Embed Size (px)
Citation preview
BRIEF DEFINITIVE REPORT
Blood plasma phosphorylated-tau isoforms trackCNS change in Alzheimer’s diseaseNicolas R. Barthelemy1, Kanta Horie1, Chihiro Sato1, and Randall J. Bateman1,2,3
Highly sensitive and specific plasma biomarkers for Alzheimer’s disease (AD) have the potential to improve diagnosticaccuracy in the clinic and facilitate research studies including enrollment in prevention and treatment trials. We recentlyreported CSF tau hyperphosphorylation, especially on T217, is an accurate predictor of β-amyloidosis at asymptomatic andsymptomatic stages. In the current study, we determine by mass spectrometry the potential utility of plasma p-tau isoformsto detect AD pathology and investigate CSF and plasma tau isoforms’ profile relationships. Plasma tau was truncated aspreviously described in CSF. CSF and plasma measures of p-tau-217 and p-tau-181 were correlated. No correlation was foundbetween CSF and plasma on total-tau levels and pS202 measures. We found p-tau-217 and p-tau-181 were highly specific foramyloid plaque pathology in the discovery cohort (n = 36, AUROC = 0.99 and 0.98 respectively). In the validation cohort (n = 92),p-tau-217 measures were still specific to amyloid status (AUROC = 0.92), and p-tau-181 measures were less specific (AUROC= 0.75).
IntroductionTests of central nervous system (CNS) proteins found in bloodplasma are being developed to enable simplified and inexpensivetesting compared with the current gold standards of cerebro-spinal fluid (CSF) and brain positron emission tomography(PET) imaging in Alzheimer’s disease (AD) and other neurode-generative diseases. Brain and CSF proteins are transferredacross the blood brain barrier and arachnoid granulations tothe blood (Roberts et al., 2014), where the CNS proteins arediluted in a complex mixture of other biomolecules. Over thepast few years, different studies have demonstrated CNSdisease-associated protein alterations could be detected inblood. However, low amounts within a complex matrix, pe-ripheral alterations, and peripheral expression of corre-sponding proteins may reduce the accuracy of the biomarkercompared with its measurement in CSF.
Blood plasma amyloid-β (Aβ) 42/40 ratio recapitulates withaccuracy change on Aβ42/40 ratio detected in CSF and associateswith measures of brain amyloid plaques by amyloid PET scans(Ovod et al., 2017; Nakamura et al., 2018; Schindler et al., 2019).Neurofilament light (NfL) chain protein can be detected in bloodand tracks neuronal damage in several neurological diseases(Bacioglu et al., 2016) similarly to CSF NfL (Preische et al., 2019).NfL changes are detected around the time of symptom onset,over a decade after abnormal AD amyloidosis is detectable by
brain imaging or CSF Aβ 42/40 (Bateman et al., 2012; Faganet al., 2014; Preische et al., 2019).
Tau is the second marker of AD pathology. Tau is amicrotubule-binding protein that is increased and phosphorylatedin AD and constitutes the main component in AD tangle andneurite pathology. Total tau (t-tau) and some phosphorylated-tau(p-tau) isoform levels are significantly increased in AD CSF.However, plasma tau and CSF tau levels poorly correlate with eachother, creating a challenge in developing plasma tau as a bio-marker for AD (Zetterberg et al., 2013; Mattsson et al., 2016).Recent reports using immunoassays have suggested more prom-ising developments; for example, some reports indicated slightincreases in plasma t-tau in mild cognitive impairment (MCI) andAD (Mielke et al., 2017, 2018), and several studies demonstratedplasma p-tau at threonine 181 (p-tau-181) increases in AD at MCIandmoderate stages (Tatebe et al., 2017; Mielke et al., 2018). Bloodp-tau-181 can differentiate AD patients from other tauopathies atsymptomatic stages of AD with accuracy (Janelidze et al., 2020a;Thijssen et al., 2020).
Our laboratory developed mass spectrometry (MS) measuresto accurately quantify both t-tau and multiple p-tau isoforms.Using this approach, we previously identified that certain p-tau/t-tau ratios are specifically increased in AD (Barthelemy et al.,2019, 2020a). Remarkably, we have reported that CSF tau
.............................................................................................................................................................................1Department of Neurology, Washington University School of Medicine, St. Louis, MO; 2Hope Center for Neurological Disorders, Washington University School of Medicine,St. Louis, MO; 3Charles F. and Joanne Knight Alzheimer’s Disease Research Center, Washington University School of Medicine, St. Louis, MO.
Correspondence to Nicolas R. Barthelemy: [email protected]; Randall J. Bateman: [email protected].
© 2020 Barthelemy et al. This article is distributed under the terms of an Attribution–Noncommercial–Share Alike–NoMirror Sites license for the first six months after thepublication date (see http://www.rupress.org/terms/). After six months it is available under a Creative Commons License (Attribution–Noncommercial–Share Alike 4.0International license, as described at https://creativecommons.org/licenses/by-nc-sa/4.0/).
Rockefeller University Press https://doi.org/10.1084/jem.20200861 1 of 11
J. Exp. Med. 2020 Vol. 217 No. 11 e20200861
Dow
nloaded from http://rupress.org/jem
/article-pdf/217/11/e20200861/1047929/jem_20200861.pdf by guest on 24 D
ecember 2021
phosphorylation measures on threonine 217 (p-tau-217) areclosely associated with amyloidosis, improving identification ofamyloidosis at the asymptomatic stage (Barthelemy et al., 2015,2017 Preprint, 2018). CSF hyperphosphorylation of p-tau-T217 ismore accurate than other sites, such as T181 (Barthelemy et al.,2020b; Janelidze et al., 2020b) and T205 (Barthelemy et al.,2020a), to detect the presence of amyloid plaques. Phosphoryl-ation occupancy on T217 is also lower intracellularly than ex-tracellularly in CSF (Barthelemy et al., 2019). Together, thesefindings suggest that an increase of p-tau-217 in both normal andAD CSF would be related to selective release of this isoform fromthe CNS to CSF and that increased p-tau-217 release is closelyrelated to amyloid plaques.We hypothesized p-tau-217 is specificto CNS, would cross the blood brain barrier, specifically con-tributes to plasma level, and increases together with CSFchanges. In this study, we sought to quantify blood plasma tauand p-tau species by MS, especially p-tau-217, to compare withAD pathology and assess their potential as blood-based ADbiomarkers.
Results and discussionTau isoforms can be purified and enriched from plasmaWe designed MS assays to assess plasma tau isoforms, includingplasma p-tau-217. Estimated concentrations of t-tau (1–20 pg/ml;Zetterberg et al., 2013; Mattsson et al., 2016; Mielke et al., 2017)and p-tau-181 (sub pg/ml; Tatebe et al., 2017), as reported byimmunoassays in plasma, are low and present a challenge formeasuring plasma tau using MS techniques. Moreover, p-tau-217 in CSF is approximately five times less abundant than p-tau-181 (Barthelemy et al., 2019). The sub pg/ml range estimated forp-tau-217 measurement is far below the concentration of cur-rently monitored plasma biomarkers (Geyer et al., 2017), in-cluding the recently assayed plasma Aβ42 peptide using MS(Ovod et al., 2017; Nakamura et al., 2018).
To overcome MS limitations in sensitivity (low attomolarrange), we designed an enrichment protocol to purify and con-centrate plasma tau from 20 ml of plasma to 25 µl of final ex-tract, leading to an enrichment factor of ∼800 times. Thisprotocol relies on an initial step of plasma protein precipitationusing perchloric acid to remove a majority of plasma proteinssuch as albumin and immunoglobulins. Soluble tau in the su-pernatant was concentrated using solid phase extraction aspreviously reported (Barthelemy et al., 2016). The pellet ob-tained after drying the solid phase extract was subsequentlyimmunopurified against N-terminus and mid-domain tau anti-bodies as described previously (Sato et al., 2018). This multiple-step extraction significantly decreased plasma interference onminor phosphorylated peptide signals. Both plasma and CSFwere analyzed for t-tau and p-tau peptides by a highly sensitiveand resolute mass spectrometer equipped with nano-flow cap-illary liquid chromatography interfaced with nano-electrosprayionization (Barthelemy et al., 2019).
Plasma tau is truncated similar to CSF profilesWe used nano liquid chromatography coupled to tandem massspectrometry (nanoLC-MS/MS) to assay plasma samples from a
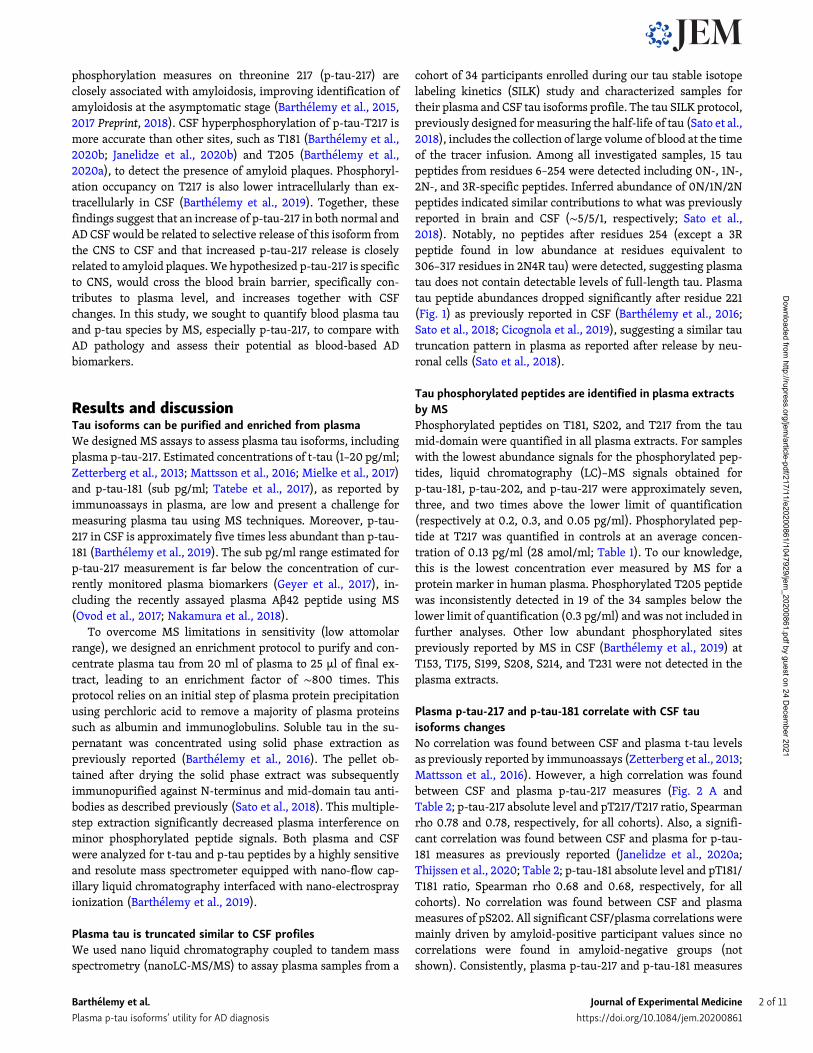
cohort of 34 participants enrolled during our tau stable isotopelabeling kinetics (SILK) study and characterized samples fortheir plasma and CSF tau isoforms profile. The tau SILK protocol,previously designed for measuring the half-life of tau (Sato et al.,2018), includes the collection of large volume of blood at the timeof the tracer infusion. Among all investigated samples, 15 taupeptides from residues 6–254 were detected including 0N-, 1N-,2N-, and 3R-specific peptides. Inferred abundance of 0N/1N/2Npeptides indicated similar contributions to what was previouslyreported in brain and CSF (∼5/5/1, respectively; Sato et al.,2018). Notably, no peptides after residues 254 (except a 3Rpeptide found in low abundance at residues equivalent to306–317 residues in 2N4R tau) were detected, suggesting plasmatau does not contain detectable levels of full-length tau. Plasmatau peptide abundances dropped significantly after residue 221(Fig. 1) as previously reported in CSF (Barthelemy et al., 2016;Sato et al., 2018; Cicognola et al., 2019), suggesting a similar tautruncation pattern in plasma as reported after release by neu-ronal cells (Sato et al., 2018).
Tau phosphorylated peptides are identified in plasma extractsby MSPhosphorylated peptides on T181, S202, and T217 from the taumid-domain were quantified in all plasma extracts. For sampleswith the lowest abundance signals for the phosphorylated pep-tides, liquid chromatography (LC)–MS signals obtained forp-tau-181, p-tau-202, and p-tau-217 were approximately seven,three, and two times above the lower limit of quantification(respectively at 0.2, 0.3, and 0.05 pg/ml). Phosphorylated pep-tide at T217 was quantified in controls at an average concen-tration of 0.13 pg/ml (28 amol/ml; Table 1). To our knowledge,this is the lowest concentration ever measured by MS for aprotein marker in human plasma. Phosphorylated T205 peptidewas inconsistently detected in 19 of the 34 samples below thelower limit of quantification (0.3 pg/ml) and was not included infurther analyses. Other low abundant phosphorylated sitespreviously reported by MS in CSF (Barthelemy et al., 2019) atT153, T175, S199, S208, S214, and T231 were not detected in theplasma extracts.
Plasma p-tau-217 and p-tau-181 correlate with CSF tauisoforms changesNo correlation was found between CSF and plasma t-tau levelsas previously reported by immunoassays (Zetterberg et al., 2013;Mattsson et al., 2016). However, a high correlation was foundbetween CSF and plasma p-tau-217 measures (Fig. 2 A andTable 2; p-tau-217 absolute level and pT217/T217 ratio, Spearmanrho 0.78 and 0.78, respectively, for all cohorts). Also, a signifi-cant correlation was found between CSF and plasma for p-tau-181 measures as previously reported (Janelidze et al., 2020a;Thijssen et al., 2020; Table 2; p-tau-181 absolute level and pT181/T181 ratio, Spearman rho 0.68 and 0.68, respectively, for allcohorts). No correlation was found between CSF and plasmameasures of pS202. All significant CSF/plasma correlations weremainly driven by amyloid-positive participant values since nocorrelations were found in amyloid-negative groups (notshown). Consistently, plasma p-tau-217 and p-tau-181 measures
Barthelemy et al. Journal of Experimental Medicine 2 of 11
Plasma p-tau isoforms’ utility for AD diagnosis https://doi.org/10.1084/jem.20200861
Dow
nloaded from http://rupress.org/jem
/article-pdf/217/11/e20200861/1047929/jem_20200861.pdf by guest on 24 D
ecember 2021
recapitulated separations obtained in CSF between amyloid-positive and -negative participants regardless of their cogni-tive status (Fig. 1 and Table 2; area under the curve (AUC) in CSFand plasma respectively 1.00 and 0.98 for pT217/T217; 0.95 and0.98 for p-T181/T181). Together, these data suggest that plasmap-tau-217 and p-tau-181 can act as proxies for changes in CNS-soluble tau and thus serve as useful biomarkers.
Changes in plasma p-tau-217 have a larger dynamic range thanp-tau-181 in ADWe calculated the magnitude of change in plasma tau isoformsbetween controls and different amyloid clinical groups (Table 2).In CSF, the highest difference in amplitude between amyloid-positive individuals and controls was found for the level ofp-tau-217 (+800%) group followed by the p-tau-181 (+250%)group. However, these changes were partially due to the con-comitant contributions of CSF tau isoform increases as mea-sured for t-tau level (+190%). When normalized from tauvariation using the p-tau/t-tau ratio, pT217/T217 demonstrated agreater change than pT181/T181 (+220% vs. +25%). In plasma, thehigh magnitude of increase for p-tau-217 in the amyloid-positivegroup remained higher than p-tau-181 measurements in all ofthe clinical groups (from +230% to +340% for pT217/T217 andfrom +60% to +80% for pT181/T181). Importantly, CSF andplasma p-tau-217 measures (Table 1 and Fig. 2, B and C) distin-guished amyloid-positive, tau PET–negative participants fromcontrols. This suggests that p-tau biomarkers are changed beforedetectable tau aggregation and reflect abnormal soluble taumetabolism occurring concomitantly with brain Aβ pathology.
Plasma p-tau modifications are detected in a validation cohortusing lower plasma volumeTo validate the discovery results in a larger cohort, we modifiedthe plasma extraction method to downscale the volume ofplasma needed to 4 ml. This assay provided sufficient sensitivityand reproducibility for measuring endogenous plasma p-taulevels (Fig. S1 and Table S1). We measured CSF and plasma fort-tau, p-tau-181, and p-tau-217 in 92 participants enrolled in AβSILK studies and selected according to their amyloid and
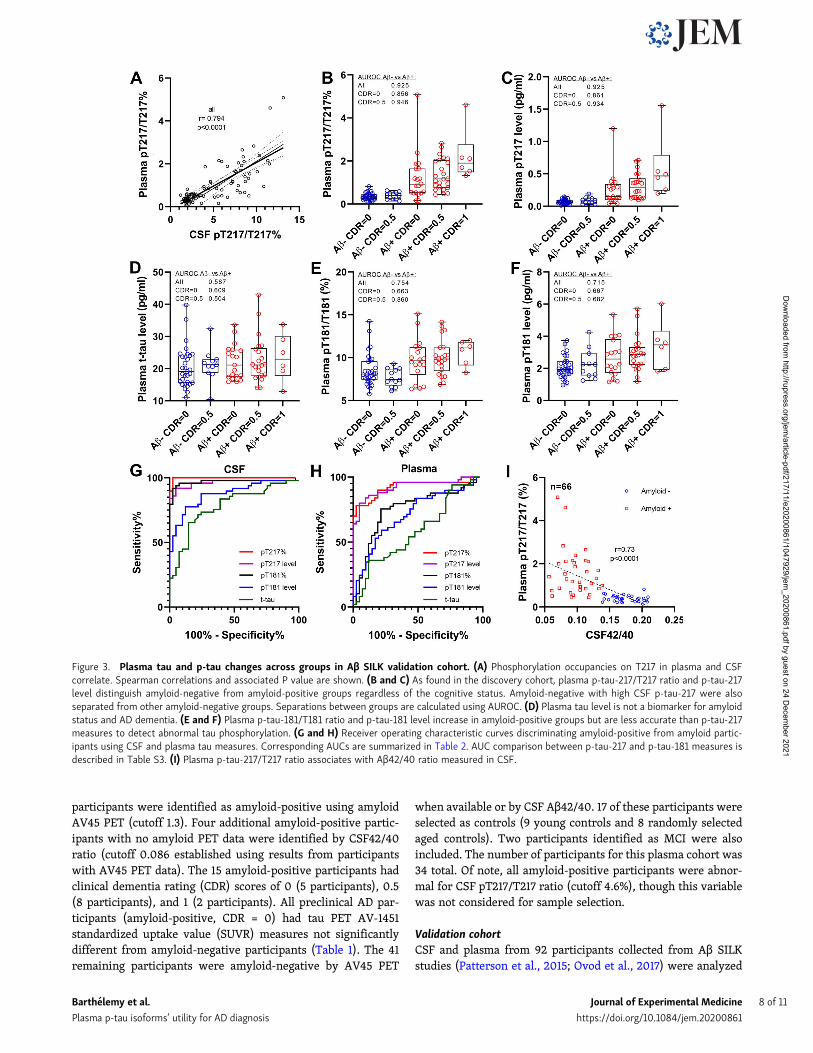
cognitive status (Patterson et al., 2015; Ovod et al., 2017). Mea-sures of p-tau-217 remained specific to amyloid status (Fig. 3, Band C; and Table 2; area under receiver operating curve[AUROC] 0.92 and 0.93 for ratio and level, respectively) andcorrelated with CSF (Fig. 3 A and Table 2; r = 0.79 and 0.70) andPET amyloid (Table 2; r = 0.70 and 0.67). PT217/T217 providedreasonable separation of amyloid-positive and -negative groupscognitively unimpaired (AUC 0.86). The p-tau-181 measureswere less specific than in the discovery cohort in differentiatingamyloid groups (Fig. 3, E and F; AUROC 0.75 and 0.72 for ratioand level, respectively). Again, no significant increase of plasmat-tau was observed (Fig. 3 D). For this larger cohort, the betterperformance for amyloid detection of p-tau-217 measures overp-tau-181 observed in CSF (Fig. 3 G) was recapitulated in plasma(Fig. 3 H). Plasma pT217/T217 was inversely correlated with CSFAβ 42/40 as expected with normal Aβ levels associated with lowpT217 phosphorylation (Fig. 3 I).
Peripheral tau phosphorylation status is different from bothcontrol and AD CNS tauThe absence of correlation between CSF and plasma t-tau levels(Table 2) suggests that the main origin of plasma t-tau is fromperipheral sources, not the CNS. From previous reports, plasmat-tau levels reflect CNS tau changes only when significantlyincreased compared with baseline, for example, in patients withacute stroke, brain injury (Bulut et al., 2006; Neselius et al.,2013; Bogoslovsky et al. 2017; Rubenstein et al., 2017), brainmetastases, (Darlix et al., 2019) and likely AD patients with highCNS t-tau release (Kasai et al., 2017; Mielke et al., 2018). Thus,tau released in the CNS would contribute to significant plasmat-tau increases only when its contribution becomes much higherthan the peripheral tau contribution.
The higher contribution of peripheral tau over CNS tau inplasma is also supported by the difference observed in p-tau/tauratios between CSF and plasma (Table 2). Both pT217/T217 andpT181/T181 ratios are significantly decreased in plasma com-pared with CSF. This observation supports the dilution of CNStau in peripheral tau, with much lower p-tau-217 and slightlylower p-tau-181 abundance (Table 2, a decrease of 4.6 and 1.8
Figure 1. Plasma tau truncation profile afterchemical extraction and IP in the discoverycohort. Left: Plasma tau peptides concentrationprofiles obtained from the 36 individuals. Eachline corresponds to the peptide profile from oneparticipant. Right: Dots represents averaged taupeptides normalized concentration obtainedfrom the overall cohort. Normalized concentra-tion for each peptide is relative to the sum of thepeptides concentrations measured in each par-ticipant. Bars represent SD. Label a indicates adecrease of 2N and 1N+2N peptide abundanceconsistent with 5/5/1 0N/1N/2N contribution inplasma tau. Label b indicates a decrease con-sistent with the presence of around 10% ofphosphorylation on position 181. Phosphoryla-
tion on T181 induces a trypsin missed cleavage between residues 180 and –181. This contributes to a decrease of 175–180 and 181–190 peptides abundanceproportional to the extent of phosphorylation on T181. Label c indicates a decrease consistent with tau truncation between residues 221 and 226. Cicognolaet al. (2019) have reported CSF tau main cleavage occurring at residue 224. Label d indicates a decrease consistent with progressive C terminus degradation ofplasma tau from residue 224 to microtubule binding region upstream region.
Barthelemy et al. Journal of Experimental Medicine 3 of 11
Plasma p-tau isoforms’ utility for AD diagnosis https://doi.org/10.1084/jem.20200861
Dow
nloaded from http://rupress.org/jem
/article-pdf/217/11/e20200861/1047929/jem_20200861.pdf by guest on 24 D
ecember 2021
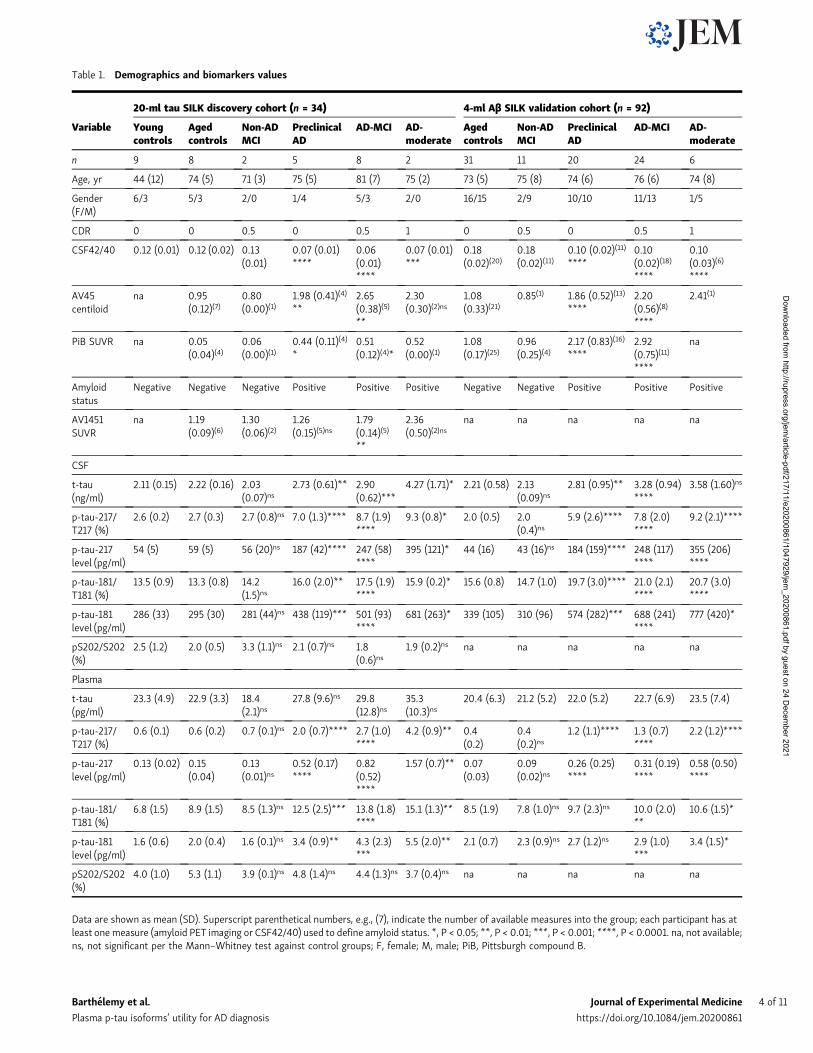
Table 1. Demographics and biomarkers values
20-ml tau SILK discovery cohort (n = 34) 4-ml Aβ SILK validation cohort (n = 92)
Variable Youngcontrols
Agedcontrols
Non-ADMCI
PreclinicalAD
AD-MCI AD-moderate
Agedcontrols
Non-ADMCI
PreclinicalAD
AD-MCI AD-moderate
n 9 8 2 5 8 2 31 11 20 24 6
Age, yr 44 (12) 74 (5) 71 (3) 75 (5) 81 (7) 75 (2) 73 (5) 75 (8) 74 (6) 76 (6) 74 (8)
Gender(F/M)
6/3 5/3 2/0 1/4 5/3 2/0 16/15 2/9 10/10 11/13 1/5
CDR 0 0 0.5 0 0.5 1 0 0.5 0 0.5 1
CSF42/40 0.12 (0.01) 0.12 (0.02) 0.13(0.01)
0.07 (0.01)****
0.06(0.01)****
0.07 (0.01)***
0.18(0.02)(20)
0.18(0.02)(11)
0.10 (0.02)(11)
****0.10(0.02)(18)
****
0.10(0.03)(6)
****
AV45centiloid
na 0.95(0.12)(7)
0.80(0.00)(1)
1.98 (0.41)(4)
**2.65(0.38)(5)
**
2.30(0.30)(2)ns
1.08(0.33)(21)
0.85(1) 1.86 (0.52)(13)
****2.20(0.56)(8)
****
2.41(1)
PiB SUVR na 0.05(0.04)(4)
0.06(0.00)(1)
0.44 (0.11)(4)
*0.51(0.12)(4)*
0.52(0.00)(1)
1.08(0.17)(25)
0.96(0.25)(4)
2.17 (0.83)(16)
****2.92(0.75)(11)
****
na
Amyloidstatus
Negative Negative Negative Positive Positive Positive Negative Negative Positive Positive Positive
AV1451SUVR
na 1.19(0.09)(6)
1.30(0.06)(2)
1.26(0.15)(5)ns
1.79(0.14)(5)
**
2.36(0.50)(2)ns
na na na na na
CSF
t-tau(ng/ml)
2.11 (0.15) 2.22 (0.16) 2.03(0.07)ns
2.73 (0.61)** 2.90(0.62)***
4.27 (1.71)* 2.21 (0.58) 2.13(0.09)ns
2.81 (0.95)** 3.28 (0.94)****
3.58 (1.60)ns
p-tau-217/T217 (%)
2.6 (0.2) 2.7 (0.3) 2.7 (0.8)ns 7.0 (1.3)**** 8.7 (1.9)****
9.3 (0.8)* 2.0 (0.5) 2.0(0.4)ns
5.9 (2.6)**** 7.8 (2.0)****
9.2 (2.1)****
p-tau-217level (pg/ml)
54 (5) 59 (5) 56 (20)ns 187 (42)**** 247 (58)****
395 (121)* 44 (16) 43 (16)ns 184 (159)**** 248 (117)****
355 (206)****
p-tau-181/T181 (%)
13.5 (0.9) 13.3 (0.8) 14.2(1.5)ns
16.0 (2.0)** 17.5 (1.9)****
15.9 (0.2)* 15.6 (0.8) 14.7 (1.0) 19.7 (3.0)**** 21.0 (2.1)****
20.7 (3.0)****
p-tau-181level (pg/ml)
286 (33) 295 (30) 281 (44)ns 438 (119)*** 501 (93)****
681 (263)* 339 (105) 310 (96) 574 (282)*** 688 (241)****
777 (420)*
pS202/S202(%)
2.5 (1.2) 2.0 (0.5) 3.3 (1.1)ns 2.1 (0.7)ns 1.8(0.6)ns
1.9 (0.2)ns na na na na na
Plasma
t-tau(pg/ml)
23.3 (4.9) 22.9 (3.3) 18.4(2.1)ns
27.8 (9.6)ns 29.8(12.8)ns
35.3(10.3)ns
20.4 (6.3) 21.2 (5.2) 22.0 (5.2) 22.7 (6.9) 23.5 (7.4)
p-tau-217/T217 (%)
0.6 (0.1) 0.6 (0.2) 0.7 (0.1)ns 2.0 (0.7)**** 2.7 (1.0)****
4.2 (0.9)** 0.4(0.2)
0.4(0.2)ns
1.2 (1.1)**** 1.3 (0.7)****
2.2 (1.2)****
p-tau-217level (pg/ml)
0.13 (0.02) 0.15(0.04)
0.13(0.01)ns
0.52 (0.17)****
0.82(0.52)****
1.57 (0.7)** 0.07(0.03)
0.09(0.02)ns
0.26 (0.25)****
0.31 (0.19)****
0.58 (0.50)****
p-tau-181/T181 (%)
6.8 (1.5) 8.9 (1.5) 8.5 (1.3)ns 12.5 (2.5)*** 13.8 (1.8)****
15.1 (1.3)** 8.5 (1.9) 7.8 (1.0)ns 9.7 (2.3)ns 10.0 (2.0)**
10.6 (1.5)*
p-tau-181level (pg/ml)
1.6 (0.6) 2.0 (0.4) 1.6 (0.1)ns 3.4 (0.9)** 4.3 (2.3)***
5.5 (2.0)** 2.1 (0.7) 2.3 (0.9)ns 2.7 (1.2)ns 2.9 (1.0)***
3.4 (1.5)*
pS202/S202(%)
4.0 (1.0) 5.3 (1.1) 3.9 (0.1)ns 4.8 (1.4)ns 4.4 (1.3)ns 3.7 (0.4)ns na na na na na
Data are shown as mean (SD). Superscript parenthetical numbers, e.g., (7), indicate the number of available measures into the group; each participant has atleast one measure (amyloid PET imaging or CSF42/40) used to define amyloid status. *, P < 0.05; **, P < 0.01; ***, P < 0.001; ****, P < 0.0001. na, not available;ns, not significant per the Mann–Whitney test against control groups; F, female; M, male; PiB, Pittsburgh compound B.
Barthelemy et al. Journal of Experimental Medicine 4 of 11
Plasma p-tau isoforms’ utility for AD diagnosis https://doi.org/10.1084/jem.20200861
Dow
nloaded from http://rupress.org/jem
/article-pdf/217/11/e20200861/1047929/jem_20200861.pdf by guest on 24 D
ecember 2021
times, respectively) in peripheral tau compared with CSF fromamyloid-negative controls. For p-tau-202, the significant in-crease of pS202/S202 ratio in plasma (1.7 times) suggests thatperipheral tau is more phosphorylated at this site than in CSF.We consistently found that the less the site is phosphorylated inperipheral tau compared with normal CSF, the greater the CNStau change would impact plasma levels for the correspondingtau isoform. This may explain why CSF and plasma p-tau-217levels better correlate than p-tau-181 levels and the absence ofcorrelation found for pS202.
Finally, by hypothesizing that peripheral tau does not containsignificant amounts of p-tau-217, we estimated that CNS taucontributes to ∼20% of the overall plasma t-tau level in controls.Assuming CNS tau release could increase by three times in AD(Fagan et al., 2007; Zetterberg, 2017), a higher CNS AD taucontribution is unlikely to increase AD plasma t-tau levelsby >40%. Moreover, peripheral tau levels could be affected bydifferent biological factors, potentially interfering with CNS taucontributions to changes in plasma. This important contributionof peripheral tau on plasma tau isoforms is a potential source ofinterference for assessing effects of tau-directed therapies usingplasma tau biomarkers.
Together, these findings support the use of more specific CNStau isoforms such as p-tau-217 and p-tau-181 over t-tau or p-tau-202 to overcome the contribution of peripheral tau and tomonitor CNS tau in plasma. Plasma measures of p-tau-181 havebeen reported to significantly increase in AD particularly atsymptomatic stages, detecting AD with good accuracy (Mielkeet al., 2018; Janelidze et al., 2020a; Thijssen et al., 2020). Ourresults suggest that, as reported in CSF (Barthelemy et al.,2020a; Barthelemy et al., 2020b; Janelidze et al., 2020b),p-tau-217 in plasma would be more accurate than p-tau-181 fordetecting abnormal CNS tau metabolism.
Limitations and perspectivesOne of the limitations of this study is the moderate size of thestudy cohort (n = 126 in discovery and validation cohorts). Al-though the validation cohort reduced the sample volume neededto 4 ml, this volume remains a restriction. Although clinicalplasma samples of 4 ml are routinely obtained in single collec-tion tubes, research biorepositories typically share 0.5 ml withrequesters, limiting our current access. In addition, the volumeof plasma currently needed for the plasma p-tau MS assay mayprevent its application for retrospective analyses of plasma
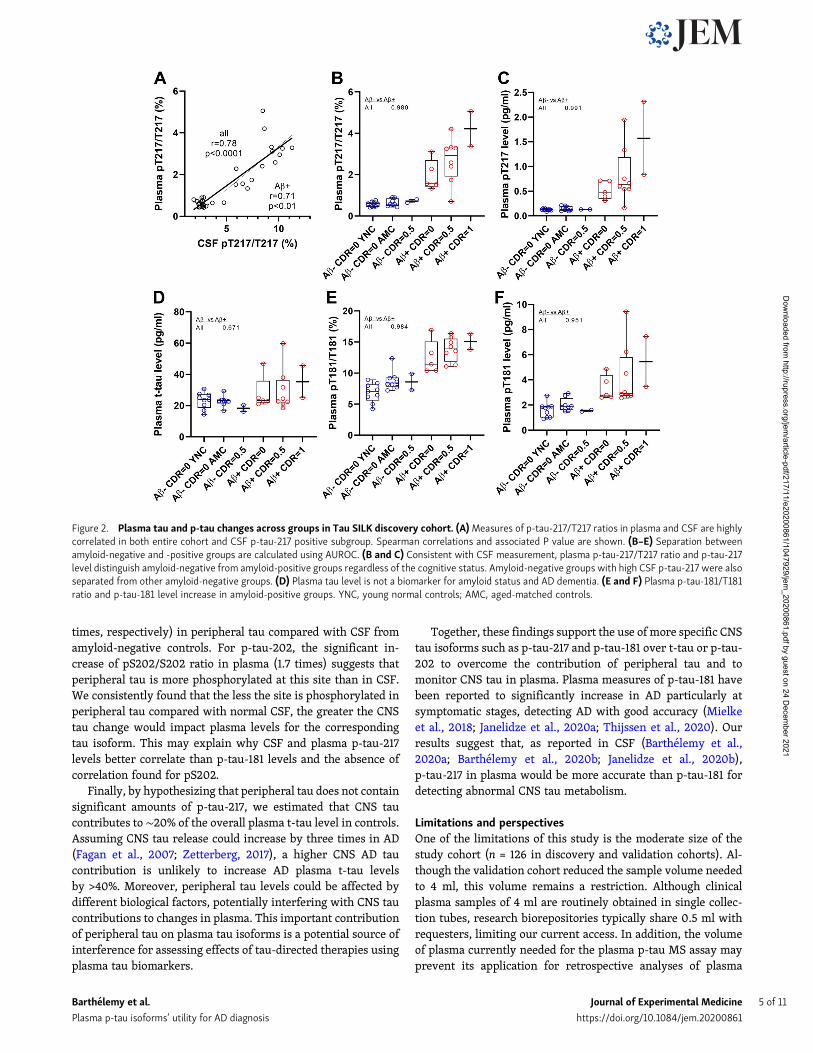
Figure 2. Plasma tau and p-tau changes across groups in Tau SILK discovery cohort. (A)Measures of p-tau-217/T217 ratios in plasma and CSF are highlycorrelated in both entire cohort and CSF p-tau-217 positive subgroup. Spearman correlations and associated P value are shown. (B–E) Separation betweenamyloid-negative and -positive groups are calculated using AUROC. (B and C) Consistent with CSF measurement, plasma p-tau-217/T217 ratio and p-tau-217level distinguish amyloid-negative from amyloid-positive groups regardless of the cognitive status. Amyloid-negative groups with high CSF p-tau-217 were alsoseparated from other amyloid-negative groups. (D) Plasma tau level is not a biomarker for amyloid status and AD dementia. (E and F) Plasma p-tau-181/T181ratio and p-tau-181 level increase in amyloid-positive groups. YNC, young normal controls; AMC, aged-matched controls.
Barthelemy et al. Journal of Experimental Medicine 5 of 11
Plasma p-tau isoforms’ utility for AD diagnosis https://doi.org/10.1084/jem.20200861
Dow
nloaded from http://rupress.org/jem
/article-pdf/217/11/e20200861/1047929/jem_20200861.pdf by guest on 24 D
ecember 2021
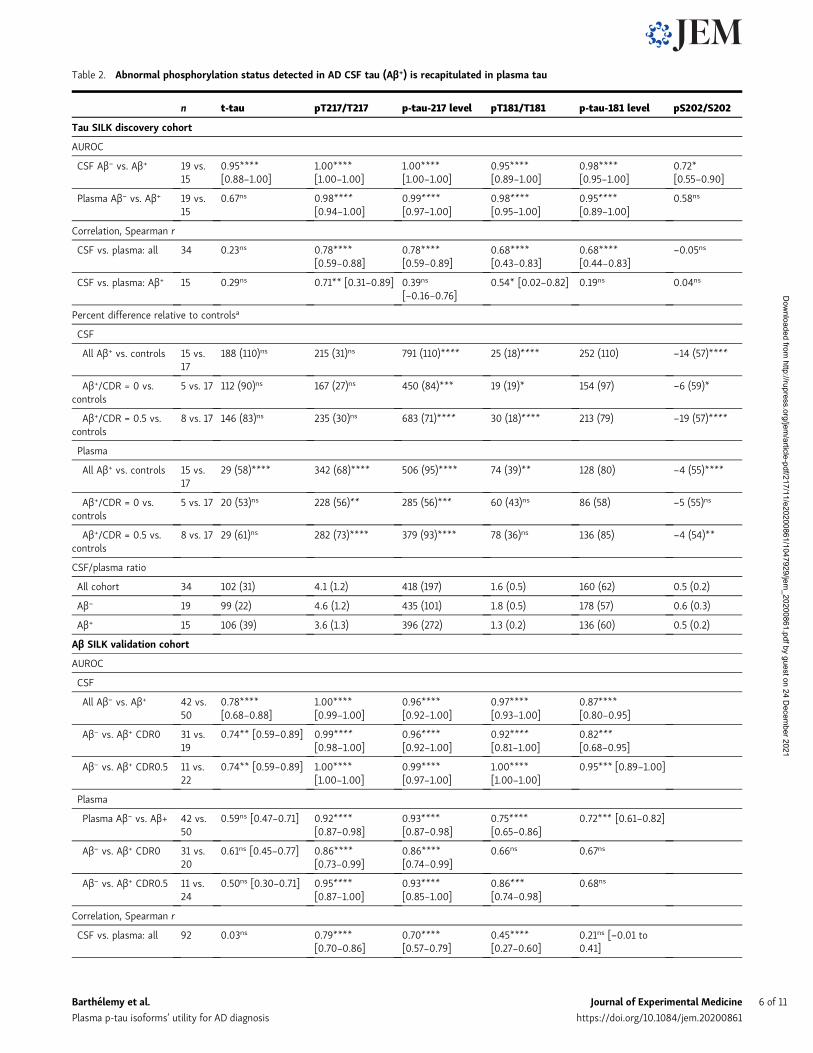
Table 2. Abnormal phosphorylation status detected in AD CSF tau (Aβ+) is recapitulated in plasma tau
n t-tau pT217/T217 p-tau-217 level pT181/T181 p-tau-181 level pS202/S202
Tau SILK discovery cohort
AUROC
CSF Aβ− vs. Aβ+ 19 vs.15
0.95****[0.88–1.00]
1.00****[1.00–1.00]
1.00****[1.00–1.00]
0.95****[0.89–1.00]
0.98****[0.95–1.00]
0.72*[0.55–0.90]
Plasma Aβ− vs. Aβ+ 19 vs.15
0.67ns 0.98****[0.94–1.00]
0.99****[0.97–1.00]
0.98****[0.95–1.00]
0.95****[0.89–1.00]
0.58ns
Correlation, Spearman r
CSF vs. plasma: all 34 0.23ns 0.78****[0.59–0.88]
0.78****[0.59–0.89]
0.68****[0.43–0.83]
0.68****[0.44–0.83]
−0.05ns
CSF vs. plasma: Aβ+ 15 0.29ns 0.71** [0.31–0.89] 0.39ns
[−0.16–0.76]0.54* [0.02–0.82] 0.19ns 0.04ns
Percent difference relative to controlsa
CSF
All Aβ+ vs. controls 15 vs.17
188 (110)ns 215 (31)ns 791 (110)**** 25 (18)**** 252 (110) −14 (57)****
Aβ+/CDR = 0 vs.controls
5 vs. 17 112 (90)ns 167 (27)ns 450 (84)*** 19 (19)* 154 (97) −6 (59)*
Aβ+/CDR = 0.5 vs.controls
8 vs. 17 146 (83)ns 235 (30)ns 683 (71)**** 30 (18)**** 213 (79) −19 (57)****
Plasma
All Aβ+ vs. controls 15 vs.17
29 (58)**** 342 (68)**** 506 (95)**** 74 (39)** 128 (80) −4 (55)****
Aβ+/CDR = 0 vs.controls
5 vs. 17 20 (53)ns 228 (56)** 285 (56)*** 60 (43)ns 86 (58) −5 (55)ns
Aβ+/CDR = 0.5 vs.controls
8 vs. 17 29 (61)ns 282 (73)**** 379 (93)**** 78 (36)ns 136 (85) −4 (54)**
CSF/plasma ratio
All cohort 34 102 (31) 4.1 (1.2) 418 (197) 1.6 (0.5) 160 (62) 0.5 (0.2)
Aβ− 19 99 (22) 4.6 (1.2) 435 (101) 1.8 (0.5) 178 (57) 0.6 (0.3)
Aβ+ 15 106 (39) 3.6 (1.3) 396 (272) 1.3 (0.2) 136 (60) 0.5 (0.2)
Aβ SILK validation cohort
AUROC
CSF
All Aβ− vs. Aβ+ 42 vs.50
0.78****[0.68–0.88]
1.00****[0.99–1.00]
0.96****[0.92–1.00]
0.97****[0.93–1.00]
0.87****[0.80–0.95]
Aβ− vs. Aβ+ CDR0 31 vs.19
0.74** [0.59–0.89] 0.99****[0.98–1.00]
0.96****[0.92–1.00]
0.92****[0.81–1.00]
0.82***[0.68–0.95]
Aβ− vs. Aβ+ CDR0.5 11 vs.22
0.74** [0.59–0.89] 1.00****[1.00–1.00]
0.99****[0.97–1.00]
1.00****[1.00–1.00]
0.95*** [0.89–1.00]
Plasma
Plasma Aβ− vs. Aβ+ 42 vs.50
0.59ns [0.47–0.71] 0.92****[0.87–0.98]
0.93****[0.87–0.98]
0.75****[0.65–0.86]
0.72*** [0.61–0.82]
Aβ− vs. Aβ+ CDR0 31 vs.20
0.61ns [0.45–0.77] 0.86****[0.73–0.99]
0.86****[0.74–0.99]
0.66ns 0.67ns
Aβ− vs. Aβ+ CDR0.5 11 vs.24
0.50ns [0.30–0.71] 0.95****[0.87–1.00]
0.93****[0.85–1.00]
0.86***[0.74–0.98]
0.68ns
Correlation, Spearman r
CSF vs. plasma: all 92 0.03ns 0.79****[0.70–0.86]
0.70****[0.57–0.79]
0.45****[0.27–0.60]
0.21ns [−0.01 to0.41]
Barthelemy et al. Journal of Experimental Medicine 6 of 11
Plasma p-tau isoforms’ utility for AD diagnosis https://doi.org/10.1084/jem.20200861
Dow
nloaded from http://rupress.org/jem
/article-pdf/217/11/e20200861/1047929/jem_20200861.pdf by guest on 24 D
ecember 2021
cohorts from existing biobanks with limited plasma resources.Although the protocol used for the validation study using 4 ml ofplasma (∼8 ml whole blood) would be challenging with currentplasma biobanks, changes in plasma collection volume would becompatible for future studies. In its current form, the assaywould still be significantly less costly and invasive than a PETscan or lumbar puncture. Our data suggest that plasma t-taumay not be an accurate AD biomarker with current methodsdue to the lower correlation with CSF t-tau. However, significantlyhigher plasma t-tau levels in AD were detected in another study(Mielke et al., 2017). Nevertheless, the magnitude of p-tau-217changes detected and its high correlation with CSF results dem-onstrate promising clinical utility for a plasma test specific forp-tau-217 epitope. We observed plasma p-tau-181 accuracy waslower in the validation cohort than the discovery cohort and recentstudies using immunoassays (Janelidze et al., 2020a; Thijssen et al.,2020). We hypothesize the CSF collection (6 ml/h collected bycatheter for Aβ SILK monitoring) occurring in parallel of theplasma collectionwould have contributed to a reduction of CNS taurelease to the periphery for this particular cohort. No concomitantCSF collection occurred at the time of the plasma collection used forthe discovery cohort. Thus, the increase of CNS p-tau isoformswould have been attenuated, affecting mainly p-tau-181, which ismore subject to peripheral tau interference than p-tau-217.
This plasma tau MS assay may be applicable beyond AD to awider array of neurodegenerative diseases, especially if com-bined with a plasma Aβ MS assay. The use of plasma p-tau bi-omarkers in combination with direct measurement of plasmaamyloid 42/40 ratio would improve the specificity of the test andenable differential diagnosis of pure tauopathies versus diseaseswith mixed pathologies. This clinical application has recentlybeen reported for plasma p-tau-181 measured by immunoassay(Janelidze et al., 2020a; Thijssen et al., 2020). Alternatively, thisplasma p-tau assay could be used as a highly sensitive screeningtool to identify a high risk of amyloidosis in normal subjects,replacing costly PET imaging. Further work is needed to deter-mine the relationship and timing of plasma p-tau changescompared with plasma Aβ (Ovod et al., 2017; Nakamura et al.,2018; Schindler et al., 2019) and other biomarkers (Preischeet al., 2019) for more accurate staging of the disease. For diag-nostic validation, confirmation for amyloid status or diagnosis
for AD could then be obtained by CSF biomarkers, amyloid andtau PET measurements, or brain neuropathology.
ConclusionWe demonstrate that measuring attomolar concentrations of tauisoforms in plasma is feasible using an enrichment protocol andMS. Our results indicate that changes in plasma p-tau, especiallyp-tau-217, mirror highly specific modifications in CSF to detectphosphorylation changes in soluble tau and amyloidosis. Weprovide strong evidence of a peripheral contribution to blood tauin plasma, which has a different phosphorylation profile com-pared with CSF. These findings support blood p-tau isoformsbeing potentially useful for detecting AD pathology, stagingdisease, and diagnosis.
Material and methodsParticipantsThe tau SILK studies had enrolled 58 participants for tau kineticmeasurements at the time of our study (Sato et al., 2018). Thesestudies were approved by the Washington University in St. LouisInstitutional Review Board.Written informed consent was obtainedfromall participants before inclusion in the study. Participantswereidentified by number, not by name. Control participants were re-ferred fromVolunteer for Health atWashingtonUniversity. AD andage-matched control participants with cognitive measures andamyloid and tau PET scans were referred from the Knight Alz-heimer’s Disease Research Center andMemory Diagnostic Center atWashington University in St. Louis. During the tau SILK study,participants received 16 h of labeled 13C-leucine infusion followed byfive lumbar punctures to collect CSF over the next 4 mo (Sato et al.,2018). To monitor leucine enrichment in the periphery, ∼10 ml ofplasma was collected at each of the 12 time points performed over19.5 h during the infusion procedure (Potter et al., 2013).
Discovery cohortCSF from the 58 SILK participants was analyzed by MS for CSFAβ42/40 and tau isoforms as previously reported (Pattersonet al., 2015; Barthelemy et al., 2019; Sato et al., 2018). Plasmasamples from 34 participants were selected based on their am-yloid and cognitive status, as described in Table 1. 11 of these
Table 2. Abnormal phosphorylation status detected in AD CSF tau (Aβ+) is recapitulated in plasma tau (Continued)
n t-tau pT217/T217 p-tau-217 level pT181/T181 p-tau-181 level pS202/S202
CSF vs. plasma: Aβ+ 50 0.03ns 0.59****[0.36–0.75]
0.25ns 0.22ns 0.08ns
Aβ PET vs. plasma: all 66 −0.02ns [−0.26 to0.23]
0.70****[0.54–0.81]
0.67****[0.51–0.79]
0.45***[0.22–0.63]
0.26* [0.00–0.48]
Aβ PET vs. plasma: Aβ+ 34 −0.20ns [−0.51 to0.16]
0.38* [0.04–0.64] 0.30ns
[−0.05–0.59]0.25ns
[−0.12–0.55]−0.04ns [−0.39 to0.32]
Data are shown as mean (SD) for % of increase compared to control value and ratio and as value (95%, CI) for AUROC and Spearman r. *, P < 0.05; **, P < 0.01;***, P < 0.001; ****, P < 0.0001. ns, not significant per the Mann–Whitney test against aged and normal control groups (amyloid-negative participants withoutcognitive symptoms). Numbers in brackets indicate confidence intervals for AUROC.aStatistical significance (t test using the linear step-up procedure of Benjamini, Krieger, and Yekutieli) of the change compared to p-tau-181 level change asreference.
Barthelemy et al. Journal of Experimental Medicine 7 of 11
Plasma p-tau isoforms’ utility for AD diagnosis https://doi.org/10.1084/jem.20200861
Dow
nloaded from http://rupress.org/jem
/article-pdf/217/11/e20200861/1047929/jem_20200861.pdf by guest on 24 D
ecember 2021
participants were identified as amyloid-positive using amyloidAV45 PET (cutoff 1.3). Four additional amyloid-positive partic-ipants with no amyloid PET data were identified by CSF42/40ratio (cutoff 0.086 established using results from participantswith AV45 PET data). The 15 amyloid-positive participants hadclinical dementia rating (CDR) scores of 0 (5 participants), 0.5(8 participants), and 1 (2 participants). All preclinical AD par-ticipants (amyloid-positive, CDR = 0) had tau PET AV-1451standardized uptake value (SUVR) measures not significantlydifferent from amyloid-negative participants (Table 1). The 41remaining participants were amyloid-negative by AV45 PET
when available or by CSF Aβ42/40. 17 of these participants wereselected as controls (9 young controls and 8 randomly selectedaged controls). Two participants identified as MCI were alsoincluded. The number of participants for this plasma cohort was34 total. Of note, all amyloid-positive participants were abnor-mal for CSF pT217/T217 ratio (cutoff 4.6%), though this variablewas not considered for sample selection.
Validation cohortCSF and plasma from 92 participants collected from Aβ SILKstudies (Patterson et al., 2015; Ovod et al., 2017) were analyzed
Figure 3. Plasma tau and p-tau changes across groups in Aβ SILK validation cohort. (A) Phosphorylation occupancies on T217 in plasma and CSFcorrelate. Spearman correlations and associated P value are shown. (B and C) As found in the discovery cohort, plasma p-tau-217/T217 ratio and p-tau-217level distinguish amyloid-negative from amyloid-positive groups regardless of the cognitive status. Amyloid-negative with high CSF p-tau-217 were alsoseparated from other amyloid-negative groups. Separations between groups are calculated using AUROC. (D) Plasma tau level is not a biomarker for amyloidstatus and AD dementia. (E and F) Plasma p-tau-181/T181 ratio and p-tau-181 level increase in amyloid-positive groups but are less accurate than p-tau-217measures to detect abnormal tau phosphorylation. (G and H) Receiver operating characteristic curves discriminating amyloid-positive from amyloid partic-ipants using CSF and plasma tau measures. Corresponding AUCs are summarized in Table 2. AUC comparison between p-tau-217 and p-tau-181 measures isdescribed in Table S3. (I) Plasma p-tau-217/T217 ratio associates with Aβ42/40 ratio measured in CSF.
Barthelemy et al. Journal of Experimental Medicine 8 of 11
Plasma p-tau isoforms’ utility for AD diagnosis https://doi.org/10.1084/jem.20200861
Dow
nloaded from http://rupress.org/jem
/article-pdf/217/11/e20200861/1047929/jem_20200861.pdf by guest on 24 D
ecember 2021
for tau isoforms as the validation cohort. The Aβ SILK protocolinvolved blood and CSF collection at baseline, followed by aleucine bolus and infusion over 9 h. Blood (12 ml) and CSF (6 ml)samples were obtained hourly over 36 h, aliquoted at 1 ml inpolypropylene tubes, and stored at −80°C CSF until use. Aliquotscollected at hour 32 were used for the MS measurement of tauisoforms. For plasma, 1-ml aliquots collected after hour 16 werecombined for constituting 4-ml plasma samples. Amyloid statuswas defined by CSF Aβ42/40 (cutoff 0.139), when available (n =66), and amyloid PET centiloid from Pittsburgh compound Btracer or AV45 SUVR. Under this definition, all amyloid-positiveparticipants (n = 50) had elevated CSF pT217/T217 ratio (cutoff2.75%) and 41 of the 42 amyloid-negative participants had CSFpT-217/T217 below this cutoff. Amyloid groups were divided intoclinical groups according to their CDR status.
Plasma and CSF tau immunopurification (IP)-LC-MS analysisFrozen plasma aliquots of 1 ml were thawed at 4°C overnight. Forthe discovery study, ∼20 ml of plasma was pooled by combining20 tubes of 1-ml plasma aliquots from the same participant fromthe 16-h infusion. After 16,000 g centrifugation for 30 min at 4°C,20 ml was transferred into a new tube, and samples were spikedwith 1 ng of 15N-labeled recombinant 2N4R tau internal standard(gift from Guy Lippens, Centre national de la recherche scienti-fique, Universite de Lille, Villeneuve-d’Ascq, France). Plasmaproteins were precipitated with perchloric acid (3.5% vol/vol fi-nal), vortexed to homogenize, and incubated for 30 min on ice.Samples were then centrifuged for 30 min at 4°C at 16,000 g.Supernatants containing soluble tau (Barthelemy et al., 2016)weretransferred to new tubes and spiked with trifluoroacetic acid(TFA) to a final concentration of 1%. Samples were loaded on anOasis HLB VAC RC 30-mg extraction cartridge (Waters) initiallyconditioned with 1 ml MeOH and 1 ml 0.1% TFA. After loading,samples were desalted with 1 ml 0.1% TFA and then eluted with700 µl 27.5% acetonitrile-0.1% TFA solution. Eluates were lyoph-ilized by speed-vac and then reconstituted in 1 ml 1× PBS, 1×protease inhibitor cocktail (Roche), 1% NP-40, and 5 mM guani-dine. After this step, both plasma and thawed CSF (spiked with15N-tau and IP reagents) were IP using similar protocol as pre-viously reported for CSF (Sato et al., 2018; Barthelemy et al., 2019).Briefly, CSF and plasma tau were immunoprecipitated with Tau1and HJ8.5 antibodies, then digested with trypsin. Digests werespikedwith absolute quantification peptides (Life Technologies) to50 and 5 fmol for each unphosphorylated and phosphorylatedpeptide, respectively. Tryptic digest was purified by solid phaseextraction on C18 TopTip. The eluate was lyophilized and re-suspended in 25 µl before nano-LC-MS/high resolution MSanalysis on nanoAcquity ultra performance liquid chromatogra-phy system (Waters) coupled to an Orbitrap Tribrid Eclipse massspectrometer (Thermo Fisher Scientific) operating as previouslyreported (Barthelemy et al., 2020a). Tandem MS (MS/MS) tran-sitions from ionized peptides (Table S2) were recorded usingparallel reaction monitoring and extracted at 5 ppm using Skylinesoftware (MacCoss Lab, University of Washington, Seattle, WA).
The internal calibration of tau and p-tau levels was per-formed in two steps. First, the addition of 15N-tau internalstandard to plasma before the first extraction step allows the
measurement of absolute level of each unmodified tau peptide inplasma using LC-MS area ratio between each endogenous taupeptide and 15N-tau peptide. Second, the phosphorylation oc-cupancy for each modified residues was obtained by comparisonof the endogenous p-tau/tau ratio with p-tau/tau ratio measuredon corresponding unphosphorylated and phosphorylated abso-lute quantification synthetic peptide standard labeled at lysineor arginine on the C-terminal position of the tryptic peptide. Thedetermination of p-tau level was obtained by combination oft-tau level and p-tau/tau phosphorylation occupancy.
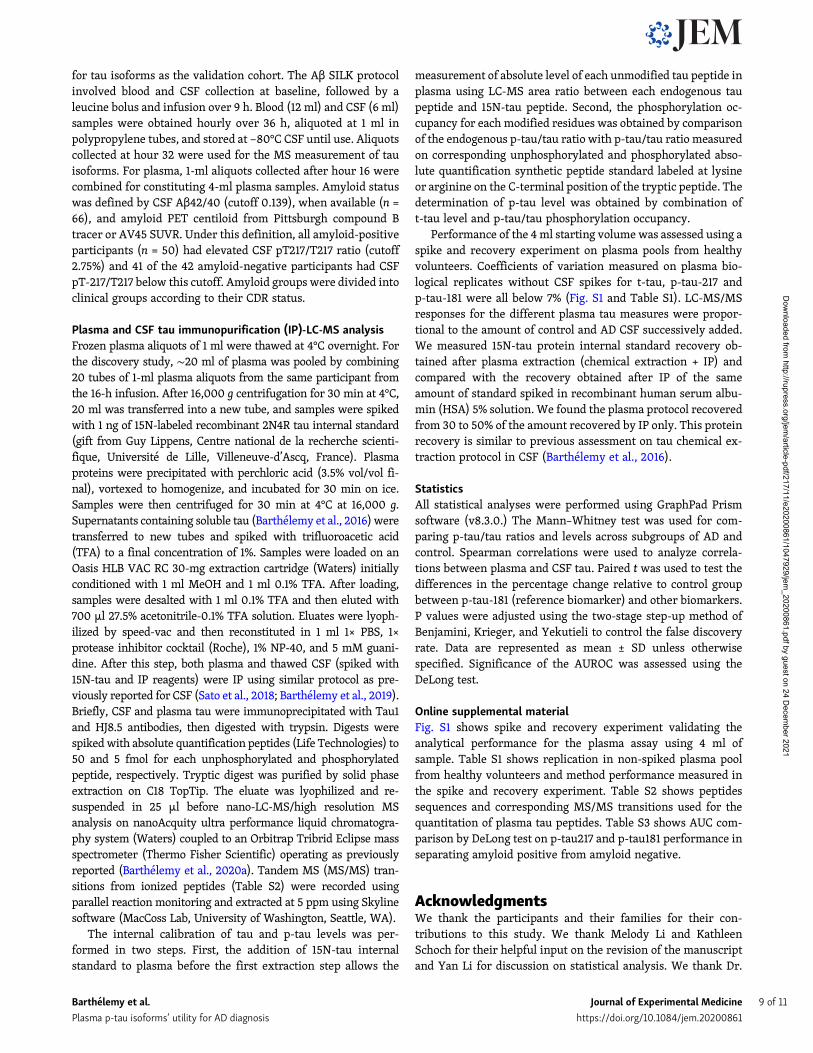
Performance of the 4 ml starting volumewas assessed using aspike and recovery experiment on plasma pools from healthyvolunteers. Coefficients of variation measured on plasma bio-logical replicates without CSF spikes for t-tau, p-tau-217 andp-tau-181 were all below 7% (Fig. S1 and Table S1). LC-MS/MSresponses for the different plasma tau measures were propor-tional to the amount of control and AD CSF successively added.We measured 15N-tau protein internal standard recovery ob-tained after plasma extraction (chemical extraction + IP) andcompared with the recovery obtained after IP of the sameamount of standard spiked in recombinant human serum albu-min (HSA) 5% solution. We found the plasma protocol recoveredfrom 30 to 50% of the amount recovered by IP only. This proteinrecovery is similar to previous assessment on tau chemical ex-traction protocol in CSF (Barthelemy et al., 2016).
StatisticsAll statistical analyses were performed using GraphPad Prismsoftware (v8.3.0.) The Mann–Whitney test was used for com-paring p-tau/tau ratios and levels across subgroups of AD andcontrol. Spearman correlations were used to analyze correla-tions between plasma and CSF tau. Paired t was used to test thedifferences in the percentage change relative to control groupbetween p-tau-181 (reference biomarker) and other biomarkers.P values were adjusted using the two-stage step-up method ofBenjamini, Krieger, and Yekutieli to control the false discoveryrate. Data are represented as mean ± SD unless otherwisespecified. Significance of the AUROC was assessed using theDeLong test.
Online supplemental materialFig. S1 shows spike and recovery experiment validating theanalytical performance for the plasma assay using 4 ml ofsample. Table S1 shows replication in non-spiked plasma poolfrom healthy volunteers and method performance measured inthe spike and recovery experiment. Table S2 shows peptidessequences and corresponding MS/MS transitions used for thequantitation of plasma tau peptides. Table S3 shows AUC com-parison by DeLong test on p-tau217 and p-tau181 performance inseparating amyloid positive from amyloid negative.
AcknowledgmentsWe thank the participants and their families for their con-tributions to this study. We thank Melody Li and KathleenSchoch for their helpful input on the revision of the manuscriptand Yan Li for discussion on statistical analysis. We thank Dr.
Barthelemy et al. Journal of Experimental Medicine 9 of 11
Plasma p-tau isoforms’ utility for AD diagnosis https://doi.org/10.1084/jem.20200861
Dow
nloaded from http://rupress.org/jem
/article-pdf/217/11/e20200861/1047929/jem_20200861.pdf by guest on 24 D
ecember 2021
David Holtzman and Ms. Hong Jiang (Washington University inSt. Louis School of Medicine, St. Louis, MO) for HJ8.5 antibody;Dr. Nicholas Kanaan (Michigan State University, Grand Rapids,MI) for Tau1 antibody; Drs. Guy Lippens and Isabelle Huvent for15N-recombinant tau (Universite des Sciences et Technologiesde Lille 1, Lille); and Chloe Yingxin He and Andrew Espeland fortheir help with sample retrieval and processing.
Funding for this work includes the Alzheimer’s AssociationResearch Fellowship AARF-16-443265 (to N.R. Barthelemy),the Rainwater Charitable Foundation (to R.J. Bateman andN.R. Barthelemy), the National Institutes of Health, NationalInstitute of Neurological Disorders and Stroke grantR01NS095773 (R.J. Bateman), the Tau SILK Consortium (AbbVie,Biogen, and Eli Lilly and Company; principal investigator,R.J. Bateman), and the Coins for Alzheimer’s Research Trustgrant (to C. Sato).
Author contributions: N.R. Barthelemy and R.J. Batemanconceived the project. N.R. Barthelemy and C. Sato conductedCSF tau profile analyses. N.R. Barthelemy and K. Horie con-ducted plasma tau measurements by MS, interpreted data, andprepared figures. N.R. Barthelemy, K. Horie, C. Sato, andR.J. Bateman wrote the manuscript.
Disclosures: N.R. Barthelemy reported a patent to the US patentoffice for "blood-based assay for diagnosing and treating basedon site-specific tau phosphorylation" pending, and a patent tothe US patent office for "methods of diagnosing and treatingbased on site-specific tau phosphorylation" issued. WashingtonUniversity and R.J. Bateman have equity ownership interest inC2N Diagnostics. R.J. Bateman and N.R. Barthelemy may receiveroyalty income based on technology (methods of diagnosing ADwith phosphorylation changes) pending license by WashingtonUniversity to C2N Diagnostics. R.J. Bateman receives incomefrom C2N Diagnostics for serving on the scientific advisoryboard. K. Horie is a visiting scholar at Washington Universityand employed by Eisai Co., Ltd. K. Hori may receive incomebased on technology (methods of diagnosing AD with phospho-rylation changes) pending license by Washington University toC2N Diagnostics. C. Sato may receive income based on tech-nology (methods of diagnosing AD with phosphorylationchanges) pending license by Washington University to C2N Di-agnostics. R.J. Bateman reported "other" from C2N Diagnostics,personal fees from Eisai, AC Immune, Amgen, Pfizer, HoffmanLaRoche, and Janssen; and grants from AbbVie, Biogen, andEli Lilly and Co. outside the submitted work. In addition,R.J. Bateman had a patent to "blood-based assay for diagnosingand treating based on site-specific tau phosphorylation" pendingand a patent to "methods of diagnosing and treating based onsite-specific tau phosphorylation" pending. Washington Uni-versity and R.J. Bateman have equity ownership interest in C2NDiagnostics andmay receive royalty income based on technology(methods of diagnosing AD with phosphorylation changes)pending license by Washington University to C2N Diagnostics.
Submitted: 1 May 2020Revised: 15 June 2020Accepted: 24 June 2020
ReferencesBacioglu, M., L.F. Maia, O. Preische, J. Schelle, A. Apel, S.A. Kaeser, M.
Schweighauser, T. Eninger, M. Lambert, A. Pilotto, et al. 2016. Neuro-filament Light Chain in Blood and CSF as Marker of Disease Progressionin Mouse Models and in Neurodegenerative Diseases. Neuron. 91:56–66.https://doi.org/10.1016/j.neuron.2016.05.018
Barthelemy, N., C. Hirtz, S. Schraen, M. Seveno, R. Bateman, P. Marin, F.Becher, A. Gabelle, et al. 2015. Mass spectrometry follow-up of t181,s199, s202, t205, and T217 tau phosphorylation in cerebrospinal fluidfrom patients revealed a specific Alzheimer’s disease pattern. AlzheimersDement. 11(7S_Part_19):870. https://doi.org/10.1016/j.jalz.2015.08.063
Barthelemy, N.R., F. Fenaille, C. Hirtz, N. Sergeant, S. Schraen-Maschke, J.Vialaret, L. Buee, A. Gabelle, C. Junot, S. Lehmann, et al. 2016. TauProtein Quantification in Human Cerebrospinal Fluid by TargetedMassSpectrometry at High Sequence Coverage Provides Insights into ItsPrimary Structure Heterogeneity. J. Proteome Res. 15:667–676. https://doi.org/10.1021/acs.jproteome.5b01001
Barthelemy, N.R., R.J. Bateman, P. Marin, F. Becher, C. Sato, S. Lehmann, andA. Gabelle. 2017. Tau hyperphosphorylation on T217 in cerebrospinalfluid is specifically associated to amyloid-β pathology. bioRxiv. https://doi.org/10.1101/226977 (Preprint posted November 30, 2017).
Barthelemy, N.R., Y. Li, G.Wang, A.M. Fagan, J.C. Morris, T.L.S. Benzinger, A.Goate, J. Hassenstab, et al. 2018. MASS SPECTROMETRY–BASEDMEASUREMENT OF LONGITUDINAL CSF TAU IDENTIFIES DIFFER-ENT PHOSPHORYLATED SITES THAT TRACK DISTINCT STAGES OFPRESYMPTOMATIC DOMINANTLY INHERITED AD. Alzheimers De-ment. 14(7S_Part_4):273-P274. https://doi.org/10.1016/j.jalz.2018.06.024
Barthelemy, N.R., N.Mallipeddi, P. Moiseyev, C. Sato, and R.J. Bateman. 2019.Tau Phosphorylation Rates Measured by Mass Spectrometry Differ inthe Intracellular Brain vs. Extracellular Cerebrospinal Fluid Compart-ments and Are Differentially Affected by Alzheimer’s Disease. Front.Aging Neurosci. 11:121. https://doi.org/10.3389/fnagi.2019.00121
Barthelemy, N.R., Y. Li, N. Joseph-Mathurin, B.A. Gordon, J. Hassenstab,T.L.S. Benzinger, V. Buckles, A.M. Fagan, R.J. Perrin, A.M. Goate, et al.Dominantly Inherited Alzheimer Network. 2020a. A soluble phos-phorylated tau signature links tau, amyloid and the evolution of stagesof dominantly inherited Alzheimer’s disease. Nat. Med. 26:398–407.https://doi.org/10.1038/s41591-020-0781-z
Barthelemy, N.R., R.J. Bateman, C. Hirtz, P. Marin, F. Becher, C. Sato, A.Gabelle, and S. Lehmann. 2020b. Cerebrospinal fluid phospho-tau T217outperforms T181 as a biomarker for the differential diagnosis of Alz-heimer’s disease and PET amyloid-positive patient identification. Alz-heimers Res. Ther. 12:26. https://doi.org/10.1186/s13195-020-00596-4
Bateman, R.J., C. Xiong, T.L.S. Benzinger, A.M. Fagan, A. Goate, N.C. Fox, D.S.Marcus, N.J. Cairns, X. Xie, T.M. Blazey, et al; Dominantly InheritedAlzheimer Network. 2012. Clinical and biomarker changes in domi-nantly inherited Alzheimer’s disease. N. Engl. J. Med. 367:795–804.https://doi.org/10.1056/NEJMoa1202753
Bogoslovsky, T., D. Wilson, Y. Chen, D. Hanlon, J. Gill, A. Jeromin, L. Song, C.Moore, Y. Gong, K. Kenney, et al. 2017. Increases of Plasma Levels ofGlial Fibrillary Acidic Protein, Tau, and Amyloid β up to 90 Days afterTraumatic Brain Injury. J. Neurotrauma. 34:66–73. https://doi.org/10.1089/neu.2015.4333
Bulut, M., O. Koksal, S. Dogan, N. Bolca, H. Ozguc, E. Korfali, Y.O. Ilcol, andM.Parklak. 2006. Tau protein as a serum marker of brain damage in mildtraumatic brain injury: preliminary results. Adv. Ther. 23:12–22. https://doi.org/10.1007/BF02850342
Cicognola, C., G. Brinkmalm, J. Wahlgren, E. Portelius, J. Gobom, N.C. Cullen,O. Hansson, L. Parnetti, R. Constantinescu, K. Wildsmith, et al. 2019.Novel tau fragments in cerebrospinal fluid: relation to tangle pathologyand cognitive decline in Alzheimer’s disease. Acta Neuropathol. 137:279–296. https://doi.org/10.1007/s00401-018-1948-2
Darlix, A., C. Hirtz, S. Thezenas, A. Maceski, A. Gabelle, E. Lopez-Crapez, H.De Forges, N. Firmin, S. Guiu, W. Jacot, et al. 2019. The prognostic valueof the Tau protein serum level in metastatic breast cancer patients andits correlation with brain metastases. BMC Cancer. 19:110. https://doi.org/10.1186/s12885-019-5287-z
Fagan, A.M., C.M. Roe, C. Xiong, M.A. Mintun, J.C. Morris, and D.M. Holtz-man. 2007. Cerebrospinal fluid tau/β-amyloid(42) ratio as a predictionof cognitive decline in nondemented older adults. Arch. Neurol. 64:343–349. https://doi.org/10.1001/archneur.64.3.noc60123
Fagan, A.M., C. Xiong, M.S. Jasielec, R.J. Bateman, A.M. Goate, T.L.S. Ben-zinger, B. Ghetti, R.N. Martins, C.L. Masters, R. Mayeux, et al; Domi-nantly Inherited Alzheimer Network. 2014. Longitudinal change in CSF
Barthelemy et al. Journal of Experimental Medicine 10 of 11
Plasma p-tau isoforms’ utility for AD diagnosis https://doi.org/10.1084/jem.20200861
Dow
nloaded from http://rupress.org/jem
/article-pdf/217/11/e20200861/1047929/jem_20200861.pdf by guest on 24 D
ecember 2021

biomarkers in autosomal-dominant Alzheimer’s disease. Sci. Transl.Med. 6. 226ra30. https://doi.org/10.1126/scitranslmed.3007901
Geyer, P.E., L.M. Holdt, D. Teupser, andM.Mann. 2017. Revisiting biomarkerdiscovery by plasma proteomics. Mol. Syst. Biol. 13:942. https://doi.org/10.15252/msb.20156297
Janelidze, S., N. Mattsson, S. Palmqvist, R. Smith, T.G. Beach, G.E. Serrano, X.Chai, N.K. Proctor, U. Eichenlaub, H. Zetterberg, et al. 2020a. PlasmaP-tau181 in Alzheimer’s disease: relationship to other biomarkers, dif-ferential diagnosis, neuropathology and longitudinal progression toAlzheimer’s dementia. Nat. Med. 26:379–386. https://doi.org/10.1038/s41591-020-0755-1
Janelidze, S., E. Stomrud, R. Smith, S. Palmqvist, N.Mattsson, D.C. Airey, N.K.Proctor, X. Chai, S. Shcherbinin, J.R. Sims, et al. 2020b. Cerebrospinalfluid p-tau217 performs better than p-tau181 as a biomarker of Alz-heimer’s disease. Nat. Commun. 11:1683. https://doi.org/10.1038/s41467-020-15436-0
Kasai, T., H. Tatebe, M. Kondo, R. Ishii, T. Ohmichi, W.T.E. Yeung, M.Morimoto, T. Chiyonobu, N. Terada, D. Allsop, et al. 2017. Increasedlevels of plasma total tau in adult Down syndrome. PLoS One. 12.e0188802. https://doi.org/10.1371/journal.pone.0188802
Mattsson, N., H. Zetterberg, S. Janelidze, P.S. Insel, U. Andreasson, E.Stomrud, S. Palmqvist, D. Baker, C.A. Tan Hehir, A. Jeromin, et al; ADNIInvestigators. 2016. Plasma tau in Alzheimer disease. Neurology. 87:1827–1835. https://doi.org/10.1212/WNL.0000000000003246
Mielke, M.M., C.E. Hagen, A.M.V. Wennberg, D.C. Airey, R. Savica, D.S.Knopman, M.M. Machulda, R.O. Roberts, C.R. Jack, Jr., R.C. Petersen,et al. 2017. Association of Plasma Total Tau Level With Cognitive De-cline and Risk of Mild Cognitive Impairment or Dementia in the MayoClinic Study on Aging. JAMA Neurol. 74:1073–1080. https://doi.org/10.1001/jamaneurol.2017.1359
Mielke,M.M., C.E. Hagen, J. Xu, X. Chai, P. Vemuri, V.J. Lowe, D.C. Airey, D.S.Knopman, R.O. Roberts, M.M. Machulda, et al. 2018. Plasma phospho-tau181 increases with Alzheimer’s disease clinical severity and is asso-ciated with tau- and amyloid-positron emission tomography. AlzheimersDement. 14:989–997. https://doi.org/10.1016/j.jalz.2018.02.013
Nakamura, A., N. Kaneko, V.L. Villemagne, T. Kato, J. Doecke, V. Dore, C.Fowler, Q.-X. Li, R. Martins, C. Rowe, et al. 2018. High performanceplasma amyloid-β biomarkers for Alzheimer’s disease. Nature. 554:249–254. https://doi.org/10.1038/nature25456
Neselius, S., H. Zetterberg, K. Blennow, J. Randall, D. Wilson, J. Marcusson,and H. Brisby. 2013. Olympic boxing is associatedwith elevated levels ofthe neuronal protein tau in plasma. Brain Inj. 27:425–433. https://doi.org/10.3109/02699052.2012.750752
Ovod, V., K.N. Ramsey, K.G. Mawuenyega, J.G. Bollinger, T. Hicks, T.Schneider, M. Sullivan, K. Paumier, D.M. Holtzman, J.C. Morris, et al.2017. Amyloid β concentrations and stable isotope labeling kinetics ofhuman plasma specific to central nervous system amyloidosis. Alz-heimers Dement. 13:841–849. https://doi.org/10.1016/j.jalz.2017.06.2266
Patterson, B.W., D.L. Elbert, K.G. Mawuenyega, T. Kasten, V. Ovod, S. Ma, C.Xiong, R. Chott, K. Yarasheski, W. Sigurdson, et al. 2015. Age and
amyloid effects on human central nervous system amyloid-beta ki-netics. Ann. Neurol. 78:439–453. https://doi.org/10.1002/ana.24454
Potter, R., B.W. Patterson, D.L. Elbert, V. Ovod, T. Kasten, W. Sigurdson, K.Mawuenyega, T. Blazey, A. Goate, R. Chott, et al. 2013. Increased in vivoamyloid-β42 production, exchange, and loss in presenilin mutationcarriers. Sci. Transl. Med. 5. 189ra77. https://doi.org/10.1126/scitranslmed.3005615
Preische, O., S.A. Schultz, A. Apel, J. Kuhle, S.A. Kaeser, C. Barro, S. Graber, E.Kuder-Buletta, C. LaFougere, C. Laske, et al; Dominantly InheritedAlzheimer Network. 2019. Serum neurofilament dynamics predictsneurodegeneration and clinical progression in presymptomatic Alz-heimer’s disease. Nat. Med. 25:277–283. https://doi.org/10.1038/s41591-018-0304-3
Roberts, K.F., D.L. Elbert, T.P. Kasten, B.W. Patterson, W.C. Sigurdson, R.E.Connors, V. Ovod, L.Y. Munsell, K.G. Mawuenyega, M.M. Miller-Thomas, et al. 2014. Amyloid-β efflux from the central nervous systeminto the plasma. Ann. Neurol. 76:837–844. https://doi.org/10.1002/ana.24270
Rubenstein, R., B. Chang, J.K. Yue, A. Chiu, E.A. Winkler, A.M. Puccio, R.Diaz-Arrastia, E.L. Yuh, P. Mukherjee, A.B. Valadka, et al; theTRACK-TBI Investigators. 2017. Comparing Plasma Phospho Tau, TotalTau, and Phospho Tau-Total Tau Ratio as Acute and Chronic TraumaticBrain Injury Biomarkers. JAMA Neurol. 74:1063–1072. https://doi.org/10.1001/jamaneurol.2017.0655
Sato, C., N.R. Barthelemy, K.G. Mawuenyega, B.W. Patterson, B.A. Gordon, J.Jockel-Balsarotti, M. Sullivan, M.J. Crisp, T. Kasten, K.M. Kirmess, et al.2018. Tau Kinetics in Neurons and the Human Central Nervous System.Neuron. 97:1284–1298.e7. https://doi.org/10.1016/j.neuron.2018.02.015
Schindler, S.E., J.G. Bollinger, V. Ovod, K.G. Mawuenyega, Y. Li, B.A. Gordon,D.M. Holtzman, J.C. Morris, T.L.S. Benzinger, C. Xiong, et al. 2019.High-precision plasma β-amyloid 42/40 predicts current and futurebrain amyloidosis. Neurology. 93:e1647–e1659.
Tatebe, H., T. Kasai, T. Ohmichi, Y. Kishi, T. Kakeya, M. Waragai, M. Kondo,D. Allsop, and T. Tokuda. 2017. Quantification of plasma phosphorylatedtau to use as a biomarker for brain Alzheimer pathology: pilot case-control studies including patients with Alzheimer’s disease and downsyndrome. Mol. Neurodegener. 12:63. https://doi.org/10.1186/s13024-017-0206-8
Thijssen, E.H., R. La Joie, A. Wolf, A. Strom, P. Wang, L. Iaccarino, V. Bour-akova, Y. Cobigo, H. Heuer, S. Spina, et al; Advancing Research andTreatment for Frontotemporal Lobar Degeneration (ARTFL) inves-tigators. 2020. Diagnostic value of plasma phosphorylated tau181 inAlzheimer’s disease and frontotemporal lobar degeneration. Nat. Med.26:387–397. https://doi.org/10.1038/s41591-020-0762-2
Zetterberg, H.. 2017. Review: Tau in biofluids - relation to pathology, imagingand clinical features. Neuropathol. Appl. Neurobiol. 43:194–199. https://doi.org/10.1111/nan.12378
Zetterberg, H., D. Wilson, U. Andreasson, L. Minthon, K. Blennow, J. Randall,and O. Hansson. 2013. Plasma tau levels in Alzheimer’s disease. Alz-heimers Res. Ther. 5:9. https://doi.org/10.1186/alzrt163
Barthelemy et al. Journal of Experimental Medicine 11 of 11
Plasma p-tau isoforms’ utility for AD diagnosis https://doi.org/10.1084/jem.20200861
Dow
nloaded from http://rupress.org/jem
/article-pdf/217/11/e20200861/1047929/jem_20200861.pdf by guest on 24 D
ecember 2021
Supplemental material
Tables S1–S3 are provided online as separate Word documents. Table S1 shows replication in non-spiked plasma pool from healthyvolunteers and method performance measured in the spike and recovery experiment. Table S2 shows peptides sequences andcorrespondingMS/MS transitions used for the quantitation of plasma tau peptides. Table S3 shows AUC comparison by DeLong teston p-tau217 and p-tau181 performance in separating amyloid positive from amyloid negative.
Figure S1. Spike and recovery experiment assessing assay performance using 4 ml of plasma volume. Plasma pool or 5% solution of recombinant HSAwere spiked with increased volumes of AD or non-AD CSF pools. Plasma was extracted using the 4-ml protocol described in the Materials and methods. HSAsamples were only immuno-purified (IP) before digestion and analysis.
Barthelemy et al. Journal of Experimental Medicine S1
Plasma p-tau isoforms’ utility for AD diagnosis https://doi.org/10.1084/jem.20200861
Dow
nloaded from http://rupress.org/jem
/article-pdf/217/11/e20200861/1047929/jem_20200861.pdf by guest on 24 D
ecember 2021


![BMC Neurology BioMed Centralgamma-enolase (neuron-specific enolase, NSE), tau, phosphorylated tau, S-100b and Aβ 1–42 [1-11]. These studies were mainly focused on diagnostic aspects](https://img.dokumen.tips/doc/110x75/6087b3c250540b5d634419a3/bmc-neurology-biomed-central-gamma-enolase-neuron-specific-enolase-nse-tau.jpg)