Embed Size (px)
Citation preview

90
80
70
60
50
40
!i4
30
20
10
8
--+- w25-L-28
B kgd
~~ 0 ~
M ar-97 JUi-98 Dec-99 Apr-01
4-152

Figure 449. Occurrence of uranium-233/234 b t i o n s at or near background (3 Kin). and detections greater than lE-05 aquifer risk-based concentration (6.7 gin) in shallow lysimeters.
Umnium23S&SA total of 122 lysimeter samples from shallow 4.6.19.22.2 lysimeters in the SDA wen analyzed for U-235/236, with 42 positive detections. Routine lysimeter monitoring began in 1997 in Well PA03; however, routine monitoring did not begin in the other lysimeter wells until 1998. The concentration trends are shown for each lysimeter in Figun 4-50. The occurrence of soil moisture detections of U-235/236 above background concentration in shallow lysimeters is depicted in Figure 4-51.
I
None of the detected concentrations in any of the shallow lysimeters exceeds the 1E-05 aquifer risk-based concentration for U-235 (6.63 Kin) or U-236 (7.1 1 pCin). Detected concentrations of U-2351236 ranged from 0.35 gin (PAO1-LIS) to 4.40 pCiL (W23-W), with the majority of values between 1.0 and 2.6 gin. In Well W23. U-235/236 was t int detected just recently, with the last two sampling events yielding detectable U-235/236. The wells with the highest U-235/236 concentrations (Wells W23 and PA03) also show elevated concentrations and emerging trends of U-233/234; however, the data are insufficient to identify a significant correlation.
. . . . . . , . . . . . . . . .
. . . . . . . . . . . . . . .. . . . .. . . . .
. . . ... .. . . . . . . . . .

7
6
5
4
2
1 0 98-4t38
-+- W25-L-28
0 M ar-97 Apr-01
e concen~ration~ of u r an~u i~ i -~35 /23~ in s s also are shown. Also see F ig~~re 3-5 1, i
08-L 13 ( n ~ a r Acid Pit), t r a ~ i ~ n ~ that are consist
3-LO~ and -L09 west end of S
3-LO8 yielde~ s a ~ p l e
total of 122 s~al low l y s i ~ e ~ e r ~ ~ ~ p l e s were nionitorin~~ and O.06 pCi/L ~98-3L38~ to 5 nd 28 pCi/L ~ ~ i g u r ~ 4-53)
ay 200 I . 12 1 r~sul t s
ions grea~er than the local soil ~ o i s ~ r e bac~ground and the ons are shown in Figure 4-53.
4- 153

, . ~ I ~ r*-rrur . . . . . .
. . . . .
. . . . . . , . . . . . . . .
. . . . . . . . . . . . . . . . . . .
. . . . . . . . . . . . . . . . . . . . . . 1 :'
. . . . .. . . . . . . . . . . . . . . . .
. . . . . , . . . . . . . . . . . . . . . . .
1111

60
50
40
$ 30
20
70
~- - 0 Mar-9~ JuI-98 RK-99 Apr-Of
~
ells with ele~ated u r a n i ~ ~ concentr~t~ons ~d noticeable t re~ds are locate at the est end of 3). As will be d ~ s c u s ~ ~ d later, the dee v a t ~ d u r a n i u ~ concentrations and tre
ost of the s a ~ ~ l e s ~ o ~ s i s ~ e n t l y exceed the IE-OS a q ~ i f ~ r risk- i/L). The ur~niLim data readi~y id cannot be de~eri~ine
~ran~u~n-233/234: U-238 r~ t ios were e v ~ l u ~ t e d for the rou~ine sh~llow l y ~ i ~ e t ~ r well ~ ~ ~ p l e s . A11 of the ~ - 2 3 ~ / 2 3 4 : ~ - 2 3 ~ one ou~Iier being 7.94E-
ios were bet wee^ 5.3 1E-OS and 1 O ~ - O ~ ~ ~ o r ~ a ~ ~ ~ ~ i g e ) , to a low conc~ntration of U-238 (
~ - 2 3 ~ / 2 ~ 4 : ~ - 2 ~ ~ ratios for the ~ 2 3 - L O ecrease over time,
Aside from the e i ~ e r g i n ~ t r e ~ d t o w ~ r ra~iiuIn in f hallow y ~ i ~ e ~ e r sam~les fro 23, the c u ~ e n t ratios for the sh~llow lysiineter~ are contra ictorq or u ~ c l e ~ r ~
4- tS6

m 98-1 984 98-5 PAOI- PA02- PA ear Ouaner L35 L38 L39 L15 L16 L33
14.5 - .. .
'igure 4-53. of una1iutn-238 et (v almve badrgtatsd (1.5 p C i )
In 1999. seven shallow lysimeter water samples WIC collected and segt forms analysis. With
anddctearoas ' gmakz ttrSn 1E-05 ~~~ (55 si&.) in sbrllow lysimeters.
tbe low-levcl aoplgrsis, it is possible toalsoevatuate tbeU-236 data, WBiCh is aniqae to aahmpic unaliua a d u-238:u-235 rarios. Tbe ssmpaes frool the PAOI-L15, PAU2-LI6,
ai. m). Horvever, the w23-m (1 1 A deep) and
4.6.7U.3 Ly&mdu -ut 4.a 7s.2.3.7 total of48 lysimtg samples collected from
the B andC basalt flows and B C U-233/234 betwetn 1997 @eeinninp of
4-157
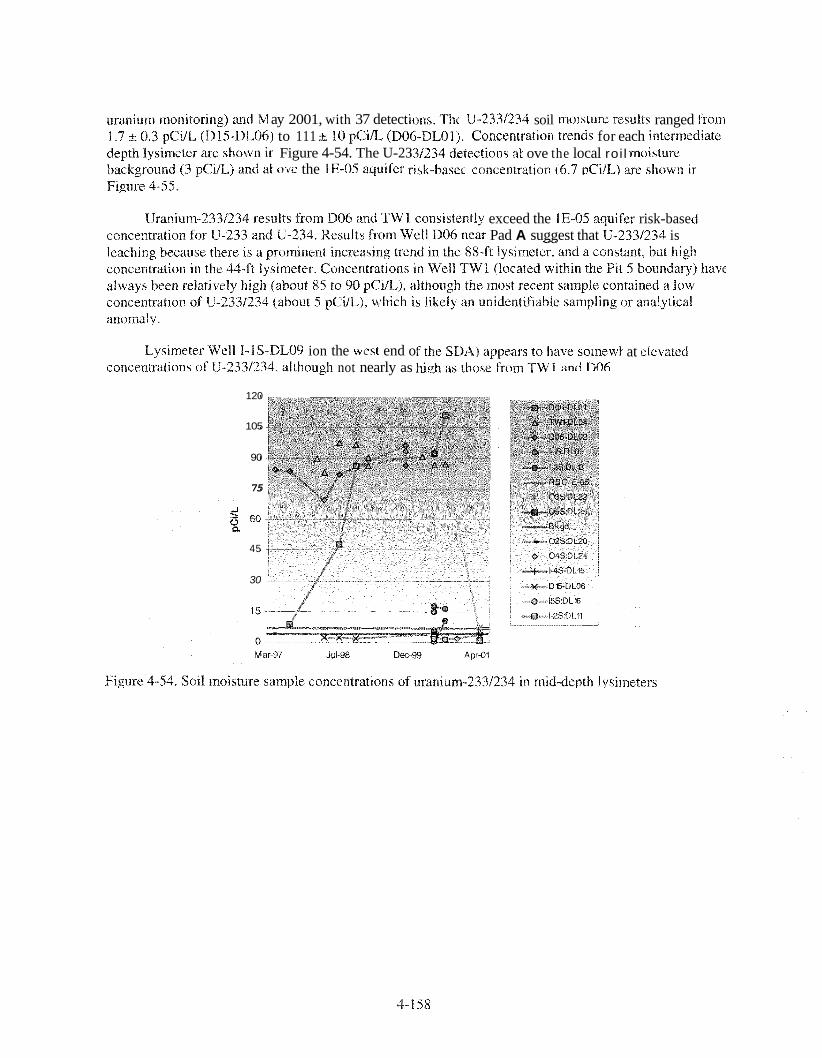
ay 2001, with 37 detect to 111 -t- 1 0 p C i ~ ( Figure 4-54. The U-23 o w the 1 ~ - ~ 5 ~ ~ q u i f ~ r
U-233/2~4 soil ~ o i s t ~ r e ~ e s ~ l t s ranged from ~ o n c e ~ ~ ~ a ~ i o n t r~nds for each i n t e r~ed i a t~
ove the local roi l ~o i s tu r e
exceed the 1E-05 a q ~ i ~ e r risk-base " Pad A suggest that U-233/~34 is
ion the west end o ough not nearly as
at el~vated
120
105
90
75
45
30
4-158

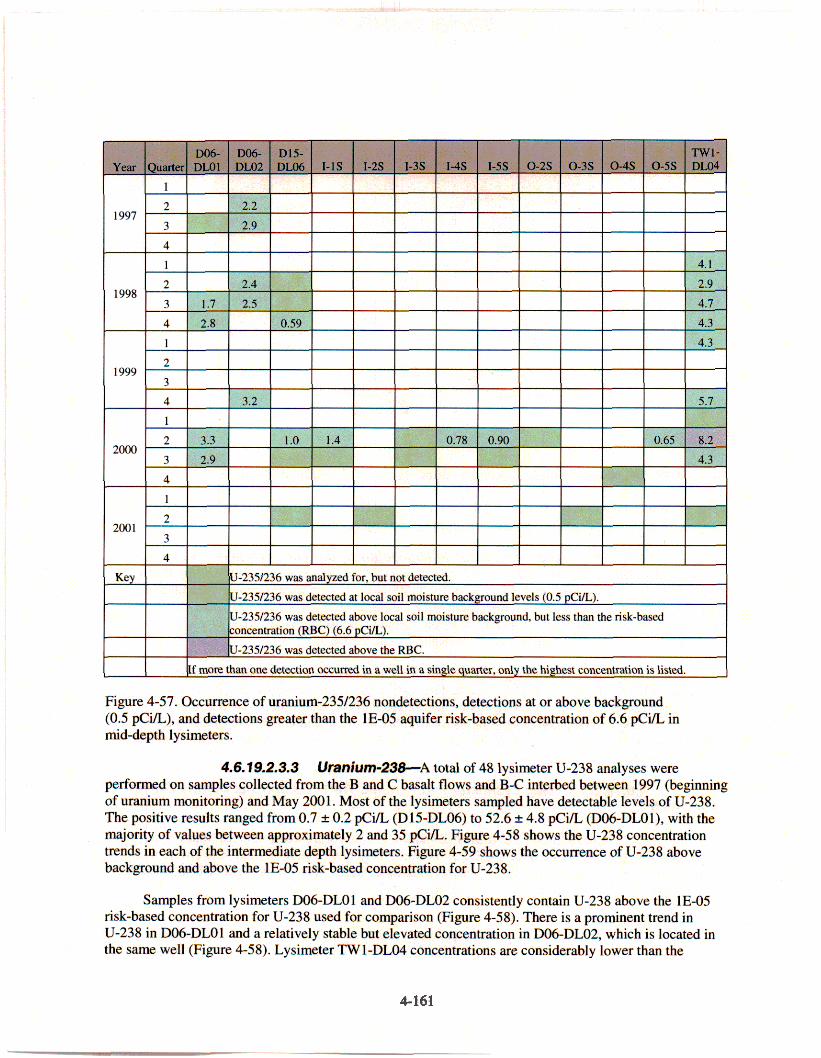
D06- DO6- D1S- rn Yuu Quancr DM1 DM2 DL06 1-1s 1-2s 1-3s 1-4s 1-5s 0-2s 0-3s 0-4s 0 - 5 s DL
f Y 82.3
. . . . .. . . . . . . . . . .
. . . .

8
7
6
5
3
2 1-2s DLll 035 DL22 04s D E 4
~
M ar-97 Jui-98 Dec-99 Apr-Ol
4- 160
. .
4-161

60
50
40
10
0 M ar-97 JuI-98 Dee-99 Apr-01
oisture sample cOnc~n~rat io~~s of uraniu~-238 ~ ~ e ~ s u r e -depth ~ y ~ i i ~ e t e r ~ .
concentrat~on~ in the 06 l y s i m ~ t ~ r ~ , but the uraniu ratios ~-233/234:U-23 u-23 8: ~ - 2 ~ S / 2 3 ~ s ~ g ~ ~ s ~ the ~ r ~ s e n c e of e n ~ ~ h e les f~~~~ that well.
DL02, TW 1 -DL04, 1999 and sent for T
, U - 2 ~ ~ , and U-238. The
om the lysi~~~eters at t i n~ reas in~ u r ~ n i u ~ co c~nsis~eiit with the T S re~ults. The ~ranium data s
the source of u r a ~ i i ~ ~ m in some cases ~annOt he ~ e t e r
ree l ~ s i ~ e t e r s and the
total of 21 water s a ~ p l e s (four l y 5 i ~ e t ~ r an
4- 162

. . . . . . . . . . .
.. . , . .
. . . . . . . . . . .
4-163
. . . , , . . . . .
. . . . . . . . . . . . .
. . . .,. .