Embed Size (px)
Citation preview

doi:10.1130/B26441.1 published online 24 Apr 2009; Geological Society of America Bulletin
Anna K Henderson and Bryan Nolan Shuman
United StatesHydrogen and oxygen isotopic compositions of lake water in the western
Geological Society of America Bulletin
on 26 April 2009 gsabulletin.gsapubs.orgDownloaded from
E-mail alerting services articles cite this article
to receive free e-mail alerts when newwww.gsapubs.org/cgi/alertsclick
Subscribe Geological Society of America Bulletin
to subscribe towww.gsapubs.org/subscriptions/index.ac.dtlclick
Permission request
to contact GSAhttp://www.geosociety.org/pubs/copyrt.htm#gsaclick
official positions of the Society. citizenship, gender, religion, or political viewpoint. Opinions presented in this publication do not reflectpresentation of diverse opinions and positions by scientists worldwide, regardless of their race, includes a reference to the article's full citation. GSA provides this and other forums for thethe abstracts only of their articles on their own or their organization's Web site providing the posting to further education and science. This file may not be posted to any Web site, but authors may postworks and to make unlimited copies of items in GSA's journals for noncommercial use in classrooms requests to GSA, to use a single figure, a single table, and/or a brief paragraph of text in subsequenttheir employment. Individual scientists are hereby granted permission, without fees or further Copyright not claimed on content prepared wholly by U.S. government employees within scope of
Notes
© 2009 Geological Society of America

1179
ABSTRACT
Lake-water isotopes can be used to track moisture regimes and water sources at present and in the geologic record. How-ever, the effects of seasonal drought and the seasonal distribution of precipitation on lake-water isotopes are not well docu-mented. To improve our understanding of lake-water isotopes, we analyzed the δD and δ18O values of water from a hundred lakes in the western United States across a broad range of seasonal precipitation regimes. Our results show that the isotopic composition of lake-water inputs is correlated with the iso-topic composition of annual precipitation. In areas associated with the summer mon-soon in northern New Mexico and southern Colorado, lake-water inputs are skewed toward summer precipitation. These results contrast with published western U.S. river-water isotopic data, which are biased toward winter precipitation, and the paradigm that lakes represent the annual moisture surplus. From the lake-water input compositions, on plots of oxygen versus hydrogen isotopes, evaporative enrichment of individual lakes follows regionally coherent evaporation trends (0.96 < r2 < 0.99). We found that the extent of evaporative enrichment in lakes is controlled by local hydrology and is not directly tied to climate or elevation. Our results suggest that paleoclimate reconstruc-tions based on single isotope records could therefore be confounded by multiple fac-tors (i.e., changes in air mass, seasonality of precipitation, temperature, or evaporation). A spatial network of lake-isotope records, however, could be used to separately assess the infl uences of these multiple factors.
INTRODUCTION
Lake-water δD and δ18O values can be used to track landscape processes such as precipitation, groundwater fl ow, stream fl ow, and evaporation (e.g., Gammons et al., 2006). Likewise, values of δD and δ18O measured in lake sediments refl ect past lake-water isotopic values and can provide quantitative information about past changes in critical climatic, tectonic, and hydrologic param-eters such as snowpack volumes (Burnett et al., 2003); seasonal precipitation amounts (Stevens et al., 2001; Yu et al., 2002; Shuman et al., 2006); moisture balance (Benson et al., 2002; Gibson et al., 2005); atmospheric circulation patterns (Edwards et al., 1996; Smith and Hollander, 1999; Kirby et al., 2002; Yu et al., 2002; Anderson et al., 2006; Rosqvist et al., 2007; Stevens and Dean, 2008); mountain uplift (Rowley and Currie, 2006; Rowley and Garzione, 2007); and tempera-ture (Von Grafenstein et al., 1999; Huang et al., 2002). These inferences have been made because the isotopic values of lake water are derived from the isotopic composition of lake-water inputs (Gonfi antini, 1986). The inputs to a lake include groundwater, stream fl ow, overland fl ow, and direct precipitation. All these inputs have isotopic values that may be infl uenced by climate, hydrol-ogy, and/or tectonics. The relative importance of inputs to a lake may be hard to determine, how-ever, and may vary greatly among lakes in the same watershed (Yu et al., 2002; Shapley et al., 2008). The isotopic value of lake water is also infl uenced by evapotranspiration from the lake and watershed. Evaporation from a lake depends on factors such as radiation, humidity, lake mor-phometry, and wind, but the sensitivity of a lake to recording evaporative losses depends on the residence time of lake water (Winter, 1995). The slope of an evaporation trend on a plot of δD ver-sus δ18O values is sensitive to climate parameters such as relative humidity (Merlivat and Jouzel, 1979; Gibson et al., 2008; Shapley et al., 2008). Individual lakes could follow unique isotopic tra-
jectories to current values because of differences in initial inputs (Fig. 1A), in local climate con-ditions (Fig. 1B), and in evaporative sensitivities (Fig. 1C). Therefore, the ultimate expression of past climatic conditions in individual sedimen-tary records based on stable isotope data may be challenging to interpret (Shapley et al., 2008).
The isotopic values of the precipitation that contributes to western U.S. lakes are related to the distance moisture travels from its source, and to factors along the pathway of moisture trans-port such as the recycling of soil moisture, the intensity of rainfall events, temperature changes along the path, and temperature-dependent frac-tionation during phase transitions (Dansgaard, 1964; Rozanski et al., 1993). The Pacifi c Ocean and the Gulf of Mexico are sources of winter moisture in the western USA, while the Gulf of Mexico and the Gulf of California are sources of summer moisture. The seasonal changes in moisture sources and temperatures cause cool-season precipitation in the western USA to have more negative isotopic values than warm-season precipitation (Rozanski et al., 1993). Indeed, Vachon et al. (2007) show that changes in the seasonal distribution of precipitation can signifi -cantly alter interannual isotopic values of mete-oric precipitation in the interior western USA.
The numerous infl uences on precipitation produce coherent seasonal spatial patterns in the isotopic values of precipitation, which are well described (Rozanski et al., 1993; Bowen and Wilkinson, 2002; Bowen and Revenaugh, 2003; Vachon et al., 2007). Both the spatial and seasonal variation in δD and δ18O values of precipitation is captured in the global meteoric waterline (GMWL). The GMWL describes the linear relationship between δD and δ18O values in precipitation where the slope refl ects nearly 100% relative humidity. The isotopic composi-tions of lake waters deviate from precipitation particularly because of kinetic fractionation of water molecules during evaporation (Craig and Gordon, 1965; Gonfi antini, 1986). The
For permission to copy, contact [email protected]© 2009 Geological Society of America
Hydrogen and oxygen isotopic compositions of lake water in the western United States
Anna K. Henderson1,† and Bryan Nolan Shuman2
1Limnological Research Center, Department of Geology, University of Minnesota, 310 Pillsbury Drive, Minneapolis, Minnesota 55455, USA2Department of Geology and Geophysics, University of Wyoming, 1000 University Avenue, Laramie, Wyoming 82071, USA
†E-mail: [email protected]: 612-720-7282.
GSA Bulletin; July/August 2009; v. 121; no. 7/8; p. 1179–1189; doi: 10.1130/B26441.1; 9 fi gures; Data Repository item 2009026.
Published online April 24, 2009; doi:10.1130/B26441.1

Henderson and Shuman
1180 Geological Society of America Bulletin, July/August 2009
variability and trends in lake-water isotopic val-ues and their relationship to the GMWL have rarely been studied over broad regions, and the potential for coherent spatial patterns to emerge from the data is poorly known.
In this study, we focus on the western USA to improve our understanding of δD and δ18O values in modern lake systems and their spatial variability, especially the modern relationship between the isotopic values of lake water and precipitation across a range of seasonal pre-cipitation regimes. Our goals are to describe the relevance of seasonal precipitation and seasonal drought regimes on continental-scale patterns of lake-water isotopes; to investigate the regional- and local-scale processes that govern continental patterns; and to highlight relevant observations that can improve the interpretations of isotope-based paleoclimate and paleoaltimetry studies.
Methods and Strategy
To document the infl uence of local climate conditions in the mountainous and thus cli-matically heterogeneous western USA (Mock, 1996) on lake-water δD and δ18O, we selected lakes on the basis of proximity to SNOwpack TELemetry stations (SNOTEL) where local cli-mate conditions are well documented (Fig. 2). SNOTEL stations are maintained by the Natu-ral Resources Conservation Services; an over-view of SNOTEL data is given in Serreze et al. (2001). To obtain our climate data, we averaged monthly precipitation and snowpack
water-content data from 54 SNOTEL stations over the years 1996–2006. SNOTEL stations in our sampling regions do not show an elevation effect on the seasonal distribution of precipita-tion, but they do show a signifi cant effect on the total amounts of precipitation. To normalize the SNOTEL data for comparison among sites and with isotopic data, we calculated monthly fractions of total annual precipitation. Principal-component analysis of monthly fractions of total annual precipitation was done in SPSS statistical program (SPSS, 2006).
Water was sampled from the 100 lakes in July of 2006 (Table DR11) along a south-north transect from 35.80° to 45.25° latitude and a west-east transect from −122.13° to −113.90° longitude (Fig. 2). The south-north transect spans northern New Mexico, Colorado, west-ern Wyoming, and southwestern Montana. The west-east transect spans Oregon, central Idaho, and northwestern Montana. The sam-pling transects were divided into comparable sampling regions by grouping the lake-water isotopic data by mountain ranges and then join-ing together mountain ranges based on similar linear relationships between δD and δ18O.
We have also established ongoing monitoring in the Park Range of Colorado and Medicine Bow Mountains of Wyoming (Region 6) and Union and Togwotee Pass, Wyoming (Region 8) (Table DR2 [see footnote 1]). Ongoing monitor-ing includes lakes sampled in 2006 plus addi-tional lakes. To date, we have resampled lakes in the Park Range of Colorado and the Medi-cine Bow Mountains of Wyoming in July 2007, February 2008, and July 2008 (Table DR2 [foot-note 1]). At Union Pass and Togwotee Pass, Wyoming, we resampled lakes in July 2008 (Table DR2 [footnote 1]).
Sampled lakes along the transects are rep-resentative of mountain lakes in the western USA with volumes ranging in size from 300 to 300,000,000 m3 (Table DR1 [footnote 1]). The shallowest 10% of the lakes have a mean depth less than 1 m, and the deepest 10% have a mean depth of more than 10 m. Half of the lakes are surfi cially open (streamfl ow out of the lake), and half are surfi cially closed (no streamfl ow out of the lake). Elevations of the lakes range from 937 to 3482 m, spanning sagebrush-dominated landscapes to subalpine forests (Table DR1 [footnote 1]).
Water samples were collected 1 m below the surface of the water in the deepest section of the lake in opaque, 60-ml, Nalgene plastic bottles. The δD and δ18O values of the water samples from July 2006, July 2007, and February 2008 were analyzed at the University of Arizona on a Finnigan Delta S, gas-source, isotope-ratio mass spectrometer. For δD, samples were
1GSA Data Repository item 2009026, Table DR1, sampling region SNOTEL stations and lakes; Ta-ble DR2, multiple years and seasons of isotope data from regions 6 and 8; Table DR3, equations of lo-cal evaporation lines for multiple years and seasons from Regions 6 and 8, is available at http://www.geosociety.org/pubs/ft2009.htm or by request to [email protected].
GMW
L GMW
L
longer water
residence time
GMW
L
lake
inpu
ts
-180
-160
-140
-120
-100
-25 -20 -15 -10 -5
δ18Ο (‰)
δD(‰
)
0
-180
-160
-140
-120
-100
-25 -20 -15 -10 -5
δ18Ο (‰)
δD(‰
)0
-180
-160
-140
-120
-100
-25 -20 -15 -10 -5
δ18Ο (‰)
δD(‰
)
0
LEL
lake
inpu
ts
lake
inpu
ts
LEL
LEL
LEL
LEL
lake
inpu
ts
A B C
lake
inpu
ts
Figure 1. Schematic diagram shows possible isotopic trajectories of individual lakes based on different (A) initial inputs, (B) climatic con-trols on evaporation, and (C) evaporative sensitivities. Each schematic diagram shows the global meteoric waterline (GMWL) as well as monthly precipitation values (Xs), initial lake input values, and local evaporative lines (LELs) for individual lakes in a hypothetical area in the western USA. In (A), three different lake-water input compositions (e.g., for lakes at different elevations or in different seasonal mois-ture regimes) and associated LELs are shown. In (B), a single input composition is shown (black circle) from which one or several LELs may extend (e.g., based on relative humidity differences). In (C), lakes with different evaporative sensitivities (different symbols) lie at different locations along the LEL (e.g., lakes with different water residence times).

Western U.S. lake-water isotopes
Geological Society of America Bulletin, July/August 2009 1181
reacted at 750 °C with Cr metal using a Finni-gan H/Device coupled to the mass spectrom-eter. For δ18O, samples were equilibrated with CO2 gas at ~15 °C in an automated equilibrium device coupled to the mass spectrometer. Nor-malization is based on international reference materials Vienna standard mean ocean water (VSMOW) and standard light Antarctic precip-itation (SLAP); and the δD and δ18O values are reported in per mil (‰) relative to VSMOW (Coplen, 1994). Analytical precision was 0.9‰ for δD and 0.1‰ for δ18O based on repeated measurements of internal standards.
The δD and δ18O values of the water samples from 2008 were analyzed at the University of Wyoming on a Los Gatos Research liquid water isotope analyzer at the University of Wyoming Stable Isotope Facility. The system uses off-axis integrated-cavity output spectroscopy (off-axis ICOS), which measures isotope ratios based on laser absorption. Results were obtained by injection of <10 ml of liquid water into the ana-
lyzer, and analytical precision was <0.2‰ for δ18O and <0.6‰ for δD.
Predictions of monthly and annual δD and δ18O values of precipitation in the sampling region were calculated with the Online Isotopes in Precipitation Calculator (http://wateriso-topes.org/; Bowen and Wilkinson, 2002; Bowen and Revenaugh, 2003) for comparison with lake-water isotope values. Predictions of the δD and δ18O values of meteoric precipitation are made in the calculator on the basis of lati-tude, longitude, elevation, and interpolation of measured data from available sites. The calcu-lator found only minor differences in the isoto-pic values of precipitation between lake sites in each sampling region. Therefore, for this study, we use the calculator to estimate the monthly isotopic values of precipitation at the centroid (the average latitude, longitude, and elevation of lakes) of each sampling region.
We calculated two different annual-average isotopic values of meteoric precipitation for each sampling region to explore the impor-tance of seasonal drought and the seasonal distribution of precipitation (Fig. 3). First, we calculated the annual-average isotopic value of the regional moisture surplus by weight-ing the calculated monthly δ18O and δD val-ues of meteoric precipitation by the monthly-moisture surplus (monthly precipitation minus monthly potential evaporation) for all months with greater precipitation than evaporation (Fig. 3B). The moisture surplus takes into account the timing and severity of seasonal (warm-season) drought. Monthly potential–evaporation data were calculated as in Whit-more et al. (2005). Second, we calculated the annual-average isotopic values of precipitation by weighting the calculated monthly δD and δ18O values by monthly precipitation amounts, which we will refer to as the “weighted mean of precipitation” (i.e., Fig. 3B). The weighted mean of precipitation takes into account the seasonal biases in different monthly precipita-tion amounts across the western USA.
Local evaporation lines (LEL) within each region were calculated in the SPSS statistical program, using a linear regression of lake-water isotopic values (SPSS, 2006). The intersection of the LEL with the GMWL refl ects the isotopic composition of all inputs to all lakes that defi ne the line in a given sampling region (Gibson et al., 2005), which we defi ne as the “lake-water input” value. We used the following standard approximation of the GMWL:
δD = 8 δ18O + 10‰ (Dansgaard, 1964). (1)
Subsequent work by Rozanski et al. (1993) sup-ports the use of this equation. We use the uncer-
tainty in the slope and intercept of the LEL with equation (1) to calculate a range of δ18O and δD lake-water input values for each region.
RESULTS
Precipitation Patterns: Seasonal Distribution and Isotopic Values
SNOTEL data show a range of precipitation regimes in the western USA that are defi ned by different total annual amounts of precipita-tion and different seasonal distributions of pre-cipitation (Fig. 4 and Table DR1 [footnote 1]). Based on principal-component analysis of the SNOTEL data, the precipitation differences among sampling regions are best explained by differences in the relative importance of a winter season that includes November through March; a spring season that includes only May and June; and a summer season that includes only July and August. In the western portions of the study region, in Oregon and Idaho (Fig. 4, Regions 11–13), winter precipitation contrib-utes 75% of annual precipitation, spring con-tributes ~10% of annual precipitation, and sum-mer contributes ~1% of annual precipitation. In the northern portion of the study, in Montana (Fig. 4, Region 10), winter precipitation con-tributes more than 50% of annual precipitation, spring contributes up to 21% of annual precipi-tation, and summer contributes ~5% of annual precipitation. In the southern portion of the study area, in New Mexico and southern Colo-rado (Fig. 4, Regions 1–3), winter precipitation contributes 50% or less of annual precipita-tion, spring contributes 5%–10%, and summer contributes up to 27% of annual precipitation. In the Wind River Range in Wyoming (Fig. 4, Regions 7 and 8), there are less clear seasonal peaks since all the seasons contribute a moder-ate portion of annual precipitation.
The distinguishing feature among precipi-tation regimes in the western USA is whether the warm-season precipitation peak is in May and June (these months account for 5%–21% of total annual precipitation) or in July and August (these months account for 1%–27% of total annual precipitation). Winter precipitation is important in all areas (30%–75% of annual precipitation). There are only three stations with winter contributions less than 40%, and more than half the stations receive more than 60% of precipitation in winter (Fig. 4).
Sampling regions differ in terms of total annual amounts of precipitation. The most west-erly extent of the study region receives the most annual precipitation. For example, the Cascades Range, Oregon (Region 13), receives 1820 ± 400 mm a year, while total annual amounts in
W
W
W
W
W
W
W
WW
W
W
W
W
W
W
W
W
W
W
W
W
W
W
W
W
W
WW
WW
WW
W
W
W
WW
W
WW
W
W
W
W
W
W
W
W
W
W
W
0̄ 200 Kilometers
12
3
4 5
6
7
8
9
1112
13
109°W117°W
36°N
45°N
SNOTEL
Lake
South
West East
10
North
Figure 2. A map of the western USA shows sampled lakes as diamonds and SNOwpack TELemetry (SNOTEL) stations as squares. Sampling regions are circled: 1—Cimarron Range, 2—Canjilon and Burned Mountains, 3—San Juan Mountains, 4—Sawatch Range, 5—Front Range, 6—Park Range and Medi-cine Bow Mountains, 7—Central Wind River Mountains, 8—Union and Togwotee Pass, 9—Beaverhead Mountains, 10—Northwest Montana, 11—McCall Area, 12—Wallowa Mountains, 13—Cascade Range.

Henderson and Shuman
1182 Geological Society of America Bulletin, July/August 2009
Canjilon and Burned Mtns, NM (Reg. 2)
Pre
cipi
tatio
n, E
vapo
ratio
n (m
m)
Cascade Range, OR (Reg. 13)Northwest MT (Reg. 10)
0
50
100
150
200
250
300
350
Pre
cipi
tatio
n, E
vapo
ratio
n (m
m)
0
50
100
150
200
250
300
350
Pre
cipi
tatio
n, E
vapo
ratio
n (m
m)
0
50
100
150
200
250
300
350
-25
-20
-15
-10
-5
δ18Ο
(‰)
10 11 121 2 3 4 5 6 7 8 9 10 11 121 2 3 4 5 6 7 8 9 10 11 121 2 3 4 5 6 7 8 9-25
-20
-15
-10
-5δ18
Ο(‰
)
-25
-20
-15
-10
-5
δ18Ο
(‰)
A
B
Precipitation
PrecipitationPrecipitation
Month Month Month
10 11 121 2 3 4 5 6 7 8 9Month
10 11 121 2 3 4 5 6 7 8 9Month
10 11 121 2 3 4 5 6 7 8 9Month
SurplusSurplus
Surplus
Surplus
PrecipitationEvaporation
Winter0.30–0.400.41–0.500.51–0.600.61–0.75
Summer0.01–0.080.09–0.140.15–0.210.22–0.27
Spring0.05–0.110.12–0.150.16–0.21
500 0 500250 km
A B C
Figure 3. Monthly precipitation, evaporation, and precipitation δ18O values are shown for New Mexico (NM) (Region 2), Montana (MT) (Region 10), and Oregon (OR) (Region 13). (A) The solid line shows monthly precipi-tation values, and the dotted line shows monthly potential evaporation values. Shaded areas mark the months that have a moisture surplus (precipitation > evaporation). (B) Monthly δ18O values (black squares) of meteoric precipitation predicted by Bowen and coworkers’ online calculator are shown for the same regions as in (A). The dashed line marked “Precipitation” shows the weighted mean of precipitation. The dashed line marked “Surplus” shows the mean annual value of precipitation weighted by the proportions of monthly precipitation that exceed evaporation during months when there is a moisture surplus.
Figure 4. Maps of the western USA show SNOTEL data for seasonal fractions of total annual precipitation for (A) Winter (November to March); (B) Spring (May and June); (C) Summer (July and August).

Western U.S. lake-water isotopes
Geological Society of America Bulletin, July/August 2009 1183
New Mexico, Colorado, and Wyoming (Regions 1–8) range from 570 to 1280 mm a year (Fig. 3 and Table DR1 [footnote 1]).
The calculated monthly isotopic values of meteoric precipitation also vary across the West. On plots of δ18O versus δD value, the predicted isotopic values of meteoric precipitation form an ellipse that falls around the GMWL (Fig. 5). The δ18O values of precipitation range from −24‰ to −10‰, and the δD values range from −180‰ to −77‰. The most negative values represent January in all regions except the Cas-cades, Oregon, where March precipitation has the most negative values. The most positive val-ues represent July and/or August in all regions. Seasonal variation in the δD and δ18O values of precipitation is greater inland than near the coasts (e.g., Fig. 3B; Vachon et al., 2007).
Lake-Water Isotopic Variability
On a plot of δ18O versus δD values for the western USA, the lake-water isotopic values of all samples fall in a band that intersects the GMWL (Fig. 5). The δ18O values of the lake water range from −18‰ to 1‰, and the δD val-ues of lake water range from −140‰ to −29‰. Many of the surfi cially open lakes and some surfi cially closed lakes fall on the GMWL. Lakes that fall on the GMWL do not record evaporative evolution of lake water, presum-ably due to a short residence time of the water related to surface or groundwater fl ow.
The band of our lake-water isotopes is made up of multiple lines that represent dif-ferent regions. The areas closer to the coasts (i.e., the initial water vapor), such as the Can-jilon and Burned Mountains, New Mexico (Fig. 5, Region 2), and the Cascades, Oregon (Fig. 5, Region 13), intersect the GMWL at more positive values than northwest Montana (Fig. 5, Region 10), where Rayleigh processes have lowered regional isotopic values of pre-cipitation (e.g., Gammons et al., 2006). Taken together, the band of lake-water data defi nes a regression line (r2 = 0.92), which could be con-sidered a western U.S. evaporation line:
δD = 5.10 (±0.15) δ18O – 38.63 (±1.92). (2)
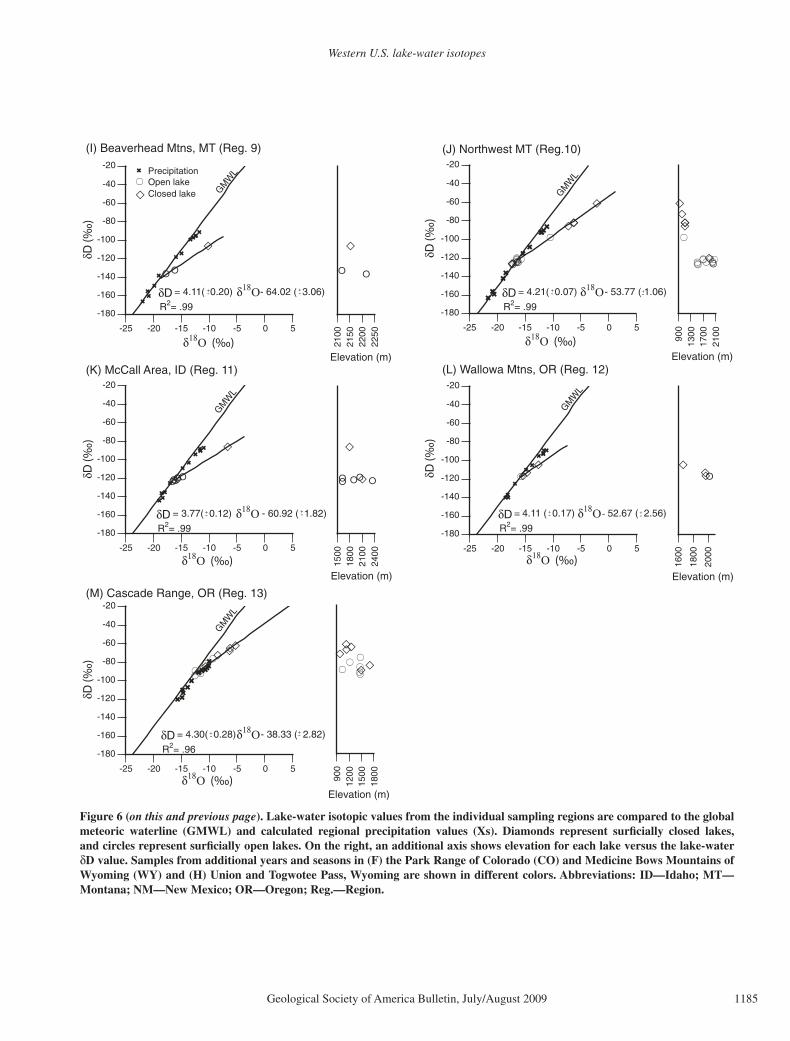
The band defi ned by δ18O versus δD val-ues of lake water in the western USA can be broken down into 13 LELs that represent the individual sampling regions (Fig. 6). The posi-tion of each individual lake along a given LEL is not correlated with the elevation of the lake (r = 0.01), although a modest relationship is seen between elevations and lake δD values in certain sampling regions (e.g., Fig. 6D). Most of the LEL slopes range from values of 4 to 5
(Fig. 7). The exceptions are the Front Range, Colorado (5.63 ± 0.10; Fig. 7, Region 5), and the McCall area, Idaho (3.77 ± 0.12; Fig. 7, Region 11). However, in both of these regions one data point dominates the slope of the evap-orative trajectory from the GMWL (Figs. 6E and 6K).
Continental-scale patterns are evident in the isotopic composition of lake-water inputs from each sampling region (Fig. 8). Lake-water input values decrease northward along the south-north transect with δ18O values decreasing from −11.89‰ to −19.04‰ and δD decreasing from −83.52‰ to −142.30‰. The input values increase westward along the west-east transect with δ18O values decreasing from −13.07‰ to −16.8‰ and with δD values decreasing from –94.59‰ to −124.43‰.
Samples from lakes in the Park Range, Colorado, and the Medicine Bow Mountains, Wyoming (Region 6), collected in July 2006, 2007, 2008, and February 2008 and samples from the Union and Togwotee Pass, Wyo-ming (Region 8), collected in July of 2006 and 2008, respectively, defi ne highly similar LELs (Figs. 6F and 6H; Table DR3 [footnote 1]). The range of lake-water values from the different years overlap for each region, and with con-sideration for uncertainty the equations of the line for the different years are the same in each region (Table DR3 [footnote 1]).
Comparison of Lake-Water Inputs and Meteoric Precipitation
The seasonal precipitation and evaporation patterns in the western USA result in regional differences in the annual amount of mois-ture surpluses and the extent of warm-season
drought (Fig. 3A). These patterns, in combina-tion with regional differences in the monthly isotopic values of meteoric precipitation, result in different isotopic values of the annual mois-ture surplus and the weighted mean of precipi-tation (Fig. 3B). The isotopic composition of the lake-water inputs (i.e., the intersection of the GMWL and the LEL) is correlated with the isotopic values of the annual moisture surplus (r = 0.73; Fig. 9A). However, the correlation shows a positive offset from a one-to-one rela-tionship. By contrast, lake-water inputs and the weighted mean precipitation are strongly correlated and fall along the 1:1 line (r = 0.84; Fig. 9B). The three most southerly regions, Cimarron Range, Canjilon and Burned Moun-tains, and the San Juan Mountains (Fig. 9, Regions 1–3), however, have lake-water input compositions that are positively offset from a one-to-one line with the weighted mean of precipitation. A positive offset with respect to surplus implies that there is contribution of summer precipitation despite summer drought (e.g., Fig. 3A), whereas a positive offset with respect to the weighted mean of precipitation implies an actual bias toward summer precipi-tation. The lake-water input compositions in the southerly regions fall on the GMWL, and therefore the isotopic effects of evapotranspira-tion are not the source of the positive isotopic bias in the southern regions. The Front Range of Colorado and the Beaverhead Mountains of Montana, which each only have three data points, have more negative isotopic input val-ues than the value of the weighted mean of pre-cipitation (Fig. 9B, Regions 5 and 9). However, these isotopic values are also not as negative as the isotopic values of the moisture surplus in either region (Fig. 9A, Regions 5 and 9).
δ18Ο (‰)
GM
WL
δD (
‰)
-180
-160
-140
-120
-100
-80
-60
-40
-20
-25 -20 -15 -10 -5 0 5
# 10, MT
# 13, OR# 2, NM
PrecipitationOpen lakeClosed lake
Figure 5. Lake-water isotopic data are shown for all sampled lakes. Lakes that are surfi cially open are shown as circles, and lakes that are surfi cially closed are shown as diamonds. The predicted monthly values of meteoric precipitation for all the sampling regions are shown as Xs. Abbreviations: GMWL—global meteoric waterline; MT—Montana; NM—New Mexico; OR—Oregon.

Henderson and Shuman
1184 Geological Society of America Bulletin, July/August 2009
δ18Ο (‰)Elevation (m)Elevation (m)
2200
2500
2800
3100
δ18Ο (‰)-25 -20 -15 -10 -5 0 5 -25 -20 -15 -10 -5 0 5
2300
2500
2700
2900
(H) Union & Togwotee Pass, WY (Reg.8)
(A) Cimarron Range, NM (Reg. 1)
δD(‰
)
-180
-160
-140
-120
-100
-80
-60
-40
-20
(B) Canjilon & Burned Mtns, NM (Reg. 2)
-180
-160
-140
-120
-100
-80
-60
-40
-20
δD(‰
)δD
(‰)
-180
-160
-140
-120
-100
-80
-60
-40
-20
(D) Sawatch Range, CO (Reg. 4)
(F) Park Range, CO & Medicine Bow Mtns, WY (Reg. 6)
δD(‰
)
-180
-160
-140
-120
-100
-80
-60
-40
-20
PrecipitationOpen lakeClosed lake
= 4.26 ( 0.19) - 33.71 ( 1.29)
= .9
δ18Ο (‰)
(C) San Juan Mtns, CO (Reg. 3)
GMW
L
9R2 - -
18Ο D + + δδ
-25 -20 -15 -10 -5 0 5
2000
2200
2400
2600
Elevation (m)
δD(‰
)
-180
-160
-140
-120
-100
-80
-60
-40
-20
= 4.95 ( 0.09) - 30.81 ( 0.72)
= .9R2 D
δ18Ο (‰)-25 -20 -15 -10 -5 0 5
9- -δ18Ο+ + δ
GMW
L
2900
2950
3000
3050
3100
Elevation (m)
2500
2800
3100
3400
Elevation (m)
GMW
L
= 4.47 ( 0.17) - 47.87 ( 2.35)
= .99R2 - -δ18ΟD + + δ
-25 -20 -15 -10 -5 0 5
δ18Ο (‰)
δD(‰
)
-180
-160
-140
-120
-100
-80
-60
-40
-20
(E) Front Range, CO (Reg. 5)
= 5.63 ( 0.10) - 32.04 ( 1.26)- Ο
= 4.78 ( 0.25) - 34.19 ( 2.25)
(G) Central Wind River Mtns, WY (Reg. 7)
+-+ -δ18Ο
= .9D
(‰)
2700
2850
3000
3150
Elevation (m)
2500
3000
3500
Elevation (m)
2000
+ -δ18
-25 -20 -15 -10 -5 0 5
δ18Ο (‰)
= .9
+
9R2 Dδ
δ18Ο-25 -20 -15 -10 -5 0 5
8R2 δ
July 2007Feb. 2008July 2008
July 2006
GMW
L
δD(‰
)
-180
-160
-140
-120
-100
-80
-60
-40
-20
δ18Ο (‰)-25 -20 -15 -10 -5 0 5
= 4.95 ( 0.13) - 43.45 ( 1.67)
= .9
GMW
LJuly 2006July 2008
δ18Ο +-+-
8R2 Dδ
Elevation (m)
2300
2700
3100
3500
δD(‰
)
-180
-160
-140
-120
-100
-80
-60
-40
-20
= 4.62 ( 0.17) - 52.62 ( 2.07)
= .992-Ο+-+ δ18Dδ
R
= 4.42 ( 0.29) - 50.58 ( 3.27)
= .98R2
+-+ -δ18ΟδD
GMW
L
GMW
LGM
WL
Western U.S. lake-water isotopes
Geological Society of America Bulletin, July/August 2009 1185
δ18Ο (‰)Elevation (m)
-25 -20 -15 -10 -5 0 5
900
1200
1500
1800
(M) Cascade Range, OR (Reg. 13)Elevation (m)
= 4.30( 0.28) - 38.33 ( 2.82)
= .96R2
+- δ18ΟδD + -
δD(‰
)
(K) McCall Area, ID (Reg. 11)
-180
-160
-140
-120
-100
-80
-60
-40
-20
δD(‰
)
-180
-160
-140
-120
-100
-80
-60
-40
-20
-25 -20 -15 -10 -5 0 5
1500
1800
2100
2400
δ18Ο (‰)
GMW
L
= 3.77( 0.12) - 60.92 ( 1.82)
= .99R2
+-+ -δ18ΟδD
GMW
L
-25 -20 -15 -10 -5 0 5
1600
1800
2000δ18Ο (‰)
Elevation (m)
-180
-160
-140
-120
-100
-80
-60
-40
-20
δD(‰
)
(L) Wallowa Mtns, OR (Reg. 12)
= 4.11 ( 0.17) - 52.67 ( 2.56)
= .99R2 δ18ΟδD +- + -
GMW
L
δ18Ο (‰)Elevation (m)
-25 -20 -15 -10 -5 0 5
900
1300
1700
2100
(J) Northwest MT (Reg.10)
(‰)
δD
-180
-160
-140
-120
-100
-80
-60
-40
-20
= 4.21( 0.07) - 53.77 ( 1.06)
GMW
L
= .99R2
+- + -δ18ΟδD
2100
2150
2200
2250
Elevation (m)
(I) Beaverhead Mtns, MT (Reg. 9)
= 4.11( 0.20) - 64.02 ( 3.06)
= .99R2 δD +-
+ -δ18Ο
δD(‰
)
GMW
L
δ18Ο (‰)
-180
-160
-140
-120
-100
-80
-60
-40
-20PrecipitationOpen lakeClosed lake
-25 -20 -15 -10 -5 0 5
Figure 6 (on this and previous page). Lake-water isotopic values from the individual sampling regions are compared to the global meteoric waterline (GMWL) and calculated regional precipitation values (Xs). Diamonds represent surfi cially closed lakes, and circles represent surfi cially open lakes. On the right, an additional axis shows elevation for each lake versus the lake-water δD value. Samples from additional years and seasons in (F) the Park Range of Colorado (CO) and Medicine Bows Mountains of Wyoming (WY) and (H) Union and Togwotee Pass, Wyoming are shown in different colors. Abbreviations: ID—Idaho; MT—Montana; NM—New Mexico; OR—Oregon; Reg.—Region.

Henderson and Shuman
1186 Geological Society of America Bulletin, July/August 2009
DISCUSSION
Continental-Scale Patterns
SNOTEL data in our study region of the moun-tainous western USA show that the distinguishing factor between climate regions is whether there is a warm-season precipitation peak in May and June or in July and August. All regions show a warm-season drought, though the timing and duration of the drought varies regionally (Fig. 3A). Whit-lock and Bartlein (1993) classifi ed regions around Yellowstone into areas of summer wet and winter dry and regions of summer dry and winter wet, and this set of anti-phased seasonal precipitation regimes is often used as the climatic context for studies throughout the western USA (Alexander et al., 1994; Harte and Shaw, 1995; Fall, 1997;
Lynch, 1998; Meltzer, 1999; Edwards et al., 2001; Sheppard et al., 2002; Lyford et al., 2003; Dif-fenbaugh and Sloan, 2004; Brunelle et al., 2005; Marlon et al., 2006; Leopold et al., 2007). How-ever, the data from SNOTEL stations in our study region show no evidence of mountain areas in the western USA as winter dry. Our results instead suggest the importance of the complexity in both warm and cool season moisture balances for the western USA.
The range of climates in the western USA is refl ected in our lake-water isotopic data. Each sampling region in our study can be represented by a single, well-defi ned LEL (0.96 ≤ r2 ≤ 0.99), which intersects the GMWL at the regional lake-water input composition (Fig. 6). Com-parison among sampling regions shows clear south-north and west-east trends in the isotopic
values of the lake-water inputs (Fig. 8), which are strongly correlated (r = 0.84) with continen-tal patterns in the weighted mean of precipita-tion (Fig. 9B). Our results strongly suggest that the compositions of lake-water inputs refl ect the seasonal distribution of precipitation and not the moisture surplus (Fig. 9).
LEL slopes are thought to be sensitive to climatic conditions such as relative humidity (Craig and Gordon, 1965; Merlivat and Jouzel, 1979; Gibson et al., 2005; e.g., Shapley et al., 2008). However, Gibson et al. (2008) show the values of slopes only range between 4 and 5 in the midlatitudes. Our observations, likewise, show little variation in slope values of LELs in the western USA with values that range between 4 and 5. The consistency in LEL slopes across the western USA may be the result of the shared feature of a period of warm-season moisture defi cit (although the timing and dura-tion of these defi cits vary, i.e., Fig. 3).
Regional- and Local-Scale Processes
Surprisingly, LELs are well defi ned in each sampling region despite large differences in cli-mate conditions at different elevations (e.g., oro-graphically enhanced relative humidity; Fig. 1B) and in lake characteristics and hydrology (e.g., differences in lake size and volume, lake-water conductivity, and in watershed slope, aspect, con-ductivity, and elevation; Fig. 1C and Table DR1 [footnote 1]). We do not detect any systematic effects of lake area, volume, or type (i.e., reser-voir, enhanced, or natural lake) on either lake-water inputs or isotopic evolution along LELs. Nor do we see a correlation between conductiv-ity and the extent of evaporative evolution along LELs (Table DR1 [footnote 1]). Future work could evaluate the specifi c infl uences of these
Latitude (°) Longitude (°)
LEL
slop
e
3
4
5
6
7
8
9
36 38 40 42 44 46 -123 -120 -117 -114
LEL
slop
e
3
4
5
6
7
8
9south north west
101213
east
11
2 34
5
67
8
91
(‰
) of l
ake
inpu
ts
δ18Ο
-25
-20
-15
-10
-5 south north west east
12
13
-160
-140
-120
-100
-80
-60
(‰
) of l
ake
inpu
ts
δD
south north west east
36 38 40 42 44 46 -123 -120 -117 -114
Latitude (°) Longitude (°)36 38 40 42 44 46 -123 -120 -117 -114
Latitude (°) Longitude (°)
(‰
) of l
ake
inpu
ts
(‰
) of l
ake
inpu
ts
δ Dδ18Ο
-160
-140
-120
-100
-80
-60
-25
-20
-15
-10
-5
1
3
4
67
8 9
1012
13
2
5
11
3
45 6 7
8 9
12
1011
A B
Figure 7. Local evaporation line (LEL) slopes are shown with error bars for each sampling region. For the south-north transect, slope values are shown for the mean sampling region latitude. For the west-east transect, slope values are shown for the mean sampling region longitude. Sampling regions are labeled by the same scheme as in Figure 2.
Figure 8. (A) The δ18O values of lake-water input compositions are shown with error bars for each sampling region. For the south-north transect, input values are shown for the mean sampling region latitude, and for lakes on the west-east transect, input values are shown for the mean sampling region longitude. Sampling regions are labeled by the same scheme as in Figure 2. Gray boxes highlight south-north and west-east trends. (B) Same as (A), but for δD.

Western U.S. lake-water isotopes
Geological Society of America Bulletin, July/August 2009 1187
and other factors, and in particular the impor-tance of lake-water residence time.
Elevation and lake-water isotopic values are not correlated across the western USA (r = 0.01) as lake-water inputs are the same across hundreds of meters of elevation within each sampling region. Further, local hydrology infl uences evaporative evolution of lake water. For example, in the Sawatch Range of Colo-rado, the LEL includes four lakes that make up an elevation transect: Lake Ivanhoe (3332 m), Seller Lake (3109 m), Diemer Lake (2903 m), and Nast Lake (2665 m) (Fig. 6D). Lake Ivan-hoe has water-isotope values on the GMWL, which are the same as the sampling region’s lake-water input value. The other lakes fol-low a linear increase in isotopic values with decreasing elevation—except for Seller Lake. Seller Lake is the second highest but the most evaporatively evolved lake, perhaps because it has no stream outlet. The Sawatch Range example implies that though climatic condi-tions related to elevation may impact evapora-tive evolution of lake water, lake hydrology can strongly overprint such a signal.
Lakes in each sampling region share a distinct lake-water input isotopic composition and fall along a LEL despite having different elevations and different ratios of inputs from overland fl ow, stream fl ow, direct precipitation, or groundwater fl ow. Down-catchment fl ow is known to affect downstream isotopic values (Dutton et al., 2005), and may contribute to similar initial lake-water
inputs within individual regions. However, lakes in each sampling region are not always located within the same watershed (e.g., northwest Montana, Region 10). This result implies that the isotopic values of lake-water inputs in the mountainous western USA may refl ect the same sources and processes across broad regions. This is consistent with the similar isotopic val-ues of precipitation in each sampling region cal-culated with the Online Isotope in Precipitation Calculator. The strong correlation (r = 0.84) between input compositions and the weighted mean of precipitation suggests that both ground and surface water refl ect the weighted mean of precipitation. However, this result differs from river-water isotopic data from the western USA (Kendall and Coplen, 2001; Dutton et al., 2005) that shows a bias toward winter precipitation. However neither Kendall and Coplen (2001) or Dutton et al. (2005) look at weighted averages of annual precipitation. Our results suggest that rivers and streams incorporate meteoric precipi-tation differently than lakes.
Lake-water levels, volumes, and area are con-sidered the result of the balance between precip-itation and evaporation (Street and Grove, 1979; Harrison and Digerfeldt, 1993; Benson et al., 1996; Viau and Gajewski, 2001; Shuman and Donnelly, 2006). However, our results show that lake responses to changes in the moisture bal-ance are fi ltered by local hydrology. Thus lake-water levels, volumes, and area may not purely refl ect climate. Further, the isotopic composition
of lake-water inputs indicates that precipitation of all months contribute proportionally to each lake’s water budget even during warm-season periods with large moisture defi cits. The appar-ent paradox of precipitation contributing to lake water, when there is greater evaporation than precipitation, may refl ect a moisture surplus on a fi ner time scale than the monthly balance of precipitation and evaporation. For example, in the summer, on a monthly or weekly scale, precipitation may be less than evaporation (Fig. 3A), but, on a daily or hourly scale, dur-ing an intense storm, precipitation may be much greater than evaporation and can thus contribute to lake and ground water. Our results suggest the importance of event-scale precipitation to the summer and annual moisture balance.
The Cimarron Range, the Canjilon and Burned Mountains, and the San Juan Moun-tains are exceptions to the overall trend that lake-water inputs refl ect the weighted mean of precipitation. Instead, in these regions, the value of the weighted mean of precipitation is more negative than the isotopic composition of the lake-water inputs (Fig. 9B, Regions 1–3) and indicates a bias toward warm-season precipita-tion. The monsoon climate in these regions is the most likely explanation for the apparent bias toward summer precipitation. Heavy summer rainfall events during the summer monsoon are a large fraction of the annual total precipitation (Fig. 4) and may override the seasonal evapora-tion rates as discussed above.
of precipitation weighted by monthly precipitationδ18Ο (‰)of precipitation weighted by monthly surplusδ18Ο (‰)
-25 -20 -15 -10 -5-25 -20 -15 -10 -5
of la
ke in
puts
δ18Ο
(‰)
-25
-20
-15
-10
-5
1:1 lin
e
of la
ke in
puts
δ18Ο
(‰)
-25
-20
-15
-10
-5
1:1 lin
e
1
23
13
4
5
67
8
9
1011124
5
67
89
1011
1
23
12
13
A B
Figure 9. (A) The mean annual δ18O values of meteoric precipitation weighted by the moisture surplus are shown versus the δ18O values of sampling region lake-water inputs. Sampling regions are labeled by the same scheme as in Figure 2. (B) The monthly weighted, annual-average δ18O values of meteoric precipitation are shown versus the δ18O values of sampling region lake-water inputs.

Henderson and Shuman
1188 Geological Society of America Bulletin, July/August 2009
Alternative explanations to the monsoon hypothesis include the possibility that the true local meteoric waterline (LMWL) in this area differs signifi cantly from the GMWL, and thus the calculated lake-water input values may be inaccurate. However, limited data suggest that the LMWL in southern Colorado falls along the GMWL (Halm and Claassen, 2003). Future monitoring of the isotopic values of precipita-tion in the western USA is needed to evaluate the possibility that the LMWL is signifi cantly different from the GMWL. Alternatively, work by Earman et al. (2006) shows that snowpack in New Mexico and Arizona can isotopically evolve during sublimation to values that look more like warm-season precipitation. However, river-water δD and δ18O data in these areas are highly negative, refl ecting unevolved win-ter precipitation (Dutton et al., 2005). Conse-quently, sublimation is an unlikely explanation for the isotopically positive lake-water inputs in the southern portion of the study area.
Our evaluations of lake-water isotopic values are largely based on one slice of time. However, our resampling of the Park Range, Colorado, and the Medicine Bow Mountains, Wyoming (Region 6), and of the Union and Togwotee Pass (Region 8) shows that though annual LELs and regional input values vary, this variation is less than the error estimates on the LEL and input values. Further monitoring of these and other regions will be important to better understand long-term variation in both lake-water input val-ues, evaporative trajectories, and the relation to climate and hydrology.
Implications for Paleoclimate Studies
Sedimentary and fossil archives that record past lake-water isotopic values may be useful as a proxy for changes in meteoric precipita-tion (i.e., related to temperature, the seasonal distribution of precipitation, and/or atmo-spheric circulation); drought (i.e., changes in the extent of the evaporative evolution of lake water); and paleoaltimetry (i.e., evaluation of paleoaltitude). Ultimately, reconstructions of climate from archives of lake-water isotopes must be constrained by other types of paleo-climate data or a network of additional isotopic records. Such data would help to reconstruct past spatial gradients in isotopic values (e.g., Fig. 8) or to confi rm that the data show region-ally coherent climatic changes.
The observed gradients in lake-water inputs, which refl ect broad-scale meteoric precipita-tion patterns along the south-north and west-east transects (Fig. 8), have a magnitude that is equivalent to the range of variation related to evaporative evolution within a sampling region
(Fig. 6). To control for evaporative effects, stud-ies concerned with changes in meteoric precipi-tation require lakes that are constrained to have fallen on the GMWL throughout the archive record. If, for example, a pure temperature extrapolation was made from isotope values that were also affected by evaporation, it would overestimate temperature. The cause of changes in isotopic values in lake water and the weighted mean of precipitation may be confounded by the effects of temperature, the seasonal distribution of precipitation, and atmospheric circulation (e.g., Vachon et al., 2007).
Isotope-based drought reconstructions rely on increases in isotope values as evidence of increased aridity and decreases in values as evi-dence of increased moisture availability. How-ever, such interpretations may be confounded by changes in meteoric precipitation values that would affect initial lake-water input values. Fur-ther, changes in local hydrology, not related to climate, could affect evaporative sensitivity of a lake. A robust approach to drought reconstruc-tion would be to reconstruct LELs over time. For example, isotopic data from a lake that represents the initial composition of lake-water inputs could be compared to at least one other lake in the same region that is heavily infl uenced by evaporation to defi ne the LEL (e.g., Ivanhoe versus Seller Lake in the Sawatch Range, Colo-rado). An analogous approach has been success-ful for δ18O fossil teeth enamel climate recon-structions (i.e., Levin et al., 2006).
The lack of correlation between elevation and lake-water isotopic values (r = 0.01) implies that reconstructions of elevation could not be made based on the assumption of decreasing isotopic values with increasing elevation. Our results sup-port the paleoaltimetry approach that assumes that lake-water isotope values in a mountain-ous area represent the mean weighted value of precipitation at a mean elevation (i.e., Rowley and Garzione, 2007). However, it is important to note that this approach would only work for lakes that do not record evaporation. The differ-ence in our lake-water isotopes to river-water isotope studies (i.e., Kendall and Coplen, 2001; Dutton et al., 2005) suggests the importance of differentiating river and lake sediments and fos-sils for paleoaltimetry studies. Since river-water isotopes are biased toward winter and lake-water isotopes represent the weighted mean of precip-itation, river samples would lead to inferences of higher elevations than lake samples.
CONCLUSION
The δ18O and δD values of lake water in the western USA have coherent regional pat-terns described by LELs that evolve from lake-
water input δ18O and δD values on the GMWL. Evaporation trends, on plots of oxygen versus hydrogen isotopes, are coherent across a range of lakes in each region (0.96 < r2 < 0.99). The extent of evaporative enrichment of the indi-vidual lakes, however, seems to be controlled by local hydrology and not climate or elevation. Additionally, the δ18O and δD values of lake-water inputs do not refl ect the moisture surplus. Instead, in most areas, input values refl ect the weighted mean of precipitation and thus the seasonal distribution of precipitation. Sampling regions in northern New Mexico and southern Colorado are an exception and have input values biased toward warm-season precipitation, which is likely related to the summer monsoon. These results have broad implications for water man-agement, especially if future climate changes infl uence the monsoon or other seasonal pre-cipitation patterns.
Studying the modern relationships between lake-water isotopic values and modern climate can greatly enhance our ability to use isotopic values to quantitatively reconstruct past cli-matic or tectonic changes. Our results empha-size the need to tease apart the confounding infl uences on isotope values. Spatial networks of lake-isotope records could be used to sepa-rately assess the infl uences of air mass source, the seasonal distribution of precipitation, tem-perature, and evaporation on isotope records.
ACKNOWLEDGMENTS
This study was supported by a National Science Foundation Doctoral Dissertation Grant (SBE – 0623442) to A. Henderson and a University of Minnesota McKnight Land-Grant Professorship to B. Shuman. We thank D. King and M. Landis for help in the fi eld, T. Pagona for advice on working with SNOTEL data, D.L. Fox, E. Ito, H.E. Wright, D. Larsen, P. Schuster, and one anonymous reviewer for comments on the manuscript, G. Bowen for discus-sion of meteoric precipitation isotopes, and P. Bartlein for climate data and discussion.
REFERENCES CITED
Alexander, J., Bridge, J.S., Leeder, M.R., Collier, R.E.L., and Gawthorpe, R.L., 1994, Holocene meander-belt evolution in an active extensional basin, southwestern Montana: Journal of Sedimentary Research, Section B: Stratigraphy and Global Studies, v. 64, p. 542–559.
Anderson, L., Abbott, M.B., Finney, B.P., and Burns, S.J., 2006, Regional atmospheric circulation change in the North Pacifi c during the Holocene inferred from lacustrine carbonate oxygen isotopes, Yukon Territory, Canada: Quaternary Research, v. 65, p. 350–351, doi: 10.1016/j.yqres.2005.11.001.
Benson, L., White, L.D., and Robert, R., 1996, Carbonate deposition, Pyramid Lake Subbasin, Nevada: 4. Com-parison of the stable isotope values of carbonate depos-its (tufas) and the Lahontan lake-level record: Palaeo-geography, Palaeoclimatology, Palaeoecology, v. 122, p. 45–76, doi: 10.1016/0031-0182(95)00099-2.
Benson, L., Kashgarian, M., Rye, R., Lund, S., Paillet, F., Smoot, J., Kester, C., Mensing, S., Meko, D., and Lind-strom, S., 2002, Holocene multidecadal and multicenten-nial droughts affecting northern California and Nevada:

Western U.S. lake-water isotopes
Geological Society of America Bulletin, July/August 2009 1189
Quaternary Science Reviews, v. 21, p. 659–682, doi: 10.1016/S0277-3791(01)00048-8.
Bowen, G.J., and Revenaugh, J., 2003, Interpolating the isotopic composition of modern meteoric precipita-tion: Water Resources Research, v. 39, p. 1299, doi: 10.1029/2003WR002086.
Bowen, G.J., and Wilkinson, B., 2002, Spatial distribution of δ18O in meteoric precipitation: Geology, v. 30, p. 315–318, doi: 10.1130/0091-7613(2002)030<0315:SDOOIM>2.0.CO;2.
Brunelle, A., Whitlock, C., Bartlein, P., and Kipfmueller, K., 2005, Holocene fi re and vegetation along environ-mental gradients in the Northern Rocky Mountains: Quaternary Science Reviews, v. 24, p. 2281–2300, doi: 10.1016/j.quascirev.2004.11.010.
Burnett, A.W., Kirby, M.E., Mullins, H.T., and Patterson, W.P., 2003, Increasing Great Lake-effect snowfall during the twentieth century: A regional response to global warm-ing?: Journal of Climate, v. 16, p. 3535–3542, doi: 10.1175/1520-0442(2003)016<3535:IGLSDT>2.0.CO;2.
Coplen, T.B., 1994, Reporting of stable hydrogen, carbon, and oxygen isotopic abundances: Pure and Applied Chemis-try, v. 66, p. 273–276, doi: 10.1351/pac199466020273.
Craig, H., and Gordon, L.I., 1965, Deuterium and oxygen 18 variations in the ocean and marine atmosphere, in Ton-giorgi, E., ed., Stable isotopes in oceanographic studies and paleotemperatures: Spoleto, Italy, Laboratorio di Geologia Nucleare.
Dansgaard, W., 1964, Stable isotopes in precipitation: Tel-lus, v. 16, no. 4, p. 436–468.
Diffenbaugh, N.S., and Sloan, L.C., 2004, Mid-Holocene orbital forcing of regional-scale climate: A case study of western North America using a high-resolution RCM: Journal of Climate, v. 17, p. 2927–2937, doi: 10.1175/1520-0442(2004)017<2927:MOFORC>2.0.CO;2.
Dutton, A., Wilkinson, B.H., Welker, J.M., Bowen, G.J., and Lohmann, K.C., 2005, Spatial distribution and seasonal variation in 18O/16O of modern precipitation and river water across the conterminous USA: Hydrological Pro-cesses, v. 19, p. 4121–4146, doi: 10.1002/hyp.5876.
Earman, S., Campbell, A.R., Phillips, F.M., and Newman, B.D., 2006, Isotopic exchange between snow and atmospheric water vapor: Estimation of the snowmelt component of groundwater recharge in the southwest-ern United States: Journal of Geophysical Research-Atmospheres, v. 111, p. D09302, doi: 10.1029/2005JD006470.
Edwards, M.E., Mock, C.J., Finney, B.P., Barber, V.A., and Bartlein, P.J., 2001, Potential analogues for paleocli-matic variations in eastern interior Alaska during the past 14,000 yr: Atmospheric-circulation controls of regional temperature and moisture responses: Quater-nary Science Reviews, v. 20, p. 189–202, doi: 10.1016/S0277-3791(00)00123-2.
Edwards, T.W.D., Wolfe, B.B., and MacDonald, G.M., 1996, Infl uence of changing atmospheric circulation on pre-cipitation delta δ18O-temperature relations in Canada during the Holocene: Quaternary Research, v. 46, p. 211–218, doi: 10.1006/qres.1996.0061.
Fall, P.L., 1997, Timberline fl uctuations and late Quaternary paleoclimates in the Southern Rocky Mountains, Colo-rado: Geological Society of America Bulletin, v. 109, p. 1306–1320, doi: 10.1130/0016-7606(1997)109<1306:TFALQP>2.3.CO;2.
Gammons, C.H., Poulson, S.R., Pellicori, D.A., Reed, P.J., Roesler, A.J., and Petrescu, E.M., 2006, The hydrogen and oxygen isotopic composition of precipitation, evap-orated mine water, and river water in Montana, USA: Amsterdam, Journal of Hydrology, v. 328, p. 319–330, doi: 10.1016/j.jhydrol.2005.12.005.
Gibson, J.J., Edwards, T.W.D., Birks, S.J., St Amour, N.A., Buhay, W.M., McEachern, P., Wolfe, B.B., and Peters, D.L., 2005, Progress in isotope tracer hydrology in Canada: Hydrological Processes, v. 19, p. 303–327, doi: 10.1002/hyp.5766.
Gibson, J.J., Birks, S.J., and Edwards, T.W.D., 2008, Global prediction of δA and δ2H-δ18O evaporation slopes for lakes and soil water accounting for seasonality: Global Biogeochemical Cycles, v. GB2031, doi: 10.1029/2007GB002997.
Gonfi antini, R., 1986, Environmental isotopes in lake stud-ies, in Fritz, P., et al., eds, Handbook of environmental
isotope geochemistry, vol. 3: New York, Elsevier Sci-ence Publishing Company, p. 113–168.
Halm, D.R., and Claassen, C., 2003, Oxygen-18 and deute-rium content of incident and through-fall precipitation at a high-altitude site, San Juan Mountains, Colorado: http://wwwbrr.cr.usgs.gov/projects/SW_corrosion/snowshoe/index.html.
Harrison, S.P., and Digerfeldt, G., 1993, European lakes as paleohydrological and paleoclimatic indicators: Quaternary Science Reviews, v. 12, p. 233–248, doi: 10.1016/0277-3791(93)90079-2.
Harte, J., and Shaw, R., 1995, Shifting dominance within a montane vegetation community—Results of a climate-warming experiment: Science, v. 267, p. 876–880, doi: 10.1126/science.267.5199.876.
Huang, Y.S., Shuman, B., Wang, Y., and Webb, T., 2002, Hydrogen isotope ratios of palmitic acid in lacustrine sediments record late Quaternary climate variations: Geology, v. 30, p. 1103–1106, doi: 10.1130/0091-7613(2002)030<1103:HIROPA>2.0.CO;2.
Kendall, C., and Coplen, T.B., 2001, Distribution of oxy-gen-18 and deuterium in river waters across the United States: Hydrological Processes, v. 15, p. 1363–1393, doi: 10.1002/hyp.217.
Kirby, M.E., Mullins, H.T., Patterson, W.P., and Burnett, A.W., 2002, Late glacial-Holocene atmospheric circu-lation and precipitation in the northeast United States inferred from modern calibrated stable oxygen and car-bon isotopes: Geological Society of America Bulletin, v. 114, p. 1326–1340, doi: 10.1130/0016-7606(2002)114<1326:LGHACA>2.0.CO;2.
Leopold, E.B., Liu, G.W., Love, J.D., and Love, D.W., 2007, Plio-Pleistocene climatic transition and the lifting of the Teton Range, Wyoming: Quaternary Research, v. 67, p. 1–11, doi: 10.1016/j.yqres.2006.10.006.
Levin, N.E., Cerling, T.E., Passey, B.H., Harris, J.M., and Ehleringer, J.R., 2006, A stable isotope aridity index for ter-restrial environments: Proceedings of the National Acad-emy of Sciences of the United States of America, v. 103, p. 11,201–11,205, doi: 10.1073/pnas.0604719103.
Lyford, M.E., Jackson, S.T., Betancourt, J.L., and Gray, S.T., 2003, Infl uence of landscape structure and climate vari-ability on a late Holocene plant migration: Ecological Monographs, v. 73, p. 567–583, doi: 10.1890/03-4011.
Lynch, E.A., 1998, Origin of a park-forest vegetation mosaic in the Wind River Range, Wyoming: Ecology, v. 79, p. 1320–1338.
Marlon, J., Bartlein, P.J., and Whitlock, C., 2006, Fire-fuel-climate linkages in the northwestern USA during the Holocene: The Holocene, v. 16, p. 1059–1071, doi: 10.1177/0959683606069396.
Meltzer, D.J., 1999, Human responses to middle Holocene (altithermal) climates on the North American Great Plains: Quaternary Research, v. 52, p. 404–416, doi: 10.1006/qres.1999.2067.
Merlivat, L., and Jouzel, J., 1979, Global climatic interpreta-tion of the deuterium-oxygen 18 relationship for pre-cipitation: Journal of Geophysical Research-Oceans and Atmospheres, v. 84, p. 5029–5033, doi: 10.1029/JC084iC08p05029.
Mock, C., 1996, Climatic controls and spatial variations of precipitation in the western United States: Journal of Climate, v. 9, p. 1111–1125, doi: 10.1175/1520-0442(1996)009<1111:CCASVO>2.0.CO;2.
Rosqvist, G.C., Leng, M.J., and Jonsson, C., 2007, North Atlantic region atmospheric circulation dynamics inferred from a late-Holocene lacustrine carbonate iso-tope record, northern Swedish Lapland: The Holocene, v. 17, p. 867–873, doi: 10.1177/0959683607080508.
Rowley, D.B., and Currie, B.S., 2006, Palaeo-altimetry of the late Eocene to Miocene Lunpola basin, central Tibet: Nature, v. 439, p. 677–681, doi: 10.1038/nature04506.
Rowley, D.B., and Garzione, C.N., 2007, Stable isotope-based paleoaltimetry: Annual Review of Earth and Planetary Sciences, v. 35, p. 463–508, doi: 10.1146/annurev.earth.35.031306.140155.
Rozanski, K., Araguas-Araguas, L., and Gonfontini, R., 1993, Isotopic patterns in modern global precipitation: in Swart, P.K., et al., eds., Climate change in continen-tal isotopic records: Lohmann, K.C., McKenzie, J., and Savin, S., eds., Geophysical Monograph No. 78: Wash-ington, American Geophysical Union, p. 1−36.
Serreze, M.C., Clark, M.P., and Frei, A., 2001, Character-istics of large snowfall events in the montane western United States as examined using snowpack telemetry (SNOTEL) data: Water Resources Research, v. 37, p. 675–688, doi: 10.1029/2000WR900307.
Shapley, M.D., Ito, E., and Donovan, J.J., 2008, Isotopic evolution and climate paleorecords: Modeling bound-ary effects in groundwater-dominated lakes: Journal of Paleolimnology, v. 39, p. 17–33, doi: 10.1007/s10933-007-9092-3.
Sheppard, P.R., Comrie, A.C., Packin, G.D., Angersbach, K., and Hughes, M.K., 2002, The climate of the US Southwest: Climate Research, v. 21, p. 219–238, doi: 10.3354/cr021219.
Shuman, B., and Donnelly, J.P., 2006, The infl uence of sea-sonal precipitation and temperature regimes on lake levels in the northeastern United States during the Holocene: Quaternary Research, v. 65, p. 44–56, doi: 10.1016/j.yqres.2005.09.001.
Shuman, B., Huang, Y.S., Newby, P., and Wang, Y., 2006, Compound-specifi c isotopic analyses track changes in seasonal precipitation regimes in the northeastern United States at ca 8200 cal yr BP: Quaternary Sci-ence Reviews, v. 25, p. 2992–3002, doi: 10.1016/j.quascirev.2006.02.021.
Smith, M.A., and Hollander, D.J., 1999, Historical link-age between atmospheric circulation patterns and the oxygen isotopic record of sedimentary carbonates from Lake Mendota, Wisconsin, USA: Geology, v. 27, p. 589–592, doi: 10.1130/0091-7613(1999)027<0589:HLBACP>2.3.CO;2.
SPSS for Mac OS X, 2006, Release 13.0.0: Chicago, SPSS.Stevens, L.R., and Dean, W.E., 2008, Geochemical evidence
for hydroclimatic variability over the last 2460 years from Crevice Lake in Yellowstone National Park, USA: Quaternary International.
Stevens, L.R., Wright, H.E., and Ito, E., 2001, Proposed changes in seasonality of climate during the Late gla-cial and Holocene at Lake Zeribar, Iran: The Holocene, v. 11, p. 747–755, doi: 10.1191/09596830195762.
Street, F.A., and Grove, A.T., 1979, Global maps of lake-level fl uctuations since 30,000 yr B.P.: Quaternary Research, v. 12, p. 83–118, doi: 10.1016/0033-5894(79)90092-9.
Vachon, R.W., White, J.W.C., Gutmann, E., and Welker, J.M., 2007, Amount-weighted annual isotopic (delta O-18) values are affected by the seasonality of precipi-tation: A sensitivity study: Geophysical Research Let-ters, v. 34, p. L21707, doi: 10.1029/2007GL030547.
Viau, A.E., and Gajewski, K., 2001, Holocene variations in the global hydrological cycle quantifi ed by objec-tive gridding of lake level databases: Journal of Geo-physical Research, v. 106, p. 31,703–31,716, doi: 10.1029/2000JD000237.
von Grafenstein, U., Erlenkeuser, H., Brauer, A., Jouzel, J., and Johnsen, S.J., 1999, A mid-European decadal isotope-climate record from 15,500 to 5000 years BP: Science, v. 284, p. 1654–1657, doi: 10.1126/science.284.5420.1654.
Whitlock, C., and Bartlein, P.J., 1993, Spatial variations of Holocene climatic-change in the Yellowstone Region: Quaternary Research, v. 39, p. 231–238, doi: 10.1006/qres.1993.1026.
Whitmore, J., Gajewski, K., Sawada, M., Williams, J.W., Shuman, B., Bartlein, P.J., Minckley, T., Viau, A.E., Webb, T., Shafer, S., Anderson, P., and Brubaker, L., 2005, Modern pollen data from North American and Greenland for multi-scale paleoenvironmental appli-cations: Quaternary Science Reviews, v. 24, p. 1828–1848, doi: 10.1016/j.quascirev.2005.03.005.
Yu, Z.C., Ito, E., and Engstrom, D.R., 2002, Water isoto-pic and hydrochemical evolution of a lake chain in the northern Great Plains and its paleoclimatic implica-tions: Journal of Paleolimnology, v. 28, p. 207–217, doi: 10.1023/A:1021651824885.
MANUSCRIPT RECEIVED 3 APRIL 2008REVISED MANUSCRIPT RECEIVED 15 OCTOBER 2008MANUSCRIPT ACCEPTED 22 OCTOBER 2008
Printed in the USA