Embed Size (px)
Citation preview

i
i
RISK MODEL FOR ELECTRICAL AND INSTRUMENTATION
INSTALLATION FOR POWER GENERATION SYSTEM ONBOARD SHIP
MOHD AZAHAR ALIAS
A thesis submitted in fulfilment of the
Requirements for the award of the degree of
Master of Engineering (Marine Technology)
Faculty of Mechanical Engineering
Universiti Teknologi Malaysia
FEBRUARY 2013

iii
iii
To my beloved wife and children
iv
iv
ACKNOWLEDGEMENT
Alhamdulillah I have made it to the final stage of my studies with the help
and guidance of the Almighty through all my hardships. I am also grateful to my
supervisor, Assoc. Prof. Dr. Mohd Zamani Ahmad, for his guidance and supervision.
Without his continued support and interest, this thesis would not have been the same
as presented here.
I would also like to thank my colleagues who have directly or indirectly
helped me with this research. My utmost praise goes to my wife for her continuous
support in my studies and for her understanding and patience during my deliverance.
Last but not least, to those who have been involved directly or indirectly in the
development of this project, I thank you for your assistants and kindness.
v
v
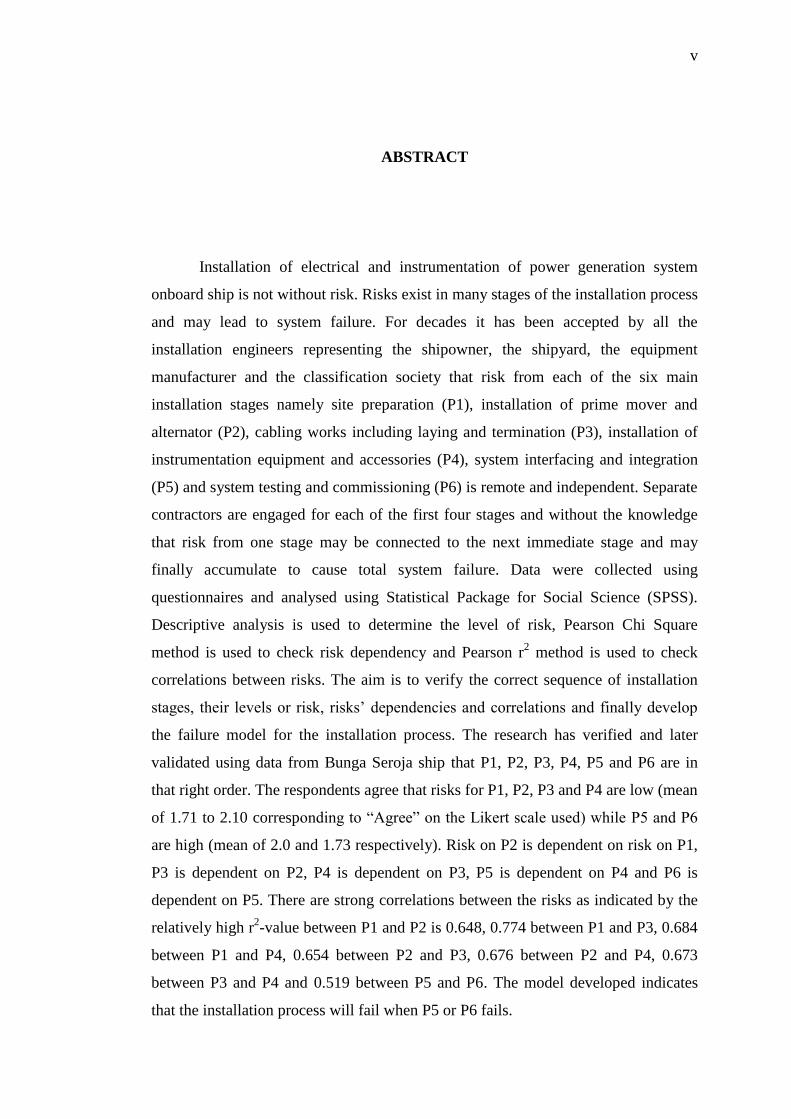
ABSTRACT
Installation of electrical and instrumentation of power generation system
onboard ship is not without risk. Risks exist in many stages of the installation process
and may lead to system failure. For decades it has been accepted by all the
installation engineers representing the shipowner, the shipyard, the equipment
manufacturer and the classification society that risk from each of the six main
installation stages namely site preparation (P1), installation of prime mover and
alternator (P2), cabling works including laying and termination (P3), installation of
instrumentation equipment and accessories (P4), system interfacing and integration
(P5) and system testing and commissioning (P6) is remote and independent. Separate
contractors are engaged for each of the first four stages and without the knowledge
that risk from one stage may be connected to the next immediate stage and may
finally accumulate to cause total system failure. Data were collected using
questionnaires and analysed using Statistical Package for Social Science (SPSS).
Descriptive analysis is used to determine the level of risk, Pearson Chi Square
method is used to check risk dependency and Pearson r2 method is used to check
correlations between risks. The aim is to verify the correct sequence of installation
stages, their levels or risk, risks‘ dependencies and correlations and finally develop
the failure model for the installation process. The research has verified and later
validated using data from Bunga Seroja ship that P1, P2, P3, P4, P5 and P6 are in
that right order. The respondents agree that risks for P1, P2, P3 and P4 are low (mean
of 1.71 to 2.10 corresponding to ―Agree‖ on the Likert scale used) while P5 and P6
are high (mean of 2.0 and 1.73 respectively). Risk on P2 is dependent on risk on P1,
P3 is dependent on P2, P4 is dependent on P3, P5 is dependent on P4 and P6 is
dependent on P5. There are strong correlations between the risks as indicated by the
relatively high r2-value between P1 and P2 is 0.648, 0.774 between P1 and P3, 0.684
between P1 and P4, 0.654 between P2 and P3, 0.676 between P2 and P4, 0.673
between P3 and P4 and 0.519 between P5 and P6. The model developed indicates
that the installation process will fail when P5 or P6 fails.
vi
vi
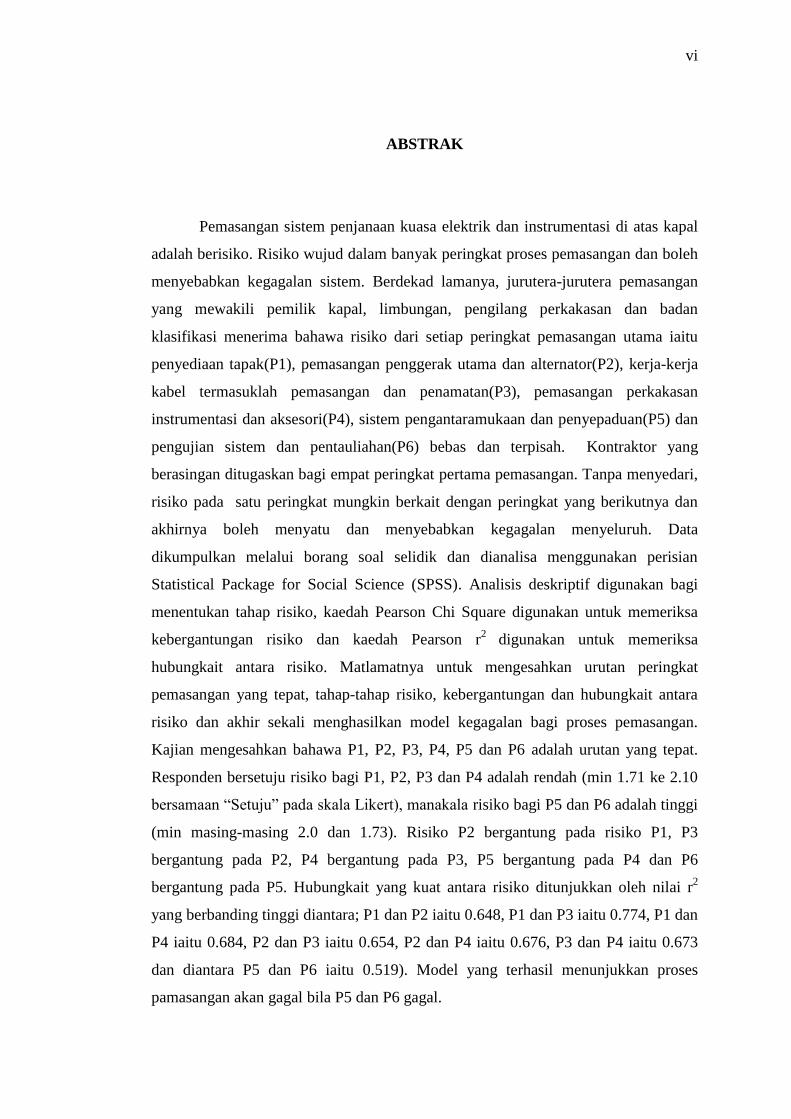
ABSTRAK
Pemasangan sistem penjanaan kuasa elektrik dan instrumentasi di atas kapal
adalah berisiko. Risiko wujud dalam banyak peringkat proses pemasangan dan boleh
menyebabkan kegagalan sistem. Berdekad lamanya, jurutera-jurutera pemasangan
yang mewakili pemilik kapal, limbungan, pengilang perkakasan dan badan
klasifikasi menerima bahawa risiko dari setiap peringkat pemasangan utama iaitu
penyediaan tapak(P1), pemasangan penggerak utama dan alternator(P2), kerja-kerja
kabel termasuklah pemasangan dan penamatan(P3), pemasangan perkakasan
instrumentasi dan aksesori(P4), sistem pengantaramukaan dan penyepaduan(P5) dan
pengujian sistem dan pentauliahan(P6) bebas dan terpisah. Kontraktor yang
berasingan ditugaskan bagi empat peringkat pertama pemasangan. Tanpa menyedari,
risiko pada satu peringkat mungkin berkait dengan peringkat yang berikutnya dan
akhirnya boleh menyatu dan menyebabkan kegagalan menyeluruh. Data
dikumpulkan melalui borang soal selidik dan dianalisa menggunakan perisian
Statistical Package for Social Science (SPSS). Analisis deskriptif digunakan bagi
menentukan tahap risiko, kaedah Pearson Chi Square digunakan untuk memeriksa
kebergantungan risiko dan kaedah Pearson r2
digunakan untuk memeriksa
hubungkait antara risiko. Matlamatnya untuk mengesahkan urutan peringkat
pemasangan yang tepat, tahap-tahap risiko, kebergantungan dan hubungkait antara
risiko dan akhir sekali menghasilkan model kegagalan bagi proses pemasangan.
Kajian mengesahkan bahawa P1, P2, P3, P4, P5 dan P6 adalah urutan yang tepat.
Responden bersetuju risiko bagi P1, P2, P3 dan P4 adalah rendah (min 1.71 ke 2.10
bersamaan ―Setuju‖ pada skala Likert), manakala risiko bagi P5 dan P6 adalah tinggi
(min masing-masing 2.0 dan 1.73). Risiko P2 bergantung pada risiko P1, P3
bergantung pada P2, P4 bergantung pada P3, P5 bergantung pada P4 dan P6
bergantung pada P5. Hubungkait yang kuat antara risiko ditunjukkan oleh nilai r2
yang berbanding tinggi diantara; P1 dan P2 iaitu 0.648, P1 dan P3 iaitu 0.774, P1 dan
P4 iaitu 0.684, P2 dan P3 iaitu 0.654, P2 dan P4 iaitu 0.676, P3 dan P4 iaitu 0.673
dan diantara P5 dan P6 iaitu 0.519). Model yang terhasil menunjukkan proses
pamasangan akan gagal bila P5 dan P6 gagal.

vii
vii
TABLE OF CONTENT
CHAPTER TITLE PAGE
DECLARATION OF THE STATUS OF THESIS
SUPERVISOR‘S DECLARATION
DECLARATION ON COOPERATION
TITLE PAGE i
DECLARATION OF ORIGINALITY AND
EXCLUSIVENESS
ii
DEDICATION iii
ACKNOWLEDGEMENT iv
ABSTRACT v
ABSTRAK vi
TABLE OF CONTENT vii
LIST OF TABLES x
LIST OF FIGURES xii
LIST OF ABBREVIATIONS
LIST OF APPENDICES
xiii
xv
1 INTRODUCTION
1.1 Background 1
1.2 Problem statement 2
1.3 Objectives of study 3
1.4 Scope of study 3
1.5 Significance of study 4
1.6 Research framework 5
1.7 Thesis Structure 6
viii
viii
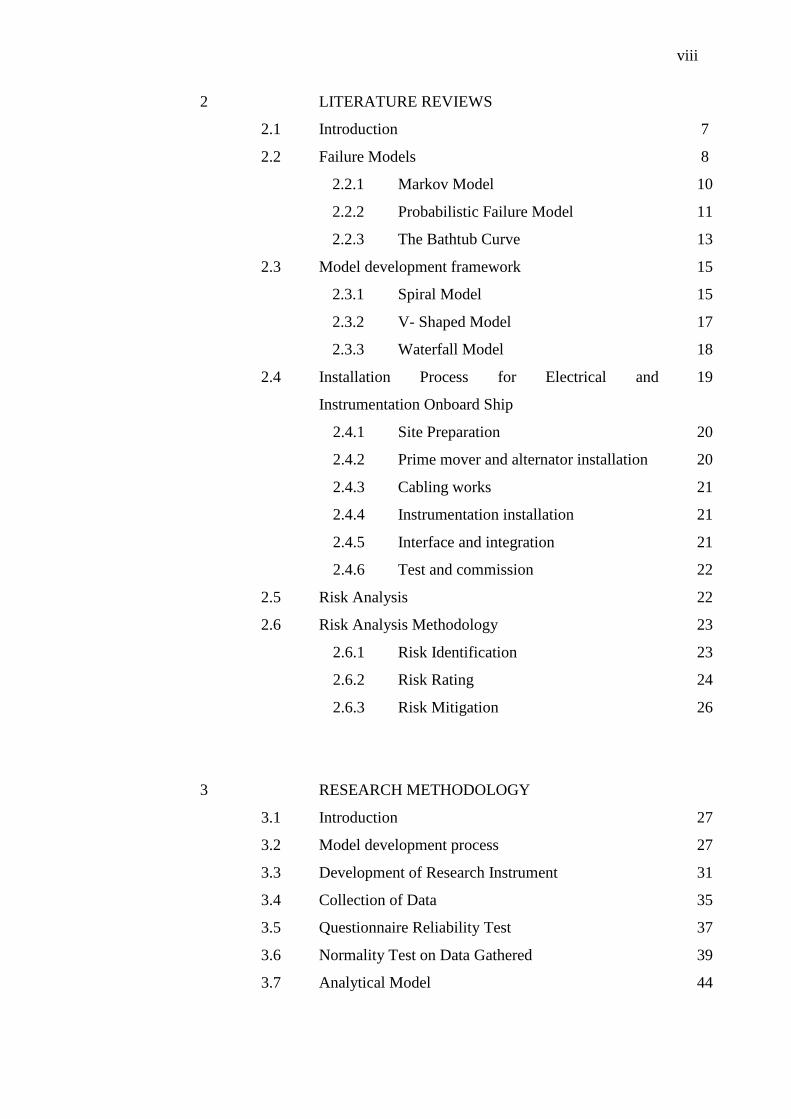
2 LITERATURE REVIEWS
2.1 Introduction 7
2.2 Failure Models 8
2.2.1 Markov Model 10
2.2.2 Probabilistic Failure Model 11
2.2.3 The Bathtub Curve 13
2.3 Model development framework 15
2.3.1 Spiral Model 15
2.3.2 V- Shaped Model 17
2.3.3 Waterfall Model 18
2.4 Installation Process for Electrical and
Instrumentation Onboard Ship
19
2.4.1 Site Preparation 20
2.4.2 Prime mover and alternator installation 20
2.4.3 Cabling works 21
2.4.4 Instrumentation installation 21
2.4.5 Interface and integration 21
2.4.6 Test and commission 22
2.5 Risk Analysis 22
2.6 Risk Analysis Methodology 23
2.6.1 Risk Identification 23
2.6.2 Risk Rating 24
2.6.3 Risk Mitigation 26
3 RESEARCH METHODOLOGY
3.1 Introduction 27
3.2 Model development process 27
3.3 Development of Research Instrument 31
3.4 Collection of Data 35
3.5 Questionnaire Reliability Test 37
3.6 Normality Test on Data Gathered 39
3.7 Analytical Model 44
ix
ix
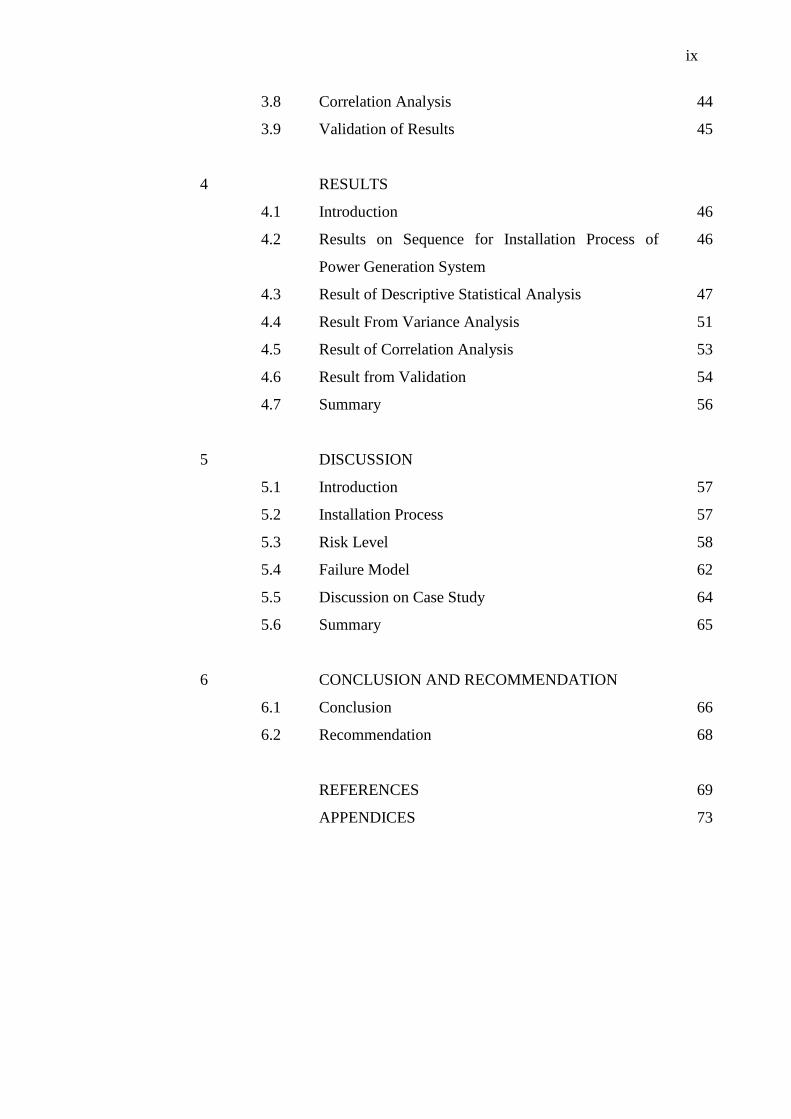
3.8 Correlation Analysis 44
3.9 Validation of Results 45
4 RESULTS
4.1 Introduction 46
4.2 Results on Sequence for Installation Process of
Power Generation System
46
4.3 Result of Descriptive Statistical Analysis 47
4.4 Result From Variance Analysis 51
4.5 Result of Correlation Analysis 53
4.6 Result from Validation 54
4.7 Summary 56
5 DISCUSSION
5.1 Introduction 57
5.2 Installation Process 57
5.3 Risk Level 58
5.4 Failure Model 62
5.5 Discussion on Case Study 64
5.6 Summary 65
6 CONCLUSION AND RECOMMENDATION
6.1 Conclusion 66
6.2 Recommendation 68
REFERENCES 69
APPENDICES 73
x
x
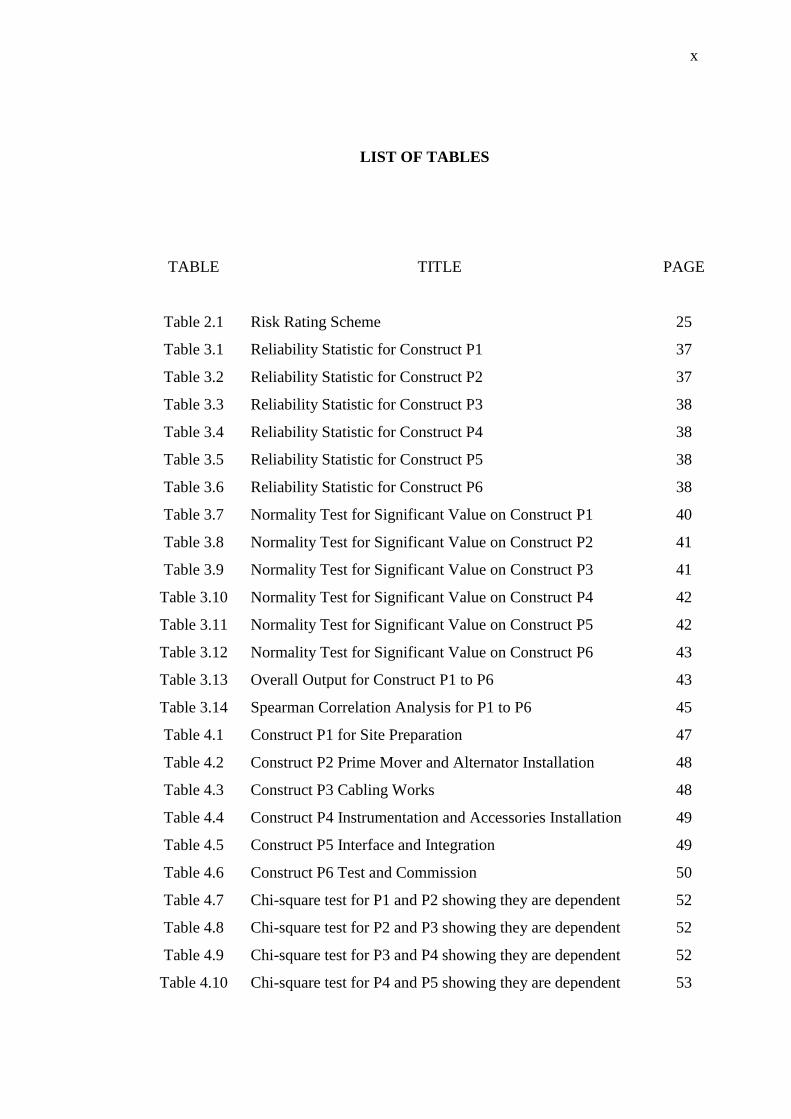
LIST OF TABLES
TABLE TITLE PAGE
Table 2.1 Risk Rating Scheme 25
Table 3.1 Reliability Statistic for Construct P1 37
Table 3.2 Reliability Statistic for Construct P2 37
Table 3.3 Reliability Statistic for Construct P3 38
Table 3.4 Reliability Statistic for Construct P4 38
Table 3.5 Reliability Statistic for Construct P5 38
Table 3.6 Reliability Statistic for Construct P6 38
Table 3.7 Normality Test for Significant Value on Construct P1 40
Table 3.8 Normality Test for Significant Value on Construct P2 41
Table 3.9 Normality Test for Significant Value on Construct P3 41
Table 3.10 Normality Test for Significant Value on Construct P4 42
Table 3.11 Normality Test for Significant Value on Construct P5 42
Table 3.12 Normality Test for Significant Value on Construct P6 43
Table 3.13 Overall Output for Construct P1 to P6 43
Table 3.14 Spearman Correlation Analysis for P1 to P6 45
Table 4.1 Construct P1 for Site Preparation 47
Table 4.2 Construct P2 Prime Mover and Alternator Installation 48
Table 4.3 Construct P3 Cabling Works 48
Table 4.4 Construct P4 Instrumentation and Accessories Installation 49
Table 4.5 Construct P5 Interface and Integration 49
Table 4.6 Construct P6 Test and Commission 50
Table 4.7 Chi-square test for P1 and P2 showing they are dependent 52
Table 4.8 Chi-square test for P2 and P3 showing they are dependent 52
Table 4.9 Chi-square test for P3 and P4 showing they are dependent 52
Table 4.10 Chi-square test for P4 and P5 showing they are dependent 53

xi
xi
Table 4.11 Chi-square test for P5 and P6 showing they are dependent 53
Table 4.12 Correlations of risk between the different process 54
Table 5.1 Electrical and Instrumentation system for Power
generation Installation process Model
58
Table 5.2 Risk Level on each Step of Installation process 58
Table 5.3 Risk Type and Risk Level for Sub-process P1 59
Table 5.4 Risk Type and Risk Level for Sub-process P2 59
Table 5.5 Risk Type and Risk Level for Sub-process P3 60
Table 5.6 Risk Type and Risk Level for Sub-process P4 60
Table 5.7 Risk Type and Risk Level for Sub-process P5 60
Table 5.8 Risk Type and Risk Level for Sub-process P6 60
Table 5.9 Process Dependency Table 61

xii
xii
LIST OF FIGURES
FIGURE TITLE PAGE
Figure 2.1 Markov Failure Model 11
Figure 2.2 Bathtub Curve 14
Figure 2.3 Model of the World Structure for AFW System 15
Figure 2.4 Spiral Model 16
Figure 2.5 V-Shaped Model 17
Figure 2.6 FMEA Waterfall Road Map 18
Figure 2.7 Shipboard Generator Installation Process 20
Figure 3.1 Research Methodology Flow Chart 28
Figure 3.2 Identification of Installation Process 29
Figure 3.3 Conceptual Model of Installation Process 30
Figure 3.4 Preliminary Failure Model 31
Figure 3.5 Construct P1 for Site Preparation 32
Figure 3.6 Construct P2 for Prime Mover and Alternator Installation 32
Figure 3.7 Construct P3 for Cabling Works 33
Figure 3.8 Construct P4 for Instrumentation and Accessories Installation 33
Figure 3.9 Construct P5 for System Interface and Integration 34
Figure 3.10 Construct P6 for Testing and Commissioning 34
Figure 3.11 Demographical 36
Figure 3.12 Bar Chart on respondent experience 36
Figure 4.1 Pie-Chart Sequence of Installation Process 47
Figure 4.2 Indicate the mean value range 50
Figure 4.3 Descriptive Statistical for mean value 51
Figure 4.4 Validation of Survey data and actual installation 55
Figure 4.5 Comparison or Survey Data and actual Installation 56
Figure 5.1 Risk Model for Electrical and Instrumentation System 62
Figure 5.2 Final Risk Model for Electrical and Instrumentation System
Installation onboard the Ship.
63
xiii
xiii
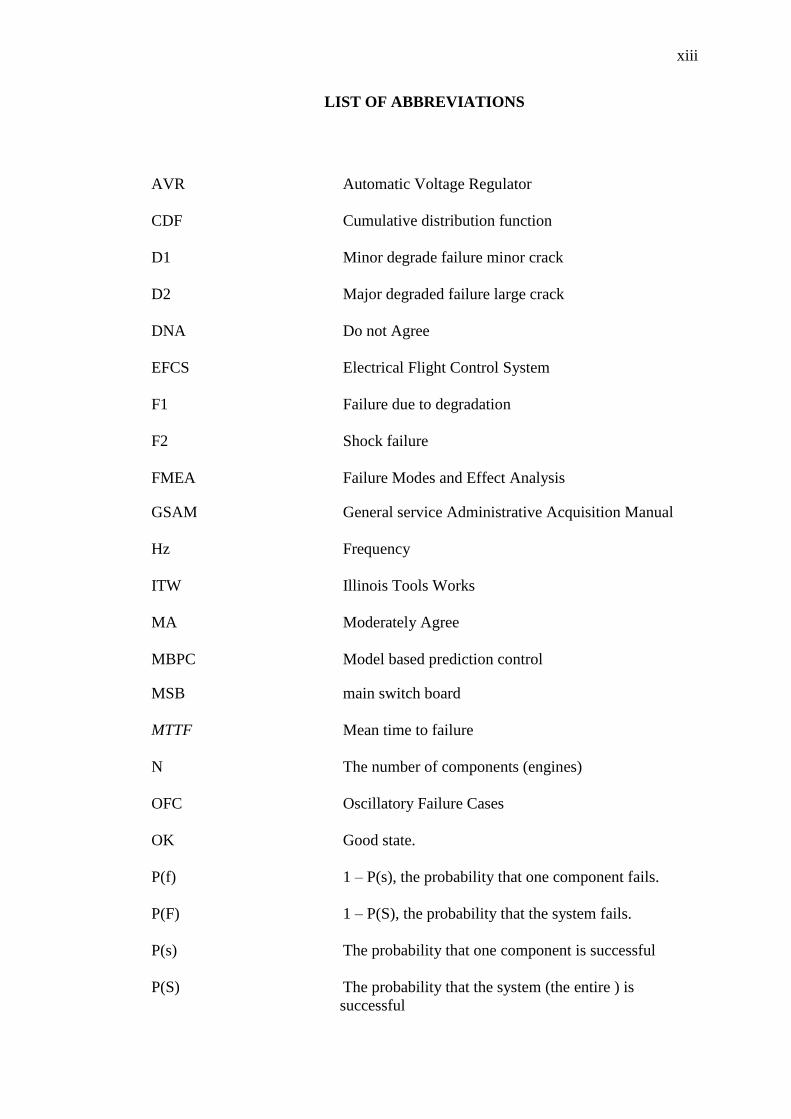
LIST OF ABBREVIATIONS
AVR Automatic Voltage Regulator
CDF Cumulative distribution function
D1 Minor degrade failure minor crack
D2 Major degraded failure large crack
DNA Do not Agree
EFCS Electrical Flight Control System
F1 Failure due to degradation
F2 Shock failure
FMEA Failure Modes and Effect Analysis
GSAM General service Administrative Acquisition Manual
Hz Frequency
ITW Illinois Tools Works
MA Moderately Agree
MBPC Model based prediction control
MSB main switch board
MTTF Mean time to failure
N The number of components (engines)
OFC Oscillatory Failure Cases
OK Good state.
P(f) 1 – P(s), the probability that one component fails.
P(F) 1 – P(S), the probability that the system fails.
P(s) The probability that one component is successful
P(S) The probability that the system (the entire ) is
successful

xiv
xiv
P1 Site Preparation
P2 Prime Mover and Alternator installation
P3 Cabling works
P4 Instrumentation and accessories installation
P5 Interface and integration
P6 Testing and commissioning
PDF Probability density function
PMS Power Management System
R(t) The probabilistic reliability function, R(t).
SA Strongly Agree
SPSS Statistical Package for Social Science
TTF Time to Fail
UIC Ultrasonic Inspection car
VSA Very strongly agree
z(t) The probabilistic failure rate function z(t).

xv
xv
LIST OF APPENDICES
APPENDIX TITLE PAGE
APPENDIX A Table for determining a sample for a given population 72
APPENDIX B Survey Questionnaire 73
APPENDIX C Survey Respondent Result 80
APPENDIX D Respondent Result for Level of Agreement 97

1
1
CHAPTER 1
INTRODUCTION
1.1 Background
This thesis reports a study to develop a failure model for the installation of
electrical and instrumentation system for power generation onboard ship. Ensuring
the successful installation for electrical and instrumentation for power generation
system onboard ships has been of great concern to ship owners as it is crucial to the
safe operation of the vessels. Installation of electrical and instrumentation for power
generation system onboard vessel is not without risk and each risk may lead to
undesirable consequences on the vessel‘s operation, maintenance and commercial
performance. Research on detailed installation process and the associated level of
risk needs further attention to minimize the risk of failure. Risk associated with the
installation process need to be studied and identified in ensuring successful
implementation of electrical and instrumentation installation of power generation on
board ship. Premature failure of electrical and instrumentation system during ship
operation is a major concern.
Poor workmanship during installation could result in fatal failure to the power
system onboard ship. For example failure of wiring could cause damage to other ship
system and ignited flammable material within the close proximity and could result in
the loss of life and property.

1
1
CHAPTER 1
INTRODUCTION
1.1 Background
This thesis reports a study to develop a failure model for the installation of
electrical and instrumentation system for power generation onboard ship. Ensuring
the successful installation for electrical and instrumentation for power generation
system onboard ships has been of great concern to ship owners as it is crucial to the
safe operation of the vessels. Installation of electrical and instrumentation for power
generation system onboard vessel is not without risk and each risk may lead to
undesirable consequences on the vessel‘s operation, maintenance and commercial
performance. Research on detailed installation process and the associated level of
risk needs further attention to minimize the risk of failure. Risk associated with the
installation process need to be studied and identified in ensuring successful
implementation of electrical and instrumentation installation of power generation on
board ship. Premature failure of electrical and instrumentation system during ship
operation is a major concern.
Poor workmanship during installation could result in fatal failure to the power
system onboard ship. For example failure of wiring could cause damage to other ship
system and ignited flammable material within the close proximity and could result in
the loss of life and property.

2
2
Therefore research on risk and failure for electrical and instrumentation
installation process during installation process will have significant impact for ship
operation. It plays as an important starting point towards maintain a system with
minimum risk. It also allows installation-related risks to be closely observed and
monitored during system installation.
It is a normal practice, yet optional, for engineering practitioners in industry
to use Failure Modes and Effect Analysis (FMEA) to address risk. FMEA (Teoh et
al., 2004) is quality improvement and risk assessment tool commonly used in
industry. FMEA captures design and process failure information. Additionally,
model based prediction control (MBPC) have been proposed by Clarke et al. (1987)
Camacho et al. (1995) and Hansen (2000). MBPC is claimed as able to control risk
of failure by further improving the resistant to faults, safety, reliability and durability
of all machinery components, as well as to decrease overall operational costs. Risk
model for electrical and instrumentation installation of power generation system is to
prove similar objectives based as MBPC.
Investigative effort on risk associated with electrical and instrumentation
installation process has not been the focus of system manufacturer, supplier, shipyard
or even ship owner. This research is also a guide to study, capture risk data related to
installation process for electrical, and instrumentation installation of power
generation system onboard ship. A failure model should be developed to show which
of the installation subprocesses are likely to contribute to total system failure.
1.2 Problem statement
System failure during the installation of electrical and instrumentation (E&I)
installation for power generation onboard ship is to be avoided as it can directly
cause delay to ship construction and financial implication. System failure during ship
operation originating from installation problems could lead to similar effects.
Therefore, risk elements associated with the installation of electrical and
instrumentation installation for power generation needs to be identified and the
individual risk level recognised.
3
3
A failure model showing the process of installing electrical and
instrumentation system for power generation onboard ship detailed with risks level
and their interrelationship will assist installation and supervision engineers on site.
Supervision focus can be directed to critical stages of the installation process so that
risk can be minimized and system failure can be avoided.
1.3 Objectives of study
The objectives of the research is to develop a risk model for electrical and
instrumentation installation of power generation system onboard ship that identifies
the related risk elements such as component damage, malfunction, and premature and
total system failure, describes the statistical correlation between risk elements and
indicates critical sub processes and path of possible system failure.
1.4 Scope of study
The scope of this research covers installation process starting from the
generator being brought to site for actual installation until the completion of system
integration process between the prime mover and alternator (generator) and main
switch board (MSB) for electrical power distribution. Risk data covers risk type and
risk level for each of the subprocesses of installing electrical and instrumentation for
power generation system onboard ship.
The methodology of developing the failure model is based on failure models
developed by others but there have been needs to adapt and combine the various
models into one unified system model. Model presentation is using the waterfall
model that illustrated using Boehm‘s waterfall model.
The failure model described by a flow chart also intends to differentiate the
steps and process during the installation of electrical and instrumentation for power
generation system onboard ship.

4
4
1.5 Significance of study
The failure model and its protocol include six main steps:
i. Site preparation – foundation of the prime mover and
alternator
ii. Prime mover and alternator placement onto the bedplate and
foundation
iii. Cabling works includes the termination of cables to each
individual system and field devices.
iv. Instrumentation and accessories, fixing of the pressure sensors,
temperature sensors input, gauges, salinometer, input and
output controllers.
v. Interface and integration of electrical and mechanical system
to the control system
vi. Testing and commissioning of the power generation system
for power distribution.
The model developed is a tool to identify the risk and failure categories that
is fundamental to various electrical and mechanical equipment installation processes.
This generic risk model for electrical and instrumentation installation for power
generation system onboard ship, is suitable to be applied to other machineries
installation process. As such the research finding will become a useful tool to
confirm the risk model for electrical and instrumentation installation of power
generation system onboard ship. Young engineers can use the failure model as a tool
for supervising and monitoring the installation process of the power generation
system and guide them to be efficient in managing the project. The research will
have significance impact to the engineers during installation process, preventive
measure, cause, consequences and recovery.
5
5
1.6 Research framework
The research approach is based upon established failure modeling concepts,
for which risk elements are identified to help eliminate and rectify inference
elements to avoid fatal failure of installation. Thus, model-driven techniques
enriched with known problems based on literature, experience and expert advised
representation are the important ingredients. In depth analysis has been injected for
the identification, interpretation and adaptation of the proposed model.
The installation failure model has been developed with reference to existing
concepts used for various industries and applications such as the waterfall concept,
spiral model concept, v-model and dual-v model. The model developed has not been
limited to one but rather the combination of various failure modeling concepts
suitable for electrical and instrumentation for power generation onboard ship.
The research adopts the failure modeling approach used by Cushing et al,
(1993) and as below:
i. Identifying potential failure during installation process mechanisms
(chemical, electrical, physical, mechanical, structural or thermal processes
leading to failure); failure sites; and failure modes.
ii. Identifying the appropriate failure model and their input parameters,
including those associated with material characteristics, damage
properties, relevant geometry at failure sites, manufacturing flaws and
defects, and environmental and operating loads.
Building up the model has been based on published information, and also
experience and expert advice captured using survey questionnaire. It is the
instrument and tools to identify the risk element and critical point during the
installation process that can post a major risk to the system. Due consideration has
been given to failure analysis done by previous researchers some of which are based
on experiment or lab test, especially for electrical component or equipment. Majority

6
6
of these failure models are the reliability failure model, aging failure model,
maintenance and operation of the equipment and instrumentation for electrical
system. Almost none has been developed to study the failure model for the
installation of electrical and instrumentation installation of power generation system
onboard ship. Lab test and experiment as the common practice to study the reliability
of the equipment for electrical and instrumentation system is not the approach
selected. Observation for the characteristic and reliability of the equipment based on
the experiment set criteria defined for the test. The result and model shown from the
experiment by Banerjee & Cheung (1997) is an excellent resemblance of what has
been developed.
1.7 Thesis Structure
This thesis consists of six chapters and followed by references and
appendices. Chapter 1 explains the overview of this research that outlines the
objective, the problem statement, scope of the study and significance of study.
Chapter 2 discusses the relevant literature pertaining to failure model. Chapter 3
describes the methodology and tools to develop the failure model. Chapter 4 outlines
the result and report based the study, experience and expert advice. Chapter 5 and
Chapter 6 each discusses and concludes the study on failure model developed for
electrical and instrumentation installation for power generation onboard ship. The
appendices contain some terminology, detail about the survey questionnaire and
reports.
69
69
REFERENCES
Aalen, O., (1995), Phase Type Distributions in Survival Analysis, Scandinavian
Journal of Statistic, Vol. 22, pp. 447-463.
Abu, M.S, and Tasir, Z, (2001), Pengenalan Kepada Analisis Data Berkomputer
SPSS 10.0, Venton Publishing, Kuala Lumpur.
Ådnanes, A.K, (2003), Maritime Electrical Installations and Diesel Electric
Propulsion, Tutorial Report, ABB AS Marine.
Banerjee, K. and Cheung, N, (1997), High-Current Failure Model for VLSI
Interconnects Under Short-Pulse Stress Conditions, IEEE ELECTRON
DEVICE LETTERS, Vol. 18, No. 9, September.
Ben-Haim, Y, (2005), .Lecture Notes on Probabilistic Failure Model, Faculty of
Mechanical Engineering, Israel Institute of Mechanical Engineering.
Bukowski, J. V, Rouvroye, J. and Goble, M. W, (2002), Social Research Theory,
Methods and Techniques,
Camacho, E.F., and Bordons, C., (1995), Model Predictive Control in the Process
Industry, Springer-Verlag.
Centurion Generic Power system Incorporation, (2008), Centurion Generic Power
system Inc, Part No. 0G8679, Revision C (05/22/08), Catalog No. IM-
ASPCA-S-01, U.S.A
Clarke, D.W., Mohtadi, C., and Tuffs, P.S., (1987), Generalized predictive control -
Part I: The Basic Algorithm, Automatica, 23(2), Page 137-148.

70
70
Cooke, R.M, (1996), The Design of Reliability Data Bases. Part I. Review of
standard design concepts, Reliability Engineering and System Safety, Vol. 51,
No. 2, pp. 137-146,
Crowder, M .J, Kimber, A.C, Smith, R.L, and Sweeting, T.J, (1991), Statistical
Analysis of Reliability Data, Chapman and Hall, London.
Cushing, M. D, Mortin, T. S, and Malhotra, A., (1993), Comparison of Electronics-
Reliability Assessment Approaches, IEEE Transactions on Reliability, Vol.
42, No.4, pp. 542-546.
Elavsky, T, (2007), A Condensed Guide to Automation Control System
Specification, Design and Installation, Part 1: System Identification and
Safety: Automation Direct, www.automationnotebook.com
Five Star Products Inc., (2009), MARINE EPOXY CHOCK High Performance
(Highly Chemical Resistant Epoxy Coating Horizontal Applications) Product
Guide (07/01/09) American Owned & Operated.
Gavrilov, L. A. and Gavril, N. S., (2006), Models of Systems Failure in Aging,
Handbook of Models for Human Aging
Gavrilov, L. A., and Gavrilova, N. S. (2006). Reliability theory of aging and
longevity. Handbook of the Biology of Aging, 6, 3-42.
GSAM (Guideline for Successful acquisition & Management of Software)
Handbook, (2003), Chapter 14.4: System Integration, Testing & Acceptance.
Hansen, J.F., (2000), Modeling and Control of Marine Power Systems, Doctor
Thesis, Norwegian University of Science and Technology, Department of
Engineering cybernetics, Trondheim, Norway.

71
71
Hokstad, P., Langseth, L., Lindqvist, B.H. ogVatn, J., (2005), Failure modeling and
maintenance optimization for a railway line. International Journal of
Performability Engineering 1(1): 51-64,
Icemaster Fischer Panda, (2005), Marine Generator Panda PMS 8 ‗mini‘ E-TEC
120V – 60 Hz, Fischer Panda Installation Manual: Installation, Maintenance,
and Troubleshooting.
Illinois Tool Works (ITW), (2004), Standard Chock Design for Integral Gas
Compressor Engines Bulletin No. 643E, Page 3.
Kling, A. (2009), AP Statistical Lecture, http://arnoldkling.com/apstats/failure.html.,
unpublished.
Knudsen, J.K., and Smith, C.L., (2002), Estimation of System Failure Probability
Uncertainty Including Model Success Criteria, PROCEEDINGS OF THE
6TH INTERNATIONAL CONFERENCE ON PROBABILISTIC SAFETY
ASSESSMENT AND MANAGEMENT (PSAM).
Kohler Power System, (2009), Kohler Power SystemMarine Generator set Operation
and Installation Manual, TP-5592 7/96a, unpublished.
Krejcie, R.V., and Morgan, D.W., (1970), Determining sample size for research
activities, Educ Psychol Meas.
McClave, J.T., Benson, P.G. and Sincich, T., (2001), Statistics for Business and
Economics. , Prentice-Hall, Inc., Upper Saddle River, New Jersey 07458.
Rausand, M. and Høyland, A., (2004), System Reliability Theory - Models,
Statistical Methods.and Applications, 2nd
Edition.
Rigdon, S. E., and Basu, A. P., (2000), Statistical Methods for the Reliability of
Repairable Systems, Wiley, New York

72
72
Siegel, S. and John C.N, (1988), Nonparametric Statistics for the Behavioral
Sciences, Second Edition, McGraw-Hill, United States of America.
Sørensen, A. J., Ådnanes, A. K., Fossen, T. I. and Strand, J. P., (1997), A New
Method of Thruster Control in Positioning of Ships Based on Power Control,
Proceedings of 4th IFAC Conference on Maneuvering and Control of Marine
Craft (MCMC‘97), pp. 172-179, Brijuni, Croatia.
Teoh, P.C., and Case, K., (2004), Modelling and Reasoning for Failure Models and
Effects Analysis Generation, Proc. Instn Mcch. Engrs Vol. 218 part B: J.
Engineering Manufacture, IMcchE.
Wärtsilä, (2006), Wartsila 50DF Project Guide Lib Version: a1416, unpublished.
Zukarnain, Z, (2001), Analisis Data Menggunakan SPSS Windows. Universiti
Teknologi Malaysia, unpublished.