Embed Size (px)
Citation preview
INSTITUTE OF PHYSICS PUBLISHING JOURNAL OF GEOPHYSICS AND ENGINEERING
J. Geophys. Eng. 3 (2006) 356–369 doi:10.1088/1742-2132/3/4/007
A fuzzy logic approach for estimation ofpermeability and rock type fromconventional well log data: an examplefrom the Kangan reservoir in the IranOffshore Gas FieldAli Kadkhodaie Ilkhchi1, Mohammadreza Rezaee1,3 andSeyed Ali Moallemi2
1 School of Geology, University College of Science, University of Tehran, Tehran, Iran2 Research Institute of Petroleum Industry/NIOC, Tehran, Iran
Received 11 May 2006Accepted for publication 10 October 2006Published 6 November 2006Online at stacks.iop.org/JGE/3/356
AbstractPermeability and rock type are the most important rock properties which can be used as inputparameters to build 3D petrophysical models of hydrocarbon reservoirs. These parameters arederived from core samples which may not be available for all boreholes, whereas, almost allboreholes have well log data. In this study, the importance of the fuzzy logic approach forprediction of rock type from well log responses was shown by using an example of the Vp toVs ratio for lithology determination from crisp and fuzzy logic approaches. A fuzzy c-meansclustering technique was used for rock type classification using porosity and permeability data.Then, based on the fuzzy possibility concept, an algorithm was prepared to estimate clusteringderived rock types from well log data. Permeability was modelled and predicted using aTakagi-Sugeno fuzzy inference system. Then a back propagation neural network was appliedto verify fuzzy results for permeability modelling. For this purpose, three wells of the Iranoffshore gas field were chosen for the construction of intelligent models of the reservoir, and aforth well was used as a test well to evaluate the reliability of the models. The results of thisstudy show that fuzzy logic approach was successful for the prediction of permeability androck types in the Iran offshore gas field.
Keywords: rock types, permeability, fuzzy logic, fuzzy c-means clustering, back propagationneural network, Kangan reservoir, Iran offshore gas field
1. Introduction
The Iran offshore gas field, the Iranian part of the world’slargest non-associated gas accumulation is located in thePersian Gulf between Qatar and Iran, some 100 km fromshore. The Upper Permian to Lower Triassic Dalan andKangan Formations are two huge, condensate rich, gas bearingreservoirs over the field. This paper focuses on application of
3 Present address: Curtin University of Technology, Department of PetroleumEngineering, Western Australia 6151, Australia.
the fuzzy logic technique for the estimation of two importantreservoir parameters including permeability and rock type inthe Kangan Formation. So far, several studies have been carriedout for the estimation of reservoir parameters by intelligentsystems (e.g. Cuddy 1998, Saggaf and Nebrija 2003, Changet al 2000, Lim 2003, 2005, Ali and Chawathe 1999, Huanget al 2001, Arpat et al 1998, Wong et al 1997 and Malki et al1996) for rock type and permeability prediction. These studiesindicate the successful role of methods such as fuzzy logic(FL), artificial neural networks (ANN), neuro-fuzzy (NF) and
1742-2132/06/040356+14$30.00 © 2006 Nanjing Institute of Geophysical Prospecting Printed in the UK 356

A fuzzy logic approach for estimation of permeability and rock type
(a)
(b)
Figure 1. The membership functions corresponding to classification of lithology types by V p/V s ratio in crisp logic (a) and fuzzy logic (b)approaches.
Table 1. V p/V s ratio values for different lithologies.
V p/V s Lithology type
1.60–1.70 Clean sand1.70–1.80 Shaly sand1.80–1.90 Limestone1.90–2.00 Dolomite
genetic algorithms (GA) for reservoir characterization. Thepresent study shows another example of using fuzzy logic forreservoir characterization.
Generally, geosciences disciplines are not clear-cut andmost of the time are associated with uncertainties. Forexample, prediction of core parameters from well logresponses is difficult and is usually associated with error.Statistical methods try to minimize and ignore this error,whereas fuzzy logic derives useful information from thiserror and uses it as a powerful parameter for increasing theaccuracy of the predictions. The following simple examplecan clarify the subject: According to the works of Tatham(1982), Domenico (1984), Castagna et al (1985) and Ikwuakor(1988), the ratio of compressional (V p) to shear wave velocity(V s) is a key factor for lithologic identification in hydrocarbonreservoirs. Lithologies such as dolomite, limestone, shaly sandand clean sand can be identified by this ratio (table 1). Themembership functions corresponding to this classification oflithologies in fuzzy and non-fuzzy approaches are shown infigure 1. According to the crisp or non-fuzzy approach (figure1(a)), a rock with a ratio of 1.8 will be classified as limestonewhereas another with a ratio of 1.799 99 will be considered ashaly sand. Such a description is of course far from reality.In the crisp approach there is a clear cut and sharp boundarybetween descriptions, whereas fuzzy logic asserts that there
is a traditional and plastic boundary between the descriptions.For example, according to figure 1(b), a rock with V p/V sratio 1.83 will be classified as shaly sand to a degree of 0.85and as limestone to a degree of 0.10. Note that we shoulddiscriminate between probabilities and possibilities. The sumof probabilities is always equal to 1, whereas such reasoningwill not be usually valid for possibilities. In the above example,the values of membership functions (possibilities) for a V p/V sratio of 1.83 do not add up to 1 (e.g. 0.1 and 0.85). Saggafand Nebrija (2003) have used a good example to clarify thedifference between possibility and probability; consider thisstatement made before two wells are drilled: ‘the possibilitythat the first well is economically viable is 0.8, whereas, theprobability that the second well is economically viable is 0.8.’Although the two numbers are the same, they describe differentnotions. The probability indicates that the likelihood of thiswell being economically viable is 0.8. There is an 80% chanceof finding oil in sufficient quantities in this well. However,there is a chance that the well could very well turn out to bea dry hole. The possibility does not relate to likelihood orchance at all. It simply expresses the information that the wellfits our definition of what we consider to be an economicallyviable well by 0.8. This well is going to be better than averagein what we consider good wells, it is not going to be great,but neither is it going to be a dry hole. In fact, after thewells are drilled, the probability would either be 0 (in casethe second well does not have oil in economic quantities) or1 (otherwise). However, the possibility would remain thesame.
As it is evident from these simple examples, fuzzyreasoning is very close to reality and the description of thefacts as they are. Therefore, it will be appropriate to use fuzzylogic to solve problems that are accompanied by vagueness
357

A Kadkhodaie Ilkhchi et al
(a) (b)
(c) (d )
(e) (f )
Figure 2. Crossplots showing the relationship between permeability and conventional well log data including NPHI (a), DT (b), RHOB (c),GR (d), Rlld (e) and Depth (f ).
and imperfection such as those of predicting core parametersfrom conventional well log responses.
2. Methodology
2.1. Fuzzy inference system
Fuzzy inference is the process of formulating from a giveninput to an output using fuzzy logic (Matlab user’s guide2001). There are two types of fuzzy inference systems (FIS)including Mamdani and Assilian (1975) and Takagi-Sugeno(1985). Mamdani’s method attempts to control a system bysynthesizing a set of linguistic control rules obtained fromexperienced human operators. The Takagi-Sugeno methodis similar to the Mamdani’s FIS. The output membershipfunctions are the main difference between Mamdani andTakagi-Sugeno methods. In Takagi-Sugeno-type FIS (Matlabuser’s guide 2001), output membership functions are constantor linear, and membership functions are defined by a clusteringprocess. A small cluster radius usually yields many smallclusters; however, a large cluster radius yields a few largeclusters in the data (Chiu 1994). Each of these clusters
refers to a membership function. Each membership functiongenerates a set of fuzzy if–then rules for formulating inputs tooutputs.
2.2. Fuzzy c-means clustering
Fuzzy c-means (FCM) is a data clustering technique whereeach data point belongs to multiple clusters to some degree thatis specified by a membership grade. This technique was firstintroduced by Dunn (1973) and improved by Bezdek (1981).It provides a method that shows how to group data points thatpopulate some multidimensional space into a specific numberof different clusters. FCM is based on minimization of thefollowing objective function (Ozer 2005):
n∑k=1
c∑i=1
(uik)m(‖xk − vi‖)2, (1)
where n is the number of objects to be clustered, c is thenumber of clusters, uik is the degree of membership of objectk in cluster i, xk is a vector of h characteristics for object k, vi
is a vector of the cluster means of the h characteristics for
358
A fuzzy logic approach for estimation of permeability and rock type
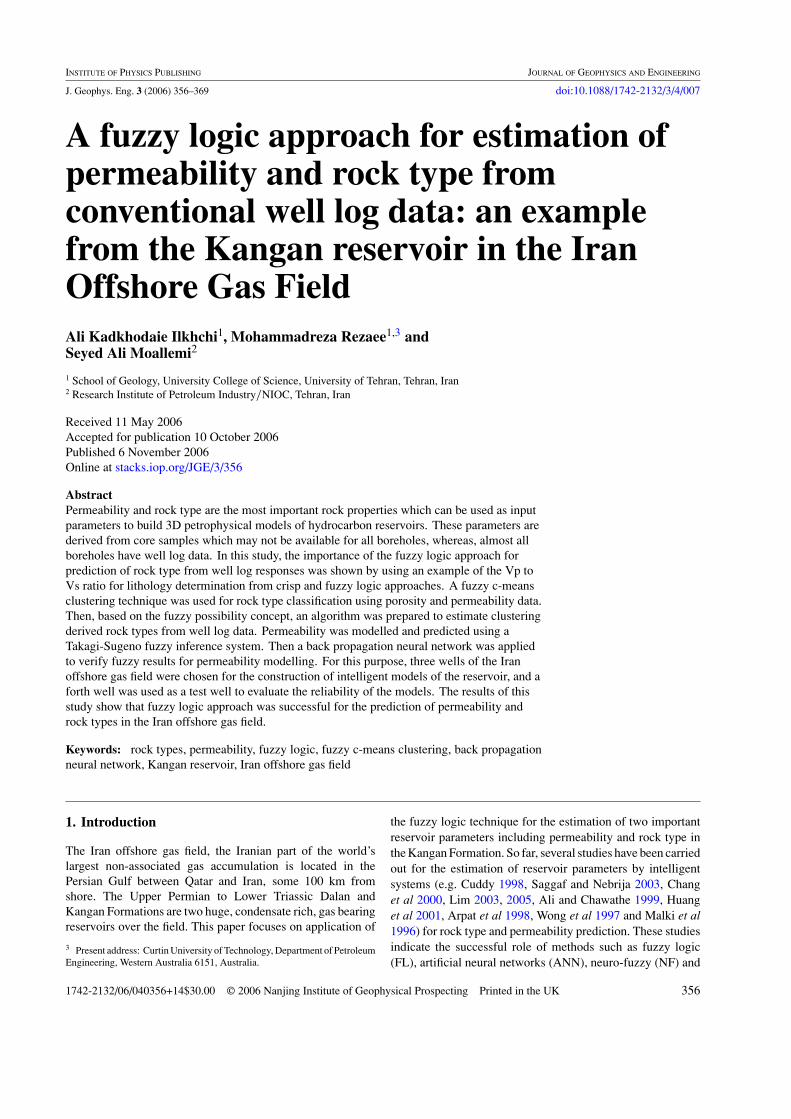
Figure 3. The NPHI, DT, RHOB, GR and Rlld membership functions for permeability modelling using TS-FIS.
cluster i and m is the weighting exponent varying in the range[1, ∞]. Equation (1) represents the sum of squared errors andis a goal function that the FCM algorithm tries to minimize.The constraints are as follows:
0 � uik � 1, ∀i, k, (2)(c∑
i=1
uik = 1
), ∀k. (3)
Condition (2) ensures that the degrees of memberships arebetween 0 and 1, and condition (3) means that, for a givenindividual, the degrees of membership across the clusters sumto one. Fuzzy partitioning is carried out through an iterativeoptimization of equation (1), with the update of membershipuik and the cluster centres vj by:
vi =∑n
k=1 (uik)mxk∑n
k=1 (uik)m, ∀i (4)
uik = 1∑cj=1
( ‖xk−vi‖2/(m−1)
‖xk−vj ‖2/(m−1)
) , (5)
for xi �= vj , ∀i, k, and m > 1.
The iteration will stop when maxik
{∣∣u(t+1)ik − u
(t)ik
∣∣} < ε,where ε is error level for termination which varies between0 and 1, and t are the iteration steps. In detail, this iterativeprocedure converges to a local minimum of equation (1).
3. Permeability modelling
3.1. Fuzzy logic
In this study, a Takagi-Sugeno FIS was used to generatepermeability models for the Kangan Formation. First, severalcrossplots showing the relationship between well log data andpermeability were generated for well A (figures 2(a)–(f )).The crossplots shows that neutron (NPHI), sonic (DT), anddensity log (RHOB) data have the strongest relationship withpermeability.
Five inputs including NPHI, DT, RHOB, GR, and deeplaterolog resistivity (Rlld) logs were used as inputs. Thereis a logical relationship between the selected inputs andpermeability. NPHI, DT, and RHOB logs are porosity logs.According to figure 2, generally, permeability in the KanganFormation increases as porosity increases. A GR log is ameasure of the natural radioactivity of a formation and is usedto distinguish between clean and shaly reservoir. Normally,clean intervals with low GR show higher permeability thanshaly intervals. The electrical resistivity of a formationdepends on many parameters including fluid saturation andpore geometry. Pore geometry is a key element that controlspermeability.
When input data were selected, they were divided into twogroups including modelling data (1076 data points) from threewells (A, B and C) and test data (125 data points) from the forthwell (D). All membership functions and their parameters wereextracted by a subtractive clustering method. By specifying0.65 for the clustering radius, three Gaussian-type membership
359

A Kadkhodaie Ilkhchi et al
Figure 3. (Continued.)
functions were extracted for used inputs which were captionedby low, moderate, and high (figures 3(a)–(e)). The if-then rulesgenerated are as below:
1. If (NPHI is low) and (DT is low) and (RHOB is high) and(GR is low) and (Rlld is low) then (permeability (K) islow).
2. If (NPHI is moderate) and (DT is moderate) and (RHOBis moderate) and (GR is moderate) and (Rlld is moderate)then (permeability (K) is moderate).
3. If (NPHI is high) and (DT is high) and (RHOB is low)and (GR is high) and (Rlld is high) then (permeability (K)is high).
By extraction of membership functions and fuzzy if-thenrules, the Takagi-Sugeno fuzzy model was constructed. Theperformance of the model was measured as 0.0019 by usingthe mean squared error (MSE) function. The formulationbetween input well log data and permeability is shown in
figure 4. After preparation of the fuzzy models, the followingsteps were implemented for the prediction of permeability inthe forth well of the field by using FIS (the test well D):
Step 1. Fuzzify inputs: The FIS takes the inputs anddetermines the degree to which the inputs belong toeach membership function.
Step 2. Apply fuzzy operator and truncation method: For thecase that the antecedent of a given rule has more thanone part, the fuzzy operator is applied to obtain onerule that represents the result of the antecedent forthat rule. The most common operators are shown asfollows:‘and’ = use the minimum of the options. ‘or’ = usethe maximum of the options. ‘not’ = use 1- option.Applying the fuzzy operators gives a value tothe antecedent of each rule, and then the outputmembership function is truncated by this value. Inthis study ‘and’ operator has been used.
360

A fuzzy logic approach for estimation of permeability and rock type
Figure 4. Formulation between well log data (inputs) topermeability (output) using the TS-FIS.
Step 3. Apply aggregation method: In this step, outputs ofeach rule that fit into a fuzzy set are combined into asingle fuzzy set.
Step 4. Defuzzify: The input for the defuzzification processis the results of the aggregation method. ThenFIS uses a defuzzification method (in this study, aweighted average) for the resulting output which isa crisp numerical value. Figure 5 shows an exampleof processing steps to use TS-FIS for permeabilitymodelling from used well log inputs. Measured MSEfor predicted permeability in the test well D is 0.15.
Figure 5. The processing steps required to use TS-FIS for permeability modelling from used well log inputs.
Figure 6. Crossplot showing correlation coefficient betweenmeasured and FL predicted permeability in test well D.
Figure 6 shows the correlation coefficient betweenmeasured and FL predicted permeability in the test well D.A comparison of measured and predicted permeability versusdepth is shown in figure 7.
3.2. Back propagation neural network
A back propagation artificial neural network (BP-ANN) isa supervised training technique that sends the input valuesforward through the network and then computes the differencebetween the calculated output and the corresponding desired
361
A Kadkhodaie Ilkhchi et al
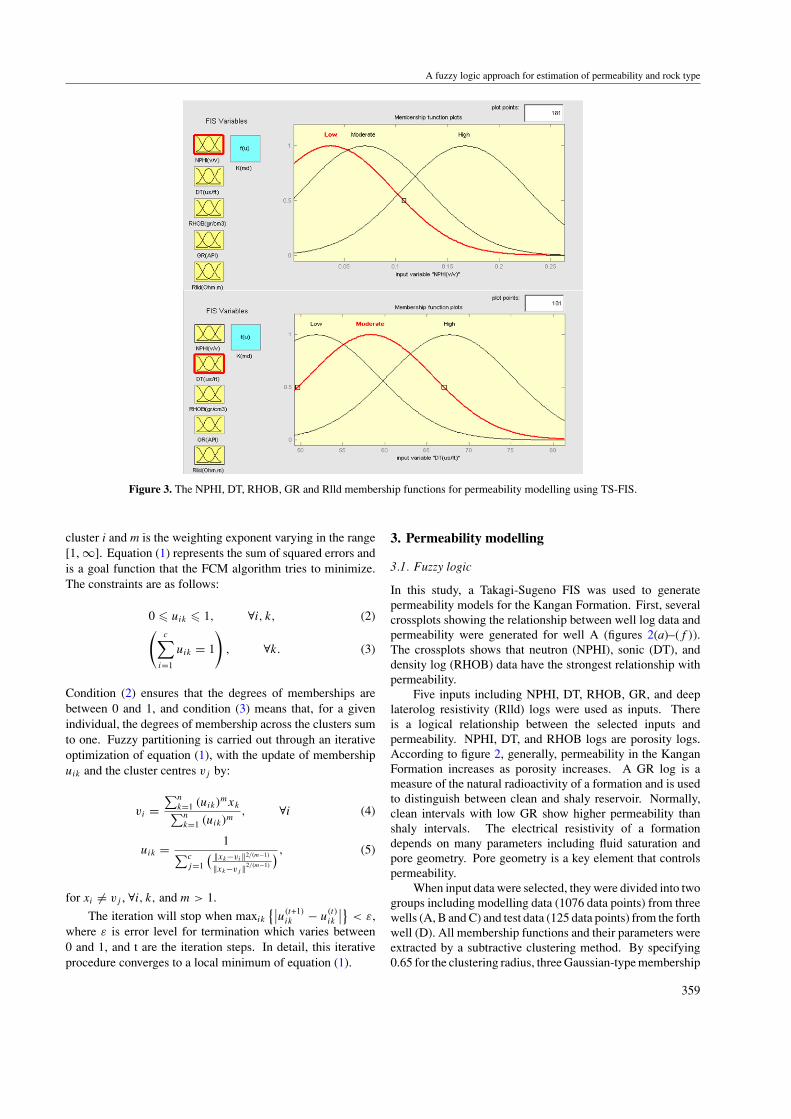
Figure 7. A comparison of measured and FL predicted permeability versus depth.
Figure 8. The schematic diagram of ANN for permeability modelling (output) using well log data inputs.
output from the training dataset. This error is then propagatedbackward through the net and the weights are adjusted duringa number of iterations. The training stops when the calculatedoutput values best approximate the desired values (Bhatt andHelle 1999). In this research, a three layered BP-ANNwas used to verify the validity of generated fuzzy modelsfor permeability prediction. The data set was divided intothree groups including training (785 data points), validationdata (150 data points) and test data (168 data points) fromthree wells. The forth well D was used to evaluate thegeneralization capability of the ANN model. Similar toTakagi-Sugeno FIS, five inputs including NPHI, DT, RHOB,GR, and Rlld logs were used in the first layer. The numberof neurons in the hidden layer was 3, and output layerincluded one neuron for permeability data. The schematicdiagram of the BP-ANN we used is shown in figure 8. Thementioned three layered neural network was trained usingthe Levenberg-Marquardet training algorithm (trainlm), thedetails of computation process and training for which canbe found in Boadu (1997, 1998) and Bishop (1995). Thedefault MSE performance function was applied to optimizeweights and default bias values. The transfer function
Figure 9. Graph of mean squared error (MSE) versus trainingepochs for training (blue/solid), validation (green/dotted) and testdata (red/dashed).
362

A fuzzy logic approach for estimation of permeability and rock type
Figure 10. Crossplot showing correlation coefficient betweenmeasured and ANN predicted permeability in the test well D.
from layer one to two is LOGSIG and from layer two tolayer three is PURELIN. After 12 epochs of training MSEperformance function was set to 0.0021 (figure 9). Whenthe training and optimization of the model was finished, theinput well log data of the test well D was passed from it andpermeability was calculated. According to figures 10 and 11,the permeability predicted values for the test well withcorrelation coefficient of 0.76 are similar to results of FL,so ANN verifies its reliability. The measured MSE of thepredicted values is 0.17.
Figure 11. A comparison of measured and ANN predicted permeability versus depth.
4. Rock types classification
Carbonate reservoir characterization has commonly haddifficulty in relating dynamic reservoir properties to ageologically consistent rock type classification system.Traditional approaches that use log and core data have not beensuccessful for rock type definition (Boitnott et al 2006). Inthe Schlumberger Oilfield Glossary, each rock type is definedbased on a set of characteristics that several rocks have incommon. The characteristics of interest are usually thosepertaining to fluid movement and fluid storage capacity. Thissection shows a case study of rock type classification using aFCM clustering technique in the Kangan carbonate reservoir.The methodology is described as below:
First, input porosity and permeability data (a matrix of1076 by 2) was passed from the following function of Matlab,
[center, U, obj f cn] = fcm (data, cluster n)
where data (input matrix of porosity and permeability),cluster n (number of cluster to be derived) and fcm (Matlab’sfuzzy c-means clustering algorithm) are input arguments ofthe function. The output arguments are center (matrix offinal cluster centres), U (membership function matrix) andobj fcn (values of the objective function during iterations). Byspecifying arbitrary values for cluster n, clusters were derivedfor the reservoir studied. Then each cluster was deemed as aunique rock type of the reservoir. In this study from five totwenty rock types were generated for the Kangan Formation.However, in order to accomplish rock typing in an applicableway, the case of specifying ten rock types was selected forfurther study. The porosity–permeability crossplots of the tenmentioned rock types are shown in figure 12. In the FCMapproach rock typing, facies type is not considered and eachrock type will be defined by its production capability andwill have a set of characteristics for porosity and permeabilityparameters which include minimum, maximum, mean and
363

A Kadkhodaie Ilkhchi et al
Figure 12. Porosity–permeability crossplot of ten rock types derived by the FCM clustering method.
standard deviation. Also, they do not overlap each other inporosity–permeability crossplots so that each one has a uniqueboundary. Table 2 shows the description of the mentionedrock types based on porosity and permeability parameters.For each rock type, a photomicrograph with its porosity andpermeability parameters is shown.
5. Rock type estimation using fuzzy logic
In this section, the FCM clustering derived rock types wereestimated from well log data using fuzzy logic. For thispurpose, the distribution of well log data for the identifiedrock types was first investigated. According to figure 13,which shows an example of the distribution of neutron logvalues for the rock types derived in previous stage, the datasets have been fitted by a Gaussian function. The normaldistribution of data by a Gaussian function is as below:
P(x, σ, c) = e−(x−c)2/σ 2
σ√
2π(6)
where f (x, σ, c) is the probability function that an observationx is measured in the data set by a mean c and standard deviationσ . This curve was used to estimate relative probability or‘fuzzy possibility’ that a data value belongs to each rock type.
The methodology described here is similar to Cuddy’sapproach (1998) for lithofacies estimation using fuzzymathematics.
Each log data value may belong to any FCM clusteringderived rock type to a degree that can be calculated from aGaussian membership function using equation (6). Each rocktype has its own mean and standard deviation, namely, for nnumber of rock types; there are n pairs of c and σ rock type.
For example, the fuzzy possibility that a neutron log databelongs to rock type 1 is obtained by substituting crock type 1
and σrock type 1 in equation (6):
P(NPHI) = exp(−(NPHI − Crock type 1)2/(σrock type 1)
2)
(σrock type 1)√
2π. (7)
The ratio of the fuzzy possibility for each rock type withthe fuzzy possibility of the mean or most likely observation isobtained by de-normalizing equation (7). The fuzzy possibilityfor mean of neutron in rock type 1 is obtained by substitutingNPHI by crock type 1 in equation (7):
P(crock type 1)= exp(−(Crock type 1 − Crock type 1)2/(σrock type 1)
2)
(σrock type 1)√
2π
= 1
(σrock type 1)√
2π. (8)
The relative fuzzy possibility R(NPHIrock type1) of a neutronporosity NPHI belonging to rock type 1 compared to the fuzzypossibility of measuring the mean value crock type 1 is equation(7) divided by equation (8):
R(NPHIrock type 1)
= exp((−(NPHI − Crock type 1)2/(σrock type 1)
2). (9)
Each value derived from equation (9) is now indicated topossible rock types. To compare the relative fuzzy possibilitiesof this equation between rock types, equation (9) is multipliedby a coefficient named relative occurrence of each rock typein the reservoir interval. For rock type 1, it is noted as√
nrock type 1:
F(NPHIrock type 1) = (√
nrock type 1)
× exp(−(NPHI − Crock type 1)2/(σrock type 1)
2). (10)
364

A fuzzy logic approach for estimation of permeability and rock type
Table 2. Description of 10 rock types derived by the FCM clustering method based on porosity and permeability parameters. In thisapproach facies type is not important, whereas production capability based on porosity and permeability is.
The obtained fuzzy possibility from equation (10) is based
on neutron log data only. This process should be repeated
for other logs such as sonic (DT), density (RHOB), . . . at
this point. This will give F(DTrock type1), F(RHOBrock type1),
. . . for rock type 1. These fuzzy possibilities are combined
harmonically to give a final fuzzy possibility:
1
Crock type 1= 1
F(NPHIrock type 1)+
1
F(DTrock type 1)
+1
F(RHOBrock type 1)+ · · · (11)
365

A Kadkhodaie Ilkhchi et al
Table 2. (Continued.)
This process is repeated for other rock types and all derived
fuzzy possibilities are combined harmonically. Then, the rock
type with the highest combined fuzzy possibility is taken as the
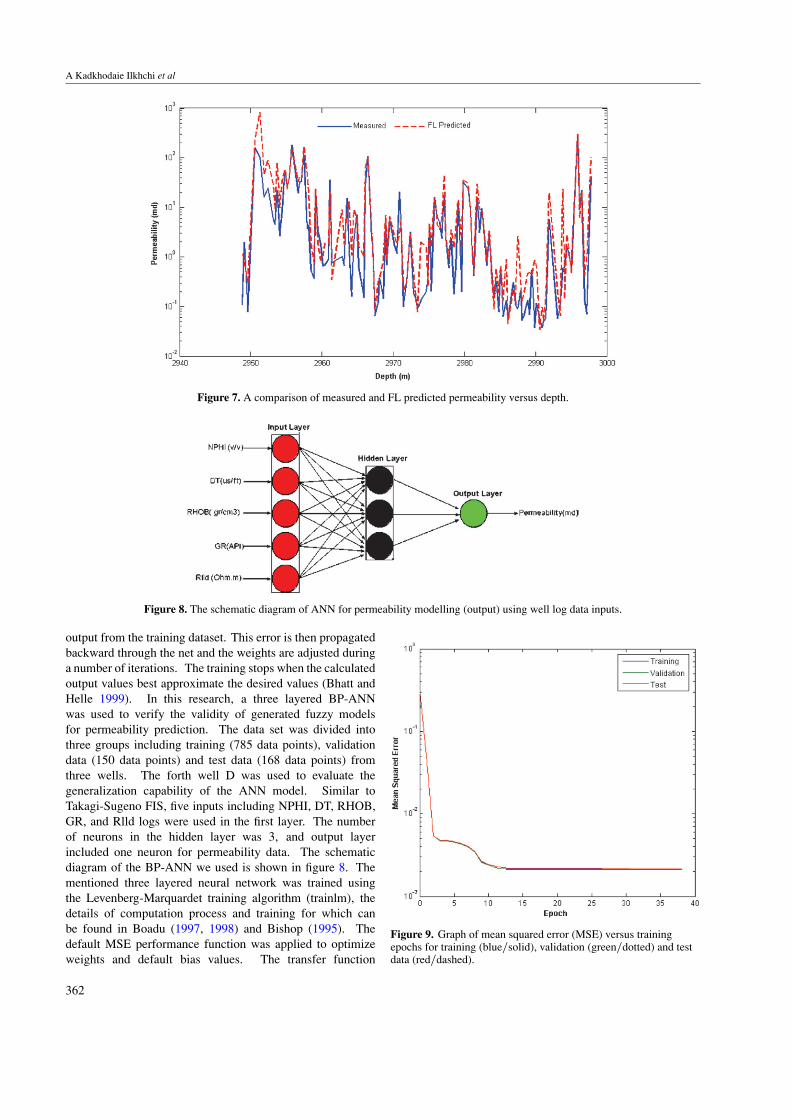
most possible rock type at that point. A comparison between
FCM clustering derived and fuzzy predicted rock types versus
depth for the test well that was not used to model construction(the test well D) is shown in figure 14.
The fuzzy possibilities in fuzzy logic are combinedharmonically, whereas, statistical methods such as Bayestheorem, combine probabilities geometrically. When
366

A fuzzy logic approach for estimation of permeability and rock type
(a) (b)
(c) (d )
(e) (f )
(g) (h)
(i ) ( j )
Figure 13. Histograms showing the fitted Gaussian membership function to neutron log values distribution of the rock types generated byFCM clustering method.
comparing rock types that are equally likely, with similarprobabilities, the harmonic combination emphasizes anyindicator which suggests the lithology selection is unlikely.
Secondly, fuzzy logic weights the possibilities by the squareroot of the proportion in the calibrating data set, whereas Bayesuses the direct proportion (Cuddy 1998).
367
A Kadkhodaie Ilkhchi et al
Figure 14. A comparison between clustering derived and fuzzy predicted rock types versus depth for the test well D.
6. Conclusions
The results of this study show that the fuzzy logic techniqueis an instrumental tool for the prediction of permeability andthe identification of permeable and non-permeable zones inthe Kangan Formation. A fuzzy c-means clustering methodwas useful for rock type definition in Kangan Formation. Inthis approach, production capability based on porosity andpermeability parameters was considered to classify rock typesso that each rock type has a specific boundary in porosity–permeability cross plots and does not overlap with another.Finally, the algorithm based on the fuzzy possibility conceptwas successful for the estimation of clustering derived rocktypes from well log data.
7. Recommendations
With regard to obtaining satisfying results when using fuzzylogic in this case study, the following is recommended:
(a) In order to identifying rock types to show flowperformance in reservoir, it will be useful to use clusteringmethods for reservoir study and modelling. Such adescription of rock types will lead to ease relating welllog responses to each rock type.
(b) With regard to high accuracy estimation of rock types formwell log data using fuzzy reasoning, it is recommendedto use fuzzy logic as a powerful tool for modelling andestimation of rock types over the reservoir.
368

A fuzzy logic approach for estimation of permeability and rock type
Acknowledgments
The authors appreciate reservoir geology department ofResearch Institute of Petroleum Industry (RIPI) of Iran forsponsoring, data preparation and permission to publish thispaper.
References
Ali M and Chawathe A 1999 Using artificial intelligence to predictpermeability from petrographic data J. Comput. Geosci.26 915–26
Arpat G B, Gumrah F and Yeten B 1998 The neighborhoodapproach to prediction of permeability from wireline logs andlimited core plug analysis data using backpropagation artificialneural networks J. Pet. Sci. Eng. 20 1–8
Bezdek J C 1981 Pattern Recognition with Fuzzy ObjectiveFunction Algorithms (New York: Plenum)
Bhatt A and Helle H B 1999 Porosity, permeability and TOCprediction from well logs using a neural network approach 61ST EAGE, Conf. (Helsinki, Finland) pp 1–4
Bishop C M 1995 Neural Networks for Pattern Recognition(Oxford: Clarendon) p 670
Boadu F K 1997 Rock properties and seismic attenuation: neuralnetwork analysis Pure Appl. Geophys. 149 507–24
Boadu F K 1998 Inversion of fracture density from field seismicvelocities using artificial neural networksGeophysica 63 534–45
Boitnott G N, Lauten W T, Jones D H, Clerke E A and Funk J J 2006Pore space inversions for petrophysical rock type identification:application to a large carbonate reservoir GEO 2006 MiddleEast Conference and Exhibition Technical Program
Castagna J P, Batzle M L and Eastwood R L 1985 Relationshipsbetween compressional-wave and shear-wave velocities inelastic silicate rocks Geophysics 50 571–81
Chang H C, Kopaska-Merkel D C, Chen H C and Durrans S R 2000Lithofacies identification using multiple adaptive resonancetheory neural networks and group decision expert systemJ. Comput. Geosci. 26 591–601
Chiu S 1994 Fuzzy model identification based on cluster estimationJ. Intell. Fuzzy Syst. 2 267–78
Cuddy S J 1998 Litho-facies and permeability prediction fromelectrical logs using fuzzy logic 8th Abu Dhabi InternationalPetroleum Exhibition and Conference SPE 49470
Domenico S N 1984 Rock lithology and porosity determinationfrom shear and compressional wave velocity Geophysics49 1188–95
Dunn J C 1973 A Fuzzy relative of the ISODATA process and itsuse in detecting compact well-separated clusters J. Cybern.3 32–57
Hoen Lee S and Gupta A D 1999 Electrofacies characterization andpermeability predictions in carbonate reservoirs: Role ofmultivariate analysis and nonparametric regression AnnualTechnical Conference and Exhibition in Houston (Texas, 3–6October) SPE 56658
Huang Y, Gedeon T D and Wong P M 2001 An integratedneural-fuzzy-genetic-algorithm using hyper-surfacemembership functions to predict permeability in petroleumreservoirs J. Eng. Appl. Artif. Intell. 14 15–21
Ikwuakor K C 1988 Vp/Vs revisited: pitfalls and new interpretationtechniques World Oil (September), pp 41–46
Lim J S 2003 Reservoir permeability determination using artificialneural network J. Korean Soc. Geosyst. Eng. 40 232–8
Lim J S 2005 Reservoir properties determination using fuzzy logicand neural networks from well data in offshore Korea J. Pet.Sci. Eng. 49 182–92
Malki H A, Baldwin J L and Kwari M A 1996 Estimatingpermeability by use of neural networks in thinly bedded shalygas sands SPE Comput. Appl. 8 58–62 (April)
Mamdani E H and Assilian S 1975 An experimental in linguisticsynthesis with a fuzzy logic control Int. J. Man-Mach. Stud. 71–13
Matlab user’s Guide 2001 Fuzzy logic toolbox, Matlab CD-ROMMathworks, Inc
Ozer M 2005 Fuzzy c-means clustering and Internet portals: a casestudy Eur. J. Oper. Res. 164 696–714
Saggaf M M and Nebrija Ed L 2003 A fuzzy approach for theestimation of facies from wireline logs AAPG Bull. 87 1233–40
Sugeno M 1985 Industrial Applications of Fuzzy Control(Amsterdam: Elsevier)
Takagi T and Sugeno M 1985 Identification of systems and itsapplication to modeling and control. Institute of electrical andelectronics engineers transactions on systems Man Cybemetics15 116–32
Tatham R H 1982 Vp/Vs and lithology Geophysics 47 336–44Wong P M, Henderson D J and Brooks L J 1997 Reservoir
permeability determination from well log data using artificialneural networks: an example from the Ravva field, offshoreIndia Proc. SPE Asia Pacific Oil and Gas Conference (KualaLumpur, Malaysia, 14–16 April) SPE 38034
369