Embed Size (px)
Citation preview
IAHR Int. Meeting of WG on Cavitation and Dynamic Problems in Hydraulic Machinery and Systems Barcelona, 28-30 June 2006
1
METHODOLOGY FOR RISK ASSESSMENT OF PART LOAD
RESONANCE IN FRANCIS TURBINE POWER PLANT
C. NICOLET1, J.-J. HEROU2, B. GREIVELDINGER1, P. ALLENBACH3, J.-J. SIMOND3, F. AVELLAN1
1EPFL – Ecole polytechnique fédérale de Lausanne,
Laboratory for Hydraulic Machines
[email protected] 2EDF – Electricité de France, Centre d’Ingénierie
Hydraulique
3EPFL – Ecole polytechnique fédérale de Lausanne,
Laboratory of Electrical Machines
ABSTRACT At low flow rate operation, Francis turbines feature a cavitating vortex rope in the draft tube
resulting from the swirling flow of the runner outlet. The unsteady pressure field related to the
precession of the vortex rope induces plane wave propagating in the entire hydraulic system.
The frequency of the vortex rope precession being comprised between 0.2 and 0.4 times the
turbine rotational speed, there is a risk of resonance between the hydraulic circuit, the
synchronous machine and the turbine itself an acting as excitation source. This paper presents
a systematic methodology for the assessment of the resonance risk for a given Francis turbine
power plant. The test case investigated is a 1GW 4 Francis turbines power plant. The
methodology is based on a transient simulation of the dynamic behavior of the whole power
plant considering a 1D model of the hydraulic installation, comprising gallery, surge chamber,
penstock, Francis turbine but also mechanical masses, synchronous machines, transformer,
grid model, speed and voltage regulators. A stochastic excitation having energy uniformly
distributed in the frequency range of interest is taken into account in the draft tube. As the
vortex rope volume has a strong influence on the natural frequencies of the hydraulic system,
the wave speed in the draft tube is considered as a parameter for the investigation. The
transient simulation points out the key excitation frequencies and the draft tube wave speed
producing resonance between the vortex rope excitation and the circuit and provide a good
evaluation of the impact on power quality. The comparison with scale model tests results allows
resonance risk assessment in the early stage of project pre-study.
C. Nicolet et al. / Cavitation and Dynamic Problems in Hydraulic Machinery and Systems 2006
2
INTRODUCTION Nowadays hydroelectric power plants are increasingly subject to off-design operation in order to
follow the demand. In this context, Francis turbine power plants operating at part load may
present instabilities in terms of pressure, discharge, rotational speed and torque. These
phenomena are strongly linked to the flow structure at the runner outlet inducing a vortex core
precession in the draft tube. This leads to hydrodynamic instabilities (Jacob, [5]). The decrease
of the tailrace pressure level makes the vortex core visible as a gaseous vortex rope. The
volume of the gaseous vortex rope is dependent of the cavitation number ! and affects the
parameters characterizing the hydro-acoustic behavior of the entire power plant. As a result,
natural frequencies of the hydraulic system decrease with the cavitation number (Tadel [16]). In
addition, for a given cavitation number !, the volume of the vortex rope changes with the
discharge rate (Jacob, [5]), thus the natural frequencies are also dependent on the turbine
discharge, i.e. the operating point. Therefore, the risk of an interaction between the excitation
sources such as vortex rope precession and the natural frequencies resulting in resonance
effects, called draft tube surge, is dependant on the cavitation number, but also on the operating
point. Such resonance may result in unacceptable pressure pulsation or electrical power swing,
(Rheingans [13], Tadel [16]).
In order to assess resonance risks on prototypes, pressure fluctuation measurements field are
carried out during scale model tests to identify experimentally the pressure excitations sources
and the vortex rope compliance [2]. Then, the pressure fluctuations due to non uniform pressure
field at the runner outlet [9], [10], can be decomposed in two parts as proposed by Angelico [1];
(1) a rotating part, due to vortex rotation, and (2) a synchronous pulsating part resulting from the
spatial perturbation of the rotating part. The pressure excitation source related to the
synchronous pulsating part can be extracted using the procedure described by Dcrfler, [2]. It is
then possible to deduce the resulting mechanical torque pulsation in the frequency domain,
using an appropriate one dimensional model of the full hydraulic system based on impedance
method, including the model of the vortex rope and the turbine itself, [3], [16], [4]. However,
obtaining the induced electrical power pulsations, requires to include the linearized model of the
synchronous machine, the voltage regulator, transformer, etc, which is very challenging.
This paper presents a methodology using a time domain simulation for the determination of the
part load resonance risk and its impact on the electrical power pulsations of a Francis turbine
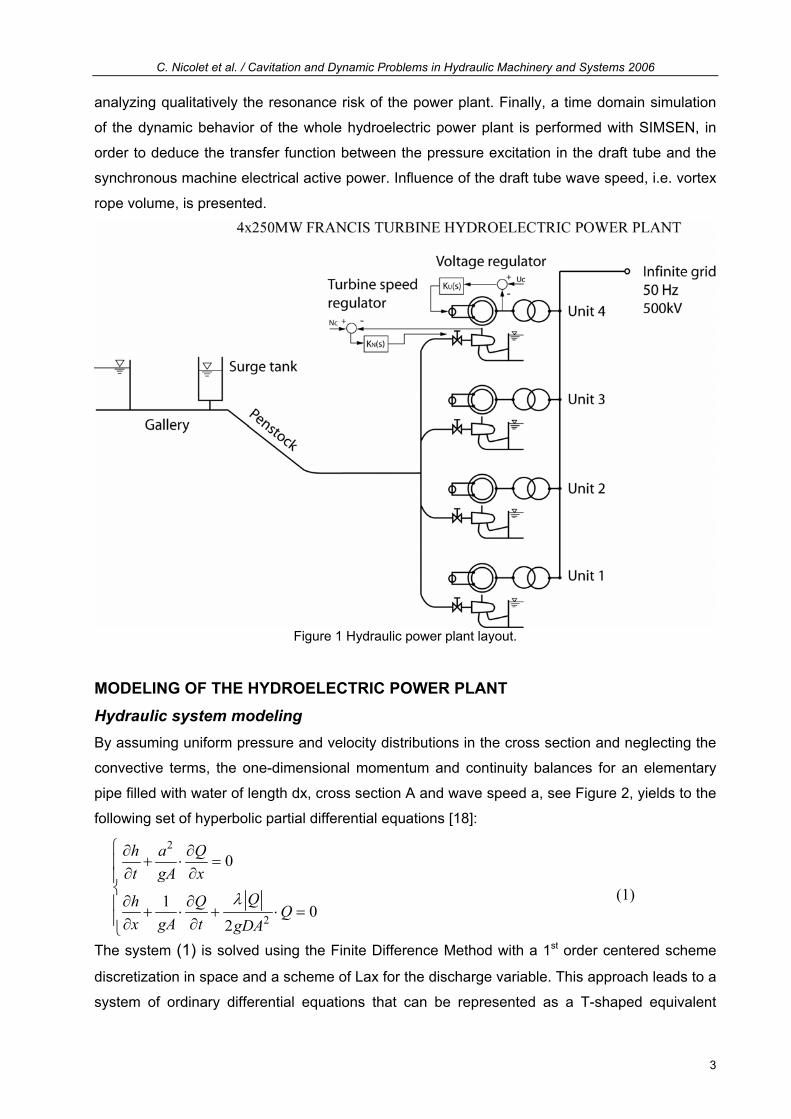
power plant. Therefore, the case of an hydroelectric power plant with 4x250MW Francis turbine
is investigated, see Figure 1. First, the numerical model based on an electrical equivalent is
presented. The model of the draft tube, taking into account the vortex rope volume and the
pressure excitation source is described. Then a simplified model of the piping is derived for
C. Nicolet et al. / Cavitation and Dynamic Problems in Hydraulic Machinery and Systems 2006
3
analyzing qualitatively the resonance risk of the power plant. Finally, a time domain simulation
of the dynamic behavior of the whole hydroelectric power plant is performed with SIMSEN, in
order to deduce the transfer function between the pressure excitation in the draft tube and the
synchronous machine electrical active power. Influence of the draft tube wave speed, i.e. vortex
rope volume, is presented.
Figure 1 Hydraulic power plant layout.
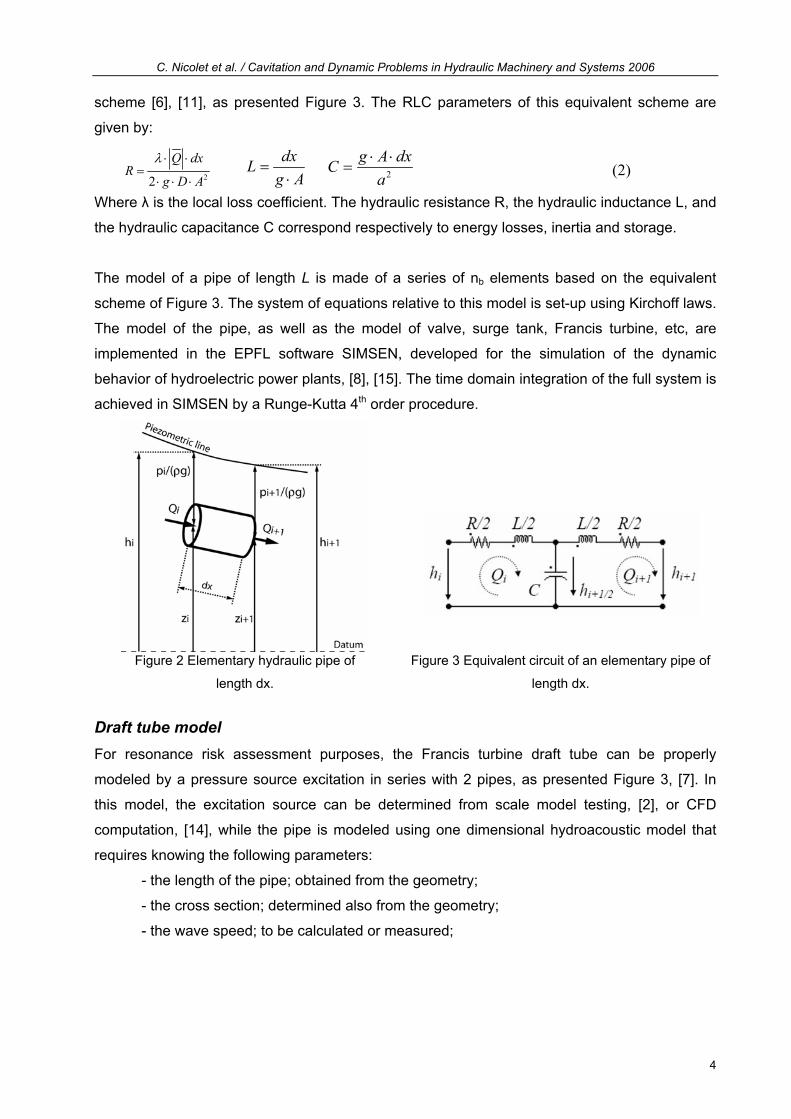
MODELING OF THE HYDROELECTRIC POWER PLANT Hydraulic system modeling By assuming uniform pressure and velocity distributions in the cross section and neglecting the
convective terms, the one-dimensional momentum and continuity balances for an elementary
pipe filled with water of length dx, cross section A and wave speed a, see Figure 2, yields to the
following set of hyperbolic partial differential equations [18]:
2
2
0
1 02
h a Qt gA x
Qh Q Qx gA t gDA
!
"# #$ % &'
# #'(# #' $ % $ % &'# #)
(1)
The system (1) is solved using the Finite Difference Method with a 1st order centered scheme
discretization in space and a scheme of Lax for the discharge variable. This approach leads to a
system of ordinary differential equations that can be represented as a T-shaped equivalent
C. Nicolet et al. / Cavitation and Dynamic Problems in Hydraulic Machinery and Systems 2006
4
scheme [6], [11], as presented Figure 3. The RLC parameters of this equivalent scheme are
given by:
22
Q dxR
g D A
! % %&
% % %
dxLg A
&% 2
g A dxCa% %
& (2)
Where " is the local loss coefficient. The hydraulic resistance R, the hydraulic inductance L, and
the hydraulic capacitance C correspond respectively to energy losses, inertia and storage.
The model of a pipe of length L is made of a series of nb elements based on the equivalent
scheme of Figure 3. The system of equations relative to this model is set-up using Kirchoff laws.
The model of the pipe, as well as the model of valve, surge tank, Francis turbine, etc, are
implemented in the EPFL software SIMSEN, developed for the simulation of the dynamic
behavior of hydroelectric power plants, [8], [15]. The time domain integration of the full system is
achieved in SIMSEN by a Runge-Kutta 4th order procedure.
Figure 2 Elementary hydraulic pipe of
length dx.
Figure 3 Equivalent circuit of an elementary pipe of
length dx.
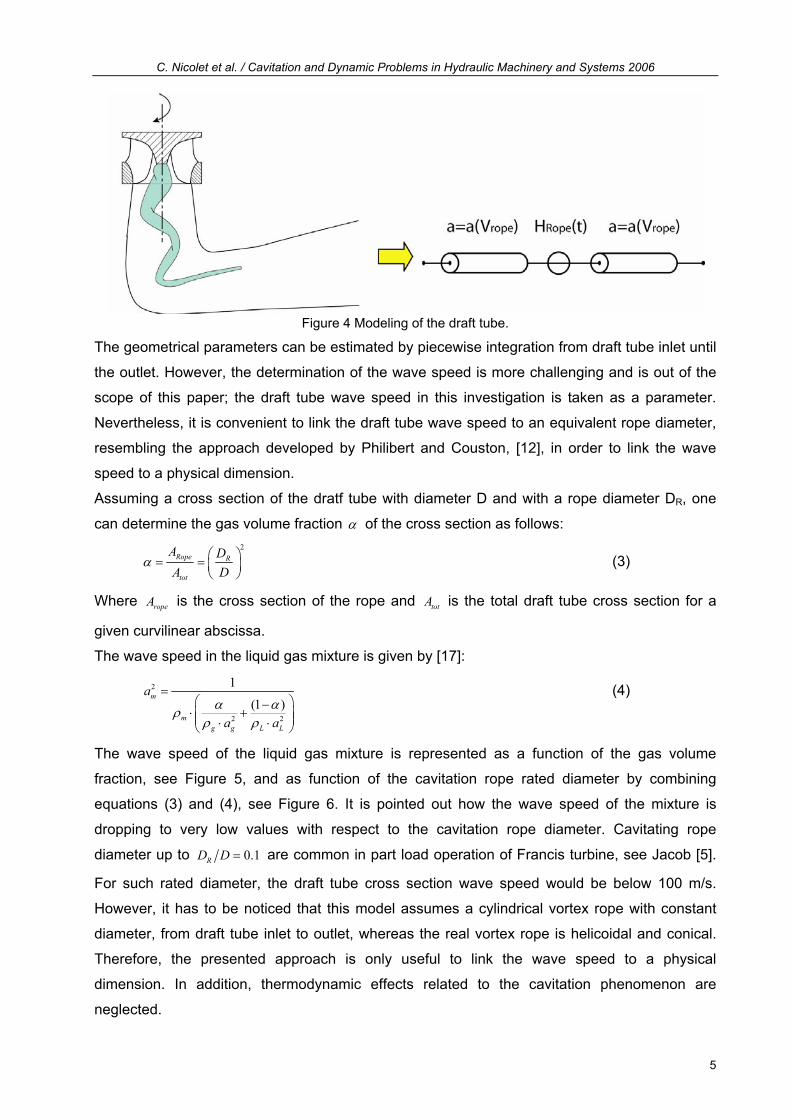
Draft tube model For resonance risk assessment purposes, the Francis turbine draft tube can be properly
modeled by a pressure source excitation in series with 2 pipes, as presented Figure 3, [7]. In
this model, the excitation source can be determined from scale model testing, [2], or CFD
computation, [14], while the pipe is modeled using one dimensional hydroacoustic model that
requires knowing the following parameters:
- the length of the pipe; obtained from the geometry;
- the cross section; determined also from the geometry;
- the wave speed; to be calculated or measured;
C. Nicolet et al. / Cavitation and Dynamic Problems in Hydraulic Machinery and Systems 2006
5
Figure 4 Modeling of the draft tube.
The geometrical parameters can be estimated by piecewise integration from draft tube inlet until
the outlet. However, the determination of the wave speed is more challenging and is out of the
scope of this paper; the draft tube wave speed in this investigation is taken as a parameter.
Nevertheless, it is convenient to link the draft tube wave speed to an equivalent rope diameter,
resembling the approach developed by Philibert and Couston, [12], in order to link the wave
speed to a physical dimension.
Assuming a cross section of the dratf tube with diameter D and with a rope diameter DR, one
can determine the gas volume fraction * of the cross section as follows:
2
Rope R
tot
A DA D
* + ,& & - ./ 0
(3)
Where ropeA is the cross section of the rope and totA is the total draft tube cross section for a
given curvilinear abscissa.
The wave speed in the liquid gas mixture is given by [17]:
2
2 2
1
(1 )m
mg g L L
a
a a* *1
1 1
&+ ,2% $- .- .% %/ 0
(4)
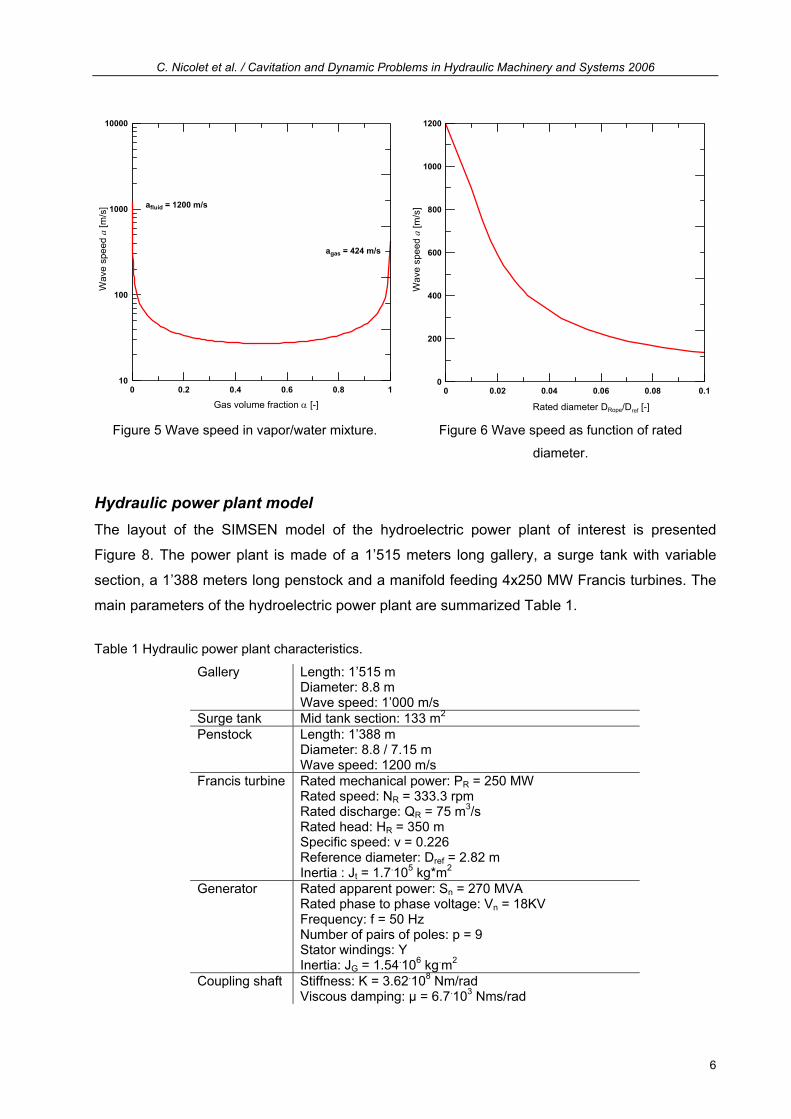
The wave speed of the liquid gas mixture is represented as a function of the gas volume
fraction, see Figure 5, and as function of the cavitation rope rated diameter by combining
equations (3) and (4), see Figure 6. It is pointed out how the wave speed of the mixture is
dropping to very low values with respect to the cavitation rope diameter. Cavitating rope
diameter up to 0.1RD D & are common in part load operation of Francis turbine, see Jacob [5].
For such rated diameter, the draft tube cross section wave speed would be below 100 m/s.
However, it has to be noticed that this model assumes a cylindrical vortex rope with constant
diameter, from draft tube inlet to outlet, whereas the real vortex rope is helicoidal and conical.
Therefore, the presented approach is only useful to link the wave speed to a physical
dimension. In addition, thermodynamic effects related to the cavitation phenomenon are
neglected.
C. Nicolet et al. / Cavitation and Dynamic Problems in Hydraulic Machinery and Systems 2006
6
0 0.2 0.4 0.6 0.8 110
100
1000
10000
Gas volume fraction * [-]
Wav
e sp
eed
a [m
/s] afluid = 1200 m/s
agas = 424 m/s
0 0.02 0.04 0.06 0.08 0.1
0
200
400
600
800
1000
1200
Rated diameter DRope/Dref [-]W
ave
spee
d a
[m/s
]
Figure 5 Wave speed in vapor/water mixture. Figure 6 Wave speed as function of rated
diameter.
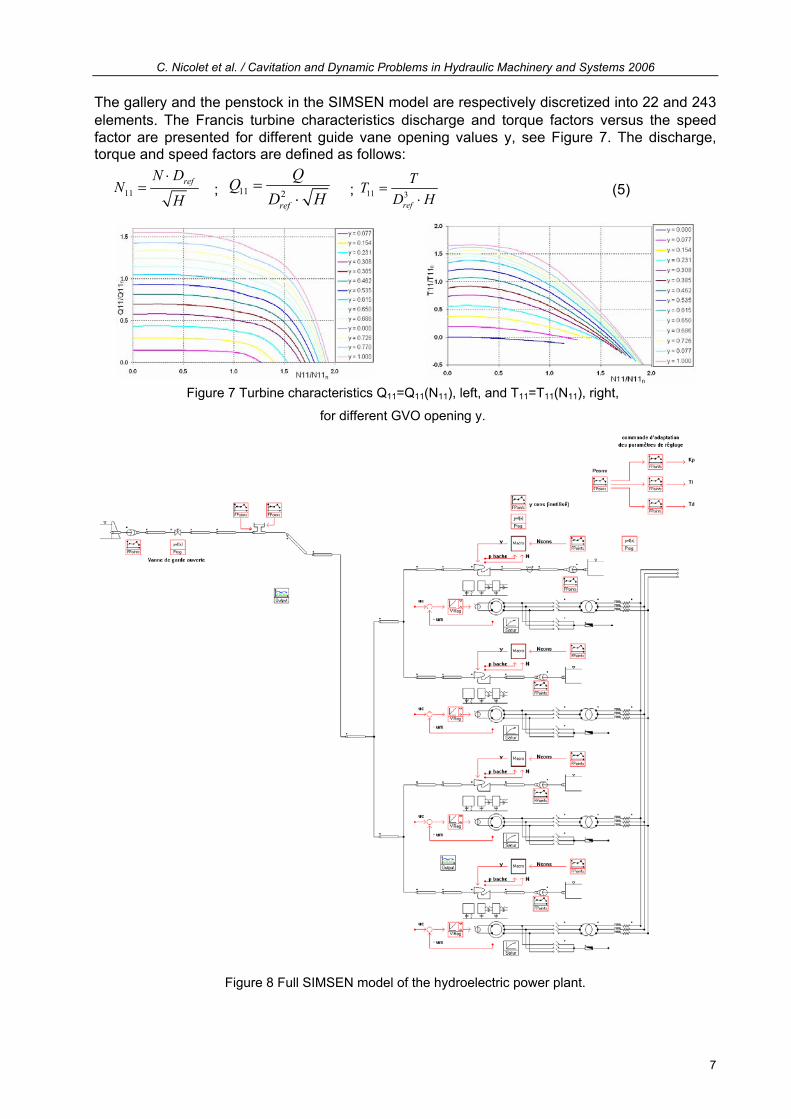
Hydraulic power plant model The layout of the SIMSEN model of the hydroelectric power plant of interest is presented
Figure 8. The power plant is made of a 1’515 meters long gallery, a surge tank with variable
section, a 1’388 meters long penstock and a manifold feeding 4x250 MW Francis turbines. The
main parameters of the hydroelectric power plant are summarized Table 1.
Table 1 Hydraulic power plant characteristics.
Gallery Length: 1’515 m Diameter: 8.8 m Wave speed: 1’000 m/s
Surge tank Mid tank section: 133 m2 Penstock Length: 1’388 m
Diameter: 8.8 / 7.15 m Wave speed: 1200 m/s
Francis turbine Rated mechanical power: PR = 250 MW Rated speed: NR = 333.3 rpm Rated discharge: QR = 75 m3/s Rated head: HR = 350 m Specific speed: # = 0.226 Reference diameter: Dref = 2.82 m Inertia : Jt = 1.7.105 kgjm2
Generator Rated apparent power: Sn = 270 MVA Rated phase to phase voltage: Vn = 18KV Frequency: f = 50 Hz Number of pairs of poles: p = 9 Stator windings: Y Inertia: JG = 1.54.106 kg.m2
Coupling shaft Stiffness: K = 3.62.108 Nm/rad Viscous damping: m = 6.7.103 Nms/rad
C. Nicolet et al. / Cavitation and Dynamic Problems in Hydraulic Machinery and Systems 2006
7
The gallery and the penstock in the SIMSEN model are respectively discretized into 22 and 243 elements. The Francis turbine characteristics discharge and torque factors versus the speed factor are presented for different guide vane opening values y, see Figure 7. The discharge, torque and speed factors are defined as follows:
11refN D
NH
%& ; 11 2
ref
QQD H
&%
; 11 3ref
TTD H
&%
(5)
Figure 7 Turbine characteristics Q11=Q11(N11), left, and T11=T11(N11), right,
for different GVO opening y.
Figure 8 Full SIMSEN model of the hydroelectric power plant.
C. Nicolet et al. / Cavitation and Dynamic Problems in Hydraulic Machinery and Systems 2006
8
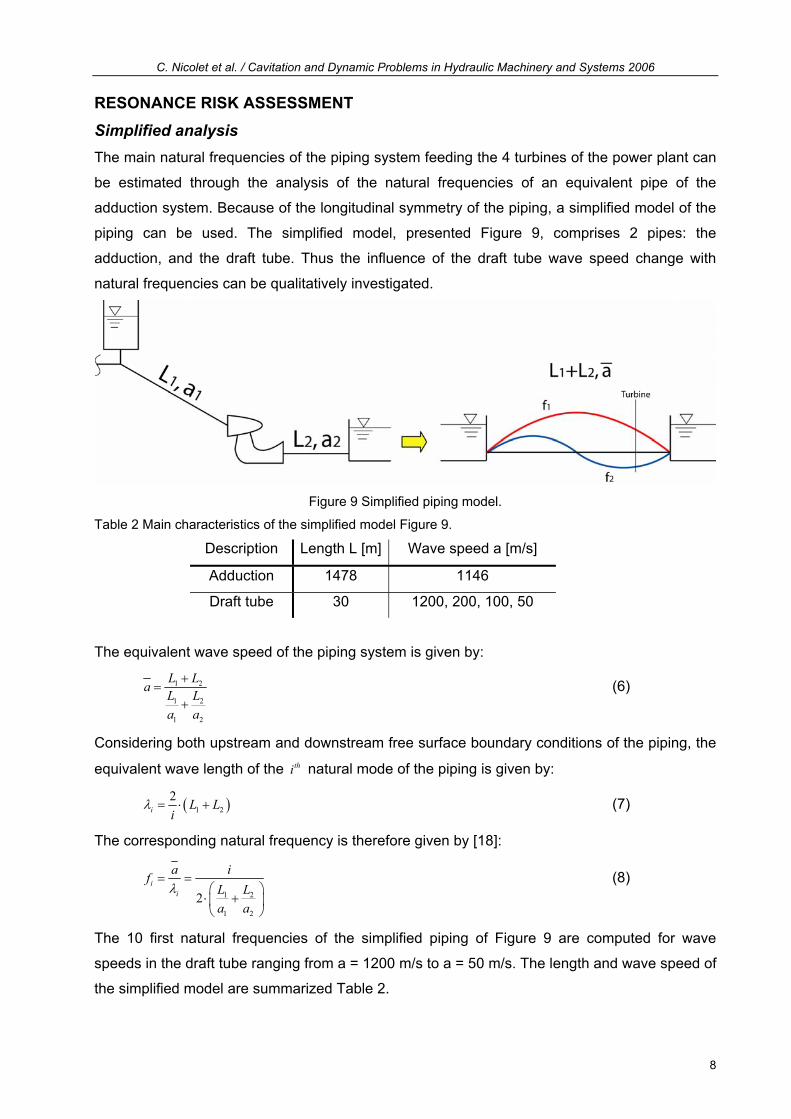
RESONANCE RISK ASSESSMENT Simplified analysis The main natural frequencies of the piping system feeding the 4 turbines of the power plant can
be estimated through the analysis of the natural frequencies of an equivalent pipe of the
adduction system. Because of the longitudinal symmetry of the piping, a simplified model of the
piping can be used. The simplified model, presented Figure 9, comprises 2 pipes: the
adduction, and the draft tube. Thus the influence of the draft tube wave speed change with
natural frequencies can be qualitatively investigated.
Figure 9 Simplified piping model.
Table 2 Main characteristics of the simplified model Figure 9.
Description Length L [m] Wave speed a [m/s]
Adduction 1478 1146
Draft tube 30 1200, 200, 100, 50
The equivalent wave speed of the piping system is given by:
1 2
1 2
1 2
L LaL La a
$&
$ (6)
Considering both upstream and downstream free surface boundary conditions of the piping, the
equivalent wave length of the thi natural mode of the piping is given by:
3 41 22
i L Li
! & % $ (7)
The corresponding natural frequency is therefore given by [18]:
1 2
1 2
2i
i
a ifL La a
!& &
+ ,% $- ./ 0
(8)
The 10 first natural frequencies of the simplified piping of Figure 9 are computed for wave
speeds in the draft tube ranging from a = 1200 m/s to a = 50 m/s. The length and wave speed of
the simplified model are summarized Table 2.
C. Nicolet et al. / Cavitation and Dynamic Problems in Hydraulic Machinery and Systems 2006
9
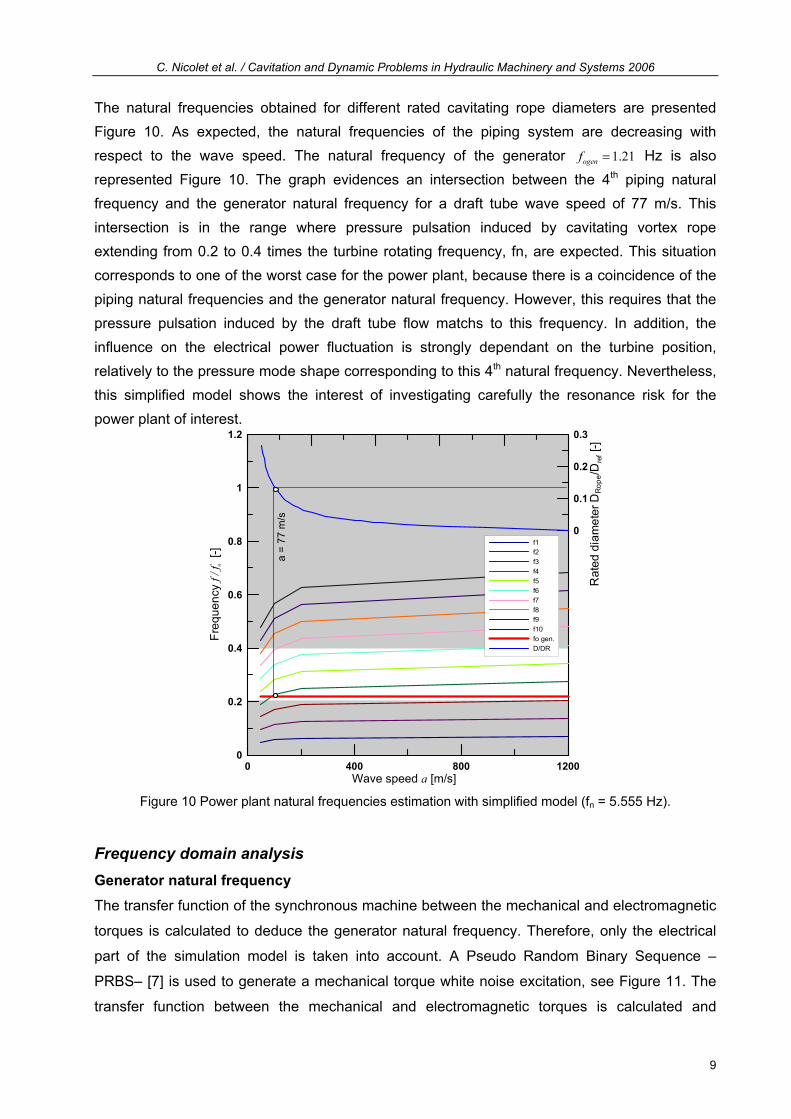
The natural frequencies obtained for different rated cavitating rope diameters are presented Figure 10. As expected, the natural frequencies of the piping system are decreasing with respect to the wave speed. The natural frequency of the generator 1.21ogenf & Hz is also represented Figure 10. The graph evidences an intersection between the 4th piping natural frequency and the generator natural frequency for a draft tube wave speed of 77 m/s. This intersection is in the range where pressure pulsation induced by cavitating vortex rope extending from 0.2 to 0.4 times the turbine rotating frequency, fn, are expected. This situation corresponds to one of the worst case for the power plant, because there is a coincidence of the piping natural frequencies and the generator natural frequency. However, this requires that the pressure pulsation induced by the draft tube flow matchs to this frequency. In addition, the influence on the electrical power fluctuation is strongly dependant on the turbine position, relatively to the pressure mode shape corresponding to this 4th natural frequency. Nevertheless, this simplified model shows the interest of investigating carefully the resonance risk for the power plant of interest.
0 400 800 1200Wave speed a [m/s]
0
0.2
0.4
0.6
0.8
1
1.2
Freq
uenc
y f /
f n [
-]
0
0.1
0.2
0.3
Rat
ed d
iam
eter
DR
ope/D
ref [
-]
f1f2f3f4f5f6f7f8f9f10fo gen.D/DR
a =
77 m
/s
Figure 10 Power plant natural frequencies estimation with simplified model (fn = 5.555 Hz).
Frequency domain analysis Generator natural frequency The transfer function of the synchronous machine between the mechanical and electromagnetic
torques is calculated to deduce the generator natural frequency. Therefore, only the electrical
part of the simulation model is taken into account. A Pseudo Random Binary Sequence –
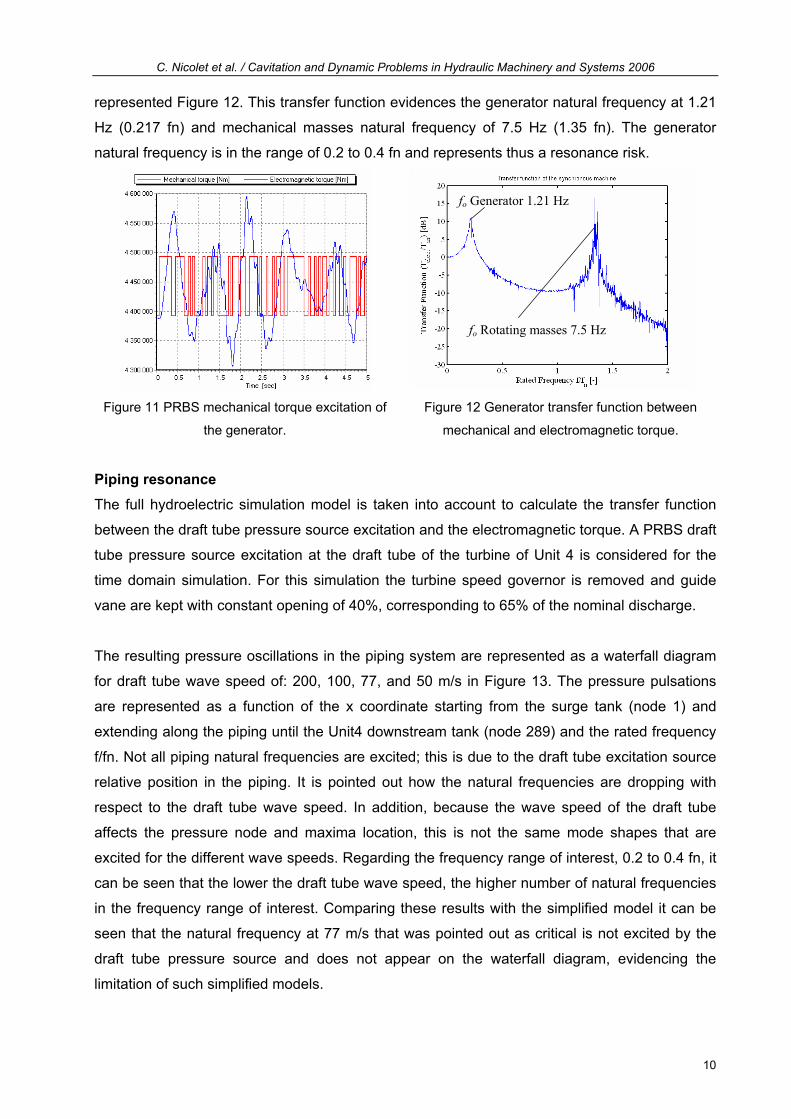
PRBS– [7] is used to generate a mechanical torque white noise excitation, see Figure 11. The
transfer function between the mechanical and electromagnetic torques is calculated and
C. Nicolet et al. / Cavitation and Dynamic Problems in Hydraulic Machinery and Systems 2006
10
represented Figure 12. This transfer function evidences the generator natural frequency at 1.21
Hz (0.217 fn) and mechanical masses natural frequency of 7.5 Hz (1.35 fn). The generator
natural frequency is in the range of 0.2 to 0.4 fn and represents thus a resonance risk.
Figure 11 PRBS mechanical torque excitation of
the generator.
Figure 12 Generator transfer function between
mechanical and electromagnetic torque.
Piping resonance The full hydroelectric simulation model is taken into account to calculate the transfer function
between the draft tube pressure source excitation and the electromagnetic torque. A PRBS draft
tube pressure source excitation at the draft tube of the turbine of Unit 4 is considered for the
time domain simulation. For this simulation the turbine speed governor is removed and guide
vane are kept with constant opening of 40%, corresponding to 65% of the nominal discharge.
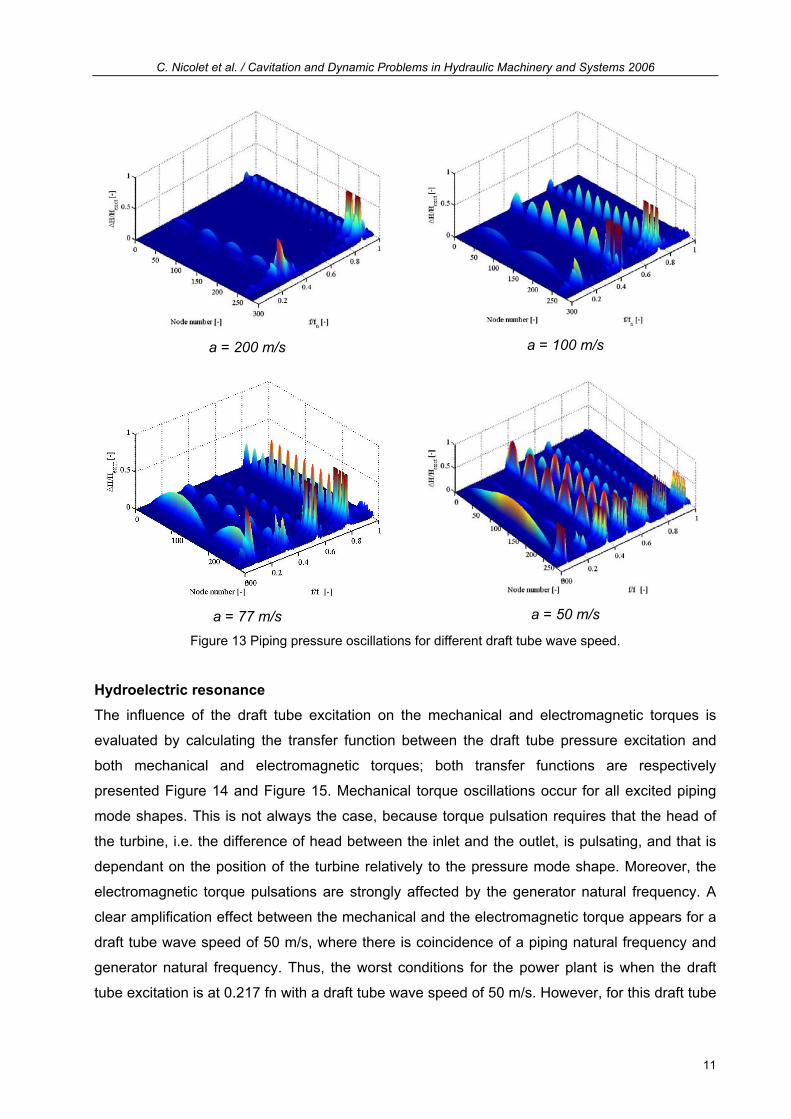
The resulting pressure oscillations in the piping system are represented as a waterfall diagram
for draft tube wave speed of: 200, 100, 77, and 50 m/s in Figure 13. The pressure pulsations
are represented as a function of the x coordinate starting from the surge tank (node 1) and
extending along the piping until the Unit4 downstream tank (node 289) and the rated frequency
f/fn. Not all piping natural frequencies are excited; this is due to the draft tube excitation source
relative position in the piping. It is pointed out how the natural frequencies are dropping with
respect to the draft tube wave speed. In addition, because the wave speed of the draft tube
affects the pressure node and maxima location, this is not the same mode shapes that are
excited for the different wave speeds. Regarding the frequency range of interest, 0.2 to 0.4 fn, it
can be seen that the lower the draft tube wave speed, the higher number of natural frequencies
in the frequency range of interest. Comparing these results with the simplified model it can be
seen that the natural frequency at 77 m/s that was pointed out as critical is not excited by the
draft tube pressure source and does not appear on the waterfall diagram, evidencing the
limitation of such simplified models.
fo Generator 1.21 Hz
fo Rotating masses 7.5 Hz
C. Nicolet et al. / Cavitation and Dynamic Problems in Hydraulic Machinery and Systems 2006
11
a = 200 m/s a = 100 m/s
a = 77 m/s a = 50 m/s
Figure 13 Piping pressure oscillations for different draft tube wave speed.
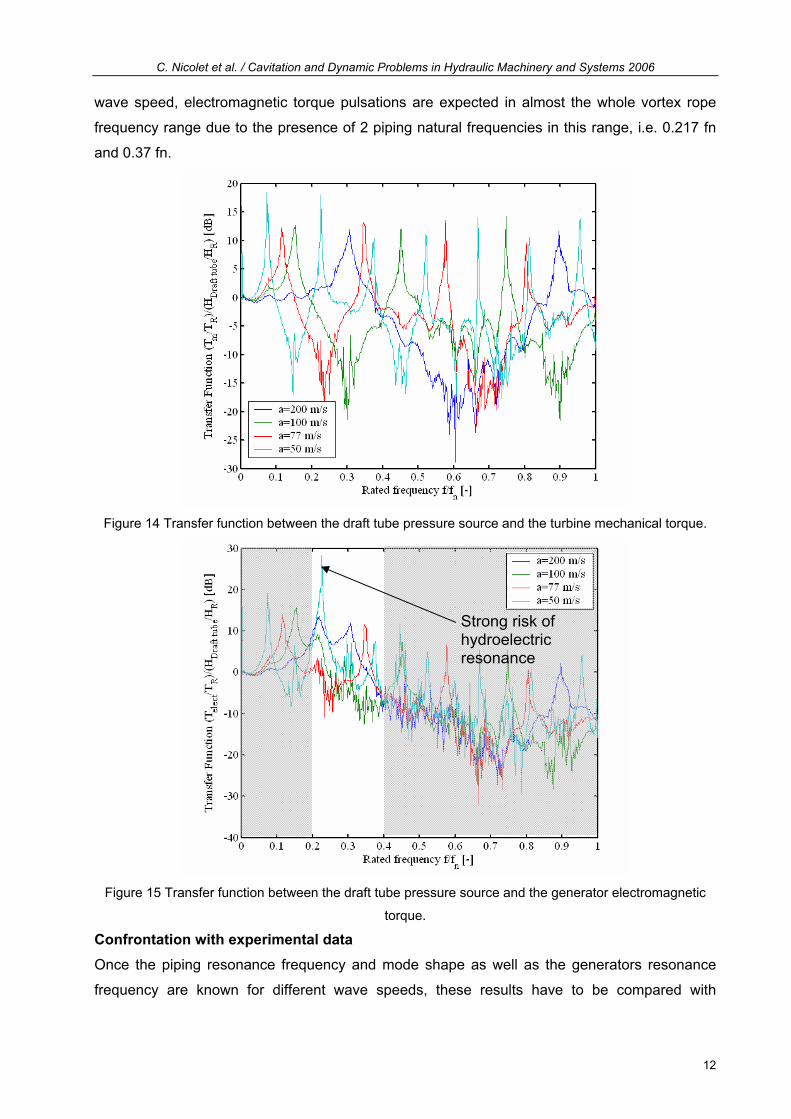
Hydroelectric resonance The influence of the draft tube excitation on the mechanical and electromagnetic torques is
evaluated by calculating the transfer function between the draft tube pressure excitation and
both mechanical and electromagnetic torques; both transfer functions are respectively
presented Figure 14 and Figure 15. Mechanical torque oscillations occur for all excited piping
mode shapes. This is not always the case, because torque pulsation requires that the head of
the turbine, i.e. the difference of head between the inlet and the outlet, is pulsating, and that is
dependant on the position of the turbine relatively to the pressure mode shape. Moreover, the
electromagnetic torque pulsations are strongly affected by the generator natural frequency. A
clear amplification effect between the mechanical and the electromagnetic torque appears for a
draft tube wave speed of 50 m/s, where there is coincidence of a piping natural frequency and
generator natural frequency. Thus, the worst conditions for the power plant is when the draft
tube excitation is at 0.217 fn with a draft tube wave speed of 50 m/s. However, for this draft tube
C. Nicolet et al. / Cavitation and Dynamic Problems in Hydraulic Machinery and Systems 2006
12
wave speed, electromagnetic torque pulsations are expected in almost the whole vortex rope
frequency range due to the presence of 2 piping natural frequencies in this range, i.e. 0.217 fn
and 0.37 fn.
Figure 14 Transfer function between the draft tube pressure source and the turbine mechanical torque.
Figure 15 Transfer function between the draft tube pressure source and the generator electromagnetic
torque.
Confrontation with experimental data Once the piping resonance frequency and mode shape as well as the generators resonance
frequency are known for different wave speeds, these results have to be compared with
Strong risk of hydroelectric resonance
C. Nicolet et al. / Cavitation and Dynamic Problems in Hydraulic Machinery and Systems 2006
13
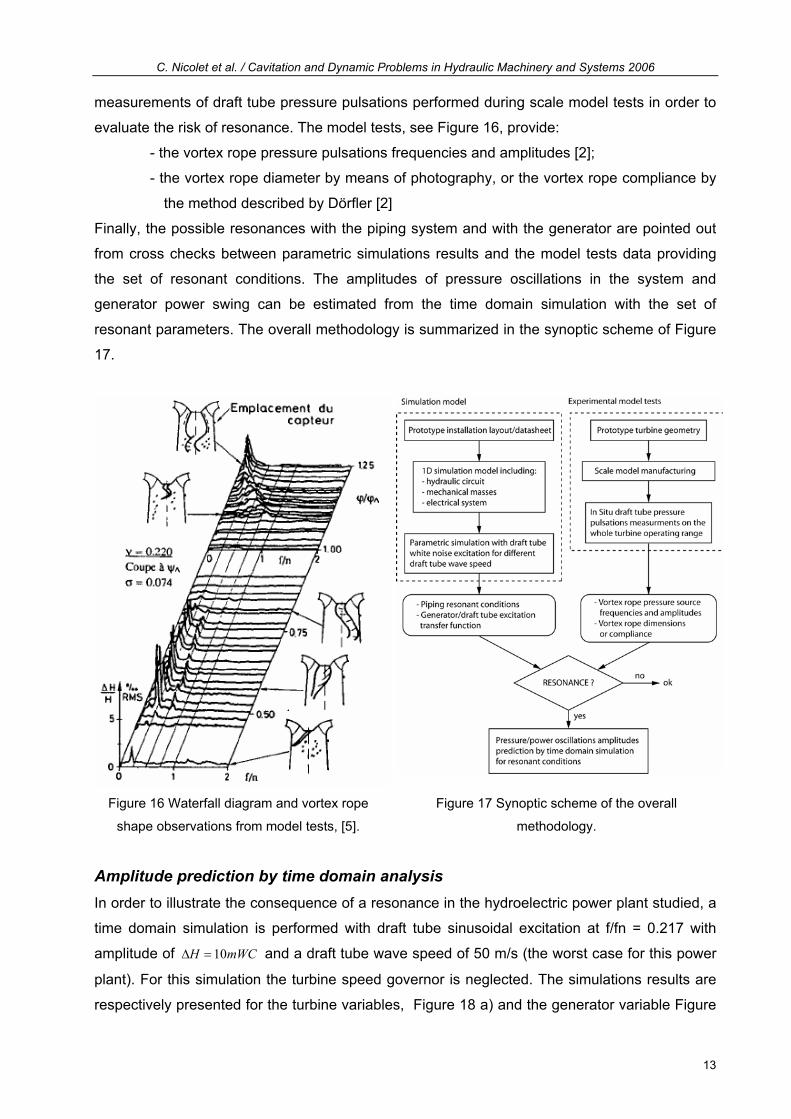
measurements of draft tube pressure pulsations performed during scale model tests in order to
evaluate the risk of resonance. The model tests, see Figure 16, provide:
- the vortex rope pressure pulsations frequencies and amplitudes [2];
- the vortex rope diameter by means of photography, or the vortex rope compliance by
the method described by Dcrfler [2]
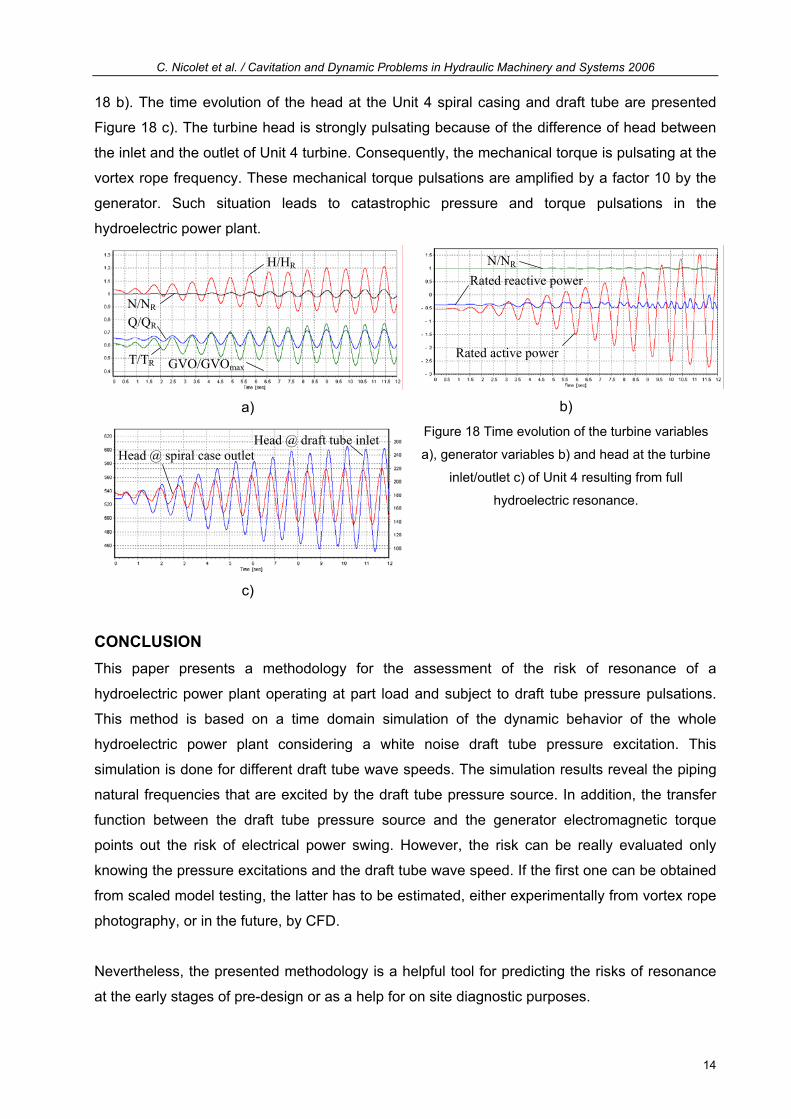
Finally, the possible resonances with the piping system and with the generator are pointed out
from cross checks between parametric simulations results and the model tests data providing
the set of resonant conditions. The amplitudes of pressure oscillations in the system and
generator power swing can be estimated from the time domain simulation with the set of
resonant parameters. The overall methodology is summarized in the synoptic scheme of Figure
17.
Figure 16 Waterfall diagram and vortex rope
shape observations from model tests, [5].
Figure 17 Synoptic scheme of the overall
methodology.
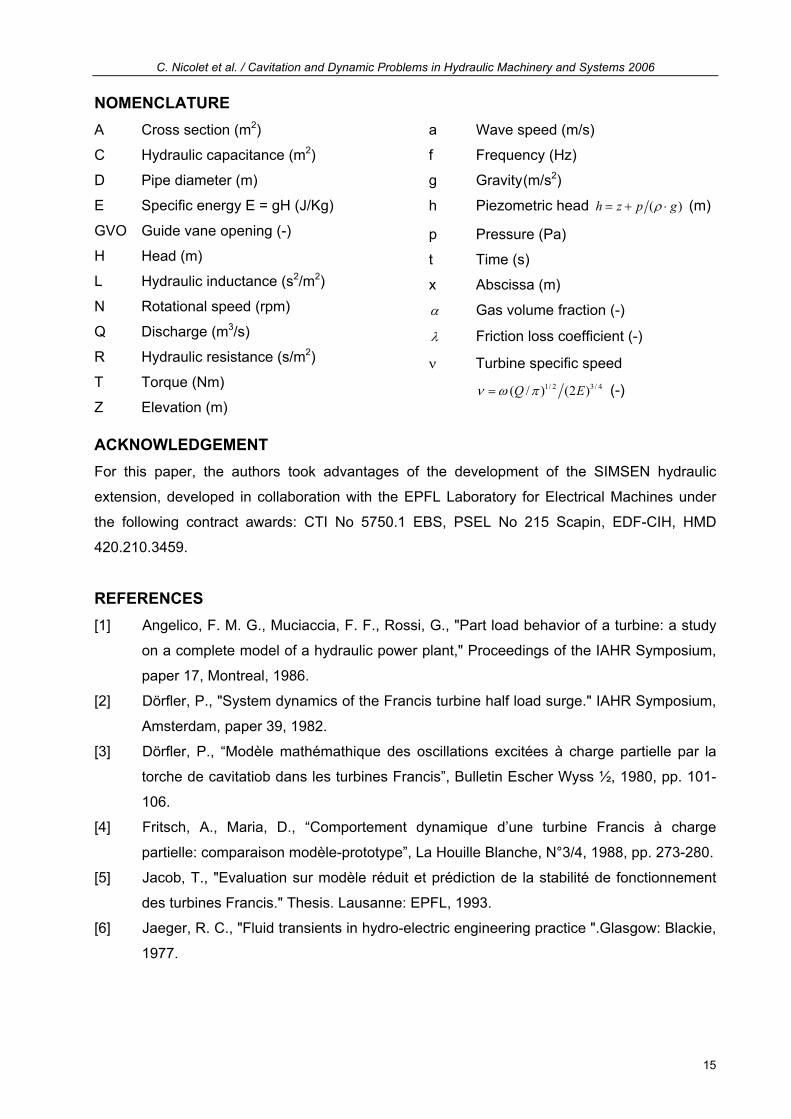
Amplitude prediction by time domain analysis In order to illustrate the consequence of a resonance in the hydroelectric power plant studied, a
time domain simulation is performed with draft tube sinusoidal excitation at f/fn = 0.217 with
amplitude of 10H mWC5 & and a draft tube wave speed of 50 m/s (the worst case for this power
plant). For this simulation the turbine speed governor is neglected. The simulations results are
respectively presented for the turbine variables, Figure 18 a) and the generator variable Figure
C. Nicolet et al. / Cavitation and Dynamic Problems in Hydraulic Machinery and Systems 2006
14
18 b). The time evolution of the head at the Unit 4 spiral casing and draft tube are presented
Figure 18 c). The turbine head is strongly pulsating because of the difference of head between
the inlet and the outlet of Unit 4 turbine. Consequently, the mechanical torque is pulsating at the
vortex rope frequency. These mechanical torque pulsations are amplified by a factor 10 by the
generator. Such situation leads to catastrophic pressure and torque pulsations in the
hydroelectric power plant.
a) b)
c)
Figure 18 Time evolution of the turbine variables
a), generator variables b) and head at the turbine
inlet/outlet c) of Unit 4 resulting from full
hydroelectric resonance.
CONCLUSION This paper presents a methodology for the assessment of the risk of resonance of a
hydroelectric power plant operating at part load and subject to draft tube pressure pulsations.
This method is based on a time domain simulation of the dynamic behavior of the whole
hydroelectric power plant considering a white noise draft tube pressure excitation. This
simulation is done for different draft tube wave speeds. The simulation results reveal the piping
natural frequencies that are excited by the draft tube pressure source. In addition, the transfer
function between the draft tube pressure source and the generator electromagnetic torque
points out the risk of electrical power swing. However, the risk can be really evaluated only
knowing the pressure excitations and the draft tube wave speed. If the first one can be obtained
from scaled model testing, the latter has to be estimated, either experimentally from vortex rope
photography, or in the future, by CFD.
Nevertheless, the presented methodology is a helpful tool for predicting the risks of resonance
at the early stages of pre-design or as a help for on site diagnostic purposes.
H/HR
N/NR Q/QR
T/TR GVO/GVOmax Rated active power
Rated reactive power N/NR
Head @ spiral case outlet Head @ draft tube inlet
C. Nicolet et al. / Cavitation and Dynamic Problems in Hydraulic Machinery and Systems 2006
15
NOMENCLATURE A Cross section (m2)
C Hydraulic capacitance (m2)
D Pipe diameter (m)
E Specific energy E = gH (J/Kg)
GVO Guide vane opening (-)
H Head (m)
L Hydraulic inductance (s2/m2)
N Rotational speed (rpm)
Q Discharge (m3/s)
R Hydraulic resistance (s/m2)
T Torque (Nm)
q Elevation (m)
a Wave speed (m/s)
f Frequency (Hz)
g Gravity (m/s2)
h Piezometric head ( )h z p g1& $ % (m)
p Pressure (Pa)
t Time (s)
x Abscissa (m)
* Gas volume fraction (-)
! Friction loss coefficient (-)
6 Turbine specific speed 1/ 2 3/ 4( / ) (2 )Q E6 7 8& (-)
ACKNOWLEDGEMENT For this paper, the authors took advantages of the development of the SIMSEN hydraulic
extension, developed in collaboration with the EPFL Laboratory for Electrical Machines under
the following contract awards: CTI No 5750.1 EBS, PSEL No 215 Scapin, EDF-CIH, HMD
420.210.3459.
REFERENCES [1] Angelico, F. M. G., Muciaccia, F. F., Rossi, G., rPart load behavior of a turbine: a study
on a complete model of a hydraulic power plant,r Proceedings of the IAHR Symposium,
paper 17, Montreal, 1986.
[2] Dcrfler, P., rSystem dynamics of the Francis turbine half load surge.r IAHR Symposium,
Amsterdam, paper 39, 1982.
[3] Dcrfler, P., sModtle mathémathique des oscillations excitées u charge partielle par la
torche de cavitatiob dans les turbines Francisv, Bulletin Escher Wyss w, 1980, pp. 101-
106.
[4] Fritsch, A., Maria, D., sComportement dynamique d’une turbine Francis u charge
partielle: comparaison modtle-prototypev, La Houille Blanche, Nx3/4, 1988, pp. 273-280.
[5] Jacob, T., rEvaluation sur modtle réduit et prédiction de la stabilité de fonctionnement
des turbines Francis.r Thesis. Lausanne: EPFL, 1993.
[6] Jaeger, R. C., rFluid transients in hydro-electric engineering practice r.Glasgow: Blackie,
1977.
C. Nicolet et al. / Cavitation and Dynamic Problems in Hydraulic Machinery and Systems 2006
16
[7] Nicolet, C., Arpe, J., Avellan, F., sIdentification and modeling of pressure fluctuations of a
Francis turbine scale model at part load operationv, 22nd Symposium of IAHR, Sweden,
Stockholm, paper A7-1, 2004.
[8] Nicolet, C., Avellan, F., Allenbach, P., Sapin, A., Simond, J.-J., Kvicinsky, S., Crahan,
M., rSimulation of Transient Phenomena in Francis Turbine Power Plants : Hydroelectric
Interaction r. Proceedings of Waterpower XIII, Advancing Technology for Sustainable
Energy, Buffalo, N.Y., USA, July 2003.
[9] Nishi, M., rSurging characteristics of conical and elbow type draft tubes.r Proceeding of
the 12th IAHR Symposium, Stirling, p272-283, 1984.
[10] Palde, U. J., sModel and prototype turbine draft tube surge analysis by the swirl
momentum methodv, Proc. 7th Symposium IAHR, Hydraulic Machinery and System,
1974, paper III.
[11] Paynter, H. M., sSurge and water hammer problemsv. Transaction of ASCE, vol. 146, p
962-1009, 1953.
[12] Philibert, R., Couston, M., sFrancis turbine at part load : Matrix simulating the
gaseous roper. In Proc. Of the 19th IAHR Symposium, Singapore, 1998, vol. 1,
pp. 441-453. [13] Rheingans, W. J., rPower swing in hydroelectric power plants.r Transaction, American
Society of Mechanical Engineers, Vol. 62, pp 171-184, 1940.
[14] Ruprecht, A., Helmrich, T., sSimulation of the water hammer in hydro power plant
caused by draft tube surgev, Proc. Of 4th ASME JSME Conf., Hawaii, USA, 2003, paper
FEDSM2003-45249.
[15] Sapin, A., sLogiciel modulaire pour la simulation et l’étude des systtmes d’entraznement
et des réseaux électriquesv, Thesis EPFL nx 1346, 1995.
[16] Tadel, J., Maria, D., sAnalysis of dynamic behavior of a hydroelectric installation with
Francis turbinev, Proc. 5th Int. Conf on Pressure Surges, Hannover, Germany, 1986,
pp.43-52.
[17] Wallis, G. B., sOne-dimensional two-phase flowv, Mc Graw-Hill, New York, 1969.
[18] Wylie, E. B. { Streeter, V.L., sFluid transients in systemsv. Prentice Hall, Englewood
Cliffs, N.J, 1993.