Embed Size (px)
Citation preview

Hysteresis of Multiconfiguration Assemblies ofNitinol and Steel Strands: Experiments and
Phenomenological IdentificationBiagio Carboni1; Walter Lacarbonara2; and Ferdinando Auricchio3
Abstract: An in-house–built rheological device, made of assemblies of custom-made nickel titanium-Naval Ordnance Laboratory (Nitinol)strands, wires, and steel wire ropes, is experimentally tested in different configurations corresponding to three distinct constitutive behaviors:a strong hardening pinched hysteresis, a quasi-linear–softening behavior, and an intermediate behavior in the range of interest. The nonlinearfeatures of the hysteretic rheological device are the result of geometric hardening of the ropes, interwire friction, and dissipation caused by thephase transformations of the Nitinol wires. These different mechanisms determine a pinching at the origin of the hysteresis force-displacementloops. A phenomenological representation of the experimentally acquired constitutive responses is obtained by an extension of the Bouc-Wenmodel incorporating a pinching function that depends on two parameters. The responses of the Nitinol wires and strands under uniaxial tensionare instead well identified using the Ivshin-Pence model. Parameter identification of the phenomenological models, based on the experimentalmeasurements, is carried out using an optimization method belonging to the family of differential evolutionary algorithms. A very goodagreement is found between the experiments and the identified models. DOI: 10.1061/(ASCE)EM.1943-7889.0000852. © 2014 AmericanSociety of Civil Engineers.
Author keywords: Pinched/hardening hysteresis; nickel titanium-Naval Ordnance Laboratory (Nitinol) strands; Steel wire ropes; Phenom-enological model; Differential evolutionary optimization.
Introduction
Devices and applications that make use of ropes, yarns, cords,cables, and strands are countless. The formidable capability of theseelements to resist relatively large axial loads in comparison withbending and torsional loads is well known. Besides the prominentaxial load-bearing capability, the idea of exploiting the bendingbehavior of short wire ropes was proposed to dissipate and absorbenergy. When a short wire rope is forced to deform in bending,a relative motion and therefore friction between the individual wirestakes place. The first device that took advantage of the interwirefrictional damping was the Stockbridge damper [G. H. Stockbridge,“Vibration damper,” U.S. Patent No. 1,675,391 (1928)]. A morerecent application is the vibration isolation of devices that control thepassage of fluid to rocket engines (Tinker and Cutchins 1992). Wirerope springs have also been used in seismic protection of sensitiveequipment in buildings (Demetriades et al. 1993). The effectivenessof a class of tuned mass dampers that rely on wire rope springs wasshown experimentally through wind tunnel and shaking table tests(Gerges and Vickery 2003a, b; Carpineto et al. 2014).
The basic element of a wire rope is a single thin wire. The rope ismade by laying several strands around a core. The core is also a wirerope, and the strands themselves have a central wire that is the axialmember around which the individual wires are wrapped helically. Thegeometric quantities that characterize a rope are the diameter of thewires, the number of layers, and the associated laying angles. Thesequantities satisfy certain geometric relationships. A detailed de-scription of the geometry ofwire ropes can be found inCostello (1990).
An effective way of describing the hysteretic force-displacementrelationship resorts to phenomenological models. Experimentalresults are required for calibration of the phenomenological parame-ters. One of the most popular models is the so-called Bouc-Wen(BW) model, introduced by Bouc (1967) and later extended byWen (1976). Baber and Wen (1981) enriched the model to takeinto account stiffness and/or strength degradation as a function ofhysteretic energy dissipation. Baber and Noori (1985, 1986) furthermodified the original model, adding the so-called pinching function.Foliente (1995) generalized the pinching function of the Bouc-Wen-Baber-Noori model. Other modified versions of the original modelwere proposed to take into account asymmetric tension-compressionhysteresis loops (Ko et al. 1992; Demetriades et al. 1993; Ni et al.1999a, b). Sireteanu et al. (2010) proposed an extended BW modelable to describe an inflection point on the loading branches.
Jenkin elements and the Masing model are also widely usedphenomenological models of hysteresis. For example, Sauter andHagedorn (2002) used distributed Jenkin elements to model thecable of a Stockbridge damper. The damper impedances weresimulated using data acquired in a simple experiment carried out ona piece of damper cable. TheMasing model was thus generalized fora continuous system such as a cable. Gerges (2008) conducted anexperimental study dealing with wire rope springs deforming intension-compression cycles. They used a semianalytical model inwhich the parameters are related to the size and properties of thesprings.
1Ph.D. Candidate, Dept. di Ingegneria Strutturale e Geotecnica, SapienzaUniv. of Rome, Rome 00184, Italy. E-mail: [email protected]
2Associate Professor, Dept. di Ingegneria Strutturale e Geotecnica,Sapienza Univ. of Rome, Rome 00184, Italy (corresponding author).E-mail: [email protected]
3Full Professor, Dept. di Ingegneria Civile ed Architettura, Univ. ofPavia, Pavia 27100, Italy. E-mail: [email protected]
Note. Thismanuscript was submitted on February 25, 2014; approved onJuly 23, 2014; published online on September 3, 2014. Discussion periodopen until February 3, 2015; separate discussions must be submitted forindividual papers. This paper is part of the Journal of EngineeringMechanics, © ASCE, ISSN 0733-9399/04014135(16)/$25.00.
© ASCE 04014135-1 J. Eng. Mech.
J. Eng. Mech.
Dow
nloa
ded
from
asc
elib
rary
.org
by
TE
CH
NIS
CH
E U
NIV
ER
SIT
EIT
DE
LFT
on
01/2
9/15
. Cop
yrig
ht A
SCE
. For
per
sona
l use
onl
y; a
ll ri
ghts
res
erve
d.

Besides the interwire frictional hysteresis of steel wire ropes, inthe present work, the authors investigate the hysteresis of shapememory alloy (SMA) wires caused by martensitic phase trans-formations. The two prominent features of SMAs, known as shapememory effect and superelasticity, are caused by the thermoelasticmartensitic phase transformation that can be induced by a tempera-ture or stress state change. The transition between the two solidphases (martensite and austenite) occurs when the thermomechan-ical state of the material varies.
The complex thermomechanical behavior of SMA elements hasbeen the object of various modeling efforts. Ivshin and Pence (1994)proposed a one-dimensional constitutive model, which was laterextended byBernardini and Pence (2002). Thismodelwell describesthe stress-strain behavior of SMA elements under uniaxial states ofstress and has been investigated in several studies (Lacarbonara et al.2004). Auricchio and colleagues (Auricchio and Petrini 2004;Auricchio et al. 1997) developed a full three-dimensional thermo-elastic constitutive law implemented in the finite-element codeABAQUS 6.11.
The use of SMAcomponents in the context of vibration control ismainly caused by the possibility of designing these alloys to havea specific behavior (Otsuka and Wayman 1999; Intrater et al. 1952;Buehler et al. 1963; Graesser and Cozzarelli 1991;Wilde et al. 2000;Dolce and Cardone 2001a, b; Dolce et al. 2000; Gandhi and Chapuis2002; Moroni et al. 2002; Masuda and Noori 2002; Han et al. 2003;Bellouard and Clavel 2004; Williams et al. 2005; Rustighi et al.2005; Zuo et al. 2006; Song et al. 2006;Klou�cek andReynolds 2006;Nemat-Nasser and Guo 2006; Zhang and Zhu 2007; Torra et al.2007;Motahari et al. 2007; Heinonen et al. 2008;Ma and Cho 2008;Sharabash and Andrawes 2009; Ma and Yam 2011; Sun 2011)[K. A.Williams, G. T. C. Chiu, andR. J. Bernhard, “Vibration absorberusing shape memory material,” U.S. Patent No. 6,290,037 (2001)].These works consider devices constituted by assemblies of steel,rubber, and SMA single wires and bars. A recent patent [N. D.Mankame et al., “Shape memory alloy cables,” U.S. Patent No.8,272,214 (2012)] describes a prototype of SMA wire rope.
Beltran et al. (2011) performed tensile tests on strands made ofCuAlBe SMA wires to characterize their behavior and demonstratetheir suitability as adaptive or resilient tension elements. Reedlunnet al. (2013a)performedanextensive setofuniaxial tensionexperimentson two types of nickel titanium-Naval Ordnance Laboratory (Nitinol)cables. They used stereo digital images to capture the evolution ofboth strains and temperature (Reedlunn et al. 2013b).
An important aspect in the study of hysteretic systems is theidentification of the constitutive parameters by making use of ex-perimental measurements. Identification techniques can be groupedin several different ways such as, to mention but one, classical andnonclassical methods (Koh et al. 2003). The methods of the firstgroup were extensively studied in the last decades (Kerschen et al.2006). The second group comprises gradient-free methods that beara much broader applicability. These methods are robust againstinstrumental noise and operate on a single type of data (displace-ments, velocities, and accelerations) without requiring differentia-tion or integration. The main disadvantage consists in the lack ofwell-posed proofs of convergence. Within the last group of tech-niques, the differential evolutionary (DE) method is a metaheuristicoptimization method based on very general assumptions with norestrictions about the nature of the optimization problem. The al-gorithm originally presented by Storn and Price (Storn and Price1997; Storn 1996) has been used in a variety of applications (Priceet al. 2006; Feoktistov 2006; Chakraborty et al. 2008), including theidentification of hysteresis cycles based on the BW model(Kyprianou et al. 2001; Ma et al. 2006). Quaranta et al. (2010)investigated the performance of six different DE versions in the
parameter identification of the van der Pol-Duffing oscillator.Worden and Manson (2012) proposed an enhancement, the self-adaptive differential evolutionary (SADE) algorithm, in whicha subset of the parameters is self-adapted.
In the present work, experimental results for tensile and bendingtests carried out on Nitinol wires and multiconfiguration assembliesof steel and Nitinol strands are reported. The restoring force is thesummation of the restoring forces delivered by two groups of wireropes. The main group is constituted by assemblies of steel wireropes or Nitinol strands subject to shear-bending-tension, whereasthe secondary group of Nitinol wires or strands is subjected to puretension cycles. The Ivshin-Pence model (Ivshin and Pence 1994;Bernardini and Pence 2002) is used to describe the constitutiveresponse of Nitinol wires and strands under uniaxial tensile states.An extension of the BWmodel (Bouc 1967;Wen 1976), inspired bytheworks of Baber andNoori (1985), is proposed for the descriptionof the total restoring force of the multiconfiguration assemblies.Moreover, a variant of the DE algorithm is adopted for parameteridentification (Kyprianou et al. 2001). The tests presented in thispaper exhibit novel constitutive behaviors, which are well identifiedby the proposed model and are useful for the development of newnonlinear vibration absorbers.
Hysteresis of Nitinol Strands under Flexure
A strand is characterized by a core wire around which a layer ofhelical wires is wrapped. The parameters that define the geometry ofthe strand are the radius of the core wire, the radius of the helicalwires, and the pitch length. According to these values, the wiresbelonging to a layer may be or not be in contact. The radius of thecore wire should be slightly larger than the radius of the helical wiresto have a strand without overlapping regions. However, in practice,they can have the same size. In such a case, during the laying pro-cess, the wires are subject to small deformations through whichcontact conditions between the elements are created. After com-pleting the laying process, the rope is further exposed to a thermalprocess to ensure preservation of the shape. This gives rise to aninitial contact force between the wire interfaces.
Two types of ropes were specifically manufactured for thisproject. The first rope, referred to as NiTi7 (diameter, 1.8 mm), isformed by a core wire and a first layer of six wires with a pitch lengthequal to 15.4mm, for a total number of sevenwires. The second typeis referred to as NiTi19 (diameter, 3 mm) and is formed by 19 wiresand is obtained by adding to the previous rope to a second layer of 12wires with a pitch length of 25.7 mm. The first and second layersare wrapped in the left and right directions, respectively. Themanufacturing of Nitinol ropes offers some challenging aspectsbecause of the strong elasticity of the material. The effectiveness ofthe thermal process is very important to obtain a rope that pre-serves its shape. Nitinol wires provided by SAES & Getters Spa(Lainate, Italy) have been used in the stranding process carriedout by Intra.Flex Spa (Oggiono, Italy), a company specialized inmanufacturing steel strands for various applications.
The other wires and ropes used in the testing campaign area single Nitinol wire (referred to as NiTi1; diameter, 0.6 mm), a steelwire rope (referred to as ST49) formed by 11 6 strands, where eachstrand has 11 6wires for a total number of 49wires (diameter, 6mm).Fig. 1 shows NiTi19 and the cross sections of the other wires andstrands described previously.
The steel and Nitinol elements are subject to cyclic quasi-statictests using a device mounted within a dedicated setup illustratedin the “Experimental Setup” section. Fig. 2 shows the principal typesof observed hysteresis: (a) the classical hysteresis cycle of a steel wire
© ASCE 04014135-2 J. Eng. Mech.
J. Eng. Mech.
Dow
nloa
ded
from
asc
elib
rary
.org
by
TE
CH
NIS
CH
E U
NIV
ER
SIT
EIT
DE
LFT
on
01/2
9/15
. Cop
yrig
ht A
SCE
. For
per
sona
l use
onl
y; a
ll ri
ghts
res
erve
d.

rope subject to bending, well identified using the BW model ofhysteresis (Carpineto et al. 2014); (b) a strong pinching at the originof the force-displacement cycle and a distinct hardening behavior;(c) intermediate behavior. An extension of the BW model foridentification of the pinched hysteresis behaviors is discussed in thenext section. The experimental tests delivering these three classes ofconstitutive behaviors will be discussed in the following sections.
Modified BW Model of Hysteresis
Hysteretic behavior is observed in several fields such as elasto-plasticity, phase transition, magnetism, and friction mechanisms. Awidely used model in a variety of studies—including nonlinearvibrations (Lacarbonara and Vestroni 2003)—is the BW model ofhysteresis. The restoring force of the BW model (Bouc 1967; Wen1976) is described as a direct summation of a linear elastic termdenoted by kex and a hysteretic force denoted by z whose evolutionis described by the first-order differential equation
_z ¼ fkd 2 ½g þ bsgnðz _xÞ�jzjng _x (1)
where x 5 displacement; z 5 hysteretic force; ke, kd, g, b, and n5 constitutive parameters; and the overdot 5 differentiation withrespect to time. Thus, the restoring force is f ðtÞ5 kex1 z, and thecoefficient k5 ke 1 kd is the tangent stiffness at the origin. Theparameters g and b regulate the softening or hardening behavior,whereas n governs the smoothness of the transition from elastic toelastoplastic behavior; in the limit n→‘, the elastoperfectly plasticbehavior is recovered.
Henceforth, the authors will consider only the softening restoringforce obtained for g1b. 0 and n5 1. The authors seek to identifythe experimentally measured forces in the Nitinol strands within thefamily of these restoring forces. Moreover, because of the pinchingfeature of the restoring forces in the multiconfiguration Nitinol/steelstrand assemblies, the authors seek tomodify the original BWmodelto allow for the description of such a pinching effect. To this end,consider the tangent stiffness of the hysteretic force denoted by zx,obtained from Eq. (1), multiplying the left and right sides by dt, anddividing the resulting equation by dx
zx ¼ kd 2 ½g þ bsgnðz _xÞ�jzjn (2)
The tangent stiffness at the origin is zxð0Þ5 kd . The function z isa continuous odd function of x with piecewise derivative zx, which,on the contrary, is an even function. The stationarity of z is reachedwhen the displacement is such that zx 5 0. Consequently, the upperand lower bounds for z are given by
zmax ¼ 2zmin ¼�
kdg þ b
�1=n
(3)
Next the modification of the BW model to account for pinchingeffects is discussed. This can be achieved by a suitable modificationof the stiffness at the origin. To this end, the stiffness constant kd inEq. (1) is multiplied by a function hðxÞ so that
_z ¼ fkdhðxÞ2 ½g þ bsgnðz _xÞ�jzjng _x (4)
where the function hðxÞ is introduced to modulate the tangent stiff-ness in the neighborhood of the origin. The bell-shaped function hhas the form (Fig. 3)
hðxÞ ¼ 12 je2ðx 2=xcÞ (5)
where j2 ½0, 1Þ and xc . 0. The introduced nonlinear stiffnessmodulation changes both zx and z as shown in Fig. 4. The ensuingbehavior is described as follows:1. Line a-b: the function zx starts off at kdð12 jÞ. 0 at a and
decreases until a local minimum is reached where the functionz changes concavity; past this point, the growth of the functionhðxÞ entails that zx reaches a local maximum and then de-creases to a value greater than zero.
Fig. 1. The 19-wire Nitinol strand and the cross sections of the strandsused in the experimental campaign
Fig. 2. Experimentally obtained force-displacement hysteresis cycles: (a) classical quasi-linear–softening hysteresis; (b) strongly pinched, hardeninghysteresis; (c) slightly pinched, hardening hysteresis
© ASCE 04014135-3 J. Eng. Mech.
J. Eng. Mech.
Dow
nloa
ded
from
asc
elib
rary
.org
by
TE
CH
NIS
CH
E U
NIV
ER
SIT
EIT
DE
LFT
on
01/2
9/15
. Cop
yrig
ht A
SCE
. For
per
sona
l use
onl
y; a
ll ri
ghts
res
erve
d.

2. Line b-c: the function zx suffers a jump because of the fact thatthevelocityvanisheswhen x5 xmax, pastwhich it switches sign.
3. Line c-d: the function zx decreases according to zx 5 kdhðxÞ2 ðg2bÞjzjn because z and hðxÞ are decreasing functionsand g2b, 0; when g2b. 0, the function zx is a mono-tonically increasing function and unlike the previous case,zxjx5d . zxjx5c; when g5b, the function zx remains constantto kdhðxÞ, whereas z decreases with a constant slope.
4. Line d-e: the function zx continues to decrease according tozx 5 kdhðxÞ2 ðg1bÞjzjn because z, 0 and hðxÞ is decreas-ing, but the term jzjn is increasing; the function zx vanisheswhere z reaches a minimum value; past this point, zx wouldcontinue to be zero if hðxÞ did not decrease entailing zx , 0.
5. Line e-f : zx decreases up to a minimum negative value, pastwhich the decrease of jzjn brings back zx to 0 where zðxÞreaches a local minimum denoted by ~zmin.
The functions zx and z are even and odd functions of x, re-spectively. The stationary points of z, expressed by Eq. (3), remainunchanged, whereas the effect of the pinching function hðxÞ is toreset the displacements where these values are attained. Moreover,two new bounds for z exist and are denoted by ~zmin and ~zmax, re-spectively. Setting again zx 5 0 yields
~zmax ¼ 2~zmin ¼�kdð12 jÞg þ b
�1=n(6)
These values are attained as x approaches zero from left and right,respectively.
There are constitutive restrictions on the functions such that thestiffness is ensured to be always positive, that is
Fig. 3. Pinching function
Fig. 4. (a) Hysteretic force-displacement loop and (b) hysteretic tangent stiffness displacement loop of the modified BW model in the rangex2 ½220; 20� when kd 5 1, g5 1, b5 1:23, n5 1, j5 0:8, and xc 5 50
© ASCE 04014135-4 J. Eng. Mech.
J. Eng. Mech.
Dow
nloa
ded
from
asc
elib
rary
.org
by
TE
CH
NIS
CH
E U
NIV
ER
SIT
EIT
DE
LFT
on
01/2
9/15
. Cop
yrig
ht A
SCE
. For
per
sona
l use
onl
y; a
ll ri
ghts
res
erve
d.

fx ¼ ke þ zx$ 0 (7)
Eq. (7) entails that
ke$ jzminx j (8)
Representative hysteretic forces for different values of theparameters of the pinching function hðxÞ are shown in Fig. 5. Theparameter xc introduced in Eq. (5) regulates the width of the pinchedregion of the hysteresis loops. Low values of xc determine localizedpinching around the origin, whereas high values entail pinching overa larger displacement range. Conversely, the parameter j in Eq. (5)controls the severity of the pinching phenomenon. In Figs. 6(a and b),the overall restoring force is obtained adding the linear force kex tothe hysteretic force in Fig. 5. Finally in Figs. 6(c and d), the moregeneral restoring force f 5 rðkex1 zÞ1 ð12 rÞk3x3 is shown fordifferent constitutive parameters. The parameter r� 1 allows theintroduction of the nonlinear elastic term k3x3. As shown in Figs. 5and 6, the solid lines marked by stars, obtained for j5 0:1, are veryclose to the black solid lines representing the classical BWmodel. Ofcourse, the modified BW model yields the standard BW model forvanishing j.
The nondimensional form of the restoring force and the hyster-etic stiffness read, respectively
~f ¼ d~xþ ð12 dÞ~zþ ~k3~x3 (9)
_~z ¼�~h2
�~g þ ~bsgn
�~z _~xj~zjn�_~x (10)
where the overdot denotes differentiation with respect to non-dimensional time, and the following nondimensional variables andparameters are introduced:
~x ¼ xx0, ~t ¼ vt, ~z ¼ z
z0, d ¼ ke
ke þ kd, ~k3 ¼ k3x20
ke þ kd(11)
In Eq. (11), x0 denotes a characteristic displacement, z0 5 kdx0,v5
ffiffiffiffiffiffiffiffiffiffiffiffiffiffiffiffiN0=x0m
p, N0 5 ðke 1 kdÞx0, and m is a characteristic mass.
The nondimensional pinching function becomes
~h ¼ 12 je2ð~x2=~xcÞ (12)
where ~xc 5 xc=x20. The other nondimensional parameters are ð~g, ~bÞ5 ðg,bÞx0zn21
0 .
Experimental Setup
The testing setup in Fig. 7 consists of a supporting squared framedenoted by F1 whose vertical bars contain special clamps for theterminal parts of two pairs of strands or ropes, representing theprincipal stiffness group (PSG). The other ends of the strands areclamped to two thick steel bars denoted by b2. An additional verticalbar b1, aligned with the vertical midaxis of the frames and havingthree passing-through circular rods clamped to it, has the role ofconstraining the two Bars b2 to move vertically all together. SmoothRods s1 and s2 allow Bars b2 to slide frictionlessly on them.Conversely, Rod s3 is a threaded bar that is or is not clamped to b2 bymeans of four bolts. In the first case, the sliding of b2 on s1 and s2 isprevented. The frictionless joints are realized by placing two self-lubricating polytetrafluoroethylene (PTFE) bushings between eachhole of Bars b2 and passing through Rods s1 and s2. The assemblycomprising Bars b1 and b2 together with Rods s1, s2, and s3 isreferred to as F2. Central Bar b1 is connected through a steel fork tothe stationary support of the material testing system (MTS) machinewhile Frame F1 is attached to the actuator (Piston P) of theMTS. Thelatter assigns cyclic displacements in the vertical direction, dis-placing F1 relative to F2. The total restoring force is measured bya load cell placed between the steel fork, connected to b1, and thefixed support of theMTS.Depending on the configuration of Rod s3,three testing conditions can be implemented:1. s3 is clamped to b2 on either sides; thus, when F1 moves
vertically with respect to F2, Bars b2 cannot slide horizontallyon Rods s1 and s2 and the PSG is subjected to a bending-tension load; the restoring force exhibits a strong geometrichardening caused by the tension arising in the ropes.
2. s3 is not clamped to b2; thus, when F1 translates relative to F2,the PSG ropes pull b2 toward F1; because b2 is free to slidehorizontally, the PSG is subject only to bending with a result-ing quasi-linear restoring force.
Fig. 5. Hysteretic force z for (a) xc 5 20 and (b) xc 5 300; the solid lines marked by stars, squares, and circles are obtained for j5 0:1, j5 0:5, andj5 0:9, respectively; the black solid lines represent the classical Bouc-Wen model; in all plots, kd 5 0:5 and g5b5 0:5
© ASCE 04014135-5 J. Eng. Mech.
J. Eng. Mech.
Dow
nloa
ded
from
asc
elib
rary
.org
by
TE
CH
NIS
CH
E U
NIV
ER
SIT
EIT
DE
LFT
on
01/2
9/15
. Cop
yrig
ht A
SCE
. For
per
sona
l use
onl
y; a
ll ri
ghts
res
erve
d.

Fig. 6. Restoring force obtained in (a) and (c) for xc 5 20 and in (b) and (d) for xc 5 300; the solid lines marked by stars, squares, and circles areobtained for j5 0:1, j5 0:5, and j5 0:9, respectively; the black solid lines represent the classical Bouc-Wen model in (a) and (b) and the Bouc-Wen model with an additional cubic stiffness term in (c) and (d); in (a)–(d), kd 5 0:5, g5b5 0:5, ke 5 0:406, k3 5 4:2653 1025, and r5 0:2
Fig. 7. Testing device: (a) actual device (image by Biagio Carboni); (b) schematic picture
© ASCE 04014135-6 J. Eng. Mech.
J. Eng. Mech.
Dow
nloa
ded
from
asc
elib
rary
.org
by
TE
CH
NIS
CH
E U
NIV
ER
SIT
EIT
DE
LFT
on
01/2
9/15
. Cop
yrig
ht A
SCE
. For
per
sona
l use
onl
y; a
ll ri
ghts
res
erve
d.

3. s3 is not clamped to b2; however, a secondary stiffness group(SSG) of SMA wires or strands connects the two Bars b2; theresulting stiffness developed in SSG acts to constrain thehorizontal translation of b2 and the ensuing hardening behav-ior depends on the stiffness ratio between the stiffness of SSGand that of PSG.
Here and henceforth, the three different assemblies/configurationsare denotedbyS1,S2, andS3, respectively (Fig. 8). Configurations S1and S2 represent two limit cases of Configuration S3, because S1 andS2 are attainedwhen the ratio between the stiffness of SSG and that ofPSG tends to infinity and to zero, respectively. The energy dissipationinS3 is caused by the internal friction and/or thephase transformationswithin PSG and the martensitic transition within SSG. The measuredquantities, functions of the vertical displacement, are the verticalrestoring force and the relative distance between the sliding blocks.The force exhibited by the SSG was not measured for the practicaldifficulty to place load cells between the strandsorwires ends andBarsb2. It is not possible to place a load cell between Bars b2 because itwould affect the stiffness of the SSG. However, the hysteresis cyclesof the SSG can be reconstructed by exploiting the phenomenologicalidentification of the tensile tests on the Nitinol wires and strands. TheS2 configuration is shown in Fig. 9 in the condition in which theassigned vertical displacement is maximum. The strands of the PSGpresent the deflected shape characterized by the change of the cur-vature at the midspan.
DE Algorithm
The DE algorithm is a nonclassical optimization method because itis not based on the computation of the gradients of the objectivefunction. This overcomes the need of an initial linearization pointfromwhich the optimization process starts off. It also overcomes theneed of differentiating an often discontinuous objective function.For each parameter to identify, the initial guess consists in choosinga value within a given range. The algorithm is very similar to geneticalgorithms and differs only in some parts. Consider a number n2N
of parameters pi to identify with i5 1, . . . , n and for each onea number m of different values drawn from uniform probabilitydistributions on ranges that, at most, span two orders of magnitude.The authors consider an initial population of parameters formed bya number m of n-dimensional vectors listing a set of values of theparameters to identify. The initial population is recorded in an n3mmatrix, where m represents the number of values for each parame-ter selected within a uniform probability distribution. Thus, the
parameters space in which the solution is searched is equallyspanned. The algorithm seeks to find a new population of parameterswith improved features combining the vectors of the starting pop-ulation. The algorithm is iterative, and the number of iterationsrequired to obtain an acceptable solution is chosen after a firstnumerical investigation. Each iteration is composed by a number ofcomputational cycles equal to the number m of vectors in thepopulation. At each computational cycle, a vector for the newimproved population is obtained as follows. Consider the jthcomputational cycle of the kth iteration with j5 1, . . . ,m andk5 1, . . . , l, where m represents the number of cycles to obtain animproved population and l is the number of improved populations.The jth cycle comprises the following steps:1. Target vector selection: The jth target vector Pt is selected.2. Random vectors selection: Three vectors Pp, Pa, and Pb are
randomly selected, with the condition that the last two shouldnot be either Pt or Pp.
3. Differential perturbation: The mutated vector Pm is obtainedby adding to Pp the perturbation FðPa 2PbÞwith F5 0:9; theensuing parameters values lying out of the defined ranges areset back to the bordering values.
4. Crossover: The trial vector Ptr is composed by taking termsfrom Pt and Pm. For each parameter, a number from a uniformprobability distribution in the range [0, 1] is randomly extracted;
Fig. 8. Three different configurations of the hysteretic device (dashed lines indicate the displaced configuration)
Fig. 9. Configuration S2 of the device deformed state
© ASCE 04014135-7 J. Eng. Mech.
J. Eng. Mech.
Dow
nloa
ded
from
asc
elib
rary
.org
by
TE
CH
NIS
CH
E U
NIV
ER
SIT
EIT
DE
LFT
on
01/2
9/15
. Cop
yrig
ht A
SCE
. For
per
sona
l use
onl
y; a
ll ri
ghts
res
erve
d.

if the number is less than 0.5, the parameter is taken from Pt;otherwise, it is taken from Pm.
5. Vector selection: The cost function is computed for both thetrial vector Ptr and the target vector Pt; the vector yielding tothe lowest cost survives and forms the new generation.
The selection of the best vector is performed by minimizing themean square error (MSE). Denoting the experimentally measuredforce and the model-based restoring force obtained with the generalparameters vector P by f ðxÞ and f̂ ðxÞ, the MSE reads
MSE ¼ 100Ns2
f
PNk51
f ðxÞ2 f̂ ðxÞ� 2
(13)
where s2f and N 5 variance and number of points of the experimen-
tal measurements, respectively.
Tensile Tests for the Nitinol Wires and Identification
The Nitinol wire of diameter 0.6 mm and the seven-wire strand withdiameter 1.8 mm were subjected to tensile cyclic tests with in-creasing amplitude. The strand is formed by a core wire and a firstlayer of six wires, with a pitch length equal to 15.4 mm. All wireshave a diameter equal to 0.6 mm. The tests are performed using theMTSmachine, and suitable grips (Fig. 10) are used to fix the strandsends to the MTS support and to the actuator head. The layout isshown in Fig. 10.One end of the specimen is fixed, whereas the otherend is subject to a prescribed displacement Du. The elongation isevaluated as
ɛ ¼ Dul0
100% (14)
where l0 5 natural specimen length. The associated restoring force ismeasured by the load cell mounted on the MTS system. In Table 1,the details of the tests performed on the single wire and the seven-wire strand are reported. For each test, the loading rate is equalto 10 mm=min during loading and unloading. The single wirespecimen has an initial length l0 equal to 255 mm, whereas theseven-wire strand is 170 mm long. The experimentally observed
force-displacement cycles are identified using the Ivshin-Pencemodel described in the Appendix. Table 2 summarizes the iden-tified parameters. The chosen independent kinematic variable is thestrain. For each amplitude, 15 experimental cycles are recorded, fromwhich one stabilized cycle is extracted and identified according to anindividual set of parameters. The number of vectors that forms thepopulation is 40, whereas the number of iterations performed by theDE algorithm is 150 for fitting the tests in Table 1. Fig. 11 showsthe experimental hysteresis cycles of the tests listed in Table 1 andthe identification obtained with the parameters in Table 2. Table 3provides the parameter space in which the optimal solutions aresearched. The tensile responses of the single Nitinol wire, observedin Fig. 11(a), are typical of superelastic materials, which are welldocumented in the literature. Near the origin, the response is elastic;the Nitinol wire goes back through the elastic branch to the un-deformed shape when the austenitic transformation takes placebecause of the removal of the tensile load.
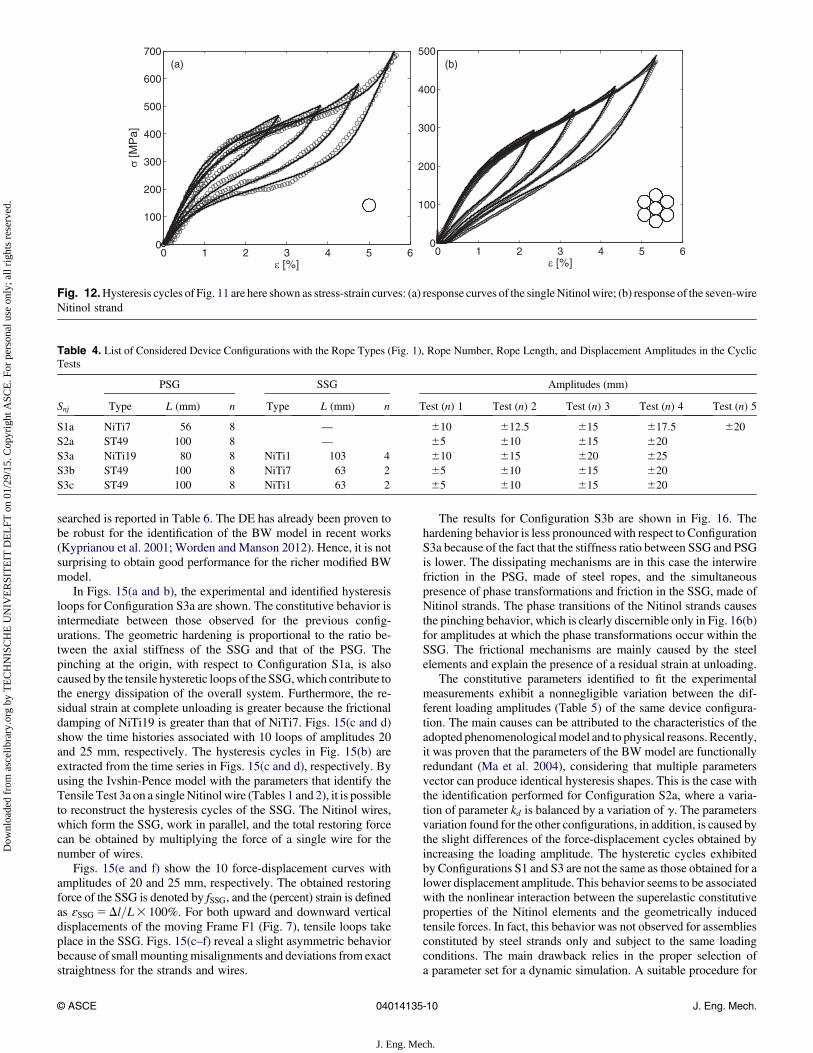
The responses of the seven-wire strand [Fig. 11(b)] present someinteresting features. The interwire friction determines a less pro-nounced variation in the tangent stiffness, and the effects of thefrictional dissipation can be observed through the presence ofa nonzero strain when the load is removed. To give an idea about thestress behavior of the material, the hysteresis tensile cycles of thesingle Nitinol wire and the seven-wire Nitinol strand are given asstress-strain curves in Fig. 12. The stress is obtained by dividing theforce by the cross-sectional area. The lower stress reached by theseven-wire strand with respect to the single wire at the same strainlevel is caused by thewire geometry forming the strand. In fact, whena certain displacement is applied to one end of the strand, its pitch
Fig. 10. Layout of the tensile cyclic tests on the Nitinol wires andstrands (image by Biagio Carboni)
Table 1. List of the Tests for the Single-Wire and the Seven-Wire Strands
Test (n) Du (mm) ɛ (%)
Single-wire strand
1 7.15 2.802 9.65 3.783 12.11 4.754 14.43 5.66
Seven-wire strand
1 4.00 2.352 5.7 3.353 8.05 4.354 9.01 5.35
Table 2. Parameters of the Ivshin-Pence Model That Give the Best Fit forthe Tensile Tests Listed in Table 1
Test (n) K (kN=mm) jr ~q1 ~q2 ~q3 l MSE (%)
Single-wire strand
1 0.124 0.200 1.712 0.465 0.950 5.0 0.8302 0.114 0.200 1.745 0.468 0.950 5.0 0.8703 0.103 0.200 1.547 0.454 0.950 3.5 0.7374 0.105 0.093 1.623 0.304 0.945 4.3 0.754
Seven-wire strand
1 0.542 0.167 1.759 0.270 0.692 4.0 0.5732 0.473 0.194 1.559 0.270 0.793 2.1 0.4273 0.506 0.196 1.613 0.250 0.894 2.9 0.3944 0.526 0.188 1.677 0.250 0.885 3.5 0.667
Note: Parameters xms, ~q, and J are all set to 1.
© ASCE 04014135-8 J. Eng. Mech.
J. Eng. Mech.
Dow
nloa
ded
from
asc
elib
rary
.org
by
TE
CH
NIS
CH
E U
NIV
ER
SIT
EIT
DE
LFT
on
01/2
9/15
. Cop
yrig
ht A
SCE
. For
per
sona
l use
onl
y; a
ll ri
ghts
res
erve
d.

length is increased. Moreover, the interwire sliding generates fric-tional forces. This geometric effect is such that the strand exhibitsa lower restoring force per unit area than the straight wire at the samelevel of elongation.
Cyclic Tests for the Strands Assembliesand Identification
The multiconfiguration rheological device can exhibit three distinctconfigurations referred to as S1, S2, and S3, respectively. The rhe-ological properties of the device ensue from the combination of thefollowing elements (Fig. 1): a Nitinol wire with a diameter equal to0.6 mm (NiTi1); a Nitinol strand formed by sevenwires (11 6) witha diameter equal to 1.8 mm (NiTi7); a Nitinol strand formed by 19wires (11 61 12) with a diameter equal to 3.0 mm (NiTi19); andsteel wire rope formed by 11 6 strands, eachmade of 11 6wires fora total number of 49 wires and a diameter equal to 6.0 mm (ST49).
The investigated assemblies are reported in Table 4. The notationSnj indicates the jth variant of the nth configuration of the device. Thetests consist of several cycles of vertical displacements in which therestoring force of the strand assemblies is measured. The sinusoidaldisplacements are xðtÞ5AsinðvtÞ, where t denotes time in seconds,A is the amplitude in millimeters, reported for each test in Table 4,and v is equal to 0:418 rad=s (i.e., 0.066 Hz). For ConfigurationS3a, the time history of the horizontal distance between Bars b2 ismeasured bymeans of a displacement transducer shown in Fig. 7(a).The expression of the restoring force adopted for the identification ofS1a, S3a, S3b, and S3c is
f ¼ ð12 rÞk3x3 þ rðkexþ zÞ (15)
where the hysteretic force z is governed by Eq. (4); and r 2 ½0, 1�5 weighting parameter. The restoring force assumed for theidentification of Assembly S2a is obtained using Eq. (15), with
r5 1, inwhich the hysteretic force z is governed by the evolution lawof the BW model given by Eq. (1). For each amplitude, 10 ex-perimental cycles are obtained, out of which one of the stabilizedcycles is extracted and identified. The number of vectors forming thepopulation of the DE algorithm is 40, whereas the number ofiterations is 150 for the tests in Table 4. In Fig. 13, the hystereticcycles for Configuration S1a and the associated identifications areshown for different displacement amplitudes. The constitutive be-havior is characterized by a strong hardening and a distinct pinchingat the origin. Thefirst is caused by the geometric stretching effect thatoriginates in the strand from having locked the horizontal dis-placement of b2 (Fig. 7). During the tests, the bars cannot approachthe vertically moving Frame F1; thus, a tensile load is generated inthe PSG (see S1 in Fig. 8). The Nitinol strands are subjected toa tension-bending state of stress. This stress state determines thephase transitions in the individual Nitinol wires. The pinchingis caused by the return to the austenitic phase toward the end ofthe unloading branches. This behavior is typical for SMAs, whichundergo unloading on the elastic branches when the austenitictransformation takes place. However, the energy dissipation causedby friction between the wires of the strands determines the presenceof a small residual strain in the fully unloaded state. The simulta-neous presence of geometric hardening, phase transitions, andinterwire friction leads to an essentially nonlinear hysteresis. Withinthe large displacement range investigated, the linear stiffness of thedevice is negligible. Identification is performed with very highaccuracy by using the extendedBWmodel that is proposed here. Thepinching ensuing from the concurrence of the nonlinear constitutivefeatures described previously can be well described by controllingthe pinching severity and the extension of the pinched region aroundthe origin. These features have a direct relation with the twoparameters of the pinching function in the extended BW model andare very sensitive to the type and length of the PSG.
The results for Configuration S2a are shown in Fig. 14. The typeof hysteresis is quasi-linear for two reasons: the allowed horizontalsliding of the bars during the vertical displacement cycles (see S2 inFig. 8) entails that the steel wires ropes are subject only to bendingand the energy dissipation is solely caused by interwire friction. Thisis the classical behavior of short steel ropes, which is well docu-mented in the literature (Carpineto et al. 2014). The MSE decreasesvery rapidly [Fig. 14(b)], and after 150 iterations, good identification(see the MSE of Table 5) is obtained at a relatively low computa-tional cost. The parameters space in which the optimal values are
Fig. 11. Hysteresis cycles obtained in the tensile tests are denoted by the circles, whereas the solid lines represent the best fitting obtained with theIvshin-Pence model: (a) response curves of the single Nitinol wire; (b) response of the seven-wire Nitinol strand
Table 3. Parameter Space of the Ivshin-PenceModel inWhich theOptimalValues Reported in Table 2 Are Selected
Test (n) K (kN=mm) jr ~q1 ~q2 ~q3 l
Minimum 0.05 0.01 1.05 0.25 0.25 1Maximum 1 0.200 1.9 0.8 0.95 8
© ASCE 04014135-9 J. Eng. Mech.
J. Eng. Mech.
Dow
nloa
ded
from
asc
elib
rary
.org
by
TE
CH
NIS
CH
E U
NIV
ER
SIT
EIT
DE
LFT
on
01/2
9/15
. Cop
yrig
ht A
SCE
. For
per
sona
l use
onl
y; a
ll ri
ghts
res
erve
d.
searched is reported in Table 6. The DE has already been proven tobe robust for the identification of the BW model in recent works(Kyprianou et al. 2001; Worden and Manson 2012). Hence, it is notsurprising to obtain good performance for the richer modified BWmodel.
In Figs. 15(a and b), the experimental and identified hysteresisloops for Configuration S3a are shown. The constitutive behavior isintermediate between those observed for the previous config-urations. The geometric hardening is proportional to the ratio be-tween the axial stiffness of the SSG and that of the PSG. Thepinching at the origin, with respect to Configuration S1a, is alsocaused by the tensile hysteretic loops of the SSG,which contribute tothe energy dissipation of the overall system. Furthermore, the re-sidual strain at complete unloading is greater because the frictionaldamping of NiTi19 is greater than that of NiTi7. Figs. 15(c and d)show the time histories associated with 10 loops of amplitudes 20and 25 mm, respectively. The hysteresis cycles in Fig. 15(b) areextracted from the time series in Figs. 15(c and d), respectively. Byusing the Ivshin-Pence model with the parameters that identify theTensile Test 3a on a singleNitinolwire (Tables 1 and 2), it is possibleto reconstruct the hysteresis cycles of the SSG. The Nitinol wires,which form the SSG, work in parallel, and the total restoring forcecan be obtained by multiplying the force of a single wire for thenumber of wires.
Figs. 15(e and f) show the 10 force-displacement curves withamplitudes of 20 and 25 mm, respectively. The obtained restoringforce of the SSG is denoted by fSSG, and the (percent) strain is definedas ɛSSG 5Dl=L3 100%. For both upward and downward verticaldisplacements of the moving Frame F1 (Fig. 7), tensile loops takeplace in the SSG. Figs. 15(c–f) reveal a slight asymmetric behaviorbecause of small mountingmisalignments and deviations from exactstraightness for the strands and wires.
The results for Configuration S3b are shown in Fig. 16. Thehardening behavior is less pronouncedwith respect to ConfigurationS3a because of the fact that the stiffness ratio between SSG and PSGis lower. The dissipating mechanisms are in this case the interwirefriction in the PSG, made of steel ropes, and the simultaneouspresence of phase transformations and friction in the SSG, made ofNitinol strands. The phase transitions of the Nitinol strands causesthe pinching behavior, which is clearly discernible only in Fig. 16(b)for amplitudes at which the phase transformations occur within theSSG. The frictional mechanisms are mainly caused by the steelelements and explain the presence of a residual strain at unloading.
The constitutive parameters identified to fit the experimentalmeasurements exhibit a nonnegligible variation between the dif-ferent loading amplitudes (Table 5) of the same device configura-tion. The main causes can be attributed to the characteristics of theadopted phenomenologicalmodel and to physical reasons. Recently,it was proven that the parameters of the BW model are functionallyredundant (Ma et al. 2004), considering that multiple parametersvector can produce identical hysteresis shapes. This is the case withthe identification performed for Configuration S2a, where a varia-tion of parameter kd is balanced by a variation of g. The parametersvariation found for the other configurations, in addition, is caused bythe slight differences of the force-displacement cycles obtained byincreasing the loading amplitude. The hysteretic cycles exhibitedby Configurations S1 and S3 are not the same as those obtained for alower displacement amplitude. This behavior seems to be associatedwith the nonlinear interaction between the superelastic constitutiveproperties of the Nitinol elements and the geometrically inducedtensile forces. In fact, this behavior was not observed for assembliesconstituted by steel strands only and subject to the same loadingconditions. The main drawback relies in the proper selection ofa parameter set for a dynamic simulation. A suitable procedure for
Fig. 12.Hysteresis cycles of Fig. 11 are here shown as stress-strain curves: (a) response curves of the singleNitinol wire; (b) response of the seven-wireNitinol strand
Table 4. List of Considered Device Configurations with the Rope Types (Fig. 1), Rope Number, Rope Length, and Displacement Amplitudes in the CyclicTests
PSG SSG Amplitudes (mm)
Snj Type L (mm) n Type L (mm) n Test (n) 1 Test (n) 2 Test (n) 3 Test (n) 4 Test (n) 5
S1a NiTi7 56 8 — 610 612:5 615 617:5 620S2a ST49 100 8 — 65 610 615 620S3a NiTi19 80 8 NiTi1 103 4 610 615 620 625S3b ST49 100 8 NiTi7 63 2 65 610 615 620S3c ST49 100 8 NiTi1 63 2 65 610 615 620
© ASCE 04014135-10 J. Eng. Mech.
J. Eng. Mech.
Dow
nloa
ded
from
asc
elib
rary
.org
by
TE
CH
NIS
CH
E U
NIV
ER
SIT
EIT
DE
LFT
on
01/2
9/15
. Cop
yrig
ht A
SCE
. For
per
sona
l use
onl
y; a
ll ri
ghts
res
erve
d.

choosing the parameter set could be a preliminary investigation ofthe dynamic systemfinalized to evaluate themaximumdisplacementamplitude achieved by the device. Then the assumed parameter setcan be that identified using a force-displacement cycle with a suit-ably defined average displacement amplitude. Another possibilitycould be the DE-driven identification of the parameter set thatdetermines the lowest MSE for several force-displacement cycles atdifferent amplitudes.
Finally, inFig. 17, the hysteresis cycles for Configuration S3c areshown. The stiffness ratio between SSG and PSG is lower than in theprevious configuration because the SSG in now constituted by onlytwo Nitinol wires. The pinching is less evident because the energydissipated by the SMA transformations is small.
Conclusions
A multiconfiguration rheological device made of an assembly ofNitinol wires, strands, and steel wire ropes is presented. The con-currence of interwire friction, phase transformations in the Nitinol
parts, and geometric nonlinearities gives rise to several types ofhysteresis as shown by the distinctly different shapes of the obtainedforce-displacement cycles. By different wire ropes arrangements andinternal constraints, quasi-linear–softening hysteresis, strongly pinchedhardening hysteresis, and slightly pinched hardening hysteresis areobtained.
A mathematical description of the pinching behavior is achievedby extending the BW model of hysteresis. The phenomenologicalmodel is obtained as a generalization of the BWmodel by introducinga two-parameter pinching function that controls the pinching se-verity and the pinching extension around the origin of the force-displacement cycles. Tensile tests on individual Nitinol wiresand strands are performed, and their constitutive identification is ob-tained through the Ivshin-Pence model. The parameter identifi-cation of the phenomenological models, for the best fit of the exper-imental measurements, is carried out via an optimization algorithmbelonging to the family of differential evolutionary algorithms. Theextended BWmodel is proven to be effective for the identification ofthe experimentally observed pinched hysteresis. Moreover, the in-vestigatedmulticonfiguration device and innovativemanufacturing of
Fig. 13. Results for Configuration S1a where hysteresis cycles are reported: (a) for the displacement amplitudes of 10 and 12.5 mm; (b) for dis-placement amplitudes of 15, 17.5, and 20 mm; the hysteresis cycles experimentally obtained are represented by the circles, whereas the solid linesrepresent the best fitting obtained with the extended BW model
Fig. 14. Experimental results for Configuration S2a: (a) hysteresis cycles in which the circles denote the experimental measurements and the solidlines represent the best fitting; (b) MSEs of the identifications where the squares, the upward-pointing triangles, the circles, and the downward-pointing triangles are related to increasingly larger displacement amplitudes
© ASCE 04014135-11 J. Eng. Mech.
J. Eng. Mech.
Dow
nloa
ded
from
asc
elib
rary
.org
by
TE
CH
NIS
CH
E U
NIV
ER
SIT
EIT
DE
LFT
on
01/2
9/15
. Cop
yrig
ht A
SCE
. For
per
sona
l use
onl
y; a
ll ri
ghts
res
erve
d.

the Nitinol strands offer new possibilities in designing hystereticconstitutive behaviors targeted to various applications. One of thefields inwhich the results of this study can be directly applied is that ofpassive or semiactive nonlinear vibration control.
Appendix. Ivshine-Pence Model
A SMA element in a uniaxial state of stress is assumed to have thefollowing free energy:
F ¼ K2½x2 sgnðxÞdjm�2 þ c
�q2q02q ln
q
q0
�
þ ðq2q0Þbdj þ a02 b0q (16)
where K 5 elastic stiffness; d. 0 5 maximum transformationdisplacement; and jm 2 ½0, 1�5 martensitic fraction; thus, in a fullyaustenitic state, jm 5 0, and in a fully martensitic state, jm 5 1.Moreover, c5 heat capacity; q and q0 5 temperature of the SMAelement and the equilibrium temperature in the austenitic phase,
respectively; b 5 slope in the force-temperature transformationplane; and a0 and b0 5 internal energy at a reference temperatureqr.Differentiating Eq. (16) with respect to the kinematic variable xyields the restoring force f as
f ¼ K½x2 sgnðxÞdjm� (17)
while differentiatingEq. (16) with respect to the temperatureq givesthe entropy. The evolution of the phase transition is regulated by theso-called driving force
P ¼ Kdðjxj2 djmÞ2 bdðq2q0Þ (18)
obtainedbydifferentiatingEq. (16) with respect to jm. The referencedisplacements are the martensitic start displacement xms5 xðjm 5 0Þand the maximum recoverable displacement xms 1 d5 xðjm 5 1Þ.The martensitic start force when x5 xms is fms 5Kxms. The otherreference forces are the martenstic finish force fmf , the austeniticstart force fas, and the austenitic finish force faf . These referenceforces are measured at the reference temperature qr . The model
Table 5. Results of the Constitutive Identification Carried Out in Various Cyclic Tests for the Different Device Configurations
Snj Amplitude (mm) k3 (kN=mm3) ke (kN=mm) kd (kN=mm) g (kN2n11=mm) b (kN2n11=mm) n j xc (mm2) r MSE (%)
610 6:8543 1024 0.010 1.00 0.591 0.501 1.0 0.99 215.57 0.217 0.759612:5 5:3933 1024 0.010 1.00 0.400 0.497 1.0 0.99 155.95 0.181 0.620
S1a 615 4:6113 1024 0.010 1.00 0.400 0.349 1.0 0.99 277.72 0.251 0.634617:5 3:7583 1024 0.010 1.00 0.400 0.268 1.0 0.99 319.83 0.325 0.968620 3:0933 1024 0.010 1.00 0.400 0.332 1.0 0.99 339.73 0.350 0.56065 — 6:3643 1023 0.19 0.500 0.845 1.0 — — — 0.082610 — 5:6603 1023 0.021 0.500 0.758 1.0 — — — 0.103
S2a 615 — 5:2503 1023 0.020 0.500 0.544 1.0 — — — 0.178620 — 5:2403 1023 0.025 0.500 0.647 1.0 — — — 0.136610 9:0003 1025 0.027 0.073 0.500 1.496 1.1 0.72 50.00 0.226 0.324615 7:8253 1025 0.014 0.086 0.573 1.500 1.0 0.890 50 0.444 0.341
S3a 620 4:6473 1025 0.017 0.163 0.878 1.441 1.1 0.896 78.81 0.308 0.552625 4:6693 1025 0.005 0.259 0.525 0.637 1.0 0.90 335.41 0.320 0.926610 1:4193 1025 0.082 0.238 0.150 1.039 1.02 0.24 10.00 0.092 0.192615 9:1363 1025 0.048 0.800 1.500 1.244 1.45 0.672 350 0.100 0.090
S3b 620 9:9783 1025 0.013 0.460 1.204 1.219 1.1 0.755 234.33 0.321 0.079625 6:6733 1025 0.010 0.755 0.767 1.454 1.2 0.893 350.00 0.252 0.105610 4:0413 1024 0.010 0.029 0.163 1.500 1.071 0.204 72.62 0.816 0.075615 1:6383 1024 0.010 0.034 0,334 1.288 1.118 0.208 57.37 0.739 0.105
S3c 620 1:0813 1024 0.010 0.035 0.150 0.901 1.0 0.316 10.00 0.791 0.104625 5:2043 1025 0.010 0.139 1.411 0.779 1.05 0.500 457.57 0.650 0.072
Table 6. Parameter Space in Which the Optimal Values Reported in Table 5 Are Selected
Snj Range k3 (kN=mm3) ke (kN=mm) kd (kN=mm) g (kN2n11=mm) b (kN2n11=mm) n j xc (mm2) r
Minimum 13 1025 0.02 0.02 0.25 0.25 1.0 0.01 50 0S1a Maximum 13 1023 1.0 1.0 1.5 1.5 2 0.99 500 1.0
Minimum — 13 1024 0.01 0.5 0.5 1.0 — — —
S2a Maximum — 13 1022 0.5 1.5 1.5 1.0 — — —
Minimum 13 1026 0.02 0.02 0.2500 0.25 1.0 0.01 50.00 0S3a Maximum 13 1024 1 1 1.5 1.500 2 0.99 500 1
Minimum 13 1026 0.02 0.02 0.2500 0.25 1.0 0.01 50.00 0S3b Maximum 13 1024 1 1 1.5 1.500 2 0.99 500 1
Minimum 13 1026 0.02 0.02 0.2500 0.25 1.0 0.01 50.00 0S3c Maximum 13 1024 1 1 1.5 1.500 2 0.99 500 1
© ASCE 04014135-12 J. Eng. Mech.
J. Eng. Mech.
Dow
nloa
ded
from
asc
elib
rary
.org
by
TE
CH
NIS
CH
E U
NIV
ER
SIT
EIT
DE
LFT
on
01/2
9/15
. Cop
yrig
ht A
SCE
. For
per
sona
l use
onl
y; a
ll ri
ghts
res
erve
d.

is made nondimensional by introducing the following non-dimensional variables and parameters:
~x ¼ xxms
, l ¼ d
xms, ~q ¼ q
qr, ~q0 ¼ q0
qr, J ¼ fms
bqr(19)
The ensuing nondimensional driving force and the equilibriumtemperature become
~P ¼ P
bqrd¼ Jðj~xj2 ljÞ2 �
~q2 ~q0
(20)
~q0 ¼ 12 J�1þ ~q1 þ ~q3 þ ~q2~q3
4 (21)
where ~q1 5 fmf =fms; ~q2 5 faf =fas; and ~q3 5 fas=fms. In our experi-ments, isothermal conditions are ensured; hence, _q5 0, where the
Fig. 15. Experimental results for Configuration S3a where hysteresis cycles are reported: (a) for displacement amplitudes of 10 and 15 mm; (b) fordisplacement amplitudes of 20 and 25mm (circles denote experimental measurements and solid lines represent best fit); (c) and (d) report time historiesof restoring force f (dashed line), displacement x (dashed-dotted line), and length increment dl (solid line) of the SSG for the displacement amplitudeof 20 and 25 mm, respectively; (e) and (f) show hysteresis tensile cycles of the SSG obtained with the Ivshin-Pence model associated to the timehistories of (c) and (d), respectively
© ASCE 04014135-13 J. Eng. Mech.
J. Eng. Mech.
Dow
nloa
ded
from
asc
elib
rary
.org
by
TE
CH
NIS
CH
E U
NIV
ER
SIT
EIT
DE
LFT
on
01/2
9/15
. Cop
yrig
ht A
SCE
. For
per
sona
l use
onl
y; a
ll ri
ghts
res
erve
d.

overdot denotes differentiation with respect to time. Thus, theevolution law of the internal variable reads
_jm ¼ 2JZ1sgnð~xÞ _~x (22)
where
Z1 ¼ ~G
1þ Jl~G(23)
and ~G indicates the nondimensional hysteresis operator given by
~G :¼8<:
~k1ð12 jÞh1þ tanh ~k1 ~Pþ ~k2
� iif _j. 0
~k3jh12 tanh ~k3 ~Pþ ~k4
� iif _j, 0
The nondimensional stiffness terms have the following expressions:
~k1 ¼ 2sJð~q12 1Þ,
~k2 ¼2�12 ~q0
2 Jð~q1 þ 1Þ
Jð~q12 1Þ s,
~k3 ¼ 2sð12 ~q2Þ~q3J
(24)
where s5 tanh21ð12 2jsÞ; and js 5 residual martensitic fractionat the conventional starting of the transformation.
Acknowledgments
This work was partially supported by the Italian Ministry of Edu-cation, University and Scientific Research (2010-2011 PRIN GrantNo. 2010BFXRHS-002). Dr. Carlo Spreafico from Intra.flex isgratefully acknowledged for mastering the new manufacturing pro-cess of the Nitinol strands.
References
Abaqus 6.11, Providence, RI, SIMULIA.Auricchio, F., and Petrini, L. (2004). “A three-dimensional model describ-
ing stress-temperature induced solid phase transformations: Solutionalgorithm and boundary value problems.” Int. J. Numer. Methods Eng.,61(6), 807–836.
Auricchio, F., Taylor, R. L., and Lubliner, J. (1997). “Shape-memory alloys:Macromodelling and numerical simulations of the superelastic behav-ior.” Comput. Meth. Appl. Mech. Eng., 146(3–4), 281–312.
Baber, T. T., and Noori, M. N. (1985). “Random vibration of degrading,pinching systems.” J. Eng. Mech., 10.1061/(ASCE)0733-9399(1985)111:8(1010), 1010–1026.
Baber, T. T., and Noori, M. N. (1986). “Modeling general hysteresis behaviorand random vibration application.” J. Vib. Acoust., 108(4), 411–420.
Baber, T. T., and Wen, Y.-K. (1981). “Random vibration hysteretic,degrading systems.” J. Engrg. Mech. Div., 107(6), 1069–1087.
Fig. 16. Experimental results for Configuration S3b where hysteresis cycles are reported: (a) for displacement amplitudes of 5 and 10 mm; (b) for dis-placement amplitudes of 15 and 20mm; circles denote experimental measurements and solid lines represent best fit obtainedwith the modified BWmodel
Fig. 17. Experimental results for Configuration S3c S3b where hysteresis cycles are reported: (a) for displacement amplitudes of 5 and 10 mm; (b) fordisplacement amplitudesof15 and20mm; circles denote experimentalmeasurements and solid lines represent bestfit obtainedwith themodifiedBWmodel
© ASCE 04014135-14 J. Eng. Mech.
J. Eng. Mech.
Dow
nloa
ded
from
asc
elib
rary
.org
by
TE
CH
NIS
CH
E U
NIV
ER
SIT
EIT
DE
LFT
on
01/2
9/15
. Cop
yrig
ht A
SCE
. For
per
sona
l use
onl
y; a
ll ri
ghts
res
erve
d.

Bellouard,Y., andClavel, R. (2004). “Shapememory alloyflexures.”Mater.Sci. Eng., A, 378(1–2), 210–215.
Beltran, J. F., Cruz, C., Herrera, R., andMoroni, O. (2011). “Shape memoryalloy CuAlBe strands subjected to cyclic axial loads.” Eng. Struct.,33(10), 2910–2918.
Bernardini, D., and Pence, T. J. (2002). “Shape-memory materials, mod-eling.” Encyclopedia of smart materials, John Wiley and Sons, NewYork.
Bouc, R. (1967). “Forced vibration of mechanical systems with hysteresis.”Proc., 4th Conf. on Non-Linear Oscillation Prague, Czechoslovakia,315.
Buehler, W. J., Gilfrich, J. V., and Wiley, R. C. (1963). “Effect of low-temperature phase changes on the mechanical properties of alloys nearcomposition TiNi.” J. Appl. Phys., 34(5), 1475–1477.
Carpineto, N., Lacarbonara, W., and Vestroni, F. (2014). “Hysteretic tunedmass dampers for structural vibration mitigation.” J. Sound Vib., 333(5),1302–1318.
Chakraborty, U. K., et al. (2008). Advances in differential evolution,Springer, New York.
Costello, G. A. (1990). Theory of wire rope, Springer, New York.Demetriades, G. F., Constantinou, M. C., and Reinhorn, A. M. (1993).
“Study of wire rope systems for seismic protection of equipment inbuildings.” Eng. Struct., 15(5), 321–334.
Dolce, M., and Cardone, D. (2001a). “Mechanical behaviour of shapememory alloys for seismic applications 1. Martensite and austenite NiTibars subjected to torsion.” Int. J. Mech. Sci., 43(11), 2631–2656.
Dolce, M., and Cardone, D. (2001b). “Mechanical behaviour of shapememory alloys for seismic applications 2.AusteniteNiTiwires subjectedto tension.” Int. J. Mech. Sci., 43(11), 2657–2677.
Dolce, M., Cardone, D., and Marnetto, R. (2000). “Implementation andtesting of passive control devices based on shape memory alloys.”Earthquake Eng. Struct. Dyn., 29(7), 945–968.
Feoktistov, V. (2006). Differential evolution, Springer, New York.Foliente, G. C. (1995). “Hysteresis modeling of wood joints and structural
systems.” J. Struct. Eng., 10.1061/(ASCE)0733-9445(1995)121:6(1013),1013–1022.
Gandhi, F., and Chapuis, G. (2002). “Passive damping augmentation ofa vibrating beam using pseudoelastic shape memory alloy wires.” J.Sound Vib., 250(3), 519–539.
Gerges, R. R. (2008). “Model for the force–displacement relationship ofwire rope springs.” J. Aerosp. Eng., 10.1061/(ASCE)0893-1321(2008)21:1(1), 1–9.
Gerges, R. R., and Vickery, B. (2003a). “Wind tunnel study of the across-wind response of a slender tower with a nonlinear tuned mass damper.”J. Wind Eng. Ind. Aerodyn., 91(8), 1069–1092.
Gerges, R. R., andVickery, B. J. (2003b). “Parametric experimental study ofwire rope spring tuned mass dampers.” J. Wind Eng. Ind. Aerodyn.,91(12–15), 1363–1385.
Graesser, E. J., and Cozzarelli, F. A. (1991). “Shape-memory alloys as newmaterials for aseismic isolation.” J. Eng. Mech., 10.1061/(ASCE)0733-9399(1991)117:11(2590), 2590–2608.
Han, Y. L., Li, Q. S., Li, A. Q., Leung, A. Y. T., and Lin, P. H. (2003).“Structural vibration control by shape memory alloy damper.” Earth-quake Eng. Struct. Dyn., 32(3), 483–494.
Heinonen, J., Vessonen, I., Klinge, P., and Järvinen, E. (2008). “Controllingstiffness of a frame spring by changing the boundary condition with ansma actuator.” Comput. Struct., 86(3), 398–406.
Intrater, J., Chang, L. C., and Read, T. A. (1952). “Influence of stress on thetemperature of the diffusionless transformation in au-cd single crystals.”Physical Review, Vol. 86, 598.
Ivshin, Y., and Pence, T. J. (1994). “A thermomechanicalmodel for a one variantshape memory material.” J. Intell. Mater. Syst. Struct., 5(4), 455–473.
Kerschen, G., Worden, K., Vakakis, A. F., and Golinval, J. C. (2006). “Past,present and future of nonlinear system identification in structural dy-namics.” Mech. Syst. Sig. Process., 20(3), 505–592.
Klou�cek, P., and Reynolds, D. R. (2006). “On the modeling and compu-tations of nonlinear thermodynamics in smawires.”Comput.Meth. Appl.Mech. Eng., 196(1), 180–191.
Ko, J. M., Ni, Y. Q., and Tian, Q. L. (1992). “Hysteretic behavior andemperical modeling of a wire-cable vibration isolator,” Int. J. Anal.Exp. Modal Anal., 7(2), 111–127.
Koh, C. G., Chen, Y. F., and Liaw, C. Y. (2003). “A hybrid computationalstrategy for identification of structural parameters.” Comput. Struct.,81(2), 107–117.
Kyprianou, A., Worden, K., and Panet, M. (2001). “Identification of hys-teretic systems using the differential evolution algorithm.” J. Sound Vib.,248(2), 289–314.
Lacarbonara, W., Bernardini, D., and Vestroni, F. (2004). “Nonlinearthermomechanical oscillations of shape-memory devices.” Int. J. SolidsStruct., 41(5–6), 1209–1234.
Lacarbonara, W., and Vestroni, F. (2003). “Nonclassical responses ofoscillators with hysteresis.” Nonlinear Dyn., 32(3), 235–258.
Ma, F., Bockstedte, A., Foliente, G. C., Paevere, P., and Zhang, H. (2004).“Parameter analysis of the differential model of hysteresis.” J. Appl.Mech., 71(3), 342–349.
Ma, F., Ng, C. H., and Ajavakom, N. (2006). “On system identification andresponse prediction of degrading structures.” Struct. Control HealthMonit., 13(1), 347–364.
Ma, H., and Cho, C. (2008). “Feasibility study on a superelastic SMA damperwith re-centring capability.” Mater. Sci. Eng., A, 473(1–2), 290–296.
Ma, H., and Yam,M. C. H. (2011). “Modelling of a self-centring damper andits application in structural control.” J. Constr. Steel Res., 67(4), 656–666.
Masuda, A., and Noori, M. (2002). “Optimization of hysteretic character-istics of damping devices based on pseudoelastic shape memory alloys.”Int. J. Non Linear. Mech., 37(8), 1375–1386.
Moroni, M. O., Saldivia, R., Sarrazin, M., and Sepúlveda, A. (2002).“Damping characteristics of a CuZnAlNi shape memory alloy.” Mater.Sci. Eng., A, 335(1–2), 313–319.
Motahari, S. A., Ghassemieh, M., and Abolmaali, S. A. (2007). “Imple-mentation of shape memory alloy dampers for passive control ofstructures subjected to seismic excitations.” J. Constr. Steel Res., 63(12),1570–1579.
Nemat-Nasser, S., andGuo,W.G. (2006). “Superelastic and cyclic responseof NiTi SMA at various strain rates and temperatures.” Mech. Mater.,38(5–6), 463–474.
Ni, Y. Q., Ko, J. M., Wong, C. W., and Zhan, S. (1999a). “Modelling andidentification of a wire-cable vibration isolator via a cyclic loading test.”J. Syst. Control Eng., 213(3), 163–172.
Ni, Y. Q., Koh, J. M., Wong, C. W., and Zhan, S. (1999b). “Modelling andidentification of a wire-cable vibration isolator via a cyclic loading test.Pt. 2: Identification and response prediction.” J. Syst. Control Eng.,213(3), 163–182.
Otsuka, K., and Wayman, C. M. (1999). Shape memory materials, Cam-bridge University Press, Cambridge, U.K.
Price, K., Storn, R.M., and Lampinen, J. A. (2006).Differential evolution: Apractical approach to global optimization, Springer, New York.
Quaranta, G., Monti, G., and Marano, G. C. (2010). “Parameters identifi-cation of Van der Pol–Duffing oscillators via particle swarm optimi-zation and differential evolution.” Mech. Syst. Sig. Process., 24(7),2076–2095.
Reedlunn, B., Daly, S., and Shaw, J. (2013a). “Superelastic shape memoryalloy cables: Part I—Isothermal tension experiments.” Int. J. SolidsStruct., 50(20–21), 3009–3026.
Reedlunn, B., Daly, S., and Shaw, J. (2013b). “Superelastic shape memoryalloy cables: Part II—Subcomponent isothermal responses.” Int. J.Solids Struct., 50(20–21), 3027–3044.
Rustighi, E., Brennan, M. J., and Mace, B. R. (2005). “Real-time control ofa shape memory alloy adaptive tuned vibration absorber.” Smart Mater.Struct., 14(6), 1184.
Sauter, D., and Hagedorn, P. (2002). “On the hysteresis of wire cables inStockbridge dampers.” Int. J. Non Linear Mech., 37(8), 1453–1459.
Sharabash, A. M., and Andrawes, B. O. (2009). “Application of shapememory alloy dampers in the seismic control of cable-stayed bridges.”Eng. Struct., 31(2), 607–616.
Sireteanu, T., Giuclea, M., and Mitu, A. M. (2010). “Identification of anextended Bouc–Wen model with application to seismic protectionthrough hysteretic devices.” Comput. Mech., 45(5), 431–441.
© ASCE 04014135-15 J. Eng. Mech.
J. Eng. Mech.
Dow
nloa
ded
from
asc
elib
rary
.org
by
TE
CH
NIS
CH
E U
NIV
ER
SIT
EIT
DE
LFT
on
01/2
9/15
. Cop
yrig
ht A
SCE
. For
per
sona
l use
onl
y; a
ll ri
ghts
res
erve
d.

Song, G., Ma, N., and Li, H. N. (2006). “Applications of shape memoryalloys in civil structures.” Eng. Struct., 28(9), 1266–1274.
Storn, R. (1996). “On the usage of differential evolution for function op-timization.” Biennial Conf. of the North American, Fuzzy InformationProcessing Society (NAFIPS) IEEE, New York, 519–523.
Storn, R., and Price, K. (1997). “Differential evolution—A simple andefficient heuristic for global optimization over continuous spaces.”J. Global Optim., 11(4), 341–359.
Sun, W. (2011). “Seismic response control of high arch dams includingcontraction joint using nonlinear super-elastic SMA damper.” Constr.Build. Mater., 25(9), 3762–3767.
Tinker, M. L., and Cutchins, M. A. (1992). “Damping phenomena in a wirerope vibration isolation system.” J. Sound Vib., 157(1), 7–18.
Torra, V., Isalgue, A., Martorelli, F., Terriault, P., and Lovey, F. C. (2007).“Built in dampers for family homes via SMA: An ANSYS computationscheme based on mesoscopic and microscopic experimental analyses.”Eng. Struct., 29(8), 1889–1902.
Wen, Y.-K. (1976). “Method for random vibration of hysteretic systems.”J. Engrg. Mech. Div., 102(2), 249–263.
Wilde, K., Gardoni, P., and Fujino, Y. (2000). “Base isolation system withshape memory alloy device for elevated highway bridges.” Eng. Struct.,22(3), 222–229.
Williams, K. A., Chiu, G. T. C., and Bernhard, R. J. (2005). “Nonlinearcontrol of a shape memory alloy adaptive tuned vibration absorber.”J. Sound Vibrat., 288(4–5), 1131–1155.
Worden, K., and Manson, G. (2012). “On the identification of hystereticsystems. Part I: Fitness landscapes and evolutionary identification.”Mech. Syst. Sig. Process., 29, 201–212.
Zhang, Y., and Zhu, S. (2007). “A shape memory alloy-based reusablehysteretic damper for seismic hazard mitigation.” Smart Mater. Struct.,16(5), 1603.
Zuo, X. B., Chang, W., Li, A. Q., and Chen, Q. F. (2006). “Design andexperimental investigation of a superelastic SMA damper.” Mater. Sci.Eng., A, 438–440, 1150–1153.
© ASCE 04014135-16 J. Eng. Mech.
J. Eng. Mech.
Dow
nloa
ded
from
asc
elib
rary
.org
by
TE
CH
NIS
CH
E U
NIV
ER
SIT
EIT
DE
LFT
on
01/2
9/15
. Cop
yrig
ht A
SCE
. For
per
sona
l use
onl
y; a
ll ri
ghts
res
erve
d.