Embed Size (px)
Citation preview
Hypofractionated dose painting
radiotherapy for prostate
adenocarcinoma
Thesis submitted in accordance with the requirements of the University of Liverpool for
the degree of Doctor of Medicine by Joachim Kwok-Chiu Chan
Feb 2020
1
Contents
Declaration ......................................................................................... 6
Acknowledgements ............................................................................ 6
List of abbreviations ........................................................................... 7
List of Tables .................................................................................... 10
List of Figures ................................................................................... 12
Abstract............................................................................................ 16
1 Introduction.............................................................................. 18
Prostate Cancer .................................................................................................. 18
1.1.1 Epidemiology, staging and principals of treatment ........................................ 18
Imaging in prostate cancer ................................................................................. 19
1.2.1 MRI .................................................................................................................. 19
1.2.2 PET/CT ............................................................................................................. 22
1.2.3 Pelvic lymph node staging ............................................................................... 32
Hormone therapy in prostate cancer ................................................................. 33
Prostate Radiotherapy ....................................................................................... 40
1.4.1 External beam radiotherapy techniques (IMRT, IGRT) ................................... 40
1.4.2 Whole prostate dose escalation RT................................................................. 44
1.4.3 Hypofractionated RT ....................................................................................... 49
1.4.4 Dose painting RT ............................................................................................. 54
1.4.5 Pelvic lymph node radiotherapy ..................................................................... 63
Toxicity and Quality of Life scores ...................................................................... 68

2
2 Dynamic 18F choline tracer uptake on PET/CT in prostate cancer
and the effects of bicalutamide on it ................................................ 70
Introduction ....................................................................................................... 70
Aims .................................................................................................................... 71
Method ............................................................................................................... 71
2.3.1 Patients selection (inclusion and exclusion criteria) ....................................... 71
2.3.2 PET/CT ............................................................................................................. 72
2.3.3 Delineation ...................................................................................................... 73
2.3.4 Analysis ............................................................................................................ 73
Results ................................................................................................................ 74
2.4.1 TT90%P ............................................................................................................ 79
2.4.2 SUVmax .............................................................................................................. 80
2.4.3 Difference in AUC of the TAC between tumour and benign tissue ................. 81
Discussion ........................................................................................................... 82
Conclusion .......................................................................................................... 85
3 Effect of bicalutamide on prostate dose painting radiotherapy
boost volumes identified on 18F choline PET/CT ................................ 86
Introduction ....................................................................................................... 86
Aims .................................................................................................................... 86
Methods ............................................................................................................. 87
3.3.1 Study design .................................................................................................... 87
3.3.2 Patient selection (inclusion and exclusion criteria)......................................... 87
3.3.3 Imaging protocol ............................................................................................. 88
3.3.4 DIL delineation protocol .................................................................................. 89
3.3.5 Boost volume analysis ..................................................................................... 89
3
3.3.6 Statistical analysis ........................................................................................... 90
Results ................................................................................................................ 90
Discussion ........................................................................................................... 95
Conclusions ...................................................................................................... 100
4 Planning of moderately hypofractionated dose painting
radiotherapy for prostate adenocarcinoma .................................... 102
Introduction ..................................................................................................... 102
Aim ................................................................................................................... 103
Methods ........................................................................................................... 103
4.3.1 Study design .................................................................................................. 103
4.3.2 Patients selection (inclusion and exclusion criteria) ..................................... 103
4.3.3 Trial protocol ................................................................................................. 103
Results .............................................................................................................. 108
4.4.1 Identifying DILs for dose painting radiotherapy ........................................... 109
4.4.2 Planning ......................................................................................................... 110
Discussion ......................................................................................................... 115
Conclusion ........................................................................................................ 124
5 Acute toxicity of moderately hypofractionated dose painting
radiotherapy for prostate adenocarcinoma .................................... 125
Introduction ..................................................................................................... 125
Aims .................................................................................................................. 125
Methods ........................................................................................................... 126
5.3.1 Schedule ........................................................................................................ 126
5.3.2 Analysis of assessments for acute toxicity .................................................... 127
Results .............................................................................................................. 128
4
5.4.1 CTCAE v4.0..................................................................................................... 153
5.4.2 RTOG ............................................................................................................. 153
5.4.3 IPSS ................................................................................................................ 154
5.4.4 EPIC ................................................................................................................ 155
5.4.5 Performance status ....................................................................................... 156
Discussion ......................................................................................................... 156
Conclusion ........................................................................................................ 159
6 Late toxicity of moderately hypofractionated dose painting
radiotherapy for prostate adenocarcinoma .................................... 160
Introduction ..................................................................................................... 160
Aims .................................................................................................................. 160
Methods ........................................................................................................... 160
Results .............................................................................................................. 161
6.4.1 CTCAE v4.0..................................................................................................... 161
6.4.2 RTOG ............................................................................................................. 162
6.4.3 IPSS ................................................................................................................ 163
6.4.4 Performance status ....................................................................................... 164
6.4.5 Treatment outcome ...................................................................................... 164
Discussion ......................................................................................................... 182
Conclusion ........................................................................................................ 183
7 Future directions .................................................................... 184
8 References .............................................................................. 186
9 Appendix ................................................................................ 201
Risk stratification for prostate cancer (NCCN guidelines 2018) ....................... 201
5
Assessment forms ............................................................................................ 202
9.2.1 CTCAE ............................................................................................................ 202
9.2.2 RTOG ............................................................................................................. 205
9.2.3 IPSS ................................................................................................................ 206
9.2.4 IPSS QoL ......................................................................................................... 207
9.2.5 PS ................................................................................................................... 207
9.2.6 EPIC ................................................................................................................ 208
9.2.7 Publications and Presentations ..................................................................... 217

6
Declaration
I declare as sole author of this thesis that the works presented represents my personal
research conducted during my clinical research fellowship at the Clatterbridge Cancer Centre
NHS Foundation Trust between September 2014 and September 2016. This centred upon
retrospective analysis of a pilot study (with input by consultant radiologist Christopher
Romaniuk, consultant nuclear medicine Sobhan Vinjamuri and physicist Anthony Carver) and
prospective analysis of patients recruited into the BIOPROP20 study at the Clatterbridge
Cancer Centre, one of two recruiting centres (with input by physicist Martin Green).
Dr Syndikus is the chief investigator for both studies, and designed the studies, applied for
funding, and developed the radiotherapy guidelines together with the physics team (Alan
Nahum, Julian Uzan and Eva Onjukka). I and Dr Syndikus jointly recruited, performed
radiotherapy delineation, and reviewed the patients in clinic. Radiotherapy planning was
performed by radiographers and physicists (Thelma Rowntree, Laura Howard, John Brunt
and Helen Mayles). Administration for BIOPROP20 was undertaken by Liverpool Cancer
Trials Unit.
Acknowledgements
Foremost, I would like to express my sincere gratitude to my supervisor Dr Syndikus for the
tireless support and time committed to provide advice and review of my work. I would also
like to thank Prof Vinjamuri, Dr Eswar, Dr Carver and Dr Brunt for their help and expertise.
Finally, I would like to thank my family for their faith and encouragement.

7
List of abbreviations
ADC Apparent diffusion coefficient
AR Androgen receptor
AUC Area under the curve
bDFS Biochemical disease free survival
BPH Benign prostatic hypertrophy
CBCT Cone beam computed tomography
CI Confidence interval
CRT Conformal-radiotherapy
CT Computed tomography
CTV Clinical target volume
DCE Dynamic contrast enhanced
DIL Dominant intra-prostatic lesion
DRE Digital rectal examination
DVH Dose volume histogram
DWI Diffusion weighted imaging
EBRT External beam radiotherapy

8
EQD2 Equivalent dose in 2 Gy per fraction
FDG Fluorodeoxyglucose
FLA Focal laser ablation
GI Gastro-intestinal
GTV Gross tumour volume
GU Genito-urinary
HIFU High-intensity focused ultrasound
ICRU International Commission on Radiation Units and Measurements
IGRT Image guided radiotherapy
IMRT Intensity modulated radiotherapy
IRE Irreversible electroporation
MLC Multi-leaf collimator
MRI Magnetic resonance imaging
MRS Magnetic resonance spectroscopy
NCCN National Comprehensive Cancer Network
NPV Negative predictive value
OAR Organs at risk
OD Once daily

9
OS Overall survival
PDT Photodynamic therapy
PFS Progression free survival
PPV Positive predictive value
PSA Prostate specific antigen
PSMA Prostate specific membrane antigen
PTV Planning target volume
QOL Quality of life
RT Radiotherapy
SABR Stereotactic ablative body radiation therapy
SIB Simultaneous integrated boost
SUV Standardised uptake value
SUVmax Maximum standardised uptake value
SV Seminal vesicle
TAC Time activity curve
TRUS Trans-rectal ultrasound
TT90%P Time to 90% peak standardised uptake value
TURP Transurethral resection of the prostate

10
List of Tables
Table 1-1 Studies correlating 11C-choline PET and histopathology (All used PET/CT except Chang et al.
who used PET and transmission scanning) ........................................................................................... 26
Table 1-2 Sensitivity and specificity of 11C choline PET for identifying malignancy with varying SUVmax
threshold values .................................................................................................................................... 28
Table 1-3 Studies correlating 18F-choline PET and histopathology (all studies used 18F-fluorocholine
except Hartenbach et al. who used 18F fluoroethylcholine) ................................................................. 29
Table 1-4 Studies correlating both choline PET and MRI (Tesla of 1.5) with histopathology ............... 30
Table 1-5 Studies on the use of hormone therapy in radical treatment .............................................. 36
Table 1-6 Studies on the use of radiotherapy in radical treatment ...................................................... 42
Table 1-7 Studies on whole prostate dose escalation radiotherapy .................................................... 46
Table 1-8 Studies on moderately hypofractionated radiotherapy ....................................................... 51
Table 1-9 Studies on dose painting radiotherapy to prostate using EBRT ........................................... 60
Table 1-10 Randomised studies on prostate and pelvic radiotherapy with conventional dose
fractionation ......................................................................................................................................... 65
Table 1-11 Studies on prostate and pelvic radiotherapy with hypofractionation ................................ 66
Table 2-1 Patient demographics ........................................................................................................... 75
Table 2-2 Tumour volume as a percentage of the whole prostatic volume ......................................... 75
Table 2-3 Time to 90% peak (TT90%P) in minutes................................................................................ 80
Table 2-4 SUVmax.................................................................................................................................... 81
Table 2-5 Relative difference in AUC between tumour and benign tissue ........................................... 82
Table 3-1 Patient demographics ........................................................................................................... 91
Table 3-2 Prostate and boost volumes ................................................................................................. 92
Table 3-3 Number of DILs identified ..................................................................................................... 93

11
Table 3-4 Comparison of correlation between prostate volumes and boost volumes (with 5 mm
margin) .................................................................................................................................................. 94
Table 4-1 CTV and PTV definition and radiotherapy planning aim objectives ................................... 105
Table 4-2 OAR dose constraints .......................................................................................................... 107
Table 4-3 Patient demographics ......................................................................................................... 109
Table 4-4 PTV reported doses ............................................................................................................. 111
Table 4-5 OAR reported doses ............................................................................................................ 113
Table 4-6 Margins used in previous prostate +/- pelvic dose painting studies .................................. 117
Table 5-1 Statistical comparisons of symptom scores between registration and week 18, and between
week 1 and week 18 ........................................................................................................................... 151
Table 5-2 Performance status (PS) within the prostate only radiotherapy group (to week 18) ........ 152
Table 5-3 Performance status (PS) within the prostate and lymph node radiotherapy group (to week
18) ....................................................................................................................................................... 152
Table 6-1 Performance status (PS) within the prostate only radiotherapy group (to month 24) ...... 179
Table 6-2 Performance status (PS) within the prostate and lymph node radiotherapy group (to month
24) ....................................................................................................................................................... 180
12
List of Figures
Figure 2-1 TACs of tumour (A) and benign prostatic tissue (B) for all patients without bicalutamide as
defined by visual method ..................................................................................................................... 76
Figure 2-2 Example of TACs for a patient who had imaging without bicalutamide, with tumour
identified by the threshold method (A) and by the visual method (B) ................................................. 77
Figure 2-3 Example of TACs for a patient who had imaging with bicalutamide, with tumour identified
by the threshold method (A) and by the visual method (B) ................................................................. 78
Figure 3-1 Diagram of the sequences of imaging for the ‘With Bicalutamide’ and the ‘Without
Bicalutamide’ groups ............................................................................................................................ 88
Figure 3-2 Example of a patient who had PET/CT with bicalutamide (left). No DIL could be identified
visually. T2 MRI (right) for comparison. ................................................................................................ 96
Figure 3-3 Example of a patient who had PET/CT (left) with bicalutamide. The DIL identified visually by
PET is smaller than the corresponding DIL identified by MRI (right). ................................................... 96
Figure 3-4 Example of a patient who had PET/CT (left) without bicalutamide. The DIL identified visually
on PET overlaps the corresponding DIL identified on MRI (right). ....................................................... 97
Figure 3-5 Distribution of DSC values between (A) MRI and visual PET, (B) MRI and threshold PET (the
red line depicts the maximum DSC achievable with the given size differences between the MRI and
PET boost volumes) ............................................................................................................................... 98
Figure 4-1 Flow diagram of study participants at the Clatterbridge Cancer Centre ........................... 108
Figure 4-2 Figure of PET/CT with TURP ............................................................................................... 119
Figure 4-3 Example of generally diffuse choline tracer uptake .......................................................... 121
Figure 4-4 Example of varying choline PET windowing ...................................................................... 123
Figure 4-5 Example of choline uptake in pelvic lymph node .............................................................. 124
Figure 5-1 Assessments schedule (Weeks 1 to 4 were during radiotherapy)..................................... 127
Figure 5-2 Acute urinary and lower GI CTCAE toxicity by time point for prostate only radiotherapy 129

13
Figure 5-3 Prevalence of specific acute CTCAE toxicities by time point for prostate only radiotherapy
............................................................................................................................................................ 130
Figure 5-4 Other acute CTCAE toxicities (not urinary or lower GI) by time point for prostate only
radiotherapy ....................................................................................................................................... 131
Figure 5-5 Prevalence of acute RTOG toxicity by time point for prostate only radiotherapy ............ 132
Figure 5-6 Cumulative incidence of acute RTOG toxicity by time point for prostate only radiotherapy
............................................................................................................................................................ 133
Figure 5-7 Change in IPSS for prostate only radiotherapy between Registration and Week 18 ........ 134
Figure 5-8 Summary EPIC scores by time point for prostate only radiotherapy ................................ 135
Figure 5-9 EPIC Urinary subcategories by time point for prostate only radiotherapy ....................... 136
Figure 5-10 EPIC bowel subcategories by time point for prostate only radiotherapy ....................... 137
Figure 5-11 EPIC sexual subcategories by time point for prostate only radiotherapy ....................... 138
Figure 5-12 EPIC hormonal subcategories by time point for prostate only radiotherapy.................. 139
Figure 5-13 Acute urinary and lower GI CTCAE toxicity by time point for prostate and lymph node
radiotherapy ....................................................................................................................................... 140
Figure 5-14 Prevalence of specific acute CTCAE toxicities by time point for prostate and lymph node
radiotherapy ....................................................................................................................................... 141
Figure 5-15 Other acute CTCAE toxicities (not urinary or lower GI) by time point for prostate and lymph
node radiotherapy .............................................................................................................................. 142
Figure 5-16 Acute RTOG toxicity by time point for prostate and lymph node radiotherapy ............. 143
Figure 5-17 Cumulative incidence of acute RTOG toxicity by time point for prostate and lymph node
radiotherapy ....................................................................................................................................... 144
Figure 5-18 Change in IPSS for prostate and lymph node radiotherapy between Registration and Week
18 ........................................................................................................................................................ 145
Figure 5-19 Summary EPIC scores by time point for prostate and lymph node radiotherapy ........... 146
Figure 5-20 EPIC Urinary subcategories by time point for prostate and lymph node radiotherapy .. 147
Figure 5-21 EPIC bowel subcategories by time point for prostate and lymph node radiotherapy .... 148
14
Figure 5-22 EPIC sexual subcategories by time point for prostate and lymph node radiotherapy .... 149
Figure 5-23 EPIC hormonal subcategories by time point for prostate and lymph node radiotherapy
............................................................................................................................................................ 150
Figure 6-1 Late urinary and lower GI CTCAE toxicity by time point for prostate only radiotherapy .. 165
Figure 6-2 Prevalence of specific late CTCAE toxicities by time point for prostate only radiotherapy
............................................................................................................................................................ 166
Figure 6-3 Other late CTCAE toxicities (not urinary or lower GI) by time point for prostate only
radiotherapy ....................................................................................................................................... 167
Figure 6-4 Late RTOG toxicity by time point for prostate only radiotherapy ..................................... 168
Figure 6-5 Cumulative incidence of late RTOG toxicity by time point for prostate only radiotherapy
............................................................................................................................................................ 169
Figure 6-6 IPSS score (A) and IPSS Quality of Life score (B) between registration and month 24 for
prostate only radiotherapy ................................................................................................................. 170
Figure 6-7 Change in IPSS for prostate only radiotherapy between registration and month 24 ....... 171
Figure 6-8 Late urinary and lower GI CTCAE toxicity by time point for prostate and lymph node
radiotherapy ....................................................................................................................................... 172
Figure 6-9 Prevalence of specific late CTCAE toxicities by time point for prostate and lymph node
radiotherapy ....................................................................................................................................... 173
Figure 6-10 Other late CTCAE toxicities (not urinary or lower GI) by time point for prostate and lymph
node radiotherapy .............................................................................................................................. 174
Figure 6-11 Late RTOG toxicity by time point for prostate and lymph node radiotherapy ................ 175
Figure 6-12 Cumulative incidence of late RTOG toxicity by time point for prostate and lymph node
radiotherapy ....................................................................................................................................... 176
Figure 6-13 IPSS score (A) and IPSS Quality of Life score (B) between registration and month 24 for
prostate and lymph node radiotherapy .............................................................................................. 177
Figure 6-14 Change in IPSS for prostate and lymph node radiotherapy between registration and month
24 ........................................................................................................................................................ 178
Figure 6-15 Kaplan Meier Curve for Overall Survival for all 56 patients ............................................ 181

15
Figure 6-16 Kaplan Meier curve for PSA relapse (by Phoenix criteria) for all 56 patients .................. 181
16
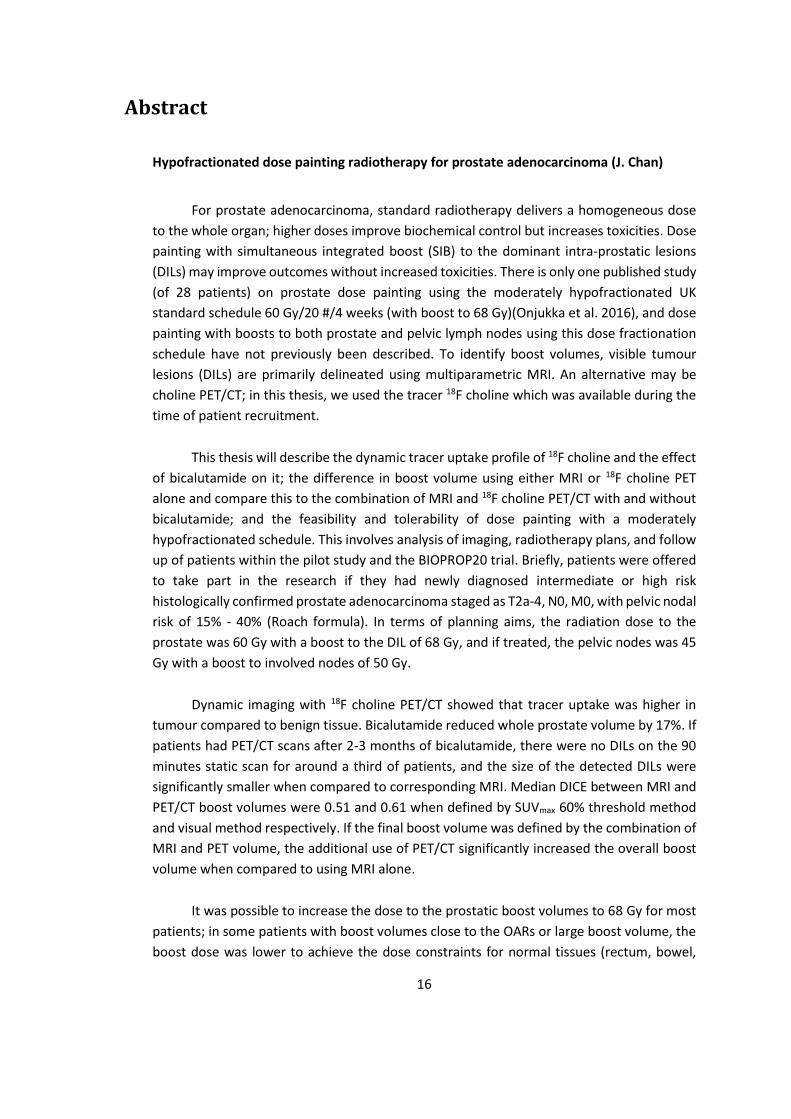
Abstract
Hypofractionated dose painting radiotherapy for prostate adenocarcinoma (J. Chan)
For prostate adenocarcinoma, standard radiotherapy delivers a homogeneous dose
to the whole organ; higher doses improve biochemical control but increases toxicities. Dose
painting with simultaneous integrated boost (SIB) to the dominant intra-prostatic lesions
(DILs) may improve outcomes without increased toxicities. There is only one published study
(of 28 patients) on prostate dose painting using the moderately hypofractionated UK
standard schedule 60 Gy/20 #/4 weeks (with boost to 68 Gy)(Onjukka et al. 2016), and dose
painting with boosts to both prostate and pelvic lymph nodes using this dose fractionation
schedule have not previously been described. To identify boost volumes, visible tumour
lesions (DILs) are primarily delineated using multiparametric MRI. An alternative may be
choline PET/CT; in this thesis, we used the tracer 18F choline which was available during the
time of patient recruitment.
This thesis will describe the dynamic tracer uptake profile of 18F choline and the effect
of bicalutamide on it; the difference in boost volume using either MRI or 18F choline PET
alone and compare this to the combination of MRI and 18F choline PET/CT with and without
bicalutamide; and the feasibility and tolerability of dose painting with a moderately
hypofractionated schedule. This involves analysis of imaging, radiotherapy plans, and follow
up of patients within the pilot study and the BIOPROP20 trial. Briefly, patients were offered
to take part in the research if they had newly diagnosed intermediate or high risk
histologically confirmed prostate adenocarcinoma staged as T2a-4, N0, M0, with pelvic nodal
risk of 15% - 40% (Roach formula). In terms of planning aims, the radiation dose to the
prostate was 60 Gy with a boost to the DIL of 68 Gy, and if treated, the pelvic nodes was 45
Gy with a boost to involved nodes of 50 Gy.
Dynamic imaging with 18F choline PET/CT showed that tracer uptake was higher in
tumour compared to benign tissue. Bicalutamide reduced whole prostate volume by 17%. If
patients had PET/CT scans after 2-3 months of bicalutamide, there were no DILs on the 90
minutes static scan for around a third of patients, and the size of the detected DILs were
significantly smaller when compared to corresponding MRI. Median DICE between MRI and
PET/CT boost volumes were 0.51 and 0.61 when defined by SUVmax 60% threshold method
and visual method respectively. If the final boost volume was defined by the combination of
MRI and PET volume, the additional use of PET/CT significantly increased the overall boost
volume when compared to using MRI alone.
It was possible to increase the dose to the prostatic boost volumes to 68 Gy for most
patients; in some patients with boost volumes close to the OARs or large boost volume, the
boost dose was lower to achieve the dose constraints for normal tissues (rectum, bowel,

17
bladder and urethra). The treatment was well tolerated with acute toxicity peaking at week
6 at the latest and with acceptable late toxicity.
In conclusion, the addition of 18F choline PET/CT to MRI for prostate dose painting
radiotherapy planning can significantly alter the boost volume, and PET/CT should be
performed without bicalutamide. Planning and delivery of dose painting with a moderately
hypofractionated schedule are both feasible and clinically acceptable regarding toxicity. The
presented planning protocol has been used for a multicentre, randomised Phase III trial
(PIVOTALboost); this should demonstrate any long term toxicity and clinical benefits of dose
painting radiotherapy with this protocol when compared to conventional radiotherapy.

18
1 Introduction
Prostate Cancer
1.1.1 Epidemiology, staging and principals of treatment
Since the early 1990s, incidence of prostate cancer has increased by 44% in the UK, in part
due to prostate specific antigen (PSA) screening(1). Currently, it is the commonest cancer in
men in the UK, with 47,200 new cases in 2015. One in 8 men will be diagnosed with it in their
lifetime, and most will be at an early stage with organ-confined disease(2). Approximately
70% of prostate cancers arise in the peripheral zone with 30% in the central gland(3), and
disease may be unifocal or multifocal within the prostate(4). Recognised risk factors include
increasing age, ethnicity (Afro-Caribbean heritage) and family history(5).
Disease assessment involves clinical staging (digital rectal examination (DRE) and
multiparametric magnetic resonance imaging (mpMRI)), PSA levels, and histology (Gleason
score and grade group)(2). Imaging of the prostate will be discussed in detail in subsequent
sections of this introduction. PSA is a serine protease produced by both prostate epithelial
cells and neoplastic prostatic cells. Therefore it can be raised for benign conditions such as
benign prostatic hypertrophy (BPH) and prostatitis, or malignant conditions such as prostate
adenocarcinoma. The Gleason score grades prostate adenocarcinoma based on degree of
glandular differentiation and overall pattern of growth. The overall score is the summation
of the primary and secondary patterns, ranging from 6 to 10, and gives a grade group of 1 to
5(6). These three factors are used to aid decision making by risk stratifying the disease to
determine its overall clinical significance. A commonly used risk classification system is by
NCCN as defined in Appendix 8.1(7). Although there are proposals for additional
investigations that would further guide management decisions, such as by using novel
biomarkers and risk calculators in the pre-biopsy setting to predict a positive prostate
biopsy(8), and by molecular testing for men considered suitable for active surveillance with
low risk and >10 years life expectancy (9), they are not currently in routine clinical use.
With localised disease, treatment aim is for cure whilst minimising toxicity. For intermediate
and high risk disease, the two established modalities are surgery (radical prostatectomy +/-
19
lymph node dissection) and radiotherapy (external-beam radiotherapy (EBRT) +/-
brachytherapy, with hormone therapy). As will be discussed in more detail later, many of
these patients who have radical radiotherapy achieve disease control for several years (e.g.
CHHiP showed that 91% of patients receiving 60Gy were biochemical or clinical failure free
at 5 years(10)). Prostate cancer and its treatment are the leading cause of cancer years lived
with disability. Therefore, consideration of survivorship issues including both acute and late
toxicity is important.
Following radical treatment, patients are primarily assessed by clinical and biochemical
monitoring. Biochemical endpoints involving PSA are used as surrogates for treatment
efficacy, which can take several years to determine owing to the often slow natural history
of the disease(6). Currently, biochemical failure after radiotherapy is defined by the Phoenix
criteria: PSA rise of 2 ng/ml over the nadir(11).
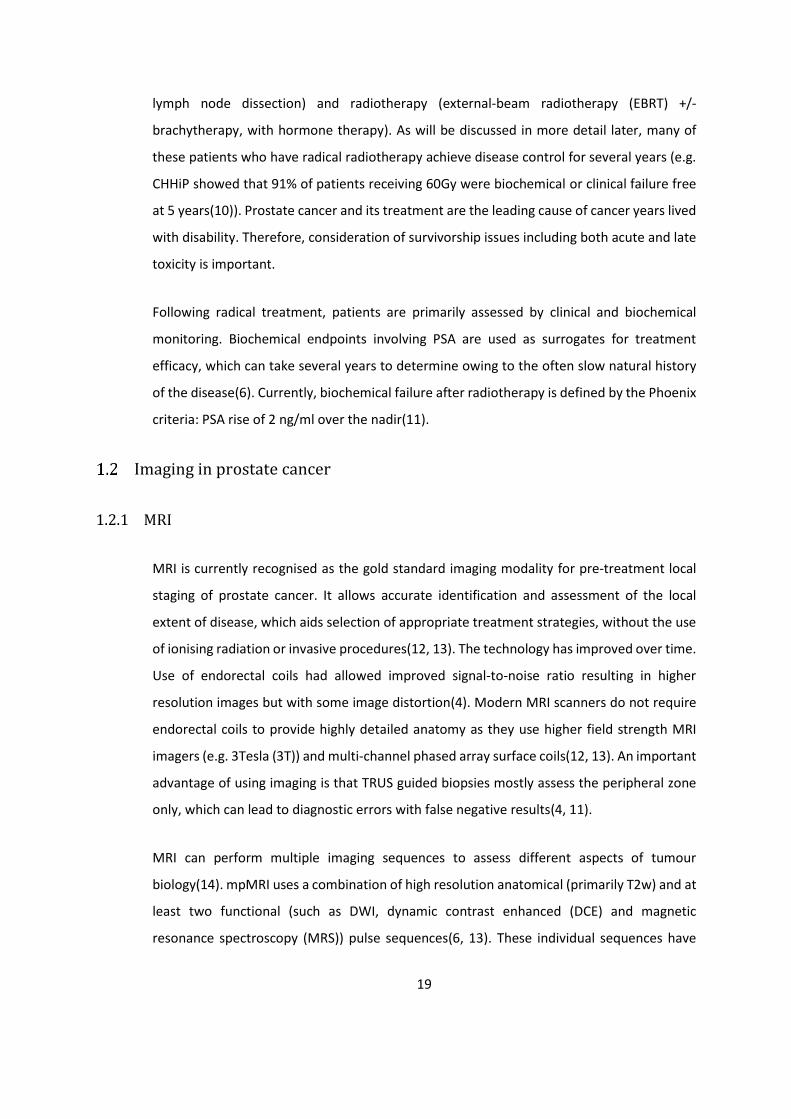
Imaging in prostate cancer
1.2.1 MRI
MRI is currently recognised as the gold standard imaging modality for pre-treatment local
staging of prostate cancer. It allows accurate identification and assessment of the local
extent of disease, which aids selection of appropriate treatment strategies, without the use
of ionising radiation or invasive procedures(12, 13). The technology has improved over time.
Use of endorectal coils had allowed improved signal-to-noise ratio resulting in higher
resolution images but with some image distortion(4). Modern MRI scanners do not require
endorectal coils to provide highly detailed anatomy as they use higher field strength MRI
imagers (e.g. 3Tesla (3T)) and multi-channel phased array surface coils(12, 13). An important
advantage of using imaging is that TRUS guided biopsies mostly assess the peripheral zone
only, which can lead to diagnostic errors with false negative results(4, 11).
MRI can perform multiple imaging sequences to assess different aspects of tumour
biology(14). mpMRI uses a combination of high resolution anatomical (primarily T2w) and at
least two functional (such as DWI, dynamic contrast enhanced (DCE) and magnetic
resonance spectroscopy (MRS)) pulse sequences(6, 13). These individual sequences have
20
inherent strengths and weaknesses, which allows them to complement each other. Hence
overall disease interpretation relies on combining these MRI sequences which improves
accuracy of detection and localisation of tumours(4).
T2w MRI provides superior soft tissue contrast of the prostate(15-18). Normal tissues often
exhibit high-signal intensity, whilst malignant tissues have low-signal intensity due to loss of
glandular morphology. However low-signal intensity is not specific to cancer, and can
indicate benign conditions such as post-biopsy haemorrhage, prostatitis, BPH, and post-
treatment changes. Interpretation of the transitional zone is more difficult than the
peripheral zone due to the presence of BPH, although BPH are generally well defined and
round. T2w can determine whether tumour is confined to the prostate or whether there is
extra-prostatic extension(19). In the latter, imaging can show the tumour directly extending
outside the prostate and cause features such as asymmetry of the neurovascular bundle or
prostate rotations. It can also determine seminal vesicle invasion, identified by low signal on
a background of high signal normal tissue, although benign conditions of the seminal vesicles
can again complicate interpretation such as calculi, clots or atrophy. Hence T2w sequencing
is important to determine T-staging. Differing sensitivity and specificity values of T2w
imaging have been reported due to differences in patient selection (affecting tumour
characteristics) and the use of different standard comparators (e.g. biopsy, surgical
specimens). For instance, T2w imaging alone by a 3T machine could identify large tumours
(> 1 cm in diameter) with 80 – 90% accuracy, whilst smaller tumours had a lower
accuracy(13).
DWI MRI relies on the random diffusion of water molecules within the extracellular space,
and follows tissue planes and natural barriers(13, 20). This Brownian motion is restricted in
regions of high cellular density and extracellular disorganisation, such as malignant
tissues(14). By applying varying strengths of external magnetic gradients (b-values), moving
water molecules acquire varying phase shifts according to the amount of motion, allowing a
quantitative estimate of the overall water diffusion, which can create an apparent diffusion
coefficient (ADC) map. In the peripheral zone, tumours are generally hyper-intense on DWI
MRI and hypo-intense on ADC maps when compared to normal tissue. In the transitional
zone, interpretation can again be more difficult due to BPH, which are also hypo-intense on
ADC maps. The addition of DWI to T2w imaging improves sensitivity and allows better
21
detection of peripheral zone tumours(13). DWI is limited by poor spatial resolution and
susceptibility to artefacts such as bowel gas(13).
DCE MRI assesses the perfusion and permeability of the microvasculature by using
intravenous gadolinium-based contrast(14, 21). It involves rapid T1w imaging before, during
and after IV contrast. Tumours have disorganised angiogenesis, which are highly permeable,
generally resulting in more rapid and intense enhancement as well as faster washout. DCE is
often interpreted by visual assessment and has a high sensitivity to detect malignant lesions
and assess grade(13). As well as for preoperative staging including seminal vesicle invasion,
DCE is particularly useful for identifying recurrence following primary treatments such as
radiotherapy and focal ablation as they can cause anatomical and functional changes to
which other sequences are susceptible. Limitations to DCE include poor spatial resolution
and malignant tissue, especially if small and low grade, in the transitional zone have a similar
enhancement to benign conditions such as BPH and prostatitis.
MRS is a functional imaging sequence, which identifies the relative concentrations of cellular
metabolites such as choline and citrate(22). Choline is involved in membrane synthesis and
the quantity is expected to be raised with cellular proliferation (14). Malignant tissues have
high levels of choline, and low levels of citrate. MRS alone has been shown to predict cancer
aggressiveness, and the addition of MRS to T2w MRI can increase specificity(13). However it
also has poor spatial resolution and is technically challenging to perform. Interpretation of
the imaging requires significant experience with variable results in multicentre studies when
compared to other sequences. As a result, MRS is not often performed as part of prostate
mpMRI.
In general, T2w allows optimal soft-tissue imaging and anatomically-defined tumour
volumes to be identified(14), whilst the other functional sequences can confirm the
detection of clinically significant higher grade intra-prostatic tumours. Overall, mpMRI has
sensitivity and specificity values of 86% and 94% respectively for identifying lesions > 0.5 ml
when compared to radical prostatectomy samples(13). In routine clinical practice, the
Prostate Imaging – Reporting and Data System (PI-RADS) V2 framework is used to identify
clinically significant prostate cancer on mpMRI, and this usually involves T2w and DWI
sequences(23). PI-RADS V2 was able to correctly identify above 94% of cancer of ≥ 0.5 ml,
22
but was limited for Gleason ≥ 4+3 tumours of ≤ 0.5 ml size(24). An advantage of improved
accuracy in detecting larger, higher grade tumours in the context of dose painting
radiotherapy is that these lesions would likely benefit from dose escalation boosting, whilst
smaller, lower grade tumours are likely to receive a sufficient dose without dose escalation
boosting(11, 25).
For general radiotherapy planning, MRI can aid the delineating of structures that are more
difficult to identify on the planning CT scan, such as prostatic apex which can reduce penile
bulb dose and lead to reduced toxicity(26). It also allows more accurate delineation of the
whole prostate, and has been found to reduce the total prostate clinical target volume (CTV)
by 30% as well as inter-observer variation(27, 28). The mpMRI can be co-registered to the
planning CT scan by using intra-prostatic fiducial markers as the reference landmark(29).
For identifying intra-prostatic lesions for dose escalation boosting, the evidence available are
mostly from single institution studies and so are difficult to extrapolate to other institutions
with different scanners. Also the studies primarily used pathology as the reference, and so
limited the evaluation of this imaging modality to the specific patient population suitable for
prostatectomy i.e. lower risk disease with lower disease burden when compared to the
population suitable for radiotherapy. A recent study found mpMRI had sensitivity and
specificity of 70% and 82% for detecting prostate cancer on histology(30). Another study
showed that mpMRI based delineating achieved 44 – 89% tumour coverage (smallest lesion
was 0.56 cc)(31). With estimated co-registration errors of 2 – 3 mm, a 5 mm margin improved
this to 85-100%. Overall, mpMRI is able to guide tumour deleating for dose painting
radiotherapy.
1.2.2 PET/CT
PET scanning is a functional and molecular imaging technique which uses a tracer (a positron-
emitter bound to a targeted molecule) to assess the distribution of the targeted molecule
(14). The tracer indirectly emits a pair of gamma rays. These are detected and a three
dimensional reconstruction of the uptake can be created. Most modern machines have a CT
scanner integrated with the PET scanner, allowing corresponding anatomical and functional
information to be collected. Depending on the tracer characteristics, uptake can reflect

23
several biological processes including hypoxia, proliferation, metabolic activity, and
perfusion(14). PET imaging is often more sensitive than MRI, but has a comparatively low
spatial resolution(13).
Several tracers have been investigated for prostate cancer. However unlike MRI, there have
not been large multicentre studies, which is partly due to scarcity of on-site cyclotrons at
clinical trial research centres. Also comparing the accuracy of different tracers is difficult as
institutions often use differing imaging protocols and image analysis methodologies(14).
The most commonly used compound in general oncology is 18F fluorodeoxyglucose (FDG), a
glucose analogue which is an indicator of glycolysis and metabolic activity, and is
preferentially taken up more in malignant than benign tissue due to upregulation of GLUT-1
glucose transporters and increased glycolytic activity in cancers (Warburg effect)(13, 14).
However in prostate cancer, it has been shown to perform poorly as lower grade disease do
not rely on glycolysis and so have low levels of GLUT-1 expression related to inherently
slower growth(6, 13, 32). Also 18F FDG is not specific to malignancy but is also taken up in
BPH and prostatitis(12, 13).
11C acetate is taken up into the cell membrane of prostate cancer cells and is excreted
primarily by the pancreas, making it suitable for prostate imaging. However 11C has a short
half-life of 20 minutes and so is only useful for centres with an on-site cyclotron. It has a
higher sensitivity when compared to 18F FDG, but it has a lower sensitivity and specificity
compared to mpMRI (62% and 80%, vs. 82% and 95%)(13).
Choline is a cell membrane component, which is required by proliferating cells. It is
transported into cells by choline kinase which is upregulated in prostate cancer (14). They
are then phosphorylated and incorporated into the lipid cell membrane. 11C choline and 18F
choline tracers have been used. The former has low urinary excretion, which is beneficial for
prostate imaging, but a short half-life. The latter has a higher urinary excretion, but a longer
half-life of 110 minutes(32). Studies of either tracer have often used different imaging
protocols (such as tracer doses and tracer uptake time before scanning) and image analyses
(such as using histopathology or MRI as the reference standard; correlation methods by
laterality, sextants or octants; and determining imaging as positive for malignancy by visual
24
analysis or differing SUV thresholds), and have shown conflicting results (Tables 1-1, 1-2, 1-
3). More studies have been performed for 11C choline than 18F choline. When comparing 11C
choline with histopathology, reported specificity ranges from 42.6% to 87.0%, and accuracy
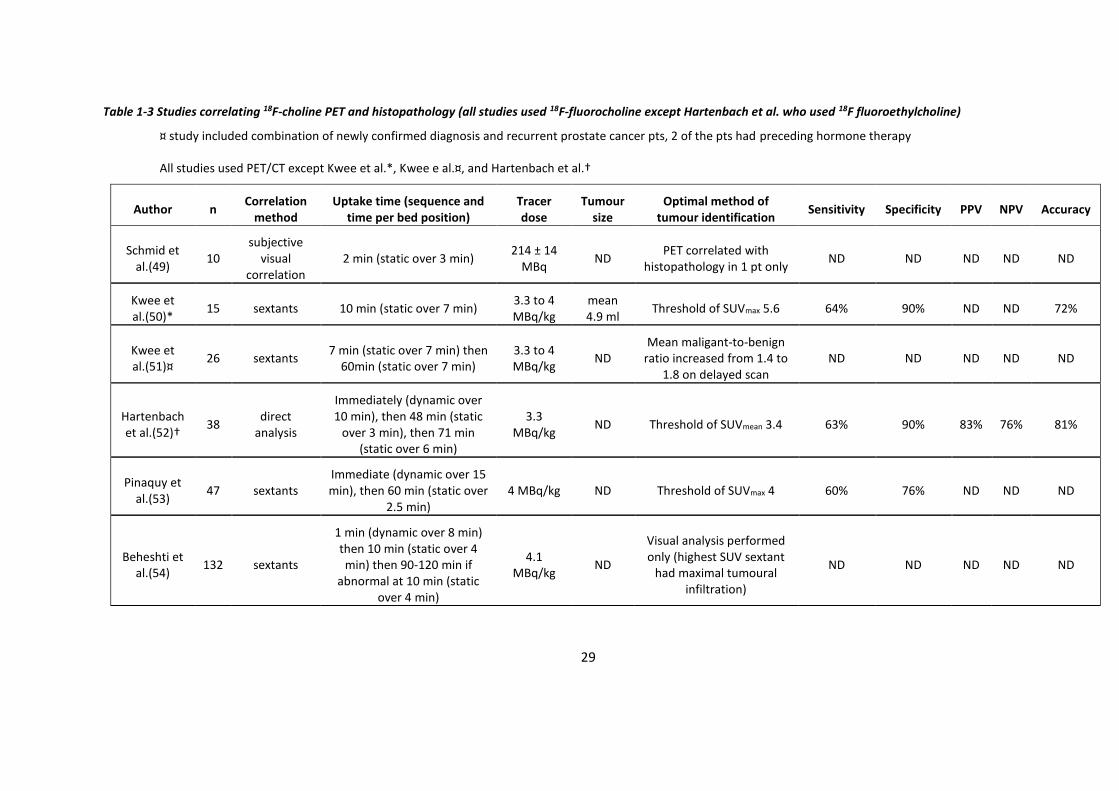
ranges from 59.6% to 84.0% (Table 1-1). When comparing 18F choline with histopathology,
reported specificity ranges from 76% to 90%, and accuracy ranges from 72% to 81% (Table
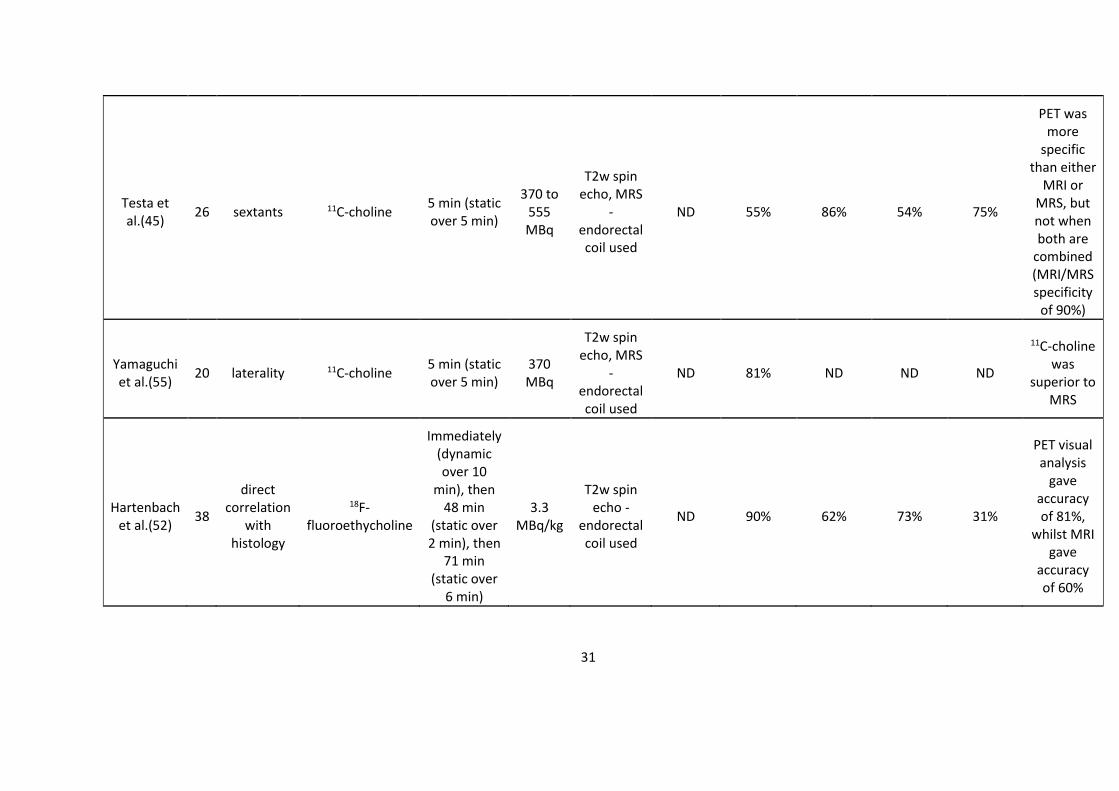
1-3). When correlating both choline and MRI with histopathology, 18F choline has been
shown in one study to perform better than MRI (accuracy 81% vs. 60% respectively; Table 1-
4). This used a comparatively long tracer uptake time before PET scanning (static scanning
at 48 minutes and 71 minutes after tracer injection)(33). Current evidence suggests that
accuracy of 18F choline PET is improved by increasing the tracer dose and by delayed
scanning, but there is a lack of consensus on scanning protocols and the optimal techniques
remain unclear(14).
Choline PET has been used to investigate intra-prostatic dose escalation radiotherapy
planning. In a radiobiological modelling study, Chang et al. used 11C choline with a tracer
uptake time of over 60 minutes and SUVmax threshold of 60 and 70%. In planning and
treatment studies, Pinkawa et al. used 18F choline with a tracer uptake time of over 60
minutes and a threshold defined by a tumour-to-background SUVmax ratio of more than
2(33).
More recently, results from 68Ga-labelled PSMA ligand PET imaging have been very
encouraging and can now be used in routine clinical practice for patients with suspected
recurrent following previous radical therapy in the UK. In the primary staging setting, PSMA-
PET led to upstaging of disease and therefore treatment modification in 21% of patients(34,
35). PSMA-PET can detect intra-prostatic lesions in up to 95% of cases, and combining it with
mpMRI can improve coverage of cancer on histology by providing complementary
information(30, 36). Dose painting radiotherapy planning using PSMA PET/CT and mpMRI
with dose fractionation of 2.0 to 2.2 Gy per fraction to the prostate is technically feasible(37).
Other radionuclide tracers have been used for prostate cancer but with fewer published
studies. 18F fluciclovine is a synthetic amino acid which undergoes increased uptake in
malignant cells but also localises benign prostate hypertrophy nodules with similar avidity,
and so its role in initial staging is not clear(38). 18F MISO, CuATSM and FAZA have been used
25
to image hypoxic regions of the prostate which may be more radio-resistant, and FLT has
been investigated for analysing tumour repopulation rates (14). However evidence for their
use in dose painting radiotherapy planning is limited.
Limitations of PET imaging include spatial and temporal variability of the biological processes
including perfusion, hypoxia and metabolic activity. With the former, these processes occur
at a microscopic level and spatial resolution of individual voxels is generally poor, and so
small lesions may not be detected due to partial voluming effects. With the latter, the
reproducibility of imaging may be affected. Hence image analyses may be simplifying the
various complex underlying processes(14). Currently, PET/CT for prostate cancer is primarily
accepted for detecting recurrent disease as opposed to for primary staging, and in my thesis
I will explore the value and additional benefits of adding choline PET to the staging and
radiotherapy planning compared to mpMRI only.

26
Table 1-1 Studies correlating 11C-choline PET and histopathology (All used PET/CT except Chang et al. who used PET and transmission scanning)
¤scan sequences were static except Chang et al. which was dynamic, * only pts who had radical prostatectomy in the study are included in this table (of these, 7
of 19 patients had preceding hormone therapy), † Unclear if contains patients from Farsad et al., ‡ All pts received chemotherapy before prostatectomy, n =
number of patients, ND = not defined, PPV = positive predictive value, NPV = negative predictive value
Author n Correlation
method Uptake
time
Tracer dose
(MBq)
Scan sequence¤
Tumour size
Optimal method of
tumour identification
Sensitivity Specificity PPV NPV Accuracy
Van den Bergh et al.(39)
49 octants 2 min 740 to 1000
over 5 min > 5 mm
diameter Threshold of SUVmax 2.7
77.4% 44.9% ND ND 61.1%
Souvatzoglou et al.(40)
43 laterality 5 min 682 ±
75 over 3 min ND
Not specified but highest
uptake correlates with
malignant segments in 79% of pts
ND ND ND ND ND
Bundschuh et al.(41)
20 manual
delineation 5 min
544 to 773
over 3 - 5 min
mean 3.3 cm3 (0.4 - 12.5 cm3)
Fixed threshold SUV value of 4.9 ± 1.8 or variable
threshold SUVmax of 75.6
± 14%
ND ND ND ND ND
Giovacchini et al.(42)*
19 sextants 5min 370 over 4 min ND Threshold of SUVmax 2.5
71.6% 42.6% 64.0% 51.3% 59.6%

27
Farsad et al.(43)
36 sextants 5 min 370 to
555 over 5 min ND
Visual analysis performed
only 66% 81% 87% 55% 71%
Martorana et al.(44)†
43 individual
nodules and sextants
5 min 370 to
555 over 5 min ND
Visual analysis by sextants
65.6% 84.2% 87.7% 58.8% 72.5%
Testa et al.(45)
26 sextants 5 min 370 to
555 over 5 min ND
Threshold of SUVmax 2.9
72% 65% ND ND ND
Piert et al.(46) 14
using ex vivo MR and block
face photography
5 min 700 over 7 min 0.03 - 12.6
cm3
Not specified, but tumour to normal tissue
ratio identified aggressive
disease better than absolute
value
ND ND ND ND ND
Reske et al.(47)
26 36 segments 5-10 min 1112 ±
131 over 3 min
> 5 mm diameter
Threshold of SUVmax 2.65
81% 87% 86% 83% 84%
Chang et al.(48)‡
8 at voxel level Immediately 370 over 60
min ≥ 1 cm3
Relative SUV thresholding
of 60% 79 ± 13% 72 ± 17% ND ND ND

28
Table 1-2 Sensitivity and specificity of 11C choline PET for identifying malignancy with varying SUVmax threshold values
Author n Number of segments per
prostate Total number of segments
analysed SUVmax threshold Sensitivity Specificity
Giovacchini et al.(42)
19 6 114 2.5 71.6% 42.6%
Reske et al.(47) 26 36 936 2.65 81% 87%
Van den Bergh et al.(39)
49 24 1,176 2.7 77.4% 44.9%
Testa et al.(45) 26 6 156 2.9 72% 65%
29
Table 1-3 Studies correlating 18F-choline PET and histopathology (all studies used 18F-fluorocholine except Hartenbach et al. who used 18F fluoroethylcholine)
¤ study included combination of newly confirmed diagnosis and recurrent prostate cancer pts, 2 of the pts had preceding hormone therapy
All studies used PET/CT except Kwee et al.*, Kwee e al.¤, and Hartenbach et al.†
Author n Correlation
method Uptake time (sequence and
time per bed position) Tracer dose
Tumour size
Optimal method of tumour identification
Sensitivity Specificity PPV NPV Accuracy
Schmid et al.(49)
10 subjective
visual correlation
2 min (static over 3 min) 214 ± 14
MBq ND
PET correlated with histopathology in 1 pt only
ND ND ND ND ND
Kwee et al.(50)*
15 sextants 10 min (static over 7 min) 3.3 to 4 MBq/kg
mean 4.9 ml
Threshold of SUVmax 5.6 64% 90% ND ND 72%
Kwee et al.(51)¤
26 sextants 7 min (static over 7 min) then
60min (static over 7 min) 3.3 to 4 MBq/kg
ND Mean maligant-to-benign
ratio increased from 1.4 to 1.8 on delayed scan
ND ND ND ND ND
Hartenbach et al.(52)†
38 direct
analysis
Immediately (dynamic over 10 min), then 48 min (static
over 3 min), then 71 min (static over 6 min)
3.3 MBq/kg
ND Threshold of SUVmean 3.4 63% 90% 83% 76% 81%
Pinaquy et al.(53)
47 sextants Immediate (dynamic over 15 min), then 60 min (static over
2.5 min) 4 MBq/kg ND Threshold of SUVmax 4 60% 76% ND ND ND
Beheshti et al.(54)
132 sextants
1 min (dynamic over 8 min) then 10 min (static over 4 min) then 90-120 min if
abnormal at 10 min (static over 4 min)
4.1 MBq/kg
ND
Visual analysis performed only (highest SUV sextant
had maximal tumoural infiltration)
ND ND ND ND ND

30
Table 1-4 Studies correlating both choline PET and MRI (Tesla of 1.5) with histopathology
Author n Correlation
method PET Tracer
PET tracer uptake time (sequence
and duration)
PET tracer dose
MR techniques
for prostate analysis
Tumour size
PET sensitivity
PET specificity
MRI sensitivity
MRI specificity
Conclusion
Van den Bergh et al.(39)
49 octants 11C-choline 2 min (static over 5 min)
740 to 1000 MBq
T2w spin echo
> 5 mm diameter
77.4% 44.9% 33.5% 94.6%
PET (threshold SUVmax of 2.7) was
more sensitive but less specific
than MRI
Pinaquy et al.(53)
47 sextants 18F-fluorocholine
Immediately (dynamic over 15
min), then 60 min
(static over 2.5 min)
4 MBq/kg
T2w, DWI, DCE
ND 60% 76% 72% 69%
SUVmax threshold of 4 had higher
specificity but lower sensitivity than DWI
MRI
31
Testa et al.(45)
26 sextants 11C-choline 5 min (static over 5 min)
370 to 555 MBq
T2w spin echo, MRS
- endorectal coil used
ND 55% 86% 54% 75%
PET was more
specific than either
MRI or MRS, but not when both are
combined (MRI/MRS specificity
of 90%)
Yamaguchi et al.(55)
20 laterality 11C-choline 5 min (static over 5 min)
370 MBq
T2w spin echo, MRS
- endorectal coil used
ND 81% ND ND ND
11C-choline was
superior to MRS
Hartenbach et al.(52)
38
direct correlation
with histology
18F-fluoroethycholine
Immediately (dynamic over 10
min), then 48 min
(static over 2 min), then
71 min (static over
6 min)
3.3 MBq/kg
T2w spin echo -
endorectal coil used
ND 90% 62% 73% 31%
PET visual analysis
gave accuracy of 81%,
whilst MRI gave
accuracy of 60%
32
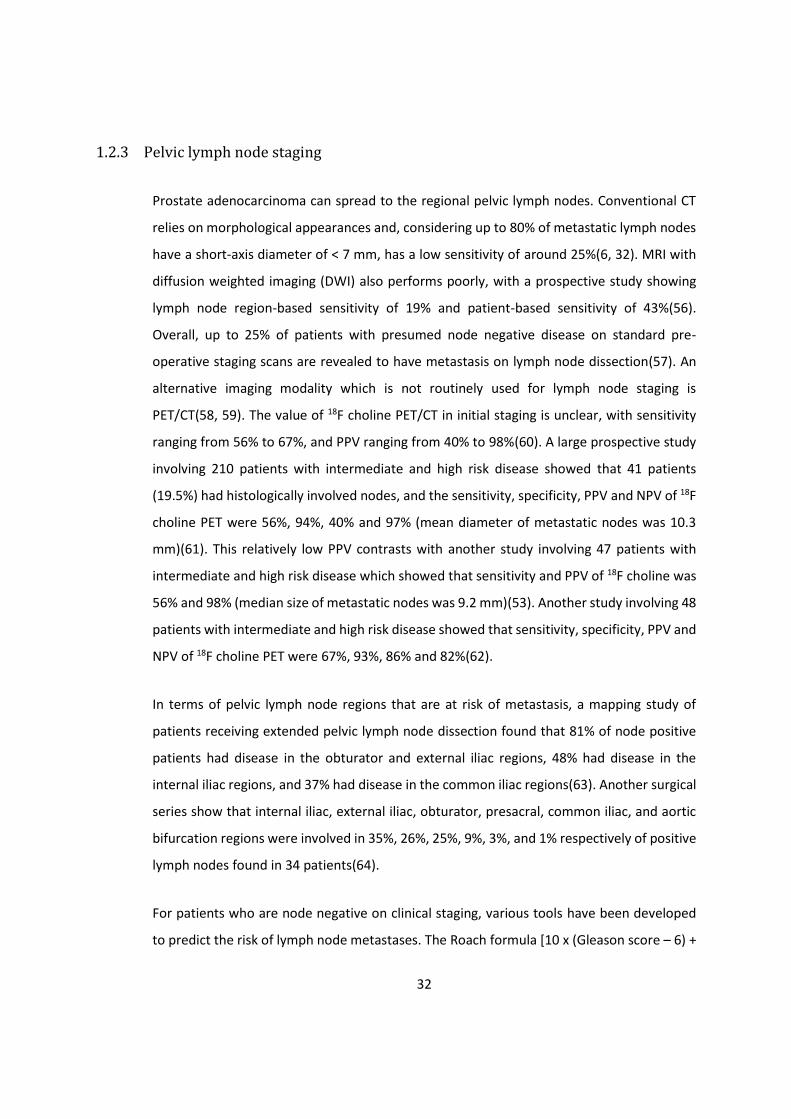
1.2.3 Pelvic lymph node staging
Prostate adenocarcinoma can spread to the regional pelvic lymph nodes. Conventional CT
relies on morphological appearances and, considering up to 80% of metastatic lymph nodes
have a short-axis diameter of < 7 mm, has a low sensitivity of around 25%(6, 32). MRI with
diffusion weighted imaging (DWI) also performs poorly, with a prospective study showing
lymph node region-based sensitivity of 19% and patient-based sensitivity of 43%(56).
Overall, up to 25% of patients with presumed node negative disease on standard pre-
operative staging scans are revealed to have metastasis on lymph node dissection(57). An
alternative imaging modality which is not routinely used for lymph node staging is
PET/CT(58, 59). The value of 18F choline PET/CT in initial staging is unclear, with sensitivity
ranging from 56% to 67%, and PPV ranging from 40% to 98%(60). A large prospective study
involving 210 patients with intermediate and high risk disease showed that 41 patients
(19.5%) had histologically involved nodes, and the sensitivity, specificity, PPV and NPV of 18F
choline PET were 56%, 94%, 40% and 97% (mean diameter of metastatic nodes was 10.3
mm)(61). This relatively low PPV contrasts with another study involving 47 patients with
intermediate and high risk disease which showed that sensitivity and PPV of 18F choline was
56% and 98% (median size of metastatic nodes was 9.2 mm)(53). Another study involving 48
patients with intermediate and high risk disease showed that sensitivity, specificity, PPV and
NPV of 18F choline PET were 67%, 93%, 86% and 82%(62).
In terms of pelvic lymph node regions that are at risk of metastasis, a mapping study of
patients receiving extended pelvic lymph node dissection found that 81% of node positive
patients had disease in the obturator and external iliac regions, 48% had disease in the
internal iliac regions, and 37% had disease in the common iliac regions(63). Another surgical
series show that internal iliac, external iliac, obturator, presacral, common iliac, and aortic
bifurcation regions were involved in 35%, 26%, 25%, 9%, 3%, and 1% respectively of positive
lymph nodes found in 34 patients(64).
For patients who are node negative on clinical staging, various tools have been developed
to predict the risk of lymph node metastases. The Roach formula [10 x (Gleason score – 6) +

33
PSA x 2/3] is well established, although a study found that it overestimated risk as it was
established prior to use of PSA screening which has led to stage migration(65, 66). More
recent tools based on contemporary patients are available, such as updated Partin, MSKCC,
and Briganti nomograms(67-69). These newer tools try to incorporate a measure of tumour
bulk, and accuracy of these three tools are broadly similar(70). Despite the availability of
them, the Roach formula remains in use due to its ease and convenience.
Hormone therapy in prostate cancer
Androgens bind to androgen receptors (AR), resulting in transcription of AR target genes that
promote growth of normal and malignant prostatic tissue. Hormone therapy interferes with
this process, causing accelerated apoptosis in normal, hyperplastic and dysplastic epithelial
cells, leading to global glandular atrophy especially in the peripheral zone(6). The prostate
gland volume is downsized by around 25 – 30%(27, 71). Furthermore, hormone therapy can
improve outcomes by causing radio-sensitisation, improved oxygenation, and effects on
micro metastases(72-74). There are two broad classes of non-surgical hormone therapy:
LHRH agonists and anti-androgens(75).
LHRH agonists bind to LHRH receptors located in the anterior pituitary gland, resulting
initially in a testosterone surge that can cause a tumour flare. However as the physiological
levels of LHRH is pulsatile, the prolonged stimulation of LHRH receptors causes their
downregulation and resultant downstream testosterone reduction to castrate levels(75).
Anti-androgens (such as bicalutamide) are competitive inhibitors of the AR and do not cause
reduction in testosterone levels, but renders the circulating androgens ineffective(73). For
short course of hormone therapy (6 months of treatment), bicalutamide is most often used.
In the curative setting, hormone therapy is not used in isolation. This is supported by EORTC
30891 and Lu-Yao et al. studies: comparing observation and primary hormone therapy alone
in non-metastatic patients, there was no difference in survival(76, 77)(Table 1-5).
When hormone therapy is used in combination with radical radiotherapy, no studies have
directly compared the efficacy of LHRH agonist and antiandrogen, although studies 306 and
307 compared bicalutamide and castration (including medical castration with goserelin) and
34
found that there was no difference in overall survival or time to progression at 6.3 years
follow up, and that bicalutamide was better tolerated than castration(78).
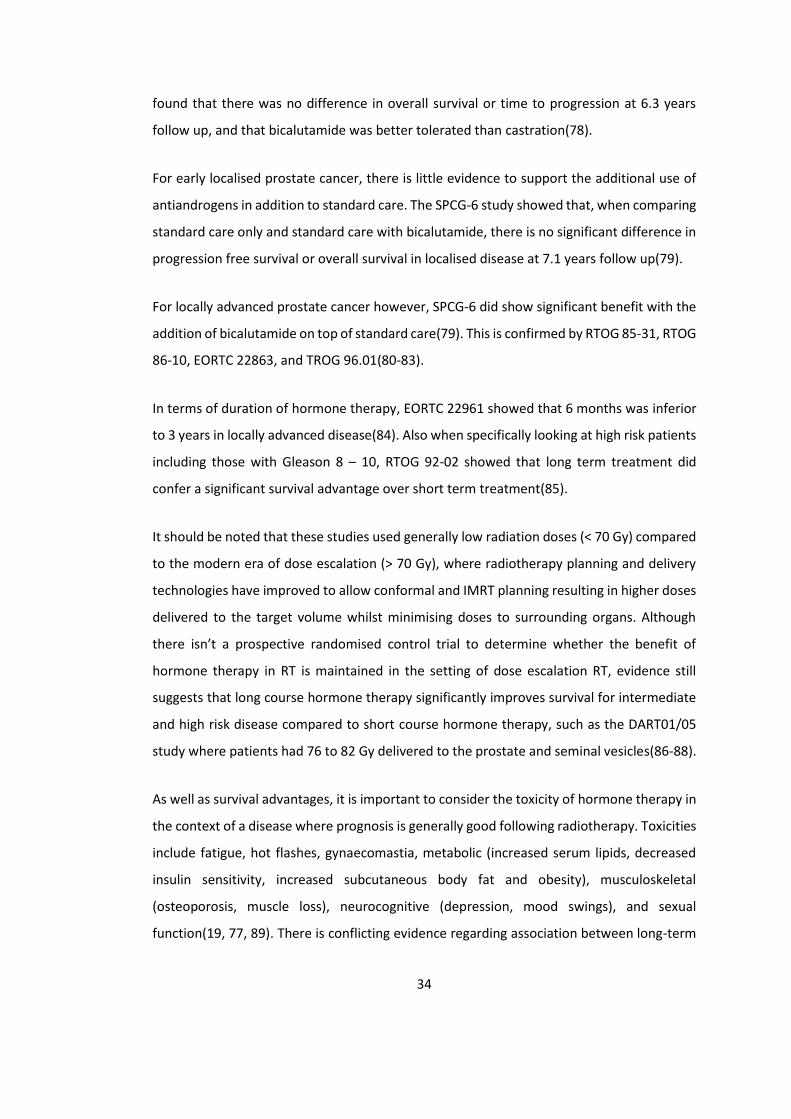
For early localised prostate cancer, there is little evidence to support the additional use of
antiandrogens in addition to standard care. The SPCG-6 study showed that, when comparing
standard care only and standard care with bicalutamide, there is no significant difference in
progression free survival or overall survival in localised disease at 7.1 years follow up(79).
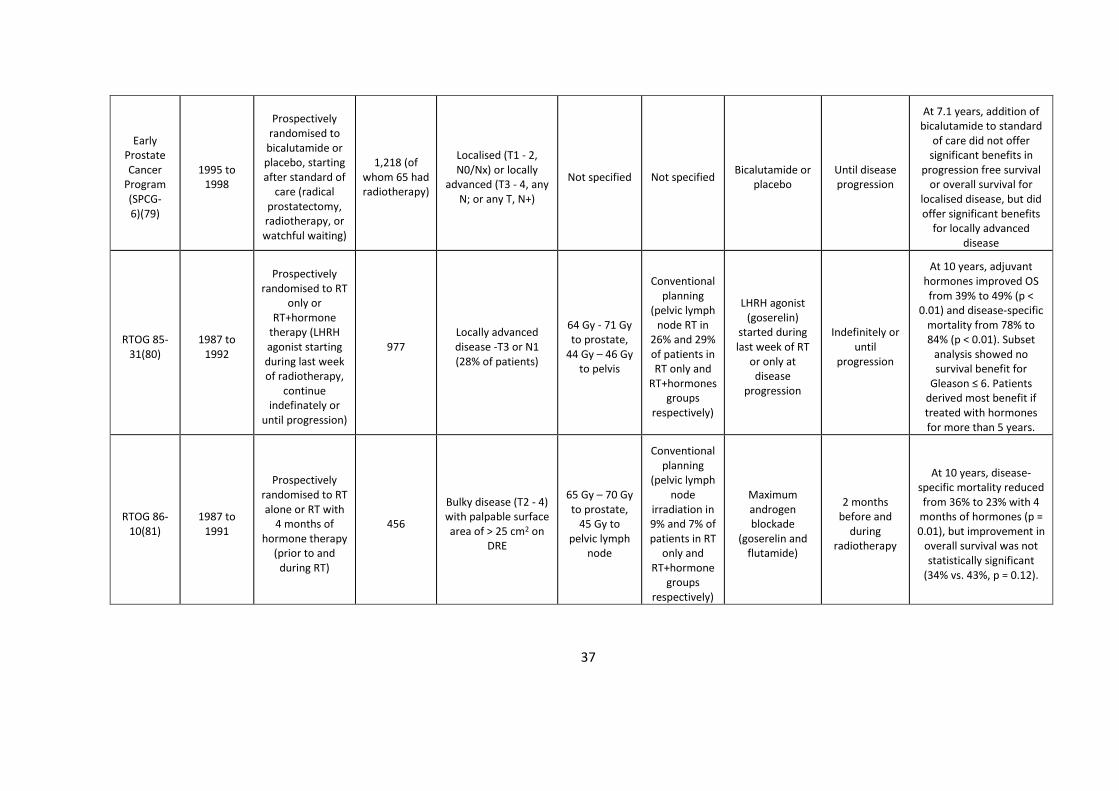
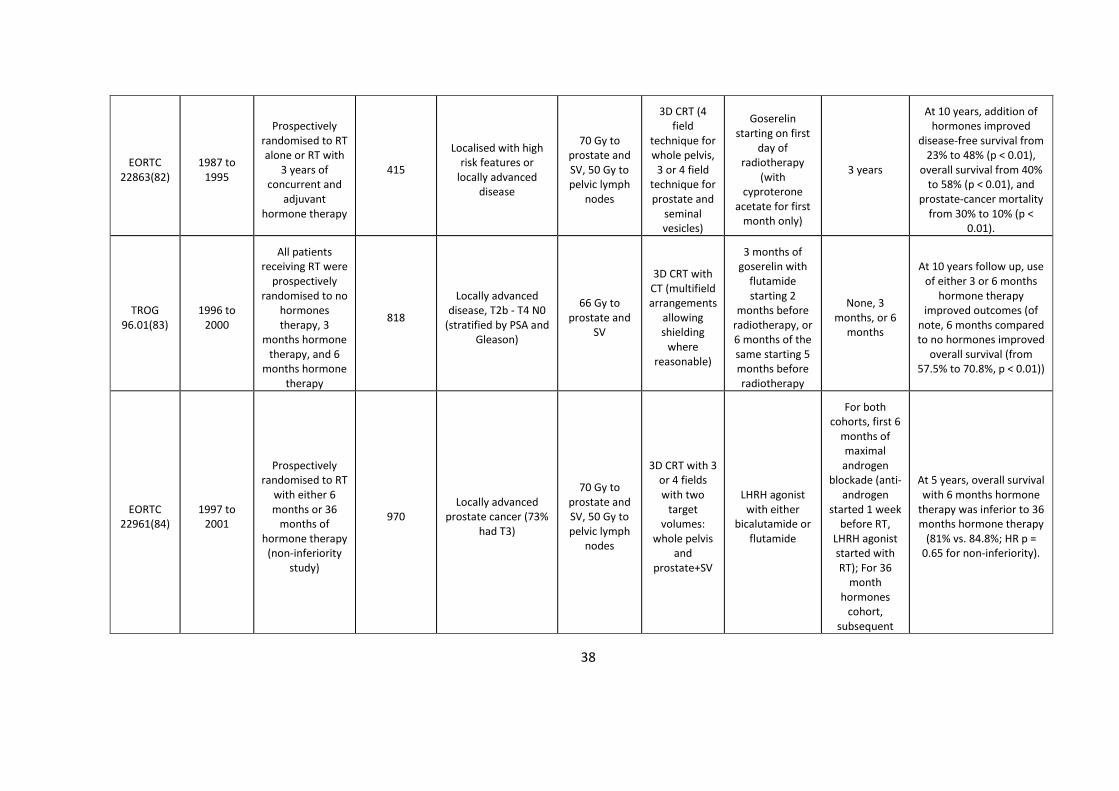
For locally advanced prostate cancer however, SPCG-6 did show significant benefit with the
addition of bicalutamide on top of standard care(79). This is confirmed by RTOG 85-31, RTOG
86-10, EORTC 22863, and TROG 96.01(80-83).
In terms of duration of hormone therapy, EORTC 22961 showed that 6 months was inferior
to 3 years in locally advanced disease(84). Also when specifically looking at high risk patients
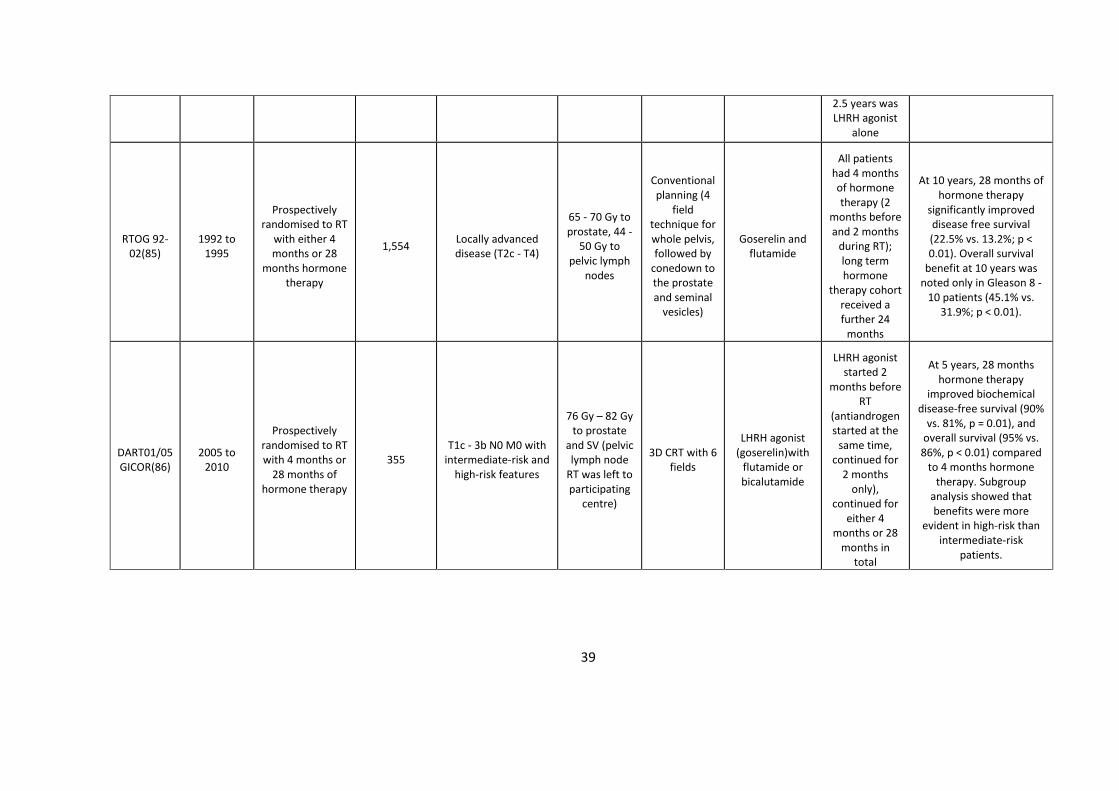
including those with Gleason 8 – 10, RTOG 92-02 showed that long term treatment did
confer a significant survival advantage over short term treatment(85).
It should be noted that these studies used generally low radiation doses (< 70 Gy) compared
to the modern era of dose escalation (> 70 Gy), where radiotherapy planning and delivery
technologies have improved to allow conformal and IMRT planning resulting in higher doses
delivered to the target volume whilst minimising doses to surrounding organs. Although
there isn’t a prospective randomised control trial to determine whether the benefit of
hormone therapy in RT is maintained in the setting of dose escalation RT, evidence still
suggests that long course hormone therapy significantly improves survival for intermediate
and high risk disease compared to short course hormone therapy, such as the DART01/05
study where patients had 76 to 82 Gy delivered to the prostate and seminal vesicles(86-88).
As well as survival advantages, it is important to consider the toxicity of hormone therapy in
the context of a disease where prognosis is generally good following radiotherapy. Toxicities
include fatigue, hot flashes, gynaecomastia, metabolic (increased serum lipids, decreased
insulin sensitivity, increased subcutaneous body fat and obesity), musculoskeletal
(osteoporosis, muscle loss), neurocognitive (depression, mood swings), and sexual
function(19, 77, 89). There is conflicting evidence regarding association between long-term

35
castration deprivation therapy and cardiovascular disease. EORTC 22863 found no difference
in cardiovascular mortality between radiotherapy alone and radiotherapy + goserelin (3
years) group at 10 years follow-up. Furthermore, a meta-analysis combining 4,141 patients
with unfavourable risk prostate cancer from eight prospective clinical trials found that the
rate of cardiovascular death was not significantly different between patients given hormone
therapy and those without (11.0% and 11.2%, p = 0.41)(90). However, analysis combining
data from 1,372 patients from three prospective clinical trials found that 6 months of
hormone therapy led to a shorter time to fatal myocardial infarction for those 65 years of
age or older, but not in those below 65 years of age(91). This may therefore counteract the
benefits of treatment in patients with cardiovascular morbidity (73, 75). Using anti-
androgens instead of LHRH agonists can lead to improved quality of life such as sexual
interest and physical capacity, and is generally more tolerable(78). It reduces the risk of
osteoporosis, hot flashes and impotence, but has risk of gynaecomastia, breast pain,
diarrhoea and hepatotoxicity(73, 92). Therefore a balance between the treatment benefits
and the impact on quality of life should be weighed for each individual patient(75, 93).
In summary, there is evidence from multiple large randomised studies for the survival
benefits of the addition of hormone therapy to conventional doses of radiotherapy in
intermediate and high risk prostate cancer patients, and that longer duration of hormone
therapy benefits patients with high risk features including locally advanced and Gleason ≥ 8
disease.

36
Table 1-5 Studies on the use of hormone therapy in radical treatment
Study name
Patient recruitment
period Study design
Number of patients
Patient characteristics
Radiotherapy dose
fractionation
Radiotherapy technique
Hormone therapy used
Duration of hormone therapy
Outcome
EORTC 30891(76)
1990 to 1999
Prospectively randomised to
hormone therapy alone or no
treatment until symptomatic
disease progression
985
Localised or locally advanced prostate cancer not suitable for or refused local curative treatment
(T0-4, N0-2, M0)
- -
Subcapsular orchidectomy or
LHRH agonist (buserelin)
In the deferred arm, 2% started
hormone therapy
immediately, 54% started
after a median of 2.8 years, 44% never started it
At 12.8 years, there was no difference in time to
castration-resistant objective progressive
disease or prostate cancer mortality
Lu-Yao et al.(77)
1992 to 2002
Retrospective data evaluating the association
between primary hormone therapy
and survival
19,271
Localised prostate cancer (≥ 66 years)
without local therapy (T1 - 2)
- - Orchidectomy or
LHRH agonists ≥ 180 days
At 10 years, prostate cancer specific survival was worse (80.1% vs.
82.6%) with no improvement in overall
survival (30.2% vs. 30.3%) in primary hormone
therapy group compared to conservative group
Studies 306 and 307(78)
1992 to 1993
Prospectively randomised to
bicalutamide or castration
(medical or surgical)
480 Locally advanced
prostate cancer (T3 - 4)
- -
Bicalutamide or castration
(orchidectomy or goserelin)
Continuous
At 6.3 years, there was no difference in overall survival or time to
progression between the bicalutamide and castration groups
37
Early Prostate Cancer
Program (SPCG-6)(79)
1995 to 1998
Prospectively randomised to
bicalutamide or placebo, starting after standard of
care (radical prostatectomy, radiotherapy, or watchful waiting)
1,218 (of whom 65 had radiotherapy)
Localised (T1 - 2, N0/Nx) or locally
advanced (T3 - 4, any N; or any T, N+)
Not specified Not specified Bicalutamide or
placebo Until disease progression
At 7.1 years, addition of bicalutamide to standard
of care did not offer significant benefits in
progression free survival or overall survival for
localised disease, but did offer significant benefits
for locally advanced disease
RTOG 85-31(80)
1987 to 1992
Prospectively randomised to RT
only or RT+hormone
therapy (LHRH agonist starting during last week of radiotherapy,
continue indefinately or
until progression)
977 Locally advanced disease -T3 or N1 (28% of patients)
64 Gy - 71 Gy to prostate,
44 Gy – 46 Gy to pelvis
Conventional planning
(pelvic lymph node RT in
26% and 29% of patients in RT only and
RT+hormones groups
respectively)
LHRH agonist (goserelin)
started during last week of RT
or only at disease
progression
Indefinitely or until
progression
At 10 years, adjuvant hormones improved OS from 39% to 49% (p <
0.01) and disease-specific mortality from 78% to 84% (p < 0.01). Subset
analysis showed no survival benefit for
Gleason ≤ 6. Patients derived most benefit if treated with hormones for more than 5 years.
RTOG 86-10(81)
1987 to 1991
Prospectively randomised to RT alone or RT with
4 months of hormone therapy
(prior to and during RT)
456
Bulky disease (T2 - 4) with palpable surface area of > 25 cm2 on
DRE
65 Gy – 70 Gy to prostate,
45 Gy to pelvic lymph
node
Conventional planning
(pelvic lymph node
irradiation in 9% and 7% of patients in RT
only and RT+hormone
groups respectively)
Maximum androgen blockade
(goserelin and flutamide)
2 months before and
during radiotherapy
At 10 years, disease-specific mortality reduced from 36% to 23% with 4
months of hormones (p = 0.01), but improvement in
overall survival was not statistically significant
(34% vs. 43%, p = 0.12).
38
EORTC 22863(82)
1987 to 1995
Prospectively randomised to RT alone or RT with
3 years of concurrent and
adjuvant hormone therapy
415
Localised with high risk features or
locally advanced disease
70 Gy to prostate and SV, 50 Gy to pelvic lymph
nodes
3D CRT (4 field
technique for whole pelvis,
3 or 4 field technique for prostate and
seminal vesicles)
Goserelin starting on first
day of radiotherapy
(with cyproterone
acetate for first month only)
3 years
At 10 years, addition of hormones improved
disease-free survival from 23% to 48% (p < 0.01),
overall survival from 40% to 58% (p < 0.01), and
prostate-cancer mortality from 30% to 10% (p <
0.01).
TROG 96.01(83)
1996 to 2000
All patients receiving RT were
prospectively randomised to no
hormones therapy, 3
months hormone therapy, and 6
months hormone therapy
818
Locally advanced disease, T2b - T4 N0
(stratified by PSA and Gleason)
66 Gy to prostate and
SV
3D CRT with CT (multifield arrangements
allowing shielding
where reasonable)
3 months of goserelin with
flutamide starting 2
months before radiotherapy, or 6 months of the same starting 5 months before radiotherapy
None, 3 months, or 6
months
At 10 years follow up, use of either 3 or 6 months
hormone therapy improved outcomes (of
note, 6 months compared to no hormones improved
overall survival (from 57.5% to 70.8%, p < 0.01))
EORTC 22961(84)
1997 to 2001
Prospectively randomised to RT
with either 6 months or 36
months of hormone therapy
(non-inferiority study)
970 Locally advanced
prostate cancer (73% had T3)
70 Gy to prostate and SV, 50 Gy to pelvic lymph
nodes
3D CRT with 3 or 4 fields with two
target volumes:
whole pelvis and
prostate+SV
LHRH agonist with either
bicalutamide or flutamide
For both cohorts, first 6
months of maximal androgen
blockade (anti-androgen
started 1 week before RT,
LHRH agonist started with RT); For 36
month hormones
cohort, subsequent
At 5 years, overall survival with 6 months hormone
therapy was inferior to 36 months hormone therapy
(81% vs. 84.8%; HR p = 0.65 for non-inferiority).
39
2.5 years was LHRH agonist
alone
RTOG 92-02(85)
1992 to 1995
Prospectively randomised to RT
with either 4 months or 28
months hormone therapy
1,554 Locally advanced disease (T2c - T4)
65 - 70 Gy to prostate, 44 -
50 Gy to pelvic lymph
nodes
Conventional planning (4
field technique for whole pelvis, followed by
conedown to the prostate and seminal
vesicles)
Goserelin and flutamide
All patients had 4 months of hormone therapy (2
months before and 2 months
during RT); long term hormone
therapy cohort received a further 24
months
At 10 years, 28 months of hormone therapy
significantly improved disease free survival (22.5% vs. 13.2%; p < 0.01). Overall survival
benefit at 10 years was noted only in Gleason 8 -
10 patients (45.1% vs. 31.9%; p < 0.01).
DART01/05 GICOR(86)
2005 to 2010
Prospectively randomised to RT with 4 months or
28 months of hormone therapy
355 T1c - 3b N0 M0 with
intermediate-risk and high-risk features
76 Gy – 82 Gy to prostate
and SV (pelvic lymph node
RT was left to participating
centre)
3D CRT with 6 fields
LHRH agonist (goserelin)with
flutamide or bicalutamide
LHRH agonist started 2
months before RT
(antiandrogen started at the
same time, continued for
2 months only),
continued for either 4
months or 28 months in
total
At 5 years, 28 months hormone therapy
improved biochemical disease-free survival (90%
vs. 81%, p = 0.01), and overall survival (95% vs. 86%, p < 0.01) compared
to 4 months hormone therapy. Subgroup
analysis showed that benefits were more
evident in high-risk than intermediate-risk
patients.

40
Prostate Radiotherapy
1.4.1 External beam radiotherapy techniques (IMRT, IGRT)
External beam radiotherapy is a standard definitive treatment option for prostate
cancer(94). It involves the use of a linear accelerator to produce megavoltage photons of
between 4 and 20 MV energy(95). The primary objective of EBRT is to deliver a therapeutic
dose to the target volume whilst minimising dose to benign neighbouring tissues, thereby
achieving high tumour control probability and minimising normal tissue complication
probability(20, 96).
Over the last decades, EBRT planning and delivery methods have evolved with improving
technological advancements. Modern treatment protocols use rotational IMRT (VMAT) or
tomotherapy in conjunction with IGRT. Rotational IMRT involves the continuous delivery of
dose during gantry rotation and multi-leaf collimator (MLC) movements. IMRT is able to
generate steep dose gradients, and allows doses to conform closely to the treatment target
and so greater sparing of the surrounding normal tissues and correspondingly reduced
toxicity(4, 94). During the radiotherapy planning process, dose volume histograms (DVHs)
are used to assess the dose delivered to the treatment targets and organs at risk (OAR). For
the latter, dose constraints are applied during inverse planning to control dose to these
surrounding critical structures. OAR include the rectum, bladder, bowel, femoral heads,
penile bulb and urethra. Modern dose constraints are derived from well-established clinical
trials such as MRC RT01, RTOG studies and CHHiP(97-100). Genito-urinary (GU) and gastro-
intestinal (GI) toxicities are the dose limiting toxicities in prostate radiotherapy, and
complications can significantly reduce QOL(11, 96).
Interfraction movement of the prostate can be large (> 1 cm) especially in the anterior-
posterior directions, and is due to variable filling of deformable organs surrounding the
prostate, namely bladder and rectum(101, 102). Intrafraction movement of the prostate is
variable and tends to be in the anterior-posterior and superior-inferior directions, and is due
to physiological motions including peristalsis and pelvic floor muscle changes(103-105). IGRT
41
uses kV x-rays or cone beam CT imaging to localise the treatment target. Fiducial markers
inserted within the prostate can act as a surrogate of prostate positioning(106, 107). On-
board imaging can be performed daily prior to each fraction to help track internal organ
motion. By being able to determine the positioning of the intended target volume before
each fraction, it allows precise RT delivery and reduction of the treatment volume margins
used(4, 87, 94, 96). This is crucial as geographical miss is a significant risk factor for future
relapse(108). Both IMRT and IGRT are now considered standard in prostate radiotherapy.
Several studies have shown the overall survival benefit of hormone therapy + radiotherapy
over hormone therapy alone (Table 1-6). SPCG-7 showed that if radiotherapy is given in
addition to hormone therapy for locally advanced disease, 10 years prostate cancer specific
mortality and overall mortality reduced significantly (23.9% vs. 11.9%, and 39.4% vs. 29.6%
respectively)(73). PR07 included comparatively higher risk patients and confirmed that the
addition of radiotherapy to hormone therapy significantly improved 10 year overall survival
(55% vs. 49%) and 10 year biochemical progression-free rate (63% vs. 27%). The
radiotherapy toxicities were modest, and G3 toxicities were uncommon(109, 110). These
studies provide strong evidence for the use of radiotherapy with hormone therapy for men
with locally advanced prostate cancer, even with modest radiation doses when compared to
the modern standard used in the current era of at least 75.6 Gy(75). In addition, Mottet et
al. showed that the addition of RT to 3 years of hormone therapy in locally advanced disease
improved 5 year progression free survival (64.7% vs. 15.4%), but overall survival and disease-
specific survival may require longer follow-up to be assessed(111). Even for patients with
pelvic node positive disease, the addition of radiotherapy to hormone therapy led to
improved failure free survival (81% vs. 53%), although longer follow up is required to
determine any improvement in overall survival(112).
Local disease control in high-risk prostate cancer patients is associated with reduced risk of
distant metastasis and cancer-specific mortality, and hence it is important to optimise local
disease control(19, 92). Relapse following radical radiotherapy can be local due to
geographic miss or intrinsic radioresistance(12, 20). Regional or metastatic relapse may
occur due to micrometastatic disease or inaccurate staging at presentation.
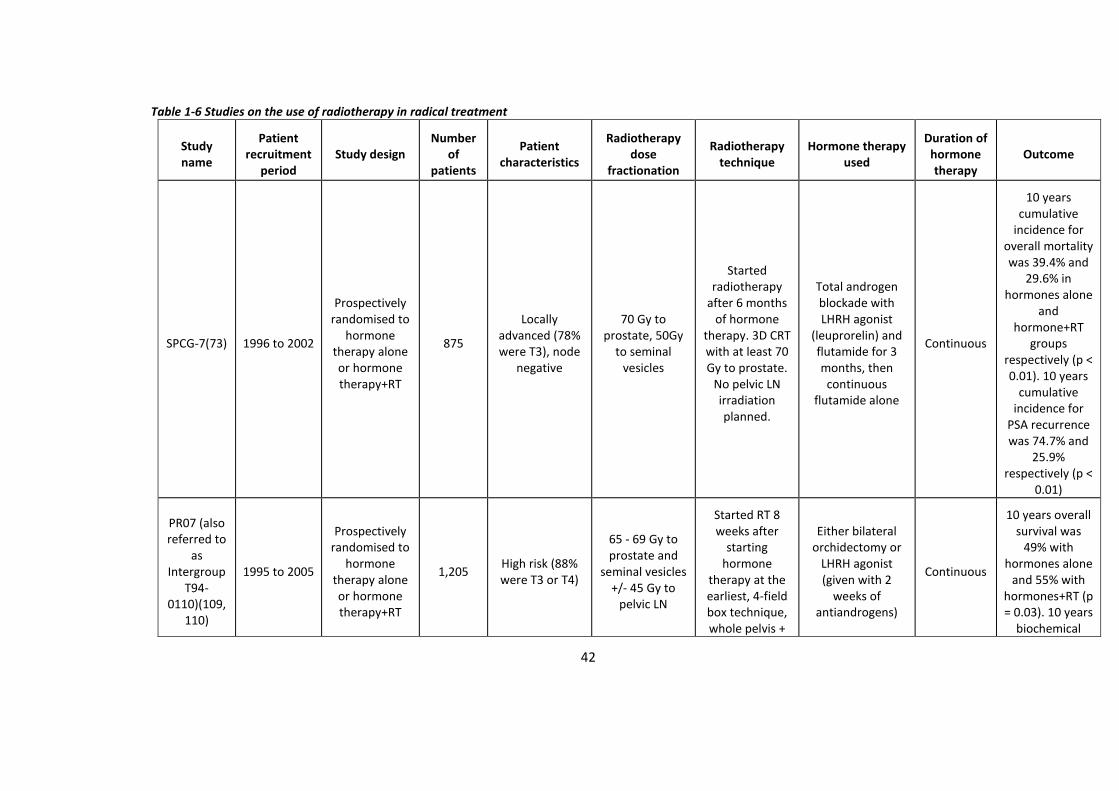
42
Table 1-6 Studies on the use of radiotherapy in radical treatment
Study name
Patient recruitment
period Study design
Number of
patients
Patient characteristics
Radiotherapy dose
fractionation
Radiotherapy technique
Hormone therapy used
Duration of hormone therapy
Outcome
SPCG-7(73) 1996 to 2002
Prospectively randomised to
hormone therapy alone or hormone therapy+RT
875
Locally advanced (78% were T3), node
negative
70 Gy to prostate, 50Gy
to seminal vesicles
Started radiotherapy
after 6 months of hormone
therapy. 3D CRT with at least 70 Gy to prostate.
No pelvic LN irradiation planned.
Total androgen blockade with LHRH agonist
(leuprorelin) and flutamide for 3 months, then
continuous flutamide alone
Continuous
10 years cumulative
incidence for overall mortality was 39.4% and
29.6% in hormones alone
and hormone+RT
groups respectively (p < 0.01). 10 years
cumulative incidence for
PSA recurrence was 74.7% and
25.9% respectively (p <
0.01)
PR07 (also referred to
as Intergroup
T94-0110)(109,
110)
1995 to 2005
Prospectively randomised to
hormone therapy alone or hormone therapy+RT
1,205 High risk (88% were T3 or T4)
65 - 69 Gy to prostate and
seminal vesicles +/- 45 Gy to
pelvic LN
Started RT 8 weeks after
starting hormone
therapy at the earliest, 4-field box technique, whole pelvis +
Either bilateral orchidectomy or
LHRH agonist (given with 2
weeks of antiandrogens)
Continuous
10 years overall survival was
49% with hormones alone
and 55% with hormones+RT (p = 0.03). 10 years
biochemical
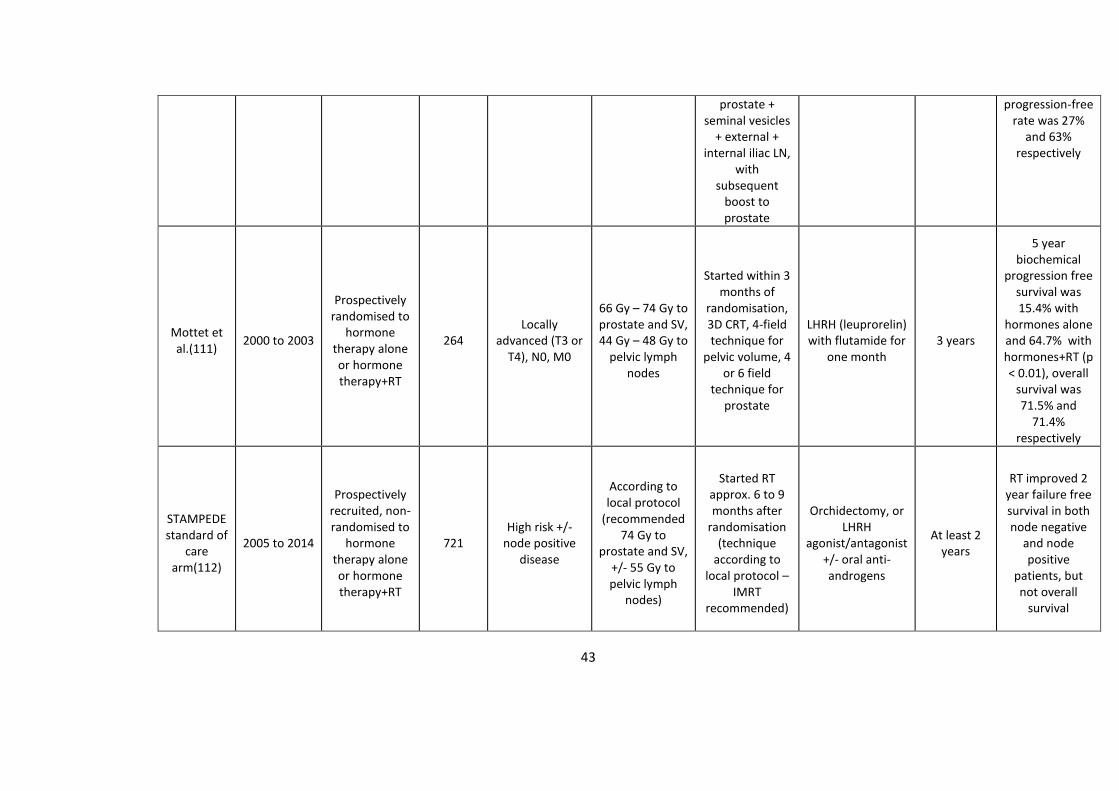
43
prostate + seminal vesicles
+ external + internal iliac LN,
with subsequent
boost to prostate
progression-free rate was 27%
and 63% respectively
Mottet et al.(111)
2000 to 2003
Prospectively randomised to
hormone therapy alone or hormone therapy+RT
264 Locally
advanced (T3 or T4), N0, M0
66 Gy – 74 Gy to prostate and SV, 44 Gy – 48 Gy to
pelvic lymph nodes
Started within 3 months of
randomisation, 3D CRT, 4-field technique for
pelvic volume, 4 or 6 field
technique for prostate
LHRH (leuprorelin) with flutamide for
one month 3 years
5 year biochemical
progression free survival was 15.4% with
hormones alone and 64.7% with hormones+RT (p < 0.01), overall
survival was 71.5% and
71.4% respectively
STAMPEDE standard of
care arm(112)
2005 to 2014
Prospectively recruited, non-randomised to
hormone therapy alone or hormone therapy+RT
721 High risk +/-
node positive disease
According to local protocol
(recommended 74 Gy to
prostate and SV, +/- 55 Gy to pelvic lymph
nodes)
Started RT approx. 6 to 9 months after
randomisation (technique
according to local protocol –
IMRT recommended)
Orchidectomy, or LHRH
agonist/antagonist +/- oral anti-androgens
At least 2 years
RT improved 2 year failure free survival in both node negative
and node positive
patients, but not overall
survival
44
1.4.2 Whole prostate dose escalation RT
Large prospective trials have consistently shown that higher doses given in standard 1.8 Gy
to 2 Gy fractions favour improved biochemical control and disease specific survival which is
maintained for up to 10 years follow-up, with around a 12% improvement in control for a 10
Gy increase in dose(4)(Table 1-7). This was found whether radiotherapy was given with
hormone therapy (MD Anderson study, Dutch trial, RT01) or without hormone therapy
(PROG/ACR95-09, GETUG 06, RTOG 0126). Zelefsky et al. retrospectively reviewed 2,047
patients treated by 3DCRT with doses between 66 Gy and 86.4 Gy, and found no differences
in biochemical relapse free survival or distant metastasis free survival for low risk patients,
but significant improvement with higher doses for intermediate and high risk patients(113).
The evidence for whole prostate escalation radiotherapy is strongest for intermediate and
high risk, with MD Anderson finding most benefit for those with PSA > 10 ng/ml, and GETUG
06 for those with PSA > 15 ng/ml. Another large retrospective non-randomised study found
that intermediate and high risk patients did derive an overall survival benefit when treated
with 75.6 Gy to 90 Gy total doses when compared with 68.4 Gy to <75.6 Gy(114). Finally, the
RT01 trial (which compared 64 Gy with 74 Gy) used hormone therapy in all patients, and
confirmed benefit in biochemical control with the higher dose although overall survival was
not significantly improved(115).
With this improvement in biochemical control from dose escalation, toxicity also increases
in tandem(87). These studies had used various different toxicity grading tools, but had all
used versions of RTOG scoring which allows some comparison between them (Table 1-7).
Acute toxicity was similar between lower and higher doses but PROG/ACR 95-09 did show
higher acute GI toxicity with higher doses, and RT01 showed more patients had G≥2 GU and
GI toxicity between 8 to 10 weeks, although they settled and were similar at around week
12 and 18.
In comparison, late toxicity was higher with higher doses, especially for GI (MD Anderson,
Dutch study, GUTUG 06, RT01, and RTOG 0126) although two trials also showed this for
urinary toxicity (GETUG 06 and RTOG 0126). A meta-analysis showed that dose escalation
using 3DCRT increased significantly the risk of late G2 GU and GI toxicity(116).
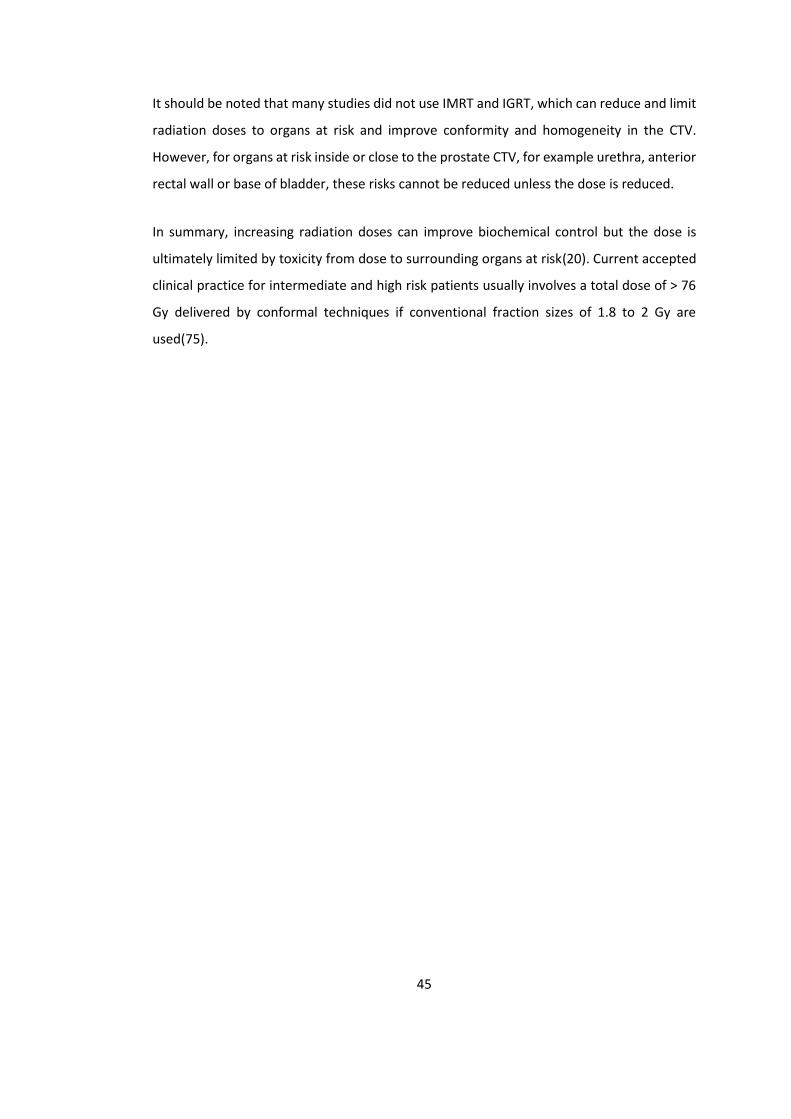
45
It should be noted that many studies did not use IMRT and IGRT, which can reduce and limit
radiation doses to organs at risk and improve conformity and homogeneity in the CTV.
However, for organs at risk inside or close to the prostate CTV, for example urethra, anterior
rectal wall or base of bladder, these risks cannot be reduced unless the dose is reduced.
In summary, increasing radiation doses can improve biochemical control but the dose is
ultimately limited by toxicity from dose to surrounding organs at risk(20). Current accepted
clinical practice for intermediate and high risk patients usually involves a total dose of > 76
Gy delivered by conformal techniques if conventional fraction sizes of 1.8 to 2 Gy are
used(75).

46
Table 1-7 Studies on whole prostate dose escalation radiotherapy All studies are prospectively randomised to standard dose or escalated dose of RT
Study name Patient
recruitment period
Number of
patients
Patient characteristics
Radiotherapy dose
fractionation
Radiotherapy technique
Hormone therapy used
Disease outcome
GU toxicity GI toxicity Toxicity
score used
Acute Late Acute Late
MD Anderson(117-
119)
1993 to 1998
301 T1b - T3, N0,
M0
70 Gy or 78 Gy (2 Gy per
fraction)
4 field box technique up to 46 Gy. For 70 Gy arm, rest of dose
delivered with smaller
field sizes. For 78 Gy arm, rest of dose delivered by 3DCRT with 6
fields.
No neoadjuvant,
concurrent, or adjuvant hormone therapy
At 8.7 years, 78 Gy had
better biochemical control than 70 Gy (78% vs. 59%; p <
0.01)
For 70 Gy and 78 Gy,
G≤2 was 90% and 97% (p > 0.4), G3 for 1 patient per group, G4 for 2 and 0
patients respectively
For 70 Gy and 78 Gy,
10 year incidence of G≥2 was 8%
and 13% (not sig
different), G3 was 5%
and 4% respectively
For 70 Gy and 78 Gy,
G≤2 was 97% and 100% (p > 0.4), G3 for no patients, G4 for 0 and
1 patien respectively
For 70 Gy and 78 Gy,
10 year incidence of
G≥2 was 13% and 26% (p =
0.013); G3 was 1% and
7% respectively (p = 0.018)
Acute toxicity: RTOG
Late toxicity: modified
RTOG-LENT
Dutch trial(120-123)
1997 to 2003
664 T1b - T4, N0,
M0
68 Gy or 78 Gy (2 Gy per
fraction) Mainly 3DCRT
(Neo)adjuvant hormone
therapy was used in 30% of
patients (6 months or 3
years)
At 9 years, 78 Gy had better bioochemical control than 68 Gy (54% vs. 47%; p =
0.03), but not overall
survival (69% vs. 69%; p =
0.9).
For 68 Gy and 78 Gy,
G≤2 was 40% and 42%
respectively, and G3 was
13% and 13%
respectively (p = 0.5)
For 68 Gy and 78 Gy, 7
year incidence of
G≥2 was 41% and 40%
respectively (p = 0.6),
G≥3 was 12% and 13%
respectively (p = 0.6), G4
was 1% in both arms
For 68 Gy and 78 Gy,
G≤2 was 41% and 47%
respectively, and G3 was 6% and 4% respectively
(p = 0.5)
For 68 Gy and 78 Gy, 7
year incidence of
G≥2 was 25% and 35%
respectively (p = 0.04),
G≥3 was 4% and 6%
respectively (p = 0.3), G4 was 0 and
1% respectively
Acute toxicity: RTOG
Late toxicity: modified RTOG and
EORTC
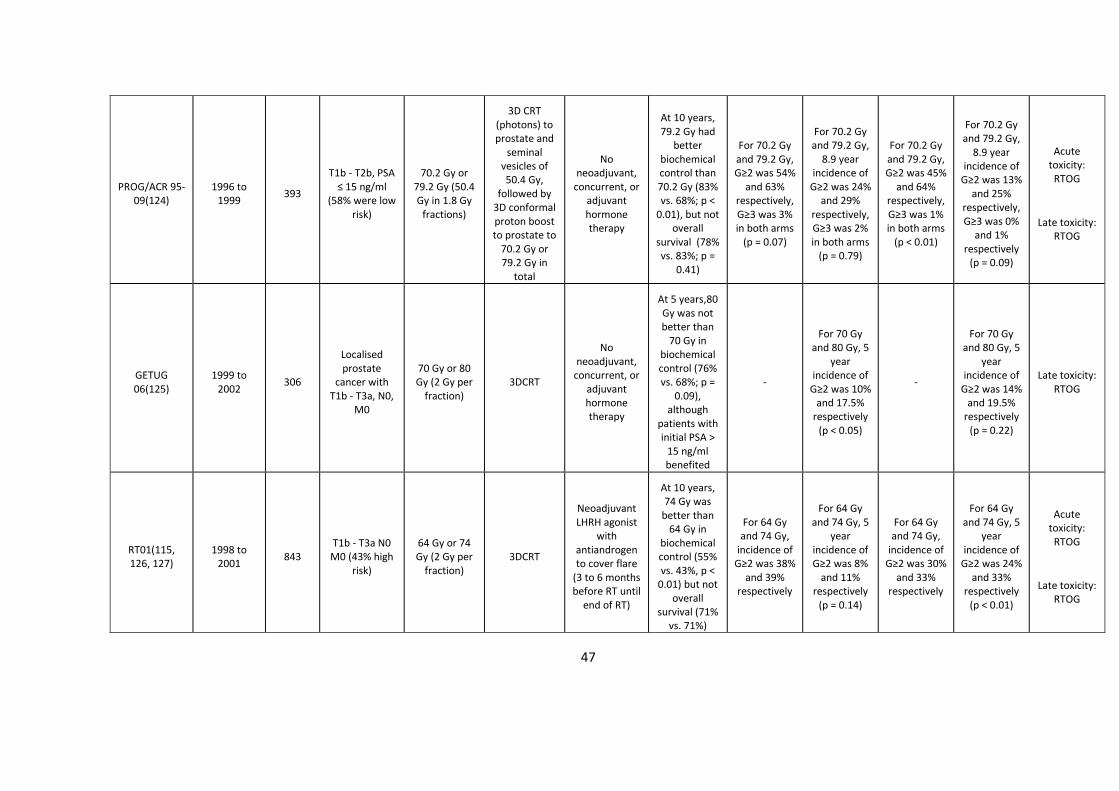
47
PROG/ACR 95-09(124)
1996 to 1999
393
T1b - T2b, PSA ≤ 15 ng/ml
(58% were low risk)
70.2 Gy or 79.2 Gy (50.4 Gy in 1.8 Gy
fractions)
3D CRT (photons) to prostate and
seminal vesicles of 50.4 Gy,
followed by 3D conformal proton boost to prostate to
70.2 Gy or 79.2 Gy in
total
No neoadjuvant,
concurrent, or adjuvant hormone therapy
At 10 years, 79.2 Gy had
better biochemical control than 70.2 Gy (83% vs. 68%; p <
0.01), but not overall
survival (78% vs. 83%; p =
0.41)
For 70.2 Gy and 79.2 Gy, G≥2 was 54%
and 63% respectively, G≥3 was 3% in both arms
(p = 0.07)
For 70.2 Gy and 79.2 Gy,
8.9 year incidence of
G≥2 was 24% and 29%
respectively, G≥3 was 2% in both arms
(p = 0.79)
For 70.2 Gy and 79.2 Gy, G≥2 was 45%
and 64% respectively, G≥3 was 1% in both arms
(p < 0.01)
For 70.2 Gy and 79.2 Gy,
8.9 year incidence of
G≥2 was 13% and 25%
respectively, G≥3 was 0%
and 1% respectively
(p = 0.09)
Acute toxicity: RTOG
Late toxicity: RTOG
GETUG 06(125)
1999 to 2002
306
Localised prostate
cancer with T1b - T3a, N0,
M0
70 Gy or 80 Gy (2 Gy per
fraction) 3DCRT
No neoadjuvant,
concurrent, or adjuvant hormone therapy
At 5 years,80 Gy was not better than
70 Gy in biochemical control (76% vs. 68%; p =
0.09), although
patients with initial PSA >
15 ng/ml benefited
-
For 70 Gy and 80 Gy, 5
year incidence of
G≥2 was 10% and 17.5%
respectively (p < 0.05)
-
For 70 Gy and 80 Gy, 5
year incidence of
G≥2 was 14% and 19.5%
respectively (p = 0.22)
Late toxicity: RTOG
RT01(115, 126, 127)
1998 to 2001
843 T1b - T3a N0 M0 (43% high
risk)
64 Gy or 74 Gy (2 Gy per
fraction) 3DCRT
Neoadjuvant LHRH agonist
with antiandrogen to cover flare
(3 to 6 months before RT until
end of RT)
At 10 years, 74 Gy was
better than 64 Gy in
biochemical control (55% vs. 43%, p <
0.01) but not overall
survival (71% vs. 71%)
For 64 Gy and 74 Gy,
incidence of G≥2 was 38%
and 39% respectively
For 64 Gy and 74 Gy, 5
year incidence of G≥2 was 8%
and 11% respectively
(p = 0.14)
For 64 Gy and 74 Gy,
incidence of G≥2 was 30%
and 33% respectively
For 64 Gy and 74 Gy, 5
year incidence of
G≥2 was 24% and 33%
respectively (p < 0.01)
Acute toxicity: RTOG
Late toxicity: RTOG
48
RTOG 0126(128)
2002 to 2008
1,532
Intermediate risk (cT1b - T2b with Gleason 2 - 6 and PSA ≥
10 and < 20, or Gleason 7 and
PSA < 15)
70.2 Gy or 79.2 Gy (1.8
Gy per fraction)
3DCRT
No neoadjuvant,
concurrent, or adjuvant hormone therapy
At 10 years,79.2 Gy
was better than 70.2 Gy
in biochemical control (74% vs. 57%, p <
0.01) but not overall
survival (67% vs. 66%)
-
For 70.2 Gy and 79.2 Gy,
10 year incidence of
G≥2 was 10% and 15% (p <
0.01)
-
For 70.2 Gy and 79.2 Gy,
10 year incidence of
G≥2 was 16% and 22% (p <
0.01)
Late toxicity: RTOG/EORTC
49
1.4.3 Hypofractionated RT
Conventional fractionation schedules require 7 to 8 weeks of daily treatments, which can be
logistically and financially challenging for patients, and it limits patient throughput for the
finite health resources in the NHS, with its limited number of available linear
accelerators(92).
Radiobiological studies have shown that prostate cancer has a low alpha/beta ratio of
around 1.8 Gy(129). A low alpha/beta ratio allows greater sensitivity to increasing fraction
size(130). The alpha/beta ratio of surrounding late reacting OAR such as rectum and bladder
are higher at around 3 to 4 Gy. Therefore hypofractionation can improve the therapeutic
ratio(131). Currently, two broad categories of hypofractionated radiotherapy are
recognised: moderate hypofractionation (around 2.5 Gy/# to 3.5 Gy/#) and extreme
hypofractionation (> 5 Gy/#).
For disease control, several randomised trials of moderately hypofractionated schedules
have demonstrated non-inferior biochemical control compared to conventional
fractionation of around 1.8 Gy/# to 2.0 Gy/# with a trend in favouring hypofractionation,
including a large UK based study called CHHiP which showed that 60 Gy/20 # is non-inferior
to 74 Gy/37 # in disease control (Table 1-8). However one trial, the MD Anderson study, did
demonstrate a significant improvement in treatment outcome with 2.4 Gy/# (72 Gy total
dose) over 1.8 Gy/# (75.6 Gy total dose) over 8.4 years despite being a small study with an
increase of 0.6 Gy/# only(132, 133).
For toxicity, there are differences between acute and late toxicity (Table 1-8). For acute
toxicity, Pollack and NRG0415 did not find differences in urinary or bowel toxicity (although
the former found that patients with pre-existing impaired urinary function had significantly
worse function after hypofractionated radiotherapy), but PROFIT and HYPRO did show more
acute GI toxicity but not more acute GU toxicity(134-137). This may have been due to the
lack of image guidance, including the seminal vesicle in the high dose planning volume, and
bladder dose constraints used in radiotherapy planning and delivery for HYPRO. CHHiP found
that acute toxicity in the hypofractionated arms had faster onsets and higher peaks, and also
returned to baseline faster. For late toxicity, MD Anderson and Arcangeli found no difference
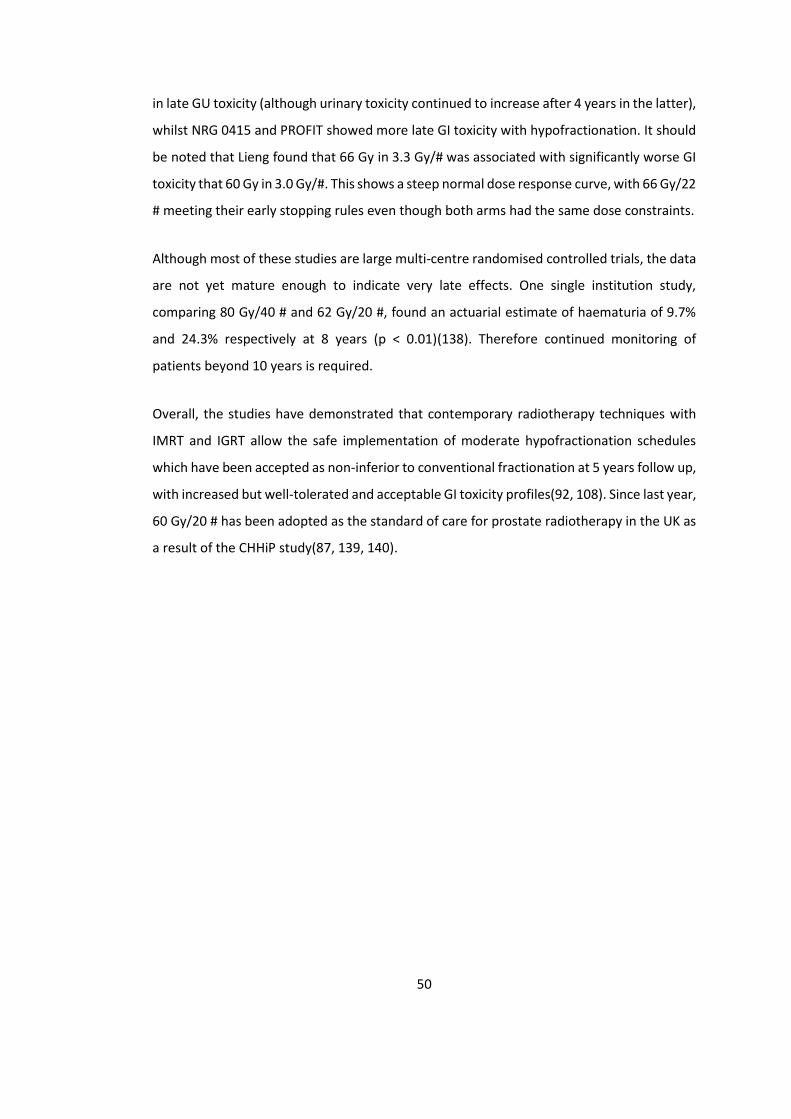
50
in late GU toxicity (although urinary toxicity continued to increase after 4 years in the latter),
whilst NRG 0415 and PROFIT showed more late GI toxicity with hypofractionation. It should
be noted that Lieng found that 66 Gy in 3.3 Gy/# was associated with significantly worse GI
toxicity that 60 Gy in 3.0 Gy/#. This shows a steep normal dose response curve, with 66 Gy/22
# meeting their early stopping rules even though both arms had the same dose constraints.
Although most of these studies are large multi-centre randomised controlled trials, the data
are not yet mature enough to indicate very late effects. One single institution study,
comparing 80 Gy/40 # and 62 Gy/20 #, found an actuarial estimate of haematuria of 9.7%
and 24.3% respectively at 8 years (p < 0.01)(138). Therefore continued monitoring of
patients beyond 10 years is required.
Overall, the studies have demonstrated that contemporary radiotherapy techniques with
IMRT and IGRT allow the safe implementation of moderate hypofractionation schedules
which have been accepted as non-inferior to conventional fractionation at 5 years follow up,
with increased but well-tolerated and acceptable GI toxicity profiles(92, 108). Since last year,
60 Gy/20 # has been adopted as the standard of care for prostate radiotherapy in the UK as
a result of the CHHiP study(87, 139, 140).
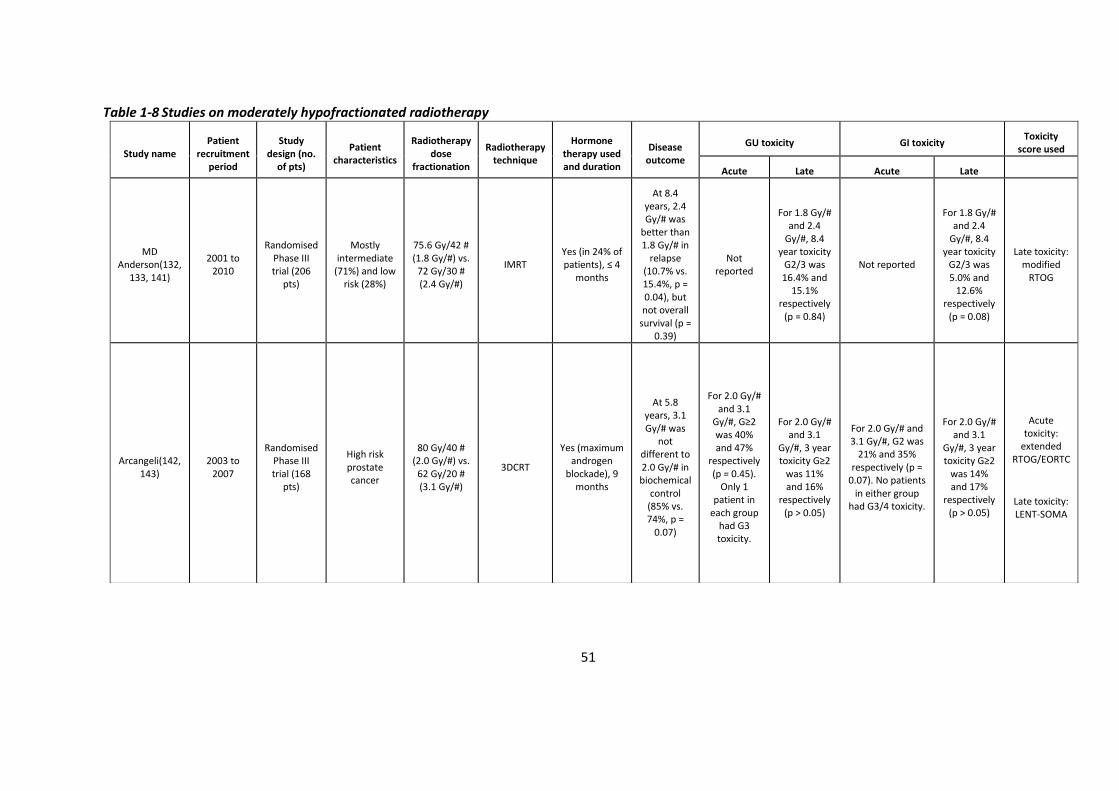
51
Table 1-8 Studies on moderately hypofractionated radiotherapy
Study name Patient
recruitment period
Study design (no.
of pts)
Patient characteristics
Radiotherapy dose
fractionation
Radiotherapy technique
Hormone therapy used and duration
Disease outcome
GU toxicity GI toxicity Toxicity
score used
Acute Late Acute Late
MD Anderson(132,
133, 141)
2001 to 2010
Randomised Phase III trial (206
pts)
Mostly intermediate
(71%) and low risk (28%)
75.6 Gy/42 # (1.8 Gy/#) vs.
72 Gy/30 # (2.4 Gy/#)
IMRT Yes (in 24% of patients), ≤ 4
months
At 8.4 years, 2.4 Gy/# was
better than 1.8 Gy/# in
relapse (10.7% vs. 15.4%, p = 0.04), but not overall
survival (p = 0.39)
Not reported
For 1.8 Gy/# and 2.4
Gy/#, 8.4 year toxicity
G2/3 was 16.4% and
15.1% respectively
(p = 0.84)
Not reported
For 1.8 Gy/# and 2.4
Gy/#, 8.4 year toxicity
G2/3 was 5.0% and
12.6% respectively
(p = 0.08)
Late toxicity: modified
RTOG
Arcangeli(142, 143)
2003 to 2007
Randomised Phase III trial (168
pts)
High risk prostate cancer
80 Gy/40 # (2.0 Gy/#) vs.
62 Gy/20 # (3.1 Gy/#)
3DCRT
Yes (maximum androgen
blockade), 9 months
At 5.8 years, 3.1 Gy/# was
not different to 2.0 Gy/# in biochemical
control (85% vs. 74%, p =
0.07)
For 2.0 Gy/# and 3.1
Gy/#, G≥2 was 40% and 47%
respectively (p = 0.45).
Only 1 patient in
each group had G3 toxicity.
For 2.0 Gy/# and 3.1
Gy/#, 3 year toxicity G≥2
was 11% and 16%
respectively (p > 0.05)
For 2.0 Gy/# and 3.1 Gy/#, G2 was
21% and 35% respectively (p =
0.07). No patients in either group
had G3/4 toxicity.
For 2.0 Gy/# and 3.1
Gy/#, 3 year toxicity G≥2
was 14% and 17%
respectively (p > 0.05)
Acute toxicity:
extended RTOG/EORTC
Late toxicity: LENT-SOMA

52
Pollack(134) 2002 to
2006
Randomised Phase III
study (303 pts)
Intermediate (66%) and
high (34%) risk
76 Gy/38 # (2.0 Gy/#) vs. 70.2 Gy/26 # (2.7 Gy/#) (if
LN treatment, 56 Gy/38 # and 50-52 Gy/26 #
respectively)
IMRT; pelvic LN treatment given in 35% of patients
Yes (in 46% of patients), 75%
had 24 months
At 5 year, 2.7 Gy/# was not
better than 2.0 Gy/# in biochemical
control (77% vs. 79%, p =
0.75)
No difference in toxicity (p =
0.58)
For 2.0 Gy/# and 2.7
Gy/#, 5 year toxicity G≥2 was 13.4% and 21.5%
respectively (p = 0.16)
No difference in toxicity (p = 0.57)
For 2.0 Gy/# and 2.7
Gy/#, 5 year toxicity G≥2 was 22.5% and 18.1%
respectively (p = 0.39)
Acute toxicity: modified
LENT/RTOG
Late toxicity: modified
LENT/RTOG
Lieng (precursor
study to PROFIT)(144)
2001 to 2005
Phase II study (123
pts)
Mostly intermediate
(67%) and low risk (26%)
60 Gy/20 # (3.0 Gy/#) vs.
66 Gy/22 # (3.3 Gy/#)
IMRT and IGRT
Yes (in 10% of pts), 3 to 36
months duration
At 8 years, 3.3 Gy/# was not
better than 3.0 Gy/# in biochemical
control (73% vs. 67%, p =
0.22)
Not reported
For 3.0 Gy/# and 3.3
Gy/#, 8 year toxicity G≥2
was 13% and 8%, and G≥3 was 2%
and 4% respectively
Not reported
For 3.0 Gy/# and 3.3
Gy/#, 8 year toxicity G≥2 was 4% and
18%, and G≥3 was 1%
and 11% respectively
Late toxicity: RTOG
RTOG NRG 0415(135)
2006 to 2009
Randomised non-
inferiority phase III
(1092 pts)
Low risk prostate cancer
73.8 Gy/41 # (1.8 Gy/#) vs. 70 Gy/28 # (2.5 Gy/#)
3DCRT (21%) and IMRT
(79%) None
At 5 years, 2.5 Gy/# was non
inferior to 1.8 Gy/# for disease free
survival (86.3% vs.
85.3%)
For 1.8 Gy/# and 2.5
Gy/#, G≥2 was 27.1% and 27.0%
respectively (p = 0.83)
For 1.8 Gy/# and 2.5
Gy/#, 5 year toxicity G≥2 was 22.8% and 29.7%
respectively, and ≥ G3 was 2.3% and 0%
respectively (p = 0.06)
For 1.8 Gy/# and 2.5 Gy/#, G≥2 was 10.3% and 10.7% respectively (p =
0.54)
For 1.8 Gy/# and 2.5
Gy/#, 5 year toxicity G≥2
was 14% and 22.4%
respectively, and ≥ G3 was 2.6% and 4.1%
respectively (p = 0.002)
Acute toxicity: CTCAE
Late toxicity: CTCAE
53
PROFIT(136) 2005 to
2012
Randomised non-
inferiority phase III
(1206 pts)
Intermediate risk prostate
cancer
78 Gy/39 # (2.0 Gy/#) vs.
60 Gy/20 # (3.0 Gy/#)
3DCRT or IMRT, IGRT
Hormone therapy
allowed up to 90 days pre-
randomisation
At 6 years, 3.0 Gy/# was non
inferior to 2.0 Gy/# for biochemical
control (72.7% vs. 71.6%, p < 0.01), and for overall
survival (87.5% vs.
87.0%)
For 2.0 Gy/# and 3.0
Gy/#, G≥2 was 31% and 30%
respectively (p = 0.93) ,
and G≥3 was 4.0% in both
arms (p = 0.97)
For 2.0 Gy/# and 3.0
Gy/#, G≥2 was 22% in both groups (p = 0.98),
and G≥3 was 3.0% and
2.1% respectively
(p = 0.33)
For 2.0 Gy/# and 3.0 Gy/#, G≥2 was
10% and 16% respectively (p < 0.01), and G≥3 was 0.5% and
0.7% respectively (p = 0.74)
For 2.0 Gy/# and 3.0
Gy/#, G≥2 was 14% and 9%
respectively (p < 0.01),
and G≥3 was 2.8% and
1.5% respectively
(p = 0.10)
Acute toxicity: RTOG
Late toxicity: RTOG
CHHiP(10, 87) 2002 to
2011
Randomised non-
inferiority phase III
(3216 pts)
All risk groups, mostly
intermediate risk (73%)
74 Gy/37 # (2.0 Gy/#) vs.
60 Gy/20 # (3.0 Gy/#) vs.
57 Gy/19 # (3.0 Gy/#)
Forward or inverse planned
IMRT
Yes (median 5.6 months)
At 5 years: biochemical
control rates were
88.3% (control), 90.5% (60 Gy), and
85.8% (57 Gy); OS
were 91.4% (control), 93.2% (60 Gy), and
91.9% (57 Gy)
G≥2 were 46.4%,
49.5% and 45.9% in 74 Gy, 60 Gy and 57 Gy
arms respectively,
and G≥3 were 8.2%, 9.2% and
9.3% respectively
(not sig difference)
At 5 years, G≥2 was 13.5%,
13.2% and 11.2% in 74 Gy, 60 Gy and 57 Gy
arms respectively
G≥2 were 24.6%, 38.5% and 37.8% in 74 Gy, 60 Gy and 57 Gy arms
respectively, and G≥3 were 0.8%, 2.4% and 2.2%
respectively (significantly
higher in hypofractionation
arms)
At 5 years, G≥2 was
1.3%, 2.3% and 2.0% in 74 Gy, 60 Gy
and 57 Gy arms
respectively
Acute toxicity: RTOG
Late toxicity: RTOG for GI, LENT-SOMA
for GU
HYPRO(137, 145, 146)
2007 to 2010
Randomised phase III (820 pts)
High (73%) and
intermediate (27%) risk
78 Gy/39 # (2.0 Gy/#) vs. 64.6 Gy/ 19#
(3.4 Gy/#)
IMRT and IGRT
Yes (in 67% of patients),
median 1.7 months before
RT
At 5 years, 3.4 Gy/#
was similar to 2.0 Gy/# for relapse
free survival (81% vs. 77%, p =
0.36)
For 2.0 Gy/# and 3.4
Gy/#, G≥2 was 58% and 61%
respectively (p = 0.43)
For 2.0 Gy/# and 3.4
Gy/#, 5 year toxicity G≥3 was 12.9% and 19%
respectively (p = 0.02)
For 2.0 Gy/# and 3.4 Gy/#, G≥2 was
31% and 42% respectively (p <
0.01)
For 2.0 Gy/# and 3.4
Gy/#, 5 year toxicity G≥3
was 2.6% and 3.3%
respectively (p = 0.55)
Acute toxicity:
RTOG-EORTC
Late toxicity: RTOG-EORTC
54
1.4.4 Dose painting RT
The standard treatment approach to prostate radiotherapy involves the delivery of a
homogeneous treatment dose distribution to the whole organ, in part due to the inability of
identifying tumours on planning CT scans(20, 147). However, improved imaging modalities
have now allowed the visualisation of intra-prostatic lesions as discussed above.
Studies have investigated treating only the intra-prostatic lesions instead of the whole organ,
but found that this leads in worse biochemical outcomes(4). This may be due to multiple
factors, including geographic miss of intended targets and that the disease may be multifocal
with microscopic disease not identified on imaging and therefore not included in treatment
volumes. Therefore it remains crucial to maintain an adequate dose to the whole organ(92).
Instead of dose escalating to the whole prostate which comes at the cost of increased
toxicity, it would be rational to perform focal dose escalation to regions with high risk of
potential recurrence whilst treating the whole prostate to an adequate dose (dose painting
radiotherapy), thereby optimising both disease control and preserving erectile, urinary and
rectal function. As discussed previously, prospective randomised clinical trials have shown
that the addition of hormone therapy to RT improves overall survival, whilst whole organ
dose escalation has not with the follow up durations so far. As the trials on combining
hormone therapy and RT were performed with low radiotherapy doses, the survival benefit
of hormone therapy (short and/or long course) may be reduced or lost if dose escalation is
performed with modern techniques(75). Therefore it may be possible to reduce the duration
hormone therapy if these new techniques are used.
Determining a clinically relevant, high risk region within the prostate that would benefit from
dose intensification is a prerequisite for dose painting radiotherapy(20). Macroscopic
disease is more treatment resistant than microscopic disease, and disease recurrence has
been shown to usually occur at the site of the dominant lesions at staging(4, 87, 148).
Therefore these lesions often drive the natural progression of the cancer, and it would be
reasonable to use macroscopic disease (referred to as dominant intra-prostatic lesions
(DILs)) with a margin to create boost volumes(20).
55
Both functional MRI and PET can provide complimentary information(4, 14). Combined
boost volumes from different imaging modalities will be larger with a higher toxicity risk, but
may include more of the primary tumour volumes and hence may be more effective than
using a single imaging modality alone. These imaging modalities are fused to the planning CT
scan. Multi-modality image registration involves a geometric transformation to align
landmarks between the corresponding scans. Implanted fiducial markers within the prostate
can be used as points of reference given that the in vivo configuration of prostate in relation
to surrounding tissues will be altered by differing bladder and rectal filling(20). Registration
can be performed manually with the clinician using their visual judgement, or automatically
by rigid (allowing only linear transformations e.g. translation and rotation) or deformable
(allowing warping to potentially achieve better matching) registration(11). Both manual and
automatic registrations of the prostate between CT and MRI are comparable(149).
Deformable registration may not be available with some planning softwares and the
expertise for it may not be present at some treatment centres, and so rigid registration is
often used(20).
Avoiding geometric miss is especially important for prostate dose painting radiotherapy as
the target boost volumes are relatively small, and increased toxicity may occur if organs at
risk migrate into the dose escalation region. For example, if boost volumes are located at the
peripheral zone of the prostate, the rectum may move within the boost region(20). Both
delineating and radiotherapy planning are based on a scan performed at a specific time
point, with which a course of treatment is delivered over several weeks. Hence the actual
treatment received by a patient may not reflect the dose distribution planned, and
accounting for target movement is crucial(150). Therefore image guidance is a prerequisite
to safely achieve dose painting(151).
Boost volumes can be defined using either the DILs or by the region of the prostate. The
former involves identifying the clinically significant lesions. This can be based on size,
features on imaging such as intensity of tracer uptake on PET, and any other information
such as Gleason score on template biopsies. This delineating is a subjective process based
on clinician judgement. For instance, some would argue that lesions of < 0.5 mls will not
require dose escalation as they would be treated adequately by the standard dose, and that
larger lesions are more likely to determine future clinical progression(11). The other strategy

56
of boosting a whole region of the prostate (e.g. the middle third of the right side of the
prostate) has the benefit of treating multiple tumour foci, but would result in dose escalating
more extensive volumes of the prostate (11).
The higher biologically effective radiation dose for dose painting can be produced by
delivering a higher total dose or higher dose per fraction(20). The former can be achieved by
sequential boosting, whereby standard radiation is delivered to the whole organ in the initial
phase, followed by additional focused treatment to the boost volume. This is suitable for
tumour sites where treatment should ideally be instigated without delay, and it allows the
use of different radiotherapy methods including electrons to be combined to produce the
desired dose distributions(20). However, tissue response to the initial phase complicates
subsequent registration for the following boost phase which often uses pre-treatment data
for planning. Also, the sequential boost strategy often increases doses to the PTV outside
the boost volume as there is spill over from the phase II into the phase I volume and can
increase normal tissue doses. In comparison, dose painting by using higher doses per fraction
can be delivered by simultaneous integrated boost (SIB), whereby IMRT (static or rotational)
can be used to plan a heterogeneous dose distribution with a concomitant boost, all in a
single phase. In comparison with sequential boosting, this allows the need for one
radiotherapy plan only and should therefore improve conformality(20).
Dose painting have already been used for prostate radiotherapy and other sites(20, 152).
For the former, previous dosimetric studies have shown that it is feasible to deliver a boost
dose to MRI defined intra-prostatic lesions without compromising the dose to the whole
prostate or the dose constraints to surrounding organs at risk(153-156). For treatment
delivery, different techniques have been combined including EBRT, brachytherapy and
stereotactic radiosurgery.
Studies which have only used EBRT for prostate dose painting radiotherapy are shown in the
Table 1-9. Intra-prostatic lesions have been identified by various methods: MRI, SPECT and
PET. In the non-randomised studies where dose painting was performed if intra-prostatic
lesions were identified, the proportion of patients who received dose painting varied from
51% to 69%. Of note, Wong et al. (which was a single cohort study) reported that 28% of
patients did not have uptake on ProstaScint, and Schild found that 21% of patients did not
57
have an intra-prostatic lesion on MRI, whilst Pinkawa found that ≥ 3 lesions were found in
13% of patients(157-159). As expected, IMRT was used to deliver the boost doses for all the
studies, and daily IGRT methods used included ultrasound, CBCT, and fiducial markers
(ultrasound based studies predated the use of fiducial markers). The margin added to the
intra-prostatic lesions varied from no margin (e.g. Sundahl) to 15 mm (Ippolito)(158, 160).
All the studies used SIB except Miralbell which used sequential phase II boost of up to 16 Gy
in 2# (this study was the only one that delivered pelvic radiotherapy (50.4 Gy/28 #) also, to
56% of patients)(101). The EQD2 to prostate varied from 64 Gy to 81 Gy, and EQD2 to boost
varied from 80 Gy to 114 Gy.
Despite these boost levels, the toxicity levels reported were clinically safe and FLAME
reported no significant difference in toxicity up to 2 years follow up between patients
receiving standard treatment and those receiving dose painting. For late urinary toxicity,
patients with prior TURP were more likely to develop late urinary incontinence (Sundahl)
and toxicity was related with prostatic urethral dose (Ippolito). Late rectal toxicity was
related to higher rectal Dmean and V30 mean values (Ippolito).
Most of these dose painting prostate radiotherapy studies have used conventional dose
fractionations. Only one study has investigated this technique using the current UK standard
moderately hypofractionated dose fractionation of 60 Gy/20 #/4 weeks(161). This small pilot
study of 28 patients with intermediate and high risk prostate cancer was performed at the
Clatterbridge Cancer Centre NHS Foundation Trust, and used mpMRI to identify DILs to
which a boost dose of up to 68 Gy were delivered. Most of the patients achieved 68 Gy boost
(25 out of 28 patients), and the rest achieved 67 Gy only due to proximity of DIL to urethra
and rectum. With follow up of at least 32 months, no patients had grade 3 urinary or bowel
toxicity, and only 3 patients had disease relapse. As a result of the low toxicity levels in this
pilot study, the phase II single arm BIOPROP20 clinical trial was established.
Other treatment modalities specifically targeting the DILs without the sole use of
conventional external beam ionising radiation are also being investigated. Brachytherapy
involves either the permanent implantation (low dose rate, LDR) or temporary placement
(high dose rate, HDR) of radiation sources directly into the target, and can be performed
alone or in combination with external beam radiotherapy for focal dose escalation.

58
Stereotactic ablative body radiation (SABR) therapy involves the delivery of a high ablative
dose to the target in a few fractions (often < 5) whilst avoiding surrounding OARs via steep
dose gradients by using precise targeting, effective immobilisation, and tumour motion
management. For brachytherapy, the mean EQD2 boost dose (if α/β ratio for prostate is 1.5
Gy) that has been delivered in clinical trials is 178 Gy (range 150 to 217 Gy, with average
differential dose when compared to the non-boosted prostate of 62 Gy) by LDR, and 106 Gy
(range 90 to 151 Gy, with average differential dose of 32Gy) by HDR(162). For SABR, the
mean EQD2 boost dose has been 136 Gy (range 90 to 164 Gy, with average differential dose
of 45 Gy). Available biochemical disease-free survival (bDFS) for LDR was 85% to 98% at 5
years, for HDR was 71% to 100% at 5 years, and for SABR was 96% to 100% at 2 years. In
terms of side effects, the median G≥3 acute and late GU toxicity were 0% and 2% for LDR,
3% and 5% for HDR, and 6% and 6% for SABR respectively. The median G≥3 acute and late
GI toxicity were 0% and 6% for LDR, 0% and 4% for HDR, and 2% and 10% for SABR
respectively. Overall, these techniques allowed increased differential doses between the
boosted and non-boosted prostate when compared to using EBRT alone (differential dose of
18Gy in BIOPROP20).
Techniques specifically targeting the DILs without the use of ionising radiation include
cryotherapy and high-intensity focused ultrasound (HIFU). Case series have been reported
for both technologies. These treat the tumour volume with a 6-8 mm margin, but not the
whole prostate. Cryotherapy is an invasive procedure often with the patient under general
anaesthetic where consecutive freezing and thawing of the target leads to cytolysis. A UK-
based series of 122 patients with intermediate (71%) and high (29%) risk disease had a 3
years failure free survival of 91%, with 0% patients having urinary incontinence and 16%
having erectile dysfunction(163). HIFU involves delivering focused ultrasound waves to
create irreversible coagulation necrosis and tumour lysis in a target by thermal effect. A UK-
based series of 625 patients (84% had either intermediate or high risk disease) had a 5 years
failure free survival of 88%, with 2% having urinary incontinence(164). The maximal length
of HIFU systems currently available is up to 67 mm, and so this technique is limited in large
prostates and anterior DILs.
Other techniques investigated include focal laser ablation (FLA), photodynamic therapy
(PDT), and irreversible electroporation (IRE)(165). FLA uses high energy laser light delivered
59
by fibres inserted transperineally for thermal ablation. Post treatment positive biopsies
ranged from 4 to 64% with up to 12 months follow up(166). PDT uses the interaction
between light from intraprostatic laser fibers and either an oral or intravenous
photosensitive agent, which results in production of reactive oxygen species causing
thrombosis within the target. Post treatment positive biopsies ranged from 26 to 51% with
up to 24 months follow up(166). IRE involves generating an electric field to increase cell
membrane permeability and resultant apoptosis. Post treatment positive biopsies ranged
from 3 to 33% with up to 12 months follow up(166). FLA and IRE were associated with <1%
urinary incontinence, whilst PDT was associated with <5% urinary incontinence. Overall,
these techniques have been used in small studies and require specialist equipment which
are not widely available currently.
In summary, the objective of dose painting radiotherapy is to improve therapeutic ratio by
achieving optimal local control with minimal effect on toxicity(87). Focal dose escalation,
biologically or in conventional fractionation, requires accurate treatment delivery. It is
suggested that BED of up to 200 Gy (at α/β of 1.5, corresponding to around 86Gy in 2 Gy/#)
will improve disease control, with limited further benefit beyond that dose(167).
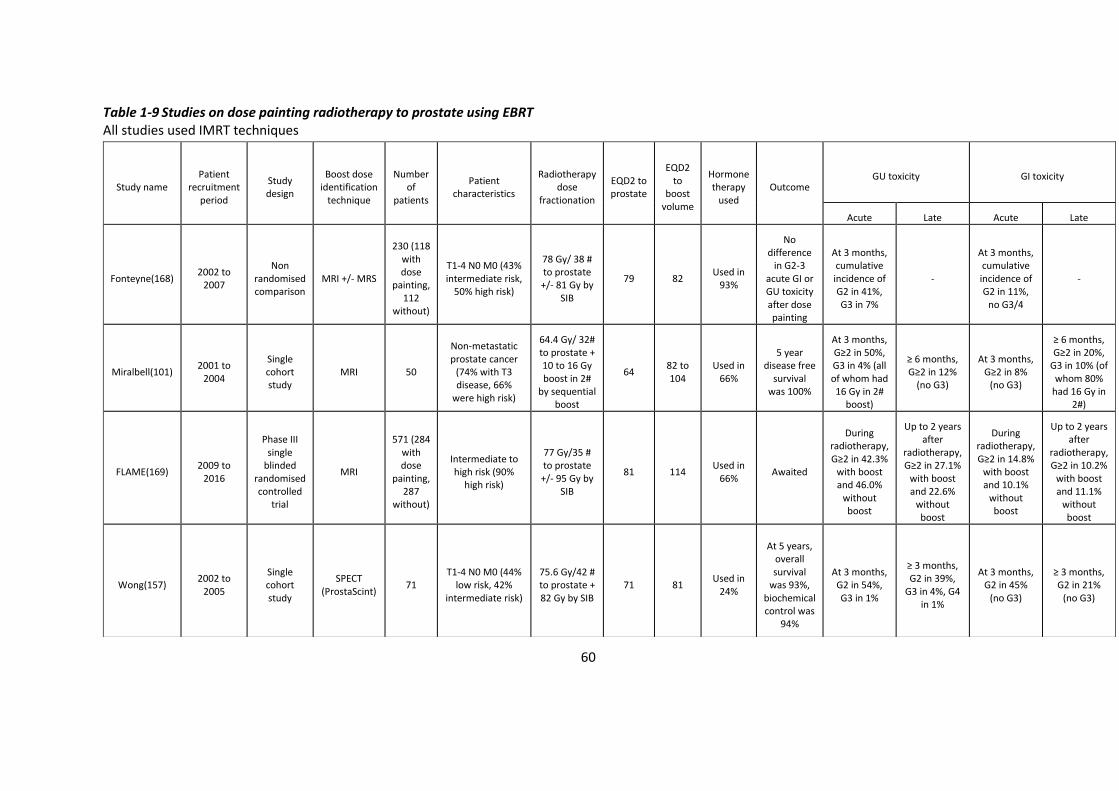
60
Table 1-9 Studies on dose painting radiotherapy to prostate using EBRT All studies used IMRT techniques
Study name Patient
recruitment period
Study design
Boost dose identification
technique
Number of
patients
Patient characteristics
Radiotherapy dose
fractionation
EQD2 to prostate
EQD2 to
boost volume
Hormone therapy
used Outcome
GU toxicity GI toxicity
Acute Late Acute Late
Fonteyne(168) 2002 to
2007
Non randomised comparison
MRI +/- MRS
230 (118 with dose
painting, 112
without)
T1-4 N0 M0 (43% intermediate risk,
50% high risk)
78 Gy/ 38 # to prostate +/- 81 Gy by
SIB
79 82 Used in
93%
No difference
in G2-3 acute GI or GU toxicity after dose painting
At 3 months, cumulative incidence of G2 in 41%, G3 in 7%
-
At 3 months, cumulative incidence of G2 in 11%,
no G3/4
-
Miralbell(101) 2001 to
2004
Single cohort study
MRI 50
Non-metastatic prostate cancer
(74% with T3 disease, 66%
were high risk)
64.4 Gy/ 32# to prostate + 10 to 16 Gy boost in 2#
by sequential boost
64 82 to 104
Used in 66%
5 year disease free
survival was 100%
At 3 months, G≥2 in 50%, G3 in 4% (all of whom had 16 Gy in 2#
boost)
≥ 6 months, G≥2 in 12%
(no G3)
At 3 months, G≥2 in 8%
(no G3)
≥ 6 months, G≥2 in 20%,
G3 in 10% (of whom 80%
had 16 Gy in 2#)
FLAME(169) 2009 to
2016
Phase III single
blinded randomised controlled
trial
MRI
571 (284 with dose
painting, 287
without)
Intermediate to high risk (90%
high risk)
77 Gy/35 # to prostate +/- 95 Gy by
SIB
81 114 Used in
66% Awaited
During radiotherapy, G≥2 in 42.3%
with boost and 46.0%
without boost
Up to 2 years after
radiotherapy, G≥2 in 27.1%
with boost and 22.6%
without boost
During radiotherapy, G≥2 in 14.8%
with boost and 10.1%
without boost
Up to 2 years after
radiotherapy, G≥2 in 10.2%
with boost and 11.1%
without boost
Wong(157) 2002 to
2005
Single cohort study
SPECT (ProstaScint)
71 T1-4 N0 M0 (44%
low risk, 42% intermediate risk)
75.6 Gy/42 # to prostate + 82 Gy by SIB
71 81 Used in
24%
At 5 years, overall survival
was 93%, biochemical control was
94%
At 3 months, G2 in 54%, G3 in 1%
≥ 3 months, G2 in 39%,
G3 in 4%, G4 in 1%
At 3 months, G2 in 45%
(no G3)
≥ 3 months, G2 in 21%
(no G3)

61
Sundahl(170) 2002 to
2014
Non randomised comparison
MRI +/- MRS
410 (225 with dose
painting, 185
without)
T1-4 N0 M0 (46% intermediate risk,
48% high risk)
78 Gy/38 # to prostate +/- 82 Gy by
SIB
79 86 Used in
94%
At 6 years, biochemical relapse free
survival was 84%
with boost vs. 85% without
boost (not sig), but was 81% and 62%
respectively for high risk
(p = 0.03)
With and without
boost, G2 was 38% and
46% respectively; G3 was 7%
and 5% respectively
> 3 months, with and without
boost, G2 was 24% and
25% respectively; G3 was 5%
and 8% respectively
With and without
boost, G2 was 10% and G3 was 0% in both groups
> 3 months with and without
boost, G2 was 8% and
10% respectively; G3 was 0%
and 2% respectively
Ippolito(160)
Not specified
(published 2012)
Single cohort study
MRI 40
T2-3 N0 M0 (42.5%
intermediate risk, 47.5% high risk)
72 Gy/ 40 # to prostate + 80 Gy by SIB
68 80 Used in 100%
Biochemical outcomes
not reported
At 3 months, G2 was 30%, G3 was 2.5%,
no G4
At 2 years, G≥2 was
13.3%
At 3 months, G2 was 15%, G3 was 5%,
no G4
At 2 years, G≥2 was
9.5%
Pinkawa(171) 2008 to
2009
Non randomised comparison
18F choline PET
67 (46 with dose
painting, 21
without)
T1-3 N0 M0 (majority are
low/intermediate risk)
76 Gy in 38 # to prostate +/- 80 Gy by
SIB
76 82.7 Used in
18%
Biochemical outcomes
not reported
No difference between
patients with vs. without
SBI
No difference between
patients with vs. without
SBI
No difference between
patients with vs. without
SBI
No difference between
patients with vs. without
SBI
Schild(158) 2009 to
2013 Single cohort
MRI 78
T1-3 N0 M0 (23% low risk, 55%
intermediate risk, 22% high risk)
77.4Gy in 43# to
prostate + 83 Gy by SIB
73 88 Used in
41%
At 3 years, biochemical control was
92%
At 3 months, G2 was 53%, none with G3
or G4
At 3 years, G2 was 26%, G3 was 3%
At 3 months, G2 was 19%, none with G3
or G4
At 3 years, G2 was 4%,
none with G3 or G4
Garibaldi(172) 2012 to
2014 Single cohort
MRI 15 Stage II to III,
intermediate/high risk
75.2Gy in 32# to
prostate + 83.2 Gy by
SIB
80.5 93.2 Not
specified
At 16 months,
biochemical control was
100%
G2 was 13.3%, no G3 or G4 toxicity
No G>2 G2 was 6.6%, no G3 or G4
toxicity No G>2
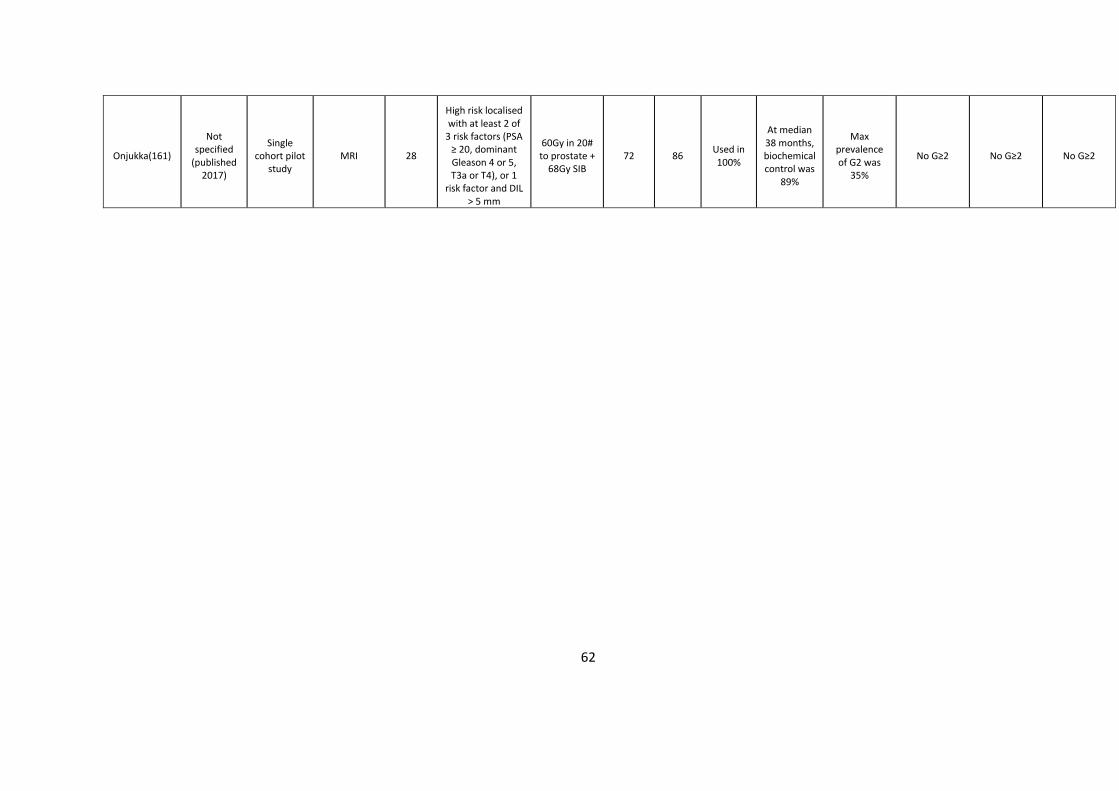
62
Onjukka(161)
Not specified
(published 2017)
Single cohort pilot
study MRI 28
High risk localised with at least 2 of
3 risk factors (PSA ≥ 20, dominant Gleason 4 or 5, T3a or T4), or 1
risk factor and DIL > 5 mm
60Gy in 20# to prostate +
68Gy SIB 72 86
Used in 100%
At median 38 months, biochemical control was
89%
Max prevalence of G2 was
35%
No G≥2 No G≥2 No G≥2
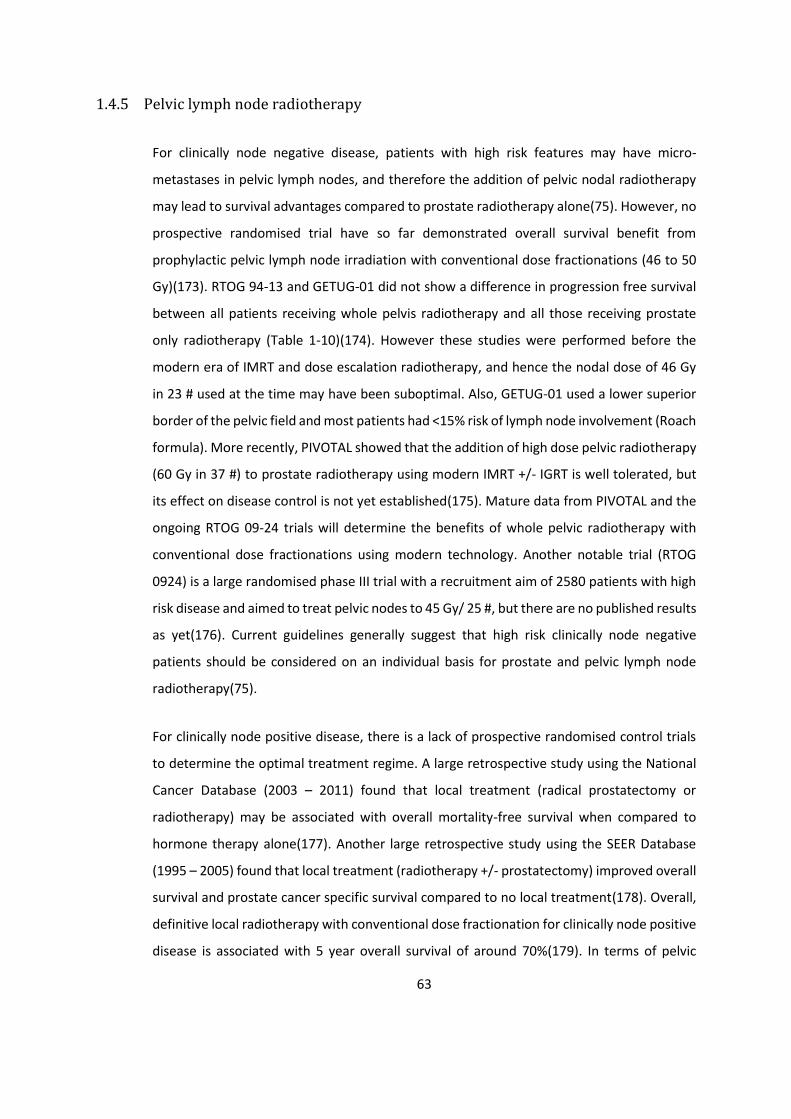
63
1.4.5 Pelvic lymph node radiotherapy
For clinically node negative disease, patients with high risk features may have micro-
metastases in pelvic lymph nodes, and therefore the addition of pelvic nodal radiotherapy
may lead to survival advantages compared to prostate radiotherapy alone(75). However, no
prospective randomised trial have so far demonstrated overall survival benefit from
prophylactic pelvic lymph node irradiation with conventional dose fractionations (46 to 50
Gy)(173). RTOG 94-13 and GETUG-01 did not show a difference in progression free survival
between all patients receiving whole pelvis radiotherapy and all those receiving prostate
only radiotherapy (Table 1-10)(174). However these studies were performed before the
modern era of IMRT and dose escalation radiotherapy, and hence the nodal dose of 46 Gy
in 23 # used at the time may have been suboptimal. Also, GETUG-01 used a lower superior
border of the pelvic field and most patients had <15% risk of lymph node involvement (Roach
formula). More recently, PIVOTAL showed that the addition of high dose pelvic radiotherapy
(60 Gy in 37 #) to prostate radiotherapy using modern IMRT +/- IGRT is well tolerated, but
its effect on disease control is not yet established(175). Mature data from PIVOTAL and the
ongoing RTOG 09-24 trials will determine the benefits of whole pelvic radiotherapy with
conventional dose fractionations using modern technology. Another notable trial (RTOG
0924) is a large randomised phase III trial with a recruitment aim of 2580 patients with high
risk disease and aimed to treat pelvic nodes to 45 Gy/ 25 #, but there are no published results
as yet(176). Current guidelines generally suggest that high risk clinically node negative
patients should be considered on an individual basis for prostate and pelvic lymph node
radiotherapy(75).
For clinically node positive disease, there is a lack of prospective randomised control trials
to determine the optimal treatment regime. A large retrospective study using the National
Cancer Database (2003 – 2011) found that local treatment (radical prostatectomy or
radiotherapy) may be associated with overall mortality-free survival when compared to
hormone therapy alone(177). Another large retrospective study using the SEER Database
(1995 – 2005) found that local treatment (radiotherapy +/- prostatectomy) improved overall
survival and prostate cancer specific survival compared to no local treatment(178). Overall,
definitive local radiotherapy with conventional dose fractionation for clinically node positive
disease is associated with 5 year overall survival of around 70%(179). In terms of pelvic

64
radiotherapy with conventional dose fractionation for clinically node positive disease,
patients who were randomised into the control arm of the STAMPEDE trial were offered
optional radiotherapy including to the pelvis. These 71 patients (82% received radiotherapy
to both prostate and pelvis; 89% received conventional dose fractionation) had 5 year overall
survival of 71%(112).
Hypofractionated dose fractionations have been used in several studies for pelvic nodal
radiotherapy (Table 1-11). One randomised trial for node negative patients, which compared
76Gy/38# to prostate and 46Gy/23# to LN, with 63Gy/20# to prostate and 44Gy/20# to LN,
found that GI and GU toxicity both occurred and settled faster with the hypofractionated
arm(180). Single cohort studies for node positive patients have shown that hypofractionated
IMRT is feasible with temporarily increased toxicity but is generally well tolerated(181, 182).
A concern with simultaneous prostate and pelvic radiotherapy with a hypofractionated
schedule is accurate delivery to both the prostate and the pelvic lymph nodes when both
may not move in tandem, providing a technical challenge. Current clinical practice for
concurrent prostate and pelvic radiotherapy with standard fractionation usually involves
matching bony anatomy between planning CT and on board cone beam CT without fiducial
markers and using wider margins to PTV to account for set up errors.
Overall there are no randomised trials in either the node negative or node positive settings
which have shown overall survival benefit with the addition of pelvic nodal radiotherapy to
prostate radiotherapy. As a result, although it is technically feasible, the selection criteria
remain undefined. If offered to the patient, long term hormone therapy is preferable due to
poor outcomes(84, 183).

65
Table 1-10 Randomised studies on prostate and pelvic radiotherapy with conventional dose fractionation
Study name Patient
recruitment period
Study design Number of
patients Patient
characteristics Radiotherapy dose
fractionation Radiotherapy
technique Outcome
RTOG 9413(184)
1995 to 1999
Randomised 2 x 2 factorial design (neoadjuvant +
concurrent hormones (NCHT) with adjuvant; and
prostate only RT with prostate + LN
RT)
1323
Localised disease, PSA ≤ 100 ng/ml, risk of LN involvement ≥ 15% (Roach formula)
70.2 Gy to prostate +/- 50.4 Gy to pelvic lymph
nodes (all with 1.8 Gy/# to prostate)
Conventional 4 field technique
At 10 years, prostate + LN RT with NHT improves
PFS compared to prostate only RT with NHT
GETUG-01(185)
1998 to 2004
Randomised phase III study (prostate
only RT vs. prostate + LN RT) – high risk
patients had 6 months hormone
therapy
444 T1b – T3, N0 pNx, M0
66-77 Gy to prostate +/- 46 Gy to pelvic
lymph nodes (all with 2 Gy/# to prostate)
Conventional 4 field techniques or conformal 3D
approach
5 year OS and PFS were similar
PIVOTAL(175) 2011 to 2013
Randomised phase II study (prostate only RT vs. prostate + LN
RT) – All patients except one had
LHRH +/- bicalutamide
124 T3b – T4, N0, risk of
LN involvement ≥ 30% (Roach formula)
74 Gy to prostate +/- 60 Gy to pelvic lymph nodes (all with 2 Gy/#
to prostate)
IMRT
Pelvic treatment led to more acute G2 bowel but not bladder toxicity, and no sig difference in late
toxicity at 2 years; effect on disease control is not
yet established
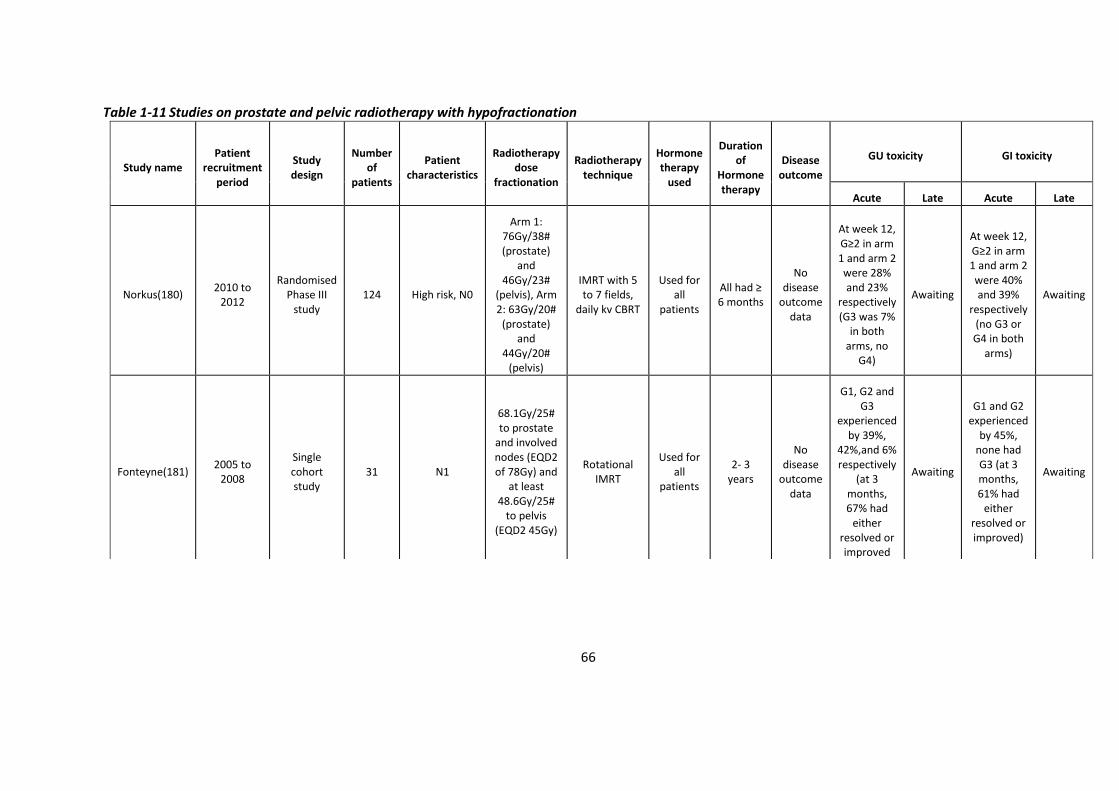
66
Table 1-11 Studies on prostate and pelvic radiotherapy with hypofractionation
Study name Patient
recruitment period
Study design
Number of
patients
Patient characteristics
Radiotherapy dose
fractionation
Radiotherapy technique
Hormone therapy
used
Duration of
Hormone therapy
Disease outcome
GU toxicity GI toxicity
Acute Late Acute Late
Norkus(180) 2010 to
2012
Randomised Phase III
study 124 High risk, N0
Arm 1: 76Gy/38# (prostate)
and 46Gy/23#
(pelvis), Arm 2: 63Gy/20#
(prostate) and
44Gy/20# (pelvis)
IMRT with 5 to 7 fields,
daily kv CBRT
Used for all
patients
All had ≥ 6 months
No disease
outcome data
At week 12, G≥2 in arm 1 and arm 2 were 28% and 23%
respectively (G3 was 7%
in both arms, no
G4)
Awaiting
At week 12, G≥2 in arm 1 and arm 2 were 40% and 39%
respectively (no G3 or G4 in both
arms)
Awaiting
Fonteyne(181) 2005 to
2008
Single cohort study
31 N1
68.1Gy/25# to prostate
and involved nodes (EQD2 of 78Gy) and
at least 48.6Gy/25#
to pelvis (EQD2 45Gy)
Rotational IMRT
Used for all
patients
2- 3 years
No disease
outcome data
G1, G2 and G3
experienced by 39%,
42%,and 6% respectively
(at 3 months, 67% had
either resolved or improved
Awaiting
G1 and G2 experienced
by 45%, none had G3 (at 3 months, 61% had
either resolved or improved)
Awaiting
67
Fonteyne(182) 2005 to
2012
Single cohort study
80 N1
69.3Gy/25# to prostate
and involved nodes (EQD2 of 80Gy) and
at least 45Gy/25# to pelvis (EQD2 45Gy) – with boost of up
to 72Gy (EQD2 of
84Gy) and 65Gy (EQD2 of 72.8Gy) to
intra-prostatic
lesion and pathological
nodes respectively
Rotational IMRT
Used for all
patients
2 – 3 years
3 year bRFS was
81%, 3 year OS
was 88%, 3
year cancer specific survival was 95%
Not reported
At 3 years,
G2 was 29%, G3 was 5%, G4 was
1%
Not reported
At 3 years,
G2 was 17%, G3 was 6%
68
Toxicity and Quality of Life scores
As well as efficacy, important endpoints when considering novel radiotherapy techniques
are both acute and late toxicity, especially as prognosis is generally good after radical
prostate radiotherapy and so survivorship issues are paramount(186). Commonly used
clinician assessed toxicity scores include Common Terminology Criteria for Adverse Events
(CTCAE) and Radiation Therapy Oncology Group (RTOG – which uses different scoring
systems for acute and late toxicity), and commonly used patient reported outcome scores
include Expanded Prostate Cancer Index Composite (EPIC) and International Prostate
Symptom Score (IPSS) (75, 96, 187). Both clinician assessed scores and patient reported
outcomes are complementary and allow a holistic assessment of the treatment.
Clinician assessed scores consist of standardised definitions that describe the severity of
toxicities and a grade is assigned by the clinician according to symptoms reported by the
patient. RTOG has been the histological gold standard for acute toxicity, but it tends to
combine several symptoms into one overall score and so may lead to loss of information.
Many of the late toxicity items are very rare or not seen any more at all with the current
radiotherapy technology. A number of different modifications have been devised over the
years to improve the capture of different side effects. It is however simple to use and most
prostate radiotherapy trials still report the RTOG toxicity score for comparison with other
studies. In comparison, CTCAE is generally more descriptive and comprehensive. The
proportion of radiation studies utilising CTCAE has been increasing and it is becoming the
commonly used standard(188). CTCAE and RTOG are similar but not equivalent. For instance,
in terms of the actual scores themselves, rectal bleeding requiring transfusion is grade 3 by
CTCAE v4.0 but grade 4 by RTOG, and in terms of clinical use of the scores in prostate cancer
patients treated with HDR brachytherapy alone, CTCAE v3.0 identified more G1-2 GU
adverse reactions than RTOG(189). EPIC is an expansion of the University of California – Los
Angeles Prostate Cancer Index (UCLA-PCI) validated health-related quality of life
questionnaire and is a patient reported outcome measure that categorises by urinary
function, bowel habits, sexual function, and hormone function. IPSS is a short efficient
questionnaire to screen and track urinary symptoms, although a weakness of it is the lack of
69
haematuria scoring(190). Overall, clinician assessed scores can predict significant clinical
events, whilst patient reported outcomes can better reflect the daily health status of the
patient(191).
It is recognised that clinician assessed scoring frequently reports symptoms as less severe
than from the patient’s perspective and so underestimate the effects on the patient’s quality
of life, thereby limiting their sensitivity in detecting subtle changes(192). For instance, EPIC
was more sensitive to changes in acute bowel toxicity during a course of prostate 3DCRT
treatment than RTOG(193). With technological advances in radiotherapy delivery, it is
important that these toxicity assessment tools are able to detect subtle but clinically
meaningful changes in toxicity when assessing their clinical impact. Furthermore, it should
be noted that a statistically significant change in toxicity on a clinician score may not be
clinically relevant from the patient’s perspective, and vice versa(75).
Assessing pre-treatment baseline symptoms as well as acute toxicities is critical as they can
both influence late sequaelae(171). For example, spontaneous erections prior to treatment
can predict subsequent maintenance of erectile function after treatment, a lack of acute
RTOG GI adverse reaction could predict lack of late adverse reaction such as radiation
proctitis, and those that developed acute G≥2 CTCAE GI and GU symptoms from 3DCRT and
IMRT had a 7 and 3.5 fold increased risk of late GI and GU toxicities respectively(96, 189,
194, 195). Therefore, collecting pre-treatment symptomatic data as well as acute toxicity
data is of importance.
Uneven reporting standards between studies, due to use of different toxicity scores at
different time points in relation to radiotherapy, can make comparing therapy effects
difficult(96, 160). Therefore, to assess the toxicity of hypofractionated dose painting
radiotherapy, it would be prudent to use well established toxicity scoring tools that have
already been used by preceding studies to facilitate consistency and comparison.
70
2 Dynamic 18F choline tracer uptake on PET/CT in prostate
cancer and the effects of bicalutamide on it
Introduction
For prostate dose painting radiotherapy, an imaging modality that can be used to identify
boost volumes is PET/CT. This can be performed at staging (before any treatment has
commenced) or at planning (during hormone therapy). The former ensures that imaging is
not affected by hormone therapy, whilst the latter would minimise changes to anatomy that
may result in the 2 - 3 months period between imaging and planning, such as prostate
shrinkage due to hormone therapy. The latter would have the added advantage of
potentially using the PET/CT as the planning CT, so as to minimise patient radiation exposure
and improve convenience. Therefore the effect of hormone therapy on PET tracer uptake is
of interest to determine the optimal timing of PET imaging. This would also be informative
for other tracers such as PSMA which is now increasingly used to identify sites of disease
recurrence following PSA relapse, and may be performed before or after initiation of
hormone therapy.
PET imaging can provide static imaging (where activity at a certain time point is analysed and
represented in a fixed image) or dynamic imaging (where sinogram data is collected
continuously which can be binned into specific static time intervals, capturing the change in
activity for individual voxels over time in the form of time activity curves (TAC)).
For dynamic imaging in prostate adenocarcinoma with choline PET, only a few studies have
been performed. 11C choline was used in only one study of 14 patients of whom only 3
patients were on hormone therapy at the time of imaging, and visual evaluation found that
hormone therapy resulted in low prostatic tracer accumulation(196). 18F choline was used in
four studies, but none of the patients were on hormone therapy at the time of imaging(197-
200). Therefore the effects of hormone therapy on 18F choline dynamic uptake is not known.
For static imaging, DIL delineation with choline PET can be performed manually (i.e. visually)
or automatically (i.e. using an SUV threshold). With the latter, the optimal threshold for 11C
choline PET/CT was been shown to be 60% of prostate SUVmax, but there has been no studies
71
to determine the optimal threshold for 18F choline PET/CT although various thresholds have
been used(201). Pinkawa et al. defined the DIL by a tumour-to-background uptake value
ratio of > 2(171). However the disadvantage of this is their definition of background (an area
of around 1 cm2 within the prostate with the lowest activity on visual assessment, and the
SUVmax in this area was used as the background uptake value) is subjective and so is not
reliably reproducible.
At the Clatterbridge Cancer Centre, an institutionally approved pilot study on prostate dose
painting radiotherapy was conducted before the BIOPROP20 study (phase II single cohort
study on moderately hypofractionated prostate dose painting radiotherapy) was initiated.
For this, consented patients received 18F choline PET/CT imaging during which a dynamic
imaging sequence was performed. Initially, patients had imaging whilst on bicalutamide.
However as the tracer uptake was felt to be low on visual assessment, subsequent patients
had imaging before starting bicalutamide. For this chapter, I have retrospectively analysed
the dynamic scans available from the pilot study and those that were available from the
ongoing BIOPROP20 trial at the time of writing this chapter.
Aims
To describe the effect of bicalutamide on the differences in the TAC between tumour and
benign prostatic tissue for 18F choline PET/CT.
Method
2.3.1 Patients selection (inclusion and exclusion criteria)
Newly diagnosed patients were considered if eligibility criteria were fulfilled:
2.3.1.1 Inclusion criteria
• Histologically confirmed prostate adenocarcinoma
• NCCN intermediate/high risk disease/locally advanced (2010 guidelines –
Appendix 8.1) and estimated risk of pelvic lymph node involvement of 15 – 40%
(Roach formula: ((Gleason score – 6) x 10) + 2/3 PSA)
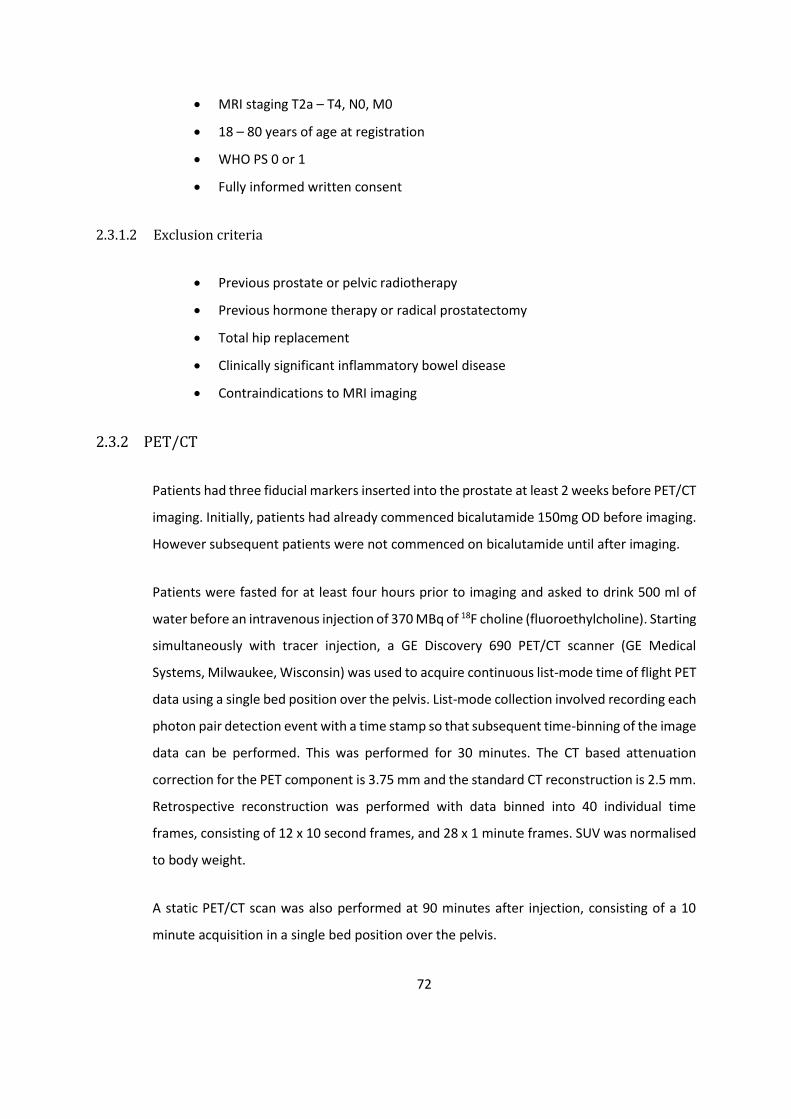
72
• MRI staging T2a – T4, N0, M0
• 18 – 80 years of age at registration
• WHO PS 0 or 1
• Fully informed written consent
2.3.1.2 Exclusion criteria
• Previous prostate or pelvic radiotherapy
• Previous hormone therapy or radical prostatectomy
• Total hip replacement
• Clinically significant inflammatory bowel disease
• Contraindications to MRI imaging
2.3.2 PET/CT
Patients had three fiducial markers inserted into the prostate at least 2 weeks before PET/CT
imaging. Initially, patients had already commenced bicalutamide 150mg OD before imaging.
However subsequent patients were not commenced on bicalutamide until after imaging.
Patients were fasted for at least four hours prior to imaging and asked to drink 500 ml of
water before an intravenous injection of 370 MBq of 18F choline (fluoroethylcholine). Starting
simultaneously with tracer injection, a GE Discovery 690 PET/CT scanner (GE Medical
Systems, Milwaukee, Wisconsin) was used to acquire continuous list-mode time of flight PET
data using a single bed position over the pelvis. List-mode collection involved recording each
photon pair detection event with a time stamp so that subsequent time-binning of the image
data can be performed. This was performed for 30 minutes. The CT based attenuation
correction for the PET component is 3.75 mm and the standard CT reconstruction is 2.5 mm.
Retrospective reconstruction was performed with data binned into 40 individual time
frames, consisting of 12 x 10 second frames, and 28 x 1 minute frames. SUV was normalised
to body weight.
A static PET/CT scan was also performed at 90 minutes after injection, consisting of a 10
minute acquisition in a single bed position over the pelvis.
73
2.3.3 Delineation
The prostatic volume (whole prostate and any extraprostatic extension) was manually
delineated by a board-certified nuclear medicine consultant of over 20 years experience
(Professor S. Vinjamuri (SV) of The Royal Liverpool University Hospital). The tumour volume
was defined on the 90 minutes static imaging by two methods: threshold and visual
methods. The threshold method (SUV60%) was performed by identifying the SUVmax of the
prostatic volume, and the Hermes Hybrid3D software (Hermes Medical Solutions,
Stockholm, Sweden) was used to automatically delineate a region within this prostatic
volume which was ≥60% of the SUVmax. The visual method was performed by a nuclear
medicine consultant (SV) who manually delineated on the PET/CT without access to any
other information including histology or MRI.
In order to transfer the tumour volumes generated from the 90 minutes static imaging to
the dynamic imaging, the CT sequences of both scans were rigidly co-registered by using the
three fiducial markers and these coordinates were used.
2.3.4 Analysis
For the tumour and benign prostatic tissues, the median SUV value within each time bin was
calculated, and data were collected to evaluate the effect of bicalutamide on:
1) Time to peak 90% (TT90%P) SUV (from time of tracer injection to the time where 90% of
maximal SUV uptake is reached) of tumour and of benign prostatic tissue;
2) The SUVmax of tumour and of benign prostatic tissue;
3) Difference in AUC between tumour and benign prostatic tissue.
The data for tumour and for benign prostatic tissue are presented with median and range
values. The 95% confidence interval (CI) for the median values are also presented (as the
data is non-parametric, the bootstrapping method with 1000 samples was used).

74
Results
Dynamic PET/CT imaging was available for 40 patients who had imaging without
bicalutamide, and 10 patients who had imaging with bicalutamide (Table 2-1). With the
threshold method, all 50 patients had identifiable tumour volumes. With the visual method,
all 40 patients who had imaging without bicalutamide had identifiable tumour volumes, but
only 7 out of the 10 patients who had imaging during bicalutamide had identifiable tumour
volumes. As a proportion of the whole prostatic volume, the tumour volume ranged from
1.6 % to 41.7 % (Table 2-2).
On visual evaluation, the initial tracer uptake in the tumour and benign prostatic tissues were
rapid within the first 5 minutes (Figure 2-1). Thereafter the TACs either plateaued or showed
gradual increase in activity with no apparent differences in pattern between tumour and
benign prostatic tissue (Figure 2-2 and 2-3). However the range of SUV values appear larger
for tumour than for benign prostatic tissue.
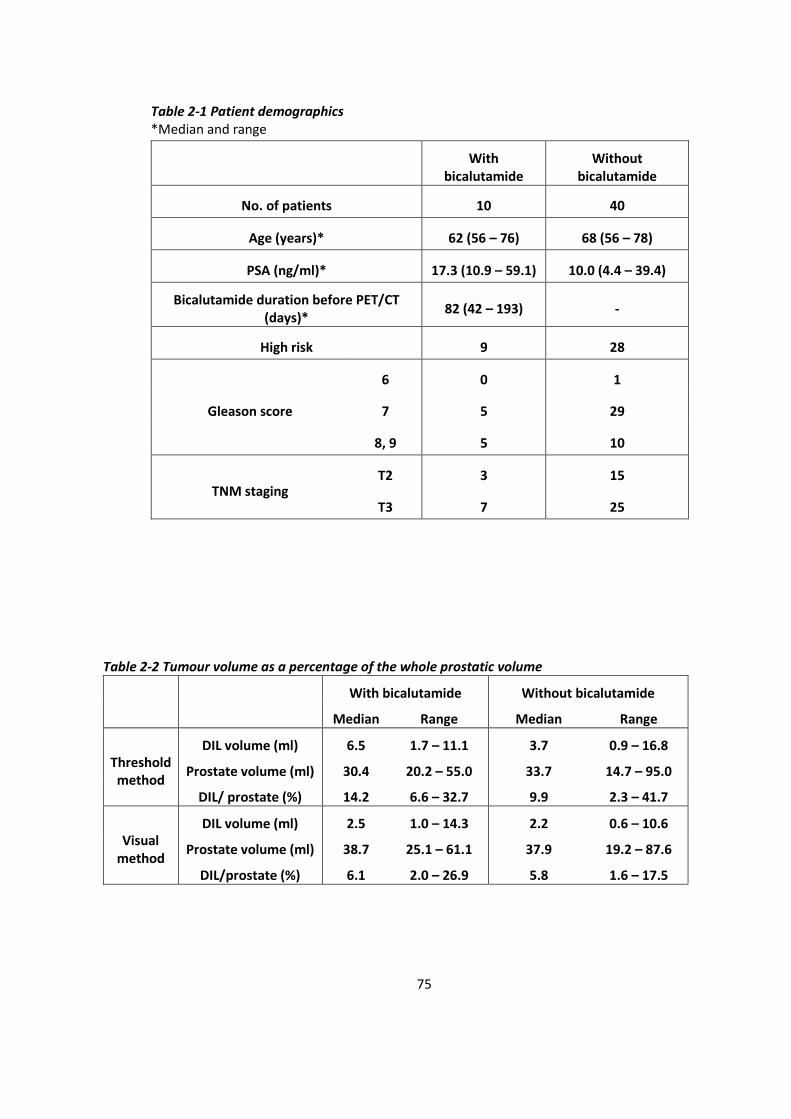
75
Table 2-1 Patient demographics *Median and range
With
bicalutamide Without
bicalutamide
No. of patients 10 40
Age (years)* 62 (56 – 76) 68 (56 – 78)
PSA (ng/ml)* 17.3 (10.9 – 59.1) 10.0 (4.4 – 39.4)
Bicalutamide duration before PET/CT (days)*
82 (42 – 193) -
High risk 9 28
Gleason score
6 0 1
7 5 29
8, 9 5 10
TNM staging T2 3 15
T3 7 25
Table 2-2 Tumour volume as a percentage of the whole prostatic volume
With bicalutamide Without bicalutamide
Median Range Median Range
Threshold method
DIL volume (ml) 6.5 1.7 – 11.1 3.7 0.9 – 16.8
Prostate volume (ml) 30.4 20.2 – 55.0 33.7 14.7 – 95.0
DIL/ prostate (%) 14.2 6.6 – 32.7 9.9 2.3 – 41.7
Visual method
DIL volume (ml) 2.5 1.0 – 14.3 2.2 0.6 – 10.6
Prostate volume (ml) 38.7 25.1 – 61.1 37.9 19.2 – 87.6
DIL/prostate (%) 6.1 2.0 – 26.9 5.8 1.6 – 17.5
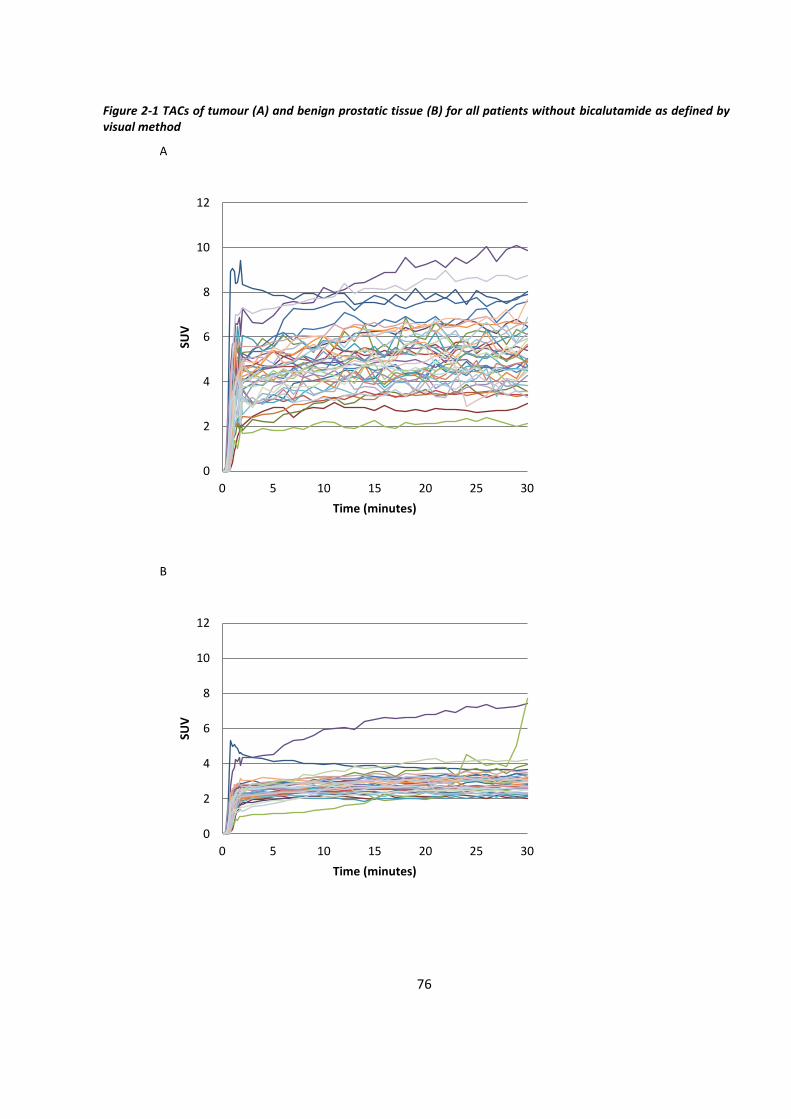
76
Figure 2-1 TACs of tumour (A) and benign prostatic tissue (B) for all patients without bicalutamide as defined by visual method
A
B
0
2
4
6
8
10
12
0 5 10 15 20 25 30
SUV
Time (minutes)
0
2
4
6
8
10
12
0 5 10 15 20 25 30
SUV
Time (minutes)
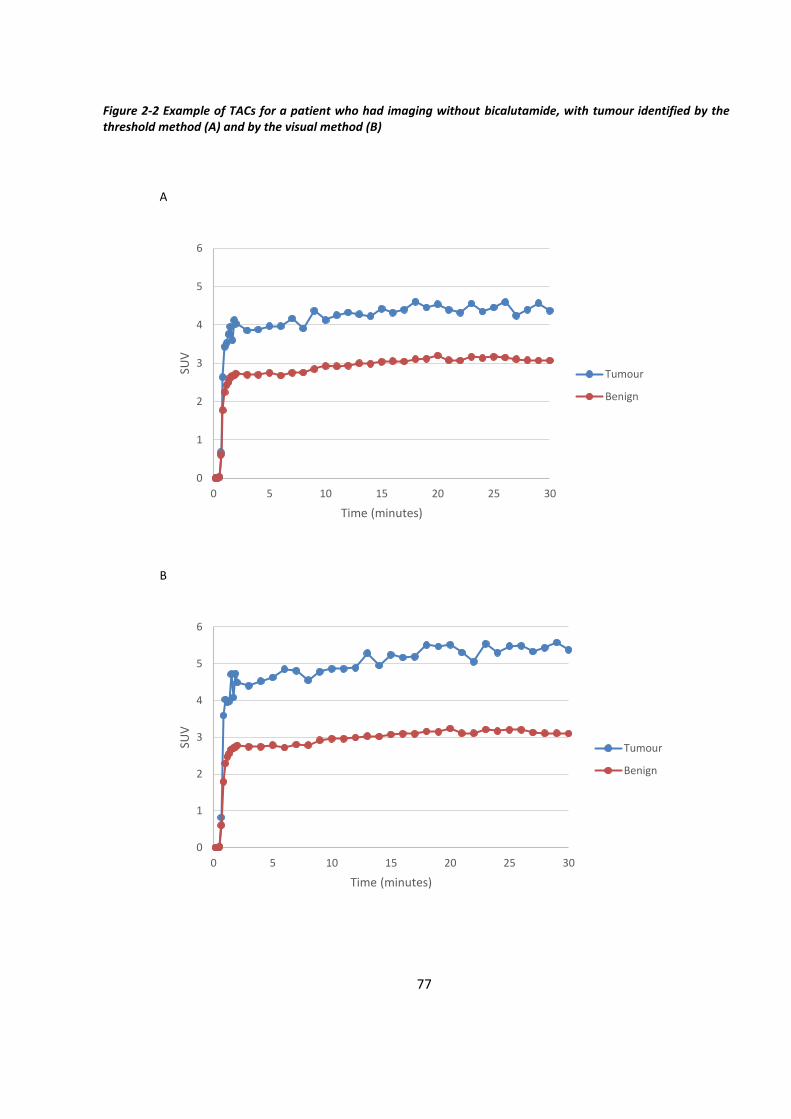
77
Figure 2-2 Example of TACs for a patient who had imaging without bicalutamide, with tumour identified by the threshold method (A) and by the visual method (B)
A
B
0
1
2
3
4
5
6
0 5 10 15 20 25 30
SUV
Time (minutes)
Tumour
Benign
0
1
2
3
4
5
6
0 5 10 15 20 25 30
SUV
Time (minutes)
Tumour
Benign
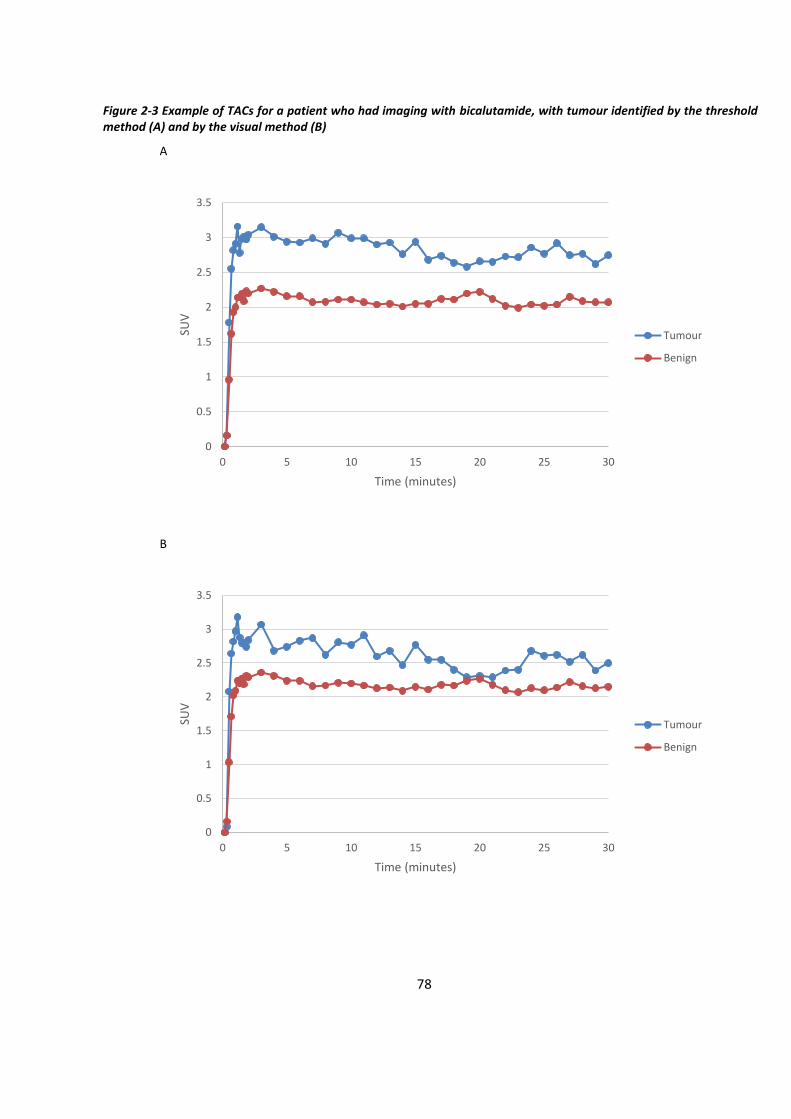
78
Figure 2-3 Example of TACs for a patient who had imaging with bicalutamide, with tumour identified by the threshold method (A) and by the visual method (B)
A
B
0
0.5
1
1.5
2
2.5
3
3.5
0 5 10 15 20 25 30
SUV
Time (minutes)
Tumour
Benign
0
0.5
1
1.5
2
2.5
3
3.5
0 5 10 15 20 25 30
SUV
Time (minutes)
Tumour
Benign

79
2.4.1 TT90%P
For the group of patients who had imaging without bicalutamide, the median TT90%P SUV
within the tumour as identified by the threshold method was 8.0 minutes, whilst that of the
benign tissue was 9.0 minutes (Table 2-3). However there is generally a significant variation
of TT90%P from patient to patient (for instance, TT90%P within the tumour ranged from 0.7
minutes to 27.0 minutes). The TT90%P within the tumour occurred before that of the benign
tissue in 18 patients, at the same time in 4 patients, and after in 18 patients. On an individual
patient by patient basis, there was no significant difference in TT90%P between tumour and
benign prostatic tissue (although this ranged from -23.0 to 13.0 minutes).
For the group of patients who had imaging with bicalutamide, the median TT90%P SUV
within the tumour as identified by the threshold method was 2.9 minutes, whilst that of the
benign tissue was 1.9 minutes (Table 2-3). Again, there is generally a significant variation of
TTP from patient to patient (for instance, TT90%P within the tumour ranged from 0.8
minutes to 23.0 minutes). The TT90%P within the tumour occurred before that of the benign
tissue in 3 patients, at the same time in 4 patients, and after in 3 patients. On an individual
patient by patient basis, there was again no significant difference in TT90%P between
tumour and benign prostatic tissue.
Therefore, whether tumour is identified by the threshold or visual method, the difference in
TT90%P of tumour and of benign tissue was not significant, whether PET/CT was performed
with or without bicalutamide (Table 2-3).
Also there is a trend for TT90%P without bicalutamide to be longer than with bicalutamide,
although was no statistical significance (using independent samples Mann Whitney U test:
with the threshold method, p value for tumour and benign were 0.22 and 0.51 respectively;
with the visual method, p value for tumour and benign were 0.35 and 0.17 respectively).
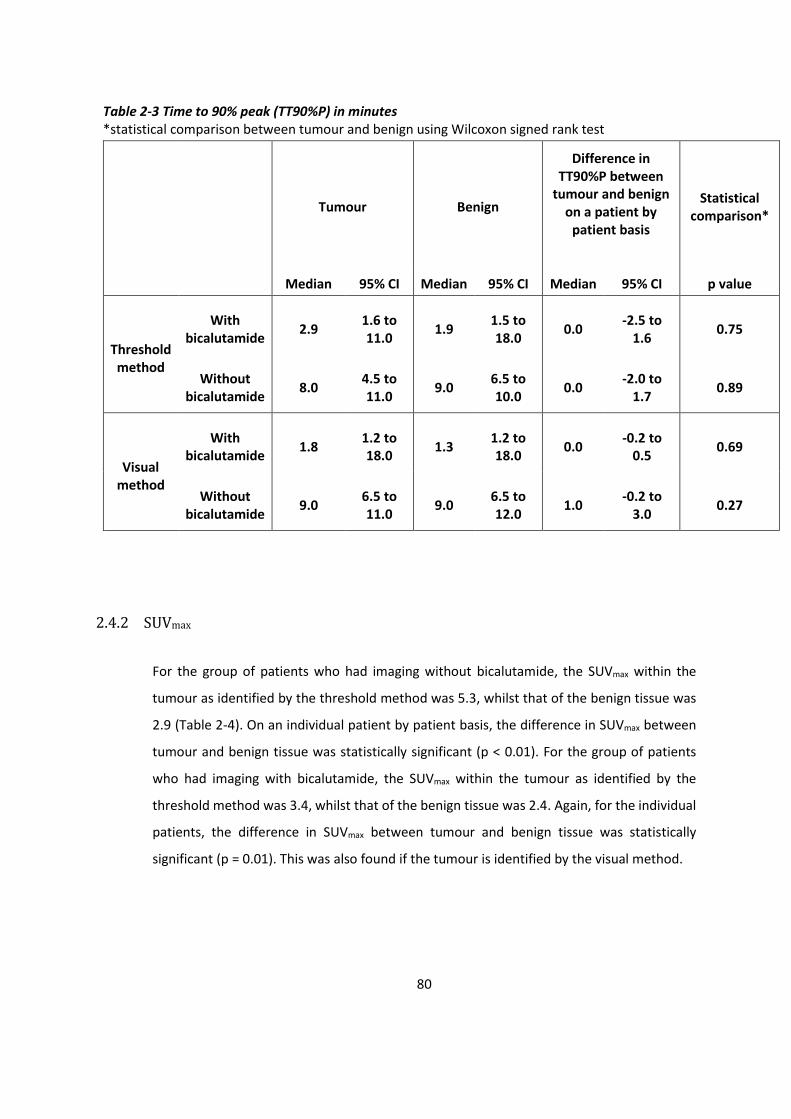
80
Table 2-3 Time to 90% peak (TT90%P) in minutes *statistical comparison between tumour and benign using Wilcoxon signed rank test
Tumour Benign
Difference in TT90%P between
tumour and benign on a patient by
patient basis
Statistical comparison*
Median 95% CI Median 95% CI Median 95% CI p value
Threshold method
With bicalutamide
2.9 1.6 to 11.0
1.9 1.5 to 18.0
0.0 -2.5 to
1.6 0.75
Without bicalutamide
8.0 4.5 to 11.0
9.0 6.5 to 10.0
0.0 -2.0 to
1.7 0.89
Visual method
With bicalutamide
1.8 1.2 to 18.0
1.3 1.2 to 18.0
0.0 -0.2 to
0.5 0.69
Without bicalutamide
9.0 6.5 to 11.0
9.0 6.5 to 12.0
1.0 -0.2 to
3.0 0.27
2.4.2 SUVmax
For the group of patients who had imaging without bicalutamide, the SUVmax within the
tumour as identified by the threshold method was 5.3, whilst that of the benign tissue was
2.9 (Table 2-4). On an individual patient by patient basis, the difference in SUVmax between
tumour and benign tissue was statistically significant (p < 0.01). For the group of patients
who had imaging with bicalutamide, the SUVmax within the tumour as identified by the
threshold method was 3.4, whilst that of the benign tissue was 2.4. Again, for the individual
patients, the difference in SUVmax between tumour and benign tissue was statistically
significant (p = 0.01). This was also found if the tumour is identified by the visual method.
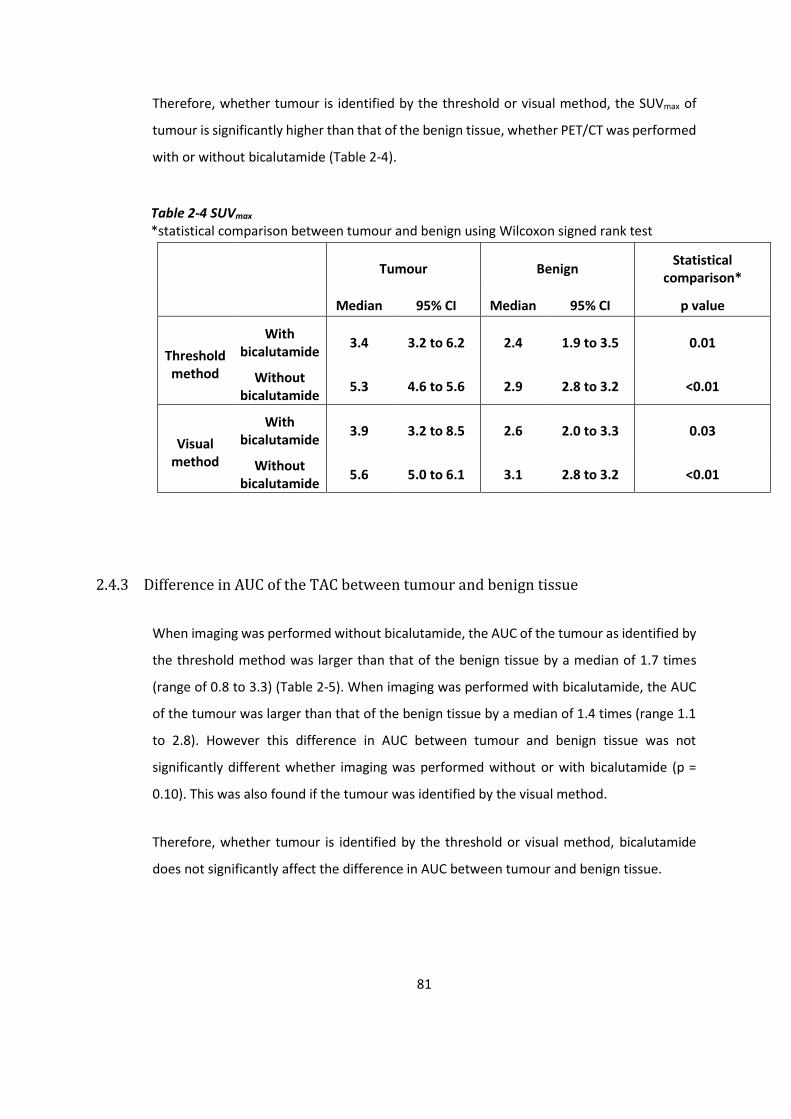
81
Therefore, whether tumour is identified by the threshold or visual method, the SUVmax of
tumour is significantly higher than that of the benign tissue, whether PET/CT was performed
with or without bicalutamide (Table 2-4).
Table 2-4 SUVmax *statistical comparison between tumour and benign using Wilcoxon signed rank test
Tumour Benign
Statistical comparison*
Median 95% CI Median 95% CI p value
Threshold method
With bicalutamide
3.4 3.2 to 6.2 2.4 1.9 to 3.5 0.01
Without bicalutamide
5.3 4.6 to 5.6 2.9 2.8 to 3.2 <0.01
Visual method
With bicalutamide
3.9 3.2 to 8.5 2.6 2.0 to 3.3 0.03
Without bicalutamide
5.6 5.0 to 6.1 3.1 2.8 to 3.2 <0.01
2.4.3 Difference in AUC of the TAC between tumour and benign tissue
When imaging was performed without bicalutamide, the AUC of the tumour as identified by
the threshold method was larger than that of the benign tissue by a median of 1.7 times
(range of 0.8 to 3.3) (Table 2-5). When imaging was performed with bicalutamide, the AUC
of the tumour was larger than that of the benign tissue by a median of 1.4 times (range 1.1
to 2.8). However this difference in AUC between tumour and benign tissue was not
significantly different whether imaging was performed without or with bicalutamide (p =
0.10). This was also found if the tumour was identified by the visual method.
Therefore, whether tumour is identified by the threshold or visual method, bicalutamide
does not significantly affect the difference in AUC between tumour and benign tissue.
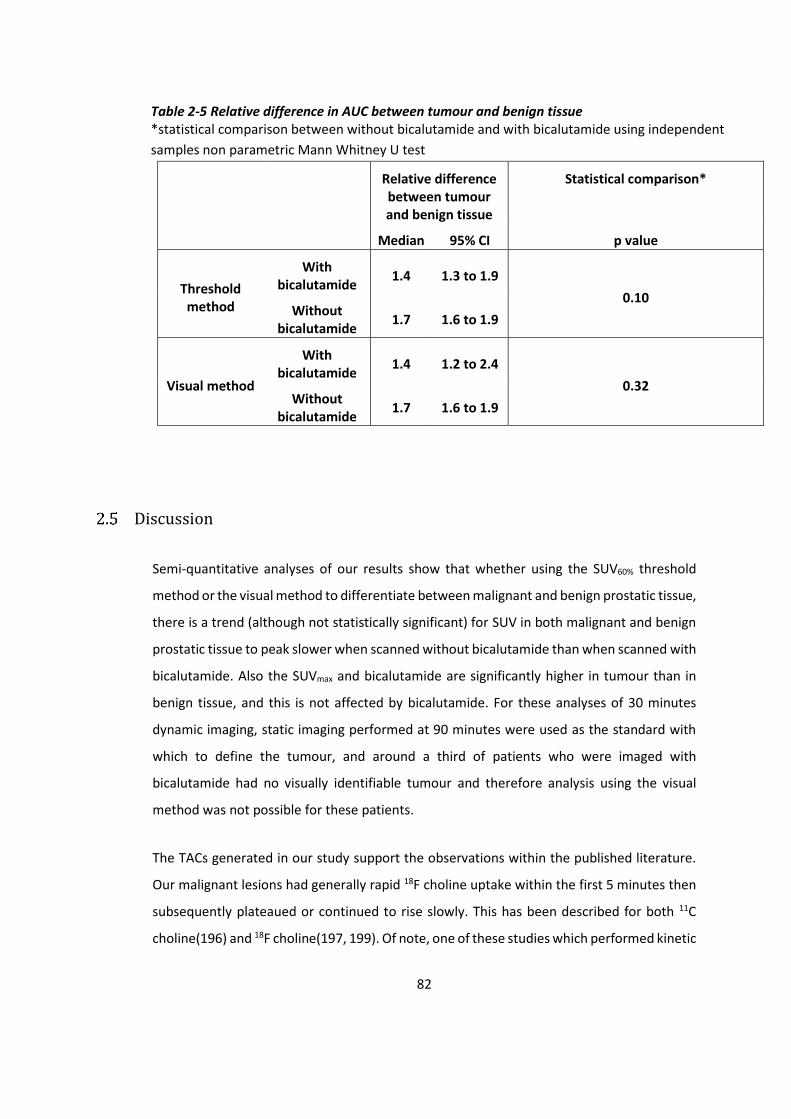
82
Table 2-5 Relative difference in AUC between tumour and benign tissue *statistical comparison between without bicalutamide and with bicalutamide using independent
samples non parametric Mann Whitney U test
Relative difference between tumour and benign tissue
Statistical comparison*
Median 95% CI p value
Threshold method
With bicalutamide
1.4 1.3 to 1.9
0.10 Without
bicalutamide 1.7 1.6 to 1.9
Visual method
With bicalutamide
1.4 1.2 to 2.4
0.32 Without
bicalutamide 1.7 1.6 to 1.9
Discussion
Semi-quantitative analyses of our results show that whether using the SUV60% threshold
method or the visual method to differentiate between malignant and benign prostatic tissue,
there is a trend (although not statistically significant) for SUV in both malignant and benign
prostatic tissue to peak slower when scanned without bicalutamide than when scanned with
bicalutamide. Also the SUVmax and bicalutamide are significantly higher in tumour than in
benign tissue, and this is not affected by bicalutamide. For these analyses of 30 minutes
dynamic imaging, static imaging performed at 90 minutes were used as the standard with
which to define the tumour, and around a third of patients who were imaged with
bicalutamide had no visually identifiable tumour and therefore analysis using the visual
method was not possible for these patients.
The TACs generated in our study support the observations within the published literature.
Our malignant lesions had generally rapid 18F choline uptake within the first 5 minutes then
subsequently plateaued or continued to rise slowly. This has been described for both 11C
choline(196) and 18F choline(197, 199). Of note, one of these studies which performed kinetic

83
studies using compartmental modelling for 18F choline had used a dynamic scan over 60
minutes, and it found that reliable estimates of all parameters could be achieved with a 30
minutes dynamic scan instead, thereby suggesting that our dynamic imaging protocol is
sufficient to obtain data from(197).
In the published literature, the only study that I am aware of which assessed dynamic choline
PET imaging in patients during hormone therapy was by Sutinen et al., which used 11C choline
and showed that the two patients on hormonal treatment with goserelin had the lowest
tracer accumulation of all the studied patients, with SUV of 1.8 and 2.8(196). There was
another patient who had orchiectomy 7 years prior to PET imaging, but his tracer uptake
profile was not specifically described. Although our study had used 18F choline instead, it also
showed that tumour SUV without hormone therapy is generally higher than tumour SUV
with hormone therapy, but that the difference in SUV between tumour and benign prostatic
tissue is statistically significant whether without or with hormone therapy. Also of note, our
study showed that PET scanning without hormone therapy can result in a more prolonged
and increased tracer uptake over time, whereas hormone therapy can result in a shortened
and lower tracer uptake. Overall, this suggests that dynamic PET scanning without hormone
therapy will allow tumour to be more easily identifiable by visual assessment than if
performed with hormone therapy, but that hormone therapy should not affect the ability to
differentiate between tumour and benign prostate tissue. Therefore if dynamic PET imaging
is to be used for the purposes of identifying DILs for dose painting radiotherapy delineation,
they should be performed without hormone therapy.
The effect of bicalutamide on 18F choline tracer uptake may be due to modulation of
signalling pathways. Prostate cancer cells have been shown to have an increased uptake of
choline due to increased cell proliferation and upregulation of choline kinase. Bicalutamide
is a pure anti-androgen which blocks androgen receptors, downregulating the expression of
several genes including those involved in lipid metabolism and regulating the Ras signalling
pathway, leading to reduced choline transporter and choline kinase activity as well as
inhibiting of angiogenesis and proliferation of cancer cells(202). Bicalutamide has previously
been found to inhibit prostate 11C choline uptake, and it is likely to have a similar effect on
18F choline(203, 204).
84
There are limitations to our methodology. The reference standard comparator was not
histology, but instead was the static PET imaging at 90 minutes after tracer injection.
Therefore this requires an assumption that the 90 minutes scan can accurately identify
malignant DILs without histological confirmation. Furthermore, the SUV60% threshold
method used for the 90 minutes scan was derived from studies using 11C choline, and so
there are inherent uncertainties about whether this threshold method is as accurate for 18F
choline. Our methodology involved rigid co-registration of the CT component of the PET/CT
scans by using three fiducial markers, in order to delineate the region of the prostate on the
dynamic scan which was identified as malignant on the 90 minutes scan. The rigid co-
registration process between the CT components was straight forward, but there are
inherent uncertainties between the registration of the PET and CT components. It has been
shown that, despite a patient lying still on the imaging bed, prostate positioning can increase
with elapsed time from physiological motions (i.e. rectal activity and bladder filling) and from
pelvic muscular contractions, especially as the dynamic PET and static PET data were
acquired over 30 minutes and 10 minutes respectively, whilst the associated CT imaging for
both were taken in a significantly shorter period of time(205). This may explain the
anomalies in Figure 2-1B, where one patient has a comparatively higher SUV than the other
patients, and another patient has a rise in SUV after around 28 minutes. The former patient
may have had a shift between the PET and CT components of either dynamic or static scans,
resulting in mis-registration of the PET despite good registration between the CT scans. This
may have led to part of the tumour migrating into the region which has been designated
benign tissue, thereby resulting in a TAC that actually represents tumour. The latter patient
may have also had a similar shift, resulting in the bladder or urethra migrating into the region
which has been designated benign tissue, and so explain the delayed uptake on the TAC.
Another limitation is that our TT90%P methodology has not been used in other studies, and
hence it is difficult to compare our results. Also we had not performed kinetic modelling nor
quantitative analysis. However we had performed semi-quantitative analysis with SUV, and
studies support the use of SUV methods to assess tracer uptake in the clinical setting(196).
85
Conclusion
Dynamic PET scanning without bicalutamide will allow tumour to be more easily identifiable
by visual assessment than if performed with bicalutamide, but bicalutamide should not
affect the ability to differentiate between tumour and benign prostate tissue. Therefore if
dynamic PET imaging is to be used for the purposes of identifying DILs for dose painting
radiotherapy delineation, they should be performed without bicalutamide.

86
3 Effect of bicalutamide on prostate dose painting
radiotherapy boost volumes identified on 18F choline
PET/CT
Introduction
Prostate dose painting radiotherapy requires the delineation of DILs within the target
volumes to which an escalated dose can be delivered. mpMRI is the standard method used
for identifying intra-prostatic lesions due to the superior soft tissue definition it affords. An
alternative imaging modality which can be used is PET/CT with various tracers including
radiolabelled choline.
Standard treatment for intermediate and high risk patients involves several months of neo-
adjuvant hormone therapy. As discussed in the previous chapter, PET/CT scan can be
performed before hormone therapy (i.e. at staging) which allows delineating of the original
DIL, or during hormone therapy which allows the CT component to be used for planning.
There is no published data to suggest if these two schedules produce significantly different
boost volumes although reduced tracer uptake has been observed in patients who were
imaged with hormone therapy(206).
For this chapter, I have retrospectively analysed the PET/CT imaging from the pilot study and
those that were available from the ongoing BIOPROP20 trial at the time of writing this
chapter. As will be discussed later in the methods section, this chapter required input from
consultants and physicists at the Clatterbridge Cancer Centre for DIL delineating and use of
Aria to obtain DSC data.
Aims
a) To determine whether sizes of DILs identified on 18F choline PET/CT are significantly
affected by bicalutamide;
87
b) To determine the optimal delineating method for 18F choline PET/CT between visual
method and threshold method (using 60% of prostate SUVmax).
Methods
3.3.1 Study design
This was a retrospective study using imaging for a cohort of patients who have had both MRI
(staging mpMRI and planning T2w MRI) and 18F choline PET/CT for prostate dose painting
radiotherapy planning. Initially patients had PET/CT imaging at planning, whilst on
bicalutamide (‘with bicalutamide’ group). As visual tracer uptake was noted to be low,
subsequent patients had PET/CT imaging at staging, before bicalutamide (‘without
bicalutamide’ group).
3.3.2 Patient selection (inclusion and exclusion criteria)
Patients had the same eligibility criteria as chapter 2. Of note, the work for the previous
chapter was performed at a later time point than that of this chapter, thereby accounting
for the differences in patient numbers.
Patients who had received 18F choline PET/CT were identified and separated into either the
‘with bicalutamide’ group or the ‘without bicalutamide’ group. The only difference in the
planning pathways between the two groups was whether bicalutamide was started before
or after the PET/CT. In all patients, gold fiducial markers were inserted in the prostate prior
to PET/CT, planning MRI and planning CT (Figure 3-1).
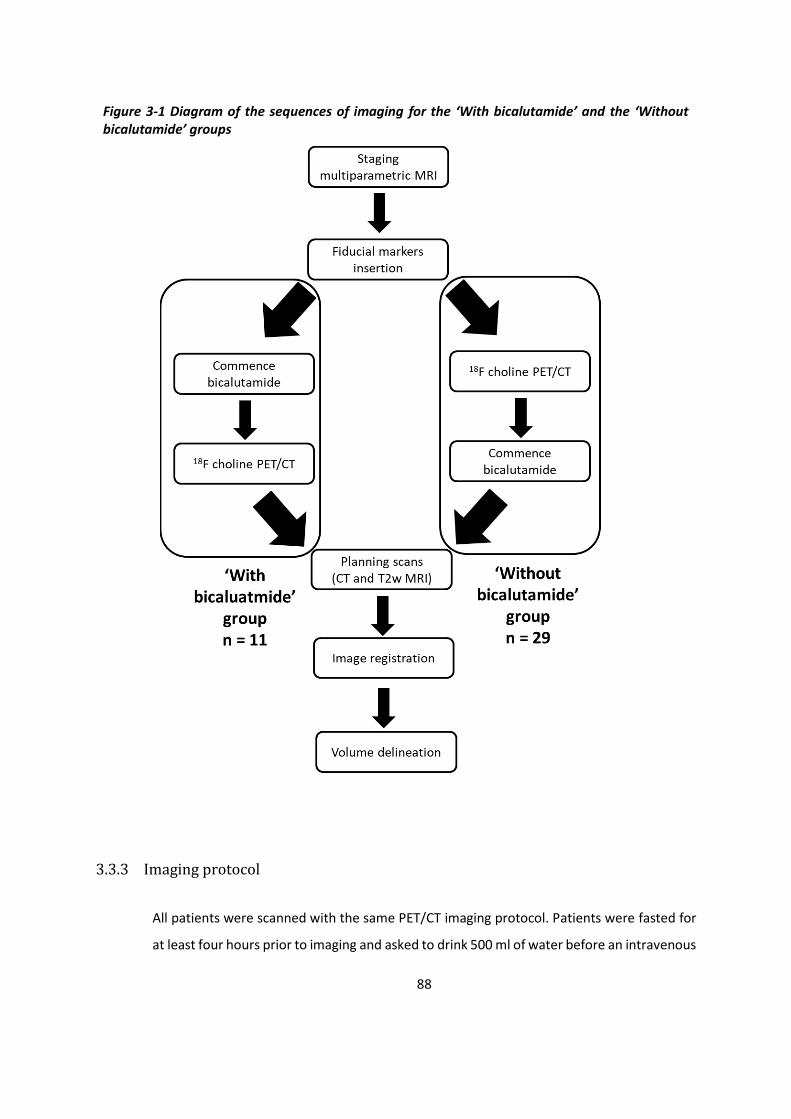
88
Figure 3-1 Diagram of the sequences of imaging for the ‘With bicalutamide’ and the ‘Without bicalutamide’ groups
3.3.3 Imaging protocol
All patients were scanned with the same PET/CT imaging protocol. Patients were fasted for
at least four hours prior to imaging and asked to drink 500 ml of water before an intravenous

89
injection of 370 MBq of 18F choline (fluoroethylcholine). A static pelvic scan performed at 90
minutes post injection in a single bed position over 10 minutes with a GE Discovery 690
PET/CT scanner (GE Medical Systems, Milwaukee, Wisconsin) was used. Images were
reconstructed using the iterative line of response (LOR) algorithm. SUV was normalised to
body weight.
Prior to the planning T2w MRI and planning CT, patients emptied their bowels with a micro
enema (Relaxit 5 ml per rectum) and drank 300 ml of water. These scans were acquired with
an indwelling 12 gauge soft Foley urethral catheter. The planning MRI was performed with
Turbo Spin Echo thin slice acquisition using a Philips Intera 1.5T MRI scanner with phased
array coils. The planning CT was performed by a Philips Brilliance wide bore scanner, giving
a 3 mm slice width.
3.3.4 DIL delineation protocol
On ProSoma (OSL Oncology Systems Limited, UK), the PET/CT and planning T2w MRI images
were rigidly co-registered to the planning CT using the fiducial markers and catheter. The
whole prostate was delineated on both PET/CT and planning CT. The identification of DILs
on MRI was performed by two radiation oncologists together by delineating on the planning
T2w MRI whilst using the staging MRI (anatomical T2w and functional diffusion weighted
imaging) for reference. The identification of DILs on PET was performed visually (‘visual PET’)
by the two radiation oncologists on ProSoma, and automatically using a threshold defined
as 60% of prostate SUVmax (‘threshold PET’) on Mirada (Mirada Medical Limited, UK) where
SUVmax uptake data was also collected. For standardisation of visual assessments between
patients, the PET windowing was altered until bone marrow uptake was visually detectable.
All information was available at time of delineation (including pathology and other imaging).
3.3.5 Boost volume analysis
To unite the structures from both ProSoma and Mirada systems, the delineations were
imported into ARIA version 11 (Varian Medical Systems, USA) which displayed the registered
images along with all structures. Size data on DIL volumes were collected from ARIA. In order
to account for registration errors between the primary data set (planning CT) and the

90
secondary data sets (MRI or PET), a 5 mm isotropic expansion margin was performed around
the DIL delineations (to create the boost volumes) and the prostate delineations within ARIA.
Correlation analyses were used with these expanded volumes, with four different metrics
used. Dice similarity coefficient (DSC) was defined according to the following formula (where
A and B are the volumes of the MRI-defined and PET-defined boosts, and AᴖB is the volume
of the overlapping boosts): DSC = 2 x AᴖB / (A+B). Sensitivity, specificity and Youden index
were calculated according to the following formulas (TP (true positive) – overlapping volume
between MRI and PET boosts; FP (false positive) – PET boost volume excluding the MRI boost
volume; FN (false negative) – MRI boost volume excluding the PET boost volume; TN (true
negative) – planning CT prostate delineation excluding both MRI and PET boost volumes):
Sensitivity = TP / (TP+FN); Specificity = TN / (TN+FP); Youden index = Sensitivity + Specificity
– 1.
3.3.6 Statistical analysis
SPSS V22.0 (International Business Machines Corporation, US) was used for statistical
analysis. Due to the skewed distribution of the delineation volumes and SUV uptake values,
they were reported by median and range, with 2-tailed significance testing using Wilcoxon
signed rank test. As the distribution of the correlation analyses tended to the normal
distribution (kurtosis were all well below 3 except for DSC between MRI and threshold
SUV60% PET during bicalutamide which was 3.3), they were reported by mean ± standard
deviation (SD) with 2-tailed significance testing using independent T test.
Results
There were 11 patients in the ‘with bicalutamide’ group (150 mg once a day orally), and 29
patients in the ‘without bicalutamide’ group (Table 3-1).

91
Table 3-1 Patient demographics *Median and range
With bicalutamide Without bicalutamide
No. of patients 11 29
Age (years)* 63 (49 – 76) 68 (50 – 77)
PSA (ng/ml)* 16.6 (10.9 – 28.6) 9.0 (3.6 – 39.4)
Bicalutamide duration before PET/CT (days)*
85 (42 – 193) -
High risk † 11 25
Gleason score
6 0 1
7 7 21
8, 9 4 7
TNM staging
T2a 0 5
T2b, c 4 6
T3a, b 7 18
There was no significant change in prostate volume between PET/CT and planning CT scans
for the ‘with bicalutamide’ group (median 0.34%, p = 0.48), but there was a significant
reduction in the ‘without bicalutamide’ group (median -16.9%, p < 0.01, Table 3-2).

92
Table 3-2 Prostate and boost volumes
With bicalutamide Without bicalutamide
Median 95% CI Median 95% CI
Prostate volumes
[ml]
PET/CT 38.02 30.16 – 44.07 47.02 44.18 – 56.95
Planning CT 36.92 29.62 – 45.05 39.07 35.68 – 48.94
%Change 0.03 % -3.08 to 3.32 -16.94 % -22.43 to -12.15
Boost volumes
[ml]
MRI 1.98 0.67 – 7.20 2.17 2.07 – 3.77
visual PET 1.34 0.15 – 3.41 2.62 2.15 – 3.65
threshold PET 4.81 2.87 – 7.49 3.71 2.81 – 6.31
There was a trend for prostate SUVmax to be lower in the ‘with bicalutamide’ group (median
4.2, range 2.7 to 12.0) compared to the ‘without bicalutamide’ group (median 6.6, range 4.1
to 18.6) although it did not reach statistical significance (Mann-Whitney U test; p = 0.06).
In the ‘with bicalutamide’ group, all patients had one MRI DIL, but 3 patients had no visually
identifiable PET DIL. In the ‘without bicalutamide’ group, 28 patients had at least one MRI
DIL, one patient had no MRI DIL that could be confidently delineated, and all patients had at
least one visually identifiable PET DIL(Table 3-3).
In both groups, the median DILs on MRI were small (1.98 and 2.17 ml), but there was a large
variation between patients (0.53 – 17.83 ml, Table 3-2). Per individual patient, the visual PET
DILs were significantly smaller than the MRI DILs in the ‘with bicalutamide’ group (median
reduction of 63%, p = 0.03) but not in the ‘without bicalutamide’ group (median reduction
of 5%, p = 0.84)(Table 3-4). The threshold PET DILs were generally larger than the MRI DILs
in both groups, but this varied between patients and was not statistically significant (median
increase of 60%, p = 0.33; median increase of 20%, p = 0.19 respectively).
The correlation analyses showed that both visual and threshold PET have a moderate
sensitivity (0.50 to 0.68) and a high specificity (0.85 to 0.98) for identifying MRI-defined
disease (Table 3-4). There was a trend for the PET boost volumes (especially visually defined)
to correlate better with the MRI boost volumes in the ‘without bicalutamide’ group.
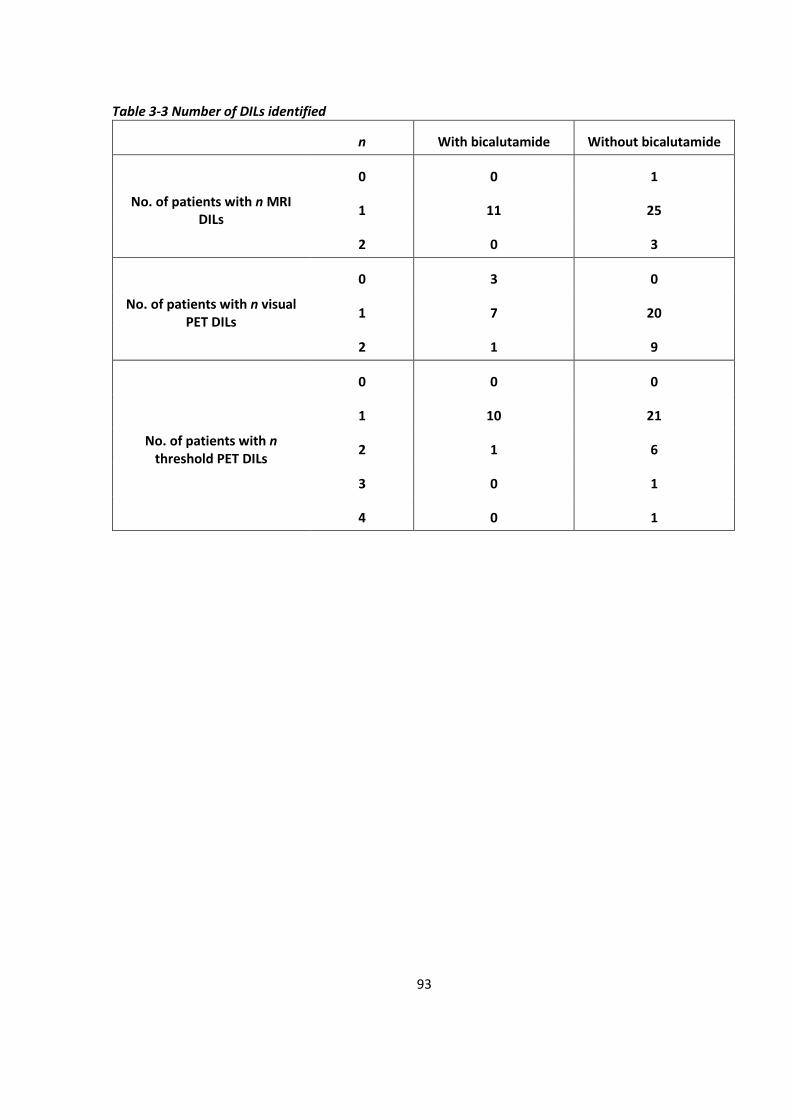
93
Table 3-3 Number of DILs identified
n With bicalutamide Without bicalutamide
No. of patients with n MRI DILs
0 0 1
1 11 25
2 0 3
No. of patients with n visual PET DILs
0 3 0
1 7 20
2 1 9
No. of patients with n threshold PET DILs
0 0 0
1 10 21
2 1 6
3 0 1
4 0 1
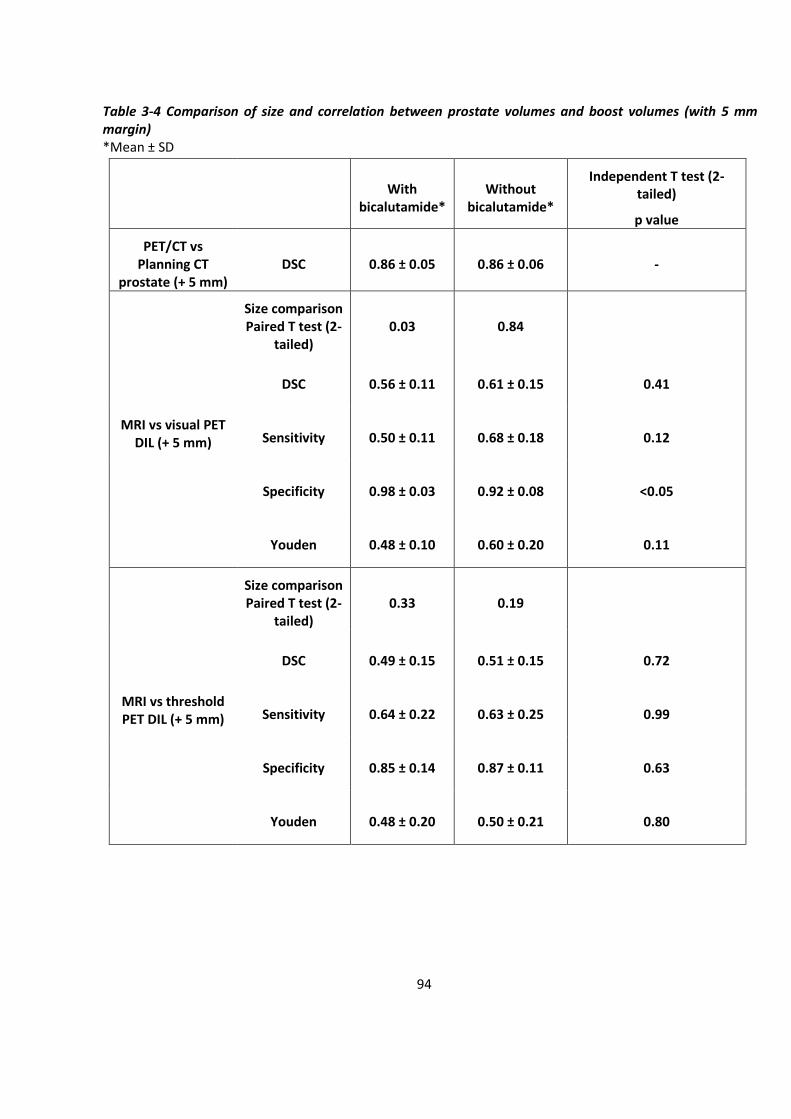
94
Table 3-4 Comparison of size and correlation between prostate volumes and boost volumes (with 5 mm margin) *Mean ± SD
With
bicalutamide* Without
bicalutamide*
Independent T test (2-tailed)
p value
PET/CT vs Planning CT
prostate (+ 5 mm) DSC 0.86 ± 0.05 0.86 ± 0.06 -
MRI vs visual PET DIL (+ 5 mm)
Size comparison Paired T test (2-
tailed) 0.03 0.84
DSC 0.56 ± 0.11 0.61 ± 0.15 0.41
Sensitivity 0.50 ± 0.11 0.68 ± 0.18 0.12
Specificity 0.98 ± 0.03 0.92 ± 0.08 <0.05
Youden 0.48 ± 0.10 0.60 ± 0.20 0.11
MRI vs threshold PET DIL (+ 5 mm)
Size comparison Paired T test (2-
tailed) 0.33 0.19
DSC 0.49 ± 0.15 0.51 ± 0.15 0.72
Sensitivity 0.64 ± 0.22 0.63 ± 0.25 0.99
Specificity 0.85 ± 0.14 0.87 ± 0.11 0.63
Youden 0.48 ± 0.20 0.50 ± 0.21 0.80
95
Discussion
Although the observation of reduced tracer uptake in patients on hormone therapy has
previously been described, these results have quantified this effect(206). If the PET/CT was
performed with bicalutamide, the prostate SUVmax was lower although it did not reach
statistical significance, and over a quarter of patients had no visually identifiable PET DILs
(Figure 3-2). If the PET/CT was performed without bicalutamide, all patients had at least one
visually identifiable PET DIL, and two patients had three to four threshold-identified PET DILs.
These additional volumes tended to be small (0.1 to 0.3 ml) and in practice, would be omitted
from the total boost volume.
For the patients who had PET/CT imaging with bicalutamide, visually identified PET DILs were
similar in size to those seen on MRI, whilst those identified in patients who were imaged
with bicalutamide were significantly smaller (Figure 3-3 and 3-4). This suggests that choline
tracer uptake in malignant lesions is reduced by bicalutamide on PET imaging, and therefore
bicalutamide should ideally be commenced after imaging has been performed. This effect
might also be found for PET imaging with other tracers such as PSMA, which is increasingly
used for identifying sites of recurrence following radical treatment.
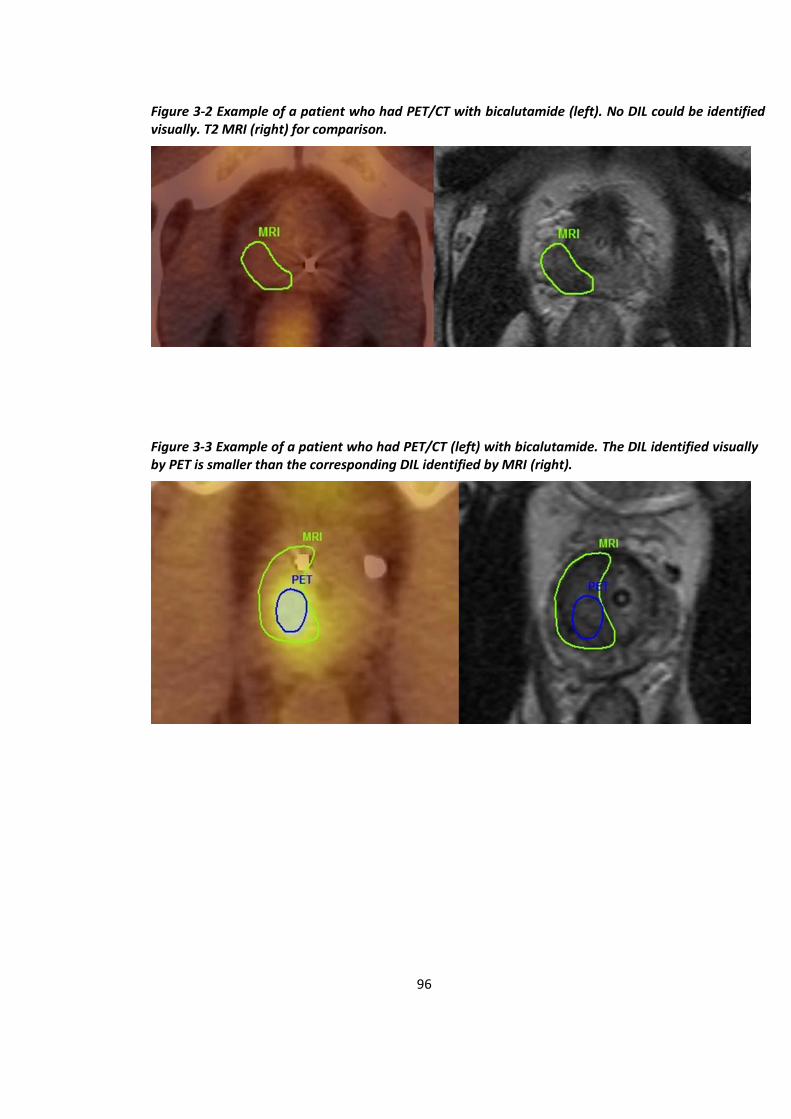
96
Figure 3-2 Example of a patient who had PET/CT with bicalutamide (left). No DIL could be identified visually. T2 MRI (right) for comparison.
Figure 3-3 Example of a patient who had PET/CT (left) with bicalutamide. The DIL identified visually by PET is smaller than the corresponding DIL identified by MRI (right).

97
Although it would be expected that a similar effect should be found for DILs delineated by
the threshold PET method, these results have not shown this. This may be because the
threshold level of SUVmax 60% is too low for our PET imaging protocol, resulting in generally
larger DILs which may have obscured any effect from bicalutamide.
Although it did not reach statistical significance, the correlation between threshold PET
boost volumes and MRI boost volumes were generally poorer than with the visual PET
method. This is likely to be because clinicians had access to all relevant clinic details at time
of visual delineation, as per real life clinical practice. The overall DSC values were highest for
the visual PET in the ‘without bicalutamide’ group (Figure 3-5).
Our data have also shown that around two and a half months of bicalutamide can reduce
the overall prostate volume by 17%, albeit with significant inter-patient variation. When
both PET/CT and planning CT were performed with bicalutamide, the prostate volumes were
similar although there were differences of up to 7.7% which reflects the difficulty delineating
pelvic soft tissue on CT. Despite the reduction in prostate size from bicalutamide, the DSC
between the prostate volumes were the same between the two groups (0.86) which may
suggest that the variation due to the change in size is on the same scale as the variation due
to difficulty delineating on CT. Rigid co-registration of the PET/CT and planning CT using the
fiducial markers and catheter was generally uncomplicated.
Figure 3-4 Example of a patient who had PET/CT (left) without bicalutamide. The DIL identified visually on PET overlaps the corresponding DIL identified on MRI (right).
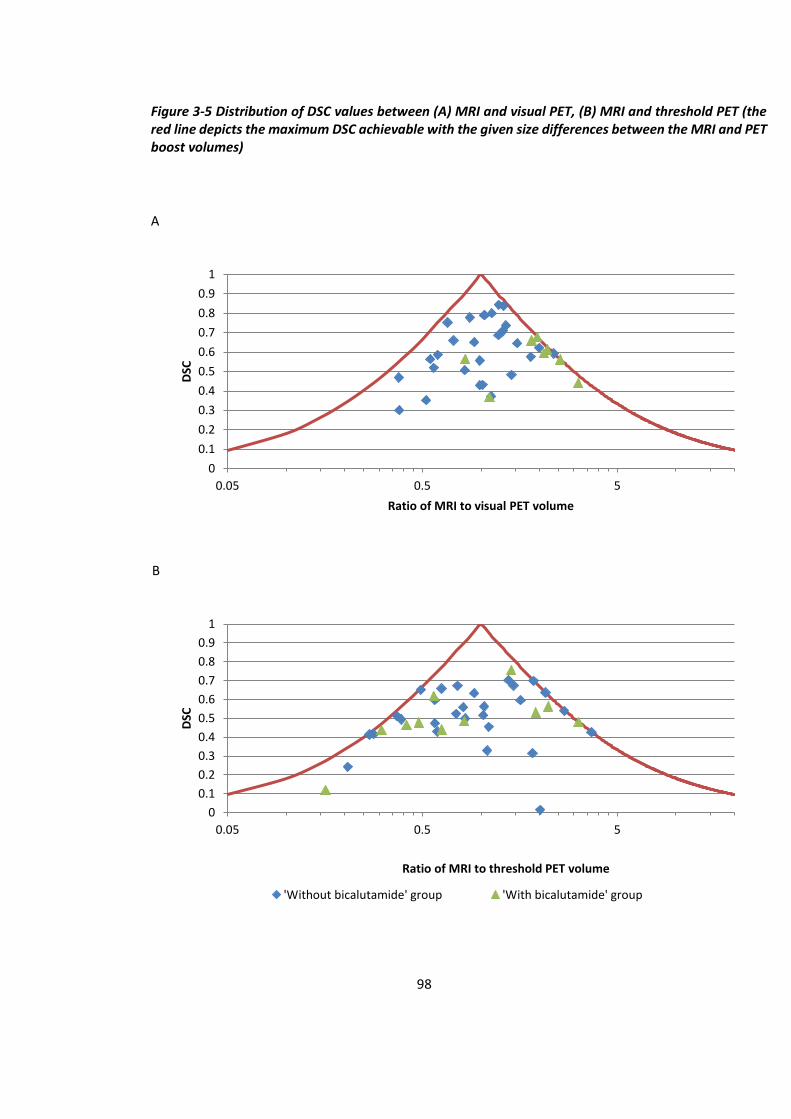
98
Figure 3-5 Distribution of DSC values between (A) MRI and visual PET, (B) MRI and threshold PET (the red line depicts the maximum DSC achievable with the given size differences between the MRI and PET boost volumes)
A
B
0
0.1
0.2
0.3
0.4
0.5
0.6
0.7
0.8
0.9
1
0.05 0.5 5
DSC
Ratio of MRI to visual PET volume
0
0.1
0.2
0.3
0.4
0.5
0.6
0.7
0.8
0.9
1
0.05 0.5 5
DSC
Ratio of MRI to threshold PET volume
'Without bicalutamide' group 'With bicalutamide' group
99
The duration of bicalutamide before PET/CT was performed varied from 42 to 193 days, in
part due to the busy clinical schedule of the nuclear medicine department. Although it is not
clear in the literature the duration of bicalutamide at which the effect on prostate volume
size is maximal, this variability may have influenced volume reduction. The hormone therapy
used in this study was bicalutamide, an antiandrogen. Other hormone therapies commonly
used in clinical practice include LHRH agonists which may be expected to have a larger effect
on SUVmax and boost volume reduction.
For this study, a standard injected activity of 370 MBq of 18F choline was used, as opposed
to a dose calibrated to the patient’s weight. This was because when 18F choline PET/CT
imaging was first introduced in our department, the optimum time of imaging was unclear
i.e. whether delayed imaging at 90 minutes would be appropriate. Hence, the maximum
activity possible under the regulations were used. Since this study was conducted, there is
more evidence for weight based reduction of injected activity which has now been adopted
within the department. For visual assessment of the static imaging, the windowing could be
altered to adjust the perceived uptake, and so for consistency the windowing was increased
until bone marrow uptake was visually detectable. There is no available evidence for the
optimal window setting for identifying intra-prostatic lesions, although a published paper
suggested adjusting with the liver as the reference(207). However the liver is not included in
the pelvic scan, and therefore for consistency, a pragmatic approach was taken to adjust the
windowing until uptake was seen in the bone marrow. MRI and Nuclear Medicine specialists
were not directly involved in delineating for this study as radiotherapy delineation is
principally performed by radiation oncologists in the UK. Therefore these results are directly
relevant to potential clinical practice.
There are differing views about the benefit of the addition of 11C choline PET/CT with MRI to
detect intra-prostatic tumours(39, 208). However Hartenbach et al. showed the increased
accuracy of using 18F choline PET/MRI (a scanning protocol with a comparatively prolonged
tracer uptake time) for identifying intra-prostatic tumour compared to MRI alone(52). It may
be the prolonged uptake time possible with using 18F choline which allows better
differentiation between malignant and benign prostate tissue.

100
Due to the lack of available literature identifying the optimal threshold level for 18F choline
PET/CT, the threshold level of SUVmax 60% which was identified by Chang et al. to provide
the best correlation between 11C choline PET and pathology was used(201). However there
are key differences between their methodology and that of this study including radioisotope
used, registration method, and the defined standard (histology vs. MRI) for comparison.
It is acknowledged that there is a substantial difference in the number of patients between
the two groups in this retrospective study, and that each group individually constitutes a
small sample size. However the boost volume correlation methodology deployed here
followed that in the published work (involving a smaller number of subjects than in either of
our groups) of Chang et al.(201).
A limitation of this retrospective study is that the patients were not randomised into the two
groups, but instead the groups were recruited in sequence from one cohort of patients. This
should not have resulted in differing group characteristics as the inclusion criteria were
constant throughout. However, subjective visual identification of DILs may have changed
over time with increasing experience in analysing choline PET/CT imaging. Furthermore,
there was a lack of the gold standard comparison with cross-sectional histology. It should be
noted that surgical series may often include lower risk patients and histology samples distort
significantly after preparation and mounting. An alternative to cross sectional histology is
template biopsies, which would have offered an accurate assessment of the location and
size of significant high grade tumour. Overall, any visual method is by definition subjective,
and so the conclusions from this study will ideally be confirmed by future studies using
different PET/CT imaging protocols. Further studies are required to determine whether the
addition of PET for the planning process will ultimately improve clinical treatment outcomes.
Conclusions
For visual delineation of DILs in prostate dose painting radiotherapy, 18F choline PET/CT
should be performed before bicalutamide. For threshold delineation of DILs using this
specific PET/CT scanning protocol, threshold levels of >60% of prostate SUVmax may be more
suitable. The location and size of PET DILs can vary to that of the MRI boost volumes, and so
the additional use of PET with MRI for radiotherapy planning can significantly change the

101
overall boost volumes compared to using MRI alone. However, further studies are required
to determine whether the addition of PET for the planning process will ultimately improve
clinical treatment outcomes. Similar effects of bicalutamide on PET/CT using other tracers,
such as PSMA, may exist.
102
4 Planning of moderately hypofractionated dose painting
radiotherapy for prostate adenocarcinoma
Introduction
Whole prostate dose escalation radiotherapy is an effective treatment modality for prostate
adenocarcinoma but the dose is limited by toxicities. Advanced technology allows delivery
of highly sculpted inhomogeneous dose distributions with simultaneous dose escalation to
a boost volume within the clinical target volume (CTV) where there is a higher risk of
recurrence, whilst still delivering a tumouricidal dose to the rest of the CTV. This
simultaneous integrated boost (SIB) technique is already standard practice for treating
prostate and seminal vesicles to different doses. However, studies have shown that it is
feasible to devise radiotherapy plans with an additional third higher dose level, identified by
mpMRI, choline PET/CT, or ProstaScint SPECT, although mature biochemical and overall
survival outcome data are not yet currently available (Table 1-9). Of these studies, only one
had used the current standard UK prostate dose fractionation schedule of 60 Gy/ 20 #/ 4
weeks(161). This pilot study of 28 patients was performed at the Clatterbridge Cancer
Centre, and it showed that delivering a SIB of 68 Gy to the prostatic lesions by rotational
IMRT with IGRT was feasible within the organs at risk (OAR) constraints and had an
acceptable safety profile. Therefore a phase II single arm trial (BIOPROP20) was initiated by
Dr Syndikus (Clinical Oncology Consultant), with recruitment at two UK centres:
Clatterbridge Cancer Centre and Velindre Cancer Centre.
For the BIOPROP20 trial, I (together with Dr Syndikus) performed radiotherapy delineating
for the patients recruited at Clatterbridge Cancer Centre and reviewed the plans created by
the radiographers. For this chapter, I have collated and analysed the data from these
radiotherapy plans.

103
Aim
To determine whether prostate dose painting radiotherapy with planning aims of 60 Gy in 20
# over 4 weeks to the prostate and a SIB of up to 68Gy is likely to meet a level of acceptable
toxicity before proceeding with a large randomised controlled phase III trial.
Methods
4.3.1 Study design
This phase II single cohort study (BIOPROP20) aimed to recruit 50 patients which would allow
an upper limit of 25% of ≥G2 toxicity to be ruled out with a power of 87.8% using the Fleming
A’Hern design(209).
4.3.2 Patients selection (inclusion and exclusion criteria)
Patients had the same eligibility criteria as chapter 2.
4.3.3 Trial protocol
All patients who fulfilled the inclusion and exclusion criteria were seen in clinic where the
options of standard treatment and study treatment were discussed. Patients have already had
staging pelvic mpMRI at their referring hospitals, with the scanner and sequence used
depending on local availability and local protocols. Patients were provided with the patient
information sheets and given at least 24 hours to consider the treatment options. Patients
subsequently returned to clinic where any outstanding questions were addressed by the
clinicians, and informed written consent was obtained and patients were registered.
For IGRT, patients received insertion of three gold fiducial markers which was performed
trans-rectally, assisted by TRUS and under local anaesthetic. Voluntary choline PET/CT was
offered to patients, and was performed at least 2 weeks after fiducial marker insertions but
within 4 weeks of patient registration although it could be deferred for logistic reasons. The
PET/CT imaging protocol has already been described in chapter 3.
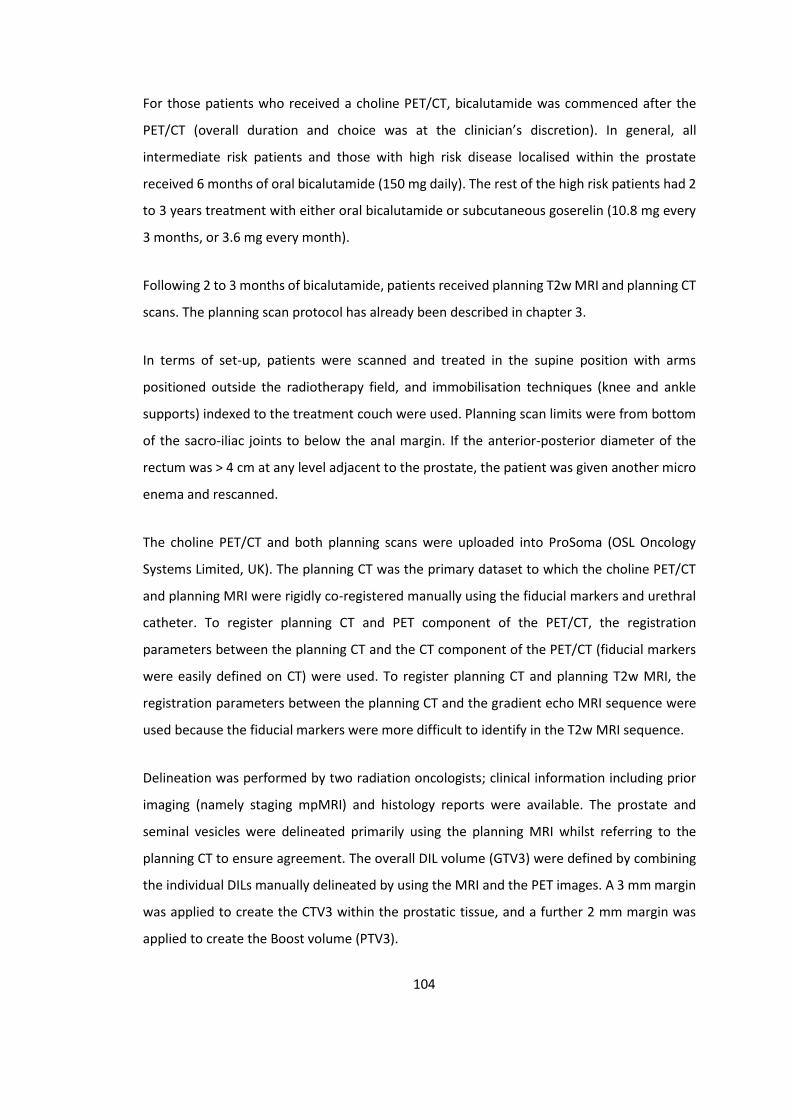
104
For those patients who received a choline PET/CT, bicalutamide was commenced after the
PET/CT (overall duration and choice was at the clinician’s discretion). In general, all
intermediate risk patients and those with high risk disease localised within the prostate
received 6 months of oral bicalutamide (150 mg daily). The rest of the high risk patients had 2
to 3 years treatment with either oral bicalutamide or subcutaneous goserelin (10.8 mg every
3 months, or 3.6 mg every month).
Following 2 to 3 months of bicalutamide, patients received planning T2w MRI and planning CT
scans. The planning scan protocol has already been described in chapter 3.
In terms of set-up, patients were scanned and treated in the supine position with arms
positioned outside the radiotherapy field, and immobilisation techniques (knee and ankle
supports) indexed to the treatment couch were used. Planning scan limits were from bottom
of the sacro-iliac joints to below the anal margin. If the anterior-posterior diameter of the
rectum was > 4 cm at any level adjacent to the prostate, the patient was given another micro
enema and rescanned.
The choline PET/CT and both planning scans were uploaded into ProSoma (OSL Oncology
Systems Limited, UK). The planning CT was the primary dataset to which the choline PET/CT
and planning MRI were rigidly co-registered manually using the fiducial markers and urethral
catheter. To register planning CT and PET component of the PET/CT, the registration
parameters between the planning CT and the CT component of the PET/CT (fiducial markers
were easily defined on CT) were used. To register planning CT and planning T2w MRI, the
registration parameters between the planning CT and the gradient echo MRI sequence were
used because the fiducial markers were more difficult to identify in the T2w MRI sequence.
Delineation was performed by two radiation oncologists; clinical information including prior
imaging (namely staging mpMRI) and histology reports were available. The prostate and
seminal vesicles were delineated primarily using the planning MRI whilst referring to the
planning CT to ensure agreement. The overall DIL volume (GTV3) were defined by combining
the individual DILs manually delineated by using the MRI and the PET images. A 3 mm margin
was applied to create the CTV3 within the prostatic tissue, and a further 2 mm margin was
applied to create the Boost volume (PTV3).
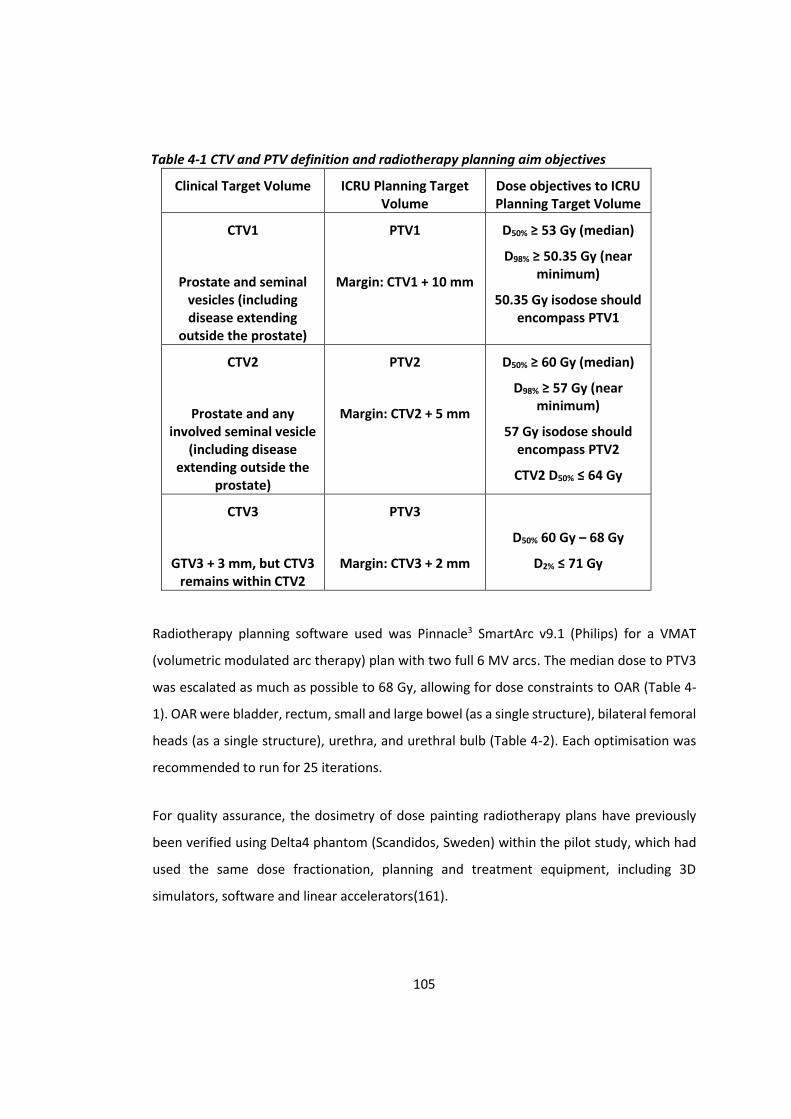
105
Table 4-1 CTV and PTV definition and radiotherapy planning aim objectives
Clinical Target Volume ICRU Planning Target Volume
Dose objectives to ICRU Planning Target Volume
CTV1
Prostate and seminal vesicles (including disease extending
outside the prostate)
PTV1
Margin: CTV1 + 10 mm
D50% ≥ 53 Gy (median)
D98% ≥ 50.35 Gy (near minimum)
50.35 Gy isodose should encompass PTV1
CTV2
Prostate and any involved seminal vesicle
(including disease extending outside the
prostate)
PTV2
Margin: CTV2 + 5 mm
D50% ≥ 60 Gy (median)
D98% ≥ 57 Gy (near minimum)
57 Gy isodose should encompass PTV2
CTV2 D50% ≤ 64 Gy
CTV3
GTV3 + 3 mm, but CTV3 remains within CTV2
PTV3
Margin: CTV3 + 2 mm
D50% 60 Gy – 68 Gy
D2% ≤ 71 Gy
Radiotherapy planning software used was Pinnacle3 SmartArc v9.1 (Philips) for a VMAT
(volumetric modulated arc therapy) plan with two full 6 MV arcs. The median dose to PTV3
was escalated as much as possible to 68 Gy, allowing for dose constraints to OAR (Table 4-
1). OAR were bladder, rectum, small and large bowel (as a single structure), bilateral femoral
heads (as a single structure), urethra, and urethral bulb (Table 4-2). Each optimisation was
recommended to run for 25 iterations.
For quality assurance, the dosimetry of dose painting radiotherapy plans have previously
been verified using Delta4 phantom (Scandidos, Sweden) within the pilot study, which had
used the same dose fractionation, planning and treatment equipment, including 3D
simulators, software and linear accelerators(161).

106
Whilst the inclusion criteria was for clinically node negative patients on staging pelvic MRI
imaging, some of the recruited patients were subsequently found to have involved pelvic
lymph nodes on choline PET/CT. As they remained suitable for radical treatment, they were
planned for simultaneous prostate and lymph node dose painting radiotherapy: prostate
was planned as above, with lymph nodes PTV (delineated using a vascular expansion
technique with a bowel expansion volume as per PIVOTAL study guidelines, and a CTV to PTV
margin of 5 mm) treated to median dose of 45 Gy and lymph node boost PTV (defined as
involved nodes with 3 mm margin) treated to median dose of 50 Gy(150).
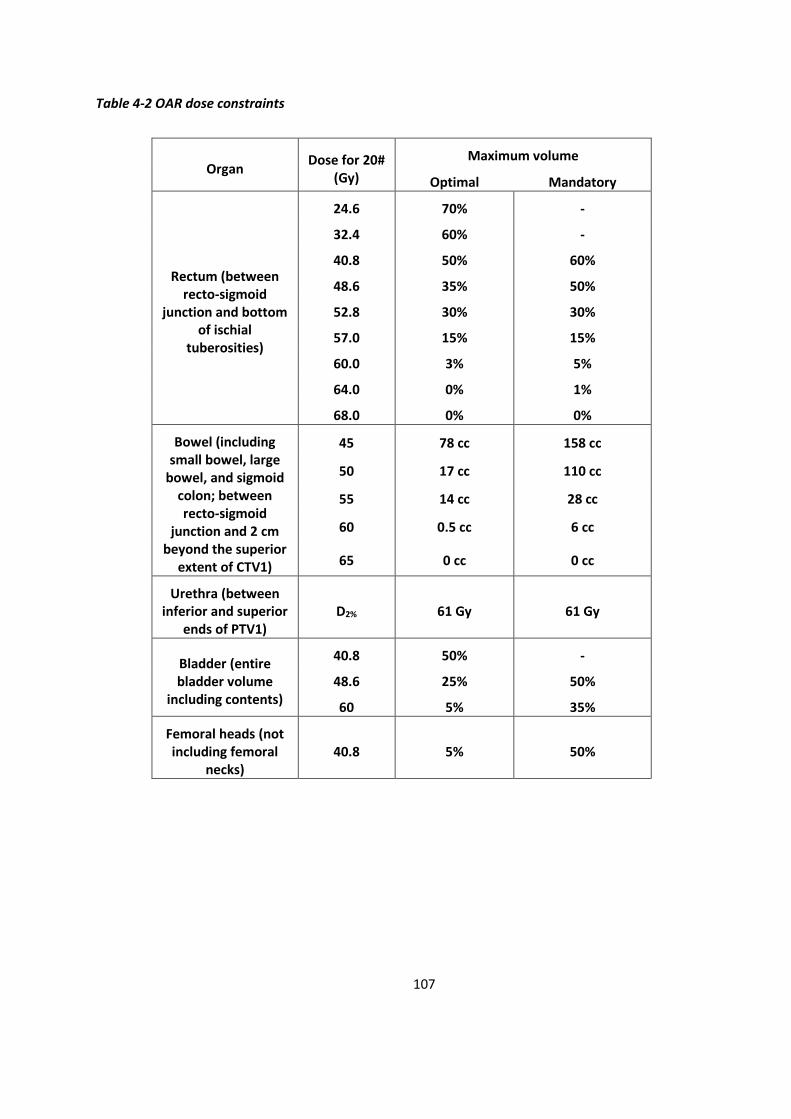
107
Table 4-2 OAR dose constraints
Organ Dose for 20#
(Gy)
Maximum volume
Optimal Mandatory
Rectum (between recto-sigmoid
junction and bottom of ischial
tuberosities)
24.6 70% -
32.4 60% -
40.8 50% 60%
48.6 35% 50%
52.8 30% 30%
57.0 15% 15%
60.0 3% 5%
64.0 0% 1%
68.0 0% 0%
Bowel (including small bowel, large
bowel, and sigmoid colon; between recto-sigmoid
junction and 2 cm beyond the superior
extent of CTV1)
45 78 cc 158 cc
50 17 cc 110 cc
55 14 cc 28 cc
60 0.5 cc 6 cc
65 0 cc 0 cc
Urethra (between inferior and superior
ends of PTV1) D2% 61 Gy 61 Gy
Bladder (entire bladder volume
including contents)
40.8 50% -
48.6 25% 50%
60 5% 35%
Femoral heads (not including femoral
necks) 40.8 5% 50%

108
Results
In total, 57 patients were registered between 14th March 2014 and 15th April 2016 at
Clatterbridge Cancer Centre. Fifty-five patients had choline PET/CT. Five patients had pelvic
lymph node positive disease on choline PET/CT, whilst 1 patient had bone metastasis on
choline PET/CT. Therefore, overall 56 patients had dose painting radiotherapy planning, of
whom 51 patients had prostate only dose painting and 5 patients had prostate and lymph
node dose painting radiotherapy planning (Figure 4-1)(Table 4-3).
Of the 5 patients with pelvic nodal boost volumes, 3 patients had a single node (2 were
external iliac, 1 was internal iliac) and 2 patients had multiple nodes (one patient had
ipsilateral nodes involving common iliac and external iliac nodes, and one patient had
bilateral nodes involving inguinal, internal and external iliac nodes regions).
Figure 4-1 Flow diagram of study participants at the Clatterbridge Cancer Centre

109
Table 4-3 Patient demographics * Roach formula for LN risk
All patients who received dose
painting radiotherapy
planning (n = 56)
Patients with prostate only
dose painting (n = 51)
Patients with prostate and lymph node
dose painting (n = 5)
Media
n Range
Median
Range Media
n Range
Age 68 50 - 77 69 56 - 77 66 50 - 77
Gleason
6 1 0 1
7 42 38 4
8 5 5 0
9 8 8 0
PSA (µg/ml)
10.0
3.9 - 39.4
9.1 3.9 – 39.4
12.2 7.2 - 32.0
Staging
T2 18 17 1
T3a 34 31 3
T3b 4 3 1
T4 0 0 0
Risk category
Intermediate 13 12 1
High 43 39 4
Risk of LN disease*
(%)
18 15 - 40 18 15 - 40 19 15 - 28
PS 0 51 46 5
1 5 5 0
4.4.1 Identifying DILs for dose painting radiotherapy
4.4.1.1 MRI
The use of both fiducial markers and indwelling catheter for rigid registration between the
planning CT and planning MRI was uncomplicated. Although the prostate and seminal
vesicles were predominantly delineated using the planning CT as the primary dataset, the

110
planning T2w MRI was useful in determining the inferior border of the prostate which can
be difficult to distinguish from the urogenital diaphragm. The DILs were generally identifiable
on planning MRI with visual reference to the staging MRI.
4.4.1.2 Choline PET/CT
Visual assessment of the registration within the choline PET/CT, and between PET and
planning CT, did not show any significant registration issues for the patients in this study.
4.4.2 Planning
The overall GTV3 were formed by combining the DILs from both imaging modalities. In order
to account for delineation uncertainties, expansion margins were used to define the PTV3.
The median size (and range) of the GTV3 volumes were 3.5 ml (1.2 ml to 14.9 ml) and 4.2 ml
(6.8 ml to 20.1 ml) for patients receiving ‘prostate only’ and ‘prostate and lymph node’ dose
painting respectively. The median size (and range) of PTV3 volumes were 13.5 ml (8.2 ml to
33.1 ml) and 16.3 ml (8.1 ml to 32.0 ml) respectively.
Planning within the dose constraints was possible for all patients (Tables 4-4 and 4-5). ‘PTV3’
is the prostate boost volume; ‘PTV2_PTV3’ is the prostate and involved seminal vesicles
without the PTV3 boost volume; ‘PTV1_PTV2’ is the prostate and whole seminal vesicles
without PTV2; ‘PTV LN50’ is the lymph node boost volume; and ‘PTV LN45_LN50’ is the
lymph node volume without the boost volume.
For the ‘prostate only’ dose painting group, the median D50% dose achieved to the PTV3
was 68.1 Gy, and the lowest D50% dose for an individual patient was 66.2 Gy. Of the 51
patients, 32 (63%) patients had PTV3 D50% of ≥ 68 Gy.
For the ‘prostate and lymph node’ dose painting group, the median D50% dose achieved to
the PTV3 was 67.2 Gy, and the lowest D50% dose for an individual patient was 66.8 Gy. Of
the 5 patients, 1 patient (20%) had PTV3 D50% of ≥ 68 Gy, and all patients had PTV LN50
D50% of ≥ 50 Gy.

111
Table 4-4 PTV reported doses
Planning target
Prostate only dose painting group
(n = 51) Prostate and lymph node
dose painting group (n = 5)
Median Range Median Range
PTV1_PTV2 (prostate and
seminal vesicles)
D2% 59.24 58.60 - 62.02 59.39 59.00 - 59.99
D50% ≥ 53.00 56.01 54.98 - 56.96 55.66 55.10 - 55.84
D90% 53.25 51.99 - 54.03 52.94 52.64 - 53.04
D98% ≥ 50.35 51.40 50.52 - 52.49 51.51 51.11 - 51.66
Mean dose 55.83 55.12 - 56.95 55.61 55.17 - 55.74
Volume (ml) 44.34 35.04 – 85.90 67.00 48.05 - 99.96
PTV2_PTV3 (prostate and any involved
seminal vesicles)
D2% 66.37 64.09 - 68.95 66.19 64.68 - 67.62
D50% ≥ 60.00; ≤ 64.00 61.02 60.39 - 61.67 60.98 60.85 - 61.17
D90% 59.21 58.37 - 59.76 59.15 58.79 - 59.41
D98% ≥ 57.00 58.07 57.19 - 59.01 58.03 57.07 - 58.31
Mean dose 61.37 60.74 - 62.06 61.34 60.98 - 61.45
Volume (ml) 62.05 36.42 - 135.14 92.79 65.04 - 114.46
D2% ≤ 71.00 70.09 69.04 - 71.01 70.32 69.18 - 70.95
112
PTV3 (prostate boost volume)
D50% 60.00 - 68.00 68.10 66.21 - 68.86 67.23 66.79 - 68.46
D90% 63.81 61.69 - 67.01 63.92 61.38 - 66.42
D98% 60.93 59.19 - 64.81 62.02 59.52 - 64.57
Mean dose 67.38 65.96 - 68.45 66.99 66.46 - 67.99
Volume 13.53 8.22 - 33.10 16.26 8.12 - 32.03
PTV LN45_LN50 (LN without
boost)
D2% NA NA 53.16 52.25 - 56.69
D50% NA NA 45.22 45.12 - 45.68
D98% NA NA 35.69 35.52 - 40.03
Mean dose NA NA 45.25 45.15 - 45.77
Volume NA NA 700.85 437.67 - 919.73
PTV LN50 (LN boost volume)
D2% NA NA 53.29 51.51 - 54.67
D50% NA NA 51.04 50.13 - 51.39
D98% NA NA 48.61 46.36 - 49.04
Mean dose NA NA 51.04 50.04 - 51.33
Volume NA NA 12.6 8.01 - 30.14
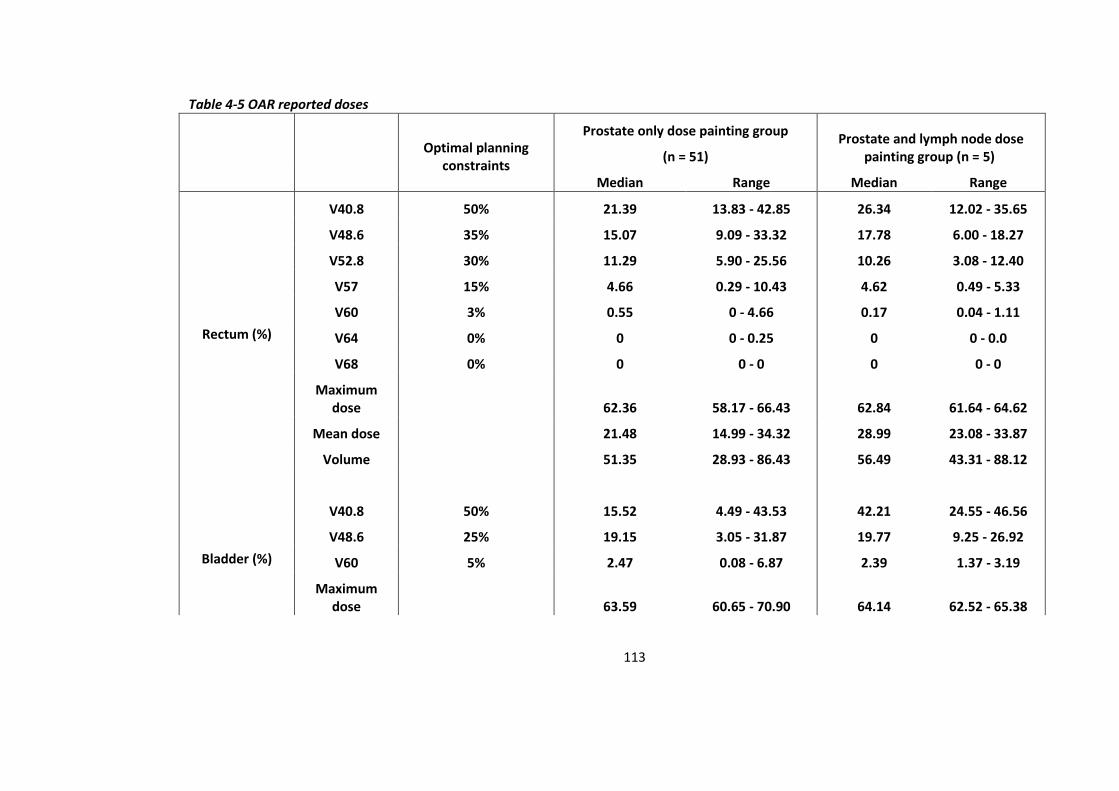
113
Table 4-5 OAR reported doses
Optimal planning constraints
Prostate only dose painting group
(n = 51) Prostate and lymph node dose
painting group (n = 5)
Median Range Median Range
Rectum (%)
V40.8 50% 21.39 13.83 - 42.85 26.34 12.02 - 35.65
V48.6 35% 15.07 9.09 - 33.32 17.78 6.00 - 18.27
V52.8 30% 11.29 5.90 - 25.56 10.26 3.08 - 12.40
V57 15% 4.66 0.29 - 10.43 4.62 0.49 - 5.33
V60 3% 0.55 0 - 4.66 0.17 0.04 - 1.11
V64 0% 0 0 - 0.25 0 0 - 0.0
V68 0% 0 0 - 0 0 0 - 0
Maximum dose 62.36 58.17 - 66.43 62.84 61.64 - 64.62
Mean dose 21.48 14.99 - 34.32 28.99 23.08 - 33.87
Volume 51.35 28.93 - 86.43 56.49 43.31 - 88.12
Bladder (%)
V40.8 50% 15.52 4.49 - 43.53 42.21 24.55 - 46.56
V48.6 25% 19.15 3.05 - 31.87 19.77 9.25 - 26.92
V60 5% 2.47 0.08 - 6.87 2.39 1.37 - 3.19
Maximum dose 63.59 60.65 - 70.90 64.14 62.52 - 65.38

114
Mean dose 17.48 7.10 – 35.89 39.56 32.47 - 42.18
Volume 181.07 48.15 - 678.91 167.75 97.01 - 318.58
Urethral (%) D2% 61 60.44 59.95 - 61.19 60.73 60.17 - 60.79
Volume 1.77 0.30 - 4.16 2 1.25 - 2.26
Bowel (cc)
V45 78 cc 0 0 – 2.69 2.71 0.1 - 25.1
V50 17 cc 0 0 – 1.68 0.02 0 - 0.61
V55 14 cc 0 0 - 0.74 0 0 - 0
V60 0.5 cc 0 0 - 0 0 0 - 0
V65 0 cc 0 0 - 0 0 0 - 0
Maximum dose 22.82 1.97 - 58.49 50.9 45.60 - 52.78
Mean dose 6.56 0.57 – 12.03 20.04 13.02 - 26.38
Volume 21.81 0.58 - 314.22 447.55 383.84 - 1066.1
Femoral heads (%)
V40.8 5% 0 0 - 1.26 0 0 - 7.02
Maximum dose 35.55 27.32 - 43.99 40.2 39.84 - 46.70
Mean dose 21.91 10.26 - 30.74 27.56 22.37 - 32.13
Volume 120.36 78.9 - 207.07 123.32 118.53 - 158.19
115
Discussion
Whilst planning within the dose constraints was possible for all patients, the position of the
boost volumes within the prostate was the main factor that limited the deliverable boost
dose. During the optimisation, the planning software sometimes struggled as a result of the
proximity of the OARs (mainly urethra and rectum) and their dose constraints. Extra
optimisation structures were often required to achieve dose drop off, and superior and
inferior shells were occasionally required to force superior-inferior dose conformity.
Overall, more than half of ‘prostate only’ radiotherapy patients achieved a prostatic boost
dose of ≥ 68 Gy, but only 20% of ‘prostate and lymph node’ radiotherapy patients achieved
a prostatic boost dose of ≥ 68 Gy whilst all achieved a lymph node boost dose of ≥ 50 Gy.
Despite the addition of lymph node dose painting radiotherapy, the D50% doses to the
prostate boost volumes for ‘prostate only’ group (median 68.1 Gy; range 66.2 Gy to 68.9 Gy)
and for ‘prostate and lymph node’ group (median 67.2 Gy; range 66.8 Gy to 68.5 Gy) were
not significantly different (Mann Whitney U test, p = 0.09). The BIOPROP20 study also
recruited at Velindre Cancer Centre, and the D50% doses to the prostate boost volumes of
the patients recruited there, all of whom were for prostate only dose painting radiotherapy
(median 65.4 Gy; range 64.0 Gy to 67.6 Gy) were significantly lower to that at Clatterbridge
Cancer Centre (Mann Whitney U test, p < 0.01). This may be due to differences in experience
of the radiographers. Velindre Cancer Centre had only planned 5 patients in total, whilst
Clatterbridge Cancer Centre had planned 56 patients within BIOPROP20 and also had prior
experience in prostate dose painting from the pilot study.
For the CHHiP study, one of the treatment arms aimed to deliver 60 Gy for localised prostate
cancer with three dose levels also(10). These were 60 Gy/ 57.6 Gy/ 48 Gy, compared with 68
Gy/ 60 Gy/ 53 Gy in the BIOPROP20 study, whilst the high dose volume for CHHiP was the
whole prostate (60 Gy) compared to DILs (68Gy). There was no posterior margin (CTV3 to
PTV3) for the high dose volume in CHHiP whilst the maximal extension of the high dose
volume beyond the boundaries of the prostate in BIOPROP20 was 2 mm, which could lead
to higher maximum doses in the rectum for BIOPROP20 than for CHHiP. On the other hand,
margins used for the lower dose levels in CHHiP were 5/10 mm compared to 3/6 mm for
116
BIOPROP20, which could lead to lower median doses in the rectum for BIOPROP20 than for
CHHiP. From the data presented in this chapter, the median volume of rectum irradiated to
60 Gy was 0.6%, whilst in CHHiP (for those who had inverse planning) it was 16.0%(210). This
comparison has to be treated with caution however as the CHHiP data, although published
in 2019, was for the early cohort of patients treated between 2002 and 2006 using various
different treatment planning systems and at a time when IMRT was a relatively new
technique.
The preceding pilot study for ‘prostate only’ patients, using the same planning aims, was
reported to have achieved a mean of the PTV68 D50% of 67 Gy (63 to 71 Gy)(161). In the
current group of ‘prostate only’ patients at Clatterbridge Cancer Centre in the BIOPROP20,
the median of the PTV68 D50% was 68 Gy. A notable difference between these two studies
was that the pilot study had used only MRI for DIL delineation, whilst this study had used
both MRI and PET. However the median DIL volumes were similar (4.3 cm3 and 3.5 cm3 for
the pilot and this study respectively).
International Commission on Radiation Units and Measurements (ICRU) Report 83 was
published to standardise the nomenclature of prescribing, recording, and reporting photon-
beam IMRT, where GTV is defined as “the gross demonstrable extent and location of the
tumour” and CTV is defined as “a volume of tissue that contains a demonstrable GTV and/or
subclinical malignant disease with a certain probability of occurrence considered relevant
for therapy”(211). Whilst it may be argued that the whole prostate outside of the boost
volume is already being treated with a radical dose which should eliminate subclinical
microscopic malignant disease and therefore a margin around the DIL to create an intra-
prostatic CTV for the boost volume is not required, we felt it was still reasonable to have a
margin given that the primary aim of dose painting radiotherapy is to deliver dose escalation
to the macroscopic DIL for which there is some uncertainty in the accuracy of delineation on
imaging.
When MRI has been used to define the prostatic boost volume in previous studies, the
margins used from the DIL have ranged from 0 mm to 15 mm (Table 4-5). Compared to the
other studies, Miralbell defined a “tumour-bearing zone” not only on MRI but also used
information from rectal examination and biopsy specimens(101). This resulted in a
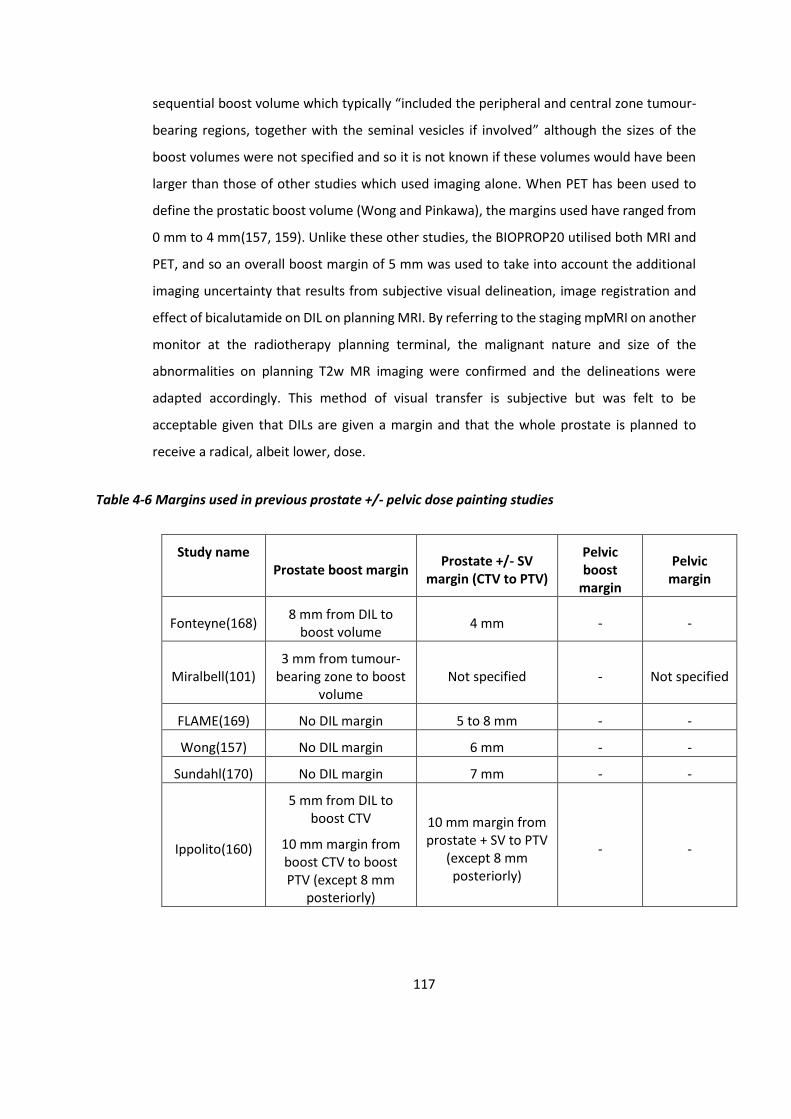
117
sequential boost volume which typically “included the peripheral and central zone tumour-
bearing regions, together with the seminal vesicles if involved” although the sizes of the
boost volumes were not specified and so it is not known if these volumes would have been
larger than those of other studies which used imaging alone. When PET has been used to
define the prostatic boost volume (Wong and Pinkawa), the margins used have ranged from
0 mm to 4 mm(157, 159). Unlike these other studies, the BIOPROP20 utilised both MRI and
PET, and so an overall boost margin of 5 mm was used to take into account the additional
imaging uncertainty that results from subjective visual delineation, image registration and
effect of bicalutamide on DIL on planning MRI. By referring to the staging mpMRI on another
monitor at the radiotherapy planning terminal, the malignant nature and size of the
abnormalities on planning T2w MR imaging were confirmed and the delineations were
adapted accordingly. This method of visual transfer is subjective but was felt to be
acceptable given that DILs are given a margin and that the whole prostate is planned to
receive a radical, albeit lower, dose.
Table 4-6 Margins used in previous prostate +/- pelvic dose painting studies
Study name Prostate boost margin
Prostate +/- SV margin (CTV to PTV)
Pelvic boost
margin
Pelvic margin
Fonteyne(168) 8 mm from DIL to
boost volume 4 mm - -
Miralbell(101) 3 mm from tumour-
bearing zone to boost volume
Not specified - Not specified
FLAME(169) No DIL margin 5 to 8 mm - -
Wong(157) No DIL margin 6 mm - -
Sundahl(170) No DIL margin 7 mm - -
Ippolito(160)
5 mm from DIL to boost CTV
10 mm margin from boost CTV to boost PTV (except 8 mm
posteriorly)
10 mm margin from prostate + SV to PTV
(except 8 mm posteriorly)
- -
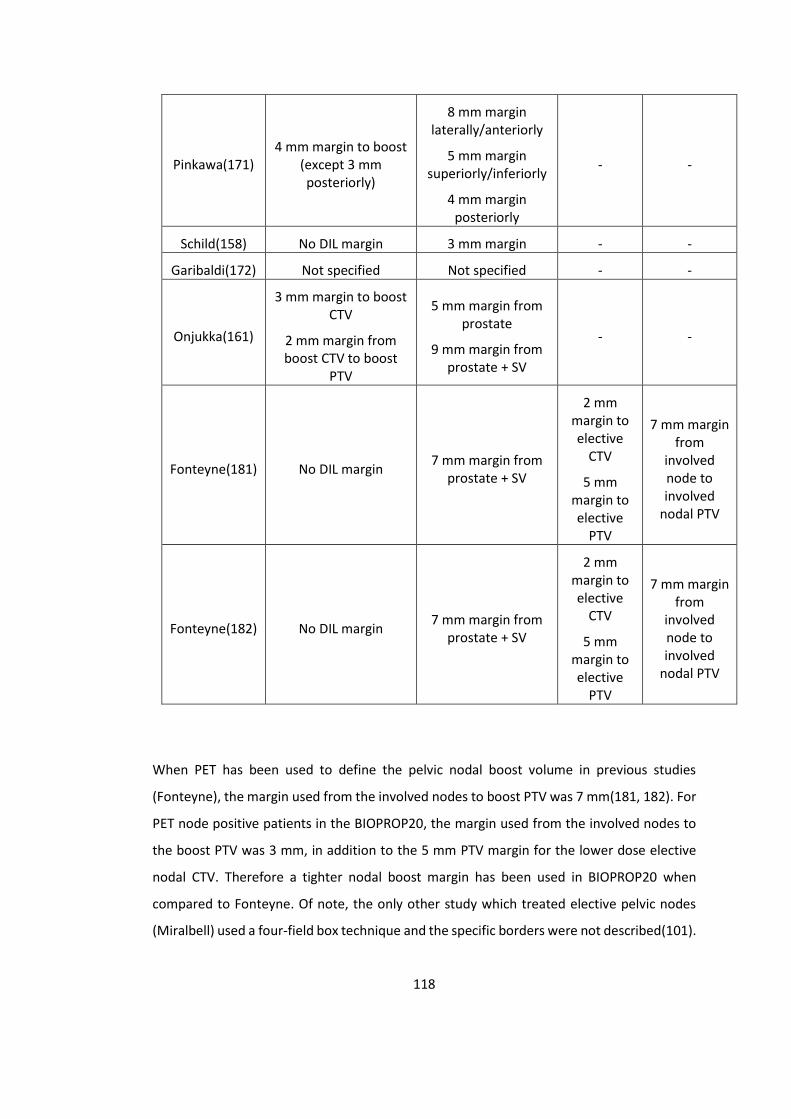
118
Pinkawa(171) 4 mm margin to boost
(except 3 mm posteriorly)
8 mm margin laterally/anteriorly
5 mm margin superiorly/inferiorly
4 mm margin posteriorly
- -
Schild(158) No DIL margin 3 mm margin - -
Garibaldi(172) Not specified Not specified - -
Onjukka(161)
3 mm margin to boost CTV
2 mm margin from boost CTV to boost
PTV
5 mm margin from prostate
9 mm margin from prostate + SV
- -
Fonteyne(181) No DIL margin 7 mm margin from
prostate + SV
2 mm margin to elective
CTV
5 mm margin to elective
PTV
7 mm margin from
involved node to involved
nodal PTV
Fonteyne(182) No DIL margin 7 mm margin from
prostate + SV
2 mm margin to elective
CTV
5 mm margin to elective
PTV
7 mm margin from
involved node to involved
nodal PTV
When PET has been used to define the pelvic nodal boost volume in previous studies
(Fonteyne), the margin used from the involved nodes to boost PTV was 7 mm(181, 182). For
PET node positive patients in the BIOPROP20, the margin used from the involved nodes to
the boost PTV was 3 mm, in addition to the 5 mm PTV margin for the lower dose elective
nodal CTV. Therefore a tighter nodal boost margin has been used in BIOPROP20 when
compared to Fonteyne. Of note, the only other study which treated elective pelvic nodes
(Miralbell) used a four-field box technique and the specific borders were not described(101).
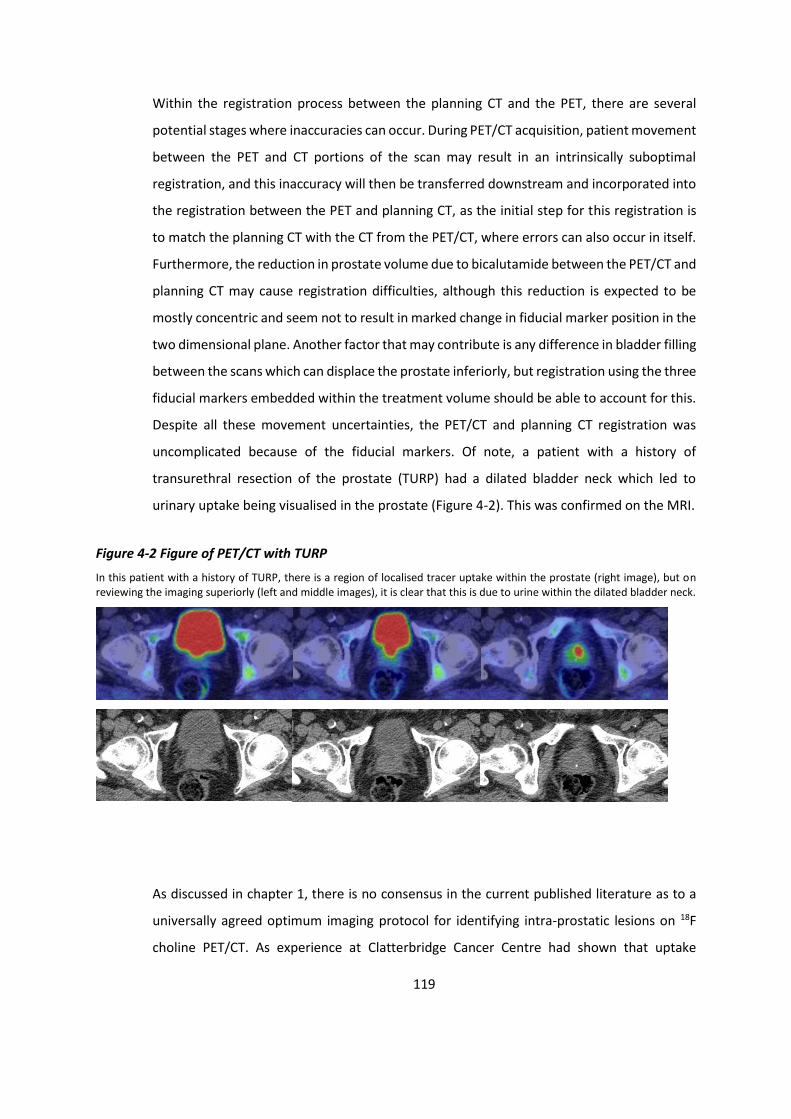
119
Within the registration process between the planning CT and the PET, there are several
potential stages where inaccuracies can occur. During PET/CT acquisition, patient movement
between the PET and CT portions of the scan may result in an intrinsically suboptimal
registration, and this inaccuracy will then be transferred downstream and incorporated into
the registration between the PET and planning CT, as the initial step for this registration is
to match the planning CT with the CT from the PET/CT, where errors can also occur in itself.
Furthermore, the reduction in prostate volume due to bicalutamide between the PET/CT and
planning CT may cause registration difficulties, although this reduction is expected to be
mostly concentric and seem not to result in marked change in fiducial marker position in the
two dimensional plane. Another factor that may contribute is any difference in bladder filling
between the scans which can displace the prostate inferiorly, but registration using the three
fiducial markers embedded within the treatment volume should be able to account for this.
Despite all these movement uncertainties, the PET/CT and planning CT registration was
uncomplicated because of the fiducial markers. Of note, a patient with a history of
transurethral resection of the prostate (TURP) had a dilated bladder neck which led to
urinary uptake being visualised in the prostate (Figure 4-2). This was confirmed on the MRI.
Figure 4-2 Figure of PET/CT with TURP
In this patient with a history of TURP, there is a region of localised tracer uptake within the prostate (right image), but on reviewing the imaging superiorly (left and middle images), it is clear that this is due to urine within the dilated bladder neck.
As discussed in chapter 1, there is no consensus in the current published literature as to a
universally agreed optimum imaging protocol for identifying intra-prostatic lesions on 18F
choline PET/CT. As experience at Clatterbridge Cancer Centre had shown that uptake

120
appeared visually to be more focal on late imaging, a pragmatic approach was taken to use
imaging performed 90 minutes following tracer injection. However there were some cases
with generally diffuse uptake throughout the prostate, and a clinical decision was made for
the DIL to be delineated at a region of highest visual uptake (Figure 4-3). This was obvious in
a patient who developed an infection and prostatitis after the fiducial marker insertion.

121
Figure 4-3 Example of generally diffuse choline tracer uptake Example of generally diffuse choline tracer uptake throughout the prostate on PET/CT (A) and the PET
sequence alone (B), and the DIL was delineated at a region of highest visual uptake
A
B
The previous chapter has shown that automatic delineation by using a threshold of SUVmax
60% produces larger DILs with lower sensitivity and specificity than manually delineation
when compared with MRI DILs. This suggests that our methodology of using manual
delineation on the choline PET is more acceptable than using automatic threshold
delineation. Manual delineation allows the operator more flexibility in defining DILs, but can

122
increase variability depending on the windowing chosen (Figure 4-4). A pragmatic decision
was made to adjust the windowing until uptake was seen in the bone marrow before
delineating.
According to a large contemporary series, the risk of pathological pelvic lymph node
involvement in intermediate and high risk prostate cancer patients are 7.2% and 25.5%
respectively(65). For this group of BIOPROP20 patients with intermediate and high risk
disease (23.2% and 76.8% respectively), 5 of the 55 staging 18F choline PET/CT scans (9.1%)
showed radiologically positive pelvic lymph node uptake (Figure 4-5). It is expected that the
proportion of radiologically detected lymph node involvement is lower than that from
surgically detected studies because PET/CT imaging has a comparatively lower sensitivity
than histopathology(212). Another study of intermediate and high risk prostate cancer
patients found that 19 out of 130 patients (14.6%) had lymph node or bone metastasis on
18F choline PET/CT(54). Although none of the patients in this group of BIOPROP20 patients
had bone metastasis detected on 18F choline PET/CT, one patient did have unexpected
thyroid uptake which led to investigations that confirmed early stage papillary thyroid
carcinoma for which he subsequently received a thyroidectomy.
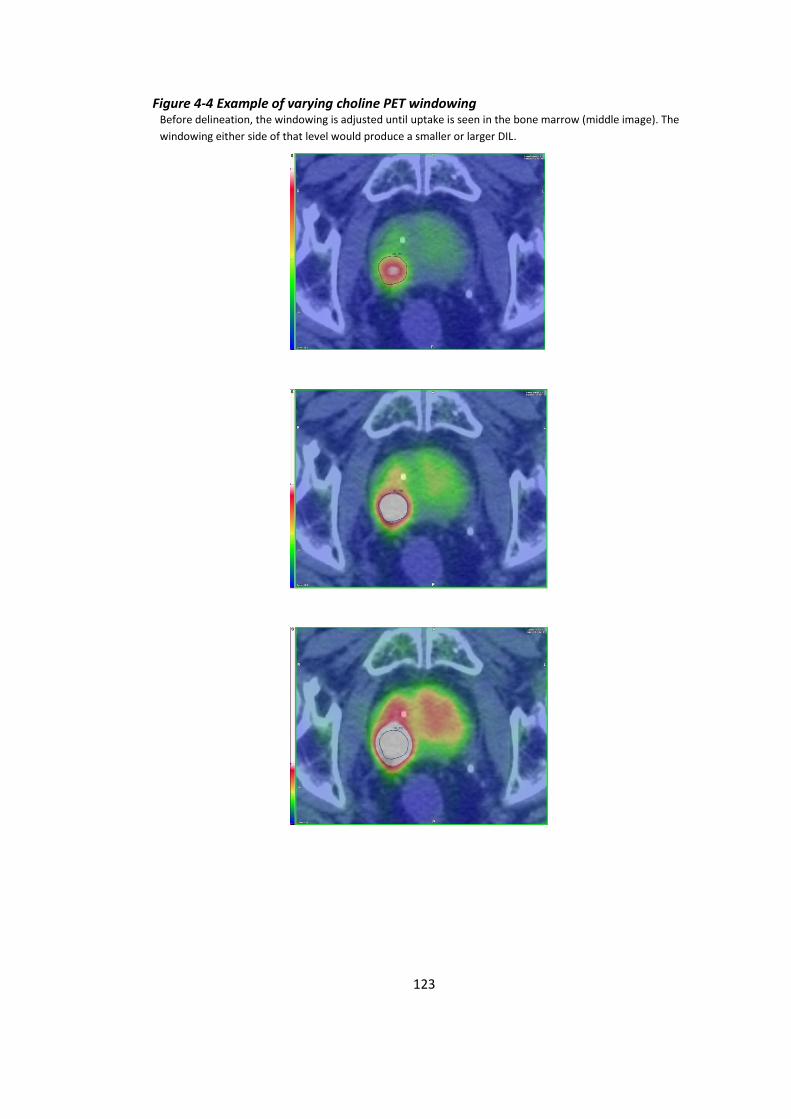
123
Figure 4-4 Example of varying choline PET windowing Before delineation, the windowing is adjusted until uptake is seen in the bone marrow (middle image). The
windowing either side of that level would produce a smaller or larger DIL.
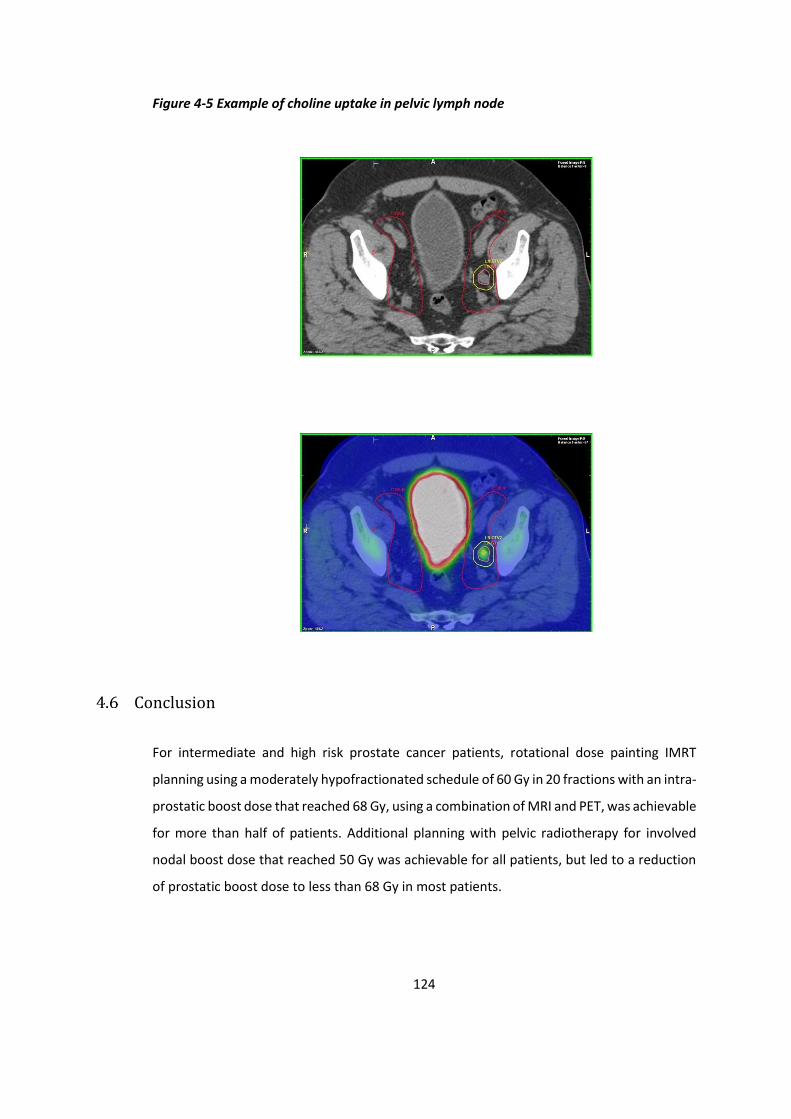
124
Figure 4-5 Example of choline uptake in pelvic lymph node
Conclusion
For intermediate and high risk prostate cancer patients, rotational dose painting IMRT
planning using a moderately hypofractionated schedule of 60 Gy in 20 fractions with an intra-
prostatic boost dose that reached 68 Gy, using a combination of MRI and PET, was achievable
for more than half of patients. Additional planning with pelvic radiotherapy for involved
nodal boost dose that reached 50 Gy was achievable for all patients, but led to a reduction
of prostatic boost dose to less than 68 Gy in most patients.

125
5 Acute toxicity of moderately hypofractionated dose
painting radiotherapy for prostate adenocarcinoma
Introduction
For standard radiotherapy, the urethra and base of bladder are included in the prostate PTV,
and the anterior rectal wall is often close to or included in the prostate PTV. In addition, the
prostate is a relatively mobile target volume, with the rectum and bladder subject to variable
filling, movement and deformity (213). Therefore, both acute and late toxicities are
experienced by a proportion of patients receiving prostate radiotherapy who are generally
expected to have good long-term survival. With dose painting prostate radiotherapy, the
addition of a boost volume for dose escalation risks increasing toxicity further. The previous
chapter demonstrated that it is theoretically feasible to deliver moderately hypofractionated
dose painting radiotherapy whilst adhering to dose constraints. This chapter will assess the
acute toxicity of this treatment.
For prostate cancer, various patient reported outcomes (IPSS, EPIC) and clinician reported
outcomes (CTCAE, RTOG) have been used in seminal trials(190, 214-216). These validated
questionnaires can prospectively evaluate symptoms prior to, during, and following
treatment. Performance status (PS) assesses the ability of the patient to undertake activities
of daily living, and is used to predict their ability to tolerate treatment and their
prognosis(217).
For the BIOPROP20 trial, I (together with Dr Syndikus) recruited and reviewed patients at the
Clatterbridge Cancer Centre. For this chapter, I have collated and analysed the acute toxicity
data.
Aims
-To determine the acute toxicities of moderately hypofractionated dose painting
radiotherapy for prostate adenocarcinoma with 60 Gy in 20 # over 4 weeks and a SIB of up
to 68 Gy.
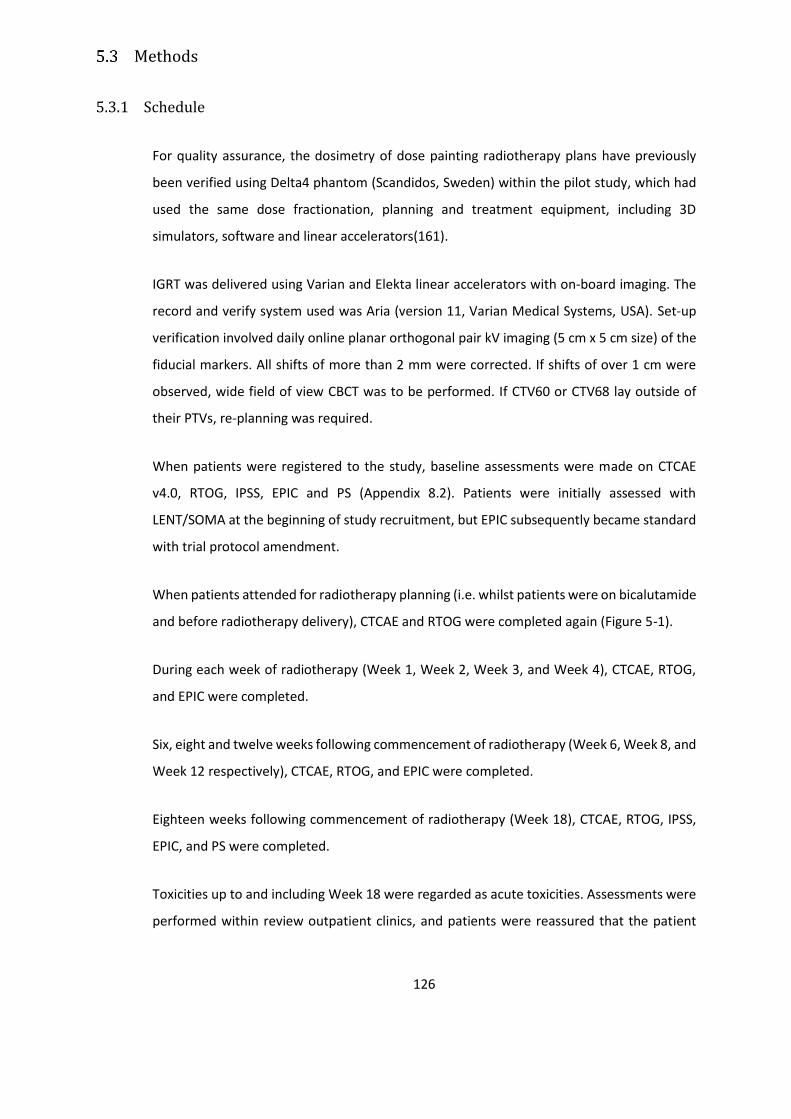
126
Methods
5.3.1 Schedule
For quality assurance, the dosimetry of dose painting radiotherapy plans have previously
been verified using Delta4 phantom (Scandidos, Sweden) within the pilot study, which had
used the same dose fractionation, planning and treatment equipment, including 3D
simulators, software and linear accelerators(161).
IGRT was delivered using Varian and Elekta linear accelerators with on-board imaging. The
record and verify system used was Aria (version 11, Varian Medical Systems, USA). Set-up
verification involved daily online planar orthogonal pair kV imaging (5 cm x 5 cm size) of the
fiducial markers. All shifts of more than 2 mm were corrected. If shifts of over 1 cm were
observed, wide field of view CBCT was to be performed. If CTV60 or CTV68 lay outside of
their PTVs, re-planning was required.
When patients were registered to the study, baseline assessments were made on CTCAE
v4.0, RTOG, IPSS, EPIC and PS (Appendix 8.2). Patients were initially assessed with
LENT/SOMA at the beginning of study recruitment, but EPIC subsequently became standard
with trial protocol amendment.
When patients attended for radiotherapy planning (i.e. whilst patients were on bicalutamide
and before radiotherapy delivery), CTCAE and RTOG were completed again (Figure 5-1).
During each week of radiotherapy (Week 1, Week 2, Week 3, and Week 4), CTCAE, RTOG,
and EPIC were completed.
Six, eight and twelve weeks following commencement of radiotherapy (Week 6, Week 8, and
Week 12 respectively), CTCAE, RTOG, and EPIC were completed.
Eighteen weeks following commencement of radiotherapy (Week 18), CTCAE, RTOG, IPSS,
EPIC, and PS were completed.
Toxicities up to and including Week 18 were regarded as acute toxicities. Assessments were
performed within review outpatient clinics, and patients were reassured that the patient
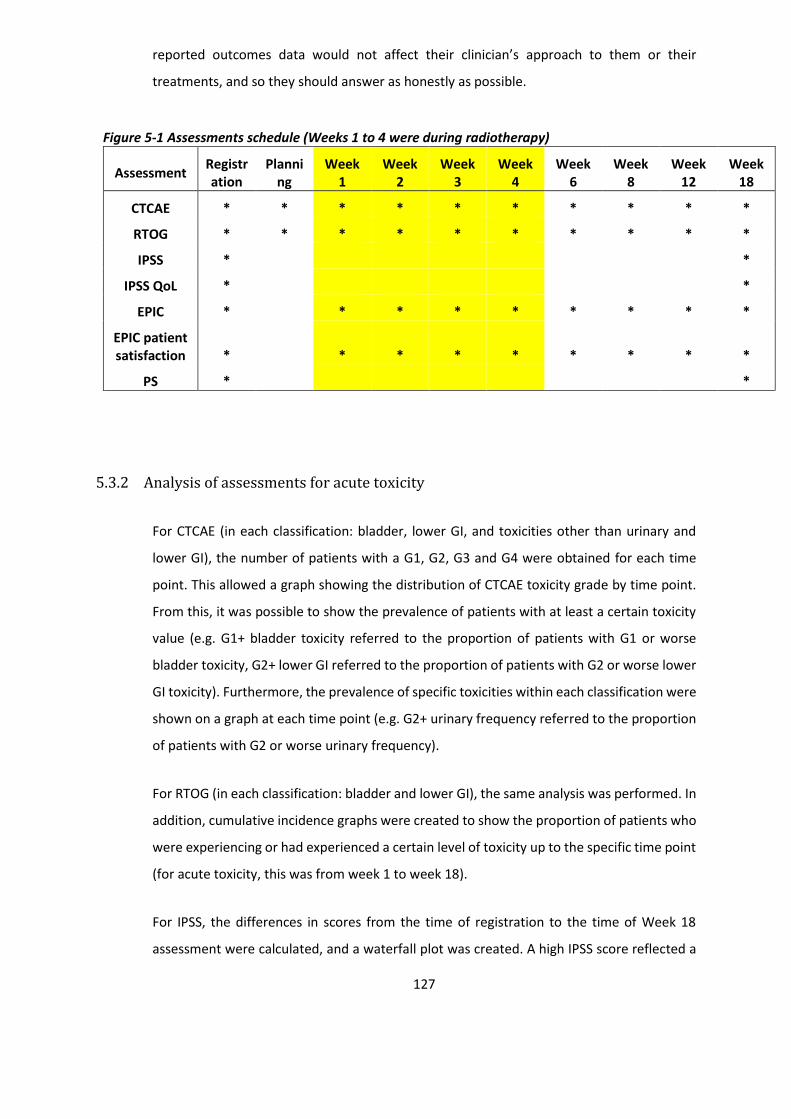
127
reported outcomes data would not affect their clinician’s approach to them or their
treatments, and so they should answer as honestly as possible.
Figure 5-1 Assessments schedule (Weeks 1 to 4 were during radiotherapy)
Assessment Registration
Planning
Week 1
Week 2
Week 3
Week 4
Week 6
Week 8
Week 12
Week 18
CTCAE * * * * * * * * * *
RTOG * * * * * * * * * *
IPSS * *
IPSS QoL * *
EPIC * * * * * * * * *
EPIC patient satisfaction * * * * * * * * *
PS * *
5.3.2 Analysis of assessments for acute toxicity
For CTCAE (in each classification: bladder, lower GI, and toxicities other than urinary and
lower GI), the number of patients with a G1, G2, G3 and G4 were obtained for each time
point. This allowed a graph showing the distribution of CTCAE toxicity grade by time point.
From this, it was possible to show the prevalence of patients with at least a certain toxicity
value (e.g. G1+ bladder toxicity referred to the proportion of patients with G1 or worse
bladder toxicity, G2+ lower GI referred to the proportion of patients with G2 or worse lower
GI toxicity). Furthermore, the prevalence of specific toxicities within each classification were
shown on a graph at each time point (e.g. G2+ urinary frequency referred to the proportion
of patients with G2 or worse urinary frequency).
For RTOG (in each classification: bladder and lower GI), the same analysis was performed. In
addition, cumulative incidence graphs were created to show the proportion of patients who
were experiencing or had experienced a certain level of toxicity up to the specific time point
(for acute toxicity, this was from week 1 to week 18).
For IPSS, the differences in scores from the time of registration to the time of Week 18
assessment were calculated, and a waterfall plot was created. A high IPSS score reflected a
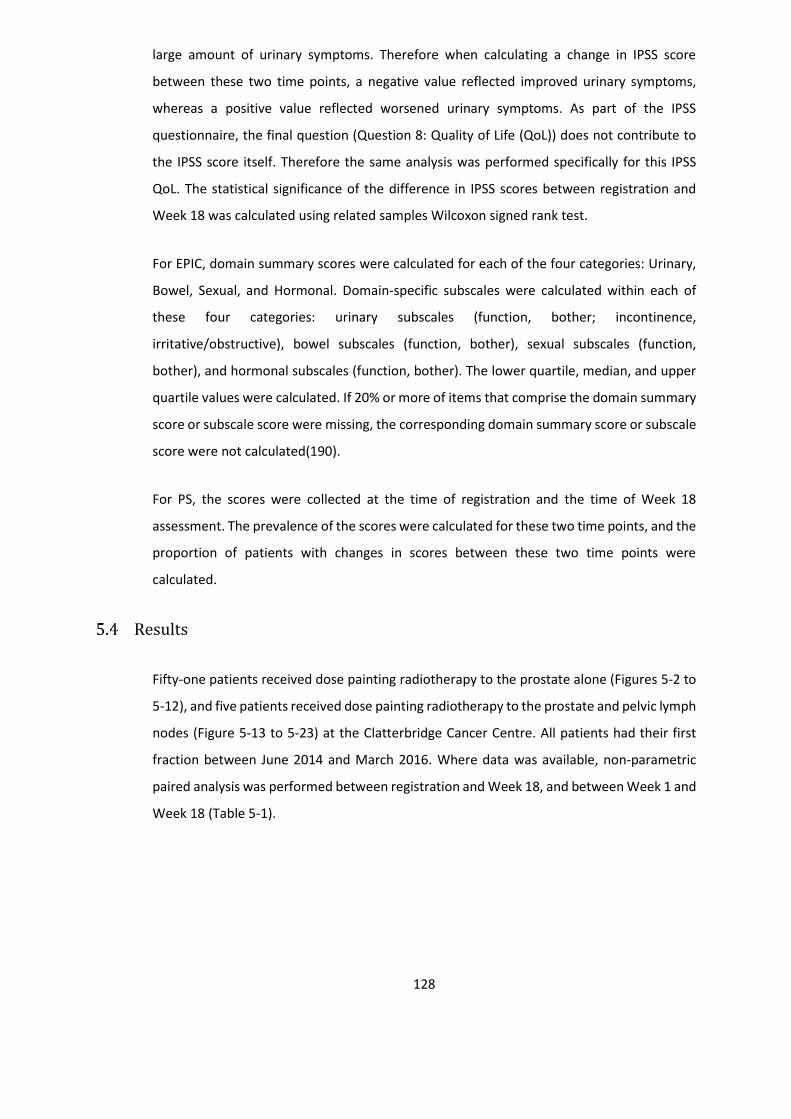
128
large amount of urinary symptoms. Therefore when calculating a change in IPSS score
between these two time points, a negative value reflected improved urinary symptoms,
whereas a positive value reflected worsened urinary symptoms. As part of the IPSS
questionnaire, the final question (Question 8: Quality of Life (QoL)) does not contribute to
the IPSS score itself. Therefore the same analysis was performed specifically for this IPSS
QoL. The statistical significance of the difference in IPSS scores between registration and
Week 18 was calculated using related samples Wilcoxon signed rank test.
For EPIC, domain summary scores were calculated for each of the four categories: Urinary,
Bowel, Sexual, and Hormonal. Domain-specific subscales were calculated within each of
these four categories: urinary subscales (function, bother; incontinence,
irritative/obstructive), bowel subscales (function, bother), sexual subscales (function,
bother), and hormonal subscales (function, bother). The lower quartile, median, and upper
quartile values were calculated. If 20% or more of items that comprise the domain summary
score or subscale score were missing, the corresponding domain summary score or subscale
score were not calculated(190).
For PS, the scores were collected at the time of registration and the time of Week 18
assessment. The prevalence of the scores were calculated for these two time points, and the
proportion of patients with changes in scores between these two time points were
calculated.
Results
Fifty-one patients received dose painting radiotherapy to the prostate alone (Figures 5-2 to
5-12), and five patients received dose painting radiotherapy to the prostate and pelvic lymph
nodes (Figure 5-13 to 5-23) at the Clatterbridge Cancer Centre. All patients had their first
fraction between June 2014 and March 2016. Where data was available, non-parametric
paired analysis was performed between registration and Week 18, and between Week 1 and
Week 18 (Table 5-1).
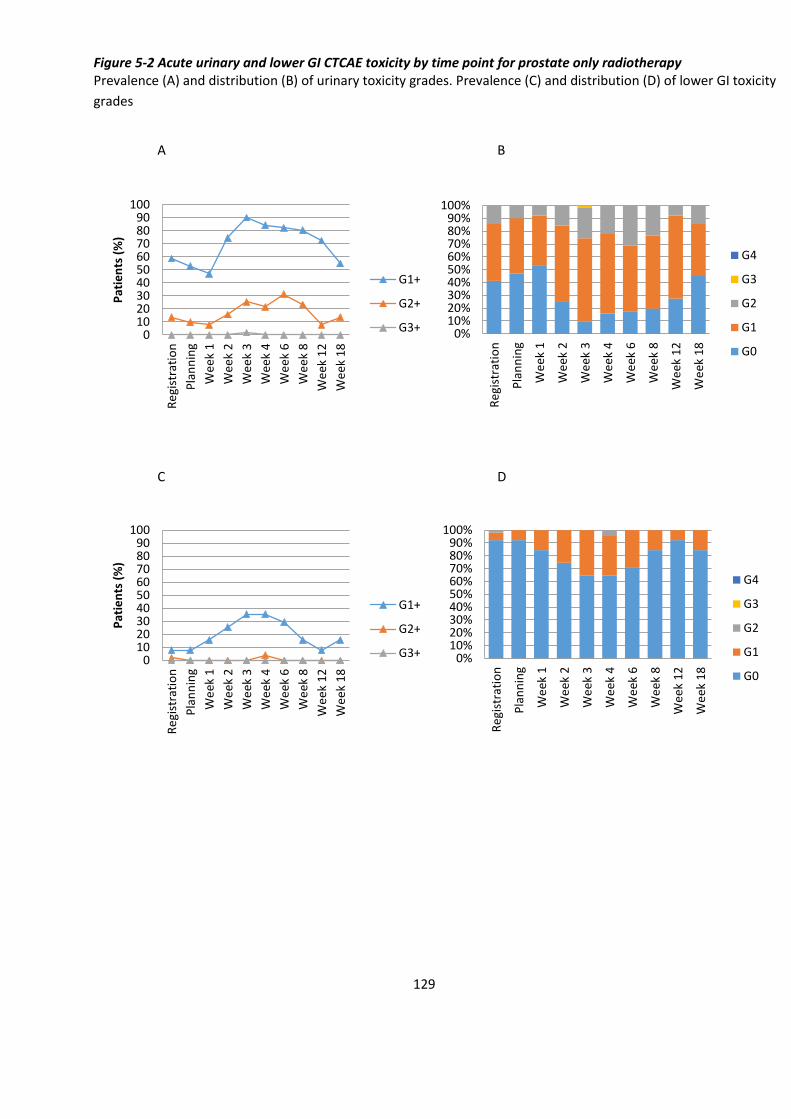
129
Figure 5-2 Acute urinary and lower GI CTCAE toxicity by time point for prostate only radiotherapy Prevalence (A) and distribution (B) of urinary toxicity grades. Prevalence (C) and distribution (D) of lower GI toxicity
grades
A B
C D
0102030405060708090
100
Re
gist
rati
on
Pla
nn
ing
We
ek 1
We
ek 2
We
ek 3
We
ek 4
We
ek 6
We
ek 8
We
ek 1
2
We
ek 1
8
Pat
ien
ts (
%)
G1+
G2+
G3+ 0%10%20%30%40%50%60%70%80%90%
100%
Re
gist
rati
on
Pla
nn
ing
We
ek 1
We
ek 2
We
ek 3
We
ek 4
We
ek 6
We
ek 8
We
ek 1
2
We
ek 1
8
G4
G3
G2
G1
G0
0102030405060708090
100
Re
gist
rati
on
Pla
nn
ing
We
ek 1
We
ek 2
We
ek 3
We
ek 4
We
ek 6
We
ek 8
We
ek 1
2
We
ek 1
8
Pat
ien
ts (
%)
G1+
G2+
G3+ 0%10%20%30%40%50%60%70%80%90%
100%
Re
gist
rati
on
Pla
nn
ing
We
ek 1
We
ek 2
We
ek 3
We
ek 4
We
ek 6
We
ek 8
We
ek 1
2
We
ek 1
8
G4
G3
G2
G1
G0
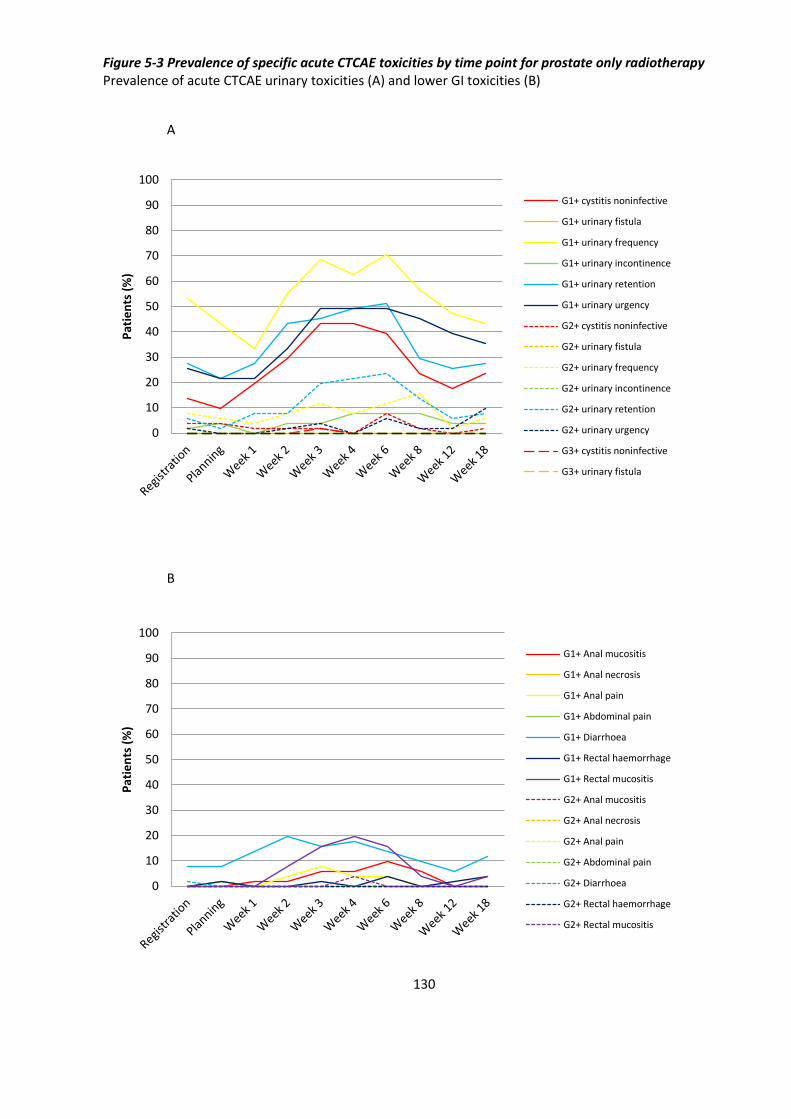
130
Figure 5-3 Prevalence of specific acute CTCAE toxicities by time point for prostate only radiotherapy Prevalence of acute CTCAE urinary toxicities (A) and lower GI toxicities (B)
A
B
0
10
20
30
40
50
60
70
80
90
100
Pat
ien
ts (
%)
G1+ cystitis noninfective
G1+ urinary fistula
G1+ urinary frequency
G1+ urinary incontinence
G1+ urinary retention
G1+ urinary urgency
G2+ cystitis noninfective
G2+ urinary fistula
G2+ urinary frequency
G2+ urinary incontinence
G2+ urinary retention
G2+ urinary urgency
G3+ cystitis noninfective
G3+ urinary fistula
0
10
20
30
40
50
60
70
80
90
100
Pat
ien
ts (
%)
G1+ Anal mucositis
G1+ Anal necrosis
G1+ Anal pain
G1+ Abdominal pain
G1+ Diarrhoea
G1+ Rectal haemorrhage
G1+ Rectal mucositis
G2+ Anal mucositis
G2+ Anal necrosis
G2+ Anal pain
G2+ Abdominal pain
G2+ Diarrhoea
G2+ Rectal haemorrhage
G2+ Rectal mucositis

131
Figure 5-4 Other acute CTCAE toxicities (not urinary or lower GI) by time point for prostate only radiotherapy Prevalence of acute CTCAE toxicities (A), distribution of maximal grades (B), and prevalence of specific CTCAE (C)
A B
C
0102030405060708090
100
Re
gist
rati
on
Pla
nn
ing
We
ek 1
We
ek 2
We
ek 3
We
ek 4
We
ek 6
We
ek 8
We
ek 1
2
We
ek 1
8
Pat
ien
ts (
%)
G1+
G2+
G3+0%
10%20%30%40%50%60%70%80%90%
100%
G4
G3
G2
G1
G0
0
10
20
30
40
50
60
70
80
90
100
Pat
ien
ts (
%)
G1+ Fatigue
G1+ Dyspnoea
G1+ Pleuritic pain
G1+ Skin discomfort
G1+ Lung infection
G1+ Infective cystitis
G1+ Vomiting
G1+ Low mood/depression
G1+ Lethargy
G1+ Erectile dysfunction
G2+ Fatigue
G2+ Dyspnoea
G2+ Pleuritic pain
G2+ Skin discomfort
G2+ Lung infection
G2+ Infective cystitis
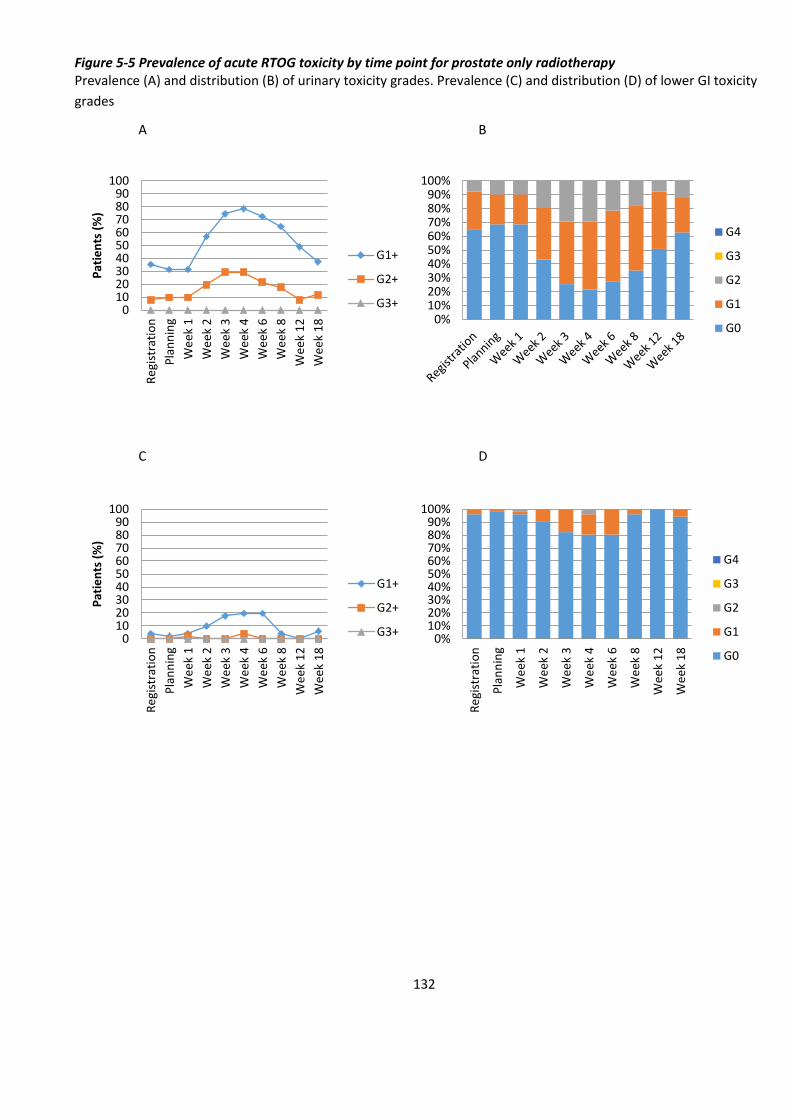
132
0102030405060708090
100
Re
gist
rati
on
Pla
nn
ing
We
ek 1
We
ek 2
We
ek 3
We
ek 4
We
ek 6
We
ek 8
We
ek 1
2
We
ek 1
8
Pat
ien
ts (
%)
G1+
G2+
G3+0%
10%20%30%40%50%60%70%80%90%
100%
G4
G3
G2
G1
G0
0102030405060708090
100
Re
gist
rati
on
Pla
nn
ing
We
ek 1
We
ek 2
We
ek 3
We
ek 4
We
ek 6
We
ek 8
We
ek 1
2
We
ek 1
8
Pat
ien
ts (
%)
G1+
G2+
G3+0%
10%20%30%40%50%60%70%80%90%
100%
Re
gist
rati
on
Pla
nn
ing
We
ek 1
We
ek 2
We
ek 3
We
ek 4
We
ek 6
We
ek 8
We
ek 1
2
We
ek 1
8
G4
G3
G2
G1
G0
Figure 5-5 Prevalence of acute RTOG toxicity by time point for prostate only radiotherapy Prevalence (A) and distribution (B) of urinary toxicity grades. Prevalence (C) and distribution (D) of lower GI toxicity
grades
A B
C D
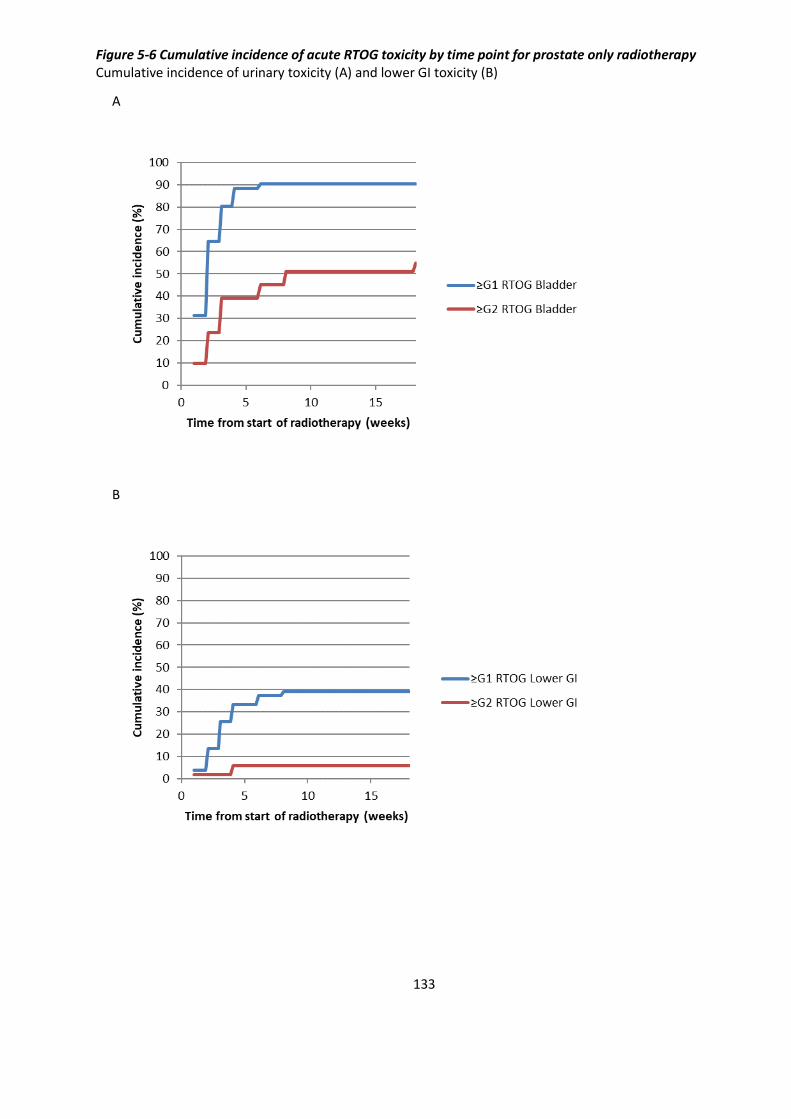
133
Figure 5-6 Cumulative incidence of acute RTOG toxicity by time point for prostate only radiotherapy Cumulative incidence of urinary toxicity (A) and lower GI toxicity (B)
A
B

134
Figure 5-7 Change in IPSS for prostate only radiotherapy between Registration and Week 18 Waterfall plot of change in IPSS score (A) and IPSS Quality of Life score (B)
A
B
-20
-15
-10
-5
0
5
10
15
20
1 3 5 7 9 11 13 15 17 19 21 23 25 27 29 31 33 35 37 39 41 43 45 47 49 51
Imp
rove
d I
PSS
sco
re
W
ors
en
ed
IPSS
sco
re
-4
-3
-2
-1
0
1
2
3
4
1 3 5 7 9 11 13 15 17 19 21 23 25 27 29 31 33 35 37 39 41 43 45 47
Imp
rove
d I
PSS
Qo
L
Wo
rse
ne
d IP
SS Q
oL
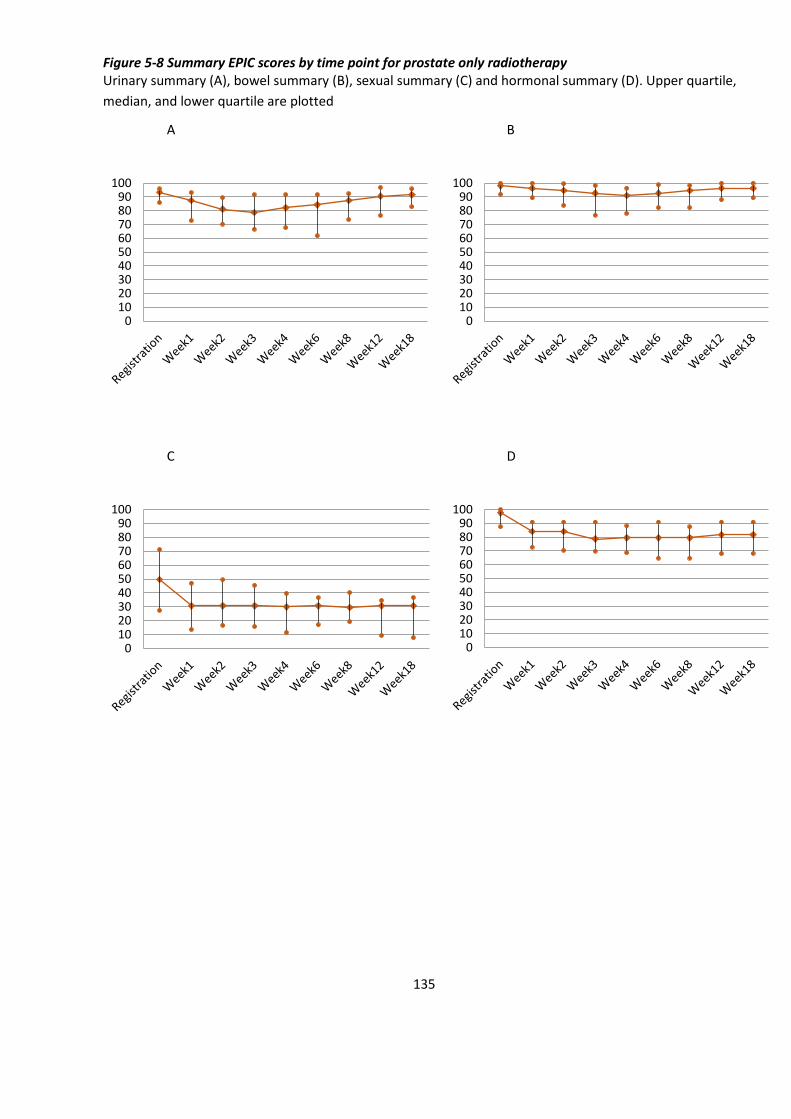
135
Figure 5-8 Summary EPIC scores by time point for prostate only radiotherapy Urinary summary (A), bowel summary (B), sexual summary (C) and hormonal summary (D). Upper quartile,
median, and lower quartile are plotted
A B
C D
0102030405060708090
100
0102030405060708090
100
0102030405060708090
100
0102030405060708090
100
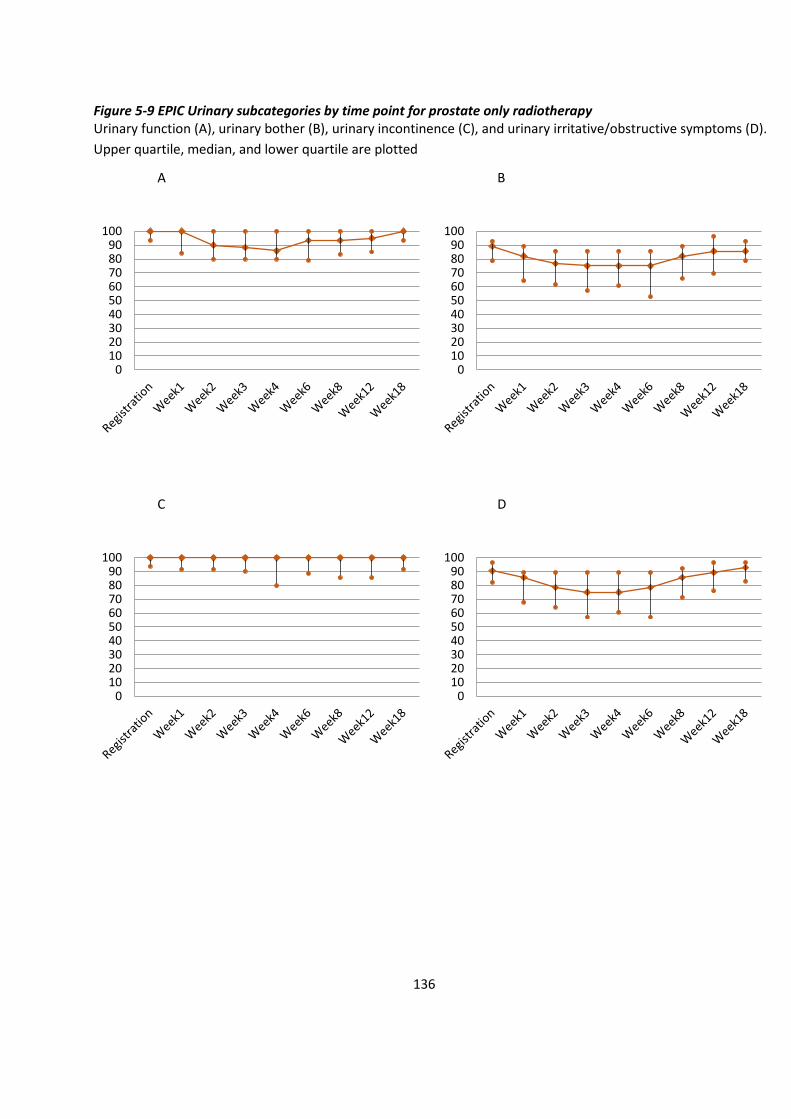
136
Figure 5-9 EPIC Urinary subcategories by time point for prostate only radiotherapy Urinary function (A), urinary bother (B), urinary incontinence (C), and urinary irritative/obstructive symptoms (D).
Upper quartile, median, and lower quartile are plotted
A B
C D
0102030405060708090
100
0102030405060708090
100
0102030405060708090
100
0102030405060708090
100
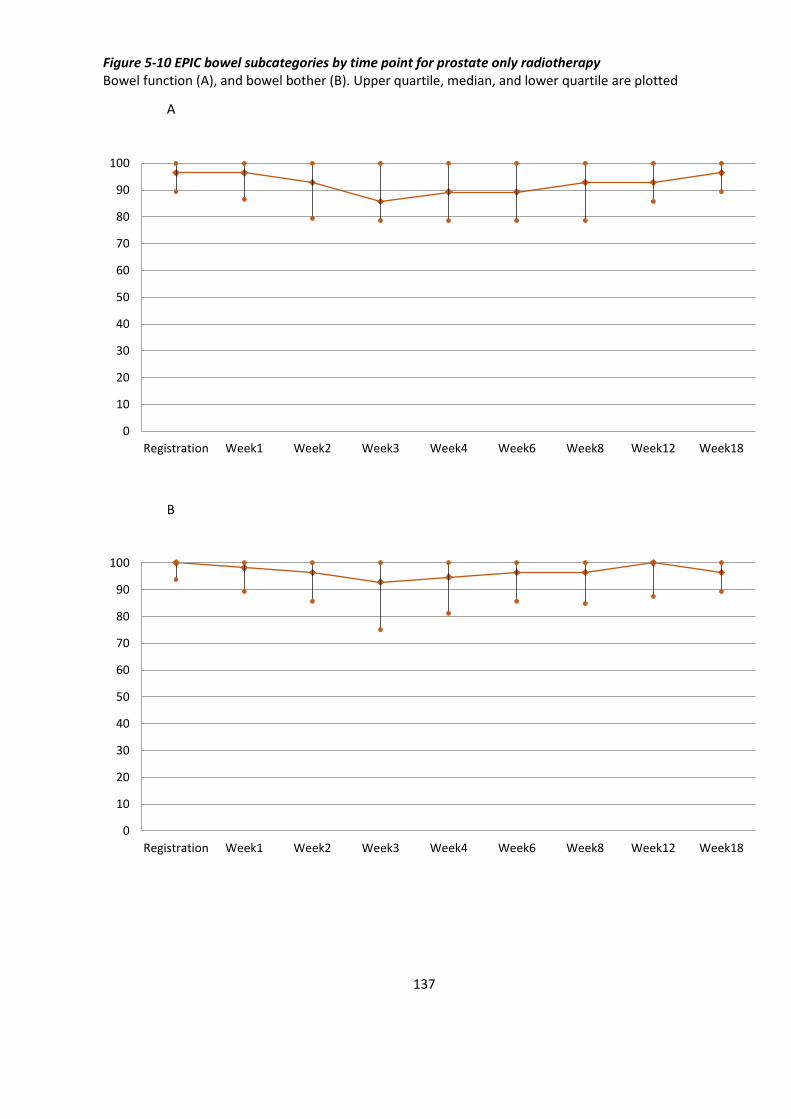
137
Figure 5-10 EPIC bowel subcategories by time point for prostate only radiotherapy Bowel function (A), and bowel bother (B). Upper quartile, median, and lower quartile are plotted
A
B
0
10
20
30
40
50
60
70
80
90
100
Registration Week1 Week2 Week3 Week4 Week6 Week8 Week12 Week18
0
10
20
30
40
50
60
70
80
90
100
Registration Week1 Week2 Week3 Week4 Week6 Week8 Week12 Week18

138
Figure 5-11 EPIC sexual subcategories by time point for prostate only radiotherapy Sexual function (A), and sexual bother (B). Upper quartile, median, and lower quartile are plotted
A
B
0
10
20
30
40
50
60
70
80
90
100
Registration Week1 Week2 Week3 Week4 Week6 Week8 Week12 Week18
0
10
20
30
40
50
60
70
80
90
100
Registration Week1 Week2 Week3 Week4 Week6 Week8 Week12 Week18

139
Figure 5-12 EPIC hormonal subcategories by time point for prostate only radiotherapy Hormonal function (A), and hormonal bother (B). Upper quartile, median, and lower quartile are plotted
A
B
0
10
20
30
40
50
60
70
80
90
100
Registration Week1 Week2 Week3 Week4 Week6 Week8 Week12 Week18
0
10
20
30
40
50
60
70
80
90
100
Registration Week1 Week2 Week3 Week4 Week6 Week8 Week12 Week18
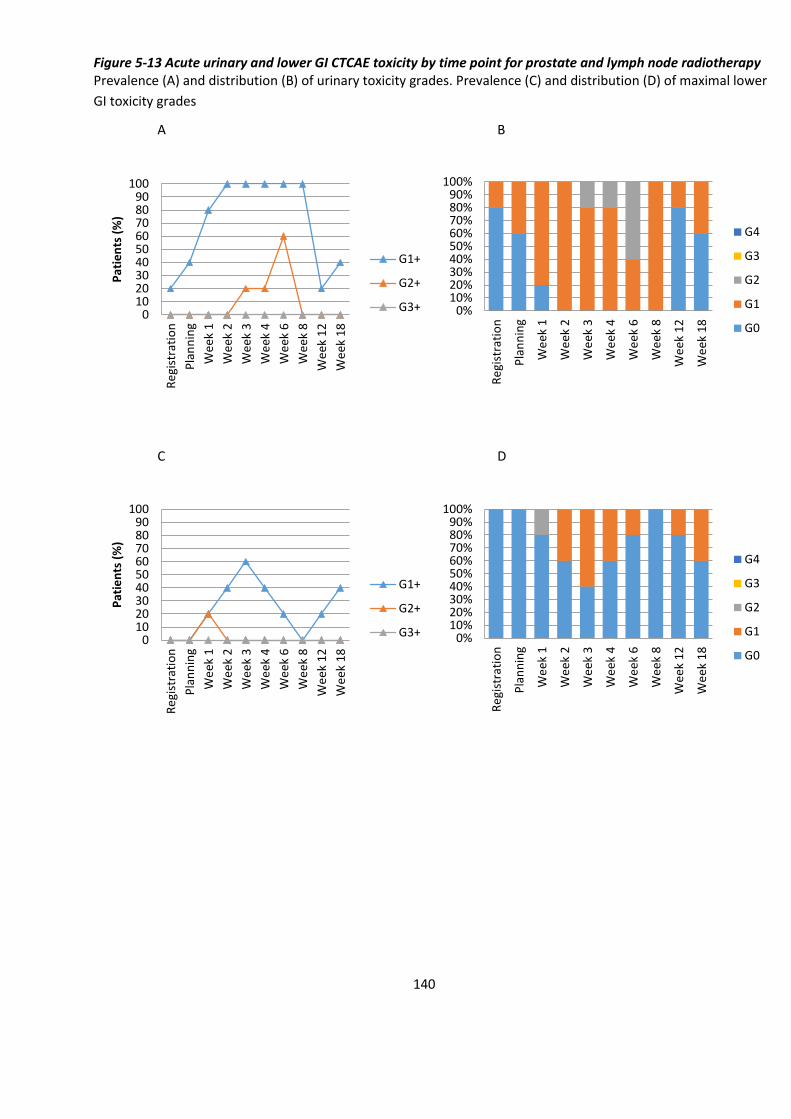
140
Figure 5-13 Acute urinary and lower GI CTCAE toxicity by time point for prostate and lymph node radiotherapy Prevalence (A) and distribution (B) of urinary toxicity grades. Prevalence (C) and distribution (D) of maximal lower
GI toxicity grades
A B
C D
0102030405060708090
100R
egi
stra
tio
n
Pla
nn
ing
We
ek 1
We
ek 2
We
ek 3
We
ek 4
We
ek 6
We
ek 8
We
ek 1
2
We
ek 1
8
Pat
ien
ts (
%)
G1+
G2+
G3+ 0%10%20%30%40%50%60%70%80%90%
100%
Re
gist
rati
on
Pla
nn
ing
We
ek 1
We
ek 2
We
ek 3
We
ek 4
We
ek 6
We
ek 8
We
ek 1
2
We
ek 1
8
G4
G3
G2
G1
G0
0102030405060708090
100
Re
gist
rati
on
Pla
nn
ing
We
ek 1
We
ek 2
We
ek 3
We
ek 4
We
ek 6
We
ek 8
We
ek 1
2
We
ek 1
8
Pat
ien
ts (
%)
G1+
G2+
G3+ 0%10%20%30%40%50%60%70%80%90%
100%R
egi
stra
tio
n
Pla
nn
ing
We
ek 1
We
ek 2
We
ek 3
We
ek 4
We
ek 6
We
ek 8
We
ek 1
2
We
ek 1
8
G4
G3
G2
G1
G0
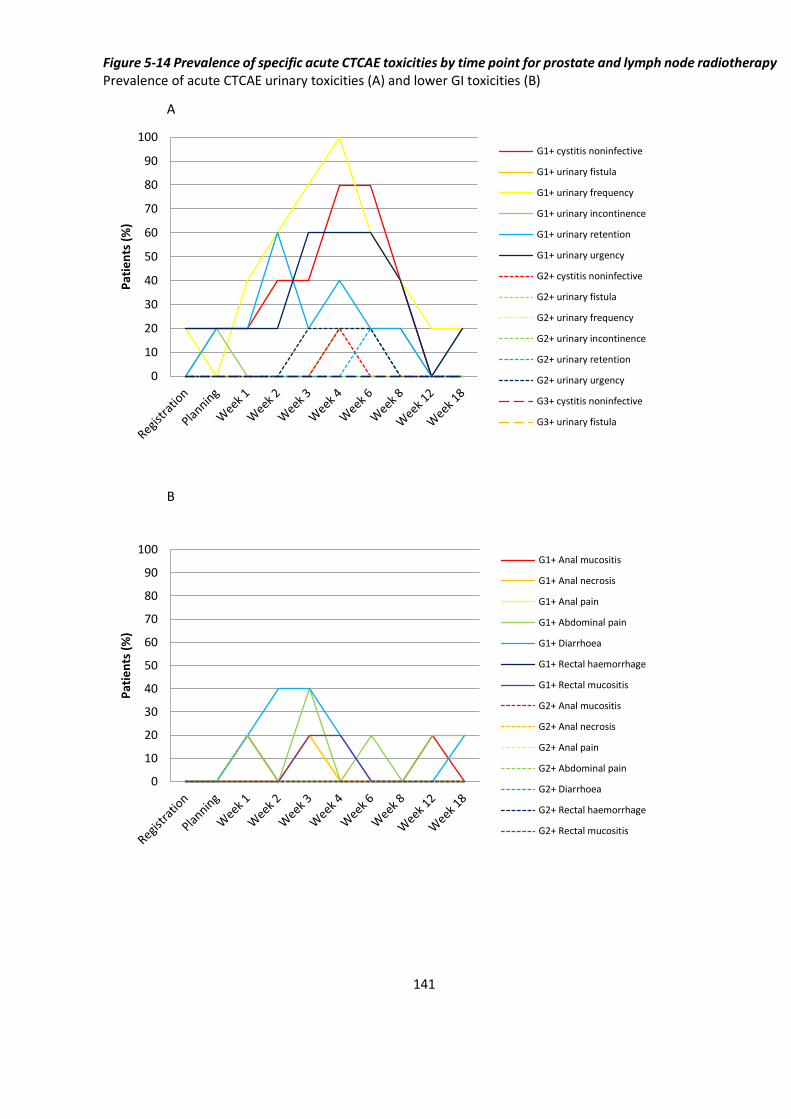
141
Figure 5-14 Prevalence of specific acute CTCAE toxicities by time point for prostate and lymph node radiotherapy Prevalence of acute CTCAE urinary toxicities (A) and lower GI toxicities (B)
A
B
0
10
20
30
40
50
60
70
80
90
100P
atie
nts
(%
)
G1+ cystitis noninfective
G1+ urinary fistula
G1+ urinary frequency
G1+ urinary incontinence
G1+ urinary retention
G1+ urinary urgency
G2+ cystitis noninfective
G2+ urinary fistula
G2+ urinary frequency
G2+ urinary incontinence
G2+ urinary retention
G2+ urinary urgency
G3+ cystitis noninfective
G3+ urinary fistula
0
10
20
30
40
50
60
70
80
90
100
Pat
ien
ts (
%)
G1+ Anal mucositis
G1+ Anal necrosis
G1+ Anal pain
G1+ Abdominal pain
G1+ Diarrhoea
G1+ Rectal haemorrhage
G1+ Rectal mucositis
G2+ Anal mucositis
G2+ Anal necrosis
G2+ Anal pain
G2+ Abdominal pain
G2+ Diarrhoea
G2+ Rectal haemorrhage
G2+ Rectal mucositis
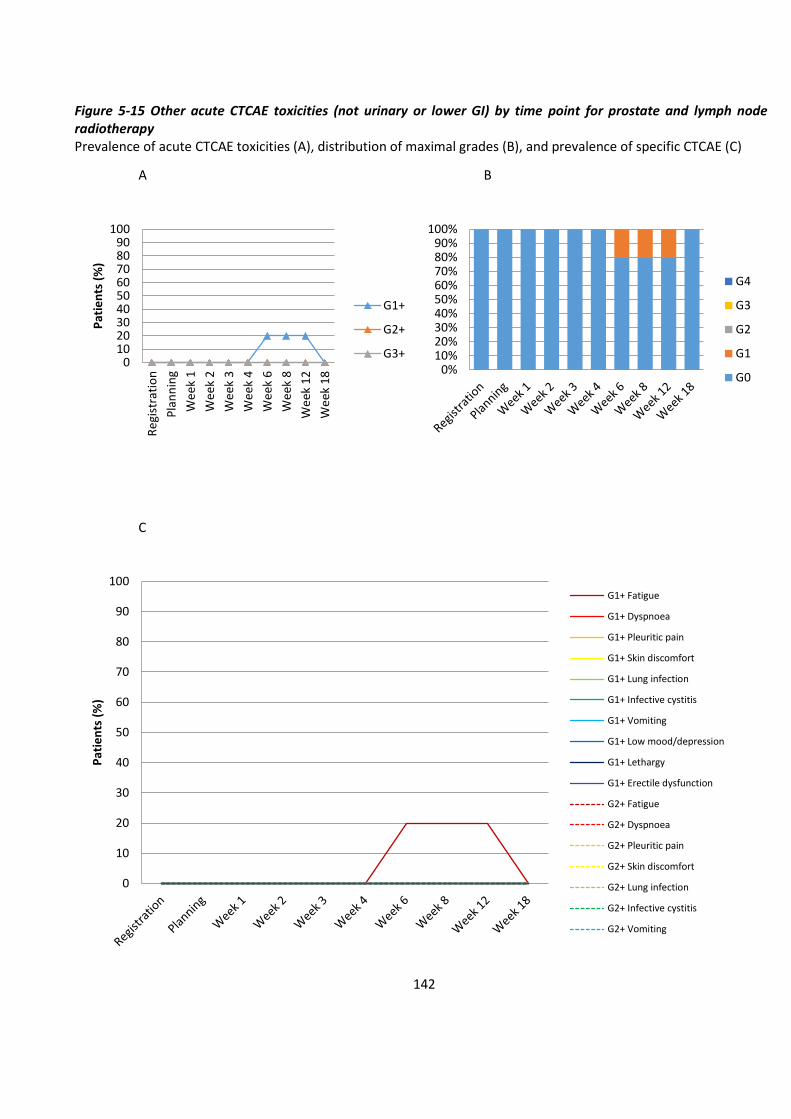
142
Figure 5-15 Other acute CTCAE toxicities (not urinary or lower GI) by time point for prostate and lymph node radiotherapy Prevalence of acute CTCAE toxicities (A), distribution of maximal grades (B), and prevalence of specific CTCAE (C)
A B
C
0102030405060708090
100
Re
gist
rati
on
Pla
nn
ing
We
ek 1
We
ek 2
We
ek 3
We
ek 4
We
ek 6
We
ek 8
We
ek 1
2
We
ek 1
8
Pat
ien
ts (
%)
G1+
G2+
G3+0%
10%20%30%40%50%60%70%80%90%
100%
G4
G3
G2
G1
G0
0
10
20
30
40
50
60
70
80
90
100
Pat
ien
ts (
%)
G1+ Fatigue
G1+ Dyspnoea
G1+ Pleuritic pain
G1+ Skin discomfort
G1+ Lung infection
G1+ Infective cystitis
G1+ Vomiting
G1+ Low mood/depression
G1+ Lethargy
G1+ Erectile dysfunction
G2+ Fatigue
G2+ Dyspnoea
G2+ Pleuritic pain
G2+ Skin discomfort
G2+ Lung infection
G2+ Infective cystitis
G2+ Vomiting

143
Figure 5-16 Acute RTOG toxicity by time point for prostate and lymph node radiotherapy Prevalence (A) and distribution (B) of urinary toxicity grades. Prevalence (C) and distribution (D) of lower GI toxicity
grades
A B
C D
0102030405060708090
100R
egi
stra
tio
n
Pla
nn
ing
We
ek 1
We
ek 2
We
ek 3
We
ek 4
We
ek 6
We
ek 8
We
ek 1
2
We
ek 1
8
Pat
ien
ts (
%)
G1+
G2+
G3+0%
10%20%30%40%50%60%70%80%90%
100%
G4
G3
G2
G1
G0
0102030405060708090
100
Re
gist
rati
on
Pla
nn
ing
We
ek 1
We
ek 2
We
ek 3
We
ek 4
We
ek 6
We
ek 8
We
ek 1
2
We
ek 1
8
Pat
ien
ts (
%)
G1+
G2+
G3+0%
10%20%30%40%50%60%70%80%90%
100%
G4
G3
G2
G1
G0

144
Figure 5-17 Cumulative incidence of acute RTOG toxicity by time point for prostate and lymph node radiotherapy Cumulative incidence of urinary toxicity (A) and lower GI toxicity (B)
A
B
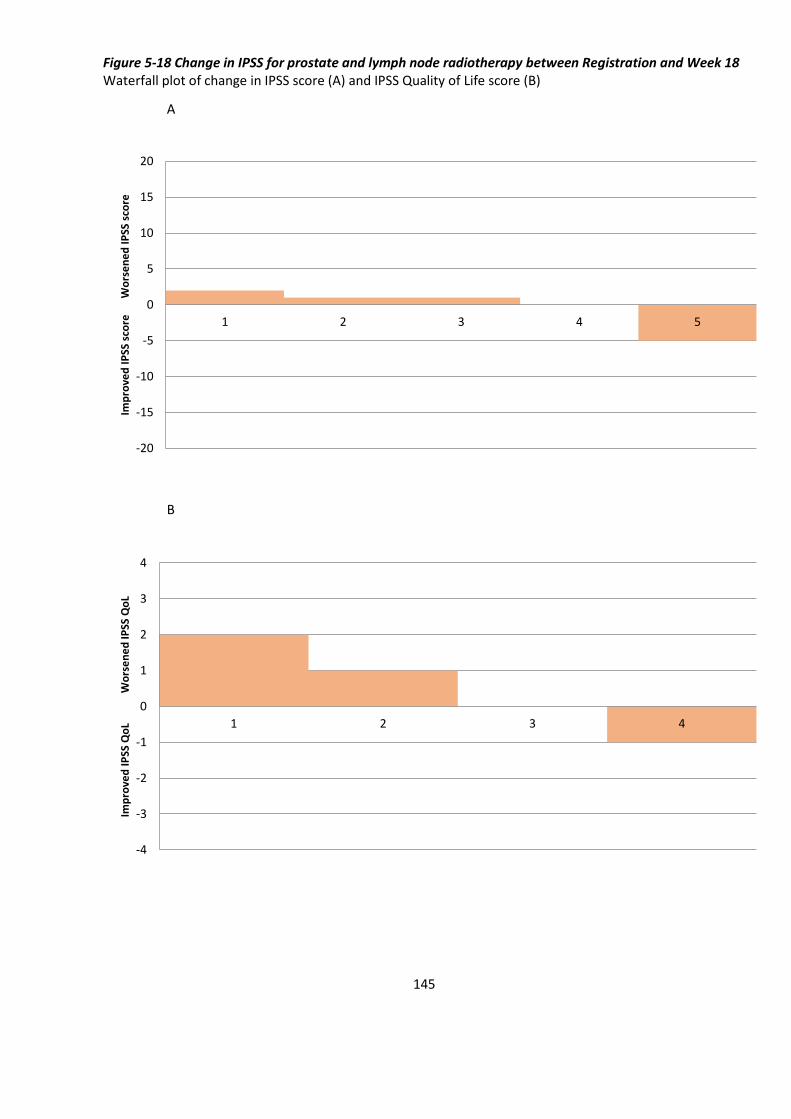
145
Figure 5-18 Change in IPSS for prostate and lymph node radiotherapy between Registration and Week 18 Waterfall plot of change in IPSS score (A) and IPSS Quality of Life score (B)
A
B
-20
-15
-10
-5
0
5
10
15
20
1 2 3 4 5
Imp
rove
d I
PSS
sco
re
W
ors
en
ed
IPSS
sco
re
-4
-3
-2
-1
0
1
2
3
4
1 2 3 4
Imp
rove
d I
PSS
Qo
L
Wo
rse
ne
d IP
SS Q
oL
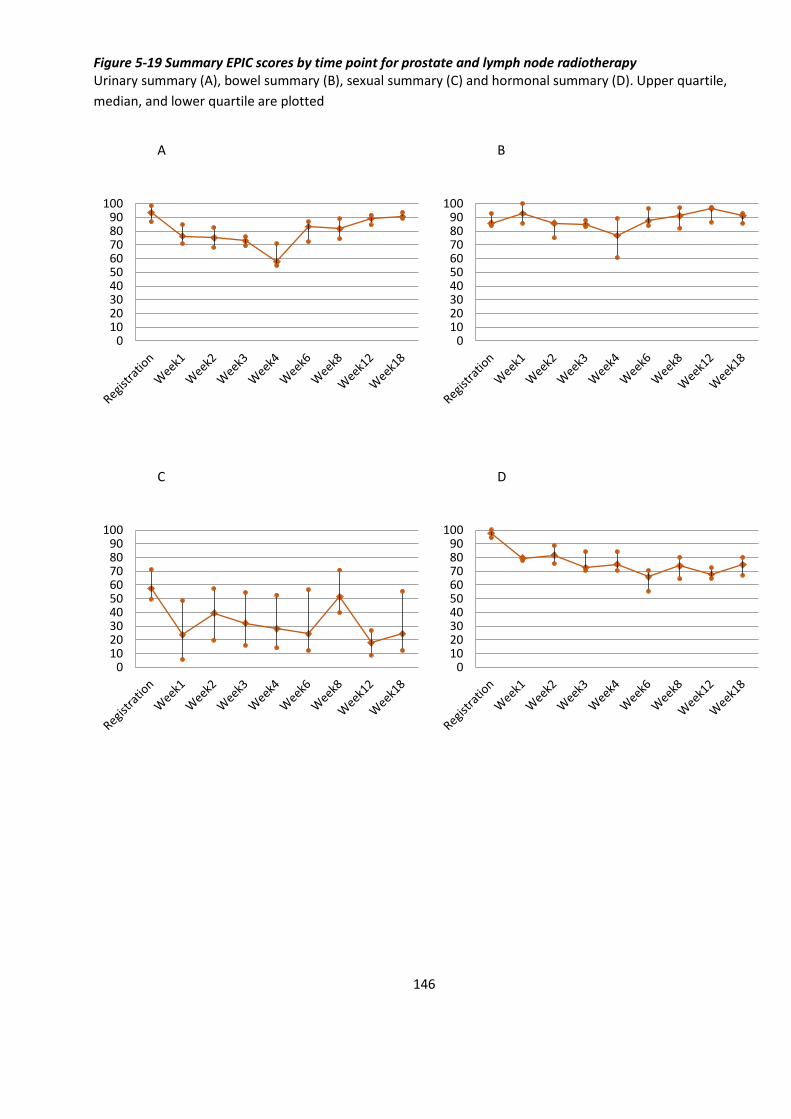
146
Figure 5-19 Summary EPIC scores by time point for prostate and lymph node radiotherapy Urinary summary (A), bowel summary (B), sexual summary (C) and hormonal summary (D). Upper quartile,
median, and lower quartile are plotted
A B
C D
0102030405060708090
100
0102030405060708090
100
0102030405060708090
100
0102030405060708090
100

147
Figure 5-20 EPIC Urinary subcategories by time point for prostate and lymph node radiotherapy Urinary function (A), urinary bother (B), urinary incontinence (C), and urinary irritative/obstructive symptoms (D).
Upper quartile, median, and lower quartile are plotted
A B
C D
0102030405060708090
100
0102030405060708090
100
0102030405060708090
100
0102030405060708090
100
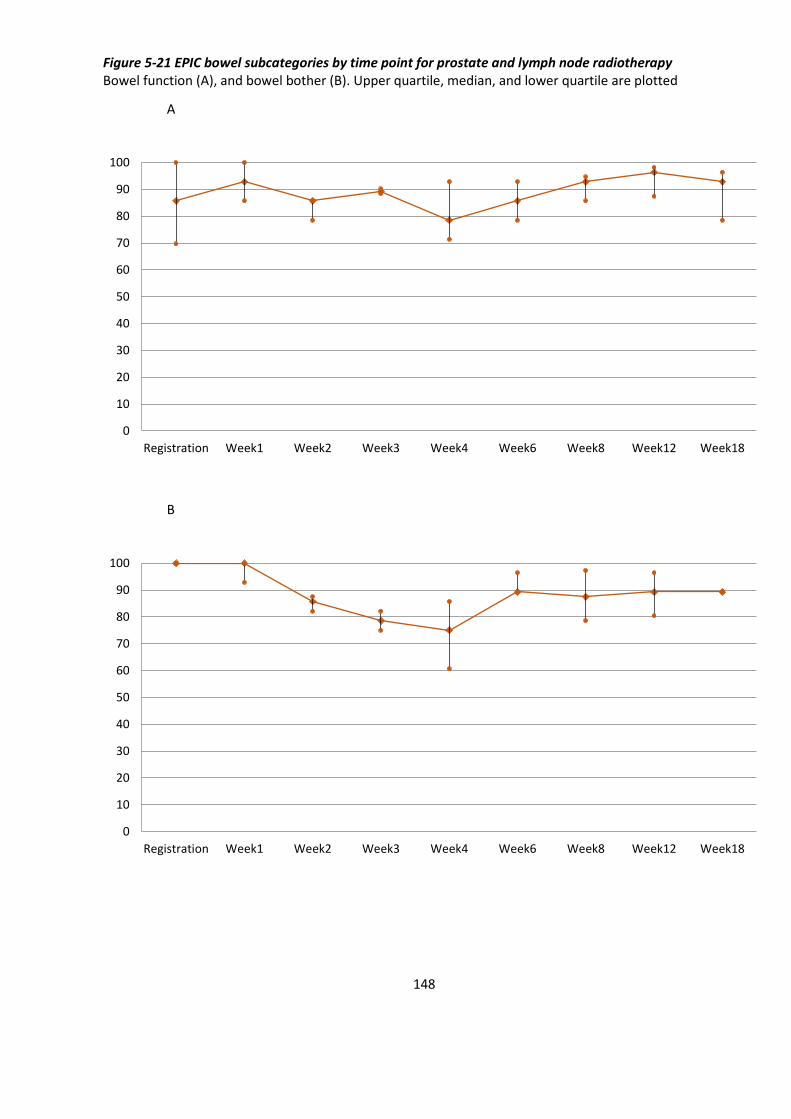
148
Figure 5-21 EPIC bowel subcategories by time point for prostate and lymph node radiotherapy Bowel function (A), and bowel bother (B). Upper quartile, median, and lower quartile are plotted
A
B
0
10
20
30
40
50
60
70
80
90
100
Registration Week1 Week2 Week3 Week4 Week6 Week8 Week12 Week18
0
10
20
30
40
50
60
70
80
90
100
Registration Week1 Week2 Week3 Week4 Week6 Week8 Week12 Week18
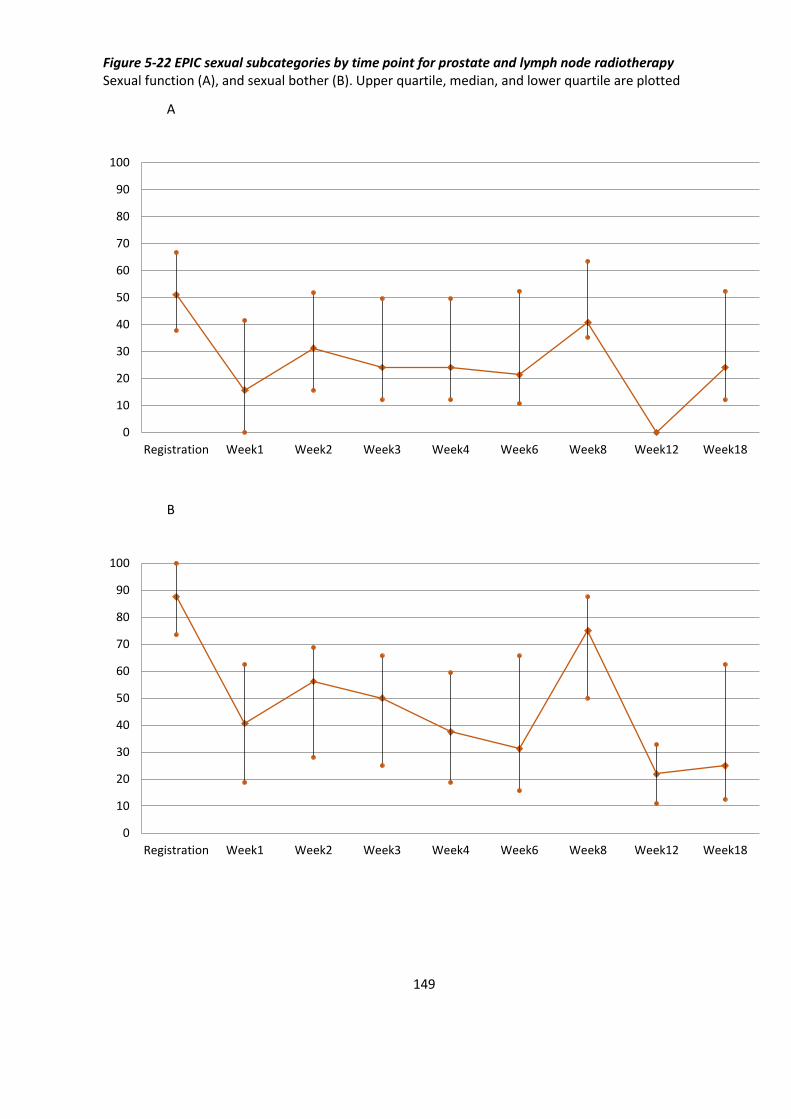
149
Figure 5-22 EPIC sexual subcategories by time point for prostate and lymph node radiotherapy Sexual function (A), and sexual bother (B). Upper quartile, median, and lower quartile are plotted
A
B
0
10
20
30
40
50
60
70
80
90
100
Registration Week1 Week2 Week3 Week4 Week6 Week8 Week12 Week18
0
10
20
30
40
50
60
70
80
90
100
Registration Week1 Week2 Week3 Week4 Week6 Week8 Week12 Week18
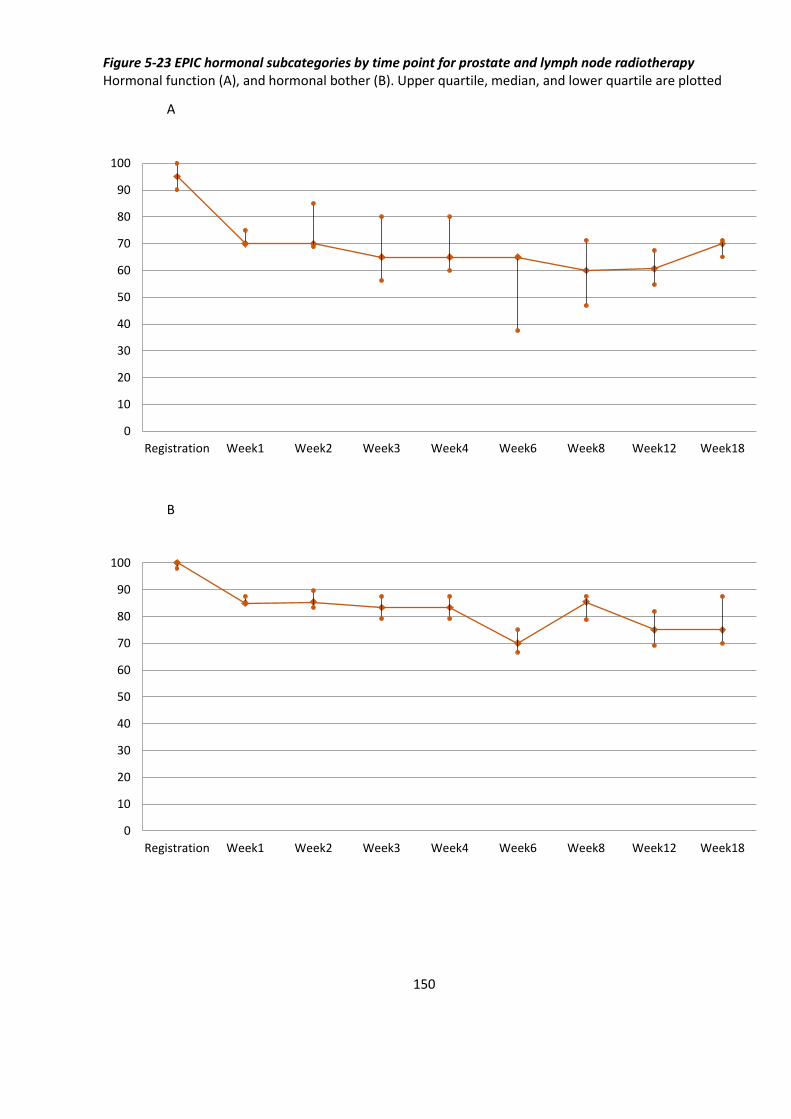
150
Figure 5-23 EPIC hormonal subcategories by time point for prostate and lymph node radiotherapy Hormonal function (A), and hormonal bother (B). Upper quartile, median, and lower quartile are plotted
A
B
0
10
20
30
40
50
60
70
80
90
100
Registration Week1 Week2 Week3 Week4 Week6 Week8 Week12 Week18
0
10
20
30
40
50
60
70
80
90
100
Registration Week1 Week2 Week3 Week4 Week6 Week8 Week12 Week18
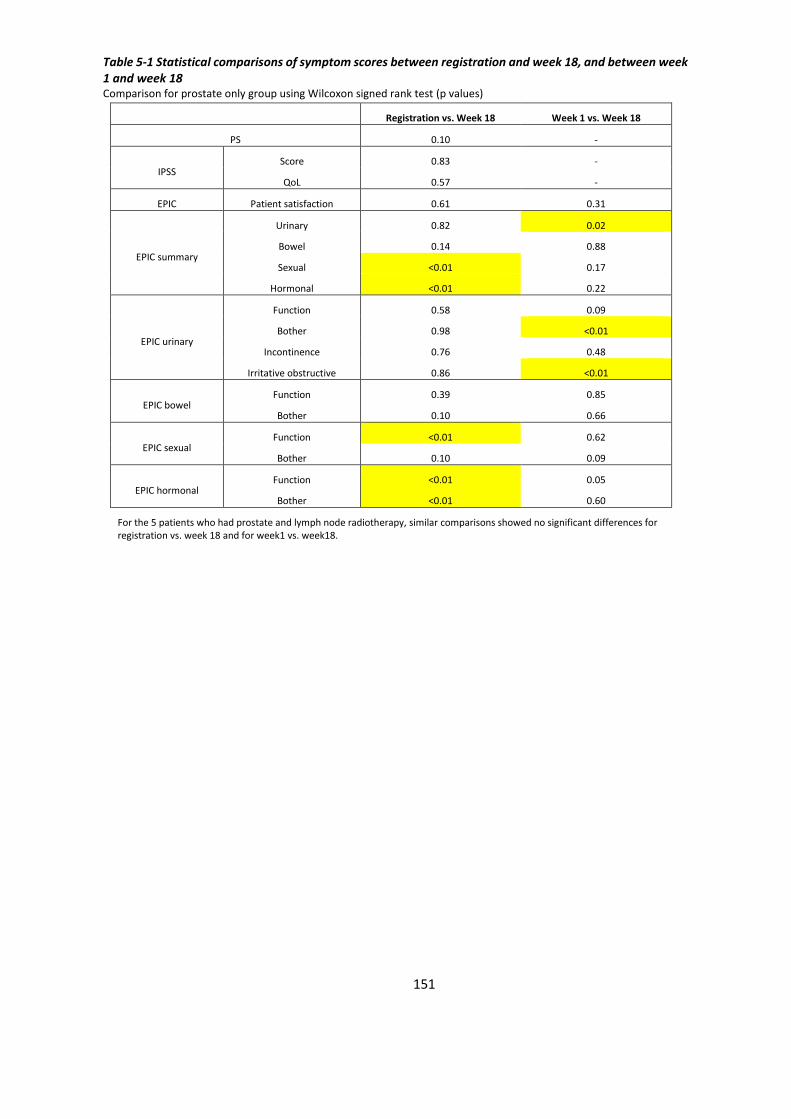
151
Table 5-1 Statistical comparisons of symptom scores between registration and week 18, and between week 1 and week 18 Comparison for prostate only group using Wilcoxon signed rank test (p values)
Registration vs. Week 18 Week 1 vs. Week 18
PS 0.10 -
IPSS Score 0.83 -
QoL 0.57 -
EPIC Patient satisfaction 0.61 0.31
EPIC summary
Urinary 0.82 0.02
Bowel 0.14 0.88
Sexual <0.01 0.17
Hormonal <0.01 0.22
EPIC urinary
Function 0.58 0.09
Bother 0.98 <0.01
Incontinence 0.76 0.48
Irritative obstructive 0.86 <0.01
EPIC bowel Function 0.39 0.85
Bother 0.10 0.66
EPIC sexual Function <0.01 0.62
Bother 0.10 0.09
EPIC hormonal Function <0.01 0.05
Bother <0.01 0.60
For the 5 patients who had prostate and lymph node radiotherapy, similar comparisons showed no significant differences for registration vs. week 18 and for week1 vs. week18.
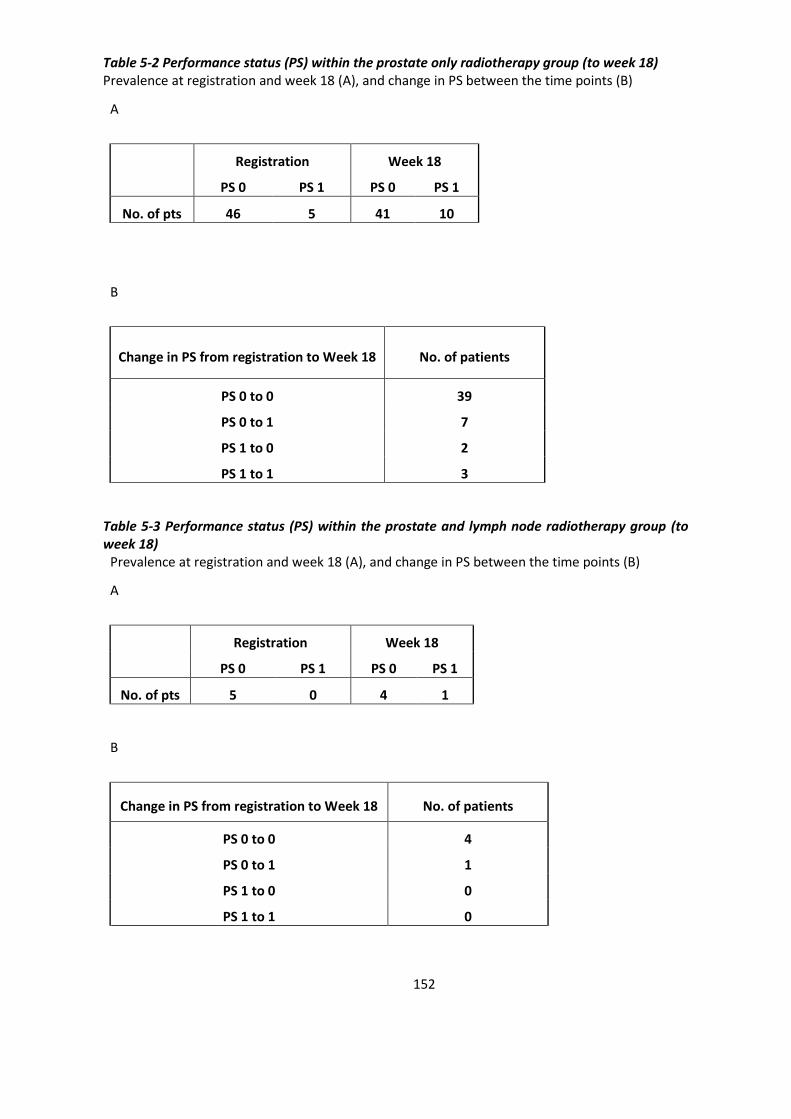
152
Table 5-2 Performance status (PS) within the prostate only radiotherapy group (to week 18) Prevalence at registration and week 18 (A), and change in PS between the time points (B)
A
Registration Week 18
PS 0 PS 1 PS 0 PS 1
No. of pts 46 5 41 10
B
Change in PS from registration to Week 18 No. of patients
PS 0 to 0 39
PS 0 to 1 7
PS 1 to 0 2
PS 1 to 1 3
Table 5-3 Performance status (PS) within the prostate and lymph node radiotherapy group (to week 18)
Prevalence at registration and week 18 (A), and change in PS between the time points (B)
A
Registration Week 18
PS 0 PS 1 PS 0 PS 1
No. of pts 5 0 4 1
B
Change in PS from registration to Week 18 No. of patients
PS 0 to 0 4
PS 0 to 1 1
PS 1 to 0 0
PS 1 to 1 0
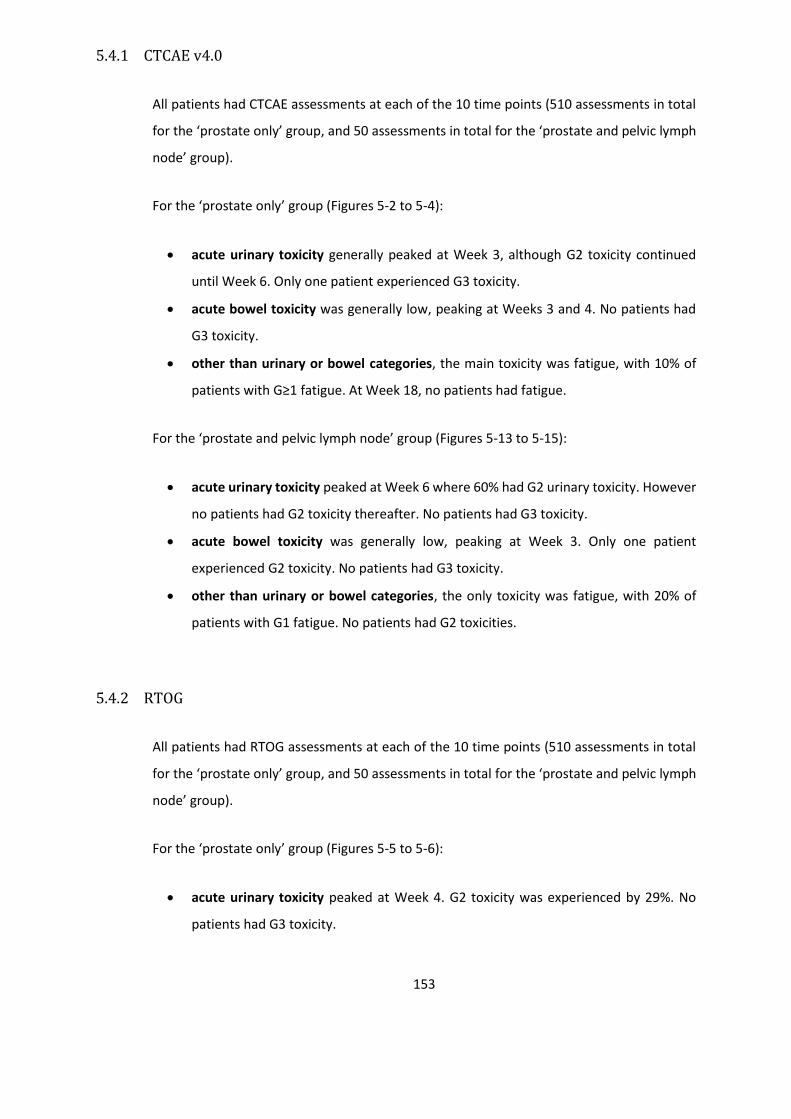
153
5.4.1 CTCAE v4.0
All patients had CTCAE assessments at each of the 10 time points (510 assessments in total
for the ‘prostate only’ group, and 50 assessments in total for the ‘prostate and pelvic lymph
node’ group).
For the ‘prostate only’ group (Figures 5-2 to 5-4):
• acute urinary toxicity generally peaked at Week 3, although G2 toxicity continued
until Week 6. Only one patient experienced G3 toxicity.
• acute bowel toxicity was generally low, peaking at Weeks 3 and 4. No patients had
G3 toxicity.
• other than urinary or bowel categories, the main toxicity was fatigue, with 10% of
patients with G≥1 fatigue. At Week 18, no patients had fatigue.
For the ‘prostate and pelvic lymph node’ group (Figures 5-13 to 5-15):
• acute urinary toxicity peaked at Week 6 where 60% had G2 urinary toxicity. However
no patients had G2 toxicity thereafter. No patients had G3 toxicity.
• acute bowel toxicity was generally low, peaking at Week 3. Only one patient
experienced G2 toxicity. No patients had G3 toxicity.
• other than urinary or bowel categories, the only toxicity was fatigue, with 20% of
patients with G1 fatigue. No patients had G2 toxicities.
5.4.2 RTOG
All patients had RTOG assessments at each of the 10 time points (510 assessments in total
for the ‘prostate only’ group, and 50 assessments in total for the ‘prostate and pelvic lymph
node’ group).
For the ‘prostate only’ group (Figures 5-5 to 5-6):
• acute urinary toxicity peaked at Week 4. G2 toxicity was experienced by 29%. No
patients had G3 toxicity.
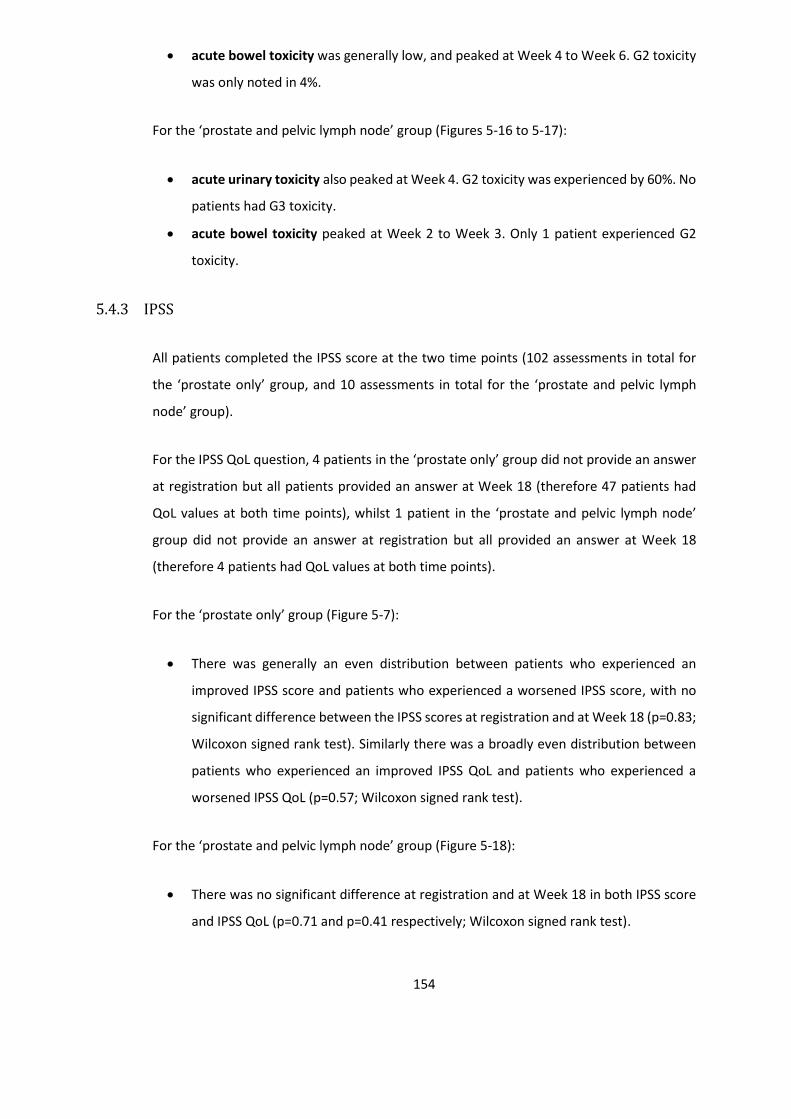
154
• acute bowel toxicity was generally low, and peaked at Week 4 to Week 6. G2 toxicity
was only noted in 4%.
For the ‘prostate and pelvic lymph node’ group (Figures 5-16 to 5-17):
• acute urinary toxicity also peaked at Week 4. G2 toxicity was experienced by 60%. No
patients had G3 toxicity.
• acute bowel toxicity peaked at Week 2 to Week 3. Only 1 patient experienced G2
toxicity.
5.4.3 IPSS
All patients completed the IPSS score at the two time points (102 assessments in total for
the ‘prostate only’ group, and 10 assessments in total for the ‘prostate and pelvic lymph
node’ group).
For the IPSS QoL question, 4 patients in the ‘prostate only’ group did not provide an answer
at registration but all patients provided an answer at Week 18 (therefore 47 patients had
QoL values at both time points), whilst 1 patient in the ‘prostate and pelvic lymph node’
group did not provide an answer at registration but all provided an answer at Week 18
(therefore 4 patients had QoL values at both time points).
For the ‘prostate only’ group (Figure 5-7):
• There was generally an even distribution between patients who experienced an
improved IPSS score and patients who experienced a worsened IPSS score, with no
significant difference between the IPSS scores at registration and at Week 18 (p=0.83;
Wilcoxon signed rank test). Similarly there was a broadly even distribution between
patients who experienced an improved IPSS QoL and patients who experienced a
worsened IPSS QoL (p=0.57; Wilcoxon signed rank test).
For the ‘prostate and pelvic lymph node’ group (Figure 5-18):
• There was no significant difference at registration and at Week 18 in both IPSS score
and IPSS QoL (p=0.71 and p=0.41 respectively; Wilcoxon signed rank test).
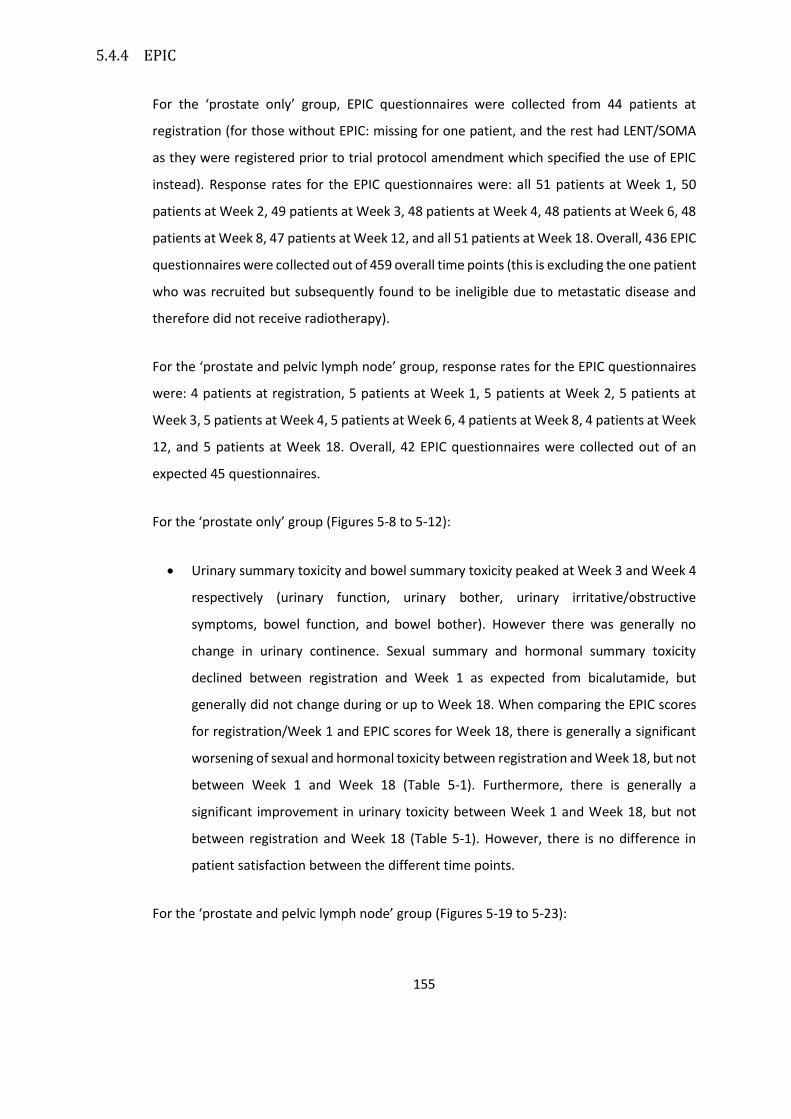
155
5.4.4 EPIC
For the ‘prostate only’ group, EPIC questionnaires were collected from 44 patients at
registration (for those without EPIC: missing for one patient, and the rest had LENT/SOMA
as they were registered prior to trial protocol amendment which specified the use of EPIC
instead). Response rates for the EPIC questionnaires were: all 51 patients at Week 1, 50
patients at Week 2, 49 patients at Week 3, 48 patients at Week 4, 48 patients at Week 6, 48
patients at Week 8, 47 patients at Week 12, and all 51 patients at Week 18. Overall, 436 EPIC
questionnaires were collected out of 459 overall time points (this is excluding the one patient
who was recruited but subsequently found to be ineligible due to metastatic disease and
therefore did not receive radiotherapy).
For the ‘prostate and pelvic lymph node’ group, response rates for the EPIC questionnaires
were: 4 patients at registration, 5 patients at Week 1, 5 patients at Week 2, 5 patients at
Week 3, 5 patients at Week 4, 5 patients at Week 6, 4 patients at Week 8, 4 patients at Week
12, and 5 patients at Week 18. Overall, 42 EPIC questionnaires were collected out of an
expected 45 questionnaires.
For the ‘prostate only’ group (Figures 5-8 to 5-12):
• Urinary summary toxicity and bowel summary toxicity peaked at Week 3 and Week 4
respectively (urinary function, urinary bother, urinary irritative/obstructive
symptoms, bowel function, and bowel bother). However there was generally no
change in urinary continence. Sexual summary and hormonal summary toxicity
declined between registration and Week 1 as expected from bicalutamide, but
generally did not change during or up to Week 18. When comparing the EPIC scores
for registration/Week 1 and EPIC scores for Week 18, there is generally a significant
worsening of sexual and hormonal toxicity between registration and Week 18, but not
between Week 1 and Week 18 (Table 5-1). Furthermore, there is generally a
significant improvement in urinary toxicity between Week 1 and Week 18, but not
between registration and Week 18 (Table 5-1). However, there is no difference in
patient satisfaction between the different time points.
For the ‘prostate and pelvic lymph node’ group (Figures 5-19 to 5-23):
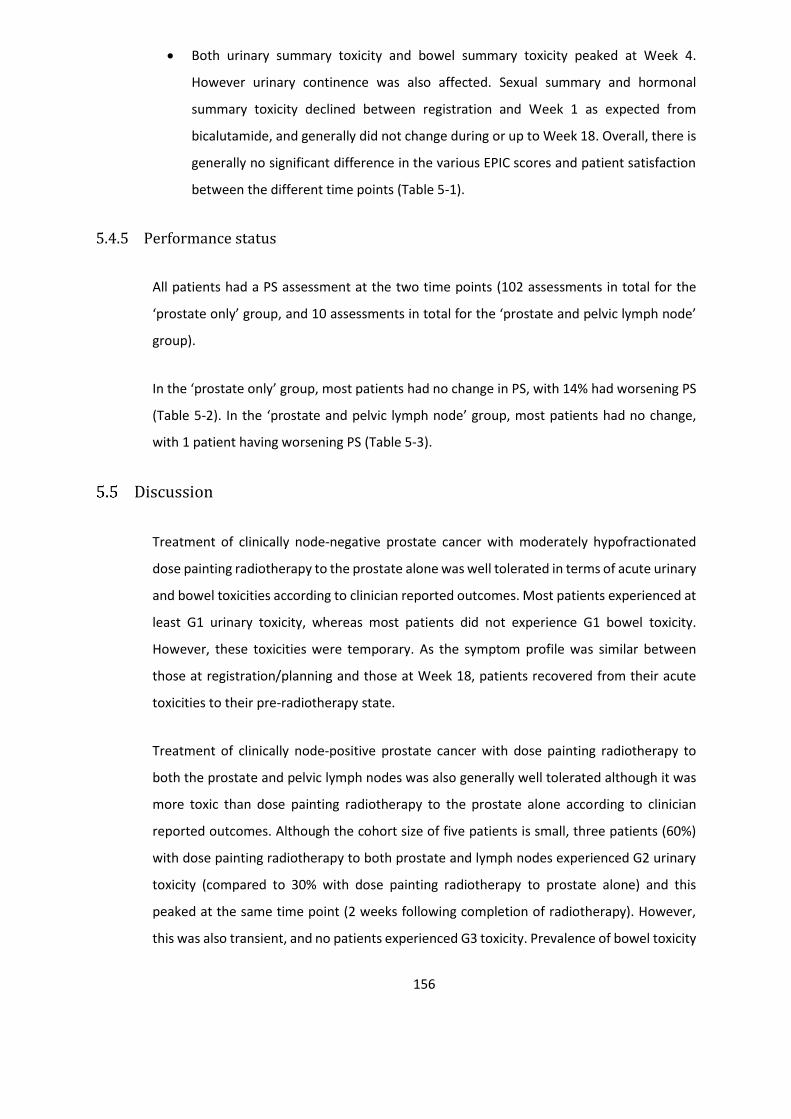
156
• Both urinary summary toxicity and bowel summary toxicity peaked at Week 4.
However urinary continence was also affected. Sexual summary and hormonal
summary toxicity declined between registration and Week 1 as expected from
bicalutamide, and generally did not change during or up to Week 18. Overall, there is
generally no significant difference in the various EPIC scores and patient satisfaction
between the different time points (Table 5-1).
5.4.5 Performance status
All patients had a PS assessment at the two time points (102 assessments in total for the
‘prostate only’ group, and 10 assessments in total for the ‘prostate and pelvic lymph node’
group).
In the ‘prostate only’ group, most patients had no change in PS, with 14% had worsening PS
(Table 5-2). In the ‘prostate and pelvic lymph node’ group, most patients had no change,
with 1 patient having worsening PS (Table 5-3).
Discussion
Treatment of clinically node-negative prostate cancer with moderately hypofractionated
dose painting radiotherapy to the prostate alone was well tolerated in terms of acute urinary
and bowel toxicities according to clinician reported outcomes. Most patients experienced at
least G1 urinary toxicity, whereas most patients did not experience G1 bowel toxicity.
However, these toxicities were temporary. As the symptom profile was similar between
those at registration/planning and those at Week 18, patients recovered from their acute
toxicities to their pre-radiotherapy state.
Treatment of clinically node-positive prostate cancer with dose painting radiotherapy to
both the prostate and pelvic lymph nodes was also generally well tolerated although it was
more toxic than dose painting radiotherapy to the prostate alone according to clinician
reported outcomes. Although the cohort size of five patients is small, three patients (60%)
with dose painting radiotherapy to both prostate and lymph nodes experienced G2 urinary
toxicity (compared to 30% with dose painting radiotherapy to prostate alone) and this
peaked at the same time point (2 weeks following completion of radiotherapy). However,
this was also transient, and no patients experienced G3 toxicity. Prevalence of bowel toxicity

157
was higher for dose painting radiotherapy to both prostate and lymph nodes, with G2
toxicity of around 20% (compared to 5% with dose painting radiotherapy to prostate alone).
This would be expected due to increased mean and maximal doses to the bowel and bladder
as shown in radiotherapy planning dosimetry data in the previous chapter. No patients had
G2 bowel toxicity at Week 18 in either group.
From the patient reported outcomes, the IPSS scores also suggest that urinary symptoms do
not worsen for the patients as a group between registration and Week 18 (i.e. from
treatments with both bicalutamide and dose painting radiotherapy). However the EPIC
scores show a small, but statistically significant, improvement in the urinary categories
between Week 1 and Week 18 in the prostate only group. This should be interpreted with
caution, as the patients may have already started to experience toxicity at Week 1, although
unlikely, and hence cannot be regarded as patients experiencing improved urinary toxicity
due to dose painting radiotherapy. In retrospect, it would have been informative to have
EPIC data collected at planning, together with the CTCAE and RTOG data. With the EPIC data
available to compare symptoms at registration and Week 18, patients did not experience
residual urinary or bowel toxicity following the acute phase from both bicalutamide and dose
painting radiotherapy. In comparison, patients did experience significant sexual and
hormonal toxicity, primarily from bicalutamide (rapid reduction in EPIC scores between
registration and Week 1), and this did not generally deteriorate from the subsequent dose
painting radiotherapy.
One of the CHHiP treatment arms involved delivering 60 Gy/20 #/4 weeks for localised
prostate cancer(10, 98). It aimed to deliver three dose levels also ([60 Gy/ 57.6 Gy/ 48 Gy]
vs. [68 Gy/ 60 Gy/ 53 Gy]), but the high dose volume was the whole prostate (60 Gy) as
opposed to the DILs (68 Gy). In addition, no posterior margin for the high dose volume (from
CTV3 to PTV3) was used within CHHiP, whilst the maximal extension of the high dose volume
beyond the boundaries of the prostate within the BIOPROP20 protocol was 2 mm. Additional
margins for the lower dose levels used in CHHiP were 5/10 mm, compared to 3/6 mm for
BIOPROP20. The inclusion criteria for CHHiP allowed for lower risk disease when compared
to BIOPROP20 (T1b-T3a compared to T2a-T4; PSA ≤ 30 ng/ml compared to no upper limit;
estimated risk of lymph node involvement of < 30% compared to <40%), with only 8% of
their patients having T3 disease compared to 67% in this study. In terms of treatment
delivery for CHHiP, static-field IMRT was used and IGRT techniques with 3 mm tolerance
were permitted although not required (was used in 30% of patients). In comparison for
158
BIOPROP20, rotational IMRT was used and IGRT technique with fiducial markers and 2 mm
tolerance were standard for all patients.
Despite these notable differences in trial protocol between the CHHiP and BIOPROP20
studies and hence a direct comparison cannot be drawn, the acute RTOG toxicity profiles for
prostate only dose painting patients who received a SIB to 68 Gy did not seem to be
significantly higher than those who received homogenous prostate radiotherapy of 60 Gy/20
#(10). Bowel and bladder toxicity peaked at weeks 4 to 5 in CHHiP, whilst it peaked at weeks
4 to 6 in this study. Cumulative incidence of patients who reported RTOG G2 or worse bowel
toxicity in CHHiP was 38%, compared to 6% in this study. Cumulative incidence of patients
who reported RTOG G2 or worse bladder toxicity in CHHiP was 49%, compared to 55% in this
study. Prevalence of RTOG G2 or worse bowel toxicity at week 18 in CHHiP was 3%,
compared to 0% in this study. Prevalence of RTOG G2 or worse bladder toxicity at week 18
in CHHiP was 5%, compared to 12% in this study. Therefore, the main difference is actually
reduced bowel toxicity in this study compared to CHHiP, which may be explained by the
routine use of IGRT with fiducial markers and tighter set-up tolerance in the BIOPROP20
protocol than in the CHHiP protocol.
There are limitations to this study and the analysis made. Patients were encouraged to
complete the EPIC forms fully, but some patients did not answer enough questions in the
sexual categories to allow a score to be calculated (for instance, 23 out of 56 of all included
patients did not have an EPIC sexual summary score at the Week 18 time point). This may be
due to significantly reduced sexual activity as a result of the treatment, although the answer
options available still allowed patients to provide an answer for this. Also, not all the
symptoms/toxicity scores were performed at every time point (Figure 5-1). This was with the
purpose of improving patient compliance and response rates for questionnaire completions,
especially as the EPIC questionnaire is 9 pages in total. But as discussed above, it would have
been of interest to have obtained EPIC data at planning, to allow differentiation between
bicalutamide and radiotherapy as the cause of patient reported urinary toxicity. Also
performing multiple statistical comparisons, in this case between different time points for
the various EPIC subcategories, can result in erroneous inferences (Table 5-1). However, the
result of these comparisons are expected e.g. sexual toxicity would primarily be from
bicalutamide.
159
Generally, it is preferable to obtain both patient reported and clinician reported outcomes,
given that patient reported outcomes may detect toxicities more reliably that clinician
reported outcomes(218, 219). But there are some considerations to be made. For patient
reported questionnaires, patients may feel obliged to report less severe toxicities. For
clinician reported questionnaires, reporting of symptomatic adverse events can be
unreliable and clinicians often under-report the incidence and severity of
symptoms/toxicities compared to patients(220). However, although not directly
comparable, the peak toxicities of the CTCAE/RTOG and the EPIC scores are in general
agreement in this study.
Overall, the phase II BIOPROP20 study aimed to recruit 50 patients at both Clatterbridge
Cancer Centre and Velindre Cancer Centre in order to rule out an upper limit of G≥2 toxicity
of 25% (with power of 87.8%). According to the Fleming-A’Hern design, if 8 or more patients
developed G≥2 toxicity at week 18, the null hypothesis will not be rejected (i.e. the 25%
upper limit is not ruled out). Although the analysis of this chapter consisted of the 51 patients
treated with prostate only dose painting radiotherapy at Clatterbridge Cancer Centre alone,
7 patients had G≥2 urinary toxicity at week 18 (CTCAE) and no patients had G≥2 bowel
toxicity. The final statistical analysis for the whole of the BIOPROP20 study is currently
pending.
Conclusion
Acute toxicity of moderately hypofractionated dose painting radiotherapy for prostate
adenocarcinoma appears to be well tolerated and clinically acceptable.
160
6 Late toxicity of moderately hypofractionated dose painting
radiotherapy for prostate adenocarcinoma
Introduction
Although the previous chapters show that dose painting radiotherapy is feasible and appears
well tolerated in the acute setting, longer term follow up is required to assess late toxicity.
This is important given that prognosis is generally good for locally advanced prostate cancer,
with patients often surviving for years even with metastatic disease as a result of the
increasing number of effective palliative treatment options available. For instance in a recent
STAMPEDE paper which reported outcomes from the up-front addition of abiraterone and
docetaxel for patients with either high risk non-metastatic disease or metastatic disease,
median survival had not been reached despite a median follow up of 4 years(221).
Total follow up of patients within the BIOPROP20 study was for 2 years. For the Clatterbridge
Cancer Centre patients, I (together with Dr Syndikus) reviewed patients up to their 2 year
follow up time point. I have collated and analysed the late toxicity data.
Aims
- To determine the late toxicities of moderately hypofractionated dose painting
radiotherapy for prostate adenocarcinoma with 60 Gy in 20 # over 4 weeks and a SIB
of up to 68 Gy.
Methods
Patients were reviewed at 6 months, 12 months, 18 months and 24 months following
commencement of radiotherapy. At all of these time points, PSA levels, CTCAE toxicity score,
RTOG toxicity score, and IPSS scores were collected. At the 24 months follow up, additional

161
data were collected for physical examination and performance status. Acceptable time
intervals for assessments to be performed were within 3 months of the expected date of
completion (as per the CHHiP protocol).
The toxicity scores were analysed and presented as per Chapter 5. For RTOG cumulative
incidence graphs, the late toxicity time frame was from month 6 to month 24. After the last
patient had reached 24 months follow up, data on survival and PSA relapse at the latest
follow up were collected for all patients.
Results
Of the 51 patients who received dose painting radiotherapy to the prostate alone, one had
died of myocardial infarction before 2 year follow up was reached (his last PSA was 0.1 at
month 18, and he was still on hormone therapy with no evidence of disease recurrence). At
2 year follow up, 6 of the 50 surviving patients were on adjuvant hormone therapy (12%)
and 1 had biochemical relapse (2%) with PSMA scan showing local as well as distant
metastatic disease.
Of the 5 patients who received dose painting radiotherapy to the prostate and pelvic lymph
nodes, all were alive at 2 year follow up, at which point 3 patients were on adjuvant hormone
therapy (60%) and none had biochemical relapse (0%).
6.4.1 CTCAE v4.0
All patients had CTCAE assessments at each of the four time points except the patient who
had assessments at three time points and died before 2 year follow up (203 assessments in
total for the ‘prostate only’ group, and 20 assessments in total for the ‘prostate and pelvic
lymph node’ group).
For the ‘prostate only’ group (Figures 6-1 to 6-3):
162
• Late urinary toxicity was generally static without significant change from month 6 to
month 24 follow up. G2 toxicity was reported for 6% of patients at month 24. No
patients had G3 urinary toxicity.
• Late bowel toxicity was generally low. G2 toxicity was reported for 2% at month 24.
No patients had G3 bowel toxicity.
• Other than urinary or bowel categories, toxicities were rare and those reported were
gynaecomastia and groin pain.
For the ‘prostate and pelvic lymph node’ group (Figures 6-8 to 6-10):
• Late urinary toxicity of G1 was experienced by 60% but no patients had G2 at month
24.
• Late bowel toxicity of G1 was experienced by 40% but no patients had G2 at month
24.
• Other than urinary or bowel toxicity, the only toxicity noted was G2 mood changes
in one patient.
6.4.2 RTOG
All patients had RTOG assessments at each of the four time points except the patient who
died before 2 year follow up (203 assessments in total for ‘prostate only’ group, and 20
assessments in total for the ‘prostate and pelvic lymph node’ group).
For the ‘prostate only’ group (Figures 6-4 to 6-5):
• Late urinary toxicity was generally static. G2 toxicity was reported for 6% of patients
at month 24. No patients had G3 toxicity.
• Late bowel toxicity was rare with G2 toxicity reported for only 2%. No patients had
G3 bowel toxicity.
For the ‘prostate and pelvic lymph node’ group (Figure 6-11 to 6-12):
• Late urinary toxicity of G1 was experienced by 40%, but no patients had G2 at month
24.
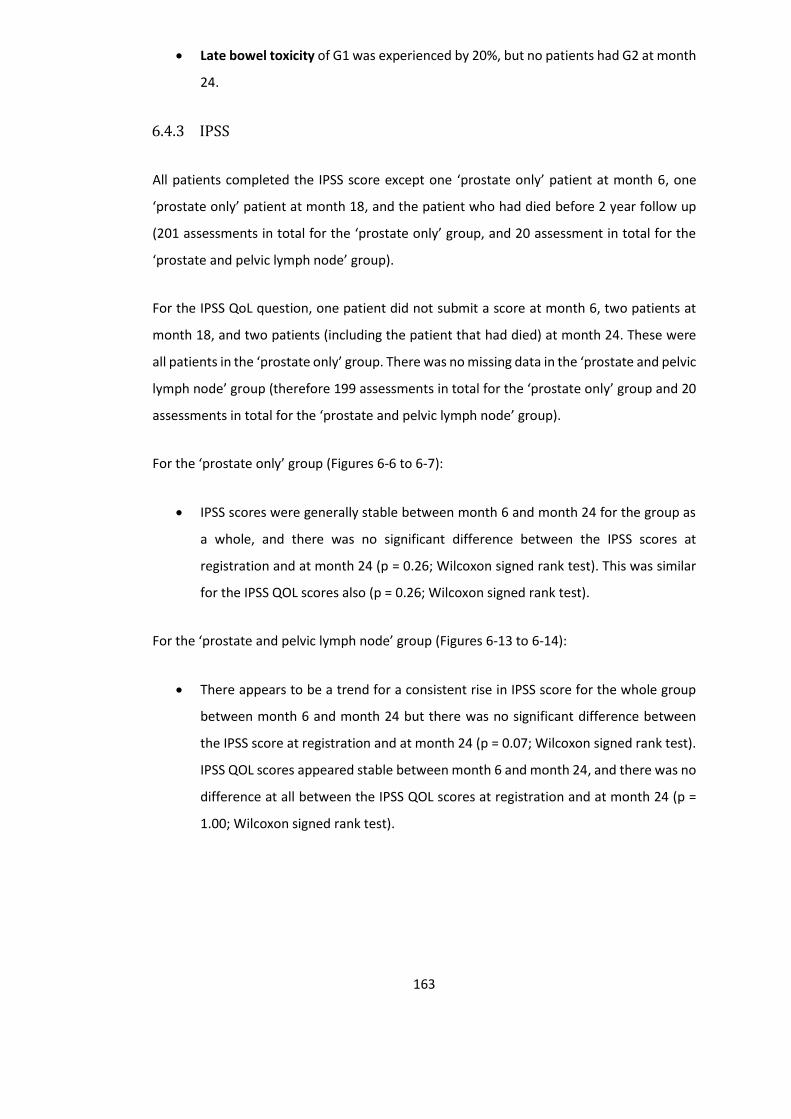
163
• Late bowel toxicity of G1 was experienced by 20%, but no patients had G2 at month
24.
6.4.3 IPSS
All patients completed the IPSS score except one ‘prostate only’ patient at month 6, one
‘prostate only’ patient at month 18, and the patient who had died before 2 year follow up
(201 assessments in total for the ‘prostate only’ group, and 20 assessment in total for the
‘prostate and pelvic lymph node’ group).
For the IPSS QoL question, one patient did not submit a score at month 6, two patients at
month 18, and two patients (including the patient that had died) at month 24. These were
all patients in the ‘prostate only’ group. There was no missing data in the ‘prostate and pelvic
lymph node’ group (therefore 199 assessments in total for the ‘prostate only’ group and 20
assessments in total for the ‘prostate and pelvic lymph node’ group).
For the ‘prostate only’ group (Figures 6-6 to 6-7):
• IPSS scores were generally stable between month 6 and month 24 for the group as
a whole, and there was no significant difference between the IPSS scores at
registration and at month 24 (p = 0.26; Wilcoxon signed rank test). This was similar
for the IPSS QOL scores also (p = 0.26; Wilcoxon signed rank test).
For the ‘prostate and pelvic lymph node’ group (Figures 6-13 to 6-14):
• There appears to be a trend for a consistent rise in IPSS score for the whole group
between month 6 and month 24 but there was no significant difference between
the IPSS score at registration and at month 24 (p = 0.07; Wilcoxon signed rank test).
IPSS QOL scores appeared stable between month 6 and month 24, and there was no
difference at all between the IPSS QOL scores at registration and at month 24 (p =
1.00; Wilcoxon signed rank test).
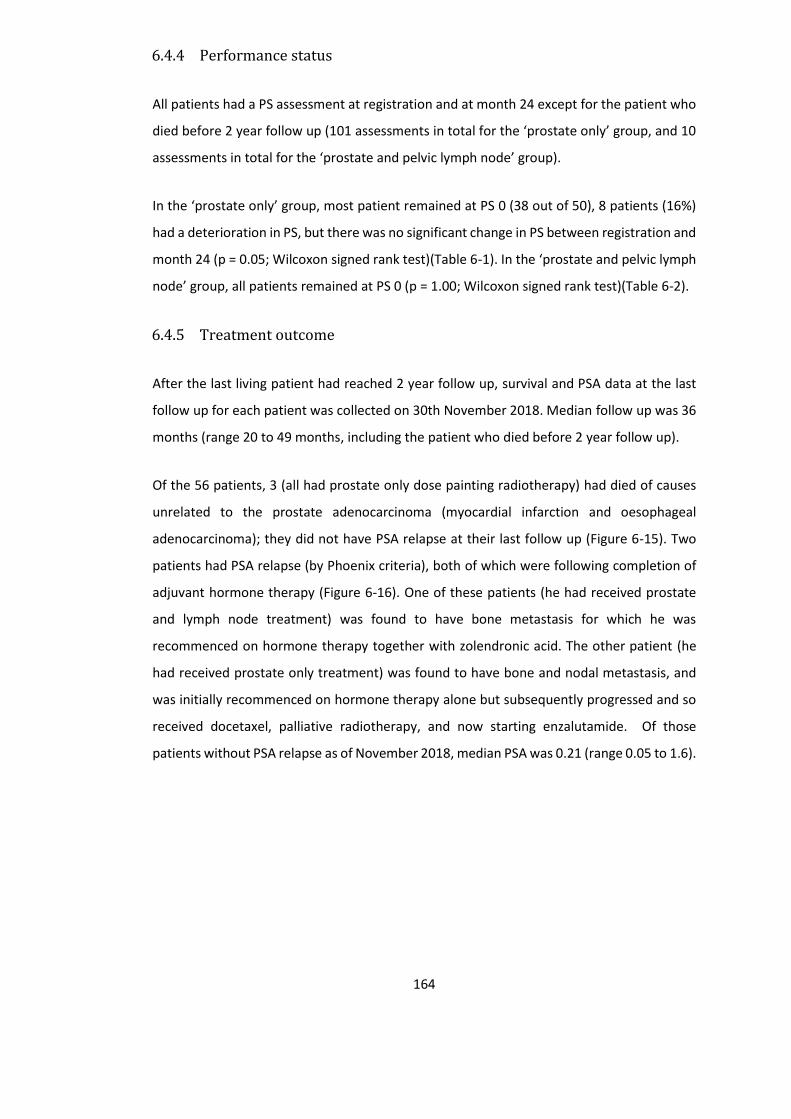
164
6.4.4 Performance status
All patients had a PS assessment at registration and at month 24 except for the patient who
died before 2 year follow up (101 assessments in total for the ‘prostate only’ group, and 10
assessments in total for the ‘prostate and pelvic lymph node’ group).
In the ‘prostate only’ group, most patient remained at PS 0 (38 out of 50), 8 patients (16%)
had a deterioration in PS, but there was no significant change in PS between registration and
month 24 (p = 0.05; Wilcoxon signed rank test)(Table 6-1). In the ‘prostate and pelvic lymph
node’ group, all patients remained at PS 0 (p = 1.00; Wilcoxon signed rank test)(Table 6-2).
6.4.5 Treatment outcome
After the last living patient had reached 2 year follow up, survival and PSA data at the last
follow up for each patient was collected on 30th November 2018. Median follow up was 36
months (range 20 to 49 months, including the patient who died before 2 year follow up).
Of the 56 patients, 3 (all had prostate only dose painting radiotherapy) had died of causes
unrelated to the prostate adenocarcinoma (myocardial infarction and oesophageal
adenocarcinoma); they did not have PSA relapse at their last follow up (Figure 6-15). Two
patients had PSA relapse (by Phoenix criteria), both of which were following completion of
adjuvant hormone therapy (Figure 6-16). One of these patients (he had received prostate
and lymph node treatment) was found to have bone metastasis for which he was
recommenced on hormone therapy together with zolendronic acid. The other patient (he
had received prostate only treatment) was found to have bone and nodal metastasis, and
was initially recommenced on hormone therapy alone but subsequently progressed and so
received docetaxel, palliative radiotherapy, and now starting enzalutamide. Of those
patients without PSA relapse as of November 2018, median PSA was 0.21 (range 0.05 to 1.6).

165
Figure 6-1 Late urinary and lower GI CTCAE toxicity by time point for prostate only radiotherapy Prevalence (A) and distribution (B) of urinary toxicity grades. Prevalence (C) and distribution (D) of lower GI
toxicity grades
A B
C D
0102030405060708090
100
Month 6 Month12
Month18
Month24
Pat
ien
ts (
%)
G1+
G2+
G3+
0%10%20%30%40%50%60%70%80%90%
100%
Month 6 Month 12Month 18Month 24
G4
G3
G2
G1
G0
0102030405060708090
100
Month 6 Month12
Month18
Month24
Pat
ien
ts (
%)
G1+
G2+
G3+
0%10%20%30%40%50%60%70%80%90%
100%
Month 6 Month 12Month 18Month 24
G4
G3
G2
G1
G0

166
Figure 6-2 Prevalence of specific late CTCAE toxicities by time point for prostate only radiotherapy Prevalence of late CTCAE urinary toxicities (A) and lower GI toxicities (B)
A
B
0
10
20
30
40
50
60
70
80
90
100
Month 6 Month 12 Month 18 Month 24
Pat
ien
ts (
%)
G1+ cystitis noninfective
G1+ urinary fistula
G1+ urinary frequency
G1+ urinary incontinence
G1+ urinary retention
G1+ urinary urgency
G2+ cystitis noninfective
G2+ urinary fistula
G2+ urinary frequency
G2+ urinary incontinence
G2+ urinary retention
0
10
20
30
40
50
60
70
80
90
100
Month 6 Month 12 Month 18 Month 24
Pat
ien
ts (
%)
G1+ Anal mucositis
G1+ Anal necrosis
G1+ Anal pain
G1+ Abdominal pain
G1+ Diarrhoea
G1+ Rectal haemorrhage
G1+ Rectal mucositis
G2+ Anal mucositis
G2+ Anal necrosis
G2+ Anal pain
G2+ Abdominal pain
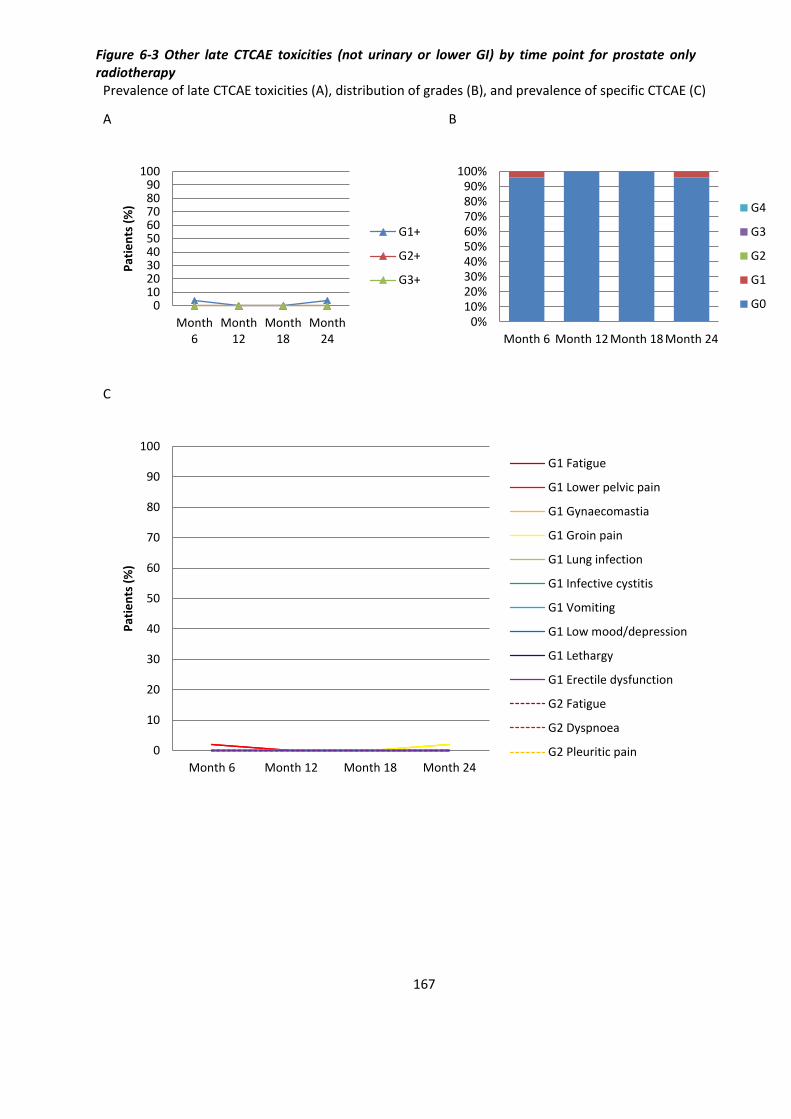
167
Figure 6-3 Other late CTCAE toxicities (not urinary or lower GI) by time point for prostate only radiotherapy
Prevalence of late CTCAE toxicities (A), distribution of grades (B), and prevalence of specific CTCAE (C)
A B
C
0102030405060708090
100
Month6
Month12
Month18
Month24
Pat
ien
ts (
%)
G1+
G2+
G3+
0%10%20%30%40%50%60%70%80%90%
100%
Month 6 Month 12 Month 18 Month 24
G4
G3
G2
G1
G0
0
10
20
30
40
50
60
70
80
90
100
Month 6 Month 12 Month 18 Month 24
Pat
ien
ts (
%)
G1 Fatigue
G1 Lower pelvic pain
G1 Gynaecomastia
G1 Groin pain
G1 Lung infection
G1 Infective cystitis
G1 Vomiting
G1 Low mood/depression
G1 Lethargy
G1 Erectile dysfunction
G2 Fatigue
G2 Dyspnoea
G2 Pleuritic pain
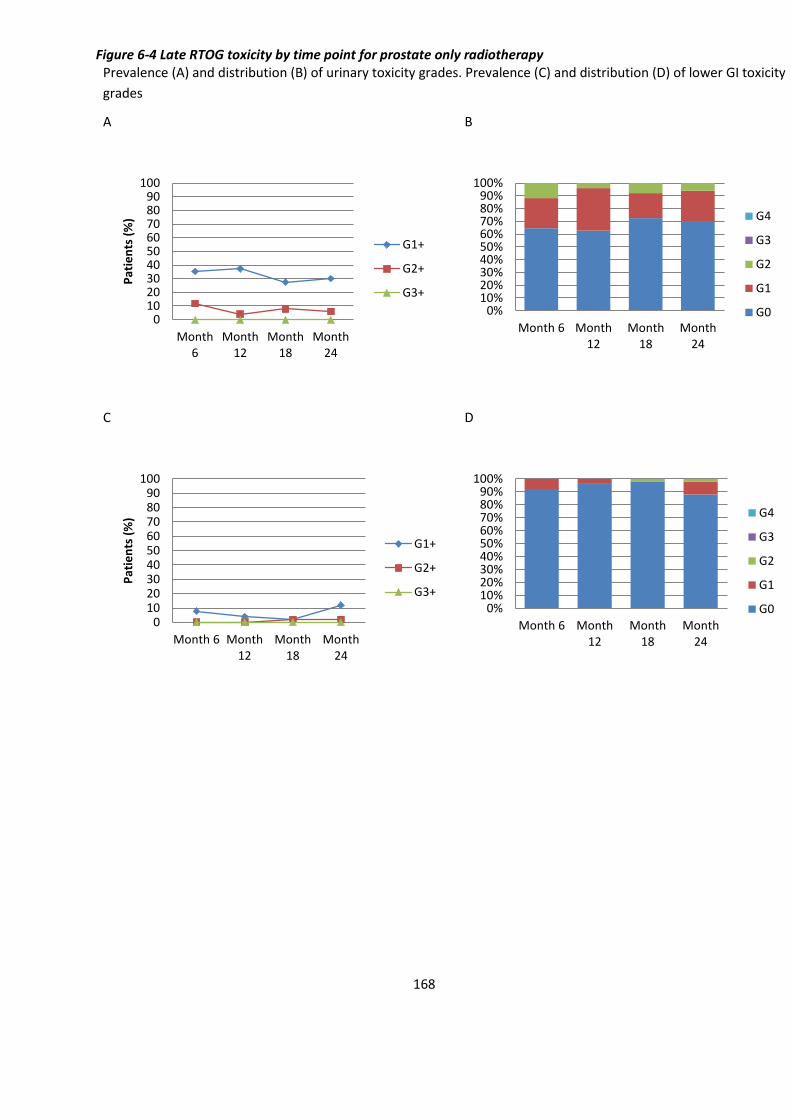
168
Figure 6-4 Late RTOG toxicity by time point for prostate only radiotherapy Prevalence (A) and distribution (B) of urinary toxicity grades. Prevalence (C) and distribution (D) of lower GI toxicity
grades
A B
C D
0102030405060708090
100
Month6
Month12
Month18
Month24
Pat
ien
ts (
%)
G1+
G2+
G3+
0%10%20%30%40%50%60%70%80%90%
100%
Month 6 Month12
Month18
Month24
G4
G3
G2
G1
G0
0102030405060708090
100
Month 6 Month12
Month18
Month24
Pat
ien
ts (
%)
G1+
G2+
G3+0%
10%20%30%40%50%60%70%80%90%
100%
Month 6 Month12
Month18
Month24
G4
G3
G2
G1
G0

169
Figure 6-5 Cumulative incidence of late RTOG toxicity by time point for prostate only radiotherapy Cumulative incidence of urinary toxicity (A) and lower GI toxicity (B)
A
B
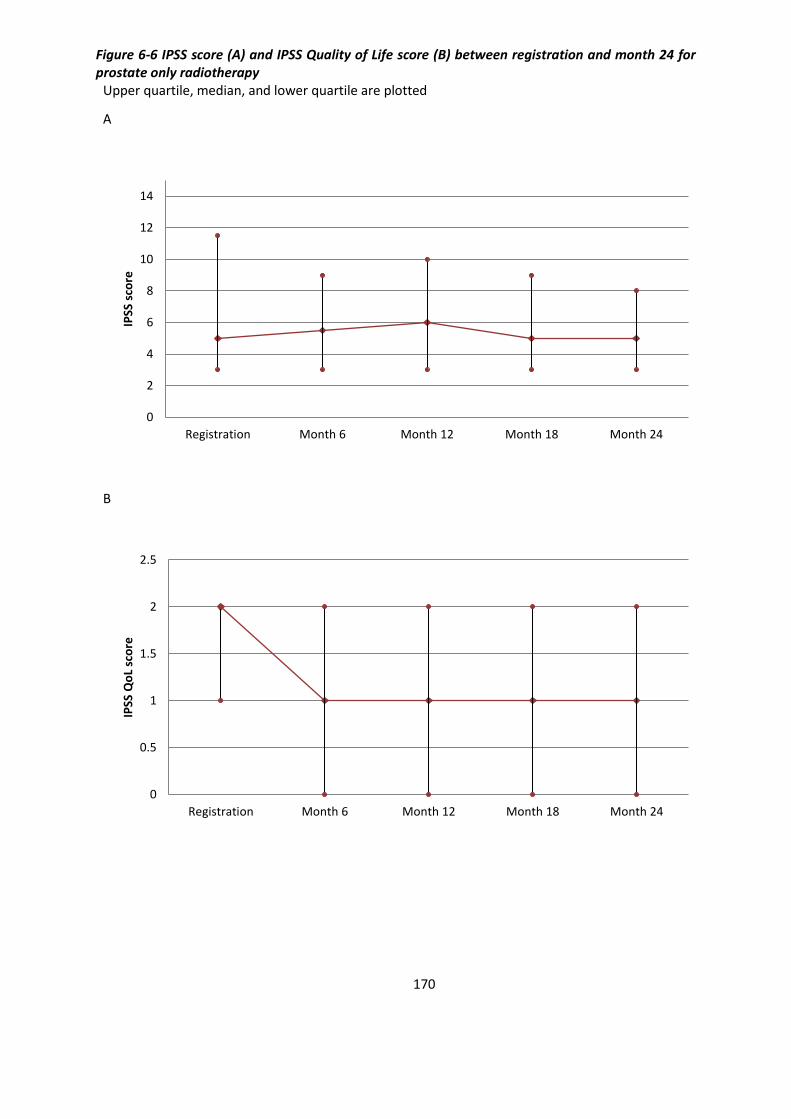
170
Figure 6-6 IPSS score (A) and IPSS Quality of Life score (B) between registration and month 24 for prostate only radiotherapy
Upper quartile, median, and lower quartile are plotted
A
B
0
2
4
6
8
10
12
14
Registration Month 6 Month 12 Month 18 Month 24
IPSS
sco
re
0
0.5
1
1.5
2
2.5
Registration Month 6 Month 12 Month 18 Month 24
IPSS
Qo
L sc
ore
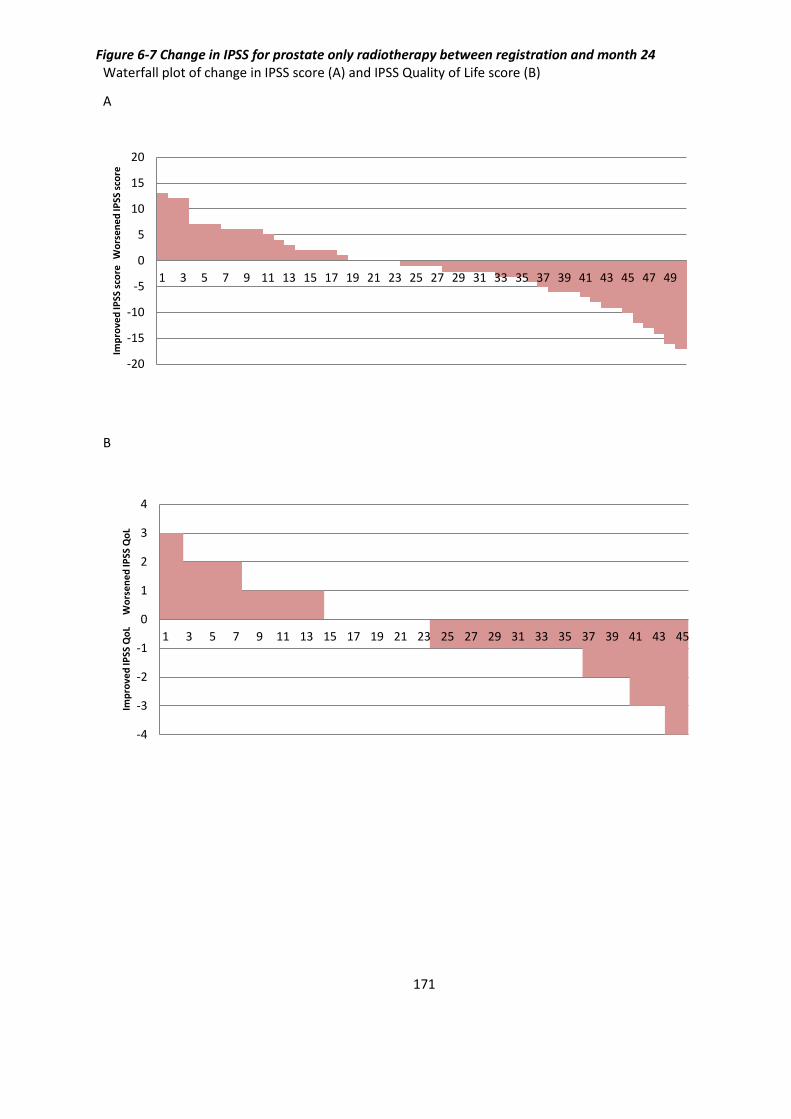
171
Figure 6-7 Change in IPSS for prostate only radiotherapy between registration and month 24 Waterfall plot of change in IPSS score (A) and IPSS Quality of Life score (B)
A
B
-20
-15
-10
-5
0
5
10
15
20
1 3 5 7 9 11 13 15 17 19 21 23 25 27 29 31 33 35 37 39 41 43 45 47 49
Imp
rove
d IP
SS s
core
Wo
rse
ne
d IP
SS s
core
-4
-3
-2
-1
0
1
2
3
4
1 3 5 7 9 11 13 15 17 19 21 23 25 27 29 31 33 35 37 39 41 43 45
Imp
rove
d IP
SS Q
oL
Wo
rse
ne
d IP
SS Q
oL
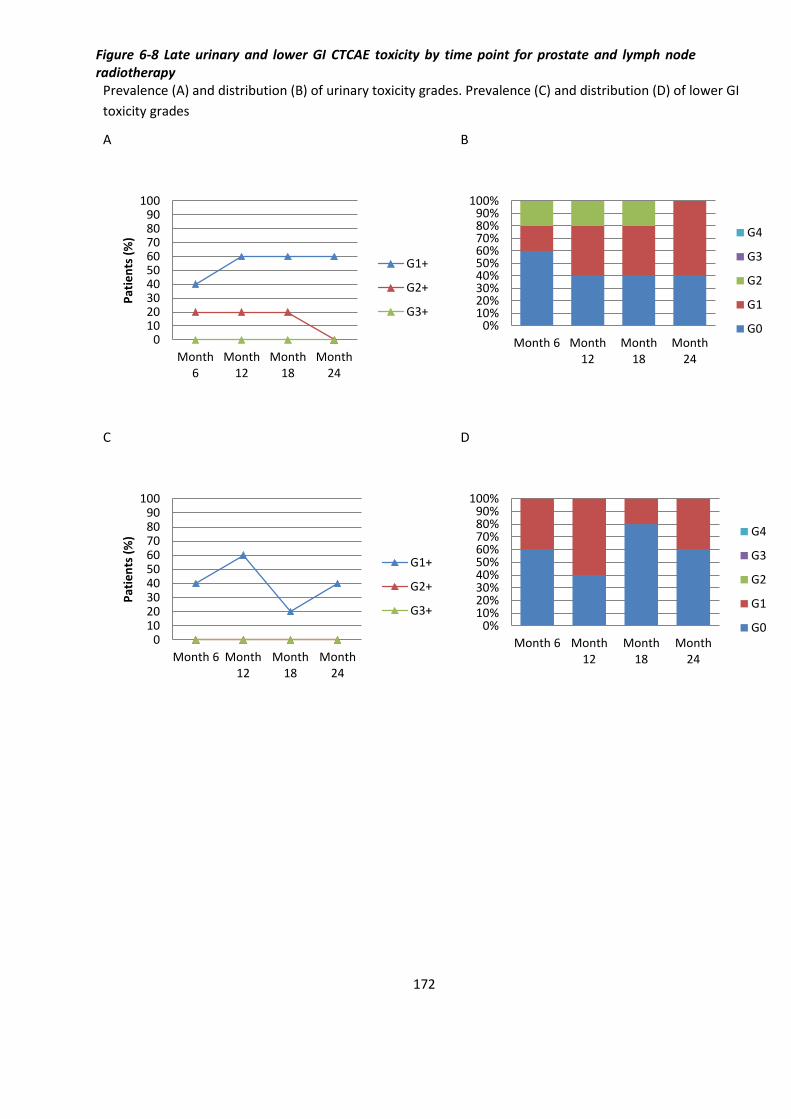
172
Figure 6-8 Late urinary and lower GI CTCAE toxicity by time point for prostate and lymph node radiotherapy
Prevalence (A) and distribution (B) of urinary toxicity grades. Prevalence (C) and distribution (D) of lower GI
toxicity grades
A B
C D
0102030405060708090
100
Month6
Month12
Month18
Month24
Pat
ien
ts (
%)
G1+
G2+
G3+0%
10%20%30%40%50%60%70%80%90%
100%
Month 6 Month12
Month18
Month24
G4
G3
G2
G1
G0
0102030405060708090
100
Month 6 Month12
Month18
Month24
Pat
ien
ts (
%)
G1+
G2+
G3+0%
10%20%30%40%50%60%70%80%90%
100%
Month 6 Month12
Month18
Month24
G4
G3
G2
G1
G0
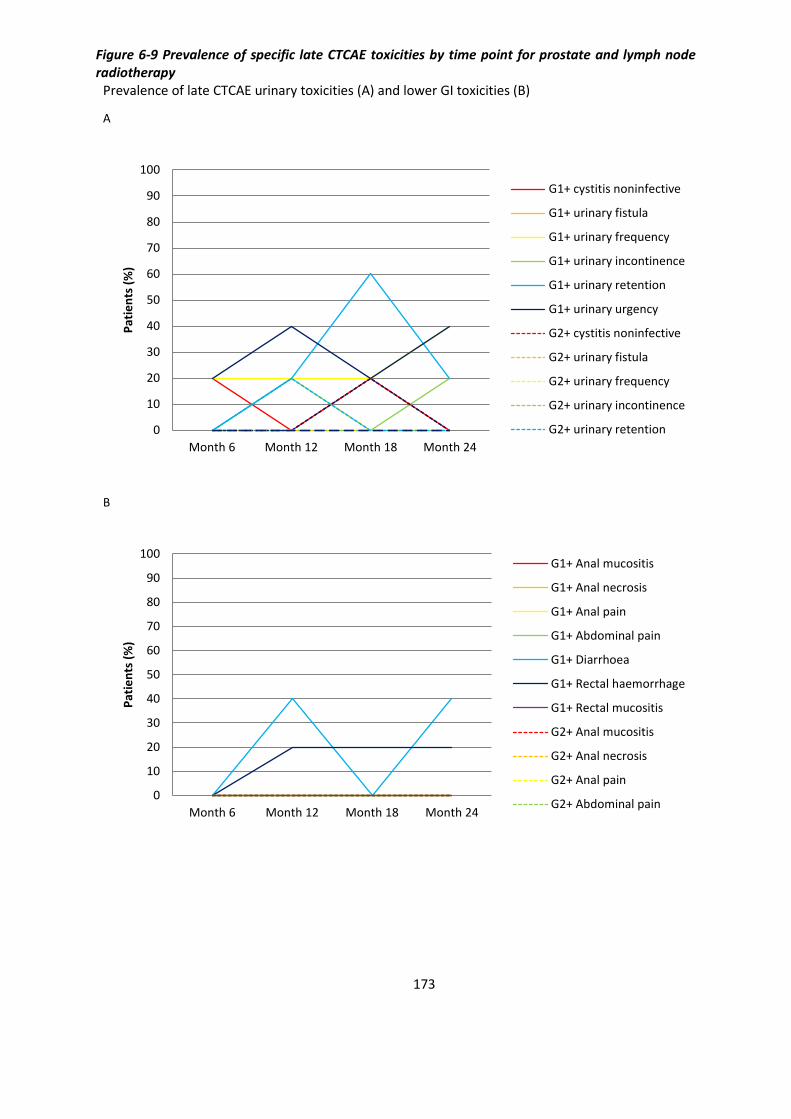
173
Figure 6-9 Prevalence of specific late CTCAE toxicities by time point for prostate and lymph node radiotherapy
Prevalence of late CTCAE urinary toxicities (A) and lower GI toxicities (B)
A
B
0
10
20
30
40
50
60
70
80
90
100
Month 6 Month 12 Month 18 Month 24
Pat
ien
ts (
%)
G1+ cystitis noninfective
G1+ urinary fistula
G1+ urinary frequency
G1+ urinary incontinence
G1+ urinary retention
G1+ urinary urgency
G2+ cystitis noninfective
G2+ urinary fistula
G2+ urinary frequency
G2+ urinary incontinence
G2+ urinary retention
0
10
20
30
40
50
60
70
80
90
100
Month 6 Month 12 Month 18 Month 24
Pat
ien
ts (
%)
G1+ Anal mucositis
G1+ Anal necrosis
G1+ Anal pain
G1+ Abdominal pain
G1+ Diarrhoea
G1+ Rectal haemorrhage
G1+ Rectal mucositis
G2+ Anal mucositis
G2+ Anal necrosis
G2+ Anal pain
G2+ Abdominal pain
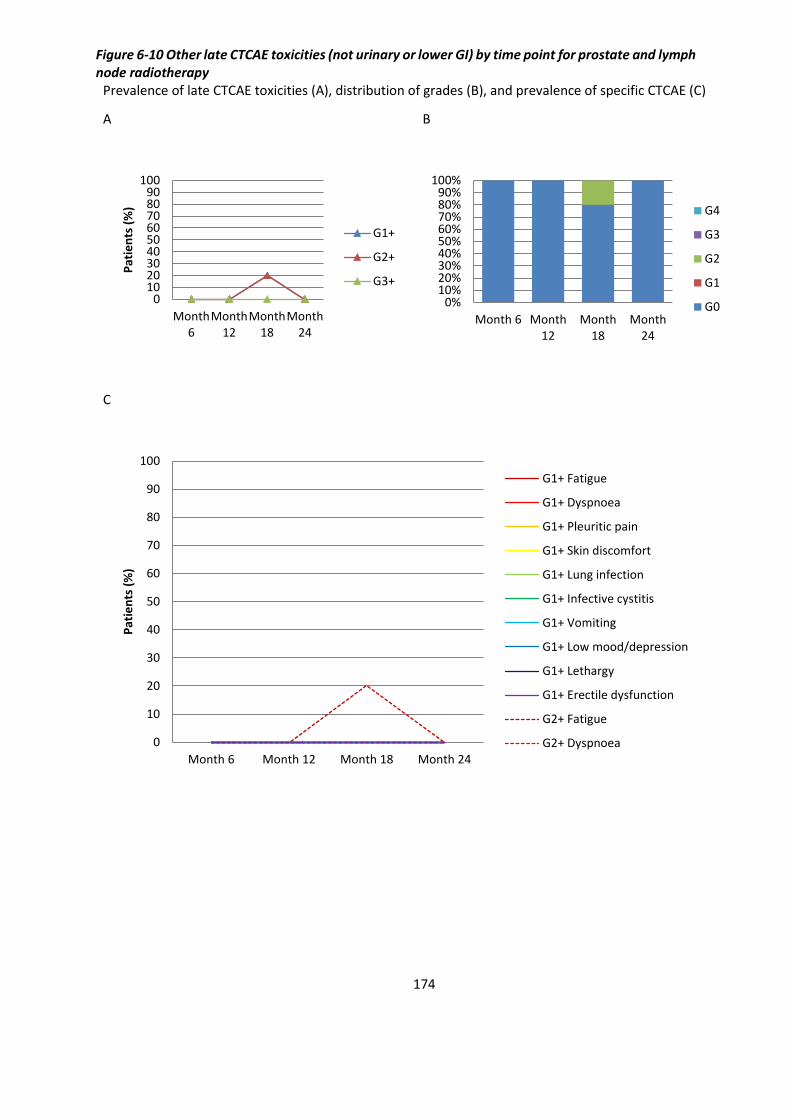
174
Figure 6-10 Other late CTCAE toxicities (not urinary or lower GI) by time point for prostate and lymph node radiotherapy
Prevalence of late CTCAE toxicities (A), distribution of grades (B), and prevalence of specific CTCAE (C)
A B
C
0102030405060708090
100
Month6
Month12
Month18
Month24
Pat
ien
ts (
%)
G1+
G2+
G3+
0%10%20%30%40%50%60%70%80%90%
100%
Month 6 Month12
Month18
Month24
G4
G3
G2
G1
G0
0
10
20
30
40
50
60
70
80
90
100
Month 6 Month 12 Month 18 Month 24
Pat
ien
ts (
%)
G1+ Fatigue
G1+ Dyspnoea
G1+ Pleuritic pain
G1+ Skin discomfort
G1+ Lung infection
G1+ Infective cystitis
G1+ Vomiting
G1+ Low mood/depression
G1+ Lethargy
G1+ Erectile dysfunction
G2+ Fatigue
G2+ Dyspnoea
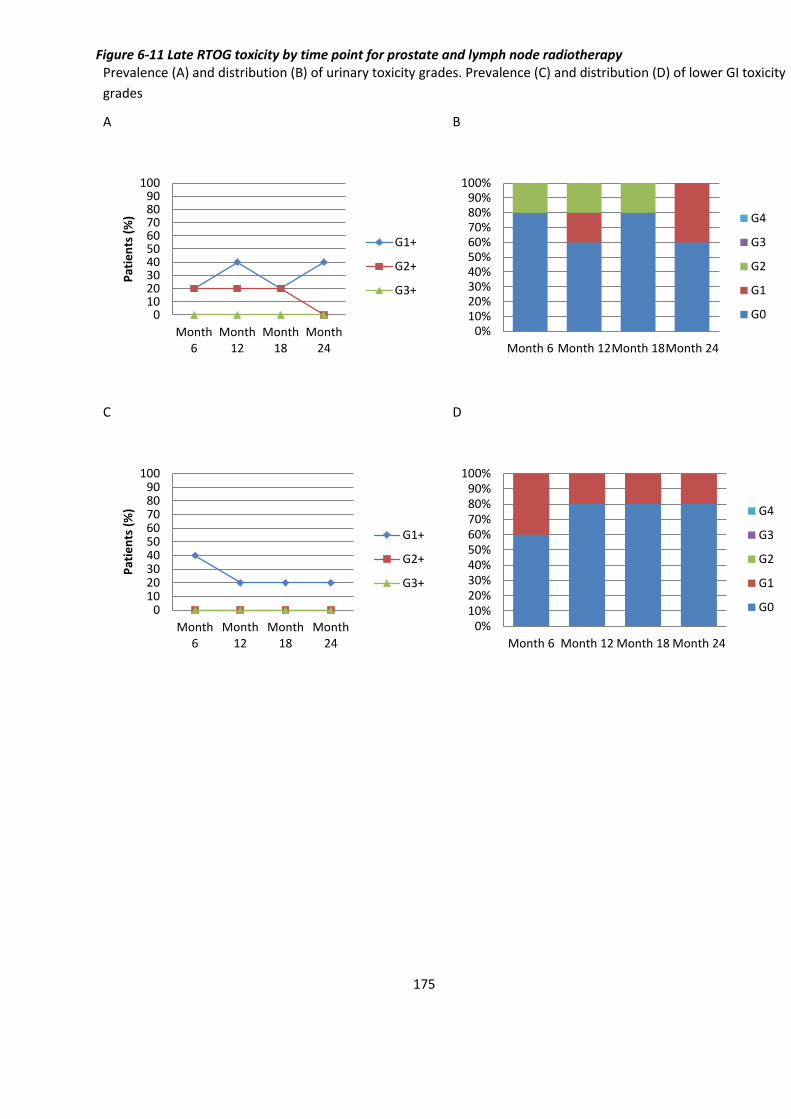
175
Figure 6-11 Late RTOG toxicity by time point for prostate and lymph node radiotherapy Prevalence (A) and distribution (B) of urinary toxicity grades. Prevalence (C) and distribution (D) of lower GI toxicity
grades
A B
C D
0102030405060708090
100
Month6
Month12
Month18
Month24
Pat
ien
ts (
%)
G1+
G2+
G3+
0%10%20%30%40%50%60%70%80%90%
100%
Month 6 Month 12Month 18Month 24
G4
G3
G2
G1
G0
0102030405060708090
100
Month6
Month12
Month18
Month24
Pat
ien
ts (
%)
G1+
G2+
G3+
0%10%20%30%40%50%60%70%80%90%
100%
Month 6 Month 12 Month 18 Month 24
G4
G3
G2
G1
G0

176
Figure 6-12 Cumulative incidence of late RTOG toxicity by time point for prostate and lymph node radiotherapy Cumulative incidence of urinary toxicity (A) and lower GI toxicity (B)
A
B

177
Figure 6-13 IPSS score (A) and IPSS Quality of Life score (B) between registration and month 24 for prostate and lymph node radiotherapy
Upper quartile, median, and lower quartile are plotted
A
B
0
2
4
6
8
10
12
14
Registration Month 6 Month 12 Month 18 Month 24
IPSS
sco
re
0
0.5
1
1.5
2
2.5
Registration Month 6 Month 12 Month 18 Month 24
IPSS
Qo
L sc
ore

178
Figure 6-14 Change in IPSS for prostate and lymph node radiotherapy between registration and month 24
Waterfall plot of change in IPSS score (A) and IPSS Quality of Life score (B)
A
B
-20
-15
-10
-5
0
5
10
15
20
1 2 3 4 5
Imp
rove
d IP
SS s
core
Wo
rse
ne
d IP
SS s
core
-4
-3
-2
-1
0
1
2
3
4
1 2 3 4
Imp
rove
d IP
SS Q
oL
Wo
rse
ne
d IP
SS Q
oL

179
Table 6-1 Performance status (PS) within the prostate only radiotherapy group (to month 24) Prevalence at registration and month 24 (A) and change in PS between the time points (B)
A
Registration Month 24
PS 0 PS 1 PS 0 PS 1 PS 2 Unanswered
No. of pts 46 5 40 8 2 1
B
Change in PS from Registration to Month 24
No. of patients
PS 0 to 0 38
PS 0 to 1 6
PS 0 to 2 1
PS 1 to 0 2
PS 1 to 1 2
PS 1 to 2 1
PS 0 to unanswered 1
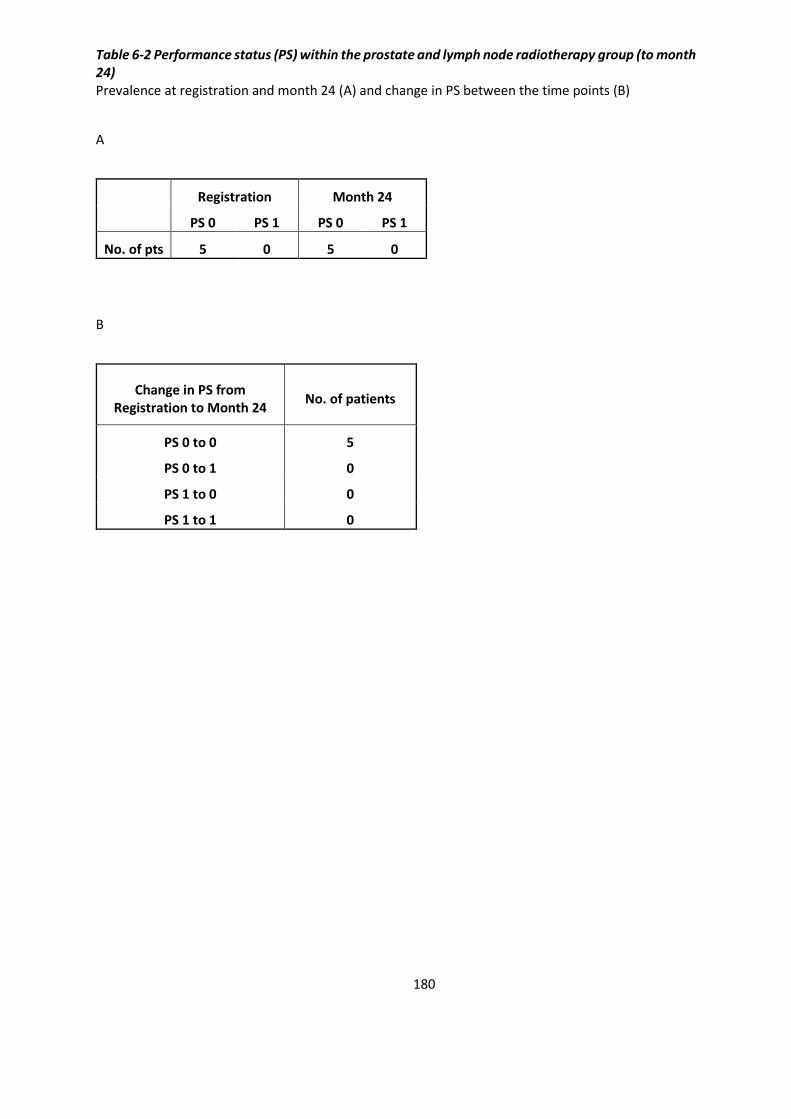
180
Table 6-2 Performance status (PS) within the prostate and lymph node radiotherapy group (to month 24) Prevalence at registration and month 24 (A) and change in PS between the time points (B)
A
Registration Month 24
PS 0 PS 1 PS 0 PS 1
No. of pts 5 0 5 0
B
Change in PS from Registration to Month 24
No. of patients
PS 0 to 0 5
PS 0 to 1 0
PS 1 to 0 0
PS 1 to 1 0

181
Figure 6-15 Kaplan Meier Curve for Overall Survival for all 56 patients Three patients had died (at 20 months, 34 months, and 36 months)
Figure 6-16 Kaplan Meier curve for PSA relapse (by Phoenix criteria) for all 56 patients Two patients had PSA relapse (at 18 months and 47 months)

182
Discussion
Treatment of clinically node-negative prostate cancer with moderately hypofractionated dose
painting radiotherapy to the prostate alone was well tolerated and toxicity generally did not worsen
from month 6 to month 24. Prevalence of late G≥2 urinary toxicity was around 6% and was mostly
urinary frequency. Prevalence of late G≥2 bowel toxicity was around 2% and was mostly diarrhoea.
Only 16% had a deterioration in performance status between registration and month 24.
Treatment of clinically node-positive prostate cancer with dose painting radiotherapy to both the
prostate and pelvic lymph nodes was also well tolerated. No patients had late G≥2 urinary or bowel
toxicity. The commonest urinary toxicity reported was retention and urgency, and the commonest
bowel toxicity reported was diarrhoea and rectal haemorrhage. IPSS score showed an increase from
month 6 to month 24 but there was no statistically significant difference between registration and
month 24 (of note, an IPSS score of <12 is classed as no or mildly symptomatic only). In comparison,
the IPSS QOL score was stable, and there was no deterioration in performance status between
registration and month 24.
In comparison to the pilot study, the cumulative incidence of late G≥2 toxicities for prostate only
dose painting radiotherapy were higher in this study for both urinary (20% vs. 7%) and bowel (4% vs.
0%) toxicities(161). This may be due to fundamental differences between the studies. The
BIOPROP20 protocol offered the addition of 18F choline PET/CT to aid DIL delineation whilst the pilot
study did not, but this did not result in larger DILs (median 3.5 ml (range 1.2 ml to 14.9 ml) for this
study vs. median 4.3 ml (range 0.46 ml to 15 ml) for the pilot study). The pilot study used a research
version of Pinnacle in order to create plans radiobiologically optimised for tumour control
probability and normal tissue complication probability as the first step, before re-planning in the
clinical treatment planning system whilst attempting to reproduce certain planning parameters from
the radiobiologically optimised plan. The mean (and range) of the maximum doses to the rectum
achieved by the clinical plans in the pilot study were 56 Gy (53 to 58 Gy), whilst that of this study
were 62 Gy (58 to 66 Gy). Therefore this may explain the higher bowel toxicities in this study when
compared to the pilot study, although care needs to be taken when comparing outcomes from
separate studies with small sample numbers.
In comparison to the CHHiP study, the prevalence of G≥2 RTOG late bladder toxicity at 2 year follow
up was higher in this study (6% vs. 2%) but was similar for late bowel toxicity (2% vs. 3%)(10).
According to the Fleming-A’Hern design for the BIOPROP20 study which aimed to recruit 50 patients,
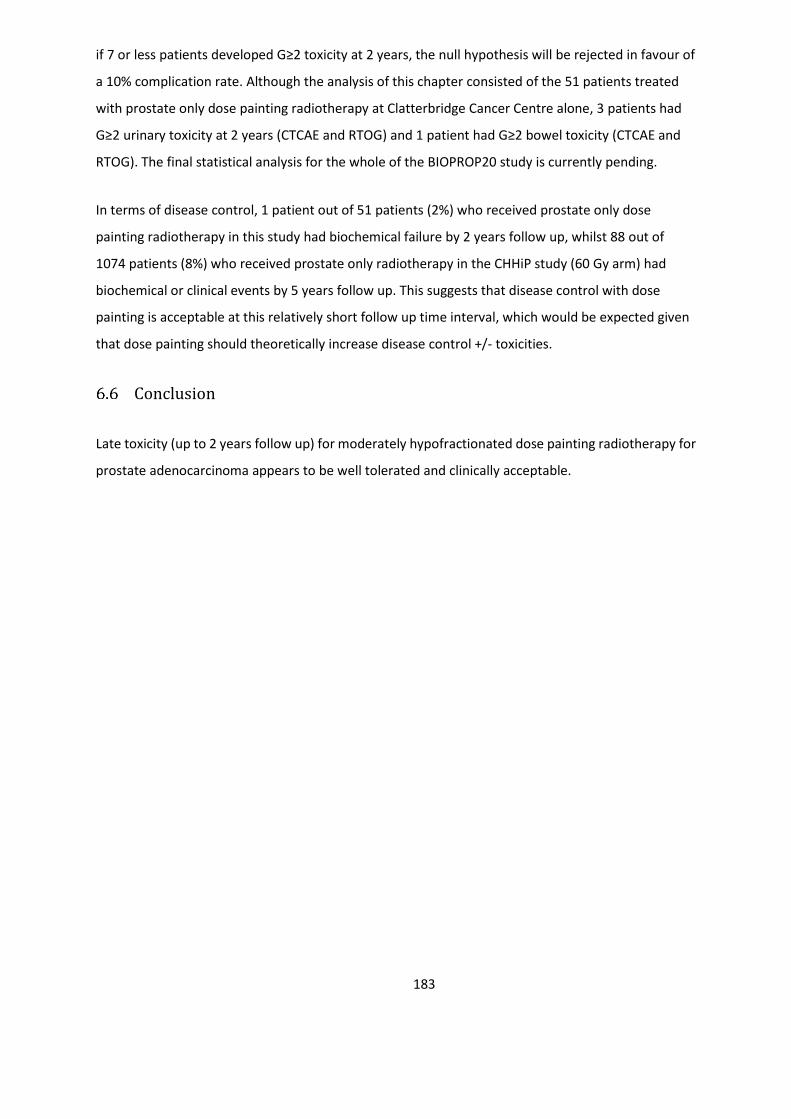
183
if 7 or less patients developed G≥2 toxicity at 2 years, the null hypothesis will be rejected in favour of
a 10% complication rate. Although the analysis of this chapter consisted of the 51 patients treated
with prostate only dose painting radiotherapy at Clatterbridge Cancer Centre alone, 3 patients had
G≥2 urinary toxicity at 2 years (CTCAE and RTOG) and 1 patient had G≥2 bowel toxicity (CTCAE and
RTOG). The final statistical analysis for the whole of the BIOPROP20 study is currently pending.
In terms of disease control, 1 patient out of 51 patients (2%) who received prostate only dose
painting radiotherapy in this study had biochemical failure by 2 years follow up, whilst 88 out of
1074 patients (8%) who received prostate only radiotherapy in the CHHiP study (60 Gy arm) had
biochemical or clinical events by 5 years follow up. This suggests that disease control with dose
painting is acceptable at this relatively short follow up time interval, which would be expected given
that dose painting should theoretically increase disease control +/- toxicities.
Conclusion
Late toxicity (up to 2 years follow up) for moderately hypofractionated dose painting radiotherapy for
prostate adenocarcinoma appears to be well tolerated and clinically acceptable.
184
7 Future directions
Current standard of care non-surgical treatment for intermediate and high risk localised or
locally advanced prostate cancer is a combination of hormone therapy and radiotherapy,
where radiotherapy involves the delivery of a homogenous dose to the whole gland
irrespective of the pattern of disease within it. Modern technological advances in imaging
technology allow the identification of dominant intraprostatic lesions where there is highest
risk of local recurrence, and advances in radiotherapy delivery allow dose escalation to sub-
volumes within the target volume. Given that whole organ dose escalation radiotherapy
leads to improved biochemical control at a cost of increased toxicity, selective dose
escalation by dose painting to these sub-volumes responsible for local failure may lead to
improved disease control without a significant increase in toxicity.
This thesis shows that planning and delivery of moderately hypofractionated dose painting
radiotherapy to the prostate appear to be both feasible and clinically acceptable with
regards to toxicity. However, the data presented here are for 2 years follow up, and given
that prognosis is generally good for this group of patients, longer term data is required to
assess clinical outcomes including biochemical relapse free survival and overall survival, and
to assess for any emergent late toxicity beyond 2 years follow up. Also only 5 patients were
treated with both prostate and pelvic nodal radiotherapy, and although the results show
that it is technically feasible, larger cohorts will need to be treated in order to allow
conclusions to be drawn regarding toxicity.
Dose escalation by external beam radiotherapy is limited by dose to the surrounding organs.
HDR brachytherapy provides an alternative method of radiation delivery and although it is
an invasive procedure with the associated risks of general anaesthesia, it provides better
dose conformity and can deliver higher biologically effective doses. Therefore dose painting
by using a combination of external beam radiotherapy and HDR brachytherapy may offer an
improved therapeutic ratio.
For radiotherapy planning, the dose descriptors of organs at risk, including bladder and
rectum, are based on dose volume histograms. However, these methods lose spatial dose
information, and advanced methods such as bladder and rectal dose surface maps would
preserve dose distribution data. This may be more useful when assessing plans for dose

185
painting radiotherapy, as the heterogeneous dose distributions generated can involve focal
hot spots with high dose gradients in close proximity to surrounding organs at risk.
With regards to imaging to define the dominant intraprostatic lesions, this thesis has used
18F choline tracer for PET/CT imaging. With the increasing availability and utilisation of PSMA
PET/CT, there is strong evidence for its use in identifying disease recurrence after definitive
treatment. It would be of interest to investigate whether PSMA performs better than 18F
choline in localising dominant intraprostatic lesions for dose painting.
The work contained in this thesis has led to the PIVOTALboost trial which is currently
underway. It is a large national multicentre randomised phase III clinical trial for dose
painting radiotherapy, where patients with node negative intermediate risk (with at least 2
adverse features including maximum tumour length >6mm, ≥50% biopsy core positive and
>50% involved cancer/total biopsy length) or high risk prostate cancer are randomised to
prostate boost (whole prostate or focal dose escalation) and pelvic nodal radiotherapy.

186
8 References
1. Uk CR. Prostate cancer incidence statistics. Cancer Research UK; 2014.
2. Eigl BJ, Gleave ME, Chi KN. The future of systemic therapies for localised prostate cancer. Clin Oncol (R Coll Radiol). 2013;25(8):506-13.
3. Hoskin PJ. Radiotherapy in practice : imaging. 2012.
4. Dulaney CR, Osula DO, Yang ES, Rais-Bahrami S. Prostate Radiotherapy in the Era of Advanced Imaging and Precision Medicine. Prostate Cancer. 2016;2016:4897515.
5. Fantus RJ, Helfand BT. Germline Genetics of Prostate Cancer: Time to Incorporate Genetics into Early Detection Tools. Clin Chem. 2019;65(1):74-9.
6. Gunderson LL, Tepper JE. Clinical radiation oncology. 2016.
7. Carroll PH, Mohler JL. NCCN Guidelines Updates: Prostate Cancer and Prostate Cancer Early Detection. J Natl Compr Canc Netw. 2018;16(5S):620-3.
8. Osses DF, Roobol MJ, Schoots IG. Prediction Medicine: Biomarkers, Risk Calculators and Magnetic Resonance Imaging as Risk Stratification Tools in Prostate Cancer Diagnosis. Int J Mol Sci. 2019;20(7).
9. Cheng HH, Sokolova AO, Schaeffer EM, Small EJ, Higano CS. Germline and Somatic Mutations in Prostate Cancer for the Clinician. J Natl Compr Canc Netw. 2019;17(5):515-21.
10. Dearnaley D, Syndikus I, Mossop H, Khoo V, Birtle A, Bloomfield D, et al. Conventional versus hypofractionated high-dose intensity-modulated radiotherapy for prostate cancer: 5-year outcomes of the randomised, non-inferiority, phase 3 CHHiP trial. Lancet Oncol. 2016;17(8):1047-60.
11. Kasivisvanathan V, Emberton M, Ahmed HU. Focal therapy for prostate cancer: rationale and treatment opportunities. Clin Oncol (R Coll Radiol). 2013;25(8):461-73.
12. Khoo V, Loblaw DA. Prostate cancer: current status, new developments and applications in radiotherapy. Clin Oncol (R Coll Radiol). 2013;25(8):449-50.
13. Turkbey B, Mena E, Aras O, Garvey B, Grant K, Choyke PL. Functional and molecular imaging: applications for diagnosis and staging of localised prostate cancer. Clin Oncol (R Coll Radiol). 2013;25(8):451-60.
14. Prestwich RJ, Vaidyanathan S, Scarsbrook AF. Functional Imaging Biomarkers: Potential to Guide an Individualised Approach to Radiotherapy. Clin Oncol (R Coll Radiol). 2015;27(10):588-600.
15. Khoo VS, Padhani AR, Tanner SF, Finnigan DJ, Leach MO, Dearnaley DP. Comparison of MRI with CT for the radiotherapy planning of prostate cancer: a feasibility study. Br J Radiol. 1999;72(858):590-7.
16. Rasch C, Barillot I, Remeijer P, Touw A, van Herk M, Lebesque JV. Definition of the prostate in CT and MRI: a multi-observer study. Int J Radiat Oncol Biol Phys. 1999;43(1):57-66.
17. Roach M, 3rd, Faillace-Akazawa P, Malfatti C, Holland J, Hricak H. Prostate volumes defined by magnetic resonance imaging and computerized tomographic scans for three-dimensional conformal radiotherapy. Int J Radiat Oncol Biol Phys. 1996;35(5):1011-8.
18. Sannazzari GL, Ragona R, Ruo Redda MG, Giglioli FR, Isolato G, Guarneri A. CT-MRI image fusion for delineation of volumes in three-dimensional conformal radiation therapy in the treatment of localized prostate cancer. Br J Radiol. 2002;75(895):603-7.

187
19. Sridharan S, Dal Pra A, Catton C, Bristow RG, Warde P. Locally advanced prostate cancer: current controversies and optimisation opportunities. Clin Oncol (R Coll Radiol). 2013;25(8):499-505.
20. Alonzi R. Functional Radiotherapy Targeting using Focused Dose Escalation. Clin Oncol (R Coll Radiol). 2015;27(10):601-17.
21. Padhani AR. Dynamic contrast-enhanced MRI in clinical oncology: current status and future directions. J Magn Reson Imaging. 2002;16(4):407-22.
22. Kurhanewicz J, Swanson MG, Nelson SJ, Vigneron DB. Combined magnetic resonance imaging and spectroscopic imaging approach to molecular imaging of prostate cancer. J Magn Reson Imaging. 2002;16(4):451-63.
23. Barentsz JO, Weinreb JC, Verma S, Thoeny HC, Tempany CM, Shtern F, et al. Synopsis of the PI-RADS v2 Guidelines for Multiparametric Prostate Magnetic Resonance Imaging and Recommendations for Use. Eur Urol. 2016;69(1):41-9.
24. Vargas HA, Hotker AM, Goldman DA, Moskowitz CS, Gondo T, Matsumoto K, et al. Updated prostate imaging reporting and data system (PIRADS v2) recommendations for the detection of clinically significant prostate cancer using multiparametric MRI: critical evaluation using whole-mount pathology as standard of reference. Eur Radiol. 2016;26(6):1606-12.
25. von Eyben FE, Kiljunen T, Kangasmaki A, Kairemo K, von Eyben R, Joensuu T. Radiotherapy Boost for the Dominant Intraprostatic Cancer Lesion-A Systematic Review and Meta-Analysis. Clin Genitourin Cancer. 2016;14(3):189-97.
26. Perna L, Fiorino C, Cozzarini C, Broggi S, Cattaneo GM, De Cobelli F, et al. Sparing the penile bulb in the radical irradiation of clinically localised prostate carcinoma: A comparison between MRI and CT prostatic apex definition in 3DCRT, Linac-IMRT and Helical Tomotherapy. Radiother Oncol. 2009;93(1):57-63.
27. Mazzola R, Fersino S, Fiorentino A, Ricchetti F, Giaj Levra N, Di Paola G, et al. The impact of prostate gland dimension in genitourinary toxicity after definitive prostate cancer treatment with moderate hypofractionation and volumetric modulated arc radiation therapy. Clin Transl Oncol. 2016;18(3):317-21.
28. Villeirs GM, Van Vaerenbergh K, Vakaet L, Bral S, Claus F, De Neve WJ, et al. Interobserver delineation variation using CT versus combined CT + MRI in intensity-modulated radiotherapy for prostate cancer. Strahlenther Onkol. 2005;181(7):424-30.
29. Parker CC, Damyanovich A, Haycocks T, Haider M, Bayley A, Catton CN. Magnetic resonance imaging in the radiation treatment planning of localized prostate cancer using intra-prostatic fiducial markers for computed tomography co-registration. Radiother Oncol. 2003;66(2):217-24.
30. Zamboglou C, Drendel V, Jilg CA, Rischke HC, Beck TI, Schultze-Seemann W, et al. Comparison of (68)Ga-HBED-CC PSMA-PET/CT and multiparametric MRI for gross tumour volume detection in patients with primary prostate cancer based on slice by slice comparison with histopathology. Theranostics. 2017;7(1):228-37.
31. Groenendaal G, Moman MR, Korporaal JG, van Diest PJ, van Vulpen M, Philippens ME, et al. Validation of functional imaging with pathology for tumor delineation in the prostate. Radiother Oncol. 2010;94(2):145-50.
32. Fortuin A, Rooij M, Zamecnik P, Haberkorn U, Barentsz J. Molecular and functional imaging for detection of lymph node metastases in prostate cancer. Int J Mol Sci. 2013;14(7):13842-75.
33. Chan J, Syndikus I, Mahmood S, Bell L, Vinjamuri S. Is choline PET useful for identifying intraprostatic tumour lesions? A literature review. Nucl Med Commun. 2015;36(9):871-80.
188
34. Roach PJ, Francis R, Emmett L, Hsiao E, Kneebone A, Hruby G, et al. The Impact of (68)Ga-PSMA PET/CT on Management Intent in Prostate Cancer: Results of an Australian Prospective Multicenter Study. J Nucl Med. 2018;59(1):82-8.
35. Zschaeck S, Lohaus F, Beck M, Habl G, Kroeze S, Zamboglou C, et al. PSMA-PET based radiotherapy: a review of initial experiences, survey on current practice and future perspectives. Radiat Oncol. 2018;13(1):90.
36. Eiber M, Weirich G, Holzapfel K, Souvatzoglou M, Haller B, Rauscher I, et al. Simultaneous (68)Ga-PSMA HBED-CC PET/MRI Improves the Localization of Primary Prostate Cancer. Eur Urol. 2016;70(5):829-36.
37. Zamboglou C, Thomann B, Koubar K, Bronsert P, Krauss T, Rischke HC, et al. Focal dose escalation for prostate cancer using (68)Ga-HBED-CC PSMA PET/CT and MRI: a planning study based on histology reference. Radiat Oncol. 2018;13(1):81.
38. Afaq A, Gleeson F, Scarsbrook A, Bradley K, Subesinghe M, Macpherson R, et al. UK guidelines on 18F-fluciclovine PET/CT in prostate cancer imaging. Nucl Med Commun. 2019.
39. Van den Bergh L, Koole M, Isebaert S, Joniau S, Deroose CM, Oyen R, et al. Is there an additional value of (1)(1)C-choline PET-CT to T2-weighted MRI images in the localization of intraprostatic tumor nodules? Int J Radiat Oncol Biol Phys. 2012;83(5):1486-92.
40. Souvatzoglou M, Weirich G, Schwarzenboeck S, Maurer T, Schuster T, Bundschuh RA, et al. The sensitivity of [11C]choline PET/CT to localize prostate cancer depends on the tumor configuration. Clin Cancer Res. 2011;17(11):3751-9.
41. Bundschuh RA, Wendl CM, Weirich G, Eiber M, Souvatzoglou M, Treiber U, et al. Tumour volume delineation in prostate cancer assessed by [11C]choline PET/CT: validation with surgical specimens. Eur J Nucl Med Mol Imaging. 2013;40(6):824-31.
42. Giovacchini G, Picchio M, Coradeschi E, Scattoni V, Bettinardi V, Cozzarini C, et al. [(11)C]choline uptake with PET/CT for the initial diagnosis of prostate cancer: relation to PSA levels, tumour stage and anti-androgenic therapy. European journal of nuclear medicine and molecular imaging. 2008;35(6):1065-73.
43. Farsad M, Schiavina R, Castellucci P, Nanni C, Corti B, Martorana G, et al. Detection and localization of prostate cancer: correlation of (11)C-choline PET/CT with histopathologic step-section analysis. Journal of nuclear medicine : official publication, Society of Nuclear Medicine. 2005;46(10):1642-9.
44. Martorana G, Schiavina R, Corti B, Farsad M, Salizzoni E, Brunocilla E, et al. 11C-choline positron emission tomography/computerized tomography for tumor localization of primary prostate cancer in comparison with 12-core biopsy. J Urol. 2006;176(3):954-60; discussion 60.
45. Testa C, Schiavina R, Lodi R, Salizzoni E, Corti B, Farsad M, et al. Prostate cancer: sextant localization with MR imaging, MR spectroscopy, and 11C-choline PET/CT. Radiology. 2007;244(3):797-806.
46. Piert M, Park H, Khan A, Siddiqui J, Hussain H, Chenevert T, et al. Detection of aggressive primary prostate cancer with 11C-choline PET/CT using multimodality fusion techniques. Journal of nuclear medicine : official publication, Society of Nuclear Medicine. 2009;50(10):1585-93.
47. Reske SN, Blumstein NM, Neumaier B, Gottfried H-W, Finsterbusch F, Kocot D, et al. Imaging prostate cancer with 11C-choline PET/CT. Journal of nuclear medicine : official publication, Society of Nuclear Medicine. 2006;47(8):1249-54.
48. Chang JH, Joon DL, Lee ST, Gong SJ, Scott AM, Davis ID, et al. Histopathological correlation of (11)C-choline PET scans for target volume definition in radical prostate radiotherapy. Radiotherapy

189
and oncology : journal of the European Society for Therapeutic Radiology and Oncology. 2011;99(2):187-92.
49. Schmid DT, John H, Zweifel R, Cservenyak T, Westera G, Goerres GW, et al. Fluorocholine PET/CT in patients with prostate cancer: initial experience. Radiology. 2005;235(2):623-8.
50. Kwee SA, Thibault GP, Stack RS, Coel MN, Furusato B, Sesterhenn IA. Use of step-section histopathology to evaluate 18F-fluorocholine PET sextant localization of prostate cancer. Molecular imaging.7(1):12-20.
51. Kwee SA, Wei H, Sesterhenn I, Yun D, Coel MN. Localization of primary prostate cancer with dual-phase 18F-fluorocholine PET. Journal of nuclear medicine : official publication, Society of Nuclear Medicine. 2006;47(2):262-9.
52. Hartenbach M, Hartenbach S, Bechtloff W, Danz B, Kraft K, Klemenz B, et al. Combined PET/MRI improves diagnostic accuracy in patients with prostate cancer: a prospective diagnostic trial. Clin Cancer Res. 2014;20(12):3244-53.
53. Pinaquy JB, De Clermont-Galleran H, Pasticier G, Rigou G, Alberti N, Hindie E, et al. Comparative effectiveness of [(18) F]-fluorocholine PET-CT and pelvic MRI with diffusion-weighted imaging for staging in patients with high-risk prostate cancer. Prostate. 2015;75(3):323-31.
54. Beheshti M, Imamovic L, Broinger G, Vali R, Waldenberger P, Stoiber F, et al. 18F choline PET/CT in the preoperative staging of prostate cancer in patients with intermediate or high risk of extracapsular disease: a prospective study of 130 patients. Radiology. 2010;254(3):925-33.
55. Yamaguchi T, Lee J, Uemura H, Sasaki T, Takahashi N, Oka T, et al. Prostate cancer: a comparative study of 11C-choline PET and MR imaging combined with proton MR spectroscopy. Eur J Nucl Med Mol Imaging. 2005;32(7):742-8.
56. Budiharto T, Joniau S, Lerut E, Van den Bergh L, Mottaghy F, Deroose CM, et al. Prospective evaluation of 11C-choline positron emission tomography/computed tomography and diffusion-weighted magnetic resonance imaging for the nodal staging of prostate cancer with a high risk of lymph node metastases. Eur Urol. 2011;60(1):125-30.
57. Vallini V, Ortori S, Boraschi P, Manassero F, Gabelloni M, Faggioni L, et al. Staging of pelvic lymph nodes in patients with prostate cancer: Usefulness of multiple b value SE-EPI diffusion-weighted imaging on a 3.0 T MR system. Eur J Radiol Open. 2016;3:16-21.
58. Sankineni S, Brown AM, Fascelli M, Law YM, Pinto PA, Choyke PL, et al. Lymph node staging in prostate cancer. Curr Urol Rep. 2015;16(5):30.
59. Thoeny HC, Barbieri S, Froehlich JM, Turkbey B, Choyke PL. Functional and Targeted Lymph Node Imaging in Prostate Cancer: Current Status and Future Challenges. Radiology. 2017;285(3):728-43.
60. Evangelista L, Briganti A, Fanti S, Joniau S, Reske S, Schiavina R, et al. New Clinical Indications for F/C-choline, New Tracers for Positron Emission Tomography and a Promising Hybrid Device for Prostate Cancer Staging: A Systematic Review of the Literature. Eur Urol. 2016.
61. Poulsen MH, Bouchelouche K, Høilund-Carlsen PF, Petersen H, Gerke O, Steffansen SI, et al. [18F]fluoromethylcholine (FCH) positron emission tomography/computed tomography (PET/CT) for lymph node staging of prostate cancer: a prospective study of 210 patients. BJU international. 2012;110(11):1666-71.
62. Evangelista L, Cimitan M, Zattoni F, Guttilla A, Zattoni F, Saladini G. Comparison between conventional imaging (abdominal-pelvic computed tomography and bone scan) and [(18)F]choline positron emission tomography/computed tomography imaging for the initial staging of patients with intermediate- tohigh-risk prostate cancer: A retrospective analysis. Scand J Urol. 2015;49(5):345-53.

190
63. Heck MM, Retz M, Bandur M, Souchay M, Vitzthum E, Weirich G, et al. Topography of lymph node metastases in prostate cancer patients undergoing radical prostatectomy and extended lymphadenectomy: results of a combined molecular and histopathologic mapping study. Eur Urol. 2014;66(2):222-9.
64. Joniau S, Van den Bergh L, Lerut E, Deroose CM, Haustermans K, Oyen R, et al. Mapping of pelvic lymph node metastases in prostate cancer. Eur Urol. 2013;63(3):450-8.
65. Abdollah F, Cozzarini C, Sun M, Suardi N, Gallina A, Passoni NM, et al. Assessing the most accurate formula to predict the risk of lymph node metastases from prostate cancer in contemporary patients treated with radical prostatectomy and extended pelvic lymph node dissection. Radiother Oncol. 2013;109(2):211-6.
66. Rahman S, Cosmatos H, Dave G, Williams S, Tome M. Predicting pelvic lymph node involvement in current-era prostate cancer. Int J Radiat Oncol Biol Phys. 2012;82(2):906-10.
67. Eifler JB, Feng Z, Lin BM, Partin MT, Humphreys EB, Han M, et al. An updated prostate cancer staging nomogram (Partin tables) based on cases from 2006 to 2011. BJU Int. 2013;111(1):22-9.
68. Cagiannos I, Karakiewicz P, Eastham JA, Ohori M, Rabbani F, Gerigk C, et al. A preoperative nomogram identifying decreased risk of positive pelvic lymph nodes in patients with prostate cancer. J Urol. 2003;170(5):1798-803.
69. Briganti A, Larcher A, Abdollah F, Capitanio U, Gallina A, Suardi N, et al. Updated nomogram predicting lymph node invasion in patients with prostate cancer undergoing extended pelvic lymph node dissection: the essential importance of percentage of positive cores. Eur Urol. 2012;61(3):480-7.
70. Cimino S, Reale G, Castelli T, Favilla V, Giardina R, Russo GI, et al. Comparison between Briganti, Partin and MSKCC tools in predicting positive lymph nodes in prostate cancer: a systematic review and meta-analysis. Scand J Urol. 2017;51(5):345-50.
71. Payne H, Mason M. Androgen deprivation therapy as adjuvant/neoadjuvant to radiotherapy for high-risk localised and locally advanced prostate cancer: recent developments. Br J Cancer. 2011;105(11):1628-34.
72. Wo JY, Zietman AL. Why does androgen deprivation enhance the results of radiation therapy? Urol Oncol. 2008;26(5):522-9.
73. Widmark A, Klepp O, Solberg A, Damber JE, Angelsen A, Fransson P, et al. Endocrine treatment, with or without radiotherapy, in locally advanced prostate cancer (SPCG-7/SFUO-3): an open randomised phase III trial. Lancet. 2009;373(9660):301-8.
74. Bourke L, Kirkbride P, Hooper R, Rosario AJ, Chico TJ, Rosario DJ. Endocrine therapy in prostate cancer: time for reappraisal of risks, benefits and cost-effectiveness? Br J Cancer. 2013;108(1):9-13.
75. Mohiuddin JJ, Baker BR, Chen RC. Radiotherapy for high-risk prostate cancer. Nat Rev Urol. 2015;12(3):145-54.
76. Studer UE, Whelan P, Wimpissinger F, Casselman J, de Reijke TM, Knonagel H, et al. Differences in time to disease progression do not predict for cancer-specific survival in patients receiving immediate or deferred androgen-deprivation therapy for prostate cancer: final results of EORTC randomized trial 30891 with 12 years of follow-up. Eur Urol. 2014;66(5):829-38.
77. Lu-Yao GL, Albertsen PC, Moore DF, Shih W, Lin Y, DiPaola RS, et al. Survival following primary androgen deprivation therapy among men with localized prostate cancer. JAMA. 2008;300(2):173-81.
191
78. Iversen P, Tyrrell CJ, Kaisary AV, Anderson JB, Van Poppel H, Tammela TL, et al. Bicalutamide monotherapy compared with castration in patients with nonmetastatic locally advanced prostate cancer: 6.3 years of followup. J Urol. 2000;164(5):1579-82.
79. Iversen P, Johansson JE, Lodding P, Kylmala T, Lundmo P, Klarskov P, et al. Bicalutamide 150 mg in addition to standard care for patients with early non-metastatic prostate cancer: updated results from the Scandinavian Prostate Cancer Period Group-6 Study after a median follow-up period of 7.1 years. Scand J Urol Nephrol. 2006;40(6):441-52.
80. Pilepich MV, Winter K, Lawton CA, Krisch RE, Wolkov HB, Movsas B, et al. Androgen suppression adjuvant to definitive radiotherapy in prostate carcinoma--long-term results of phase III RTOG 85-31. Int J Radiat Oncol Biol Phys. 2005;61(5):1285-90.
81. Roach M, 3rd, Bae K, Speight J, Wolkov HB, Rubin P, Lee RJ, et al. Short-term neoadjuvant androgen deprivation therapy and external-beam radiotherapy for locally advanced prostate cancer: long-term results of RTOG 8610. J Clin Oncol. 2008;26(4):585-91.
82. Bolla M, Van Tienhoven G, Warde P, Dubois JB, Mirimanoff RO, Storme G, et al. External irradiation with or without long-term androgen suppression for prostate cancer with high metastatic risk: 10-year results of an EORTC randomised study. Lancet Oncol. 2010;11(11):1066-73.
83. Denham JW, Steigler A, Lamb DS, Joseph D, Turner S, Matthews J, et al. Short-term neoadjuvant androgen deprivation and radiotherapy for locally advanced prostate cancer: 10-year data from the TROG 96.01 randomised trial. Lancet Oncol. 2011;12(5):451-9.
84. Bolla M, de Reijke TM, Van Tienhoven G, Van den Bergh AC, Oddens J, Poortmans PM, et al. Duration of androgen suppression in the treatment of prostate cancer. N Engl J Med. 2009;360(24):2516-27.
85. Horwitz EM, Bae K, Hanks GE, Porter A, Grignon DJ, Brereton HD, et al. Ten-year follow-up of radiation therapy oncology group protocol 92-02: a phase III trial of the duration of elective androgen deprivation in locally advanced prostate cancer. J Clin Oncol. 2008;26(15):2497-504.
86. Zapatero A, Guerrero A, Maldonado X, Alvarez A, Gonzalez San Segundo C, Cabeza Rodriguez MA, et al. High-dose radiotherapy with short-term or long-term androgen deprivation in localised prostate cancer (DART01/05 GICOR): a randomised, controlled, phase 3 trial. Lancet Oncol. 2015;16(3):320-7.
87. Tree AC, Alexander EJ, Van As NJ, Dearnaley DP, Khoo V. Biological dose escalation and hypofractionation: what is there to be gained and how will it best be done? Clin Oncol (R Coll Radiol). 2013;25(8):483-98.
88. Zhao S, Urdaneta AI, Anscher MS. The role of androgen deprivation therapy plus radiation therapy in patients with non-metastatic prostate cancer. Expert Rev Anticancer Ther. 2016;16(9):929-42.
89. Caram ME, Skolarus TA, Cooney KA. Limitations of Prostate-specific Antigen Testing After a Prostate Cancer Diagnosis. Eur Urol. 2016;70(2):209-10.
90. Nguyen PL, Je Y, Schutz FA, Hoffman KE, Hu JC, Parekh A, et al. Association of androgen deprivation therapy with cardiovascular death in patients with prostate cancer: a meta-analysis of randomized trials. JAMA. 2011;306(21):2359-66.
91. D'Amico AV, Denham JW, Crook J, Chen MH, Goldhaber SZ, Lamb DS, et al. Influence of androgen suppression therapy for prostate cancer on the frequency and timing of fatal myocardial infarctions. J Clin Oncol. 2007;25(17):2420-5.
192
92. Juloori A, Shah C, Stephans K, Vassil A, Tendulkar R. Evolving Paradigm of Radiotherapy for High-Risk Prostate Cancer: Current Consensus and Continuing Controversies. Prostate Cancer. 2016;2016:2420786.
93. Ahmed HU, Cathcart P, McCartan N, Kirkham A, Allen C, Freeman A, et al. Focal salvage therapy for localized prostate cancer recurrence after external beam radiotherapy: a pilot study. Cancer. 2012;118(17):4148-55.
94. Ferrera G, Mortellaro G, Mannino M, Caminiti G, Spera A, Figlia V, et al. Moderate hypofractionation and simultaneous integrated boost by helical tomotherapy in prostate cancer: monoinstitutional report of acute tolerability assessment with different toxicity scales. Radiol Med. 2015;120(12):1170-6.
95. Hoskin P. Radiotherapy in practice : external beam therapy2014.
96. Budaus L, Bolla M, Bossi A, Cozzarini C, Crook J, Widmark A, et al. Functional outcomes and complications following radiation therapy for prostate cancer: a critical analysis of the literature. Eur Urol. 2012;61(1):112-27.
97. Emami B, Lyman J, Brown A, Coia L, Goitein M, Munzenrider JE, et al. Tolerance of normal tissue to therapeutic irradiation. Int J Radiat Oncol Biol Phys. 1991;21(1):109-22.
98. Dearnaley D, Syndikus I, Sumo G, Bidmead M, Bloomfield D, Clark C, et al. Conventional versus hypofractionated high-dose intensity-modulated radiotherapy for prostate cancer: preliminary safety results from the CHHiP randomised controlled trial. Lancet Oncol. 2012;13(1):43-54.
99. Mangar SA, Sydes MR, Tucker HL, Coffey J, Sohaib SA, Gianolini S, et al. Evaluating the relationship between erectile dysfunction and dose received by the penile bulb: using data from a randomised controlled trial of conformal radiotherapy in prostate cancer (MRC RT01, ISRCTN47772397). Radiother Oncol. 2006;80(3):355-62.
100. Roach M, Winter K, Michalski JM, Cox JD, Purdy JA, Bosch W, et al. Penile bulb dose and impotence after three-dimensional conformal radiotherapy for prostate cancer on RTOG 9406: findings from a prospective, multi-institutional, phase I/II dose-escalation study. Int J Radiat Oncol Biol Phys. 2004;60(5):1351-6.
101. Miralbell R, Molla M, Rouzaud M, Hidalgo A, Toscas JI, Lozano J, et al. Hypofractionated boost to the dominant tumor region with intensity modulated stereotactic radiotherapy for prostate cancer: a sequential dose escalation pilot study. Int J Radiat Oncol Biol Phys. 2010;78(1):50-7.
102. Pinkawa M, Siluschek J, Gagel B, Demirel C, Asadpour B, Holy R, et al. Influence of the initial rectal distension on posterior margins in primary and postoperative radiotherapy for prostate cancer. Radiother Oncol. 2006;81(3):284-90.
103. Langen KM, Willoughby TR, Meeks SL, Santhanam A, Cunningham A, Levine L, et al. Observations on real-time prostate gland motion using electromagnetic tracking. Int J Radiat Oncol Biol Phys. 2008;71(4):1084-90.
104. Tanyi JA, He T, Summers PA, Mburu RG, Kato CM, Rhodes SM, et al. Assessment of planning target volume margins for intensity-modulated radiotherapy of the prostate gland: role of daily inter- and intrafraction motion. Int J Radiat Oncol Biol Phys. 2010;78(5):1579-85.
105. Onishi H, Kuriyama K, Komiyama T, Marino K, Araya M, Saito R, et al. Large prostate motion produced by anal contraction. Radiother Oncol. 2012;104(3):390-4.
106. Rudat V, Nour A, Hammoud M, Alaradi A, Mohammed A. Image-guided intensity-modulated radiotherapy of prostate cancer: Analysis of interfractional errors and acute toxicity. Strahlenther Onkol. 2016;192(2):109-17.
193
107. Ahmed HU, Dickinson L, Charman S, Weir S, McCartan N, Hindley RG, et al. Focal Ablation Targeted to the Index Lesion in Multifocal Localised Prostate Cancer: a Prospective Development Study. Eur Urol. 2015;68(6):927-36.
108. Di Muzio NG, Fodor A, Noris Chiorda B, Broggi S, Mangili P, Valdagni R, et al. Moderate Hypofractionation with Simultaneous Integrated Boost in Prostate Cancer: Long-term Results of a Phase I-II Study. Clin Oncol (R Coll Radiol). 2016;28(8):490-500.
109. Warde P, Mason M, Ding K, Kirkbride P, Brundage M, Cowan R, et al. Combined androgen deprivation therapy and radiation therapy for locally advanced prostate cancer: a randomised, phase 3 trial. Lancet. 2011;378(9809):2104-11.
110. Mason MD, Parulekar WR, Sydes MR, Brundage M, Kirkbride P, Gospodarowicz M, et al. Final Report of the Intergroup Randomized Study of Combined Androgen-Deprivation Therapy Plus Radiotherapy Versus Androgen-Deprivation Therapy Alone in Locally Advanced Prostate Cancer. J Clin Oncol. 2015;33(19):2143-50.
111. Mottet N, Peneau M, Mazeron JJ, Molinie V, Richaud P. Addition of radiotherapy to long-term androgen deprivation in locally advanced prostate cancer: an open randomised phase 3 trial. Eur Urol. 2012;62(2):213-9.
112. James ND, Spears MR, Clarke NW, Dearnaley DP, Mason MD, Parker CC, et al. Failure-Free Survival and Radiotherapy in Patients With Newly Diagnosed Nonmetastatic Prostate Cancer: Data From Patients in the Control Arm of the STAMPEDE Trial. JAMA Oncol. 2016;2(3):348-57.
113. Zelefsky MJ, Yamada Y, Fuks Z, Zhang Z, Hunt M, Cahlon O, et al. Long-term results of conformal radiotherapy for prostate cancer: impact of dose escalation on biochemical tumor control and distant metastases-free survival outcomes. Int J Radiat Oncol Biol Phys. 2008;71(4):1028-33.
114. Kalbasi A, Li J, Berman A, Swisher-McClure S, Smaldone M, Uzzo RG, et al. Dose-Escalated Irradiation and Overall Survival in Men With Nonmetastatic Prostate Cancer. JAMA Oncol. 2015;1(7):897-906.
115. Dearnaley DP, Jovic G, Syndikus I, Khoo V, Cowan RA, Graham JD, et al. Escalated-dose versus control-dose conformal radiotherapy for prostate cancer: long-term results from the MRC RT01 randomised controlled trial. Lancet Oncol. 2014;15(4):464-73.
116. Hou Z, Li G, Bai S. High dose versus conventional dose in external beam radiotherapy of prostate cancer: a meta-analysis of long-term follow-up. J Cancer Res Clin Oncol. 2015;141(6):1063-71.
117. Kuban DA, Tucker SL, Dong L, Starkschall G, Huang EH, Cheung MR, et al. Long-term results of the M. D. Anderson randomized dose-escalation trial for prostate cancer. Int J Radiat Oncol Biol Phys. 2008;70(1):67-74.
118. Pollack A, Zagars GK, Starkschall G, Childress CH, Kopplin S, Boyer AL, et al. Conventional vs. conformal radiotherapy for prostate cancer: preliminary results of dosimetry and acute toxicity. Int J Radiat Oncol Biol Phys. 1996;34(3):555-64.
119. Pollack A, Zagars GK, Starkschall G, Antolak JA, Lee JJ, Huang E, et al. Prostate cancer radiation dose response: results of the M. D. Anderson phase III randomized trial. Int J Radiat Oncol Biol Phys. 2002;53(5):1097-105.
120. Heemsbergen WD, Al-Mamgani A, Slot A, Dielwart MF, Lebesque JV. Long-term results of the Dutch randomized prostate cancer trial: impact of dose-escalation on local, biochemical, clinical failure, and survival. Radiother Oncol. 2014;110(1):104-9.
194
121. Peeters ST, Heemsbergen WD, Koper PC, van Putten WL, Slot A, Dielwart MF, et al. Dose-response in radiotherapy for localized prostate cancer: results of the Dutch multicenter randomized phase III trial comparing 68 Gy of radiotherapy with 78 Gy. J Clin Oncol. 2006;24(13):1990-6.
122. Peeters ST, Heemsbergen WD, van Putten WL, Slot A, Tabak H, Mens JW, et al. Acute and late complications after radiotherapy for prostate cancer: results of a multicenter randomized trial comparing 68 Gy to 78 Gy. Int J Radiat Oncol Biol Phys. 2005;61(4):1019-34.
123. Al-Mamgani A, van Putten WL, Heemsbergen WD, van Leenders GJ, Slot A, Dielwart MF, et al. Update of Dutch multicenter dose-escalation trial of radiotherapy for localized prostate cancer. Int J Radiat Oncol Biol Phys. 2008;72(4):980-8.
124. Zietman AL, Bae K, Slater JD, Shipley WU, Efstathiou JA, Coen JJ, et al. Randomized trial comparing conventional-dose with high-dose conformal radiation therapy in early-stage adenocarcinoma of the prostate: long-term results from proton radiation oncology group/american college of radiology 95-09. J Clin Oncol. 2010;28(7):1106-11.
125. Beckendorf V, Guerif S, Le Prise E, Cosset JM, Bougnoux A, Chauvet B, et al. 70 Gy versus 80 Gy in localized prostate cancer: 5-year results of GETUG 06 randomized trial. Int J Radiat Oncol Biol Phys. 2011;80(4):1056-63.
126. Dearnaley DP, Sydes MR, Graham JD, Aird EG, Bottomley D, Cowan RA, et al. Escalated-dose versus standard-dose conformal radiotherapy in prostate cancer: first results from the MRC RT01 randomised controlled trial. Lancet Oncol. 2007;8(6):475-87.
127. Dearnaley DP, Sydes MR, Langley RE, Graham JD, Huddart RA, Syndikus I, et al. The early toxicity of escalated versus standard dose conformal radiotherapy with neo-adjuvant androgen suppression for patients with localised prostate cancer: results from the MRC RT01 trial (ISRCTN47772397). Radiother Oncol. 2007;83(1):31-41.
128. Michalski JM, Moughan J, Purdy JA, Bosch WR, Bahary J, Lau H, et al. Initial Results of a Phase 3 Randomized Study of High Dose 3DCRT/IMRT versus Standard Dose 3D-CRT/IMRT in Patients Treated for Localized Prostate Cancer (RTOG 0126). International Journal of Radiation Oncology • Biology • Physics.90(5):1263.
129. Benjamin LC, Tree AC, Dearnaley DP. The Role of Hypofractionated Radiotherapy in Prostate Cancer. Curr Oncol Rep. 2017;19(4):30.
130. Nahum AE. The radiobiology of hypofractionation. Clin Oncol (R Coll Radiol). 2015;27(5):260-9.
131. Gulliford S, Hall E, Dearnaley D. Hypofractionation trials and radiobiology of prostate cancer. Oncoscience. 2017;4(3-4):27-8.
132. Hoffman KE, Skinner H, Pugh TJ, Voong KR, Levy LB, Choi S, et al. Patient-reported Urinary, Bowel, and Sexual Function After Hypofractionated Intensity-modulated Radiation Therapy for Prostate Cancer: Results From a Randomized Trial. Am J Clin Oncol. 2016.
133. Hoffman KE, Voong KR, Levy LB, Allen PK, Choi S, Schlembach PJ, et al. Randomized Trial of Hypofractionated, Dose-Escalated, Intensity-Modulated Radiation Therapy (IMRT) Versus Conventionally Fractionated IMRT for Localized Prostate Cancer. J Clin Oncol. 2018;36(29):2943-9.
134. Pollack A, Walker G, Horwitz EM, Price R, Feigenberg S, Konski AA, et al. Randomized trial of hypofractionated external-beam radiotherapy for prostate cancer. J Clin Oncol. 2013;31(31):3860-8.
135. Lee WR, Dignam JJ, Amin MB, Bruner DW, Low D, Swanson GP, et al. Randomized Phase III Noninferiority Study Comparing Two Radiotherapy Fractionation Schedules in Patients With Low-Risk Prostate Cancer. J Clin Oncol. 2016;34(20):2325-32.
195
136. Catton CN, Lukka H, Gu CS, Martin JM, Supiot S, Chung PWM, et al. Randomized Trial of a Hypofractionated Radiation Regimen for the Treatment of Localized Prostate Cancer. J Clin Oncol. 2017;35(17):1884-90.
137. Aluwini S, Pos F, Schimmel E, van Lin E, Krol S, van der Toorn PP, et al. Hypofractionated versus conventionally fractionated radiotherapy for patients with prostate cancer (HYPRO): acute toxicity results from a randomised non-inferiority phase 3 trial. Lancet Oncol. 2015;16(3):274-83.
138. Sanguineti G, Arcidiacono F, Landoni V, Saracino BM, Farneti A, Arcangeli S, et al. Macroscopic Hematuria After Conventional or Hypofractionated Radiation Therapy: Results From a Prospective Phase 3 Study. Int J Radiat Oncol Biol Phys. 2016;96(2):304-12.
139. Dearnaley D, Hall E. How will the CHHiP trial affect the future of prostate radiotherapy? Expert Rev Anticancer Ther. 2018;18(7):607-9.
140. Dearnaley D, Syndikus I, Gulliford S, Hall E. Hypofractionation for Prostate Cancer: Time to Change. Clin Oncol (R Coll Radiol). 2017;29(1):3-5.
141. Hoffman KE, Voong KR, Pugh TJ, Skinner H, Levy LB, Takiar V, et al. Risk of late toxicity in men receiving dose-escalated hypofractionated intensity modulated prostate radiation therapy: results from a randomized trial. Int J Radiat Oncol Biol Phys. 2014;88(5):1074-84.
142. Arcangeli G, Fowler J, Gomellini S, Arcangeli S, Saracino B, Petrongari MG, et al. Acute and late toxicity in a randomized trial of conventional versus hypofractionated three-dimensional conformal radiotherapy for prostate cancer. Int J Radiat Oncol Biol Phys. 2011;79(4):1013-21.
143. Arcangeli S, Strigari L, Gomellini S, Saracino B, Petrongari MG, Pinnaro P, et al. Updated results and patterns of failure in a randomized hypofractionation trial for high-risk prostate cancer. Int J Radiat Oncol Biol Phys. 2012;84(5):1172-8.
144. Lieng H, Pintilie M, Bayley A, Berlin A, Bristow R, Chung P, et al. Long-term outcomes of a phase II trial of moderate hypofractionated image-guided intensity modulated radiotherapy (IG-IMRT) for localized prostate cancer. Radiother Oncol. 2017;122(1):93-8.
145. Aluwini S, Pos F, Schimmel E, Krol S, van der Toorn PP, de Jager H, et al. Hypofractionated versus conventionally fractionated radiotherapy for patients with prostate cancer (HYPRO): late toxicity results from a randomised, non-inferiority, phase 3 trial. Lancet Oncol. 2016;17(4):464-74.
146. Incrocci L, Wortel RC, Alemayehu WG, Aluwini S, Schimmel E, Krol S, et al. Hypofractionated versus conventionally fractionated radiotherapy for patients with localised prostate cancer (HYPRO): final efficacy results from a randomised, multicentre, open-label, phase 3 trial. Lancet Oncol. 2016;17(8):1061-9.
147. Cellini N, Morganti AG, Mattiucci GC, Valentini V, Leone M, Luzi S, et al. Analysis of intraprostatic failures in patients treated with hormonal therapy and radiotherapy: implications for conformal therapy planning. Int J Radiat Oncol Biol Phys. 2002;53(3):595-9.
148. Arrayeh E, Westphalen AC, Kurhanewicz J, Roach M, 3rd, Jung AJ, Carroll PR, et al. Does local recurrence of prostate cancer after radiation therapy occur at the site of primary tumor? Results of a longitudinal MRI and MRSI study. Int J Radiat Oncol Biol Phys. 2012;82(5):e787-93.
149. Korsager AS, Carl J, Riis Ostergaard L. Comparison of manual and automatic MR-CT registration for radiotherapy of prostate cancer. J Appl Clin Med Phys. 2016;17(3):294-303.
150. Harris VA, Staffurth J, Naismith O, Esmail A, Gulliford S, Khoo V, et al. Consensus Guidelines and Contouring Atlas for Pelvic Node Delineation in Prostate and Pelvic Node Intensity Modulated Radiation Therapy. Int J Radiat Oncol Biol Phys. 2015;92(4):874-83.
196
151. Hafeez S, Warren-Oseni K, McNair HA, Hansen VN, Jones K, Tan M, et al. Prospective Study Delivering Simultaneous Integrated High-dose Tumor Boost (</=70 Gy) With Image Guided Adaptive Radiation Therapy for Radical Treatment of Localized Muscle-Invasive Bladder Cancer. Int J Radiat Oncol Biol Phys. 2016;94(5):1022-30.
152. Gregoire V, Langendijk JA, Nuyts S. Advances in Radiotherapy for Head and Neck Cancer. J Clin Oncol. 2015;33(29):3277-84.
153. Onal C, Sonmez S, Erbay G, Guler OC, Arslan G. Simultaneous integrated boost to intraprostatic lesions using different energy levels of intensity-modulated radiotherapy and volumetric-arc therapy. Br J Radiol. 2014;87(1034):20130617.
154. Riches SF, Payne GS, Desouza NM, Dearnaley D, Morgan VA, Morgan SC, et al. Effect on therapeutic ratio of planning a boosted radiotherapy dose to the dominant intraprostatic tumour lesion within the prostate based on multifunctional MR parameters. Br J Radiol. 2014;87(1037):20130813.
155. Bossart EL, Stoyanova R, Sandler K, Studenski M, Orman A, Abramowitz M, et al. Feasibility and Initial Dosimetric Findings for a Randomized Trial Using Dose-Painted Multiparametric Magnetic Resonance Imaging-Defined Targets in Prostate Cancer. Int J Radiat Oncol Biol Phys. 2016;95(2):827-34.
156. Kuang Y, Wu L, Hirata E, Miyazaki K, Sato M, Kwee SA. Volumetric modulated arc therapy planning for primary prostate cancer with selective intraprostatic boost determined by 18F-choline PET/CT. Int J Radiat Oncol Biol Phys. 2015;91(5):1017-25.
157. Wong WW, Schild SE, Vora SA, Ezzell GA, Nguyen BD, Ram PC, et al. Image-guided radiotherapy for prostate cancer: a prospective trial of concomitant boost using indium-111-capromab pendetide (ProstaScint) imaging. Int J Radiat Oncol Biol Phys. 2011;81(4):e423-9.
158. Schild MH, Schild SE, Wong WW, Vora SA, Silva AC, Silva AM, et al. Early Outcome of Prostate Intensity Modulated Radiation Therapy (IMRT) Incorporating a Simultaneous Intra-Prostatic MRI Directed Boost. OMICS J Radiol. 2014;3(4).
159. Pinkawa M, Piroth MD, Holy R, Klotz J, Djukic V, Corral NE, et al. Dose-escalation using intensity-modulated radiotherapy for prostate cancer - evaluation of quality of life with and without (18)F-choline PET-CT detected simultaneous integrated boost. Radiation oncology (London, England). 2012;7:14-.
160. Ippolito E, Mantini G, Morganti AG, Mazzeo E, Padula GD, Digesu C, et al. Intensity-modulated radiotherapy with simultaneous integrated boost to dominant intraprostatic lesion: preliminary report on toxicity. Am J Clin Oncol. 2012;35(2):158-62.
161. Onjukka E, Uzan J, Baker C, Howard L, Nahum A, Syndikus I. Twenty Fraction Prostate Radiotherapy with Intra-prostatic Boost: Results of a Pilot Study. Clin Oncol (R Coll Radiol). 2017;29(1):6-14.
162. Feutren T, Herrera FG. Prostate irradiation with focal dose escalation to the intraprostatic dominant nodule: a systematic review. Prostate Int. 2018;6(3):75-87.
163. Shah TT, Peters M, Eldred-Evans D, Miah S, Yap T, Faure-Walker NA, et al. Early-Medium-Term Outcomes of Primary Focal Cryotherapy to Treat Nonmetastatic Clinically Significant Prostate Cancer from a Prospective Multicentre Registry. Eur Urol. 2019;76(1):98-105.
164. Guillaumier S, Peters M, Arya M, Afzal N, Charman S, Dudderidge T, et al. A Multicentre Study of 5-year Outcomes Following Focal Therapy in Treating Clinically Significant Nonmetastatic Prostate Cancer. Eur Urol. 2018;74(4):422-9.
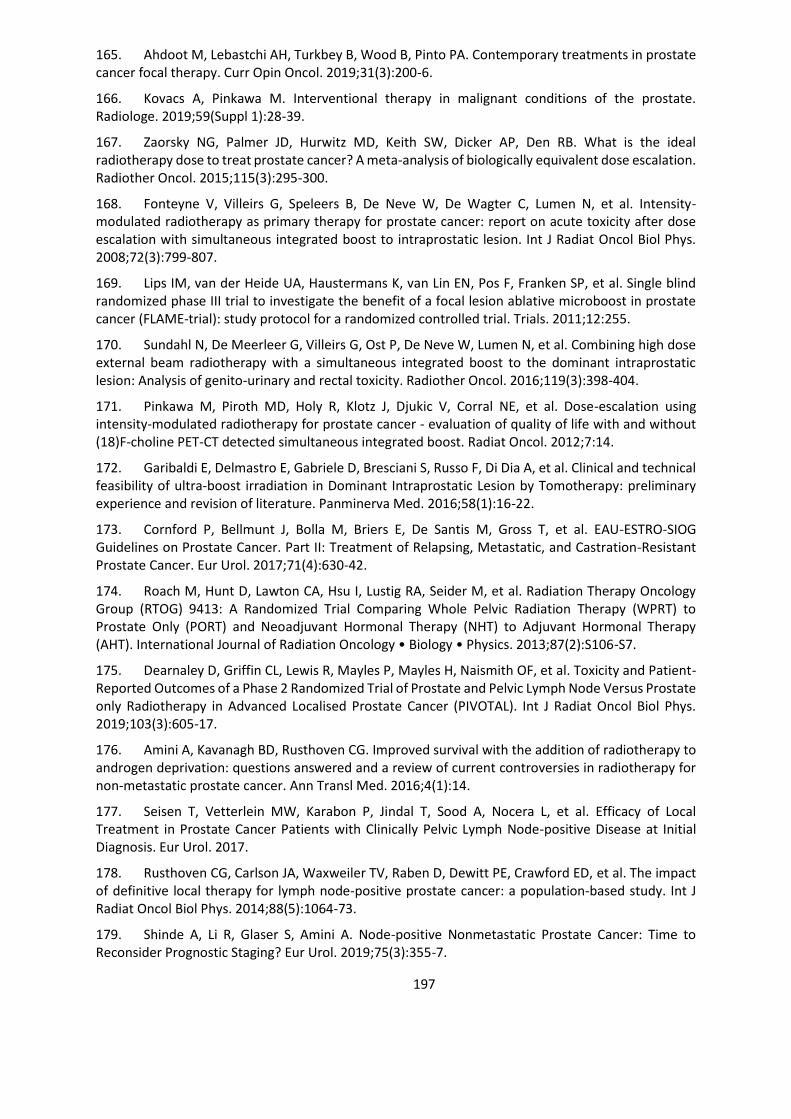
197
165. Ahdoot M, Lebastchi AH, Turkbey B, Wood B, Pinto PA. Contemporary treatments in prostate cancer focal therapy. Curr Opin Oncol. 2019;31(3):200-6.
166. Kovacs A, Pinkawa M. Interventional therapy in malignant conditions of the prostate. Radiologe. 2019;59(Suppl 1):28-39.
167. Zaorsky NG, Palmer JD, Hurwitz MD, Keith SW, Dicker AP, Den RB. What is the ideal radiotherapy dose to treat prostate cancer? A meta-analysis of biologically equivalent dose escalation. Radiother Oncol. 2015;115(3):295-300.
168. Fonteyne V, Villeirs G, Speleers B, De Neve W, De Wagter C, Lumen N, et al. Intensity-modulated radiotherapy as primary therapy for prostate cancer: report on acute toxicity after dose escalation with simultaneous integrated boost to intraprostatic lesion. Int J Radiat Oncol Biol Phys. 2008;72(3):799-807.
169. Lips IM, van der Heide UA, Haustermans K, van Lin EN, Pos F, Franken SP, et al. Single blind randomized phase III trial to investigate the benefit of a focal lesion ablative microboost in prostate cancer (FLAME-trial): study protocol for a randomized controlled trial. Trials. 2011;12:255.
170. Sundahl N, De Meerleer G, Villeirs G, Ost P, De Neve W, Lumen N, et al. Combining high dose external beam radiotherapy with a simultaneous integrated boost to the dominant intraprostatic lesion: Analysis of genito-urinary and rectal toxicity. Radiother Oncol. 2016;119(3):398-404.
171. Pinkawa M, Piroth MD, Holy R, Klotz J, Djukic V, Corral NE, et al. Dose-escalation using intensity-modulated radiotherapy for prostate cancer - evaluation of quality of life with and without (18)F-choline PET-CT detected simultaneous integrated boost. Radiat Oncol. 2012;7:14.
172. Garibaldi E, Delmastro E, Gabriele D, Bresciani S, Russo F, Di Dia A, et al. Clinical and technical feasibility of ultra-boost irradiation in Dominant Intraprostatic Lesion by Tomotherapy: preliminary experience and revision of literature. Panminerva Med. 2016;58(1):16-22.
173. Cornford P, Bellmunt J, Bolla M, Briers E, De Santis M, Gross T, et al. EAU-ESTRO-SIOG Guidelines on Prostate Cancer. Part II: Treatment of Relapsing, Metastatic, and Castration-Resistant Prostate Cancer. Eur Urol. 2017;71(4):630-42.
174. Roach M, Hunt D, Lawton CA, Hsu I, Lustig RA, Seider M, et al. Radiation Therapy Oncology Group (RTOG) 9413: A Randomized Trial Comparing Whole Pelvic Radiation Therapy (WPRT) to Prostate Only (PORT) and Neoadjuvant Hormonal Therapy (NHT) to Adjuvant Hormonal Therapy (AHT). International Journal of Radiation Oncology • Biology • Physics. 2013;87(2):S106-S7.
175. Dearnaley D, Griffin CL, Lewis R, Mayles P, Mayles H, Naismith OF, et al. Toxicity and Patient-Reported Outcomes of a Phase 2 Randomized Trial of Prostate and Pelvic Lymph Node Versus Prostate only Radiotherapy in Advanced Localised Prostate Cancer (PIVOTAL). Int J Radiat Oncol Biol Phys. 2019;103(3):605-17.
176. Amini A, Kavanagh BD, Rusthoven CG. Improved survival with the addition of radiotherapy to androgen deprivation: questions answered and a review of current controversies in radiotherapy for non-metastatic prostate cancer. Ann Transl Med. 2016;4(1):14.
177. Seisen T, Vetterlein MW, Karabon P, Jindal T, Sood A, Nocera L, et al. Efficacy of Local Treatment in Prostate Cancer Patients with Clinically Pelvic Lymph Node-positive Disease at Initial Diagnosis. Eur Urol. 2017.
178. Rusthoven CG, Carlson JA, Waxweiler TV, Raben D, Dewitt PE, Crawford ED, et al. The impact of definitive local therapy for lymph node-positive prostate cancer: a population-based study. Int J Radiat Oncol Biol Phys. 2014;88(5):1064-73.
179. Shinde A, Li R, Glaser S, Amini A. Node-positive Nonmetastatic Prostate Cancer: Time to Reconsider Prognostic Staging? Eur Urol. 2019;75(3):355-7.

198
180. Norkus D, Karklelyte A, Engels B, Versmessen H, Griskevicius R, De Ridder M, et al. A randomized hypofractionation dose escalation trial for high risk prostate cancer patients: interim analysis of acute toxicity and quality of life in 124 patients. Radiat Oncol. 2013;8:206.
181. Fonteyne V, De Gersem W, De Neve W, Jacobs F, Lumen N, Vandecasteele K, et al. Hypofractionated intensity-modulated arc therapy for lymph node metastasized prostate cancer. Int J Radiat Oncol Biol Phys. 2009;75(4):1013-20.
182. Fonteyne V, Lumen N, Ost P, Van Praet C, Vandecasteele K, De Gersem Ir W, et al. Hypofractionated intensity-modulated arc therapy for lymph node metastasized prostate cancer: early late toxicity and 3-year clinical outcome. Radiother Oncol. 2013;109(2):229-34.
183. Pilepich MV, Krall JM, al-Sarraf M, John MJ, Doggett RL, Sause WT, et al. Androgen deprivation with radiation therapy compared with radiation therapy alone for locally advanced prostatic carcinoma: a randomized comparative trial of the Radiation Therapy Oncology Group. Urology. 1995;45(4):616-23.
184. Roach M, Hunt D, Lawton CA, Hsu I, Lustig RA, Seider M, et al. Radiation Therapy Oncology Group (RTOG) 9413: A Randomized Trial Comparing Whole Pelvic Radiation Therapy (WPRT) to Prostate Only (PORT) and Neoadjuvant Hormonal Therapy (NHT) to Adjuvant Hormonal Therapy (AHT). International Journal of Radiation Oncology • Biology • Physics.87(2):S106-S7.
185. Pommier P, Chabaud S, Lagrange JL, Richaud P, Lesaunier F, Le Prise E, et al. Is there a role for pelvic irradiation in localized prostate adenocarcinoma? Preliminary results of GETUG-01. J Clin Oncol. 2007;25(34):5366-73.
186. Choudhury A, Arthur C, Malik J, Mandall P, Taylor C, Alam N, et al. Patient-reported outcomes and health-related quality of life in prostate cancer treated with a single fraction of high dose rate brachytherapy combined with hypofractionated external beam radiotherapy. Clin Oncol (R Coll Radiol). 2014;26(10):661-7.
187. Holch P, Henry AM, Davidson S, Gilbert A, Routledge J, Shearsmith L, et al. Acute and Late Adverse Events Associated With Radical Radiation Therapy Prostate Cancer Treatment: A Systematic Review of Clinician and Patient Toxicity Reporting in Randomized Controlled Trials. Int J Radiat Oncol Biol Phys. 2017;97(3):495-510.
188. Jiang Y. Normal Tissue Toxicity Criteria in Radiation Therapy. International Journal of Radiation Oncology Biology Physics. 2013;87(2):S621 - S2.
189. Yoshida K, Yamazaki H, Nakamara S, Masui K, Kotsuma T, Akiyama H, et al. Comparison of common terminology criteria for adverse events v3.0 and radiation therapy oncology group toxicity score system after high-dose-rate interstitial brachytherapy as monotherapy for prostate cancer. Anticancer Res. 2014;34(4):2015-8.
190. Wei JT, Dunn RL, Sandler HM, McLaughlin PW, Montie JE, Litwin MS, et al. Comprehensive comparison of health-related quality of life after contemporary therapies for localized prostate cancer. J Clin Oncol. 2002;20(2):557-66.
191. Basch E, Jia X, Heller G, Barz A, Sit L, Fruscione M, et al. Adverse symptom event reporting by patients vs clinicians: relationships with clinical outcomes. J Natl Cancer Inst. 2009;101(23):1624-32.
192. Atkinson TM, Ryan SJ, Bennett AV, Stover AM, Saracino RM, Rogak LJ, et al. The association between clinician-based common terminology criteria for adverse events (CTCAE) and patient-reported outcomes (PRO): a systematic review. Support Care Cancer. 2016;24(8):3669-76.
193. Muanza TM, Albert PS, Smith S, Godette D, Crouse NS, Cooley-Zgela T, et al. Comparing measures of acute bowel toxicity in patients with prostate cancer treated with external beam radiation therapy. Int J Radiat Oncol Biol Phys. 2005;62(5):1316-21.
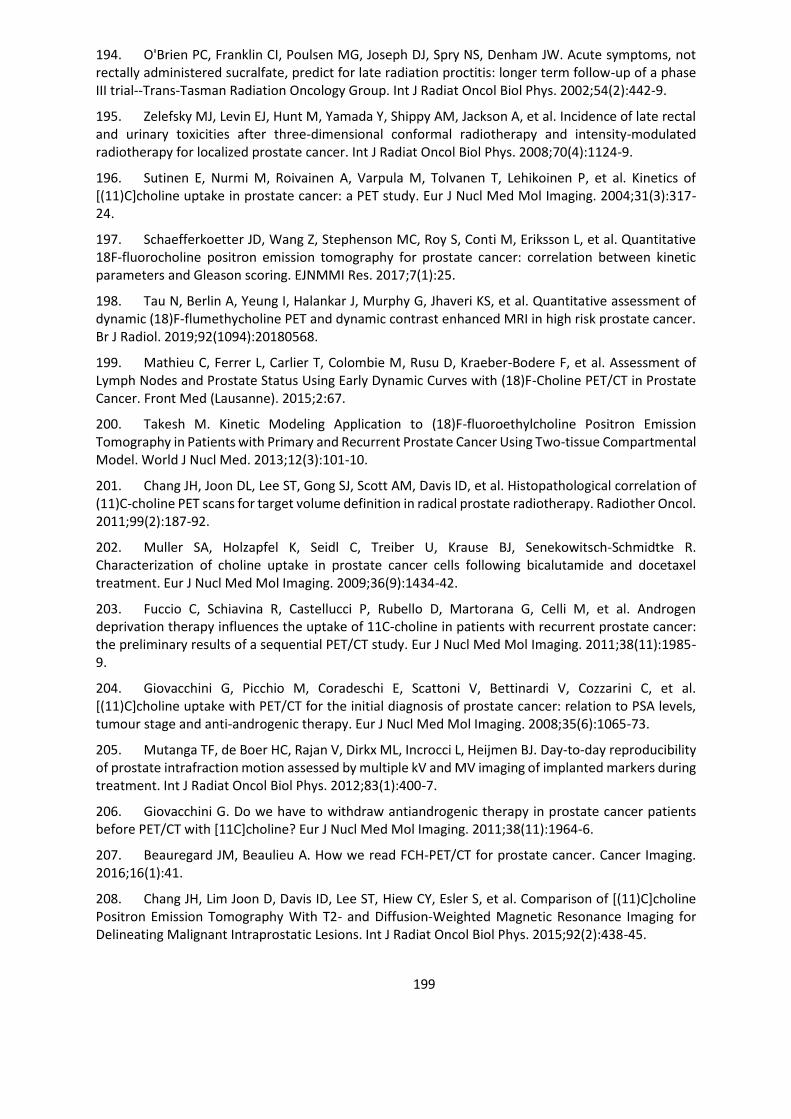
199
194. O'Brien PC, Franklin CI, Poulsen MG, Joseph DJ, Spry NS, Denham JW. Acute symptoms, not rectally administered sucralfate, predict for late radiation proctitis: longer term follow-up of a phase III trial--Trans-Tasman Radiation Oncology Group. Int J Radiat Oncol Biol Phys. 2002;54(2):442-9.
195. Zelefsky MJ, Levin EJ, Hunt M, Yamada Y, Shippy AM, Jackson A, et al. Incidence of late rectal and urinary toxicities after three-dimensional conformal radiotherapy and intensity-modulated radiotherapy for localized prostate cancer. Int J Radiat Oncol Biol Phys. 2008;70(4):1124-9.
196. Sutinen E, Nurmi M, Roivainen A, Varpula M, Tolvanen T, Lehikoinen P, et al. Kinetics of [(11)C]choline uptake in prostate cancer: a PET study. Eur J Nucl Med Mol Imaging. 2004;31(3):317-24.
197. Schaefferkoetter JD, Wang Z, Stephenson MC, Roy S, Conti M, Eriksson L, et al. Quantitative 18F-fluorocholine positron emission tomography for prostate cancer: correlation between kinetic parameters and Gleason scoring. EJNMMI Res. 2017;7(1):25.
198. Tau N, Berlin A, Yeung I, Halankar J, Murphy G, Jhaveri KS, et al. Quantitative assessment of dynamic (18)F-flumethycholine PET and dynamic contrast enhanced MRI in high risk prostate cancer. Br J Radiol. 2019;92(1094):20180568.
199. Mathieu C, Ferrer L, Carlier T, Colombie M, Rusu D, Kraeber-Bodere F, et al. Assessment of Lymph Nodes and Prostate Status Using Early Dynamic Curves with (18)F-Choline PET/CT in Prostate Cancer. Front Med (Lausanne). 2015;2:67.
200. Takesh M. Kinetic Modeling Application to (18)F-fluoroethylcholine Positron Emission Tomography in Patients with Primary and Recurrent Prostate Cancer Using Two-tissue Compartmental Model. World J Nucl Med. 2013;12(3):101-10.
201. Chang JH, Joon DL, Lee ST, Gong SJ, Scott AM, Davis ID, et al. Histopathological correlation of (11)C-choline PET scans for target volume definition in radical prostate radiotherapy. Radiother Oncol. 2011;99(2):187-92.
202. Muller SA, Holzapfel K, Seidl C, Treiber U, Krause BJ, Senekowitsch-Schmidtke R. Characterization of choline uptake in prostate cancer cells following bicalutamide and docetaxel treatment. Eur J Nucl Med Mol Imaging. 2009;36(9):1434-42.
203. Fuccio C, Schiavina R, Castellucci P, Rubello D, Martorana G, Celli M, et al. Androgen deprivation therapy influences the uptake of 11C-choline in patients with recurrent prostate cancer: the preliminary results of a sequential PET/CT study. Eur J Nucl Med Mol Imaging. 2011;38(11):1985-9.
204. Giovacchini G, Picchio M, Coradeschi E, Scattoni V, Bettinardi V, Cozzarini C, et al. [(11)C]choline uptake with PET/CT for the initial diagnosis of prostate cancer: relation to PSA levels, tumour stage and anti-androgenic therapy. Eur J Nucl Med Mol Imaging. 2008;35(6):1065-73.
205. Mutanga TF, de Boer HC, Rajan V, Dirkx ML, Incrocci L, Heijmen BJ. Day-to-day reproducibility of prostate intrafraction motion assessed by multiple kV and MV imaging of implanted markers during treatment. Int J Radiat Oncol Biol Phys. 2012;83(1):400-7.
206. Giovacchini G. Do we have to withdraw antiandrogenic therapy in prostate cancer patients before PET/CT with [11C]choline? Eur J Nucl Med Mol Imaging. 2011;38(11):1964-6.
207. Beauregard JM, Beaulieu A. How we read FCH-PET/CT for prostate cancer. Cancer Imaging. 2016;16(1):41.
208. Chang JH, Lim Joon D, Davis ID, Lee ST, Hiew CY, Esler S, et al. Comparison of [(11)C]choline Positron Emission Tomography With T2- and Diffusion-Weighted Magnetic Resonance Imaging for Delineating Malignant Intraprostatic Lesions. Int J Radiat Oncol Biol Phys. 2015;92(2):438-45.
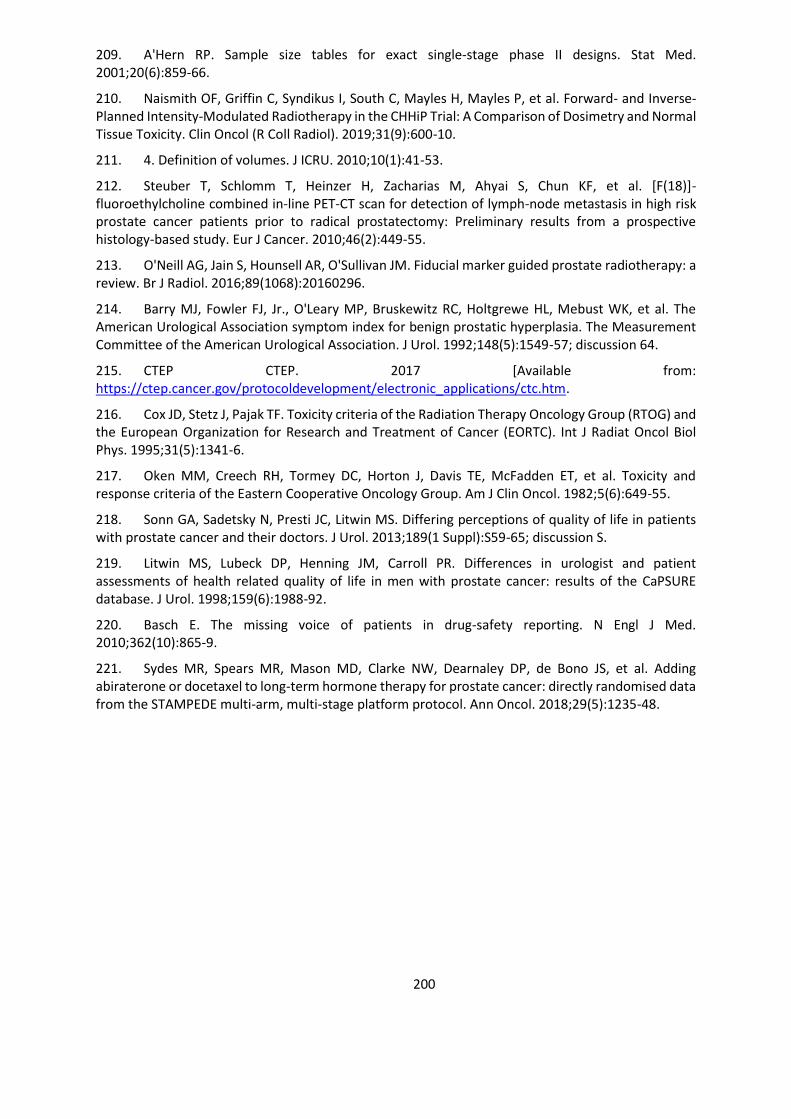
200
209. A'Hern RP. Sample size tables for exact single-stage phase II designs. Stat Med. 2001;20(6):859-66.
210. Naismith OF, Griffin C, Syndikus I, South C, Mayles H, Mayles P, et al. Forward- and Inverse-Planned Intensity-Modulated Radiotherapy in the CHHiP Trial: A Comparison of Dosimetry and Normal Tissue Toxicity. Clin Oncol (R Coll Radiol). 2019;31(9):600-10.
211. 4. Definition of volumes. J ICRU. 2010;10(1):41-53.
212. Steuber T, Schlomm T, Heinzer H, Zacharias M, Ahyai S, Chun KF, et al. [F(18)]-fluoroethylcholine combined in-line PET-CT scan for detection of lymph-node metastasis in high risk prostate cancer patients prior to radical prostatectomy: Preliminary results from a prospective histology-based study. Eur J Cancer. 2010;46(2):449-55.
213. O'Neill AG, Jain S, Hounsell AR, O'Sullivan JM. Fiducial marker guided prostate radiotherapy: a review. Br J Radiol. 2016;89(1068):20160296.
214. Barry MJ, Fowler FJ, Jr., O'Leary MP, Bruskewitz RC, Holtgrewe HL, Mebust WK, et al. The American Urological Association symptom index for benign prostatic hyperplasia. The Measurement Committee of the American Urological Association. J Urol. 1992;148(5):1549-57; discussion 64.
215. CTEP CTEP. 2017 [Available from: https://ctep.cancer.gov/protocoldevelopment/electronic_applications/ctc.htm.
216. Cox JD, Stetz J, Pajak TF. Toxicity criteria of the Radiation Therapy Oncology Group (RTOG) and the European Organization for Research and Treatment of Cancer (EORTC). Int J Radiat Oncol Biol Phys. 1995;31(5):1341-6.
217. Oken MM, Creech RH, Tormey DC, Horton J, Davis TE, McFadden ET, et al. Toxicity and response criteria of the Eastern Cooperative Oncology Group. Am J Clin Oncol. 1982;5(6):649-55.
218. Sonn GA, Sadetsky N, Presti JC, Litwin MS. Differing perceptions of quality of life in patients with prostate cancer and their doctors. J Urol. 2013;189(1 Suppl):S59-65; discussion S.
219. Litwin MS, Lubeck DP, Henning JM, Carroll PR. Differences in urologist and patient assessments of health related quality of life in men with prostate cancer: results of the CaPSURE database. J Urol. 1998;159(6):1988-92.
220. Basch E. The missing voice of patients in drug-safety reporting. N Engl J Med. 2010;362(10):865-9.
221. Sydes MR, Spears MR, Mason MD, Clarke NW, Dearnaley DP, de Bono JS, et al. Adding abiraterone or docetaxel to long-term hormone therapy for prostate cancer: directly randomised data from the STAMPEDE multi-arm, multi-stage platform protocol. Ann Oncol. 2018;29(5):1235-48.
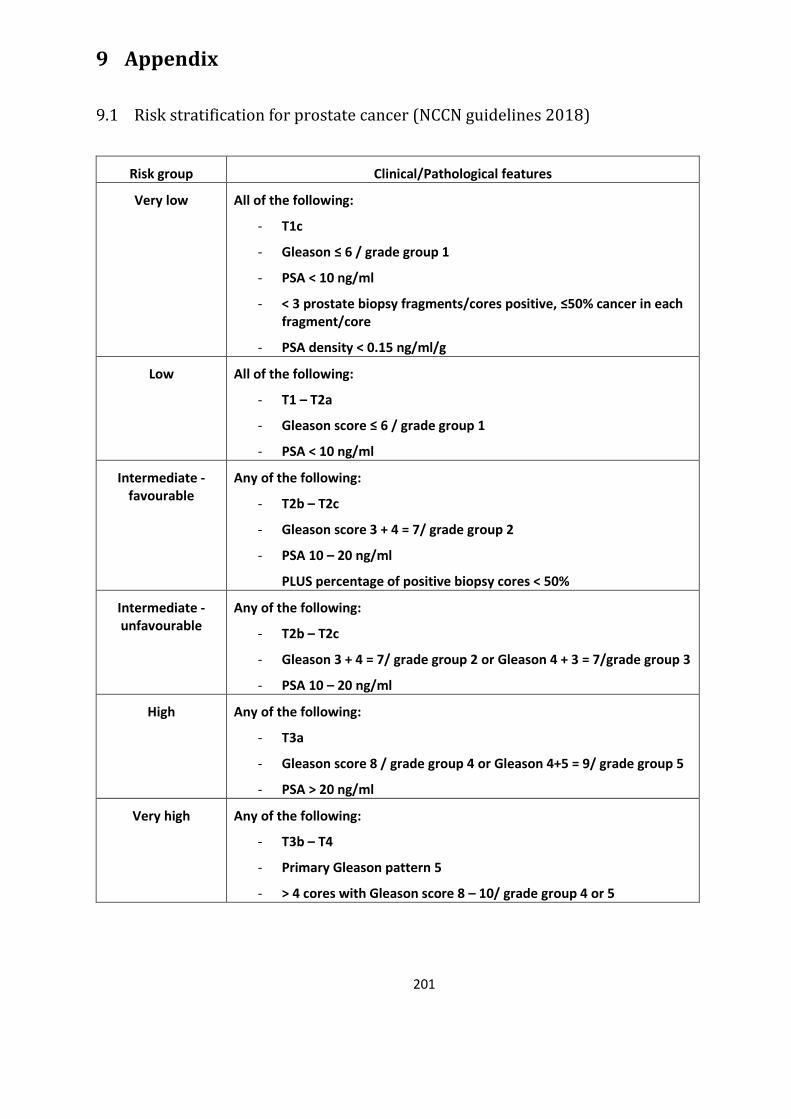
201
9 Appendix
Risk stratification for prostate cancer (NCCN guidelines 2018)
Risk group Clinical/Pathological features
Very low All of the following:
- T1c
- Gleason ≤ 6 / grade group 1
- PSA < 10 ng/ml
- < 3 prostate biopsy fragments/cores positive, ≤50% cancer in each fragment/core
- PSA density < 0.15 ng/ml/g
Low All of the following:
- T1 – T2a
- Gleason score ≤ 6 / grade group 1
- PSA < 10 ng/ml
Intermediate - favourable
Any of the following:
- T2b – T2c
- Gleason score 3 + 4 = 7/ grade group 2
- PSA 10 – 20 ng/ml
PLUS percentage of positive biopsy cores < 50%
Intermediate - unfavourable
Any of the following:
- T2b – T2c
- Gleason 3 + 4 = 7/ grade group 2 or Gleason 4 + 3 = 7/grade group 3
- PSA 10 – 20 ng/ml
High Any of the following:
- T3a
- Gleason score 8 / grade group 4 or Gleason 4+5 = 9/ grade group 5
- PSA > 20 ng/ml
Very high Any of the following:
- T3b – T4
- Primary Gleason pattern 5
- > 4 cores with Gleason score 8 – 10/ grade group 4 or 5

202
Assessment forms
9.2.1 CTCAE
CTCAE 1 2 3 4
Anal mucositis Asymptomatic or mild symptoms; intervention not
indicated
Symptomatic; medical
intervention indicated;
limiting instrumental ADL
Severe symptoms;
limiting self care ADL
Life-threatening consequences;
urgent interventions
indicated
Anal necrosis - - TPN or hospitalisation
indicated; radiologic,
endoscopic, or operative
intervention indicated
Life-threatening consequences;
urgent operative intervention
indicated
Anal pain Mild pain Moderate pain; limiting
instrumental ADL
Severe pain; limiting self care
ADL
-
Abdominal pain Mild pain Moderate pain; limiting
instrumental ADL
Severe pain; limiting self care
ADL
-
Diarrhoea Increase of <4 stools per day over baseline;
mild increase in ostomy output compared to
baseline
Increase of 4 – 6 stools per day over baseline;
moderate increase in
ostomy output compared to
baseline
Increase of ≥7 stools per day over baseline; incontinence; hospitalisation
indicated; severe increase in
ostomy output compared to
baseline; limiting self care ADL
Life-threatening consequences;
urgent intervention
indicated
Rectal haemorrhage
Mild; intervention not
indicated
Moderate symptoms;
medical intervention or
minor cauterisation
indicated
Transfusion, radiologic,
endoscopic, or elective
operative intervention
indicated
Life-threatening consequences;
urgent intervention
indicated
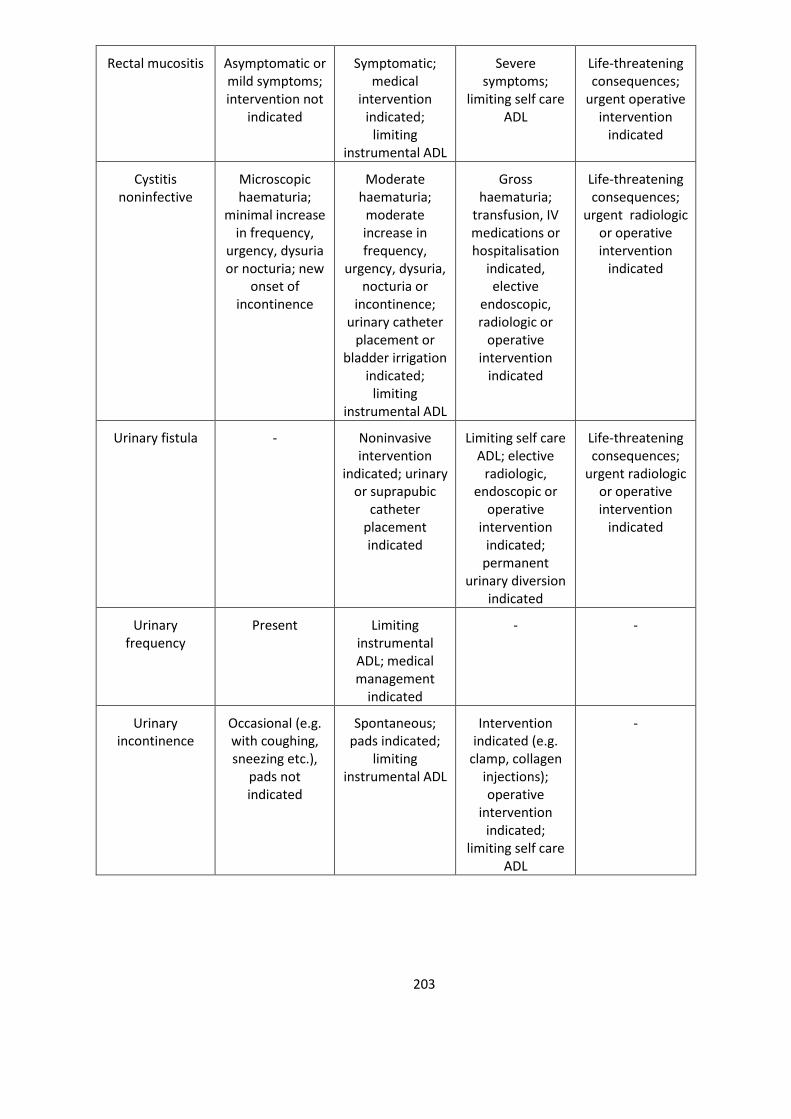
203
Rectal mucositis Asymptomatic or mild symptoms; intervention not
indicated
Symptomatic; medical
intervention indicated;
limiting instrumental ADL
Severe symptoms;
limiting self care ADL
Life-threatening consequences;
urgent operative intervention
indicated
Cystitis noninfective
Microscopic haematuria;
minimal increase in frequency,
urgency, dysuria or nocturia; new
onset of incontinence
Moderate haematuria;
moderate increase in frequency,
urgency, dysuria, nocturia or
incontinence; urinary catheter
placement or bladder irrigation
indicated; limiting
instrumental ADL
Gross haematuria;
transfusion, IV medications or hospitalisation
indicated, elective
endoscopic, radiologic or
operative intervention
indicated
Life-threatening consequences;
urgent radiologic or operative intervention
indicated
Urinary fistula - Noninvasive intervention
indicated; urinary or suprapubic
catheter placement indicated
Limiting self care ADL; elective
radiologic, endoscopic or
operative intervention
indicated; permanent
urinary diversion indicated
Life-threatening consequences;
urgent radiologic or operative intervention
indicated
Urinary frequency
Present Limiting instrumental ADL; medical management
indicated
- -
Urinary incontinence
Occasional (e.g. with coughing, sneezing etc.),
pads not indicated
Spontaneous; pads indicated;
limiting instrumental ADL
Intervention indicated (e.g.
clamp, collagen injections); operative
intervention indicated;
limiting self care ADL
-
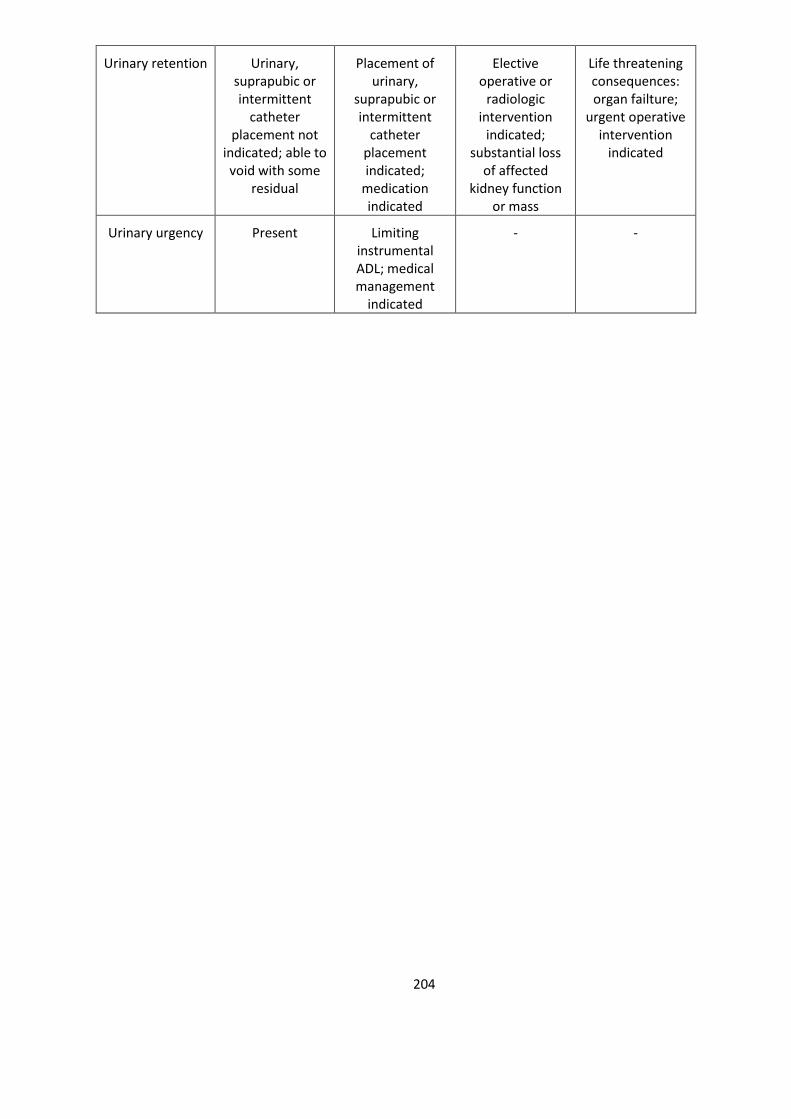
204
Urinary retention Urinary, suprapubic or intermittent
catheter placement not
indicated; able to void with some
residual
Placement of urinary,
suprapubic or intermittent
catheter placement indicated;
medication indicated
Elective operative or
radiologic intervention
indicated; substantial loss
of affected kidney function
or mass
Life threatening consequences: organ failture;
urgent operative intervention
indicated
Urinary urgency Present Limiting instrumental ADL; medical management
indicated
- -
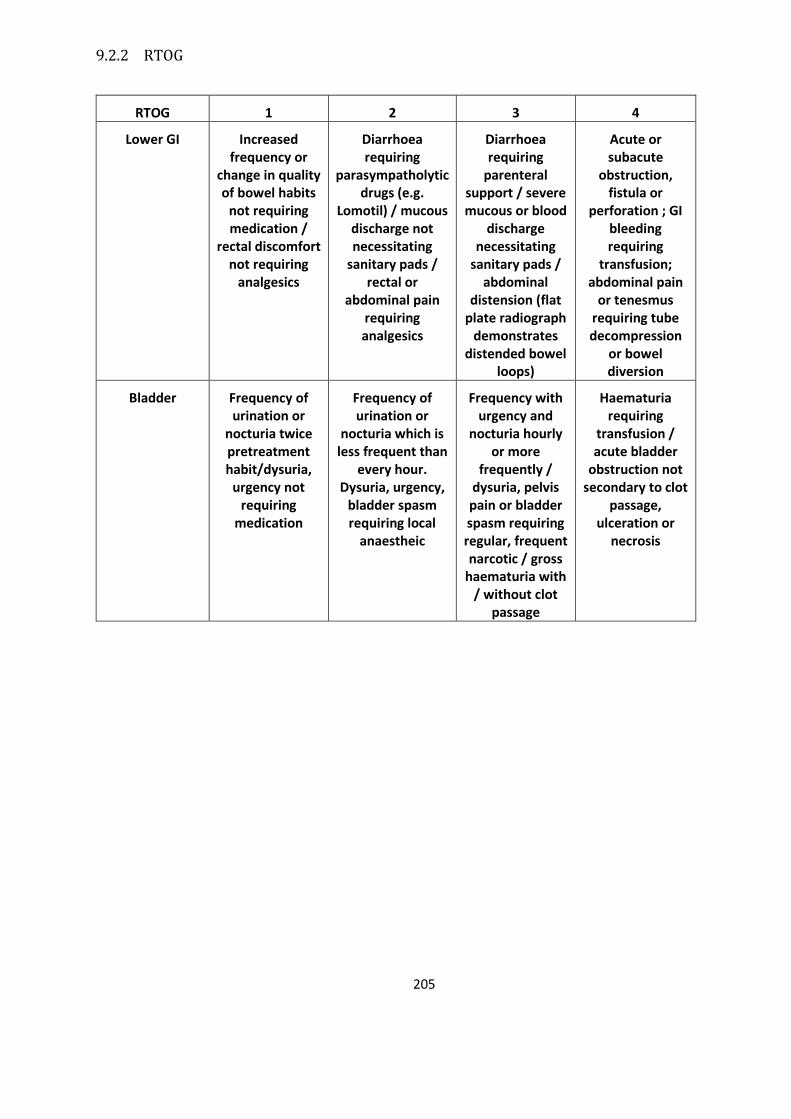
205
9.2.2 RTOG
RTOG 1 2 3 4
Lower GI Increased frequency or
change in quality of bowel habits
not requiring medication /
rectal discomfort not requiring
analgesics
Diarrhoea requiring
parasympatholytic drugs (e.g.
Lomotil) / mucous discharge not necessitating
sanitary pads / rectal or
abdominal pain requiring analgesics
Diarrhoea requiring
parenteral support / severe mucous or blood
discharge necessitating
sanitary pads / abdominal
distension (flat plate radiograph
demonstrates distended bowel
loops)
Acute or subacute
obstruction, fistula or
perforation ; GI bleeding requiring
transfusion; abdominal pain
or tenesmus requiring tube decompression
or bowel diversion
Bladder Frequency of urination or
nocturia twice pretreatment habit/dysuria,
urgency not requiring
medication
Frequency of urination or
nocturia which is less frequent than
every hour. Dysuria, urgency,
bladder spasm requiring local
anaestheic
Frequency with urgency and
nocturia hourly or more
frequently / dysuria, pelvis pain or bladder spasm requiring regular, frequent narcotic / gross
haematuria with / without clot
passage
Haematuria requiring
transfusion / acute bladder
obstruction not secondary to clot
passage, ulceration or
necrosis
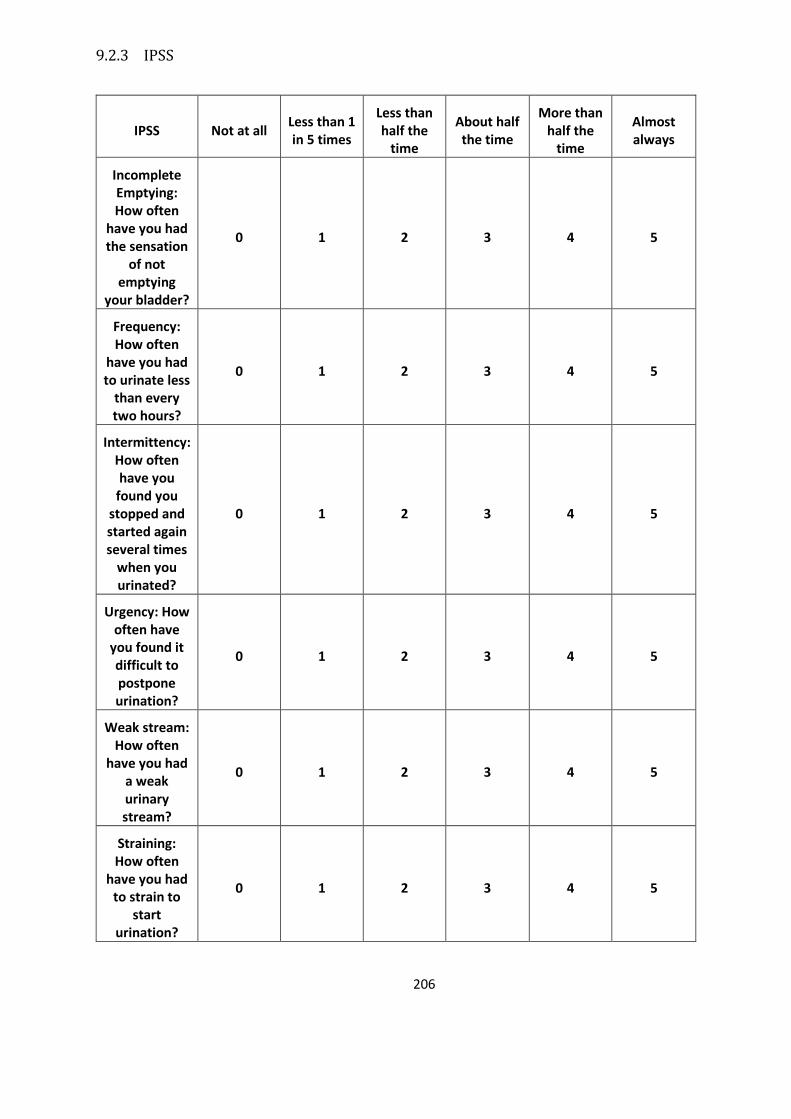
206
9.2.3 IPSS
IPSS Not at all Less than 1 in 5 times
Less than half the
time
About half the time
More than half the
time
Almost always
Incomplete Emptying: How often
have you had the sensation
of not emptying
your bladder?
0 1 2 3 4 5
Frequency: How often
have you had to urinate less
than every two hours?
0 1 2 3 4 5
Intermittency: How often have you
found you stopped and started again several times
when you urinated?
0 1 2 3 4 5
Urgency: How often have
you found it difficult to postpone urination?
0 1 2 3 4 5
Weak stream: How often
have you had a weak urinary stream?
0 1 2 3 4 5
Straining: How often
have you had to strain to
start urination?
0 1 2 3 4 5
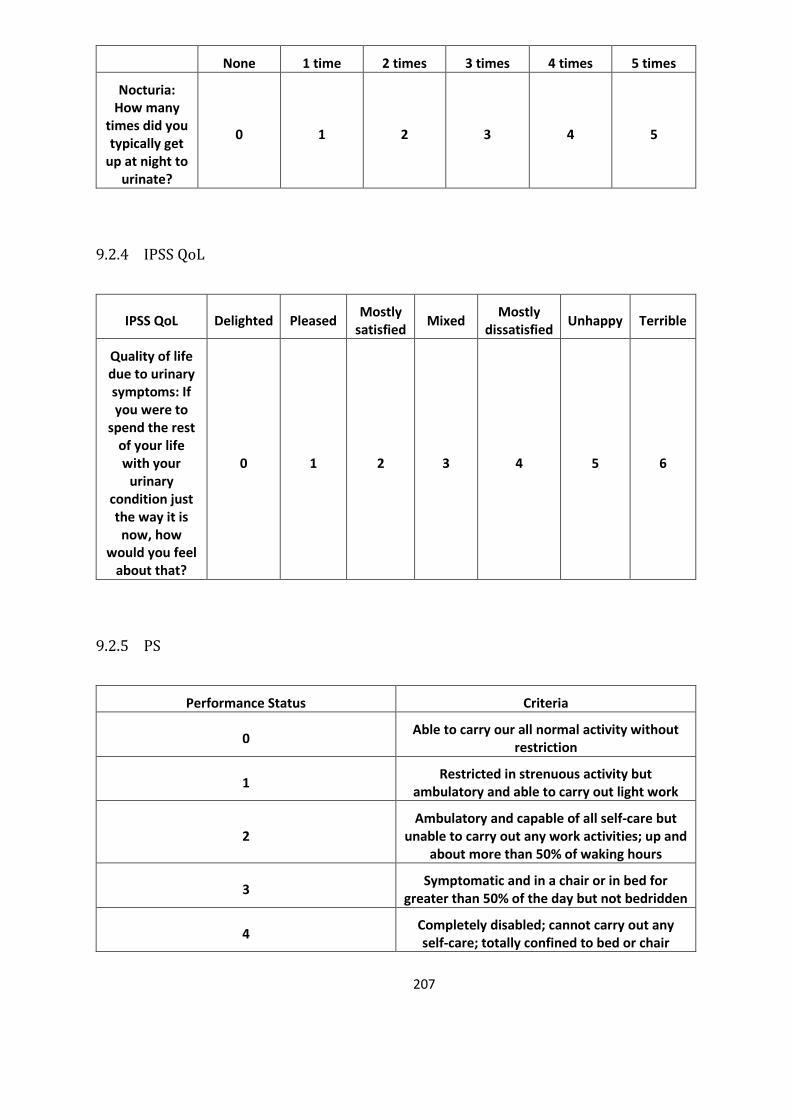
207
None 1 time 2 times 3 times 4 times 5 times
Nocturia: How many
times did you typically get
up at night to urinate?
0 1 2 3 4 5
9.2.4 IPSS QoL
IPSS QoL Delighted Pleased Mostly
satisfied Mixed
Mostly dissatisfied
Unhappy Terrible
Quality of life due to urinary symptoms: If you were to
spend the rest of your life with your
urinary condition just the way it is now, how
would you feel about that?
0 1 2 3 4 5 6
9.2.5 PS
Performance Status Criteria
0 Able to carry our all normal activity without
restriction
1 Restricted in strenuous activity but
ambulatory and able to carry out light work
2 Ambulatory and capable of all self-care but
unable to carry out any work activities; up and about more than 50% of waking hours
3 Symptomatic and in a chair or in bed for
greater than 50% of the day but not bedridden
4 Completely disabled; cannot carry out any self-care; totally confined to bed or chair
208
9.2.6 EPIC

209
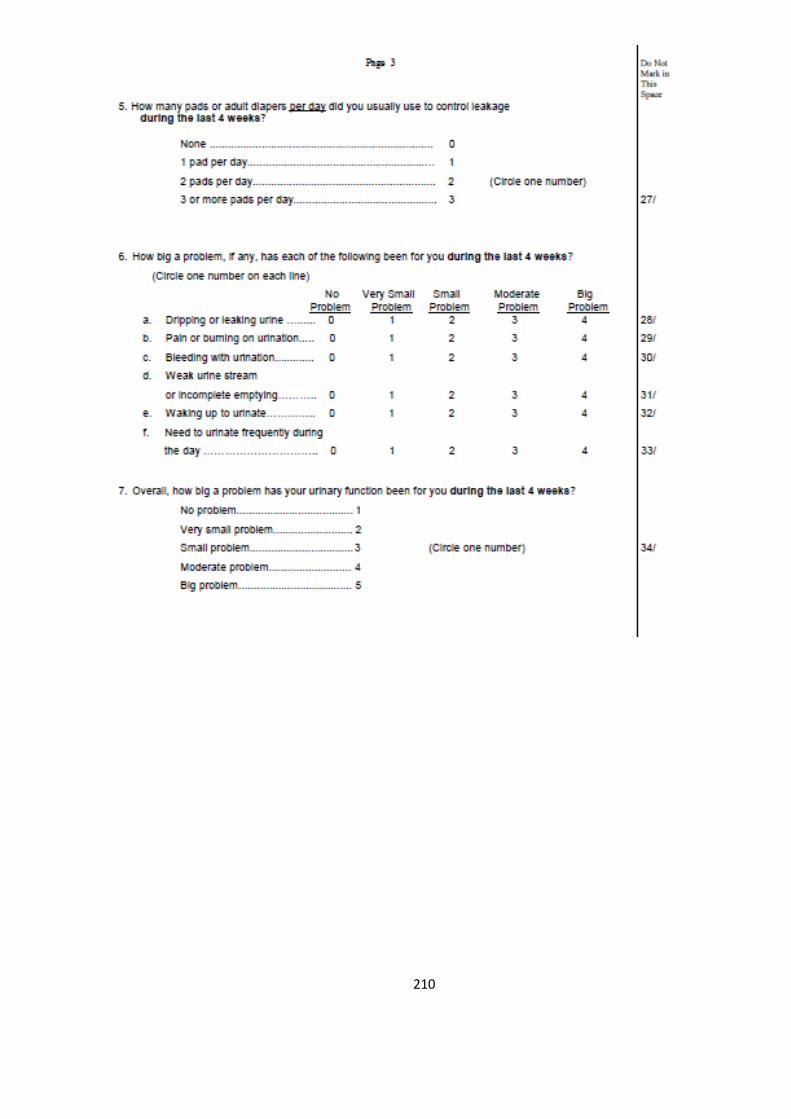
210
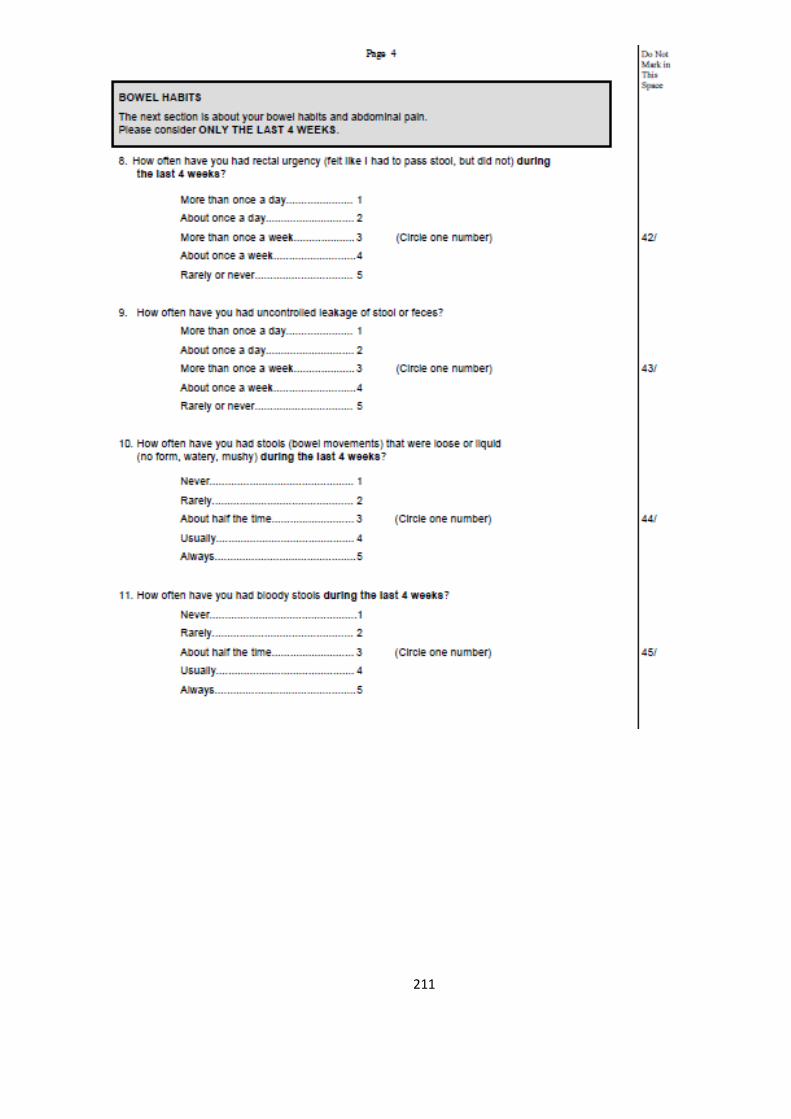
211

212

213
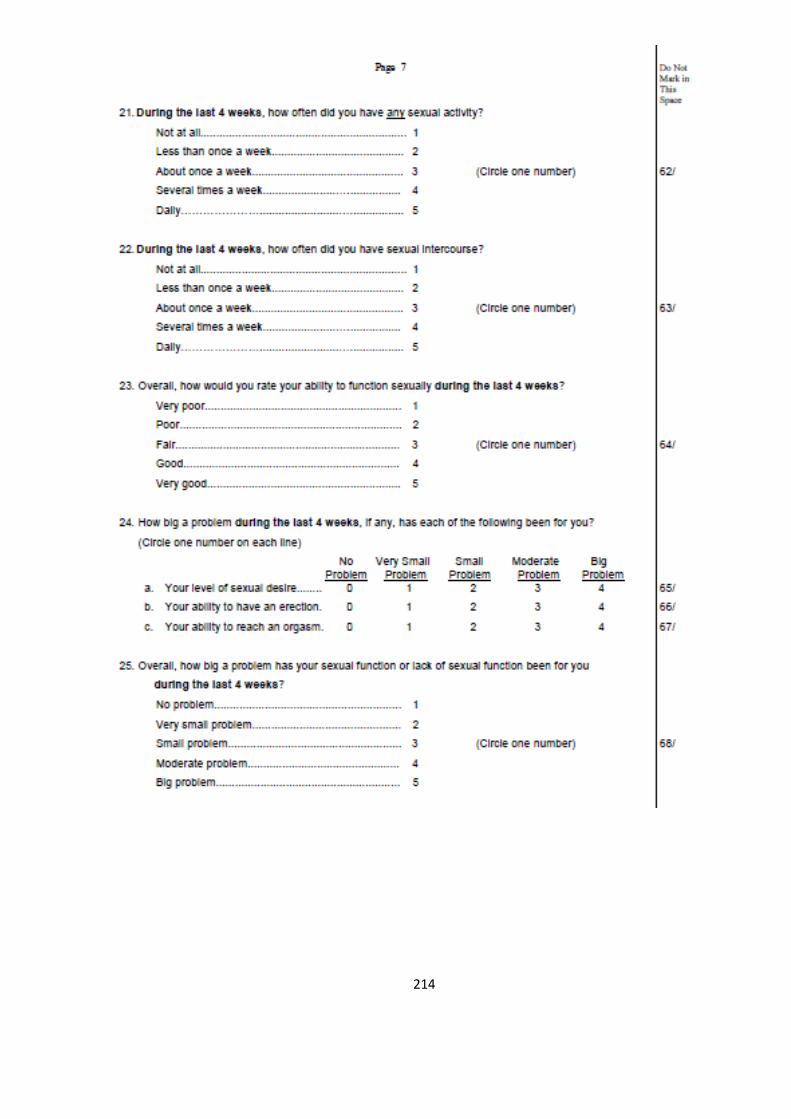
214
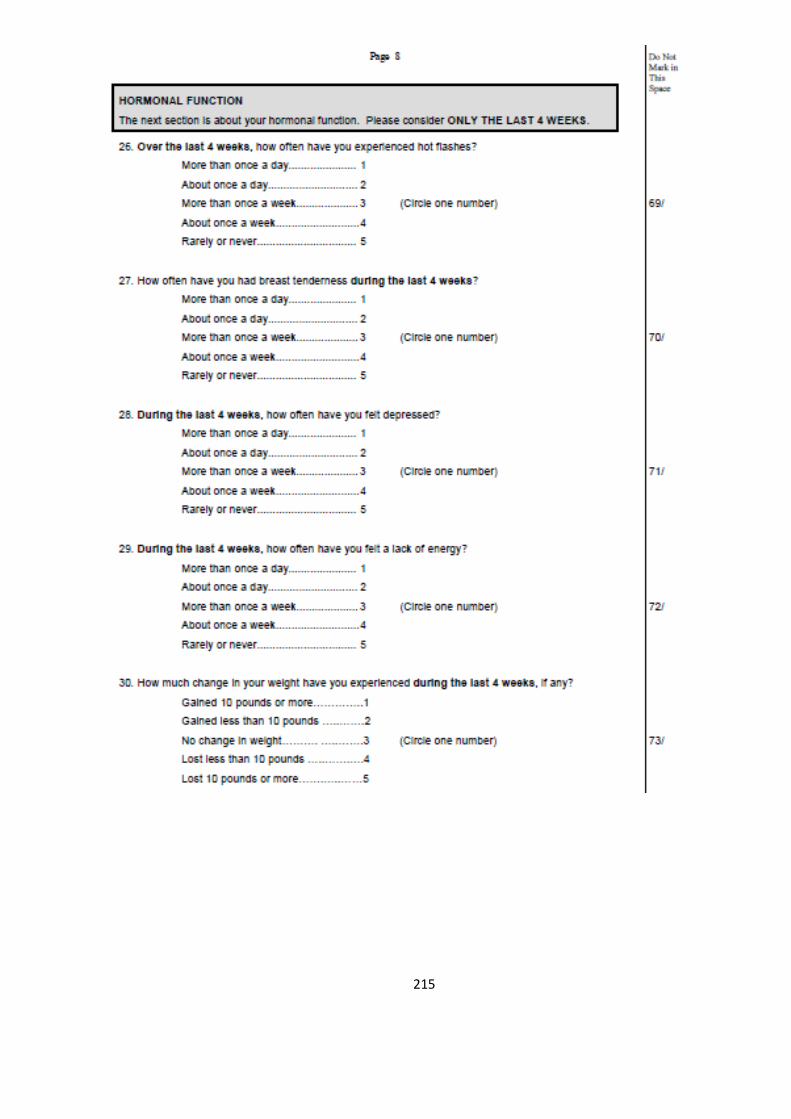
215

216
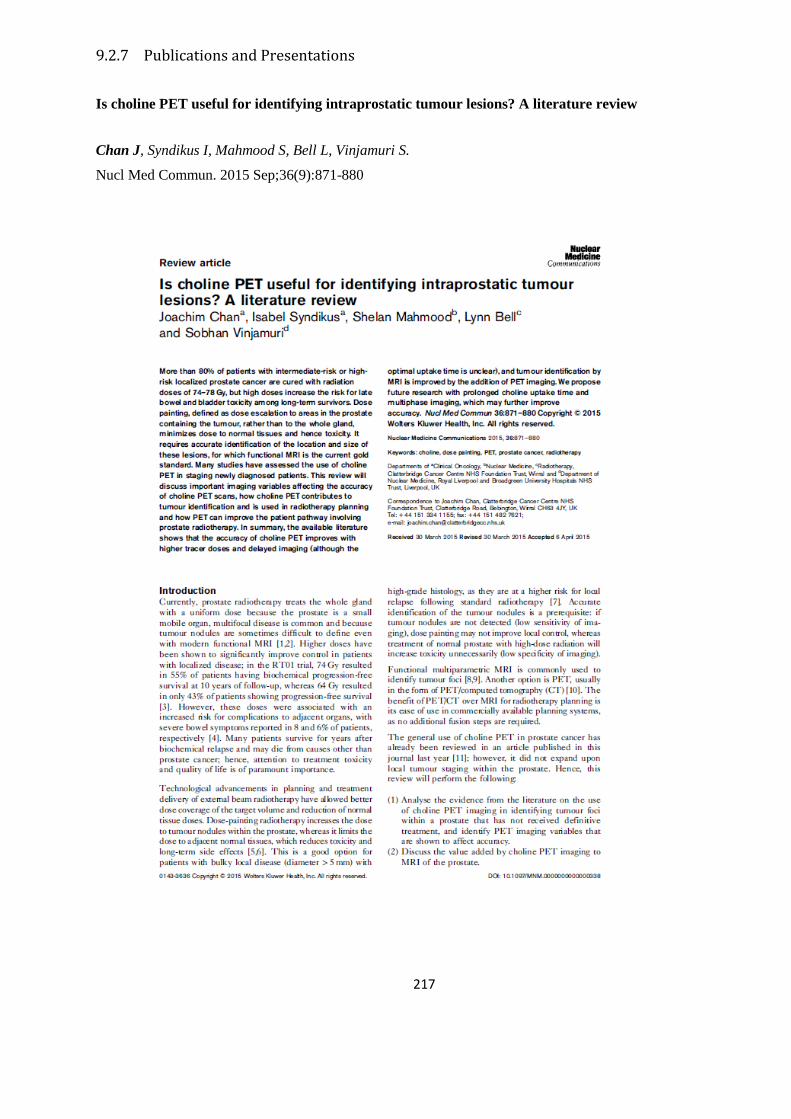
217
9.2.7 Publications and Presentations
Is choline PET useful for identifying intraprostatic tumour lesions? A literature review
Chan J, Syndikus I, Mahmood S, Bell L, Vinjamuri S.
Nucl Med Commun. 2015 Sep;36(9):871-880

218

219

220
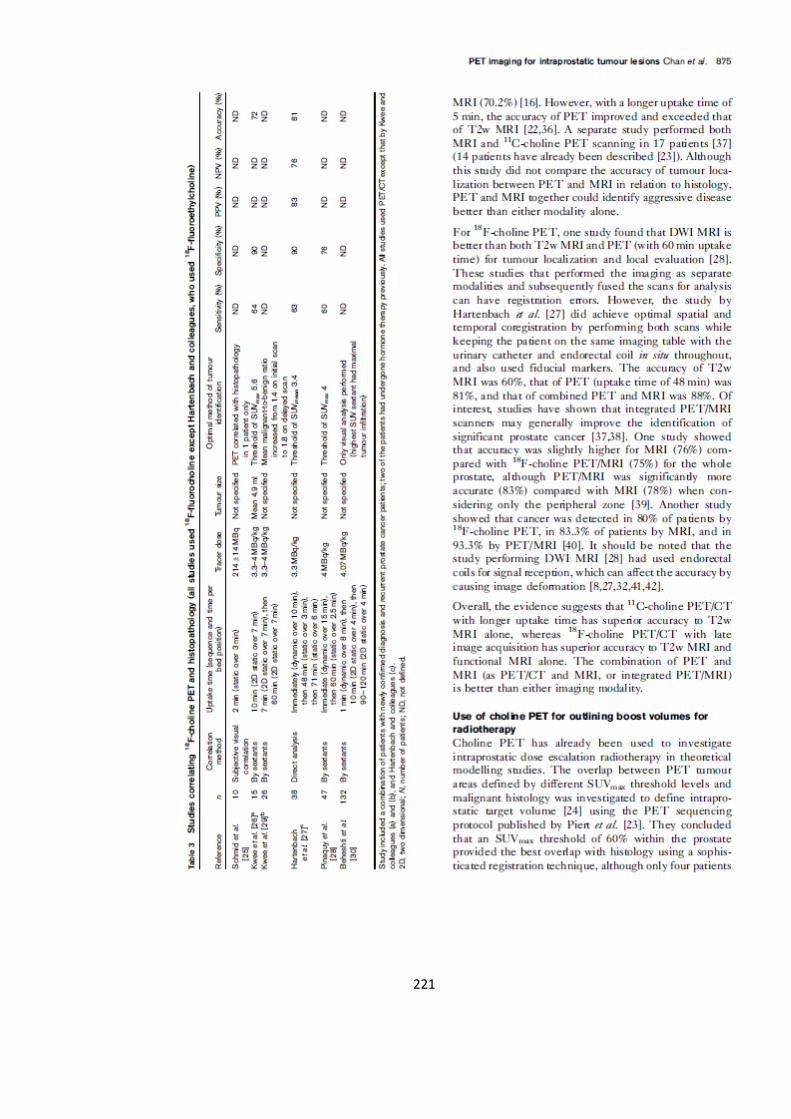
221
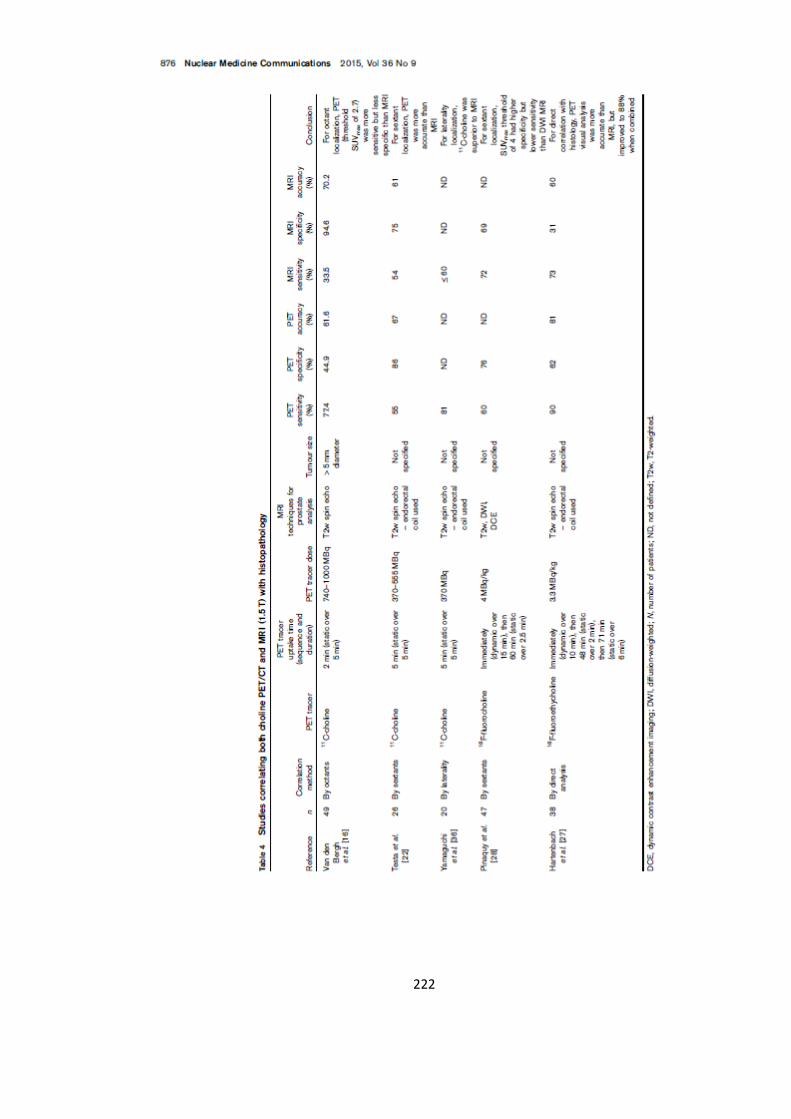
222

223

224
225
226

227
Effect of androgen deprivation therapy on intraprostatic tumour volume identified on
18F choline PET/CT for prostate dose painting radiotherapy
Chan J, Carver A, Brunt JNH, Vinjamuri S, Syndikus I
British Journal of Radiology 2017 March 90(1071), 20160818

228
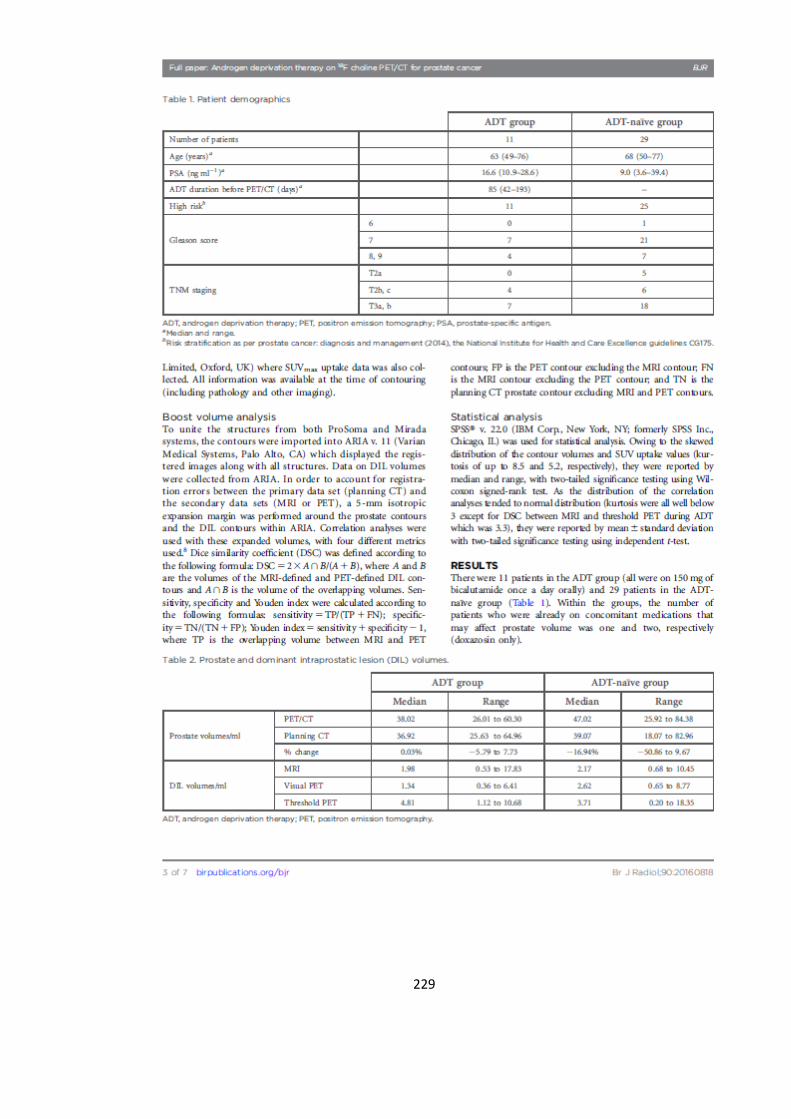
229
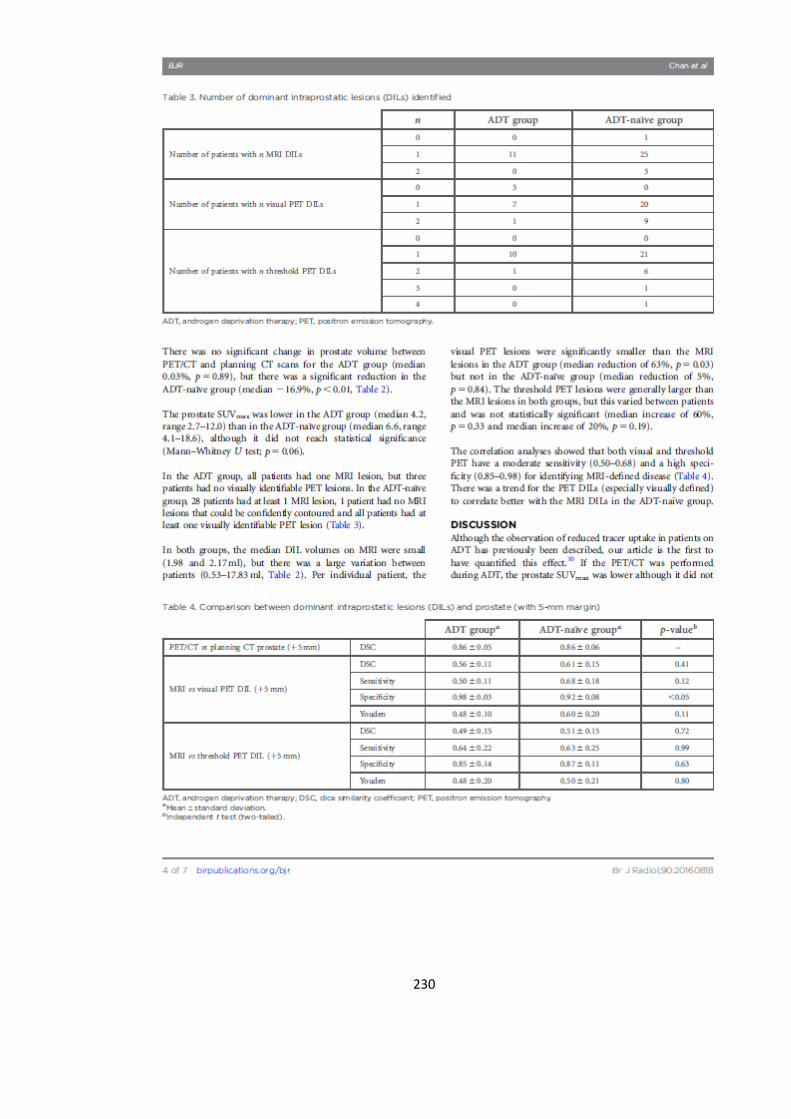
230

231
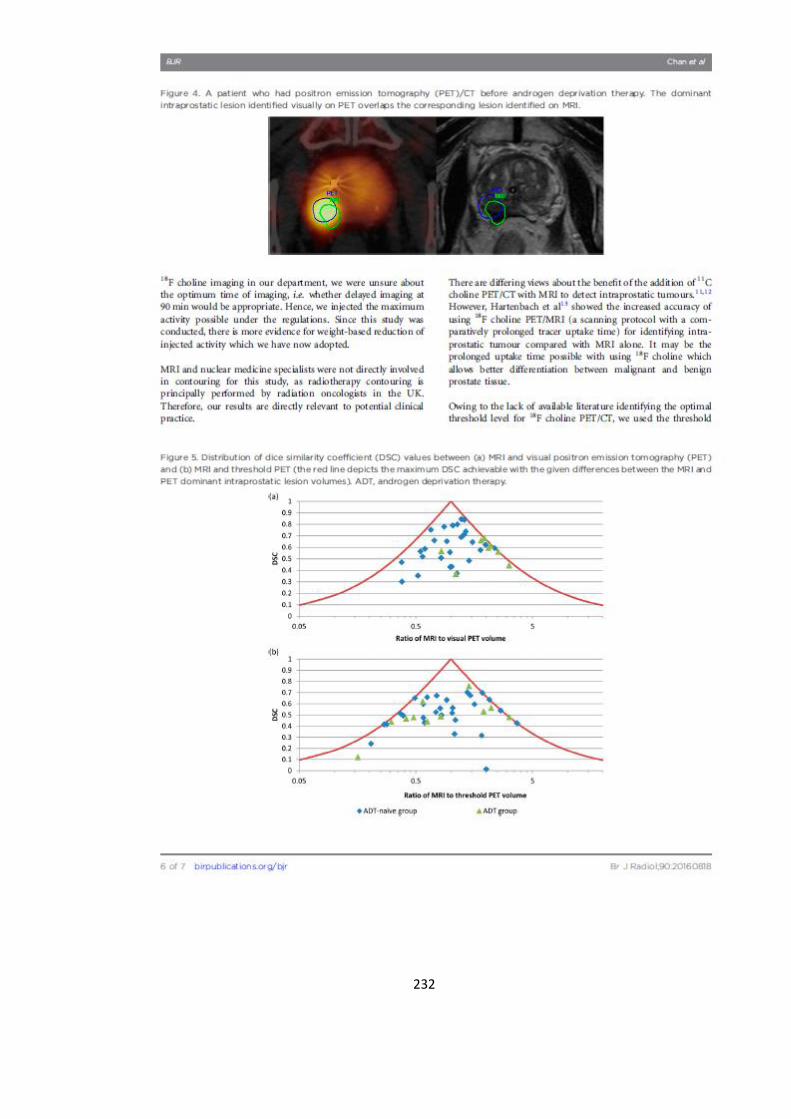
232

233
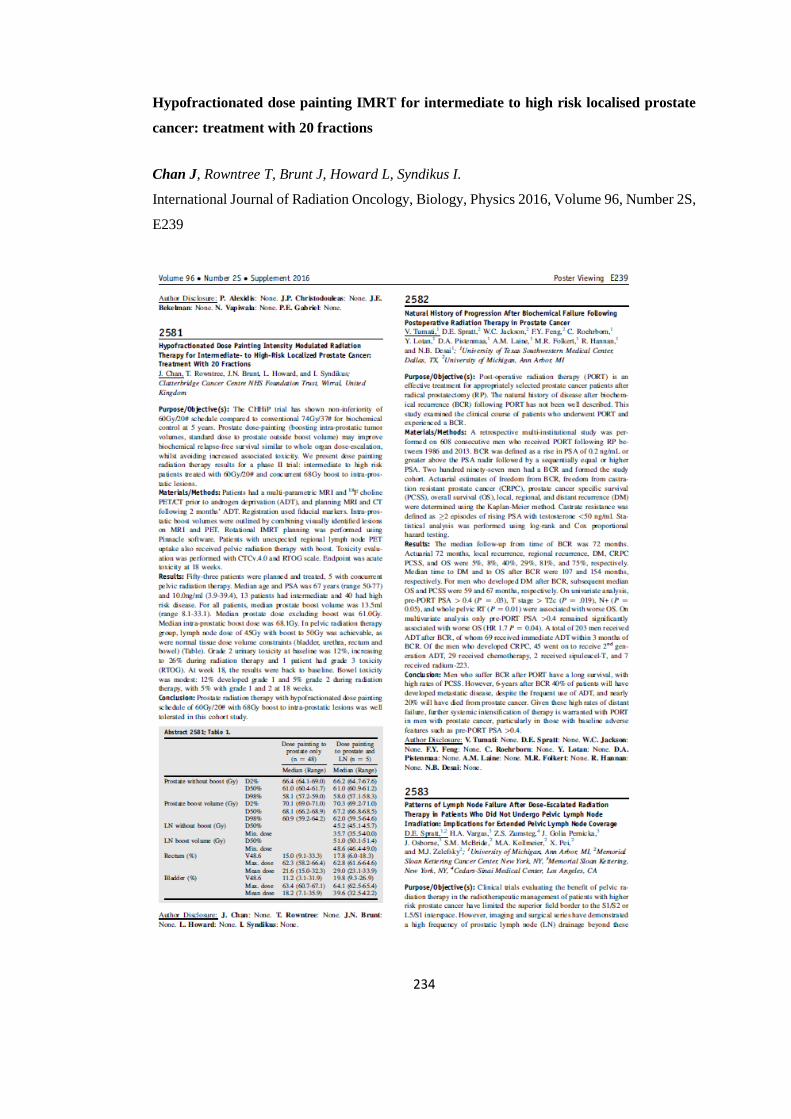
234
Hypofractionated dose painting IMRT for intermediate to high risk localised prostate
cancer: treatment with 20 fractions
Chan J, Rowntree T, Brunt J, Howard L, Syndikus I.
International Journal of Radiation Oncology, Biology, Physics 2016, Volume 96, Number 2S,
E239

235
Hypofractionated dose painting IMRT using 20 fractions for intermediate and high-risk
localised prostate cancer: Two-year outcome data (BIOPROP20, NCT02125175)
Syndikus I, Chan J, Rowntree T, Howard L, Staffurth J
Journal of Clinical Oncology 37, no.7_suppl (March 01, 2019) 59-59
236
Oral Presentations
International
June 2015 Dose painting radiotherapy for high risk prostate cancer: delayed 18F-choline
PET/CT imaging before neo-adjuvant hormone therapy improves detection
rates
Chan J, Mahmood S, Brunt J, Vinjamuri S, Syndikus I.
Biology-Guided Adaptive Radiotherapy 13th Acta Oncologica Symposium
(BiGART2015) – Aarhus, Denmark
National
June 2017 Hypofractionated dose painting IMRT for intermediate to high risk prostate
cancer: treatment with 20 fractions
Chan J, Jackson R, Rowntree T, Brunt J, Howard L, Syndikus I.
UKCRO (UK Radiological and Radiation Oncology Congress) 2017 –
Manchester, UK
Poster Presentations
International
Feb 2019 Hypofractionated dose painting IMRT using 20 fractions for intermediate to
high risk localised prostate cancer: 2 year outcome data
Syndikus I, Chan J, Rowntree T, Howard L, Staffurth J
GU ASCO 2019
May 2017 Impact of 18F choline PET scan acquisition time on delineation of GTV in
prostate cancer
Parkinson C, Chan J, Syndikus I, Marshall C, Staffurth J, Spezi E
ESTRO 2017
Sept 2016 Hypofractionated dose painting IMRT for intermediate to high risk localised
prostate cancer: treatment with 20 fractions
Chan J, Rowntree T, Brunt J, Howard L, Syndikus I.
ASTRO 2016