Embed Size (px)
Citation preview

Hyperion is Business Performance Management

0
100
200
300
400
500
600
Annual Revenues($ millions)
383
492528
499432
'98 '02'01'00'99
-1.0
-0.5
0.0
0.5
1.0
1.5
1.13
.26
.87
-.95
.45
EPS(diluted)
'98 '02'01'00'99
Revenues by Type* Revenues by Geography* Software License Revenues by Channel**
SoftwareLicense 40%
Maintenance38%
Services22%
International35%
North America65%
Indirect25%
Direct 75%
Fiscal Year 2002
* as a percent of total revenues** as a percent of total software license revenue
Hyperion is a $0.5 Billion business performance management software company serving morethan 6,000 customers worldwide.

It’s been a good year at Hyperion, particularly in
light of a difficult economy. I am especially
pleased that the year’s success was measured
by consistent quarterly growth and global
improvements across all our key metrics. That
tells me the strategy we laid out last year is
working and we continue to improve execution.
Last year, we told you we planned to capitalize
on our dominant presence in finance and
strengthen our business intelligence platform.
And we did. Our new Web-based financial appli-
cations have been extremely well received. In
addition, we introduced Hyperion Essbase XTD,
a powerful development and deployment platform
that greatly improves reporting and relational
access. Our customers can now apply an
integrated goal-setting, planning, budgeting,
forecasting, monitoring and reporting process
across the enterprise. This is becoming known
as business performance management.
We Deliver Fast ROI
Our solutions enable companies to understand
profitability, analyze and model their operations,
pinpoint problems, collaborate on responses,
and put plans into immediate action with
improved accountability. We’re hearing from
customers that the payback on investment
is fast, and that they are gaining important
advantages at a critical time.
The economic environment is difficult, but it is
creating clear and swift enterprise-wide accept-
ance of business performance management
software. The capital markets collapsed two
years ago when focus returned to profits and
solid business models. The resulting uncertainty
increased the need for companies to plan more
frequently, and the financial scandals turned
attention to robust, timely, and accurate reporting.
Performance matters. Profits matter.
These situations highlighted the need for business
performance management and the need for
these solutions is long-lasting. The focus on
performance and profits is not going away any
time soon.
Thank You to All Hyperion Employees
It took enormous effort by all Hyperion
employees to bring about a year of progress and
investor reward. Our company was greatly
bolstered by the additions of Godfrey Sullivan as
president and chief operating officer and Nazhin
Zarghamee as chief marketing officer. Both bring
tremendous industry knowledge and leadership
strength to our able team of professionals.
We will continue implementing our strategy,
improving our products, and expanding our
reach into a market primed and ready for what
we have to offer. During these exciting times, we
look forward to continuing to meet opportunities
through great execution.
To Hyperion Stockholders
Jeff Rodek
Hyperion Solutions Corporation
September 25, 2002
Hyperion 1
Jeffrey R. Rodek Chairman and Chief Executive Officer

2 Hyperion
“The need for business performance management has
been around forever, but the technology to enable it
has only recently matured. Business performance
management complements enterprise resource planning
and transaction systems and better enables companies
to make collaborative and informed decisions.”
John Kopcke, Chief Technology Officer
“Developing and improving on decision-
enabling reporting, analysis, modeling
and planning capabilities is in our DNA.
It’s not just what we do; it’s who we are.”
Jeff Rodek, Chief Executive Officer
“When we say we’re customer focused, we mean that our
actions center on our customers. Each major product has a
customer advisory board that helps us understand what
works, what doesn’t, and what else they need—and we use
that feedback in our development process. We’ve also
initiated several high-touch customer services to make it
increasingly easy to do business with Hyperion.”
Godfrey Sullivan, President and Chief Operating Officer
“There has never been a greater need for our products.
Our new solutions arrived at the perfect time to address the
renewed emphasis on profitability, the need for dynamic
planning, and the demand for financial accountability.”
Nazhin Zarghamee, Chief Marketing Officer
Business performance management
answers the need
Success in today’s business environment
demands an in-depth grasp of how daily activities
measure up financially, strategically, competitively,
and in the eyes of the customer. That’s where
Hyperion business performance management
solutions come in and why they are quickly
redefining the business intelligence arena.
Using Hyperion’s business performance man-
agement solutions, companies can establish and
monitor forward-looking financial and non-
financial indicators of corporate health and
future performance, assess how well plans are
being executed against strategies, and collabo-
ratively plan updates as business conditions
change. In addition, managers can generate
financial impact reports quickly to get the
information they need to make more informed
decisions and breed accountability at all levels
of the organization.
Bringing a company’s information and its distinct
business processes together on an integrating
platform with applications that provide robust
analysis, planning, budgeting, and collaboration
enables companies to spot problems and oppor-
tunities, and to respond quickly and confidently.
That’s Hyperion’s unique competitive advantage.
What’s Driving the growth in Business
Performance Management?
Hyperion is ideally positioned to take advantage
of opportunities for growth in the business
performance management sector. These oppor-
tunities include:
• Increasing adoption of business performance
management as a critical business tool;
• Growing demand for enterprise-wide solutions
that broaden action and accountability
throughout the organization;
• Large customer base that can move up to
the new products and expand from point
solutions to application suites;
• Greater need for transparency and financial
control systems;
• Movement to drive traditional finance actions
out to other departments;
• Continuing geographic expansion supported
by product localizations; and
• Strong network of channel partners to drive
sales and implement tailored business
performance management solutions built with
Hyperion products.
Hyperion’s business performance managementsolutions bring together business intelligenceand business process in a management cycle todeliver recurring benefits and, ultimately, to drivegreater profits.
Market Opportunity
Hyperion 3

Companies that want to outperform their
industry competitors should understand
business performance management and
immediately start building their strategies.

Because the management process is an on-going and demanding cycle, Hyperion offers customers feature-rich applicationsand an integrating development and deployment platform to create business performance management solutions.
These solutions enable companies to continually: • • • • measure performance
• • • anticipate results• • drive profitability, and• improve financial integrity.
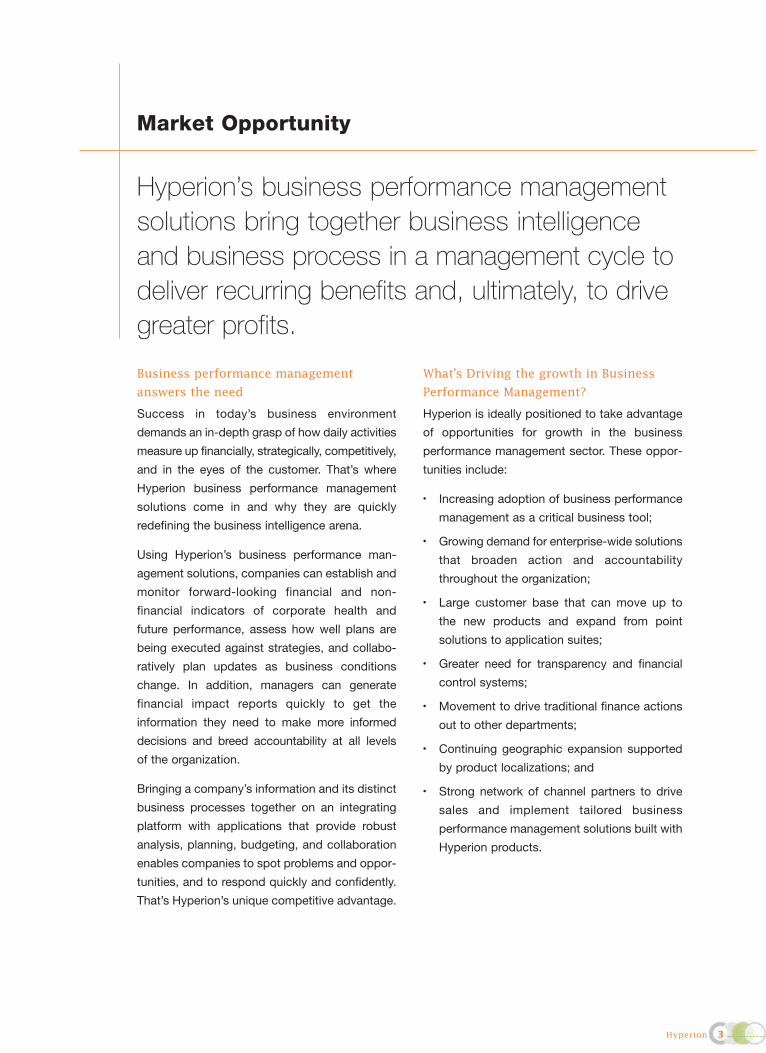
The Management Cycle
• Scenario Testing• Goal Setting• Scorecarding
• Performance Measurement• Efficiency and Utilization• Benchmarking and Metrics
• Revenues• Resources• Constraints• Profitability
• Financial Planning• Resource Allocation• Budgeting• Demand Planning
• Profitability• Variance• Effectiveness• Product Mix
• Consolidation• Management• Legal and Statutory• Financial
To drive profitability, companies must move
continuously through the management cycle
with ever-increasing awareness and agility. Goals
drive strategies that, in turn, guide actions.
Business performance management helps link
goals to strategies and translates them into
adaptive plans modeled to match a company’s
unique operating style. This approach aligns all
levels of the organization, from the boardroom
to the front lines, along the path to results.
Hyperion’s platform and applications keep
companies informed, throughout the enterprise,
using a Web-based system designed to improve
collaboration and increase responsiveness.
6 Hyperion
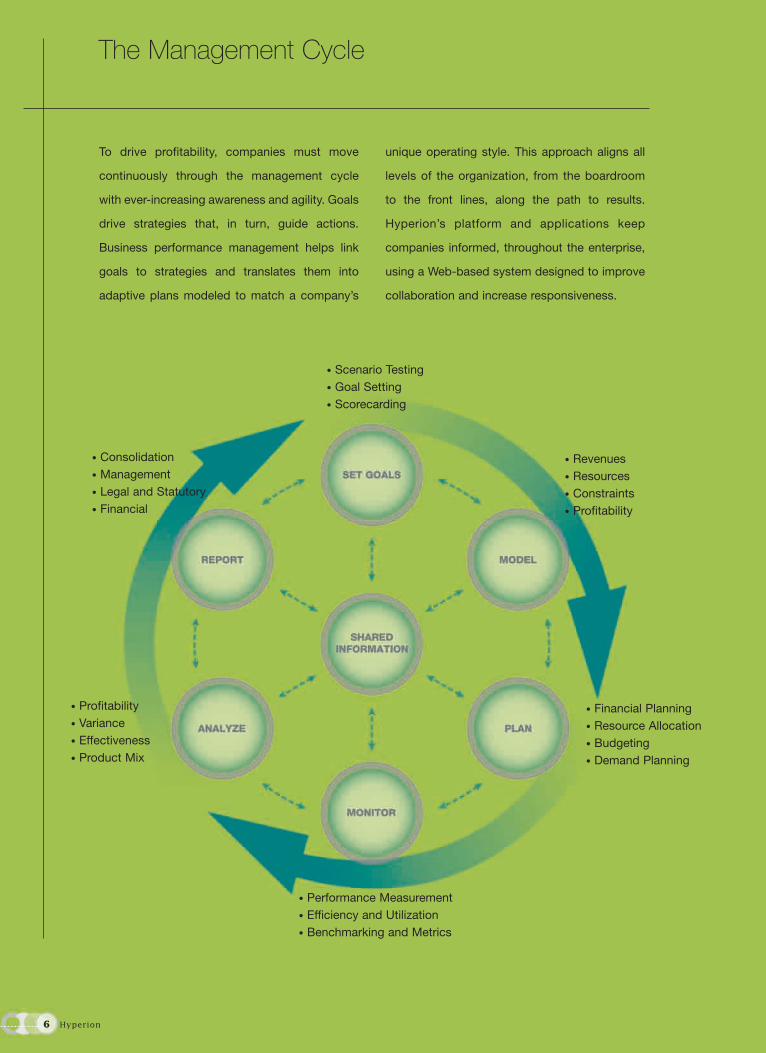
To stay nimble, companies must shift from annual
planning to rolling or event-based planning. Knowing
how well plans tie to strategies and actions measure
up against plans and projections is crucial to a
company’s success. Hyperion products enable
companies to monitor key operating indicators and
to tie information together across the organization.
1. Measure Performance 2. Anticipate Results
At the end of the day, Hyperion lets
management and sales associates
know which stores need Incubus shirts
and which ones want Slipknot tanks.
That results in happy customers and
better profits.”John HorwathVice President of Information TechnologyHot Topic, Inc.
Where it once would have taken days,
we had the information we needed to
make decisions within a few hours.
That was critical on September 11th,
but it’s no less valuable today. Our
business cockpits, for instance, give
senior executives and frontline
managers alike a remarkable tool to
analyze performance from a variety of
views so they can quickly identify
emerging issues and make informed
decisions.”Mike Van De VenVice President of Financial Planning and AnalysisSouthwest Airlines Co.
Hot Topic, Inc.A mall-based specialty retailer of music-licensed andmusic-influenced apparel, accessories, and gift items
BackgroundHot Topic sells mainly to 12-to-22-year olds, a market thatcan adopt or reject a trend almost daily. Their previous system created weekly sales reports that were difficult tounderstand and often very late before they reached thefield. In order to stay one step ahead of this changeablemarket, the fast-growing retail chain of nearly 400 storesneeded to be able to analyze regional inventory and salesdata daily to understand what was selling on a store,regional, and national basis. Fast analysis would allowthe retailer to get the right inventory to the right stores tomeet demand.
SolutionsHyperion Essbase, Hyperion Analyzer
Southwest AirlinesThe fourth largest U.S. carrier in terms ofcustomers boarded
Hyperion enables companies to look into their
supply chain, customer relationship, transactional,
channel, operational, and financial systems to
compare performance to projections. From triggered
alerts, managers can collaboratively respond to
existing or predicted discrepancies against expecta-
tions. Planning, modeling, and forecasting help
managers test potential scenarios to determine the
best strategic direction.
“
BackgroundThe events of 9/11 brought the airline industry to its financial knees. Southwest quickly put Hyperion applications to work modeling scenarios and reportingagainst them to plan and budget. Accurate forecasting of operating expenses helped the airline weather thestorm without resorting to layoffs or applying for government-backed loans. Each of Southwest’soperating departments uses “business cockpits” to track individual financial performance.
SolutionsHyperion Essbase, Hyperion Analyzer, Hyperion Pillar
“

3. Drive Profitability 4. …and Improve Financial Integrity
Hyperion helps us to not only meet our
corporate objectives, but also to make
these objectives more transparent
throughout all levels of the company.
We are able to more accurately forecast
expenses, and have greater insight
from quarter to quarter on what our
results will be. With Hyperion we are
more nimble, which is especially
important as we continue on our path
of rapid growth.”Gloria FanVice President, FinanceUTStarcom
BackgroundUTStarcom, named one of Business Week’s 100 HotGrowth Companies in 2001, has seen its earnings growmore than 320 percent in the past three years. High-speedgrowth and expanding opportunities challenged the company’s infrastructure and its ability to plan effectivelyfor a rapidly evolving future.
SolutionsHyperion Essbase, Hyperion Planning, Hyperion Reports
We’ve been able to unify our commercial
and financial reporting, analysis,
modeling, and planning in a single
Web-based application that we can
continue to extend as we grow. The
full Web-reporting capability eliminates
local input sites, which drastically
reduces maintenance and increases
flexibility so that we can address
business issues.”Brian MackieChief Financial OfficerMaxxium Worldwide B.V.
BackgroundMaxxium Worldwide’s partner companies, HighlandDistillers of Scotland, Jim Beam Brands of the U.S., Rémy-Cointreau of France, and Vin & Spirit AB of Sweden,came together to drive their products into the global market. Each company had national standards and legacysystems that needed integration. They also needed toextract and analyze data for Maxxium and each partner.While satisfied with their local-site Hyperion deployments,they needed a true enterprise-wide solution.
SolutionsHyperion Financial Management
UTStarcom, Inc.A leading provider of wireless, wireline, andbroadband access equipment
At the heart of business today lies the need to focus
on profits by curtailing costs, increasing revenue,
and improving market position. Hyperion’s products
enable managers to understand their businesses,
adjust strategies to address ever-present change,
identify and seize growth opportunities, and use
resources wisely.
With attention pointed sharply on financial reporting,
companies must feel confident about the integrity of
reported numbers. There must be an accurate,
single version of the truth enterprise-wide. Hyperion
leads the market in financial business performance
management with unified solutions that enable
companies to improve financial integrity and make
strategic decisions faster.
“
Maxxium Worldwide, B.V.Global marketer, distributor, and seller ofpremium branded spirits and wines
“

Hyperion 9
Hyperion solutions deliver information customers
need to confidently set strategy and goals,
model their businesses, plan and measure
performance, and analyze and report results. By
connecting individual processes into a coherent
system, companies are able to look inside the
management process to anticipate results,
adjust plans, and deploy key resources wisely.
Bridging Management Processes Across the Organization

10 Hyperion

UNITED STATESSECURITIES AND EXCHANGE COMMISSION
WASHINGTON, D.C. 20549_______________
FORM 10-K
[X] ANNUAL REPORT PURSUANT TO SECTION 13 OR 15(d) OF THE SECURITIESEXCHANGE ACT OF 1934 (FEE REQUIRED)
FOR THE FISCAL YEAR ENDED JUNE 30, 2002OR
[ ] TRANSITION REPORT PURSUANT TO SECTION 13 OR 15(d) OF THE SECURITIESEXCHANGE ACT OF 1934 (NO FEE REQUIRED)
For the transition period from ____________ to _____________.
________________________________
COMMISSION FILE NUMBER 0-26934
HYPERION SOLUTIONS CORPORATION(Exact name of registrant as specified in its charter)
DELAWARE 77-0277772(State or other jurisdiction of (I.R.S. Employerincorporation or organization) Identification No.)
1344 CROSSMAN AVENUE, SUNNYVALE, CALIFORNIA 94089(Address of principal executive offices, including zip code)
Registrant's telephone number, including area code: (408) 744-9500
Securities registered pursuant to Section 12(b) of the Act: NONE
Securities registered pursuant to Section 12(g) of the Act:COMMON STOCK, PAR VALUE $0.001
Indicate by check mark whether the registrant (1) has filed all reports required to be filed by Section 13 or 15(d) of theSecurities Exchange Act of 1934 during the preceding 12 months (or for such shorter period that the registrant was required tofile such reports), and (2) has been subject to such filing requirements for the past 90 days. YES [X] NO [ ]
Indicate by check mark if disclosure of delinquent filers pursuant to Item 405 of Regulation S-K is not contained herein, andwill not be contained, to the best of the registrant's knowledge, in definitive proxy or information statements incorporated byreference in Part III of this Form 10-K or any amendment to this Form 10-K. [X]
As of September 16, 2002, there were 33,547,554 shares of the registrant's common stock, $0.001 par value, outstanding. Theaggregate market value of the registrant's voting stock held by nonaffiliates as of September 16, 2002 was approximately $694million.
DOCUMENTS INCORPORATED BY REFERENCE
Portions of the registrant's Proxy Statement for its 2002 Annual Meeting of Stockholders, scheduled to be held on November13, 2002, are incorporated by reference in Part III hereof.

2
HYPERION SOLUTIONS CORPORATION
FORM 10-K
PAGEPART I.
Item 1. Business 3Item 2. Properties 10Item 3. Legal Proceedings 10Item 4. Submission of Matters to a Vote of Security Holders 11
PART II.
Item 5. Market for Registrant's Common Equity and Related Stockholder Matters 11Item 6. Selected Financial Data 12Item 7. Management's Discussion and Analysis of Financial Condition and Results of Operations 13Item 7A. Quantitative and Qualitative Disclosures About Market Risk 24Item 8. Financial Statements and Supplementary Data 25Item 9. Changes in and Disagreements with Accountants on Accounting and Financial Disclosure 46
PART III.
Item 10. Directors and Executive Officers of the Registrant 46Item 11. Executive Compensation 46Item 12. Security Ownership of Certain Beneficial Owners and Management 46Item 13. Certain Relationships and Related Transactions 46
PART IV.
Item 14. Exhibits, Financial Statement Schedules and Reports on Form 8-K 47
Signatures 49
Hyperion, the Hyperion “H” logo, Essbase, Hyperion Essbase XTD, Hyperion Planning, Hyperion Financial Management, Hyperion Performance Scorecard,Hyperion Business Modeling, Hyperion Pillar, and Hyperion Enterprise are registered trademarks or trademarks of Hyperion Solutions Corporation. All othertrademarks and company names mentioned are the property of their respective owners. All rights reserved.
3
FORWARD-LOOKING STATEMENTS
Certain information contained in this report on Form 10-K and the Annual Report is forward-looking in nature. All statementsincluded in this report on Form 10-K and the Annual Report or made by management of Hyperion Solutions Corporation andits subsidiaries (Hyperion), other than statements of historical fact, are forward-looking statements. Examples of forward-looking statements include statements regarding Hyperion's future financial results, operating results, business strategies,projected costs, products, competitive positions and plans and objectives of management for future operations. In some cases,forward-looking statements can be identified by terminology such as "may," "will," "should," "would," "expects," "plans,""anticipates," "intends," "believes," "estimates," "predicts," "potential," "continue," or the negative of these terms or othercomparable terminology. Any expectations based on these forward-looking statements are subject to risks and uncertainties andother important factors, including those discussed in the section entitled "Factors That May Affect Future Results." These andmany other factors could affect Hyperion's future financial and operating results, and could cause actual results to differmaterially from expectations based on forward-looking statements made in this document or elsewhere by Hyperion or on itsbehalf. Hyperion does not undertake an obligation to update its forward-looking statements to reflect future events orcircumstances.
PART I
ITEM 1. BUSINESS
GENERAL
Hyperion Solutions Corporation (“Hyperion”) delivers business performance management software solutions that enablecompanies to continually measure performance, anticipate results and drive profitability across key business activities. Ourcustomers use our products to help them collaborate enterprise-wide, focus resources, improve operational efficiencies andleverage opportunities for growth.
Our business performance management solutions provide comprehensive support for the entire process of goal setting, businessmodeling, planning, budgeting, performance monitoring, analyzing and reporting throughout organizations. Our productscomplement existing enterprise resource planning (ERP), customer relationship management (CRM), supply chainmanagement (SCM) and transaction systems by integrating data from multiple sources, providing a common view across theenterprise and enabling an integrated business performance management process that aligns individual goals with corporateobjectives.
We provide applications along with a development and deployment platform to enable enterprise-class business performancemanagement across a wide variety of functional and business activity areas. We use our best-of-breed online analyticalprocessing (OLAP) technology, Hyperion Essbase, as the foundation for our platform, Hyperion Essbase XTD. Componentswithin Hyperion Essbase XTD can be used individually to create tailored applications or in conjunction with our packagedapplications to support the entire business performance management process. With our platform and our packaged businessperformance management applications, we provide customers some of the deepest and broadest product offerings in themarket. In addition, we offer support and services from offices in 20 countries and work with over 330 partners to providesolutions to more than 6,000 customer organizations worldwide. Hyperion was formed in August 1998 when Arbor Software,founded in 1991, acquired Hyperion Software, founded in 1981.
INDUSTRY BACKGROUND
In response to today's competitive pressures and renewed focus on profitability, most businesses are seeking systems that cansupport the full business cycle from strategy formulation to the creation and adaptation of plans and operational execution, aswell as the monitoring and reporting of results. Companies need to unlock the volumes of transactional and operationalinformation captured in different information systems and in different formats. It is common for organizations to have multiplegeneral ledger, order entry, partner and customer interaction systems worldwide. With business performance managementsolutions, organizations can consolidate their financial and operational information and turn this raw data into meaningfulbusiness information. More importantly, our business performance management solutions can scale from executivemanagement through to the line manager.
We see five business imperatives driving increased demand for business performance management solutions. These are theneed to 1) increase visibility, agility and measurable accountability across the enterprise; 2) achieve necessary alignmentamong business and functional units for tight strategy execution; 3) increase the quality of management reports and have everymanager work from the same set of facts; 4) extend existing information technology investments in operational enterprise
4
resource planning, customer relationship management and other legacy transactional systems; and 5) make informationaccessible and actionable throughout the organization to increase the speed, quality and accuracy of decision making.
These imperatives are in contrast to the tactical manner in which some organizations address analysis requirements today.Using standalone applications, query and reporting tools and spreadsheets, for example, employees in different functional areasconduct analyses that are potentially incomplete or inaccurate. Deployment of pervasive business performance managementapplications provides consistent information and allows organizations to create and execute strategic, financial and operationalplans that are in alignment.
To be useful, all of the data must be accessed, cleansed, transformed, extracted and then analyzed using an assortment ofsophisticated quantitative methods. It must be summarized, visualized and presented in a variety of formats - from spreadsheetsand specialized financial report formats, to multidimensional views and graphical Web-based presentations - that aremeaningful and intuitive to users throughout the organization. Since most global organizations use multiple operationalsystems that capture data in different formats, integrating and interpreting this enterprise data is an increasingly criticalrequirement. To take full advantage of the value of the data stored in existing systems and accelerate decision-making requiresspecific business performance management applications that provide data quality and integrity, scalability and ease-of-useacross the organization.
Our business performance management solutions are comprehensive, scalable, open and enterprise-class. They meet industryneeds with a suite and platform approach specifically designed to leverage the investment organizations have already made inraw data collection and operational systems. Business performance management applications represent the next logical step inthe evolution of enterprise application software.
STRATEGY
Our objective is to be the leading global provider of business performance management solutions. These solutions give ourcustomers the power to leverage their information assets for strategic purposes and enable organizations to measureperformance, anticipate results and drive profitability. We intend to accomplish this by leading with our applications, as thosecustomer wins tend to drive additional platform license revenue. In addition, we will continue to expand our network ofpartners delivering business performance management capabilities on our platform, including value added solutions foremerging areas of performance management such as customer relationship, supply chain, and industry-specific markets. Wewill also continue to enhance our scalable, open Hyperion Essbase technology, deliver the best applications available andprovide complementary support and service offerings.
We believe that high levels of customer service and satisfaction are critical to the successful marketing and sale of our new andexisting products. We provide a broad range of worldwide consulting, training and support services that help customers andpartners implement, customize, enhance, support and extend their business performance management solutions. We arecommitted to maintaining a world-class workforce to deliver these offerings and support more than 330 partners that delivercomplementary products and services, meeting a wide variety of customer requirements. These solutions include additionalpackaged business performance management applications, data and application integration technologies, tools, and trainingservices that leverage the Hyperion Essbase XTD platform as the foundation. We believe that the number of partners offeringsolutions based on our business performance management applications and technology validates the value of our platform.These partner relationships increase the network effects of our platform, enhance our market reach and provide our customerswith comprehensive business performance management solutions that deliver greater flexibility and choice.
Key elements of our strategy include:
Leverage Existing Market Leadership Position. We plan to enhance the core component of our Hyperion Essbase XTDplatform for ease of development and increased interoperability of business performance management applications, with evengreater scalability and ease-of-use features and tighter integration with relational data sources. We intend to actively seek theco-development of vertical and horizontal applications with outside organizations. We also intend to enable all of ourpackaged applications to fully exploit the Hyperion Essbase XTD platform, creating a key differentiation with competingproducts. We believe that these activities will increase our ability and our partners' ability to deliver an integrated suite ofbusiness performance management applications across key market areas. We believe our key strengths are our establisheddistribution channels and comprehensive strategic technology. We also believe that our proven domain expertise andcredibility gained from market leadership in the financial area can be leveraged to fully exploit the substantial marketopportunity that exists in the applications area and expand to the adjacent operational analytics space.
5
Increase Focus and Penetration of Key Markets. We plan to focus our intellectual capital and leverage our partners to providebest-of-breed business performance management solutions in key markets, including financial management, CRM analysis,supply-chain analysis, workforce analysis, industry-specific solutions, general OLAP-based solutions and data warehousing.
Foster Strategic Partner Relationships. To accelerate the adoption of business performance management solutions, we haveestablished over 330 relationships, including the following:
- Consulting Partners, including large systems integrators, regional consulting firms, professional services organizationsand value added resellers, deliver custom application consulting and related implementation, integration and/ortraining services.
- Independent Software Vendor (ISV) Partners integrate their products with our core technology to develop businessintelligence enhancements and deliver added value with their solutions.
- Original Equipment Manufacturer (OEM) Partners embed our products in their own applications to form specializedanalytical solutions for vertical markets or functional applications.
- Distribution Partners market, distribute and support our software solutions in remote markets where we do not have awholly-owned corporate presence.
- Technology Partners offer tools and technologies that integrate with our business intelligence platform and helpcustomers build, use, and manage our analytical and business performance management solutions.
- Alliance Partners cooperatively position and market the benefits of a comprehensive, integrated, multi-vendor solutionto the marketplace based upon our business performance management products.
Our partner network enhances and expands our distribution channels and extends our business performance managementsolutions by providing a wider range of choices for our customers.
Leverage the Web for Ease-of-Implementation and Ease-of-Use. Our new packaged application products are designed toleverage web-based technologies and enable collaboration throughout the organization. By building scalable, highperformance applications that can be accessed via an intranet or the Internet, corporations can improve their business processes,gain efficiencies, improve agility to respond to changing market conditions and improve bottom line performance. Byleveraging the web browser as a user interface, a corporation's information technology department can deploy and maintainapplications quickly and easily with reduced costs. From an end-user perspective, web-based applications are easy to learn andenhance productivity, resulting in reduced training costs and faster return on investment.
Maintain Sales and Support Relationships. We license our products to customers throughout the world through a direct salesforce as well as through original equipment manufacturers, value added resellers (VARs), independent distributors and salesagents. Together with our partners, we often provide installation and post-sale consulting support to build long-term customerrelationships.
Generate Follow-on Revenues. We generate revenues from existing customers through licensing for additional users, the crossselling of licenses of new products, annual maintenance fees and sales of training and consulting services. Follow-on revenuesleverage sales and marketing resources and strengthen relationships with our customers.
BUSINESS PERFORMANCE MANAGEMENT SOFTWARE SOLUTIONS
We offer customers application software products and technology software products. Applications include financial andbusiness performance management products that provide customers the opportunity to strategize, model, plan and measureperformance. Technology products include an open, scalable, flexible and integrating platform with Hyperion Essbase as itsfoundation, and Hyperion tools, incorporating domain-specific business rules, data storage, integration, interoperability, query,reporting, visualization and development capabilities. Together with our partners, we offer a suite of business performancemanagement solutions that are compelling in the industry and help customers measure performance, anticipate results and driveprofitability.
6
Application Products
Our business performance management applications provide comprehensive support for the strategy setting, businessmodeling, planning, performance measurement, reporting and analysis needs of finance and operations staffs in organizationsworldwide. Our business performance management applications complement existing ERP and transaction systems -integrating data from multiple sources, providing a common view across the organization and enabling an integrated financialand performance management process that aligns individual goals with corporate objectives.
Hyperion Planning is a Web-based budgeting, planning and forecasting application that supports financial and operationalplanning to align with strategic plans and goals. It enables collaborative, event-based operational planning processesthroughout the organization. Using Hyperion Planning, strategic and senior managers and front line decision-makers cancommunicate a desired course of action to facilitate effective collaboration so that the planning process is optimized andefficient. When a material event occurs that changes a critical assumption, planners can quickly adapt, ensuring that plans arerelevant and useful. Hyperion Planning is built on the Hyperion Essbase XTD platform and is most appropriate for companiesseeking a solution that delivers real-time planning, sophisticated modeling, dynamic forecasting and event-driven reallocationof resources to a large number of users.
Hyperion Financial Management is a comprehensive, Web-based application that delivers global collection, financialconsolidation, reporting and analysis in a single, highly scalable solution. With Hyperion Financial Management, companiescan unify their financial information (actuals, budgets, forecasts, statistics) into a single application. They can centrallymanage and collaborate on financial information and processes for their global operations, via the Internet, intranet, extranetand a standard Web browser. Employees, branch offices and partners operate with a single, unified view of key financial dataat any moment in time. Hyperion Financial Management is designed for diverse, multi-entity organizations that have acentralized approach to managing their financial management and reporting processes and that are seeking to align theirdecision-making processes with overall business goals. It is a financial reporting and analysis system that can manage allfinancial information and deploy it enterprise-wide. Hyperion Financial Management takes advantage of the Hyperion EssbaseXTD platform and is most appropriate for companies seeking a centralized approach to comprehensive financial managementunifying all decision makers across the enterprise and leading to improved efficiencies, faster business cycle times and greatercompany agility.
Hyperion Performance Scorecard, a Balanced Scorecard Collaborative certified application, is a Web-based business analysisapplication designed to help employees throughout an organization gain a clear understanding of organizational strategy andaccountability. Hyperion Performance Scorecard helps companies set and communicate goals, establish key performancemetrics and accountability and continuously measure performance against company goals and objectives. With performancescorecarding, organizations can align and focus the enterprise on business objectives, plans and actions; empower employeeswith clearly defined performance measures; and enable continuous performance improvement and agility at all levels. Webelieve organizations that deploy Hyperion Performance Scorecard are better able to bridge the gap between strategy andexecution, engage a broader range of employees in planning activities and respond more proactively to changing businessconditions. Hyperion Performance Scorecard embeds industry-leading metric libraries, exposes world class benchmarkingservices and supports customized and standard performance measurement frameworks, including the Balanced Scorecard.
Hyperion Business Modeling is a Web-enabled business analysis application that helps organizations optimize resources andexecute efficiently. Hyperion Business Modeling is an enterprise-class activity based modeling solution that enablesorganizations to test operational and financial planning assumptions, model processes and activities, optimize resources andmeasure profitability. By using business models, managers and analysts test operational and financial plans for the purpose ofstrategic decision-making. Business modeling also enables organizations to test scenarios, validate strategies and optimizeresources to improve profitability.
Hyperion Enterprise is designed to simplify the collection, consolidation and reporting of financial results, reduce the timeorganizations spend on these activities and improve financial analysis and planning capabilities. It is appropriate for globalorganizations seeking a comprehensive consolidation and reporting solution with many remote sites and low IT supportrequirements. Complementing Hyperion Enterprise, Hyperion Enterprise Reporting is an advanced financial reportingsolution. An intuitive graphical interface helps users create sophisticated production-quality financial reports for printing oronline access. Embedded process-specific financial intelligence provides accurate and detailed financial information, while acomprehensive library of financial functions and calculations allow users to derive new metrics.
Hyperion Pillar is a business analysis application for departmental budgeting and planning. It is designed to increase thereliability and efficiency of a hierarchically controlled bottom-up budgeting process. By facilitating participation of linemanagers and business activity experts in this process, Hyperion Pillar can improve an organization's ability to shorten cyclical
7
budget cycle times and deliver consistent budget revisions and projected financial statements. Hyperion Pillar enables acompany to increase usage and decrease the maintenance of the budgeting and planning process. It is appropriate fororganizations seeking a budgeting solution supporting remote users with limited IT resource requirements.
Technology Products
Hyperion Essbase XTD uses our best-of breed OLAP technology, Hyperion Essbase, as its foundation. OLAP is an enablingtechnology that allows data to be explored well beyond the capabilities of traditional reporting systems. Using sophisticatedstatistical and mathematical calculations, intuitive multidimensional views and a highly scalable architecture, it supportsinteractive reporting, analysis, modeling and planning activities. We believe, based on independent industry analyst productevaluations and market share estimates, that Hyperion Essbase is the industry's leading OLAP technology.
Hyperion Essbase XTD provides an open and integrating platform that delivers the foundation technologies - platform services,application framework, powerful analytics, query and reporting tools - to support business performance management solutions.Built on a flexible, multi-tiered architecture, Hyperion Essbase XTD delivers scalability, performance and reliability at a lowtotal cost of ownership. With Hyperion Essbase XTD as the foundation, businesses can quickly develop and easily deploy anyof our business performance management solutions out-of-the-box. Alternatively, they can customize and extend theseapplications to meet their specific needs with Essbase XTD Application Framework and Platform Services.
Essbase XTD Platform Services are a set of business intelligence technologies that integrate data and metadata from multiplesources, perform advanced analytical processing and deploy business performance applications across the enterprise.Comprehensive platform services run on multiple operating systems, leverage multiple relational databases and access datafrom diverse ERP, CRM and SCM systems. With Essbase XTD Platform Services, businesses can leverage their existinginvestments in technology and quickly extend their analytical capabilities across the enterprise. Essbase XTD Query andReporting Services rounds out the platform services and delivers high performance enterprise reporting. Dynamicallyscheduled reports also are delivered in a variety of formats to meet individual end user needs.
Essbase XTD Application Framework is a rich tool set that enables rapid creation, delivery and deployment of enterprise-classanalytic and reporting applications for the Web. With Hyperion Application Framework, users can share and viewpersonalized content and reports from multiple data sources through a standard Web browser. Out-of-the-box solutions providea quick path to interactive analysis and reporting. Easy-to-use development tools allow users to rapidly extend, or build customanalytic applications.
SERVICES AND SUPPORT
We believe that high levels of customer service and satisfaction are important to the successful marketing and sale of ourproducts. We offer an extensive selection of worldwide training, consulting and technical support services to install,implement and support our products. Consulting and training services are not included in software license fees, but areprovided on a time and materials basis. Within the area of technical support, enhanced support offerings are not included in thesoftware license fees. Our services and support organization consisted of 760 employees as of August 31, 2002. We have alsoestablished a global network of partners who deliver implementation and training services.
Under the terms of our standard license agreement, customers may, at their option, pay a maintenance fee annually. Thismaintenance fee entitles customers to technical support, including telephone and Web-based support, and to any updates andenhancements provided for their software.
SALES AND MARKETING
We market and sell our products in North America, Latin America, Europe and Asia Pacific through our direct sales force andthrough OEMs, VARs, independent distributors and sales agents. We support our sales force with lead generation andmarketing programs, which include telemarketing, public relations, direct mail, advertising, seminars, trade shows, education,ongoing customer communication programs, third-party alliances and user group conferences. Worldwide and regional userconferences are held annually. Regional user meetings and product-specific focus groups are also scheduled periodically. Salescycles generally last from three to nine months. We have dedicated sales, marketing and technical alliance resources designedto optimize our partner relationships. The direct sales force is compensated for direct sales as well as sales made throughchannel partners to ensure appropriate cooperation with our OEMs and VARs, independent distributors and sales agents. Wehave licensed our software to more than 6,000 organizations worldwide, many of which are multidivision and/or multilocationorganizations with diverse information management requirements. In fiscal 2002, 2001 and 2000, approximately 35%, 32%
8
and 32%, respectively, of our total revenues were derived from markets outside of North America. In the past three fiscalyears, no single customer accounted for more than 10% of total revenues.
Our sales and marketing organization consisted of 718 employees as of August 31, 2002, of which approximately 235employees were quota-carrying sales representatives. We have sales offices at our worldwide headquarters in Sunnyvale,California and in more than 40 other locations throughout North America, Latin America, Europe and Asia Pacific. Productsupport and training are also available in many of these locations.
We have been able to leverage sales and marketing through our partnering strategy with channel partners that distribute orresell our products in their respective markets. We have license and distribution agreements with independent distributors andsales agents in many countries worldwide. The distributors generally maintain sales and services personnel dedicated to ourproducts. The distribution agreements generally provide for the right to offer our products within a territory in return forroyalties typically equal to 50% of license and maintenance fees.
License revenues derived from channel partners in fiscal 2002, 2001 and 2000 were 25%, 21% and 27% of total licenserevenues, respectively. Our channel partners include such firms as Deloitte & Touche LLP; Fujitsu Limited; Immix Inc.;International Business Machines Corporation; i2 Technologies, Inc.; KPMG Consulting Inc.; Lawson Associates, Inc.; andSPSS Corporation.
RESEARCH AND DEVELOPMENT
Our products have been developed by our internal staff, contract developers and through strategic acquisitions. Ourdevelopment efforts are focused on new products, as well as on maintaining the competitiveness of our current product line.As of August 31, 2002, our product development was primarily performed by 418 employees located at our facilities inSunnyvale, California; Stamford, Connecticut; Orlando, Florida; Atlanta, Georgia and Toronto, Canada.
COMPETITION
The markets in which we compete are intensely competitive, highly fragmented and characterized by rapidly changingtechnology and evolving standards. Current and potential competitors offer a variety of reporting, analysis, modeling andplanning software solutions and generally fall within four categories: (1) vendors of packaged business analysis applications;(2) vendors of enterprise software applications that support transaction processes and front/back office automation; (3) vendorsof OLAP server software that may also be marketed as part of a platform offering; and (4) vendors of front-end informationaccess tools. While competition is intense, we believe that no other competitor currently has the singular focus and breadth ofproducts and services required to deliver enterprise-wide business performance management solutions. As markets continue todevelop for business performance management products, additional competitors may enter or expand into those markets andcompetition may intensify.
Competitors, some of whom have significantly greater financial, technical, marketing and other resources than we do, may beable to respond more quickly to new or emerging technologies and changes in customer requirements or devote greaterresources to the development, promotion and sale of their products than us. Also, certain current and potential competitors mayhave greater name recognition or more extensive customer bases that could be leveraged, thereby gaining market share to ourdetriment. We expect additional competition as other established and emerging companies enter into the enterprise softwaremarket and new products and technologies are introduced. In addition, as we develop and enhance our software andcomplementary products, the resulting new functionality may duplicate the functionality of, and thus compete with, otherproducts offered by our channel partners. Increased competition could result in price reductions, fewer customer orders,reduced gross margins and loss of market share, any of which would materially adversely affect our business, operating resultsand financial condition.
Current and potential competitors may make strategic acquisitions or establish cooperative relationships among themselves orwith third-parties, thereby increasing their ability to address the needs of our existing and prospective customers. Furthercompetitive pressures, such as those resulting from competitors' discounting of their products, may require us to reduce theprice of our software products, which would materially adversely affect our business, operating results and financial condition.There can be no assurance that we will be able to compete successfully against current and future competitors, and the failureto do so would have a material adverse effect on our business, operating results and financial condition. See "Item 7. FactorsThat May Affect Future Results."

9
PROPRIETARY RIGHTS AND LICENSES
We rely primarily on a combination of patent, copyright and trademark laws, trade secrets, confidentiality procedures andcontractual provisions to protect our proprietary rights. Despite our efforts, unauthorized parties may attempt to copy aspects ofour products or to obtain and use information that we regard as proprietary. Policing unauthorized use of our products isdifficult and, while we are unable to determine the extent to which piracy of our software products exists, software piracy isexpected to be a persistent problem. In addition, the laws of some foreign countries do not protect our proprietary rights asfully as do the laws of the United States. There can be no assurance that our means of protecting our proprietary rights in theUnited States or abroad will be adequate or that competitors will not independently develop similar technology. We haveentered into source code escrow agreements with a number of our customers and channel partners requiring release of sourcecode under certain conditions. Generally, such agreements provide that such parties will have a limited, nonexclusive right touse such code in the event that there is an undismissed bankruptcy proceeding by or against us, if we cease to do business or ifwe materially fail to meet our contractual obligations. The release of source code may increase the likelihood ofmisappropriation by third-parties.
We currently have a small number of patents relating to our products, including seven United States patents and a number ofpatent applications pending in the United States and abroad. There can be no assurance that our patents will not be invalidated,circumvented or challenged, that the rights granted thereunder will provide competitive advantages to us or that any of ourpending or future patent applications, whether or not being currently challenged by applicable governmental patent examiners,will be issued with the scope of the claims sought by us, if at all. Furthermore, there can be no assurance that other companieswill not develop technologies that are similar or superior to our technology or design around the patents owned by us. In 1998,the U.S. Patent and Trademark Office granted two requests for reexamination of our U.S. Patent No. 5,359,724. Thereexamination proceedings are currently pending. An adverse outcome of the reexamination proceedings could involve loss ofsome or all of the claims of the patent. On August 29, 2002 we settled a patent infringement claim brought by Timeline, Inc.See "Item 3. Legal Proceedings" for further discussion of both of these matters.
We expect that software product developers will increasingly be subject to infringement claims as the number of products andcompetitors in our industry segment grows and the functionality of products in different industry segments overlaps. Any suchclaims, with or without merit, could be time consuming to defend, result in costly litigation, divert management's attention andresources, cause product shipment delays or require us to enter into royalty or licensing agreements. Such royalty or licensingagreements, if required, may not be available on terms acceptable to us, if at all. In the event of a successful claim of productinfringement against us and our failure or inability to license the infringed or similar technology, our business, operating resultsand financial condition would be materially adversely affected.
We rely upon certain software that we license from third-parties, including software that is integrated with our internallydeveloped software and used in our products to perform key functions. There can be no assurance that these third-partysoftware licenses will continue to be available to us on commercially reasonable terms. The loss of, or inability to maintain,any such software licenses could result in shipment delays or reductions until equivalent software could be developed,identified, licensed and integrated, which would materially adversely affect our business, operating results and financialcondition.
We distribute our products under software license agreements that grant customers a nonexclusive, nontransferable license toour products and contain terms and conditions prohibiting the unauthorized reproduction or transfer of our products. Generally,we do not provide end users with the source code for our products except under the escrow arrangements described above.
EMPLOYEES
As of August 31, 2002, we employed a total of 2,252 employees. None of our employees is represented by a labor union. Webelieve our relations with employees are good.
Our executive officers as of August 31, 2002 are as follows:
Name Age Position Jeffrey R. Rodek 49 Chairman and Chief Executive Officer Godfrey R. Sullivan 49 President and Chief Operating Officer David W. Odell 39 Chief Financial Officer W. Russell Wayman 58 Vice President, General Counsel and Secretary Nazhin Zarghamee 35 Chief Marketing Officer

10
Jeffrey R. Rodek has served as Chairman and Chief Executive Officer of Hyperion since October 1999. He has been a memberof Hyperion's Board of Directors since January 1998. Prior to joining Hyperion, Mr. Rodek served as President and WorldwideChief Operating Officer of Ingram Micro, a distributor of electronic products, from January 1995 to October 1999.
Godfrey R. Sullivan joined Hyperion as President and Chief Operating Officer in October 2001. Prior to joining Hyperion, Mr.Sullivan served as Chief Executive Officer of Promptu Corporation, an enterprise marketing automation software company,from October 2000 to August 2001. Previously, he spent eight years at AutoDesk, Inc., a design software and digital mediacompany, in various senior management positions.
David W. Odell joined Hyperion as Chief Financial Officer and Corporate Vice President in August 2000. He joined Hyperionfrom KPMG LLP, a public accounting firm. He was with KPMG for over fifteen years, most recently as a partner in the firm'sSydney, Australia office.
W. Russell Wayman joined Hyperion as Corporate Vice President, General Counsel and Secretary in January 2001. Prior tothat he was Vice President and General Counsel of Etec Systems, Inc, a semiconductor manufacturing equipment company,from 1998 to 2000, and Vice President and General Counsel of Storage Technology Corporation, a manufacturer of computerdisk and tape storage devices, from 1990 to 1998.
Nazhin Zarghamee joined Hyperion as Chief Marketing Officer in February 2002. Before joining Hyperion, Ms. Zarghameeserved as Vice President of Worldwide Marketing at Documentum, an enterprise content management company, from October1999 to October 2001. From April 1999 to October 1999, Ms. Zarghamee served as Vice President of Marketing for TheBusiness Network. From August 1994 to April 1999, Ms. Zarghamee was employed by Oracle Corporation, most recently asSenior Director of Worldwide Marketing.
ITEM 2. PROPERTIES
Our principal administrative, sales, marketing, services, training and research and development facilities are located inSunnyvale and San Francisco, California; Stamford, Connecticut; Dallas, Texas; Atlanta and Kennesaw, Georgia; Lisle,Illinois; Orlando, Florida; Toronto, Canada; Waltham, Massachusetts; Paris, France; and Singapore. We occupy approximately100,000 square feet at our worldwide headquarters in Sunnyvale, California, pursuant to a lease that expires in December 2006.We also own and occupy approximately 230,000 square feet in Stamford, Connecticut. In addition, we lease office spacethroughout the world for our local sales and services needs. We believe that our existing facilities are adequate for our currentneeds. If additional space is needed in the future, we believe that suitable space will be available on commercially reasonableterms.
ITEM 3. LEGAL PROCEEDINGS
On June 27, 2001, Timeline, Inc. filed a complaint against us in the United States District Court for the Western District ofWashington alleging that we infringe U.S. Patent Nos. 5,802,511; 6,023,694; and 6,026,392 (the "Timeline patents") andseeking a permanent injunction and monetary damages, including treble damages. On August 29, 2002, we settled the lawsuitwith Timeline, and each company agreed to dismiss its claims with prejudice. Under the settlement agreement, we obtained afully paid-up license to the Timeline patents and agreed to pay Timeline a settlement totaling $1.05 million, payable over fourmonths. This settlement has been recorded in fiscal 2002, and the resulting liability is included in accounts payable andaccrued expenses on our consolidated balance sheet.
On July 11, 1997, Gentia Software filed a request for reexamination of our U.S. Patent No. 5,359,724 with the United StatesPatent and Trademark Office (the “PTO”) arguing that the '724 patent was anticipated and obvious in light of certain prior artreferences. On September 11, 1997, the PTO granted the request for reexamination. On February 27, 1998, Gentia Softwarefiled with the PTO a request for a second reexamination of the '724 patent based on additional prior art references. On May 22,1998, the PTO granted that request for reexamination, which was later consolidated with the first reexamination. On March 31,1999, the PTO issued a non-final office action rejecting the claims of the '724 patent. We filed our response to the office actionon May 31, 1999. No final office action has been issued by the PTO. We believe that the outcome of such action will not havea material adverse effect on our financial position, results of operations or cash flows.
From time to time, in the normal course of business, various claims are made against us. At this time, in the opinion ofmanagement, there are no pending claims the outcome of which is expected to result in a material adverse effect on ourfinancial position, results of operations or cash flows.

11
ITEM 4. SUBMISSION OF MATTERS TO A VOTE OF SECURITY HOLDERS
During the fourth quarter of the fiscal year covered by this report, no matter was submitted to a vote of security holders throughthe solicitation of proxies or otherwise.
PART II
ITEM 5. MARKET FOR REGISTRANT'S COMMON EQUITY AND RELATED STOCKHOLDER MATTERS
Our common stock trades on the Nasdaq National Market under the symbol "HYSL." The following table sets forth, for theperiods indicated, the high and low sales prices of our common stock as reported on the Nasdaq National Market.
Fiscal 2002 High LowFirst quarter $16.980 $12.400Second quarter $21.580 $12.510Third quarter $27.600 $19.000Fourth quarter $27.065 $14.010
Fiscal 2001 High LowFirst quarter $34.938 $22.000Second quarter $26.625 $10.875Third quarter $24.250 $14.250Fourth quarter $17.500 $12.688
As of August 31, 2002, we had 174 stockholders of record and approximately 10,000 beneficial holders of our common stock.
We have never declared or paid any cash dividends on our capital stock. We currently intend to retain all earnings to financefuture growth and, therefore, we do not anticipate paying any cash dividends in the foreseeable future.

12
ITEM 6. SELECTED FINANCIAL DATA
Year Ended June 30,2002 2001 2000 1999 1998
Statement of Income Data: (in thousands, except per share amounts)
Revenues $ 492,018 $ 528,011 $ 499,332 $ 431,722 $ 382,968Costs and expenses (1) 471,944 582,891 460,935 416,600 330,677Operating income (loss) 20,074 (54,880) 38,397 15,122 52,291Income (loss) before extraordinary item 14,379 (32,537) 28,819 7,973 34,757Net income (loss) 14,981 (31,073) 28,819 7,973 34,757
Basic EPS: Income (loss) before extraordinary item $ 0.44 $ (0.99) $ 0.91 $ 0.26 $ 1.19 Net income (loss) $ 0.46 $ (0.95) $ 0.91 $ 0.26 $ 1.19
Diluted EPS: Income (loss) before extraordinary item $ 0.43 $ (0.99) $ 0.87 $ 0.26 $ 1.13 Net income (loss) $ 0.45 $ (0.95) $ 0.87 $ 0.26 $ 1.13
Weighted average shares outstanding: Basic 32,836 32,592 31,665 30,196 29,121 Diluted 33,491 32,592 33,107 30,855 30,770
Balance Sheet Data:
Cash, cash equivalents and short-term investments $ 330,258 $ 255,366 $ 295,159 $ 271,856 $ 257,347Working capital 281,501 254,141 297,745 230,910 218,033Total assets 583,890 570,393 589,891 512,894 476,665Deferred revenue 94,910 100,234 88,828 81,089 63,724Long-term debt 80,802 91,045 102,518 103,752 107,314Stockholders' equity 299,657 267,319 309,861 240,776 213,225
(1) Costs and expenses for the years ended June 30, 2002, 2001 and 2000 include restructuring and non-recurring charges of$0.1 million, $42.8 million and $2.1 million, respectively (see Note 14 of the Notes to Consolidated Financial Statementsfor discussion of these restructuring and non-recurring charges).
(2) Certain prior year balances have been reclassified to conform to the current year presentation.
13
ITEM 7. MANAGEMENT'S DISCUSSION AND ANALYSIS OF FINANCIAL CONDITION AND RESULTS OFOPERATIONS
OVERVIEW
Hyperion delivers business performance management software solutions that enable companies to continually measureperformance, anticipate results and drive profitability across key business activities. Our customers use our products to helpthem collaborate enterprise-wide, focus resources, improve operational efficiencies and leverage opportunities for growth.
Our business performance management solutions provide comprehensive support for the entire process of goal setting, businessmodeling, planning, budgeting, performance monitoring, analyzing and reporting throughout organizations. Our productscomplement existing enterprise resource planning, customer relationship management, supply chain management andtransaction systems by integrating data from multiple sources, providing a common view across the enterprise and enabling anintegrated business performance management process that aligns individual goals with corporate objectives.
We provide applications along with a development and deployment platform to enable enterprise-class business performancemanagement across a wide variety of functional and business activity areas. We use our best-of-breed online analyticalprocessing technology, Hyperion Essbase, as the foundation for our platform, Hyperion Essbase XTD. Components withinHyperion Essbase XTD can be used individually to create tailored applications or in conjunction with our packagedapplications to support the entire business performance management process. With our platform and our packaged businessperformance management applications, we provide customers some of the deepest and broadest product offerings in themarket. In addition, we offer support and services from offices in 20 countries and work with over 330 partners to providesolutions to more than 6,000 customer organizations worldwide. Hyperion was formed in August 1998 when Arbor Software,founded in 1991, acquired Hyperion Software, founded in 1981.
CRITICAL ACCOUNTING POLICIES
The preparation of financial statements in conformity with accounting principles generally accepted in the United Statesrequires management to make estimates and assumptions that affect the reported amounts of assets and liabilities anddisclosure of contingent assets and liabilities at the date of the financial statements and the reported amounts of revenues andexpenses during the reporting period. Actual results could differ from those estimates, and such differences could affect theresults of operations reported in future periods. We believe the following critical accounting policies affect our moresignificant judgments and estimates used in the preparation of our consolidated financial statements.
Revenue Recognition
We derive revenues from the licensing of our software products and providing maintenance and professional services. Ourstandard software license agreement is a perpetual license to use our products on an end user, concurrent user or centralprocessing unit basis. We record revenue from licensing of software products to end users provided there is persuasiveevidence of an arrangement, the fee is fixed and determinable, collection is reasonably assured and delivery of the product hasoccurred as prescribed by Statement of Position (“SOP”) No. 97-2, “Software Revenue Recognition,” issued by the AmericanInstitute of Certified Public Accountants. For arrangements with multiple elements, and for which vendor specific objectiveevidence (“VSOE”) of fair value exists for the undelivered elements, we recognize revenue for the delivered elements basedupon the residual method in accordance with SOP 98-9, “Modifications of SOP 97-2 with Respect to Certain Transactions.”VSOE of fair value for all elements of an arrangement is based upon the normal pricing and discounting practices for thoseproducts and services when sold separately. VSOE of fair value for services is based upon the standard hourly rate we chargefor such services when sold separately. VSOE of fair value for maintenance is measured by the stated renewal rates includedin the contracts. If we cannot objectively determine the fair value of any undelivered element included in a multiple-elementarrangement, we defer revenue until all elements are delivered, services have been performed or until fair value can beobjectively determined. License revenue from resellers or distributors is recognized upon sell-through to the end customer.Amounts billed or payments received in advance of revenue recognition are recorded as deferred revenue.
Maintenance agreements are generally a 12 month prepaid contract that is recognized ratably over the period. Customers mayalso enter into a professional services arrangement that is typically on a time and materials basis and includes consulting andtraining services. Consulting and training revenues are typically recognized as earned.
Consulting revenues are generated primarily from implementation services related to the installation of our products. Thesearrangements are generally accounted for separately from the license revenue because the arrangements qualify as “servicetransactions” as defined in SOP 97-2. Our services are generally not essential to the functionality of the software. Our

14
products are fully functional upon delivery of the product and implementation does not require any significant modification oralteration. Our services often include assistance with product adoption. Other significant factors considered in determiningwhether the revenue should be accounted for separately include degree of risk, availability of services from other vendors,timing of payments and impact of milestones or acceptance criteria on the realizability of the software license fee. Customersgenerally purchase these services to facilitate the adoption of our products and obtain dedicated personnel to participate in theservices being performed, but they may also decide to use their own internal resources or appoint other professional serviceorganizations to provide these services. Payments related to the software product to which the services relate are typicallybilled independently from the services and, therefore, are not coincident with performance of such services. Licenseagreements generally do not include acceptance provisions. If an arrangement does not qualify for separate accounting of thelicense and service elements, license revenue is generally recognized together with the consulting services using thepercentage-of-completion method of contract accounting in accordance with SOP No. 81-1, "Accounting for Performance ofConstruction-Type and Certain Product-Type Contracts" and Accounting Research Bulletin No. 45, "Long-Term Construction-Type Contracts.”
Allowance for Doubtful Accounts
We make judgments as to our ability to collect outstanding receivables and provide allowances for a portion of receivableswhen collection becomes doubtful. Provisions are made based upon a specific review of all significant outstanding invoices.For those invoices not specifically reviewed, provisions are made at differing rates, based upon the age of the receivable. Indetermining these percentages, we analyze our historical collection experience, customer concentrations, customer credit-worthiness and current economic trends. If the historical data we use to calculate the allowance provided for doubtful accountsdoes not reflect the future ability to collect outstanding receivables, additional provisions for doubtful accounts may be neededand future results of operations could be adversely affected.
Income Taxes
Income taxes are accounted for using an asset and liability approach, which requires the recognition of taxes payable orrefundable for the current year and deferred tax assets and liabilities for the future tax consequences of events that have beenrecognized in our financial statements or tax returns. The measurement of current and deferred tax assets and liabilities arebased on provisions of the enacted tax law. The effects of future changes in tax laws or rates are not anticipated.
During the preparation of our consolidated financial statements, we are required to estimate our income taxes in each of thejurisdictions in which we operate. This process involves us estimating our actual current tax exposure together with assessingtemporary differences resulting from differing treatment of items, such as deferred revenue, for tax and accounting purposes.These differences result in deferred tax assets and liabilities, which are included within our consolidated balance sheet. Wethen assess the likelihood that our deferred tax assets will be recovered from future taxable income, and, to the extent webelieve that recovery is not likely, we establish a valuation allowance. To the extent we establish a valuation allowance orincrease this allowance in a period, we record an expense within the tax provision in our statements of income.
Significant management judgment is required in determining our provision for income taxes, our deferred tax assets andliabilities and any valuation allowance recorded against our net deferred tax assets. We have recorded a valuation allowancedue to uncertainties related to our ability to utilize some of our deferred tax assets, primarily relating to net operating lossescarried forward, before they expire. The valuation allowance is based on our estimates of taxable income by jurisdiction inwhich we operate and the period over which our deferred tax assets will be recoverable. In the event that actual results differfrom these estimates, or we adjust these estimates in future periods, we may need to establish an additional valuationallowance, which could materially impact our financial position and results of operations.
Valuation of Long-Lived and Intangible Assets
We evaluate the recoverability of our property and equipment and intangible assets in accordance with Statement of FinancialAccounting Standards (“SFAS”) No. 121, "Accounting for the Impairment of Long-Lived Assets and for Long-Lived Assets tobe Disposed of." SFAS No. 121 requires us to review for impairment of long-lived assets whenever events or changes incircumstances indicate that the carrying amount of an asset may not be recoverable. Factors we consider important whichcould trigger an impairment review include:
• significant underperformance relative to expected historical or projected future operating results;• significant changes in the manner of use of the assets or the strategy for our overall business;• significant negative industry or economic trends;• significant decline in our stock price for a sustained period; and• our market capitalization relative to net book value.
15
When we determine that the carrying amount of long-lived or intangible assets may not be recoverable based upon theexistence of one or more of the above indicators, we assess the assets for impairment based on the estimated futureundiscounted cash flows expected to result from the use of the asset and its eventual disposition. If the carrying amount of anasset exceeds its estimated future undiscounted cash flows, an impairment loss is recorded for the excess of the asset’s carryingamount over its fair value. Fair value is generally determined based on the estimated future discounted cash flows over theremaining useful life of the of the asset using a discount rate determined by our management to be commensurate with the riskinherent in our current business model. The assumptions supporting the cash flows, including the discount rates, aredetermined using our best estimates as of the date of the impairment review. If these estimates or their related assumptionschange in the future, we may be required to record additional impairment charges for these assets and future results ofoperations could be adversely affected.
RESULTS OF OPERATIONS
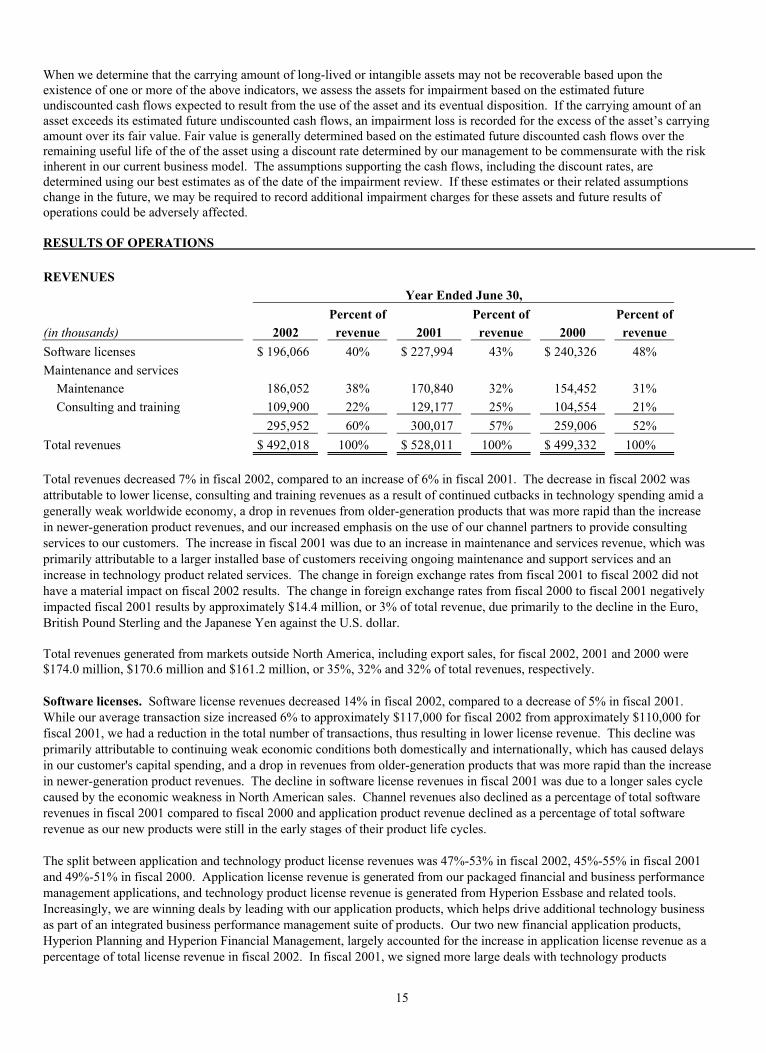
REVENUESYear Ended June 30,
Percent of Percent of Percent of(in thousands) 2002 revenue 2001 revenue 2000 revenue
Software licenses $ 196,066 40% $ 227,994 43% $ 240,326 48%
Maintenance and services Maintenance 186,052 38% 170,840 32% 154,452 31%
Consulting and training 109,900 22% 129,177 25% 104,554 21%
295,952 60% 300,017 57% 259,006 52%
Total revenues $ 492,018 100% $ 528,011 100% $ 499,332 100%
Total revenues decreased 7% in fiscal 2002, compared to an increase of 6% in fiscal 2001. The decrease in fiscal 2002 wasattributable to lower license, consulting and training revenues as a result of continued cutbacks in technology spending amid agenerally weak worldwide economy, a drop in revenues from older-generation products that was more rapid than the increasein newer-generation product revenues, and our increased emphasis on the use of our channel partners to provide consultingservices to our customers. The increase in fiscal 2001 was due to an increase in maintenance and services revenue, which wasprimarily attributable to a larger installed base of customers receiving ongoing maintenance and support services and anincrease in technology product related services. The change in foreign exchange rates from fiscal 2001 to fiscal 2002 did nothave a material impact on fiscal 2002 results. The change in foreign exchange rates from fiscal 2000 to fiscal 2001 negativelyimpacted fiscal 2001 results by approximately $14.4 million, or 3% of total revenue, due primarily to the decline in the Euro,British Pound Sterling and the Japanese Yen against the U.S. dollar.
Total revenues generated from markets outside North America, including export sales, for fiscal 2002, 2001 and 2000 were$174.0 million, $170.6 million and $161.2 million, or 35%, 32% and 32% of total revenues, respectively.
Software licenses. Software license revenues decreased 14% in fiscal 2002, compared to a decrease of 5% in fiscal 2001.While our average transaction size increased 6% to approximately $117,000 for fiscal 2002 from approximately $110,000 forfiscal 2001, we had a reduction in the total number of transactions, thus resulting in lower license revenue. This decline wasprimarily attributable to continuing weak economic conditions both domestically and internationally, which has caused delaysin our customer's capital spending, and a drop in revenues from older-generation products that was more rapid than the increasein newer-generation product revenues. The decline in software license revenues in fiscal 2001 was due to a longer sales cyclecaused by the economic weakness in North American sales. Channel revenues also declined as a percentage of total softwarerevenues in fiscal 2001 compared to fiscal 2000 and application product revenue declined as a percentage of total softwarerevenue as our new products were still in the early stages of their product life cycles.
The split between application and technology product license revenues was 47%-53% in fiscal 2002, 45%-55% in fiscal 2001and 49%-51% in fiscal 2000. Application license revenue is generated from our packaged financial and business performancemanagement applications, and technology product license revenue is generated from Hyperion Essbase and related tools.Increasingly, we are winning deals by leading with our application products, which helps drive additional technology businessas part of an integrated business performance management suite of products. Our two new financial application products,Hyperion Planning and Hyperion Financial Management, largely accounted for the increase in application license revenue as apercentage of total license revenue in fiscal 2002. In fiscal 2001, we signed more large deals with technology products

16
included whereas in fiscal 2000 we sold a significant number of pure application product deals, which resulted in a decrease inapplication license revenue as a percentage of total license revenue in fiscal 2001. In addition, Hyperion Planning andHyperion Financial Management were still in the early stages of their product life cycles in fiscal 2001 and the first half offiscal 2002. (See the heading “Product Enhancement and New Product Introductions Involve Inherent Risks” in the sectionentitled “Factors that May Affect Future Results.”)
We market our products through our direct sales force and channel partners. Historically, we have generated the majority of ourrevenue from the direct sales force. We continue to focus on complementing our direct sales force with channel partners,which consists of OEMs, VARs, independent distributors and sales agents. Revenue from all channel partners comprised 25%,21% and 27% of license revenue in fiscal 2002, 2001 and 2000, respectively. The increase in the percentage of total licenserevenue derived through our channel partners in fiscal 2002 was primarily due to a greater emphasis on effectively leveragingour channel partners. This increase continues to bring us closer to our target for direct sales force and channel partner revenuesplit of 67% - 33%. No single partner represented more than 10% of total revenue during fiscal 2002, 2001 or 2000.
Maintenance and services. Maintenance and services revenue decreased 1% in fiscal 2002, compared to an increase of 16%in fiscal 2001. The decrease in absolute dollars in fiscal 2002 was primarily due to a 15% decrease in consulting and trainingrevenues. Consulting revenues decreased as a result of our increased use of our channel partners to provide consulting servicesand general economic weakness. Partially offsetting the decrease in consulting revenue was a 9% increase in maintenancerevenue, which was due to year-over-year growth of our installed customer base.
Maintenance and services revenue increased 16% in fiscal 2001 due primarily to the 24% increase in services revenue relatedto the increase in technology product related services. Maintenance revenues increased 11% in fiscal 2001 due to a largerinstalled base of customers receiving ongoing maintenance and support services.
COST OF REVENUESYear Ended June 30,
Gross Gross Gross(in thousands) 2002 margin 2001 margin 2000 margin
Software licenses $ 15,430 92% $ 16,334 93% $ 8,782 96%
Maintenance and services 137,047 54% 161,016 46% 146,348 44%
Cost of software license revenues. Cost of software license revenues consists primarily of royalty expenses, cost of productpackaging and documentation materials, amortization of capitalized software development costs and amortization of acquiredtechnologies. The 6% decrease in the cost of software license revenues in fiscal 2002 compared to fiscal 2001 was primarilyattributable to the 14% decrease in software license revenue and the related decrease in royalty payments to third-parties. The86% increase in the cost of software license revenues in fiscal 2001 compared to fiscal 2000 principally reflects increasedroyalty payments to third-parties for software supplied by them and distributed by us. The total cost of software licenserevenues as a percentage of license revenues was 8%, 7% and 4% for fiscal 2002, 2001 and 2000, respectively.
In fiscal 2002, 2001 and 2000, we capitalized $0.6 million, $2.2 million and $2.6 million of software product developmentcosts, respectively, in accordance with SFAS No. 86, "Accounting for the Costs of Computer Software to be Sold, Leased, orOtherwise Marketed." The amounts capitalized relate to development and localization of our software products. Capitalizedsoftware product development costs are amortized over the estimated economic life of the products, but generally for no morethan three years. The amortization of capitalized product development costs begins upon the general release of the software tocustomers.
Cost of maintenance and services revenues. The cost of providing maintenance and services consists largely ofcompensation and benefits for consulting, education and support personnel. The 15% decrease in cost of maintenance andservices revenue in fiscal 2002 compared to fiscal 2001 was primarily due to controls over headcount and employee relatedexpenses, mainly as a result of our restructuring in the fourth quarter of fiscal 2001. The decrease was also due in part to areduction in variable pay as a result of lower consulting revenues. The continued gross margin improvement on maintenanceand services revenue is a direct reflection of our focus on margin improvement and the results of rebalancing our cost structure.
The 10% increase in the cost of maintenance and service revenues in fiscal 2001 compared to fiscal 2000 was due primarily toadditional staffing expenses for both installation and ongoing support services. These staffing expenses grew with an increasein headcount and utilization of independent contractors to assist with the implementation of our technology products.
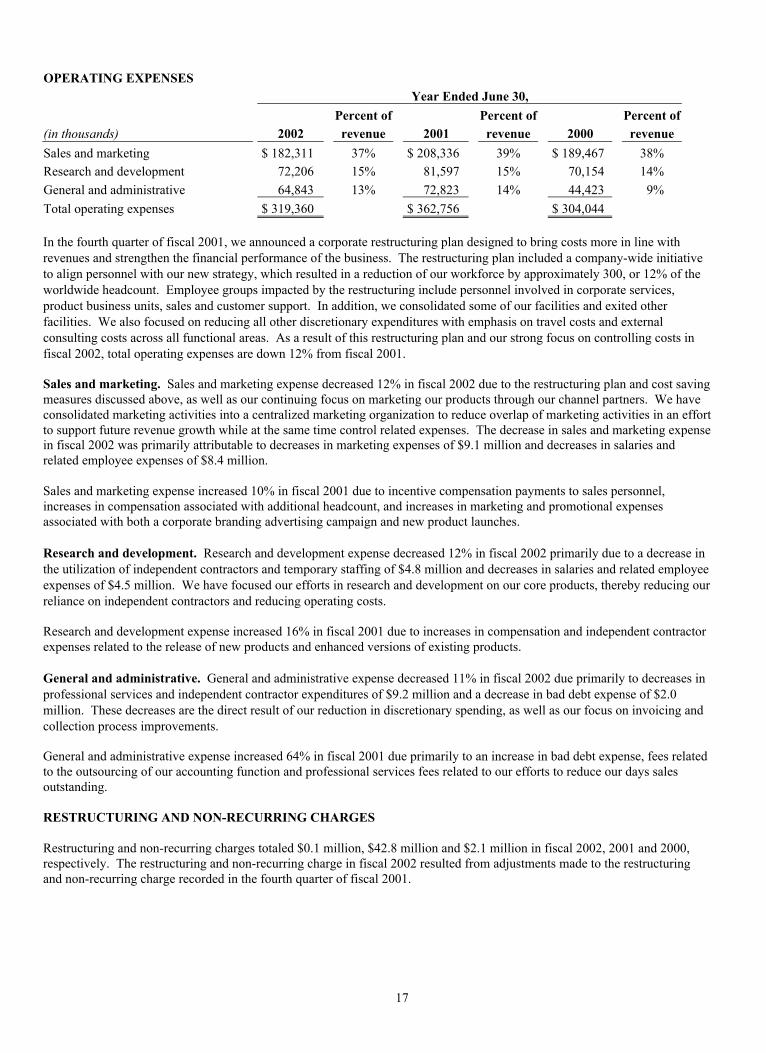
17
OPERATING EXPENSESYear Ended June 30,
Percent of Percent of Percent of(in thousands) 2002 revenue 2001 revenue 2000 revenue
Sales and marketing $ 182,311 37% $ 208,336 39% $ 189,467 38%Research and development 72,206 15% 81,597 15% 70,154 14%
General and administrative 64,843 13% 72,823 14% 44,423 9%
Total operating expenses $ 319,360 $ 362,756 $ 304,044
In the fourth quarter of fiscal 2001, we announced a corporate restructuring plan designed to bring costs more in line withrevenues and strengthen the financial performance of the business. The restructuring plan included a company-wide initiativeto align personnel with our new strategy, which resulted in a reduction of our workforce by approximately 300, or 12% of theworldwide headcount. Employee groups impacted by the restructuring include personnel involved in corporate services,product business units, sales and customer support. In addition, we consolidated some of our facilities and exited otherfacilities. We also focused on reducing all other discretionary expenditures with emphasis on travel costs and externalconsulting costs across all functional areas. As a result of this restructuring plan and our strong focus on controlling costs infiscal 2002, total operating expenses are down 12% from fiscal 2001.
Sales and marketing. Sales and marketing expense decreased 12% in fiscal 2002 due to the restructuring plan and cost savingmeasures discussed above, as well as our continuing focus on marketing our products through our channel partners. We haveconsolidated marketing activities into a centralized marketing organization to reduce overlap of marketing activities in an effortto support future revenue growth while at the same time control related expenses. The decrease in sales and marketing expensein fiscal 2002 was primarily attributable to decreases in marketing expenses of $9.1 million and decreases in salaries andrelated employee expenses of $8.4 million.
Sales and marketing expense increased 10% in fiscal 2001 due to incentive compensation payments to sales personnel,increases in compensation associated with additional headcount, and increases in marketing and promotional expensesassociated with both a corporate branding advertising campaign and new product launches.
Research and development. Research and development expense decreased 12% in fiscal 2002 primarily due to a decrease inthe utilization of independent contractors and temporary staffing of $4.8 million and decreases in salaries and related employeeexpenses of $4.5 million. We have focused our efforts in research and development on our core products, thereby reducing ourreliance on independent contractors and reducing operating costs.
Research and development expense increased 16% in fiscal 2001 due to increases in compensation and independent contractorexpenses related to the release of new products and enhanced versions of existing products.
General and administrative. General and administrative expense decreased 11% in fiscal 2002 due primarily to decreases inprofessional services and independent contractor expenditures of $9.2 million and a decrease in bad debt expense of $2.0million. These decreases are the direct result of our reduction in discretionary spending, as well as our focus on invoicing andcollection process improvements.
General and administrative expense increased 64% in fiscal 2001 due primarily to an increase in bad debt expense, fees relatedto the outsourcing of our accounting function and professional services fees related to our efforts to reduce our days salesoutstanding.
RESTRUCTURING AND NON-RECURRING CHARGES
Restructuring and non-recurring charges totaled $0.1 million, $42.8 million and $2.1 million in fiscal 2002, 2001 and 2000,respectively. The restructuring and non-recurring charge in fiscal 2002 resulted from adjustments made to the restructuringand non-recurring charge recorded in the fourth quarter of fiscal 2001.
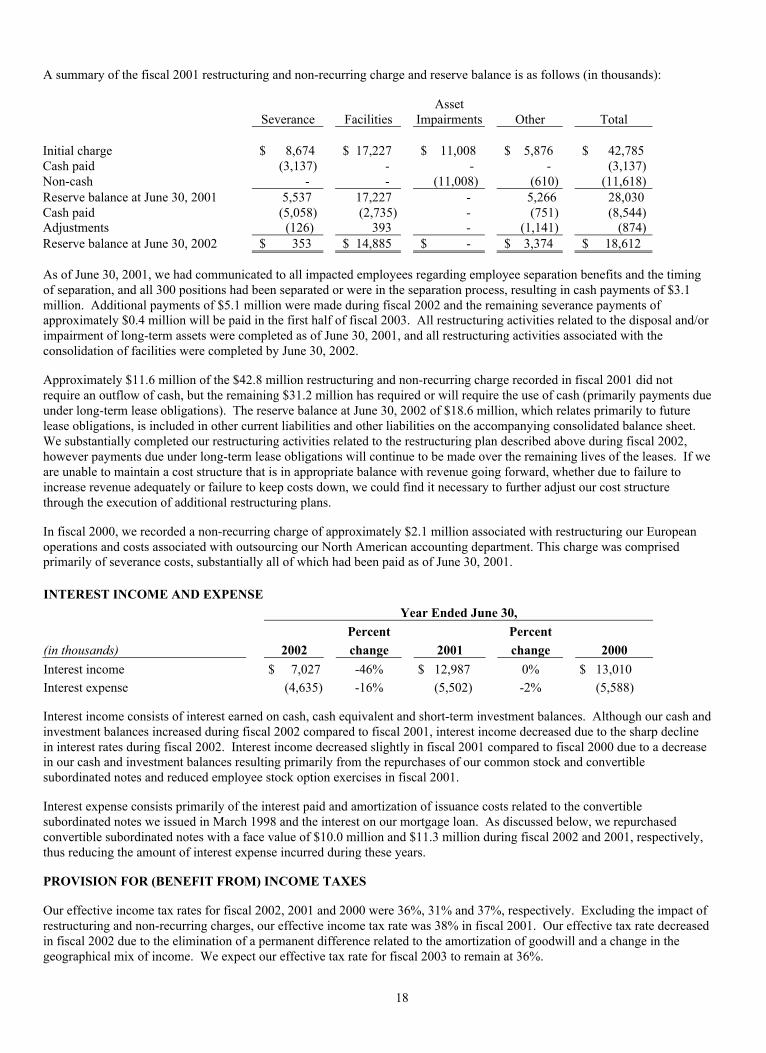
18
A summary of the fiscal 2001 restructuring and non-recurring charge and reserve balance is as follows (in thousands):
Severance FacilitiesAsset
Impairments Other Total
Initial charge $ 8,674 $ 17,227 $ 11,008 $ 5,876 $ 42,785Cash paid (3,137) - - - (3,137)Non-cash - - (11,008) (610) (11,618)Reserve balance at June 30, 2001 5,537 17,227 - 5,266 28,030Cash paid (5,058) (2,735) - (751) (8,544)Adjustments (126) 393 - (1,141) (874)Reserve balance at June 30, 2002 $ 353 $ 14,885 $ - $ 3,374 $ 18,612
As of June 30, 2001, we had communicated to all impacted employees regarding employee separation benefits and the timingof separation, and all 300 positions had been separated or were in the separation process, resulting in cash payments of $3.1million. Additional payments of $5.1 million were made during fiscal 2002 and the remaining severance payments ofapproximately $0.4 million will be paid in the first half of fiscal 2003. All restructuring activities related to the disposal and/orimpairment of long-term assets were completed as of June 30, 2001, and all restructuring activities associated with theconsolidation of facilities were completed by June 30, 2002.
Approximately $11.6 million of the $42.8 million restructuring and non-recurring charge recorded in fiscal 2001 did notrequire an outflow of cash, but the remaining $31.2 million has required or will require the use of cash (primarily payments dueunder long-term lease obligations). The reserve balance at June 30, 2002 of $18.6 million, which relates primarily to futurelease obligations, is included in other current liabilities and other liabilities on the accompanying consolidated balance sheet.We substantially completed our restructuring activities related to the restructuring plan described above during fiscal 2002,however payments due under long-term lease obligations will continue to be made over the remaining lives of the leases. If weare unable to maintain a cost structure that is in appropriate balance with revenue going forward, whether due to failure toincrease revenue adequately or failure to keep costs down, we could find it necessary to further adjust our cost structurethrough the execution of additional restructuring plans.
In fiscal 2000, we recorded a non-recurring charge of approximately $2.1 million associated with restructuring our Europeanoperations and costs associated with outsourcing our North American accounting department. This charge was comprisedprimarily of severance costs, substantially all of which had been paid as of June 30, 2001.
INTEREST INCOME AND EXPENSEYear Ended June 30,
Percent Percent(in thousands) 2002 change 2001 change 2000
Interest income $ 7,027 -46% $ 12,987 0% $ 13,010Interest expense (4,635) -16% (5,502) -2% (5,588)
Interest income consists of interest earned on cash, cash equivalent and short-term investment balances. Although our cash andinvestment balances increased during fiscal 2002 compared to fiscal 2001, interest income decreased due to the sharp declinein interest rates during fiscal 2002. Interest income decreased slightly in fiscal 2001 compared to fiscal 2000 due to a decreasein our cash and investment balances resulting primarily from the repurchases of our common stock and convertiblesubordinated notes and reduced employee stock option exercises in fiscal 2001.
Interest expense consists primarily of the interest paid and amortization of issuance costs related to the convertiblesubordinated notes we issued in March 1998 and the interest on our mortgage loan. As discussed below, we repurchasedconvertible subordinated notes with a face value of $10.0 million and $11.3 million during fiscal 2002 and 2001, respectively,thus reducing the amount of interest expense incurred during these years.
PROVISION FOR (BENEFIT FROM) INCOME TAXES
Our effective income tax rates for fiscal 2002, 2001 and 2000 were 36%, 31% and 37%, respectively. Excluding the impact ofrestructuring and non-recurring charges, our effective income tax rate was 38% in fiscal 2001. Our effective tax rate decreasedin fiscal 2002 due to the elimination of a permanent difference related to the amortization of goodwill and a change in thegeographical mix of income. We expect our effective tax rate for fiscal 2003 to remain at 36%.

19
EXTRAORDINARY GAIN
During fiscal 2002, we repurchased convertible subordinated notes with a face value of $10.0 million for a total cost of $8.9million, resulting in an extraordinary gain of approximately $0.6 million after income taxes, or approximately $0.02 per share.During fiscal 2001, we repurchased convertible subordinated notes with a face value of $11.3 million for a total cost of $8.7million, resulting in an extraordinary gain of approximately $1.5 million after income taxes, or approximately $0.04 per share.Depending on market conditions and other factors, we may repurchase additional convertible subordinated notes in the openmarket in fiscal 2003.
NET INCOME (LOSS)
As a result of the above factors, we generated net income of $15.0 million, or $0.45 per diluted share, in fiscal 2002 comparedto a net loss of $31.1 million, or $0.95 per diluted share, in fiscal 2001, and net income of $28.8 million, or $0.87 per dilutedshare, in fiscal 2000.
LIQUIDITY AND CAPITAL RESOURCES
Year Ended June 30,
Percent Percent(in thousands) 2002 change 2001 change 2000
Cash, cash equivalents and short-term investments $ 330,258 29% $ 255,366 -13% $ 295,159
Working capital 281,501 11% 254,141 -15% 297,745Net cash provided by operating activities 84,355 170% 31,273 13% 27,774
Net cash used in investing activities (14,625) -62% (38,959) 50% (25,986)Net cash provided by (used in) financing activities 4,126 123% (18,106) -159% 30,672
To date, we have financed our business through positive cash flow from operations and, to a lesser extent, through the issuanceof capital stock and convertible subordinated notes. During fiscal 2002, 2001 and 2000, we invested our cash primarily in stateand municipal bonds, U.S. government and agency obligations, corporate notes and other highly-liquid securities withmaturities of three months or less.
In fiscal 2002, 2001 and 2000, we generated positive cash flow from operations of $84.3 million, $31.3 million and $27.8million, respectively. The considerable increase in operating cash flows for fiscal 2002 was primarily attributable to the netincome for the year and a significant decrease in accounts receivable, resulting from our focus on invoicing and collectionprocess improvements.
Net cash used in investing activities amounted to $14.6 million, $39.0 million and $26.0 million in fiscal 2002, 2001 and 2000,respectively. Our capital expenditures in fiscal 2002, 2001 and 2000 consisted primarily of purchases of resources to manageour operations, including computer hardware and software and leasehold improvements. The higher level of purchases ofproperty and equipment in fiscal 2001 compared to fiscal 2002 and 2000 was attributable to the acquisition of several criticalbusiness systems during fiscal 2001, including Vantive, Callidus and our ERP platform.
Net cash provided by financing activities was $4.1 million in fiscal 2002, compared to net cash used in financing activities of$18.1 million in fiscal 2001 and net cash provided by financing activities of $30.7 million in fiscal 2000. The cash provided byfinancing activities in fiscal 2002 was due to $13.2 million of proceeds from the exercise of stock options and the employeestock purchase plan, which was partially offset by $8.9 million used to repurchase convertible subordinated notes. Thenegative cash flow from financing activities in fiscal 2001 primarily resulted from the repurchases of our common stock andconvertible subordinated notes during the period. In November 2000, our board of directors authorized the repurchase of up to$100.0 million of our outstanding common stock at market prices over the following twelve months. Pursuant to thisrepurchase program, we repurchased 1,389,000 shares during fiscal 2001 at a cost of approximately $23.8 million. Duringfiscal 2001, we also repurchased convertible subordinated notes for a total cost of $8.7 million. These amounts were partiallyoffset by proceeds from the exercise of stock options and the employee stock purchase plan of $14.0 million for fiscal 2001.During fiscal 2000, the cash provided by financing activities resulted from proceeds from the exercise of stock options and theemployee stock purchase plan of $35.2 million. In fiscal 2000, we also made principal payments of $4.5 million related to theloan agreement with the Connecticut Development Authority governing the $9.5 million mortgage loan issued to us in 1995 topurchase an office and research facility in Stamford, Connecticut.
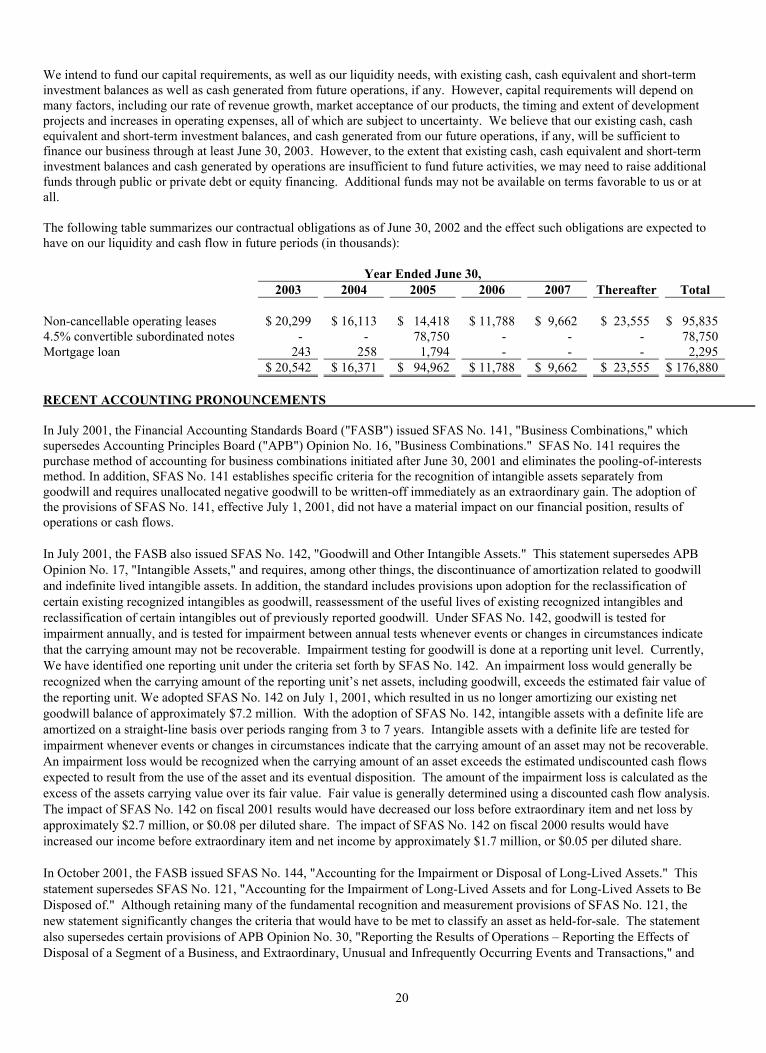
20
We intend to fund our capital requirements, as well as our liquidity needs, with existing cash, cash equivalent and short-terminvestment balances as well as cash generated from future operations, if any. However, capital requirements will depend onmany factors, including our rate of revenue growth, market acceptance of our products, the timing and extent of developmentprojects and increases in operating expenses, all of which are subject to uncertainty. We believe that our existing cash, cashequivalent and short-term investment balances, and cash generated from our future operations, if any, will be sufficient tofinance our business through at least June 30, 2003. However, to the extent that existing cash, cash equivalent and short-terminvestment balances and cash generated by operations are insufficient to fund future activities, we may need to raise additionalfunds through public or private debt or equity financing. Additional funds may not be available on terms favorable to us or atall.
The following table summarizes our contractual obligations as of June 30, 2002 and the effect such obligations are expected tohave on our liquidity and cash flow in future periods (in thousands):
Year Ended June 30,2003 2004 2005 2006 2007 Thereafter Total
Non-cancellable operating leases $ 20,299 $ 16,113 $ 14,418 $ 11,788 $ 9,662 $ 23,555 $ 95,8354.5% convertible subordinated notes - - 78,750 - - - 78,750Mortgage loan 243 258 1,794 - - - 2,295
$ 20,542 $ 16,371 $ 94,962 $ 11,788 $ 9,662 $ 23,555 $ 176,880
RECENT ACCOUNTING PRONOUNCEMENTS
In July 2001, the Financial Accounting Standards Board ("FASB") issued SFAS No. 141, "Business Combinations," whichsupersedes Accounting Principles Board ("APB") Opinion No. 16, "Business Combinations." SFAS No. 141 requires thepurchase method of accounting for business combinations initiated after June 30, 2001 and eliminates the pooling-of-interestsmethod. In addition, SFAS No. 141 establishes specific criteria for the recognition of intangible assets separately fromgoodwill and requires unallocated negative goodwill to be written-off immediately as an extraordinary gain. The adoption ofthe provisions of SFAS No. 141, effective July 1, 2001, did not have a material impact on our financial position, results ofoperations or cash flows.
In July 2001, the FASB also issued SFAS No. 142, "Goodwill and Other Intangible Assets." This statement supersedes APBOpinion No. 17, "Intangible Assets," and requires, among other things, the discontinuance of amortization related to goodwilland indefinite lived intangible assets. In addition, the standard includes provisions upon adoption for the reclassification ofcertain existing recognized intangibles as goodwill, reassessment of the useful lives of existing recognized intangibles andreclassification of certain intangibles out of previously reported goodwill. Under SFAS No. 142, goodwill is tested forimpairment annually, and is tested for impairment between annual tests whenever events or changes in circumstances indicatethat the carrying amount may not be recoverable. Impairment testing for goodwill is done at a reporting unit level. Currently,We have identified one reporting unit under the criteria set forth by SFAS No. 142. An impairment loss would generally berecognized when the carrying amount of the reporting unit’s net assets, including goodwill, exceeds the estimated fair value ofthe reporting unit. We adopted SFAS No. 142 on July 1, 2001, which resulted in us no longer amortizing our existing netgoodwill balance of approximately $7.2 million. With the adoption of SFAS No. 142, intangible assets with a definite life areamortized on a straight-line basis over periods ranging from 3 to 7 years. Intangible assets with a definite life are tested forimpairment whenever events or changes in circumstances indicate that the carrying amount of an asset may not be recoverable.An impairment loss would be recognized when the carrying amount of an asset exceeds the estimated undiscounted cash flowsexpected to result from the use of the asset and its eventual disposition. The amount of the impairment loss is calculated as theexcess of the assets carrying value over its fair value. Fair value is generally determined using a discounted cash flow analysis.The impact of SFAS No. 142 on fiscal 2001 results would have decreased our loss before extraordinary item and net loss byapproximately $2.7 million, or $0.08 per diluted share. The impact of SFAS No. 142 on fiscal 2000 results would haveincreased our income before extraordinary item and net income by approximately $1.7 million, or $0.05 per diluted share.
In October 2001, the FASB issued SFAS No. 144, "Accounting for the Impairment or Disposal of Long-Lived Assets." Thisstatement supersedes SFAS No. 121, "Accounting for the Impairment of Long-Lived Assets and for Long-Lived Assets to BeDisposed of." Although retaining many of the fundamental recognition and measurement provisions of SFAS No. 121, thenew statement significantly changes the criteria that would have to be met to classify an asset as held-for-sale. The statementalso supersedes certain provisions of APB Opinion No. 30, "Reporting the Results of Operations – Reporting the Effects ofDisposal of a Segment of a Business, and Extraordinary, Unusual and Infrequently Occurring Events and Transactions," and
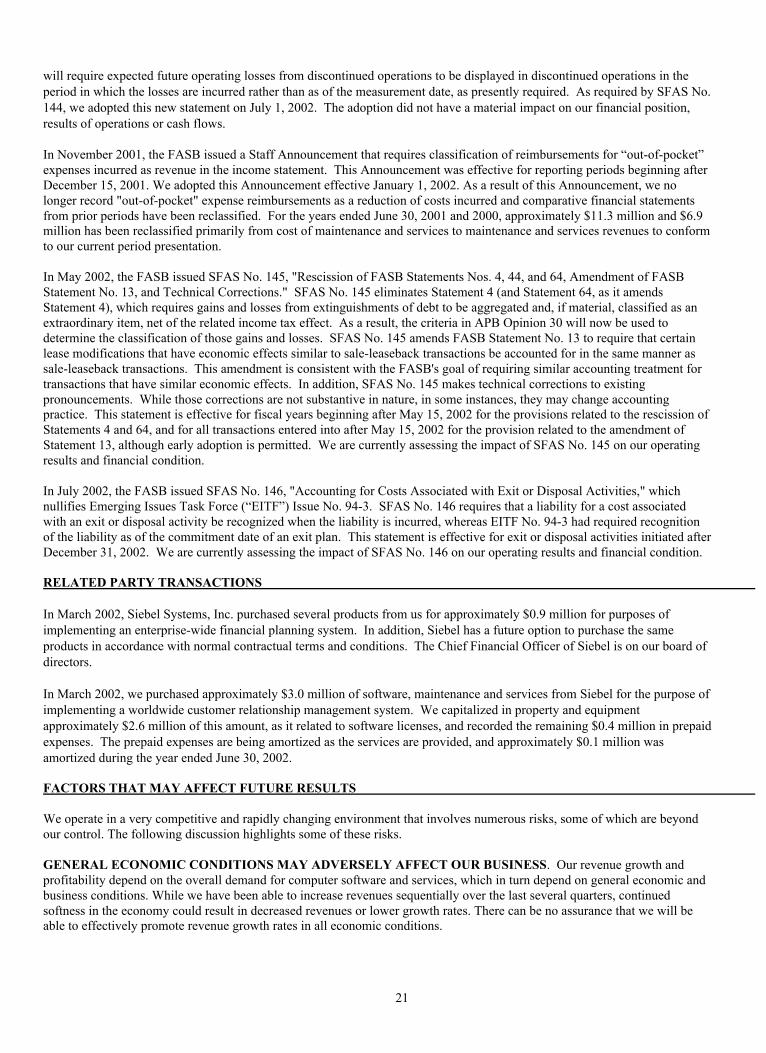
21
will require expected future operating losses from discontinued operations to be displayed in discontinued operations in theperiod in which the losses are incurred rather than as of the measurement date, as presently required. As required by SFAS No.144, we adopted this new statement on July 1, 2002. The adoption did not have a material impact on our financial position,results of operations or cash flows.
In November 2001, the FASB issued a Staff Announcement that requires classification of reimbursements for “out-of-pocket”expenses incurred as revenue in the income statement. This Announcement was effective for reporting periods beginning afterDecember 15, 2001. We adopted this Announcement effective January 1, 2002. As a result of this Announcement, we nolonger record "out-of-pocket" expense reimbursements as a reduction of costs incurred and comparative financial statementsfrom prior periods have been reclassified. For the years ended June 30, 2001 and 2000, approximately $11.3 million and $6.9million has been reclassified primarily from cost of maintenance and services to maintenance and services revenues to conformto our current period presentation.
In May 2002, the FASB issued SFAS No. 145, "Rescission of FASB Statements Nos. 4, 44, and 64, Amendment of FASBStatement No. 13, and Technical Corrections." SFAS No. 145 eliminates Statement 4 (and Statement 64, as it amendsStatement 4), which requires gains and losses from extinguishments of debt to be aggregated and, if material, classified as anextraordinary item, net of the related income tax effect. As a result, the criteria in APB Opinion 30 will now be used todetermine the classification of those gains and losses. SFAS No. 145 amends FASB Statement No. 13 to require that certainlease modifications that have economic effects similar to sale-leaseback transactions be accounted for in the same manner assale-leaseback transactions. This amendment is consistent with the FASB's goal of requiring similar accounting treatment fortransactions that have similar economic effects. In addition, SFAS No. 145 makes technical corrections to existingpronouncements. While those corrections are not substantive in nature, in some instances, they may change accountingpractice. This statement is effective for fiscal years beginning after May 15, 2002 for the provisions related to the rescission ofStatements 4 and 64, and for all transactions entered into after May 15, 2002 for the provision related to the amendment ofStatement 13, although early adoption is permitted. We are currently assessing the impact of SFAS No. 145 on our operatingresults and financial condition.
In July 2002, the FASB issued SFAS No. 146, "Accounting for Costs Associated with Exit or Disposal Activities," whichnullifies Emerging Issues Task Force (“EITF”) Issue No. 94-3. SFAS No. 146 requires that a liability for a cost associatedwith an exit or disposal activity be recognized when the liability is incurred, whereas EITF No. 94-3 had required recognitionof the liability as of the commitment date of an exit plan. This statement is effective for exit or disposal activities initiated afterDecember 31, 2002. We are currently assessing the impact of SFAS No. 146 on our operating results and financial condition.
RELATED PARTY TRANSACTIONS
In March 2002, Siebel Systems, Inc. purchased several products from us for approximately $0.9 million for purposes ofimplementing an enterprise-wide financial planning system. In addition, Siebel has a future option to purchase the sameproducts in accordance with normal contractual terms and conditions. The Chief Financial Officer of Siebel is on our board ofdirectors.
In March 2002, we purchased approximately $3.0 million of software, maintenance and services from Siebel for the purpose ofimplementing a worldwide customer relationship management system. We capitalized in property and equipmentapproximately $2.6 million of this amount, as it related to software licenses, and recorded the remaining $0.4 million in prepaidexpenses. The prepaid expenses are being amortized as the services are provided, and approximately $0.1 million wasamortized during the year ended June 30, 2002.
FACTORS THAT MAY AFFECT FUTURE RESULTS
We operate in a very competitive and rapidly changing environment that involves numerous risks, some of which are beyondour control. The following discussion highlights some of these risks.
GENERAL ECONOMIC CONDITIONS MAY ADVERSELY AFFECT OUR BUSINESS. Our revenue growth andprofitability depend on the overall demand for computer software and services, which in turn depend on general economic andbusiness conditions. While we have been able to increase revenues sequentially over the last several quarters, continuedsoftness in the economy could result in decreased revenues or lower growth rates. There can be no assurance that we will beable to effectively promote revenue growth rates in all economic conditions.

22
PRODUCT ENHANCEMENT AND NEW PRODUCT INTRODUCTIONS INVOLVE INHERENT RISKS. Wecompete in a market characterized by rapid technological advances in hardware and software development, evolving standardsin computer hardware and software technology and frequent new product introductions and enhancements. We continuallyexpand and refresh our product offerings to include newer features or products, and enter into agreements allowing integrationof third-party technology into our products. The introduction of new products or updated versions of continuing products hasinherent risks, including, but not limited to, product quality, the fit of the new products and features with the customer's needs,the successful adaptation of third-party technology into our products, educating our sales, marketing and consulting personnelto work with the new products and features, competition from earlier and more established entrants, general economicconditions, market acceptance of initial product releases, marketing effectiveness and the accuracy of assumptions about thenature of customer demand. Our failure to successfully introduce, market and sell new products and technologies or enhanceand improve existing products in a timely manner, and position and/or price its products, undetected errors or delays in newproducts or new versions of a product and/or the failure of anticipated market growth could have a material adverse effect onour business, results of operations or financial position. These risks tend to be greater when newer products, such as HyperionFinancial Management and Hyperion Planning, make up a larger portion of the overall product mix. In the coming year, asmore and more of these newer products are deployed, our service and maintenance organizations, along with our partners, willhave to rapidly increase their ability to install and service these products, and we must rapidly improve their ease-of-implementation and ease-of-use. The failure to successfully increase these capacities and make these improvements couldresult in significantly lower customer satisfaction, which could lead to lower license revenue.
WE OPERATE IN A VERY COMPETITIVE ENVIRONMENT. The markets in which we compete are intenselycompetitive, highly fragmented and characterized by rapidly changing technology and evolving standards. We haveexperienced, and expect that we will continue to experience, vigorous competition from both current and new competitors,some of whom may have significantly greater financial, technical, marketing and other resources than we do. We expectadditional competition as other established and emerging companies enter into both the OLAP and application parts of thebusiness performance management software market. This competition could result in price reductions, fewer customer orders,reduced gross margins and loss of market share, any of which would materially adversely affect our business, operating resultsand financial condition.
CHANGING OUR PRICING COULD ADVERSELY AFFECT OUR BUSINESS. In an effort to simplify and clarify ourproduct positioning and marketing, we periodically make changes to our product pricing. While we do not believe these pricingchanges will have a material impact on license revenue, any such broadly based changes to pricing could have a materialadverse effect on our business, results of operations or financial position as customers change or delay their purchasingdecisions in response to such pricing revisions. Additional risks of such pricing changes include delays in transactions as oursales force learns how to deploy the new pricing, and delay or loss of revenues as the competition reacts to the pricing changes.In the future, intense competition in the various markets in which we compete may put pressure on us to reduce prices oncertain products, particularly in the markets where certain vendors offer deep discounts in an effort to recapture or gain marketshare or to sell other software or hardware products. Any such price reductions could have a material adverse effect on ourbusiness, results of operations or financial position.
WE MAY NOT BE ABLE TO CONTINUE OUR OPERATIONAL IMPROVEMENTS. As part of our focus onimproving our operating margins, we are driving toward continued efficiencies in not only our sales force, but also ourservices, product development, product marketing, finance, and other administrative processes. The ability to continue torealize current efficiencies, and find ways to improve on past performance is crucial to the improvement of operating margins.Any increase in the relative cost of these functions, or failure to continue to realize current efficiencies, could have a materialadverse effect on our profits. There is also a risk that, as newer sales, services and marketing strategies are implemented, thechanges will either be unduly disruptive or less effective.
BACK-ENDED QUARTERS. Quarterly revenues and operating results are highly dependent on the volume and timing ofthe signing of licensing agreements and product deliveries during the quarter, which are difficult to forecast. Significantportions of our quarterly software licensing agreements are concluded in the last month of the fiscal quarter, generally with aconcentration of such revenues earned in the final week of that month. Due to the relatively fixed nature of certain costs,including personnel and facilities expenses, a decline or shortfall in quarterly and/or annual revenues typically results in lowerprofitability or may result in losses. Prior to the very end of any quarter, we must rely on our forecasts of revenue for planning,modeling and other purposes. Forecasts are only estimates and may not correlate to revenues in a particular quarter or over alonger period of time. A significant discrepancy between actual results and sales forecasts could cause us to improperly plan orbudget and thereby adversely affect our business or results of operations. Any publicly stated revenue or earnings projectionsby us are especially subject to this risk.
23
RESTRUCTURING MAY ADVERSELY AFFECT PRODUCTIVITY. We have continued to restructure and make otheradjustments to our sales and other operations and may do so in the future. These changes have historically resulted intemporary sales or other productivity issues in the short term. The restructured organization must keep improving over pastperformance in order to provide better operating margins and efficiencies. Failure of the organization to maintain or improvemomentum and productivity could materially impact our revenue and profits.
INTERNATIONAL OPERATIONS ARE SUBJECT TO SIGNIFICANT RISKS. A substantial portion of our revenue isderived from international sales and is, therefore, subject to the related risks, including the general economic conditions in eachcountry, the overlap of different tax structures, the difficulty of managing an organization spread over various countries,changes in regulatory requirements, compliance with a variety of foreign laws and regulations, longer payment cycles,volatilities of exchange rates, import and export licensing requirements, trade restrictions and changes in tariff rates. There canbe no assurances that we will be able to successfully address each of these challenges.
INABILITY TO HIRE AND RETAIN EMPLOYEES COULD HARM OUR BUSINESS. Our future operating resultsdepend significantly upon the retention and hiring of technical and management personnel. Competition for such personnel isintense, and there can be no assurance that we will retain our key managerial or technical personnel or attract such personnel inthe future. Either directly or through personnel search firms, we actively recruit qualified development, sales and marketingpersonnel. We have at times experienced difficulty recruiting or retaining qualified personnel and there can be no assurancethat we will not experience such difficulties in the future, which could have a material adverse effect on our business, operatingresults and financial condition. We will seek approval of additional stock options under our employee stock option plan at our2002 Annual Meeting of Stockholders. Stockholders have shown increasing reluctance to approve stock option plans. Werequested the stockholders approve additional shares for our employee option plan at our 2001 Annual Meeting ofStockholders, and the additional shares were not approved. If we are not able to offer prospective and current employees stockoptions on a basis generally comparable to other companies competing for the same workers, it will have a material adverseimpact on our ability to attract and retain a competitive, motivated and dedicated workforce.
THERE ARE SIGNIFICANT ORGANIZATIONAL AND PRODUCT INTEGRATION RISKS RELATED TOBUSINESS COMBINATIONS. We have made and may in the future make acquisitions of, mergers with, or significantinvestments in, businesses that offer complementary products, services and technologies. There are risks involved in businesscombinations, including but not limited to: the possibility that we pay more than the value we derive from the acquisition; thedifficulty of integrating the operations and personnel of the acquired businesses; the possibility that all aspects of theintegration are not completed or that all of the anticipated synergies of the acquisition are not realized; the potential productliability associated with selling the acquired company's products; the potential disruption of our ongoing business and thedistraction of management from our business. These factors could have a material adverse effect on our business, results ofoperations or financial position, especially in the case of a large acquisition.
WE ARE SUBJECT TO THE POSSIBILITY OF INFRINGEMENT CLAIMS. We expect that software productdevelopers will increasingly be subject to infringement claims as the number of products and competitors in our industrysegment grows and the functionality of products in different industry segments overlaps. Any such claims, with or withoutmerit, could be time consuming to defend, result in costly litigation, divert management's attention and resources, causeproduct shipment delays or require us to enter into royalty or licensing agreements. Such royalty or licensing agreements, ifrequired, may not be available on terms acceptable to us, if at all. In the event of a successful claim of product infringementagainst us and our failure or inability to license the infringed or similar technology, our business, operating results and financialcondition would be materially adversely affected.
ENFORCEMENT OF OUR INTELLECTUAL PROPERTY RIGHTS MAY BE DIFFICULT. We rely primarily on acombination of patent, copyright and trademark laws, trade secrets, confidentiality procedures and contractual provisions toprotect our proprietary rights. There can be no assurance that our means of protecting its proprietary rights in the United Statesor abroad will be adequate or that competitors will not independently develop similar technology.
OUR STOCK PRICE MAY BE VOLATILE. The market price of our common stock is subject to significant fluctuations.The market price of our common stock may be significantly affected by factors, including but not limited to, the announcementof new products, product enhancements or technological innovation by us or our competitors, changes in our or ourcompetitors' results of operations, changes in revenue, revenue growth rates and revenue mix for us as a whole or for specificgeographic areas or business units, changes in earnings estimates by market analysts and general market conditions or marketconditions specific to particular industries. Technology stocks have experienced wide fluctuations in prices, which sometimeshave been unrelated to their operating performance. The market price of our common stock could be adversely affected by suchfluctuations.

24
ITEM 7A. QUANTITATIVE AND QUALITATIVE DISCLOSURES ABOUT MARKET RISK
Interest Rate Risk. The primary objective of our investment activities is to preserve principal while maximizing yields,without significantly increasing risk. To achieve this objective, we maintain our portfolio of cash equivalents and short-terminvestments in a variety of securities, including government and corporate obligations, certificates of deposit and moneymarket funds. At June 30, 2002, our investment portfolio consisted of investment-grade debt securities, excluding thoseclassified as cash equivalents, with a fair value of $19.1 million. The portfolio is invested in short-term securities to minimizeinterest rate risk and for liquidity purposes in the event of immediate cash needs. Due to the short duration of our investmentportfolio, an immediate 10% increase in market interest rates would not have a material effect on our investment portfolio.
Our long-term debt bears interest at fixed interest rates and, therefore, relative to our long-term debt, an immediate 10% changein market interest rates would not have a material impact our financial condition or results of operations. As of June 30, 2002,our long-term debt consists of 4.5% convertible subordinated notes due March 2005 with a face value of $78.8 million and amortgage loan with an outstanding principal balance of $2.3 million bearing interest at 6.0%.
Foreign Currency Exchange Rate Risk. We transact business in various foreign currencies. Our exposure to foreign currencyexchange rate fluctuations arises in part from intercompany accounts in which costs incurred in the United States are chargedto our foreign sales subsidiaries. Additionally, intercompany balances arise from software royalty fees that are charged to ourforeign subsidiaries. These intercompany accounts are typically denominated in the functional currency of the foreignsubsidiary. From time to time, we utilize foreign currency forward exchange contracts to offset the risk associated with theeffects of certain intercompany balances for which we anticipate settlement in the foreseeable future. As a result, increases ordecreases in our intercompany accounts due to foreign exchange rate changes are offset by gains and losses on the forwardcontracts, so as to mitigate the possibility of foreign currency transaction gains and losses. Our forward contracts generallyhave terms of 90 days or less. We do not use forward contracts for trading purposes. All foreign currency transactions and alloutstanding forward contracts are marked to market at the end of the period with unrealized gains and losses included in ourconsolidated statements of income. Our ultimate realized gain or loss with respect to currency fluctuations will depend on thecurrency exchange rates and other factors in effect as the contracts mature. Net foreign exchange transaction gains and losseswere not material for fiscal 2002, 2001 and 2000. We had no open foreign currency forward exchange contracts as of June 30,2002.
We are also exposed to foreign currency exchange rate fluctuations as the income statements of our foreign subsidiaries aretranslated into U.S. dollars upon consolidation. As exchange rates vary, these results, when translated, may vary fromexpectations and adversely impact overall expected profitability. The effect of foreign exchange rate fluctuations for fiscal2002 was not material.

25
ITEM 8. FINANCIAL STATEMENTS AND SUPPLEMENTARY DATA
INDEX TO CONSOLIDATED FINANCIAL STATEMENTS
Page
Report of Independent Accountants 26
Consolidated Financial Statements: Consolidated Balance Sheets as of June 30, 2002 and 2001 27 Consolidated Statements of Income for the years ended June 30, 2002, 2001 and 2000 28 Consolidated Statements of Stockholders' Equity and Comprehensive Income (Loss) for the years ended June 30, 2002, 2001 and 2000 29 Consolidated Statements of Cash Flows for the years ended June 30, 2002, 2001 and 2000 30 Notes to Consolidated Financial Statements 31
Financial Statement Schedule: Schedule II – Valuation and Qualifying Accounts 51
26
REPORT OF INDEPENDENT ACCOUNTANTS
To the Board of Directors and Stockholders ofHyperion Solutions Corporation:
In our opinion, the consolidated financial statements listed in the accompanying index present fairly, in all material respects,the financial position of Hyperion Solutions Corporation and its subsidiaries ("Hyperion") at June 30, 2002 and 2001, and theresults of their operations and their cash flows for each of the three years in the period ended June 30, 2002, in conformity withaccounting principles generally accepted in the United States of America. In addition, in our opinion, the financial statementschedule listed in the accompanying index presents fairly, in all material respects, the information set forth therein when readin conjunction with the related consolidated financial statements. These financial statements and the financial statementschedule are the responsibility of Hyperion's management; our responsibility is to express an opinion on these financialstatements and the financial statement schedule based on our audits. We conducted our audits of these statements in accordancewith auditing standards generally accepted in the United States of America which require that we plan and perform the audit toobtain reasonable assurance about whether the financial statements are free of material misstatement. An audit includesexamining, on a test basis, evidence supporting the amounts and disclosures in the financial statements, assessing theaccounting principles used and significant estimates made by management, and evaluating the overall financial statementpresentation. We believe that our audits provide a reasonable basis for our opinion.
/s/ PricewaterhouseCoopers LLP
San Jose, CaliforniaJuly 25, 2002, except Note 10,which is as of August 29, 2002
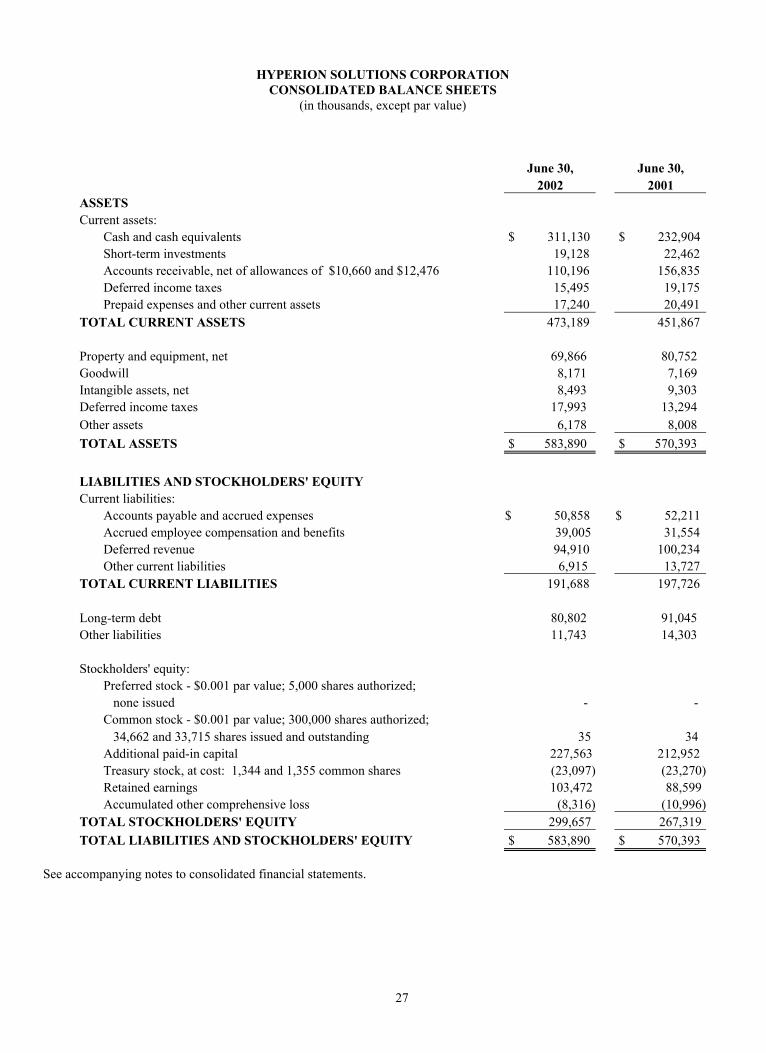
27
HYPERION SOLUTIONS CORPORATIONCONSOLIDATED BALANCE SHEETS
(in thousands, except par value)
June 30, June 30,2002 2001
ASSETSCurrent assets:
Cash and cash equivalents $ 311,130 $ 232,904Short-term investments 19,128 22,462Accounts receivable, net of allowances of $10,660 and $12,476 110,196 156,835Deferred income taxes 15,495 19,175Prepaid expenses and other current assets 17,240 20,491
TOTAL CURRENT ASSETS 473,189 451,867
Property and equipment, net 69,866 80,752Goodwill 8,171 7,169Intangible assets, net 8,493 9,303Deferred income taxes 17,993 13,294Other assets 6,178 8,008
TOTAL ASSETS $ 583,890 $ 570,393
LIABILITIES AND STOCKHOLDERS' EQUITYCurrent liabilities:
Accounts payable and accrued expenses $ 50,858 $ 52,211Accrued employee compensation and benefits 39,005 31,554Deferred revenue 94,910 100,234Other current liabilities 6,915 13,727
TOTAL CURRENT LIABILITIES 191,688 197,726
Long-term debt 80,802 91,045Other liabilities 11,743 14,303
Stockholders' equity:Preferred stock - $0.001 par value; 5,000 shares authorized; none issued - -Common stock - $0.001 par value; 300,000 shares authorized; 34,662 and 33,715 shares issued and outstanding 35 34Additional paid-in capital 227,563 212,952Treasury stock, at cost: 1,344 and 1,355 common shares (23,097) (23,270)Retained earnings 103,472 88,599Accumulated other comprehensive loss (8,316) (10,996)
TOTAL STOCKHOLDERS' EQUITY 299,657 267,319
TOTAL LIABILITIES AND STOCKHOLDERS' EQUITY $ 583,890 $ 570,393
See accompanying notes to consolidated financial statements.
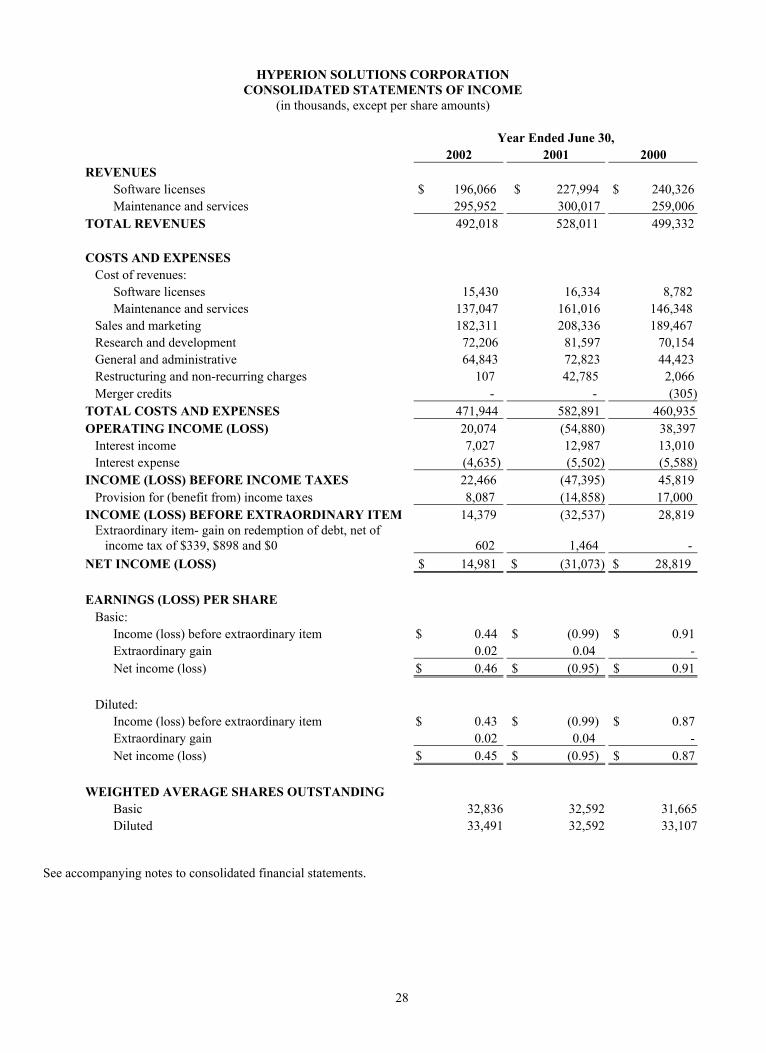
28
HYPERION SOLUTIONS CORPORATIONCONSOLIDATED STATEMENTS OF INCOME
(in thousands, except per share amounts)
Year Ended June 30,2002 2001 2000
REVENUESSoftware licenses $ 196,066 $ 227,994 $ 240,326Maintenance and services 295,952 300,017 259,006
TOTAL REVENUES 492,018 528,011 499,332
COSTS AND EXPENSES Cost of revenues:
Software licenses 15,430 16,334 8,782Maintenance and services 137,047 161,016 146,348
Sales and marketing 182,311 208,336 189,467 Research and development 72,206 81,597 70,154 General and administrative 64,843 72,823 44,423 Restructuring and non-recurring charges 107 42,785 2,066 Merger credits - - (305)TOTAL COSTS AND EXPENSES 471,944 582,891 460,935OPERATING INCOME (LOSS) 20,074 (54,880) 38,397 Interest income 7,027 12,987 13,010 Interest expense (4,635) (5,502) (5,588)INCOME (LOSS) BEFORE INCOME TAXES 22,466 (47,395) 45,819 Provision for (benefit from) income taxes 8,087 (14,858) 17,000INCOME (LOSS) BEFORE EXTRAORDINARY ITEM 14,379 (32,537) 28,819 Extraordinary item- gain on redemption of debt, net of income tax of $339, $898 and $0 602 1,464 -
NET INCOME (LOSS) $ 14,981 $ (31,073) $ 28,819
EARNINGS (LOSS) PER SHARE Basic:
Income (loss) before extraordinary item $ 0.44 $ (0.99) $ 0.91Extraordinary gain 0.02 0.04 -Net income (loss) $ 0.46 $ (0.95) $ 0.91
Diluted:Income (loss) before extraordinary item $ 0.43 $ (0.99) $ 0.87Extraordinary gain 0.02 0.04 -Net income (loss) $ 0.45 $ (0.95) $ 0.87
WEIGHTED AVERAGE SHARES OUTSTANDINGBasic 32,836 32,592 31,665Diluted 33,491 32,592 33,107
See accompanying notes to consolidated financial statements.
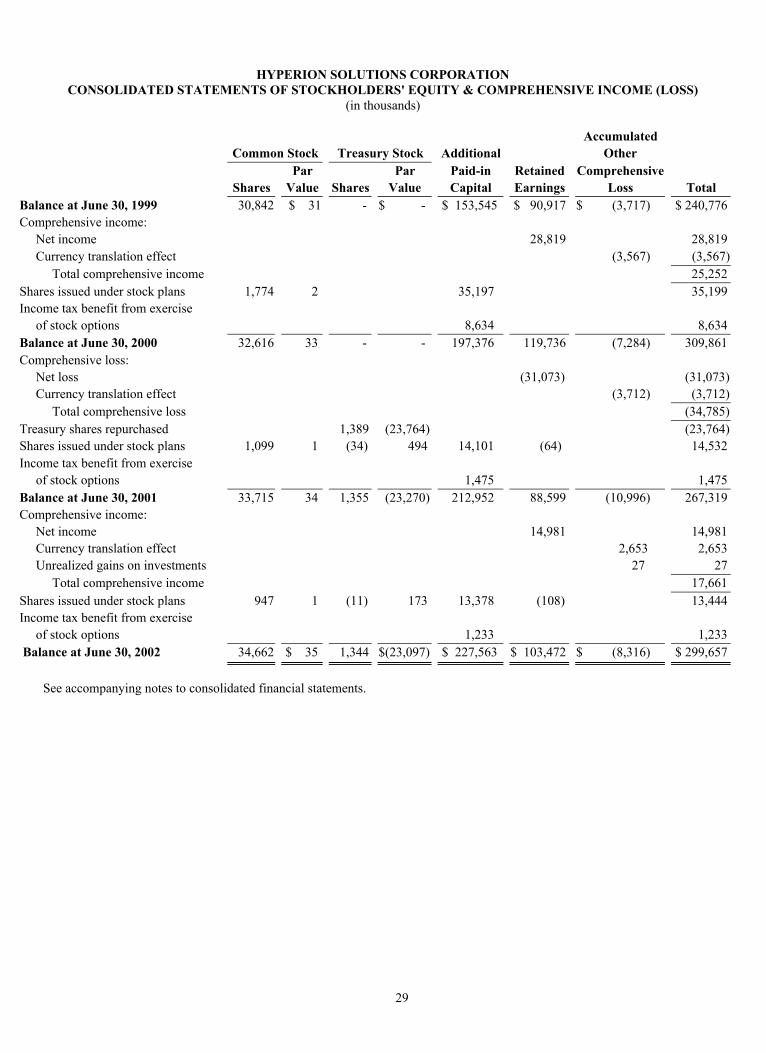
29
HYPERION SOLUTIONS CORPORATIONCONSOLIDATED STATEMENTS OF STOCKHOLDERS' EQUITY & COMPREHENSIVE INCOME (LOSS)
(in thousands)
AccumulatedCommon Stock Treasury Stock Additional Other
Par Par Paid-in Retained ComprehensiveShares Value Shares Value Capital Earnings Loss Total
Balance at June 30, 1999 30,842 $ 31 - $ - $ 153,545 $ 90,917 $ (3,717) $ 240,776Comprehensive income: Net income 28,819 28,819 Currency translation effect (3,567) (3,567) Total comprehensive income 25,252Shares issued under stock plans 1,774 2 35,197 35,199Income tax benefit from exercise of stock options 8,634 8,634Balance at June 30, 2000 32,616 33 - - 197,376 119,736 (7,284) 309,861Comprehensive loss: Net loss (31,073) (31,073) Currency translation effect (3,712) (3,712) Total comprehensive loss (34,785)Treasury shares repurchased 1,389 (23,764) (23,764)Shares issued under stock plans 1,099 1 (34) 494 14,101 (64) 14,532Income tax benefit from exercise of stock options 1,475 1,475Balance at June 30, 2001 33,715 34 1,355 (23,270) 212,952 88,599 (10,996) 267,319Comprehensive income: Net income 14,981 14,981 Currency translation effect 2,653 2,653 Unrealized gains on investments 27 27 Total comprehensive income 17,661Shares issued under stock plans 947 1 (11) 173 13,378 (108) 13,444Income tax benefit from exercise of stock options 1,233 1,233 Balance at June 30, 2002 34,662 $ 35 1,344 $(23,097) $ 227,563 $ 103,472 $ (8,316) $ 299,657
See accompanying notes to consolidated financial statements.

30
HYPERION SOLUTIONS CORPORATIONCONSOLIDATED STATEMENTS OF CASH FLOWS
(in thousands)
Year Ended June 30,2002 2001 2000
CASH FLOWS FROM OPERATING ACTIVITIES:Net income (loss) $ 14,981 $ (31,073) $ 28,819Adjustments to reconcile net income (loss) to net cash provided by operating activities: Gain on redemption of debt (941) (2,362) - Loss on sale of assets 128 - - Depreciation and amortization 31,907 38,901 34,482 Provision for accounts receivable allowances 20,850 27,677 8,316 Deferred income taxes (932) (12,602) (3,368) Income tax benefit from exercise of stock options 1,233 1,475 8,634 Other - 10,902 -Changes in assets and liabilities: Accounts receivable 31,856 (22,629) (59,454) Prepaid expenses and other current assets 3,932 (10,389) (2,060) Other assets (621) 286 546 Accounts payable and accrued expenses (6,290) 2,278 (2,015) Accrued employee compensation and benefits 6,399 (1,015) 2,301 Income taxes payable 117 (9,609) 3,834 Deferred revenue (8,892) 11,403 7,739 Other current liabilities (6,812) 13,727 - Other liabilities (2,560) 14,303 -Net cash provided by operating activities 84,355 31,273 27,774
CASH FLOWS FROM INVESTING ACTIVITIES: Proceeds from maturity of investments, net 5,396 8,291 5,590 Purchases of property and equipment, net (15,067) (42,573) (21,805) Purchases of intangible and other assets (4,954) (4,677) (4,683) Business acquisitions - - (5,088)Net cash used in investing activities (14,625) (38,959) (25,986)
CASH FLOWS FROM FINANCING ACTIVITIES: Principal payments on mortgage loan (242) (222) (4,527) Redemption of debt (8,931) (8,652) - Treasury stock transactions, net 64 (23,270) - Proceeds from exercise of stock options and employee stock purchase plan 13,235 14,038 35,199Net cash provided by (used in) financing activities 4,126 (18,106) 30,672
Effect of exchange rate on cash and cash equivalents 4,370 (3,712) (3,567)
INCREASE (DECREASE) IN CASH AND CASH EQUIVALENTS 78,226 (29,504) 28,893Cash and cash equivalents at beginning of year 232,904 262,408 233,515
CASH AND CASH EQUIVALENTS AT END OF YEAR $ 311,130 $ 232,904 $ 262,408
SUPPLEMENTAL CASH FLOW INFORMATION: Cash paid for income taxes $ 9,095 $ 5,838 $ 8,500 Cash paid for interest $ 4,316 $ 4,841 $ 4,712
See accompanying notes to consolidated financial statements.
31
HYPERION SOLUTIONS CORPORATIONNOTES TO CONSOLIDATED FINANCIAL STATEMENTS
1. BUSINESS
Hyperion Solutions Corporation (“Hyperion”) develops, markets and supports business performance management softwaresolutions that enable companies to continually measure performance, anticipate results and drive profitability across keybusiness activities. Hyperion’s customers use its products to help them collaborate enterprise-wide, focus resources, improveoperational efficiencies and leverage opportunities for growth.
Hyperion’s business performance management solutions provide comprehensive support for the entire process of goal setting,business modeling, planning, budgeting, performance monitoring, analyzing and reporting throughout organizations.Hyperion’s products complement existing enterprise resource planning, customer relationship management, supply chainmanagement and transaction systems by integrating data from multiple sources, providing a common view across the enterpriseand enabling an integrated business performance management process that aligns individual goals with corporate objectives.
Hyperion provides applications along with a development and deployment platform to enable enterprise-class businessperformance management across a wide variety of functional and business activity areas. Hyperion uses its online analyticalprocessing technology, Hyperion Essbase, as the foundation for its platform, Hyperion Essbase XTD. Components withinHyperion Essbase XTD can be used individually to create tailored applications or in conjunction with Hyperion’s packagedapplications to support the entire business performance management process. Hyperion was formed in August 1998 whenArbor Software, founded in 1991, acquired Hyperion Software, founded in 1981.
2. SUMMARY OF SIGNIFICANT ACCOUNTING POLICIES
Basis of Presentation and Principles of Consolidation
The consolidated financial statements include the accounts of Hyperion and its subsidiaries, all of which are wholly-owned. Allsignificant intercompany accounts and transactions have been eliminated.
Certain prior period amounts in the consolidated financial statements and notes thereto have been reclassified to conform to thecurrent period presentation.
Use of Estimates
The preparation of financial statements in conformity with accounting principles generally accepted in the United States ofAmerica requires management to make estimates and assumptions that affect the reported amounts of assets and liabilities anddisclosure of contingent assets and liabilities at the date of the financial statements and the reported amounts of revenues andexpenses during the reporting period. Actual results could differ from those estimates, and such differences could affect theresults of operations reported in future periods.
Revenue Recognition
Hyperion derives revenues from the licensing of its software products and providing maintenance and professional services.Hyperion’s standard software license agreement is a perpetual license to use its products on an end user, concurrent user orcentral processing unit basis. Hyperion records revenue from licensing of software products to end users provided there ispersuasive evidence of an arrangement, the fee is fixed and determinable, collection is reasonably assured and delivery of theproduct has occurred as prescribed by Statement of Position (“SOP”) No. 97-2, “Software Revenue Recognition,” issued by theAmerican Institute of Certified Public Accountants. For arrangements with multiple elements, and for which vendor specificobjective evidence (“VSOE”) of fair value exists for the undelivered elements, revenue is recognized for the delivered elementsbased upon the residual method in accordance with SOP 98-9, “Modifications of SOP 97-2 with Respect to CertainTransactions.” VSOE of fair value for all elements of an arrangement is based upon the normal pricing and discountingpractices for those products and services when sold separately. VSOE of fair value for services is based upon the standardhourly rate Hyperion charges for such services when sold separately. VSOE of fair value for maintenance is measured by thestated renewal rates included in the contracts. If the fair value of any undelivered element included in a multiple-elementarrangement cannot be objectively determined, revenue is deferred until all elements are delivered, services have beenperformed or until fair value can be objectively determined. License revenue from resellers or distributors is recognized uponsell-through to the end customer. Amounts billed or payments received in advance of revenue recognition are recorded asdeferred revenue.
32
Maintenance agreements are generally a 12 month prepaid contract that is recognized ratably over the period. Customers mayalso enter into a professional services arrangement that is typically on a time and materials basis and includes consulting andtraining services. Consulting and training revenues are typically recognized as earned.
Consulting revenues are generated primarily from implementation services related to the installation of Hyperion’s products.These arrangements are generally accounted for separately from the license revenue because the arrangements qualify as“service transactions” as defined in SOP 97-2. Hyperion’s services are generally not essential to the functionality of thesoftware. Hyperion’s products are fully functional upon delivery of the product and implementation does not require anysignificant modification or alteration. Hyperion’s services often include assistance with product adoption. Other significantfactors considered in determining whether the revenue should be accounted for separately include degree of risk, availability ofservices from other vendors, timing of payments and impact of milestones or acceptance criteria on the realizability of thesoftware license fee. Customers generally purchase these services to facilitate the adoption of Hyperion’s products and obtaindedicated personnel to participate in the services being performed, but they may also decide to use their own internal resourcesor appoint other professional service organizations to provide these services. Payments related to the software product towhich the services relate are typically billed independently from the services and, therefore, are not coincident withperformance of such services. License agreements generally do not include acceptance provisions. If an arrangement does notqualify for separate accounting of the license and service elements, license revenue is generally recognized together with theconsulting services using the percentage-of-completion method of contract accounting in accordance with SOP No. 81-1,"Accounting for Performance of Construction-Type and Certain Product-Type Contracts" and Accounting Research BulletinNo. 45, "Long-Term Construction-Type Contracts.”
Foreign Currency
The functional currency of Hyperion’s international subsidiaries is their local currency. The financial statements of thesesubsidiaries are translated into United States dollars using the period-end exchange rates for assets and liabilities, and averageexchange rates for the period for revenues and expenses. Translation gains and losses that Hyperion considers to be of a long-term investment nature are recorded in accumulated other comprehensive income (loss), a separate component of shareholders'equity. Translation gains and losses for those international subsidiaries for which Hyperion anticipates settlement in theforeseeable future are recorded in the consolidated statements of income. Net gains and losses resulting from foreign exchangetransactions are also included in the consolidated statements of income. The net gains and losses recorded in the consolidatedstatements of income were not significant during the periods presented.
Stock-Based Compensation
Hyperion accounts for stock option grants in accordance with Accounting Principles Board ("APB") Opinion No. 25,"Accounting for Stock Issued to Employees," and complies with the disclosure provisions of Statement of FinancialAccounting Standards ("SFAS") No. 123, "Accounting for Stock-Based Compensation." Hyperion generally grants its stockoptions at exercise prices equal to the fair market value of the underlying stock on the date of grant and, therefore, under APBOpinion No. 25, no compensation expense is recognized in the statements of income.
Cash, Cash Equivalents and Short-Term Investments
Hyperion classifies highly-liquid investments with remaining maturities of three months or less at the time of purchase as cashequivalents. Cash equivalents are comprised primarily of investment-grade commercial paper, and U.S. federal, state andpolitical subdivision obligations.
Investments are comprised of U.S. government and debt securities. Investments with remaining maturities exceeding threemonths but less than one year are classified as short-term investments. Investments with maturities greater than one year areclassified as long-term investments. All debt securities that have readily determinable fair values have been classified asavailable-for-sale in accordance with SFAS No. 115, "Accounting for Certain Investments in Debt and Equity Securities." As aresult, investments are reported at fair value, and unrealized holding gains and losses, net of applicable taxes, are reported inaccumulated other comprehensive income (loss), a separate component of stockholders' equity, until realized. To date,unrealized gains and losses have not been material. On a quarterly basis, management evaluates individual securities todetermine whether a decline in fair value is other than temporary. If the decline in fair value is considered to be other thantemporary, the cost basis of the individual security is written down to fair value as a new cost basis and the amount of thewrite-down is included in the statement of income. Interest income is recognized when earned. Realized gains and losses formarketable securities are derived using the specific identification method for determining the cost of the securities sold.
33
Allowance for Doubtful Accounts
Hyperion makes judgments as to its ability to collect outstanding receivables and provides allowances for a portion ofreceivables when collection becomes doubtful. Provisions are made based upon a specific review of all significant outstandinginvoices. For those invoices not specifically reviewed, provisions are made at differing rates, based upon the age of thereceivable. In determining these percentages, Hyperion analyzes its historical collection experience, customer concentrations,customer credit-worthiness and current economic trends. If the historical data used to calculate the allowance provided fordoubtful accounts does not reflect the future ability to collect outstanding receivables, additional provisions for doubtfulaccounts may be needed.
Fair Value of Financial Instruments
All current assets and current liabilities, because of their short-term nature, are stated at cost, which approximates fair value.The fair value of Hyperion's 4.5% convertible subordinated notes was approximately $71.2 million at June 30, 2002, based onquoted market prices. The carrying amount of Hyperion's mortgage loan approximates fair value due to the market valueinterest rate which this loan bears.
Long-Lived Assets
Hyperion accounts for long-lived assets under SFAS No. 121, "Accounting for the Impairment of Long-Lived Assets and forLong-Lived Assets to be Disposed of," which requires Hyperion to review for impairment of long-lived assets whenever eventsor changes in circumstances indicate that the carrying amount of an asset might not be recoverable. When such an event occurs,Hyperion estimates the future cash flows expected to result from the use of the asset and its eventual disposition. If theundiscounted expected future cash flows are less than the carrying amount of the asset, an impairment loss is recognized. Animpairment charge of $4.1 million was recorded during the year ended June 30, 2001.
Product Development Costs
Hyperion begins capitalizing software product development costs, principally wages and contractor fees, only after establishingtechnological feasibility. Capitalization ceases when the product is available for general release. Annual amortization of thesecosts represents the greater of the amount computed using (i) the ratio that current gross revenues for the products bear to thetotal current and anticipated future gross revenues for the products, or (ii) the straight-line method over the remaining estimatedeconomic life of the products (generally three years). The amortization of capitalized product development costs begins uponthe general release of the software to customers.
Income Taxes
Income taxes are accounted for using an asset and liability approach, which requires the recognition of taxes payable orrefundable for the current year and deferred tax assets and liabilities for the future tax consequences of events that have beenrecognized in Hyperion's financial statements or tax returns. The measurement of current and deferred tax assets and liabilitiesare based on provisions of the enacted tax law; the effects of future changes in tax laws or rates are not anticipated. Themeasurement of deferred tax assets is reduced, if necessary, by the amount of any tax benefits that, based on availableevidence, are not expected to be realized.
Concentration of Credit Risk
Financial instruments that potentially subject Hyperion to a concentration of credit risk principally comprise cash and cashequivalents, short-term investments and accounts receivable. Regarding its cash equivalent and short-term investments,Hyperion only invests in instruments with an investment credit rating of AA and better. Hyperion places its investments forsafekeeping with high-credit-quality financial institutions, and by policy, limits the amount of credit exposure from any oneinstitution or issuer.
For fiscal 2002, 2001 and 2000, Hyperion had no customers that accounted for 10% or more of total revenues. As of June 30,2002 and 2001, Hyperion had no customers that accounted for 10% or more of gross accounts receivable.
Earnings Per Share
Earnings per share, or EPS, is computed in accordance with SFAS No. 128, "Earnings Per Share." Basic EPS is computed bydividing net income (loss) available to common stockholders by the weighted average number of common shares outstanding
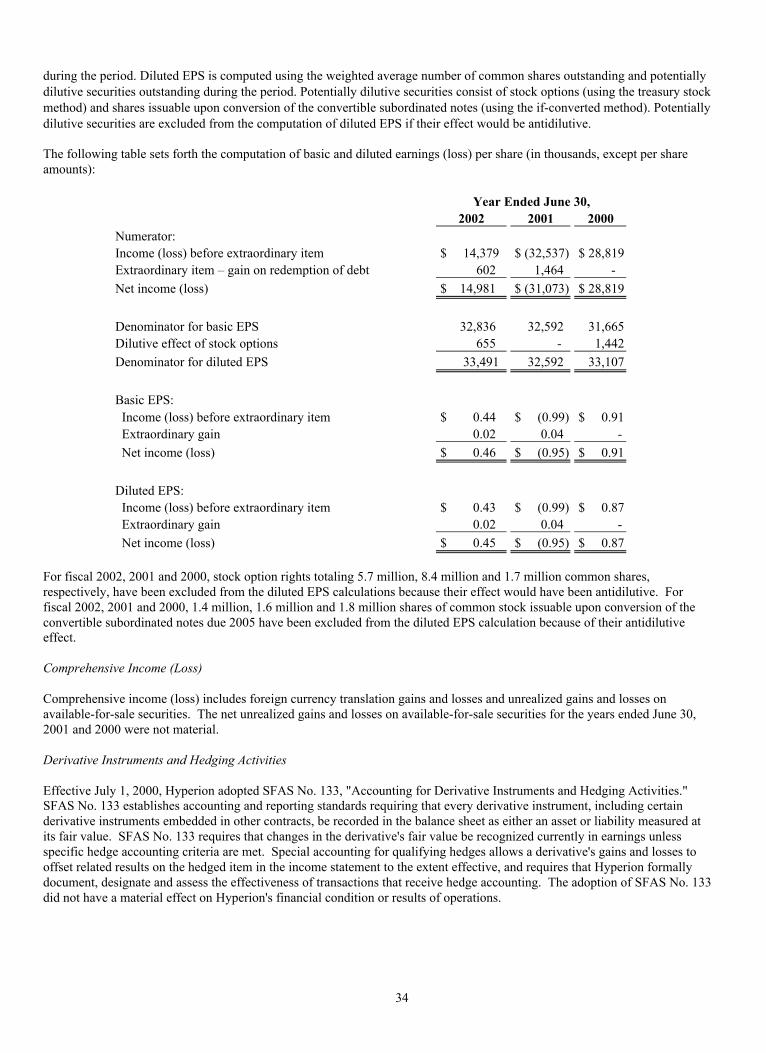
34
during the period. Diluted EPS is computed using the weighted average number of common shares outstanding and potentiallydilutive securities outstanding during the period. Potentially dilutive securities consist of stock options (using the treasury stockmethod) and shares issuable upon conversion of the convertible subordinated notes (using the if-converted method). Potentiallydilutive securities are excluded from the computation of diluted EPS if their effect would be antidilutive.
The following table sets forth the computation of basic and diluted earnings (loss) per share (in thousands, except per shareamounts):
Year Ended June 30,2002 2001 2000
Numerator:Income (loss) before extraordinary item $ 14,379 $ (32,537) $ 28,819Extraordinary item – gain on redemption of debt 602 1,464 -
Net income (loss) $ 14,981 $ (31,073) $ 28,819
Denominator for basic EPS 32,836 32,592 31,665Dilutive effect of stock options 655 - 1,442
Denominator for diluted EPS 33,491 32,592 33,107
Basic EPS: Income (loss) before extraordinary item $ 0.44 $ (0.99) $ 0.91 Extraordinary gain 0.02 0.04 -
Net income (loss) $ 0.46 $ (0.95) $ 0.91
Diluted EPS: Income (loss) before extraordinary item $ 0.43 $ (0.99) $ 0.87 Extraordinary gain 0.02 0.04 -
Net income (loss) $ 0.45 $ (0.95) $ 0.87
For fiscal 2002, 2001 and 2000, stock option rights totaling 5.7 million, 8.4 million and 1.7 million common shares,respectively, have been excluded from the diluted EPS calculations because their effect would have been antidilutive. Forfiscal 2002, 2001 and 2000, 1.4 million, 1.6 million and 1.8 million shares of common stock issuable upon conversion of theconvertible subordinated notes due 2005 have been excluded from the diluted EPS calculation because of their antidilutiveeffect.
Comprehensive Income (Loss)
Comprehensive income (loss) includes foreign currency translation gains and losses and unrealized gains and losses onavailable-for-sale securities. The net unrealized gains and losses on available-for-sale securities for the years ended June 30,2001 and 2000 were not material.
Derivative Instruments and Hedging Activities
Effective July 1, 2000, Hyperion adopted SFAS No. 133, "Accounting for Derivative Instruments and Hedging Activities."SFAS No. 133 establishes accounting and reporting standards requiring that every derivative instrument, including certainderivative instruments embedded in other contracts, be recorded in the balance sheet as either an asset or liability measured atits fair value. SFAS No. 133 requires that changes in the derivative's fair value be recognized currently in earnings unlessspecific hedge accounting criteria are met. Special accounting for qualifying hedges allows a derivative's gains and losses tooffset related results on the hedged item in the income statement to the extent effective, and requires that Hyperion formallydocument, designate and assess the effectiveness of transactions that receive hedge accounting. The adoption of SFAS No. 133did not have a material effect on Hyperion's financial condition or results of operations.

35
Recent Accounting Pronouncements
In July 2001, the Financial Accounting Standards Board ("FASB") issued SFAS No. 141, "Business Combinations," whichsupersedes APB Opinion No. 16, "Business Combinations." SFAS No. 141 requires the purchase method of accounting forbusiness combinations initiated after June 30, 2001 and eliminates the pooling-of-interests method. In addition, SFAS No. 141establishes specific criteria for the recognition of intangible assets separately from goodwill and requires unallocated negativegoodwill to be written-off immediately as an extraordinary gain. The adoption of the provisions of SFAS No. 141, effectiveJuly 1, 2001, did not have a material impact on Hyperion's financial position, results of operations or cash flows.
In July 2001, the FASB also issued SFAS No. 142, "Goodwill and Other Intangible Assets." This statement supersedes APBOpinion No. 17, "Intangible Assets," and requires, among other things, the discontinuance of amortization related to goodwilland indefinite lived intangible assets. In addition, the standard includes provisions upon adoption for the reclassification ofcertain existing recognized intangibles as goodwill, reassessment of the useful lives of existing recognized intangibles andreclassification of certain intangibles out of previously reported goodwill. Under SFAS No. 142, goodwill is tested forimpairment annually, and is tested for impairment between annual tests whenever events or changes in circumstances indicatethat the carrying amount may not be recoverable. Impairment testing for goodwill is done at a reporting unit level. Currently,Hyperion has identified one reporting unit under the criteria set forth by SFAS No. 142. An impairment loss would generallybe recognized when the carrying amount of the reporting unit’s net assets, including goodwill, exceeds the estimated fair valueof the reporting unit. Hyperion adopted SFAS No. 142 effective July 1, 2001, which resulted in Hyperion no longer amortizingits existing net goodwill balance of approximately $7.2 million. With the adoption of SFAS No. 142, intangible assets with adefinite life are amortized on a straight-line basis over periods ranging from 3 to 7 years. Intangible assets with a definite lifeare tested for impairment whenever events or changes in circumstances indicate that the carrying amount of an asset may notbe recoverable. An impairment loss would be recognized when the carrying amount of an asset exceeds the estimatedundiscounted cash flows expected to result from the use of the asset and its eventual disposition. The amount of theimpairment loss is calculated as the excess of the assets carrying value over its fair value. Fair value is generally determinedusing a discounted cash flow analysis. The impact of SFAS No. 142 on fiscal 2001 results would have decreased the lossbefore extraordinary item and the net loss by approximately $2.7 million, or $0.08 per diluted share. The impact of SFAS No.142 on fiscal 2000 results would have increased income before extraordinary item and net income by approximately $1.7million, or $0.05 per diluted share.
In October 2001, the FASB issued SFAS No. 144, "Accounting for the Impairment or Disposal of Long-Lived Assets." Thisstatement supersedes SFAS No. 121, "Accounting for the Impairment of Long-Lived Assets and for Long-Lived Assets to BeDisposed of." Although retaining many of the fundamental recognition and measurement provisions of SFAS No. 121, thenew statement significantly changes the criteria that would have to be met to classify an asset as held-for-sale. The statementalso supersedes certain provisions of APB Opinion No. 30, "Reporting the Results of Operations – Reporting the Effects ofDisposal of a Segment of a Business, and Extraordinary, Unusual and Infrequently Occurring Events and Transactions," andwill require expected future operating losses from discontinued operations to be displayed in discontinued operations in theperiod in which the losses are incurred rather than as of the measurement date, as presently required. As required by SFAS No.144, Hyperion adopted this new statement on July 1, 2002. The adoption did not have a material impact on its financialposition, results of operations or cash flows.
In November 2001, the FASB issued a Staff Announcement that requires classification of reimbursements for “out-of-pocket”expenses incurred as revenue in the income statement. This Announcement was effective for reporting periods beginning afterDecember 15, 2001. Hyperion adopted this Announcement effective January 1, 2002. As a result, Hyperion no longer records"out-of-pocket" expense reimbursements as a reduction of costs incurred and comparative financial statements from priorperiods have been reclassified. For the years ended June 30, 2001 and 2000, approximately $11.3 million and $6.9 million hasbeen reclassified primarily from cost of maintenance and services to maintenance and services revenues to conform to thecurrent period presentation.
In May 2002, the FASB issued SFAS No. 145, "Rescission of FASB Statements Nos. 4, 44, and 64, Amendment of FASBStatement No. 13, and Technical Corrections." SFAS No. 145 eliminates Statement 4 (and Statement 64, as it amendsStatement 4), which requires gains and losses from extinguishments of debt to be aggregated and, if material, classified as anextraordinary item, net of the related income tax effect. As a result, the criteria in APB Opinion 30 will now be used todetermine the classification of those gains and losses. SFAS No. 145 amends FASB Statement No. 13 to require that certainlease modifications that have economic effects similar to sale-leaseback transactions be accounted for in the same manner assale-leaseback transactions. This amendment is consistent with the FASB's goal of requiring similar accounting treatment fortransactions that have similar economic effects. In addition, SFAS No. 145 makes technical corrections to existing
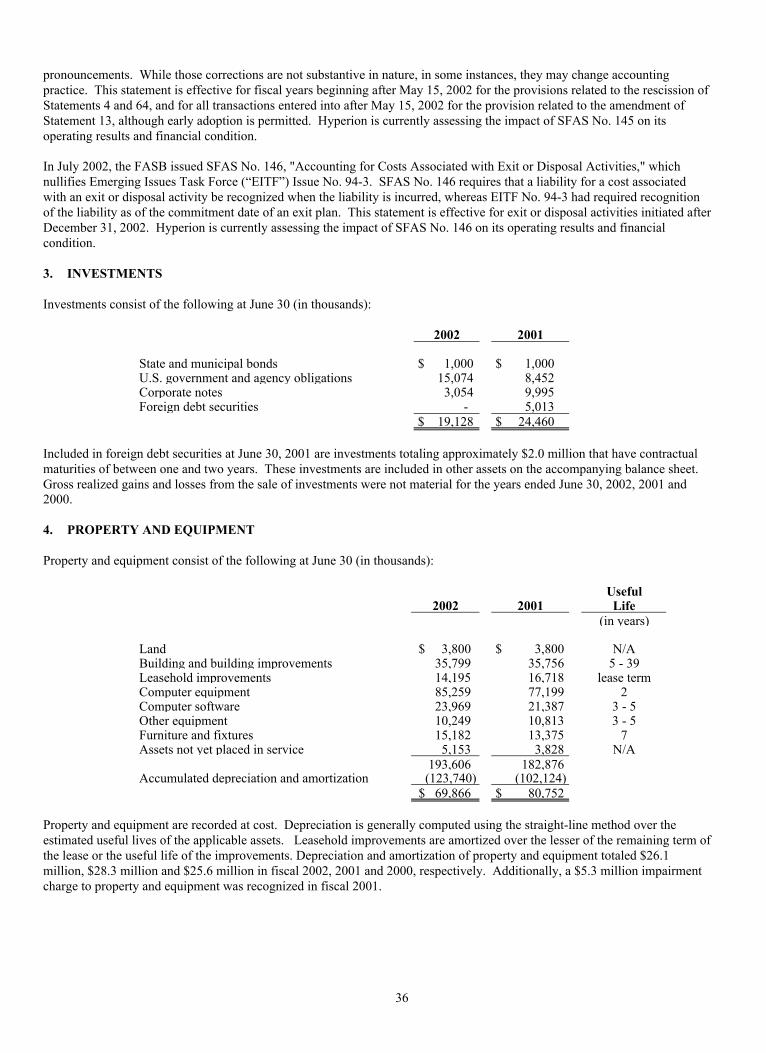
36
pronouncements. While those corrections are not substantive in nature, in some instances, they may change accountingpractice. This statement is effective for fiscal years beginning after May 15, 2002 for the provisions related to the rescission ofStatements 4 and 64, and for all transactions entered into after May 15, 2002 for the provision related to the amendment ofStatement 13, although early adoption is permitted. Hyperion is currently assessing the impact of SFAS No. 145 on itsoperating results and financial condition.
In July 2002, the FASB issued SFAS No. 146, "Accounting for Costs Associated with Exit or Disposal Activities," whichnullifies Emerging Issues Task Force (“EITF”) Issue No. 94-3. SFAS No. 146 requires that a liability for a cost associatedwith an exit or disposal activity be recognized when the liability is incurred, whereas EITF No. 94-3 had required recognitionof the liability as of the commitment date of an exit plan. This statement is effective for exit or disposal activities initiated afterDecember 31, 2002. Hyperion is currently assessing the impact of SFAS No. 146 on its operating results and financialcondition.
3. INVESTMENTS
Investments consist of the following at June 30 (in thousands):
2002 2001
State and municipal bonds $ 1,000 $ 1,000U.S. government and agency obligations 15,074 8,452Corporate notes 3,054 9,995Foreign debt securities - 5,013
$ 19,128 $ 24,460
Included in foreign debt securities at June 30, 2001 are investments totaling approximately $2.0 million that have contractualmaturities of between one and two years. These investments are included in other assets on the accompanying balance sheet.Gross realized gains and losses from the sale of investments were not material for the years ended June 30, 2002, 2001 and2000.
4. PROPERTY AND EQUIPMENT
Property and equipment consist of the following at June 30 (in thousands):
Useful2002 2001 Life
(in years)
Land $ 3,800 $ 3,800 N/ABuilding and building improvements 35,799 35,756 5 - 39Leasehold improvements 14,195 16,718 lease termComputer equipment 85,259 77,199 2Computer software 23,969 21,387 3 - 5Other equipment 10,249 10,813 3 - 5Furniture and fixtures 15,182 13,375 7Assets not yet placed in service 5,153 3,828 N/A
193,606 182,876Accumulated depreciation and amortization (123,740) (102,124)
$ 69,866 $ 80,752
Property and equipment are recorded at cost. Depreciation is generally computed using the straight-line method over theestimated useful lives of the applicable assets. Leasehold improvements are amortized over the lesser of the remaining term ofthe lease or the useful life of the improvements. Depreciation and amortization of property and equipment totaled $26.1million, $28.3 million and $25.6 million in fiscal 2002, 2001 and 2000, respectively. Additionally, a $5.3 million impairmentcharge to property and equipment was recognized in fiscal 2001.
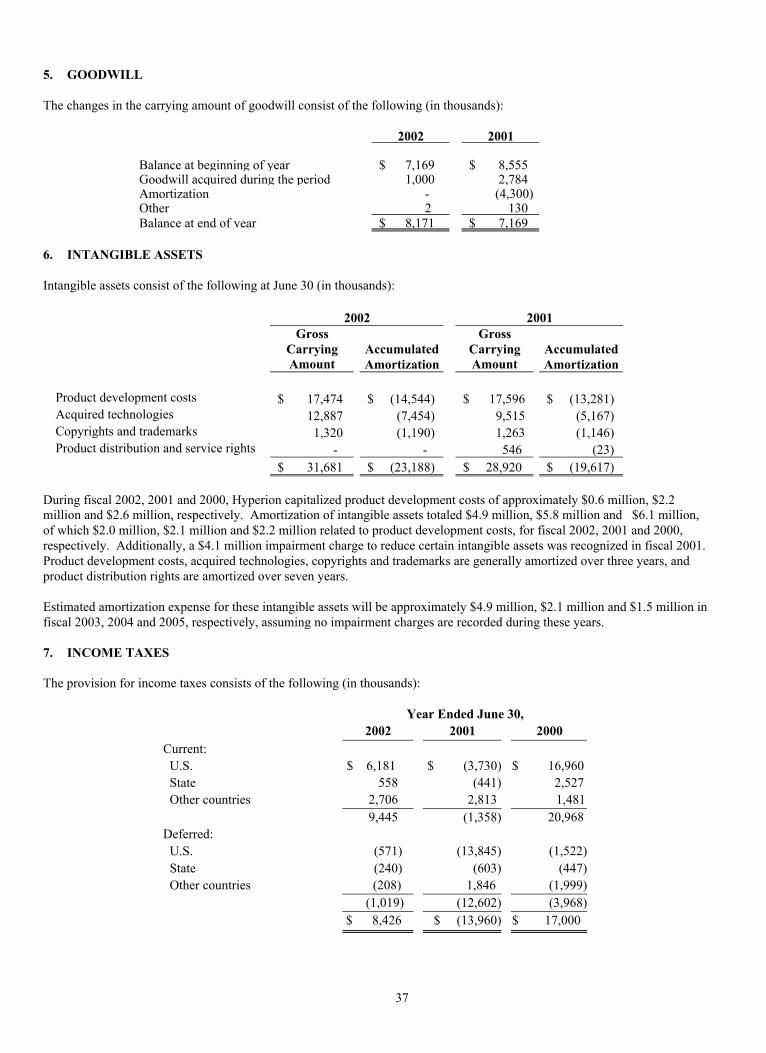
37
5. GOODWILL
The changes in the carrying amount of goodwill consist of the following (in thousands):
2002 2001
Balance at beginning of year $ 7,169 $ 8,555Goodwill acquired during the period 1,000 2,784Amortization - (4,300)Other 2 130Balance at end of year $ 8,171 $ 7,169
6. INTANGIBLE ASSETS
Intangible assets consist of the following at June 30 (in thousands):
2002 2001Gross
CarryingAmount
AccumulatedAmortization
GrossCarryingAmount
AccumulatedAmortization
Product development costs $ 17,474 $ (14,544) $ 17,596 $ (13,281)Acquired technologies 12,887 (7,454) 9,515 (5,167)Copyrights and trademarks 1,320 (1,190) 1,263 (1,146)Product distribution and service rights - - 546 (23)
$ 31,681 $ (23,188) $ 28,920 $ (19,617)
During fiscal 2002, 2001 and 2000, Hyperion capitalized product development costs of approximately $0.6 million, $2.2million and $2.6 million, respectively. Amortization of intangible assets totaled $4.9 million, $5.8 million and $6.1 million,of which $2.0 million, $2.1 million and $2.2 million related to product development costs, for fiscal 2002, 2001 and 2000,respectively. Additionally, a $4.1 million impairment charge to reduce certain intangible assets was recognized in fiscal 2001.Product development costs, acquired technologies, copyrights and trademarks are generally amortized over three years, andproduct distribution rights are amortized over seven years.
Estimated amortization expense for these intangible assets will be approximately $4.9 million, $2.1 million and $1.5 million infiscal 2003, 2004 and 2005, respectively, assuming no impairment charges are recorded during these years.
7. INCOME TAXES
The provision for income taxes consists of the following (in thousands):
Year Ended June 30,2002 2001 2000
Current: U.S. $ 6,181 $ (3,730) $ 16,960 State 558 (441) 2,527 Other countries 2,706 2,813 1,481
9,445 (1,358) 20,968Deferred: U.S. (571) (13,845) (1,522) State (240) (603) (447) Other countries (208) 1,846 (1,999)
(1,019) (12,602) (3,968)$ 8,426 $ (13,960) $ 17,000
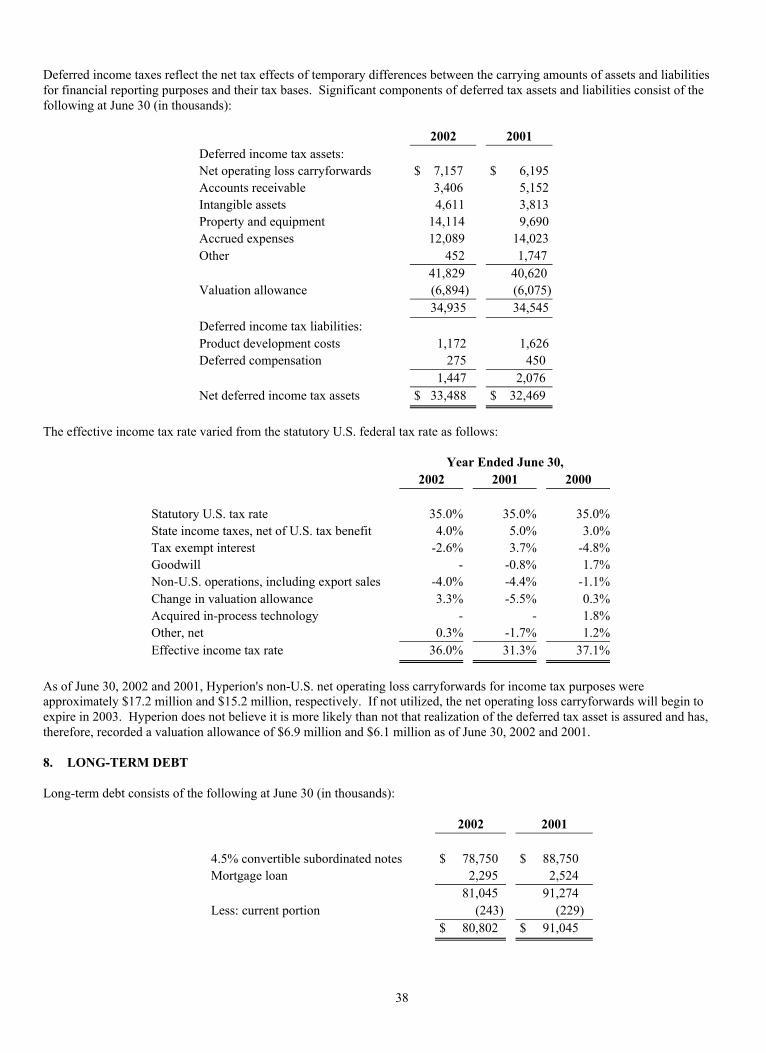
38
Deferred income taxes reflect the net tax effects of temporary differences between the carrying amounts of assets and liabilitiesfor financial reporting purposes and their tax bases. Significant components of deferred tax assets and liabilities consist of thefollowing at June 30 (in thousands):
2002 2001Deferred income tax assets:Net operating loss carryforwards $ 7,157 $ 6,195Accounts receivable 3,406 5,152Intangible assets 4,611 3,813Property and equipment 14,114 9,690Accrued expenses 12,089 14,023Other 452 1,747
41,829 40,620Valuation allowance (6,894) (6,075)
34,935 34,545
Deferred income tax liabilities:Product development costs 1,172 1,626Deferred compensation 275 450
1,447 2,076Net deferred income tax assets $ 33,488 $ 32,469
The effective income tax rate varied from the statutory U.S. federal tax rate as follows:
Year Ended June 30,2002 2001 2000
Statutory U.S. tax rate 35.0% 35.0% 35.0%State income taxes, net of U.S. tax benefit 4.0% 5.0% 3.0%Tax exempt interest -2.6% 3.7% -4.8%Goodwill - -0.8% 1.7%Non-U.S. operations, including export sales -4.0% -4.4% -1.1%Change in valuation allowance 3.3% -5.5% 0.3%Acquired in-process technology - - 1.8%Other, net 0.3% -1.7% 1.2%Effective income tax rate 36.0% 31.3% 37.1%
As of June 30, 2002 and 2001, Hyperion's non-U.S. net operating loss carryforwards for income tax purposes wereapproximately $17.2 million and $15.2 million, respectively. If not utilized, the net operating loss carryforwards will begin toexpire in 2003. Hyperion does not believe it is more likely than not that realization of the deferred tax asset is assured and has,therefore, recorded a valuation allowance of $6.9 million and $6.1 million as of June 30, 2002 and 2001.
8. LONG-TERM DEBT
Long-term debt consists of the following at June 30 (in thousands):
2002 2001
4.5% convertible subordinated notes $ 78,750 $ 88,750Mortgage loan 2,295 2,524
81,045 91,274Less: current portion (243) (229)
$ 80,802 $ 91,045
39
In March 1998, Hyperion issued $100.0 million of 4.5% convertible subordinated notes, due 2005. The notes are subordinatedto all existing and future senior debt and are convertible into shares of Hyperion's common stock at a conversion price of$56.36 per share. The notes are redeemable at the option of Hyperion, in whole or in part, at any time on or after March 20,2001, at 104.5% of the principal amount initially, and thereafter at prices declining to 100% at maturity, in each case togetherwith accrued interest. Each holder of the notes has the right, subject to certain conditions and restrictions, to require Hyperionto offer to repurchase all outstanding notes, in whole or in part, owned by such holder, at specified repurchase prices togetherwith accrued interest upon the occurrence of certain events. Hyperion incurred $3.3 million of costs in connection with theissuance of the notes, which were deferred and included in other assets. These finance costs are being recognized as interestexpense over the term of the notes using the straight-line method, which approximates the effective interest method. Interest onthe notes began accruing March 16, 1998 and is payable semi-annually on March 15 and September 15. The fair value of thenotes was approximately $71.2 million at June 30, 2002, based on quoted market prices.
During fiscal 2002, Hyperion repurchased $10.0 million of the notes for a total cost of $8.9 million, resulting in anextraordinary gain of approximately $0.6 million after income taxes, or approximately $0.02 per share. During fiscal 2001,Hyperion repurchased $11.3 million of the notes for a total cost of $8.7 million, resulting in an extraordinary gain ofapproximately $1.5 million after income taxes, or approximately $0.04 per share.
Hyperion obtained a mortgage loan of $9.5 million from the Connecticut Development Authority to purchase its Stamford,Connecticut office building. The mortgage loan is repayable in monthly installments of principal and interest with the lastpayment due February 2005. As of January 1, 2000, Hyperion had employed fewer employees in its Stamford, Connecticutoffice than required under the terms of the loan. As a result, Hyperion prepaid $4.1 million of the outstanding principalbalance and incurred additional interest expense of $0.2 million. In addition, the interest rate on the remaining outstandingprincipal balance increased by approximately 1.4%. As of June 30, 2002, the loan bears interest at 6.0% per annum.
Future maturities of the loan and notes are as follows (in thousands):
2003 $ 2432004 2582005 80,544
$ 81,045
9. RELATED PARTY TRANSACTIONS
In March 2002, Siebel Systems, Inc. purchased several products from Hyperion for approximately $0.9 million for purposes ofimplementing an enterprise-wide financial planning system. In addition, Siebel has a future option to purchase the sameproducts in accordance with normal contractual terms and conditions. The Chief Financial Officer of Siebel is on the board ofdirectors of Hyperion.
In March 2002, Hyperion purchased approximately $3.0 million of software, maintenance and services from Siebel for thepurpose of implementing a worldwide customer relationship management system. Hyperion capitalized in property andequipment approximately $2.6 million of this amount, as it related to software licenses, and recorded the remaining $0.4million in prepaid expenses. The prepaid expenses are being amortized as the services are provided, and approximately $0.1million was amortized during the year ended June 30, 2002.
10. COMMITMENTS AND CONTINGENCIES
Hyperion leases office and research facilities and certain computer and other equipment under operating lease agreementsexpiring at various dates through 2016. In addition to base rent, Hyperion is responsible for certain taxes, utilities andmaintenance costs. Additionally, several leases include rentals based upon changes in the Consumer Price Index or the fairmarket rental value of the property and options for renewal or purchase. Hyperion subleases certain of its facilities to third-party tenants. These subleases expire at various dates from 2003 to 2016.
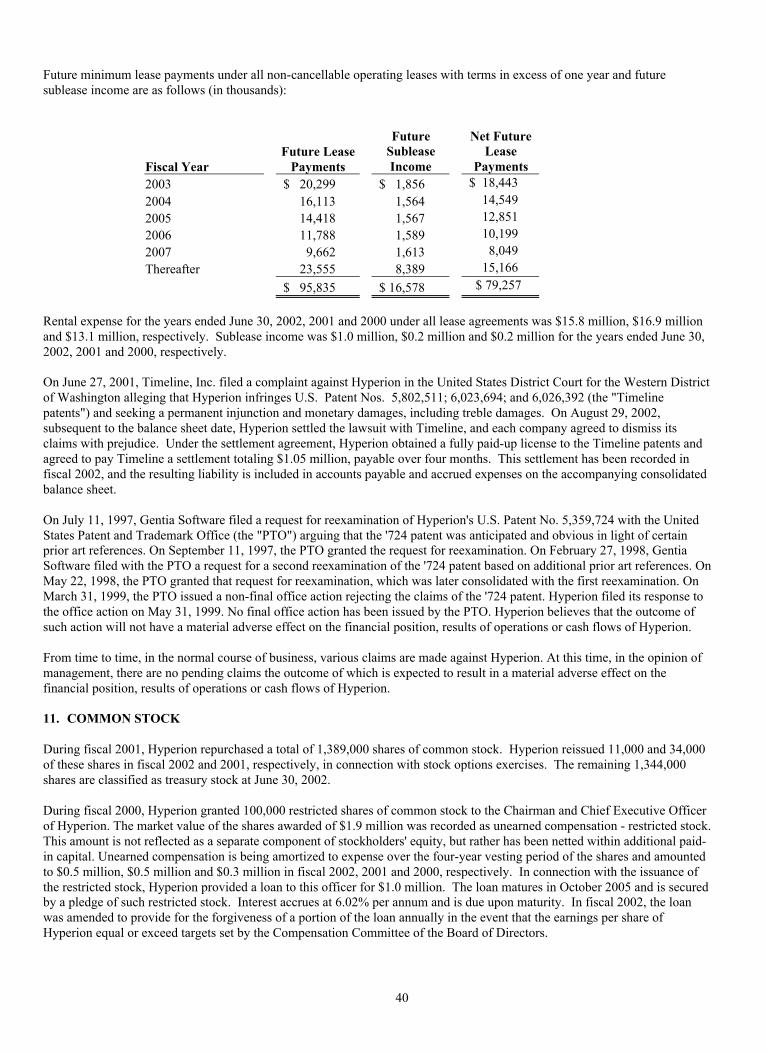
40
Future minimum lease payments under all non-cancellable operating leases with terms in excess of one year and futuresublease income are as follows (in thousands):
Fiscal YearFuture Lease
Payments
FutureSubleaseIncome
Net FutureLease
Payments2003 $ 20,299 $ 1,856 $ 18,443
2004 16,113 1,564 14,549
2005 14,418 1,567 12,851
2006 11,788 1,589 10,199
2007 9,662 1,613 8,049
Thereafter 23,555 8,389 15,166
$ 95,835 $ 16,578 $ 79,257
Rental expense for the years ended June 30, 2002, 2001 and 2000 under all lease agreements was $15.8 million, $16.9 millionand $13.1 million, respectively. Sublease income was $1.0 million, $0.2 million and $0.2 million for the years ended June 30,2002, 2001 and 2000, respectively.
On June 27, 2001, Timeline, Inc. filed a complaint against Hyperion in the United States District Court for the Western Districtof Washington alleging that Hyperion infringes U.S. Patent Nos. 5,802,511; 6,023,694; and 6,026,392 (the "Timelinepatents") and seeking a permanent injunction and monetary damages, including treble damages. On August 29, 2002,subsequent to the balance sheet date, Hyperion settled the lawsuit with Timeline, and each company agreed to dismiss itsclaims with prejudice. Under the settlement agreement, Hyperion obtained a fully paid-up license to the Timeline patents andagreed to pay Timeline a settlement totaling $1.05 million, payable over four months. This settlement has been recorded infiscal 2002, and the resulting liability is included in accounts payable and accrued expenses on the accompanying consolidatedbalance sheet.
On July 11, 1997, Gentia Software filed a request for reexamination of Hyperion's U.S. Patent No. 5,359,724 with the UnitedStates Patent and Trademark Office (the "PTO") arguing that the '724 patent was anticipated and obvious in light of certainprior art references. On September 11, 1997, the PTO granted the request for reexamination. On February 27, 1998, GentiaSoftware filed with the PTO a request for a second reexamination of the '724 patent based on additional prior art references. OnMay 22, 1998, the PTO granted that request for reexamination, which was later consolidated with the first reexamination. OnMarch 31, 1999, the PTO issued a non-final office action rejecting the claims of the '724 patent. Hyperion filed its response tothe office action on May 31, 1999. No final office action has been issued by the PTO. Hyperion believes that the outcome ofsuch action will not have a material adverse effect on the financial position, results of operations or cash flows of Hyperion.
From time to time, in the normal course of business, various claims are made against Hyperion. At this time, in the opinion ofmanagement, there are no pending claims the outcome of which is expected to result in a material adverse effect on thefinancial position, results of operations or cash flows of Hyperion.
11. COMMON STOCK
During fiscal 2001, Hyperion repurchased a total of 1,389,000 shares of common stock. Hyperion reissued 11,000 and 34,000of these shares in fiscal 2002 and 2001, respectively, in connection with stock options exercises. The remaining 1,344,000shares are classified as treasury stock at June 30, 2002.
During fiscal 2000, Hyperion granted 100,000 restricted shares of common stock to the Chairman and Chief Executive Officerof Hyperion. The market value of the shares awarded of $1.9 million was recorded as unearned compensation - restricted stock.This amount is not reflected as a separate component of stockholders' equity, but rather has been netted within additional paid-in capital. Unearned compensation is being amortized to expense over the four-year vesting period of the shares and amountedto $0.5 million, $0.5 million and $0.3 million in fiscal 2002, 2001 and 2000, respectively. In connection with the issuance ofthe restricted stock, Hyperion provided a loan to this officer for $1.0 million. The loan matures in October 2005 and is securedby a pledge of such restricted stock. Interest accrues at 6.02% per annum and is due upon maturity. In fiscal 2002, the loanwas amended to provide for the forgiveness of a portion of the loan annually in the event that the earnings per share ofHyperion equal or exceed targets set by the Compensation Committee of the Board of Directors.

41
12. STOCK OPTION, EMPLOYEE STOCK PURCHASE, AND EMPLOYEE SAVINGS PLANS
Stock Option Plans
As of June 30, 2002, Hyperion had an aggregate of 11.8 million common shares authorized for issuance under its equity plans.The equity plans provide for the issuance of common shares pursuant to stock option exercises and other equity based awards.There were 1.4 million shares available for grant under the equity plans as of June 30, 2002. Under the equity plans, stockoptions can be issued to employees and to non-employee directors.
Stock options are granted under the equity plans with exercise prices equal to the fair market value of the common stock on thedate of grant and generally vest over a period of four years. Options granted under the equity plans have a maximum term of 10years from the date of grant. Options provide for accelerated vesting upon certain events, including an employee's involuntarytermination, as defined in the plan, within eighteen months following a change in control of Hyperion.
The following table presents a summary of Hyperion's stock option activity for the years ended June 30 (shares in thousands):
2002 2001 2000Weighted Weighted WeightedAverage Average AverageExercise Exercise Exercise
Shares Price Shares Price Shares PriceOutstanding at beginning of year 8,423 $ 23.02 7,492 $ 25.29 5,355 $ 22.69 Granted 2,388 18.99 3,159 18.67 5,123 26.98 Exercised (348) 14.77 (357) 13.79 (1,251) 21.97 Forfeited (1,361) 25.66 (1,871) 26.55 (1,735) 24.68
Outstanding at end of year 9,102 $ 21.89 8,423 $ 23.02 7,492 $ 25.29
Exercisable at end of year 4,304 $ 23.47 3,005 $ 24.16 1,665 $ 21.46
The following table summarizes information about stock options outstanding at June 30, 2002 (shares in thousands):
Options Outstanding Options ExercisableWeighted Average Weighted Weighted
Range of Number Remaining Years of Average Number AverageExercise Prices Outstanding Contractual Life Exercise Price Exercisable Exercise Price
$ 0.50 - 14.99 1,306 7.70 $ 12.86 540 $ 12.42$ 15.00 - 15.99 1,385 8.48 $ 15.12 504 $ 15.12$ 16.00 - 19.99 1,969 7.63 $ 18.77 1,108 $ 18.98$ 20.00 - 25.99 2,407 8.59 $ 22.10 716 $ 22.06$ 26.00 - 35.99 1,254 7.00 $ 29.61 892 $ 29.47$ 36.00 - 57.63 781 7.12 $ 43.75 544 $ 43.31
9,102 4,304
Employee Stock Purchase Plan
Hyperion sponsors an employee stock purchase plan, or ESPP, which is qualified under Section 423 of the Internal RevenueCode. Under the ESPP, substantially all employees may purchase Hyperion common stock through payroll deductions at aprice equal to 85 percent of the lower of the fair market value at the beginning or end of each six-month offering period. Stockpurchases under the ESPP are limited to ten percent of an employee's eligible compensation, up to 1,000 shares in a six-monthperiod and a fair market value of $25,000 in any plan year. Shares issued under the ESPP were 606,000 for fiscal 2002,775,000 for fiscal 2001 and 360,000 for fiscal 2000. At June 30, 2002, 970,000 shares were reserved for future issuance underthe ESPP.

42
Pro Forma Disclosure
The weighted average estimated grant date fair value, as defined by SFAS No. 123, for options granted under Hyperion's stockoption plans in fiscal 2002, 2001 and 2000 was $10.89, $13.21 and $11.26 per share, respectively. The weighted averageestimated grant date fair value, as defined by SFAS No. 123, for purchase awards issued under Hyperion's employee stockpurchase plan in fiscal 2002, 2001 and 2000 was $4.17, $4.71 and $7.80 per share, respectively. The estimated grant date fairvalues were calculated using the Black-Scholes model.
The following weighted average assumptions were used in the estimated grant date fair value calculations for stock option andpurchase awards:
Year Ended June 30,2002 2001 2000
Stock option plans: Expected dividend yield 0% 0% 0% Expected stock price volatility 70% 84% 40% Risk free interest rate 4.53% 4.97% 6.24% Expected term (in years) 4.2 5.5 4.3
Stock purchase plan: Expected dividend yield 0% 0% 0% Expected stock price volatility 70% 84% 40% Risk free interest rate 2.69% 3.63% 6.22% Expected term (in years) 0.5 0.5 0.5
Had Hyperion recorded compensation expense based on the estimated grant date fair value, as defined by SFAS No. 123, forawards granted under its stock option plans and stock purchase plan, Hyperion's net income (loss) and earnings (loss) per sharewould have been reduced to the pro forma amounts below (in thousands, except per share amounts):
Year Ended June 30,2002 2001 2000
Net income (loss): As reported $ 14,981 $ (31,073) $ 28,819 Pro forma $ (882) $ (55,731) $ 18,220
Net income (loss) per share: As reported – basic $ 0.46 $ (0.95) $ 0.91 As reported – diluted $ 0.45 $ (0.95) $ 0.87 Pro forma – basic $ (0.03) $ (1.71) $ 0.58 Pro forma – diluted $ (0.03) $ (1.71) $ 0.55
Because the determination of the fair value of options granted includes an expected volatility factor in addition to the otherfactors described in the tables above and because additional option grants are expected to be made each year, the above proforma disclosures are not representative of the pro forma effects of option grants on reported results for future years.
Employee Savings Plans
Hyperion maintains an employee savings plan that qualifies as a cash or deferred salary arrangement under Section 401(k) ofthe Internal Revenue Code. Under the plan, participating U.S. employees may defer up to 15% of their pre-tax compensation,but not more than $11,000 for calendar year 2002. Hyperion contributes to the plan annually, up to a maximum of $2,000 perparticipant. Similar savings plans are maintained with respect to certain non-U.S. employees. In fiscal 2002, 2001 and 2000,Hyperion contributed $4.7 million, $5.4 million and $3.6 million, respectively, to the savings plans.
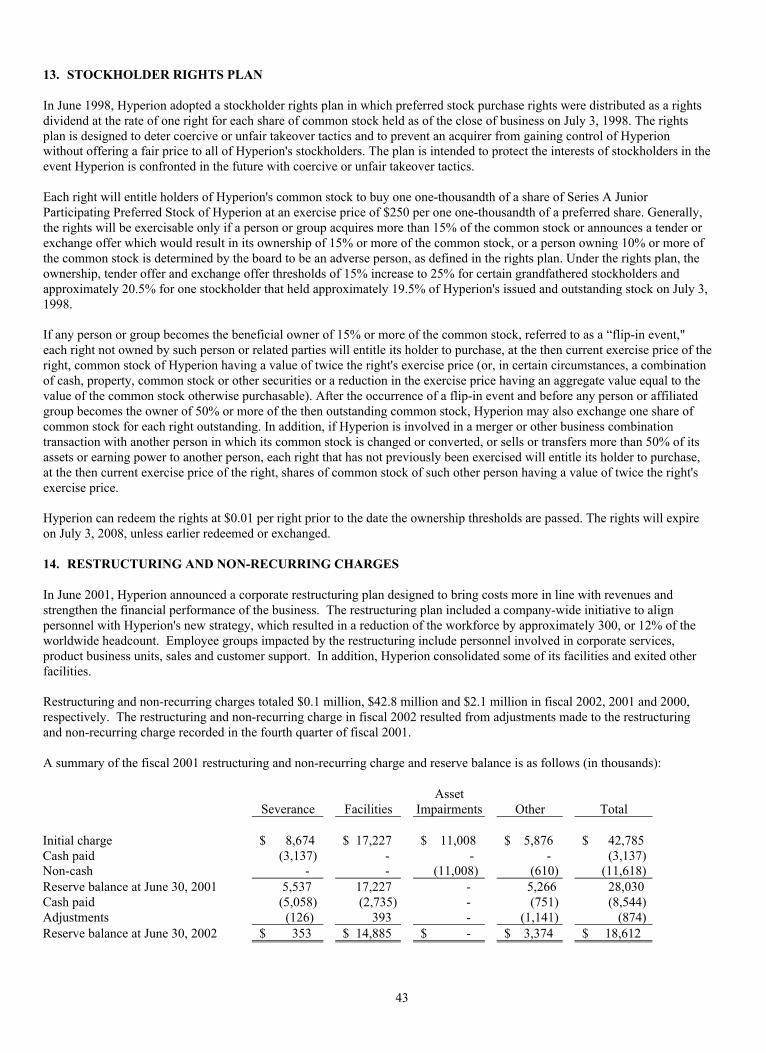
43
13. STOCKHOLDER RIGHTS PLAN
In June 1998, Hyperion adopted a stockholder rights plan in which preferred stock purchase rights were distributed as a rightsdividend at the rate of one right for each share of common stock held as of the close of business on July 3, 1998. The rightsplan is designed to deter coercive or unfair takeover tactics and to prevent an acquirer from gaining control of Hyperionwithout offering a fair price to all of Hyperion's stockholders. The plan is intended to protect the interests of stockholders in theevent Hyperion is confronted in the future with coercive or unfair takeover tactics.
Each right will entitle holders of Hyperion's common stock to buy one one-thousandth of a share of Series A JuniorParticipating Preferred Stock of Hyperion at an exercise price of $250 per one one-thousandth of a preferred share. Generally,the rights will be exercisable only if a person or group acquires more than 15% of the common stock or announces a tender orexchange offer which would result in its ownership of 15% or more of the common stock, or a person owning 10% or more ofthe common stock is determined by the board to be an adverse person, as defined in the rights plan. Under the rights plan, theownership, tender offer and exchange offer thresholds of 15% increase to 25% for certain grandfathered stockholders andapproximately 20.5% for one stockholder that held approximately 19.5% of Hyperion's issued and outstanding stock on July 3,1998.
If any person or group becomes the beneficial owner of 15% or more of the common stock, referred to as a “flip-in event,"each right not owned by such person or related parties will entitle its holder to purchase, at the then current exercise price of theright, common stock of Hyperion having a value of twice the right's exercise price (or, in certain circumstances, a combinationof cash, property, common stock or other securities or a reduction in the exercise price having an aggregate value equal to thevalue of the common stock otherwise purchasable). After the occurrence of a flip-in event and before any person or affiliatedgroup becomes the owner of 50% or more of the then outstanding common stock, Hyperion may also exchange one share ofcommon stock for each right outstanding. In addition, if Hyperion is involved in a merger or other business combinationtransaction with another person in which its common stock is changed or converted, or sells or transfers more than 50% of itsassets or earning power to another person, each right that has not previously been exercised will entitle its holder to purchase,at the then current exercise price of the right, shares of common stock of such other person having a value of twice the right'sexercise price.
Hyperion can redeem the rights at $0.01 per right prior to the date the ownership thresholds are passed. The rights will expireon July 3, 2008, unless earlier redeemed or exchanged.
14. RESTRUCTURING AND NON-RECURRING CHARGES
In June 2001, Hyperion announced a corporate restructuring plan designed to bring costs more in line with revenues andstrengthen the financial performance of the business. The restructuring plan included a company-wide initiative to alignpersonnel with Hyperion's new strategy, which resulted in a reduction of the workforce by approximately 300, or 12% of theworldwide headcount. Employee groups impacted by the restructuring include personnel involved in corporate services,product business units, sales and customer support. In addition, Hyperion consolidated some of its facilities and exited otherfacilities.
Restructuring and non-recurring charges totaled $0.1 million, $42.8 million and $2.1 million in fiscal 2002, 2001 and 2000,respectively. The restructuring and non-recurring charge in fiscal 2002 resulted from adjustments made to the restructuringand non-recurring charge recorded in the fourth quarter of fiscal 2001.
A summary of the fiscal 2001 restructuring and non-recurring charge and reserve balance is as follows (in thousands):
Severance FacilitiesAsset
Impairments Other Total
Initial charge $ 8,674 $ 17,227 $ 11,008 $ 5,876 $ 42,785Cash paid (3,137) - - - (3,137)Non-cash - - (11,008) (610) (11,618)Reserve balance at June 30, 2001 5,537 17,227 - 5,266 28,030Cash paid (5,058) (2,735) - (751) (8,544)Adjustments (126) 393 - (1,141) (874)Reserve balance at June 30, 2002 $ 353 $ 14,885 $ - $ 3,374 $ 18,612

44
As of June 30, 2001, Hyperion had communicated to all impacted employees regarding employee separation benefits and thetiming of separation, and all 300 positions had been separated or were in the separation process, resulting in cash payments of$3.1 million. Additional payments of $5.1 million were made during fiscal 2002 and the remaining severance payments ofapproximately $0.4 million will be paid in the first half of fiscal 2003. All restructuring activities related to the disposal and/orimpairment of long-term assets were completed as of June 30, 2001, and all restructuring activities associated with theconsolidation of facilities were completed by June 30, 2002.
Approximately $11.6 million of the $42.8 million restructuring and non-recurring charge recorded in fiscal 2001 did notrequire an outflow of cash, but the remaining $31.2 million has required or will require the use of cash (primarily payments dueunder long-term lease obligations). The reserve balance at June 30, 2002 of $18.6 million, which relates primarily to futurelease obligations, is included in other current liabilities and other liabilities on the accompanying consolidated balance sheet.Hyperion substantially completed its restructuring activities related to the restructuring plan described above during fiscal2002, however payments due under long-term lease obligations will continue to be made over the remaining lives of the leases.If Hyperion is unable to maintain a cost structure that is in appropriate balance with revenue going forward, whether due tofailure to increase revenue adequately or failure to keep costs down, Hyperion could find it necessary to further adjust its coststructure through the execution of additional restructuring plans.
In fiscal 2000, Hyperion recorded a non-recurring charge of approximately $2.1 million associated with restructuring itsEuropean operations and costs associated with outsourcing its North American accounting department. This charge wascomprised primarily of severance costs, all of which have been paid as of June 30, 2002.
15. SEGMENT AND GEOGRAPHICAL INFORMATION
SFAS No. 131, "Disclosures about Segments of an Enterprise and Related Information," established standards for reportinginformation about operating segments in a company's financial statements. Operating segments are defined as components ofan enterprise about which separate financial information is available that is evaluated regularly by the chief operating decisionmaker, or decision making group, in deciding how to allocate resources and in assessing performance. Hyperion has identifiedone industry segment: the development and marketing of business performance management software and related services.This segment operates in three geographic regions: Americas, Europe and Asia Pacific. Hyperion's products are marketedinternationally through Hyperion's direct sales force, independent distributors and application resellers.
Enterprise-wide information is provided in accordance with SFAS No. 131. Geographic sales information is primarily basedon the ordering location of the customer. Long-lived asset information is based on the physical location of the assets.
The following table is a breakdown of financial information by geographic area (in thousands):
AsiaAmericas Europe Pacific Total
Year Ended June 30, 2002:Total revenues $ 324,352 $ 141,423 $ 26,243 $ 492,018Long-lived assets 60,809 7,834 1,223 69,866
Year Ended June 30, 2001:Total revenues $ 362,984 $ 134,658 $ 30,369 $ 528,011Long-lived assets 71,317 8,268 1,167 80,752
Year Ended June 30, 2000:Total revenues $ 341,004 $ 131,860 $ 26,468 $ 499,332Long-lived assets 63,444 7,014 1,211 71,669

45
The following table presents external revenues for groups of similar products and services (in thousands):
Year Ended June 30,2002 2001 2000
Software licenses: Application products $ 92,698 $ 103,250 $ 118,814 Technology products 103,368 124,744 121,512
196,066 227,994 240,326Maintenance and services: Maintenance 186,052 170,840 154,452 Consulting and training 109,900 129,177 104,544
295,952 300,017 259,006
Total revenues $ 492,018 $ 528,011 $ 499,332
16. QUARTERLY RESULTS OF OPERATIONS (UNAUDITED)
The following is a summary of the unaudited quarterly results of operations for the years ended June 30, 2002 and 2001 (inthousands, except per share amounts):
Fiscal 2002 Sep. 30 Dec. 31 Mar. 31 Jun. 30
Total revenues $ 117,336 $ 118,903 $ 119,959 $ 135,820Gross profit 78,008 80,988 83,174 97,371Net income 1,946 3,729 3,085 6,221Diluted earnings per share 0.06 0.11 0.09 0.18
Fiscal 2001 Sep. 30 Dec. 31 Mar. 31 Jun. 30
Total revenues $ 117,996 $ 137,340 $ 132,662 $ 140,014Gross profit 75,602 94,415 85,965 94,680Net income (loss) (4,093) 2,270 (1,321) (27,929)Diluted earnings (loss) per share (0.12) 0.07 (0.04) (0.87)
46
ITEM 9. CHANGES IN AND DISAGREEMENTS WITH ACCOUNTANTS ON ACCOUNTING ANDFINANCIAL DISCLOSURE
None.
PART III
ITEM 10. DIRECTORS AND EXECUTIVE OFFICERS OF THE REGISTRANT
The information required by this Item 10 with respect to executive officers is set forth in Part I of this Form 10-K. Theinformation required by this Item 10 with respect to directors is incorporated herein by reference to the section entitled"Election of Directors" in our definitive Proxy Statement for our 2002 Annual Meeting of Stockholders.
ITEM 11. EXECUTIVE COMPENSATION
The information required by this item is incorporated herein by reference to the sections entitled "Director Compensation" and"Executive Compensation and Related Information" in our definitive Proxy Statement for our 2002 Annual Meeting ofStockholders.
ITEM 12. SECURITY OWNERSHIP OF CERTAIN BENEFICIAL OWNERS AND MANAGEMENT
The information required by this item is incorporated herein by reference to the section entitled "Stock Ownership of CertainBeneficial Owners and Management" in our definitive Proxy Statement for our 2002 Annual Meeting of Stockholders.
ITEM 13. CERTAIN RELATIONSHIPS AND RELATED TRANSACTIONS
The information required by this item is incorporated herein by reference to the section entitled "Certain Relationships andRelated Transactions" in our definitive Proxy Statement for our 2002 Annual Meeting of Shareholders.
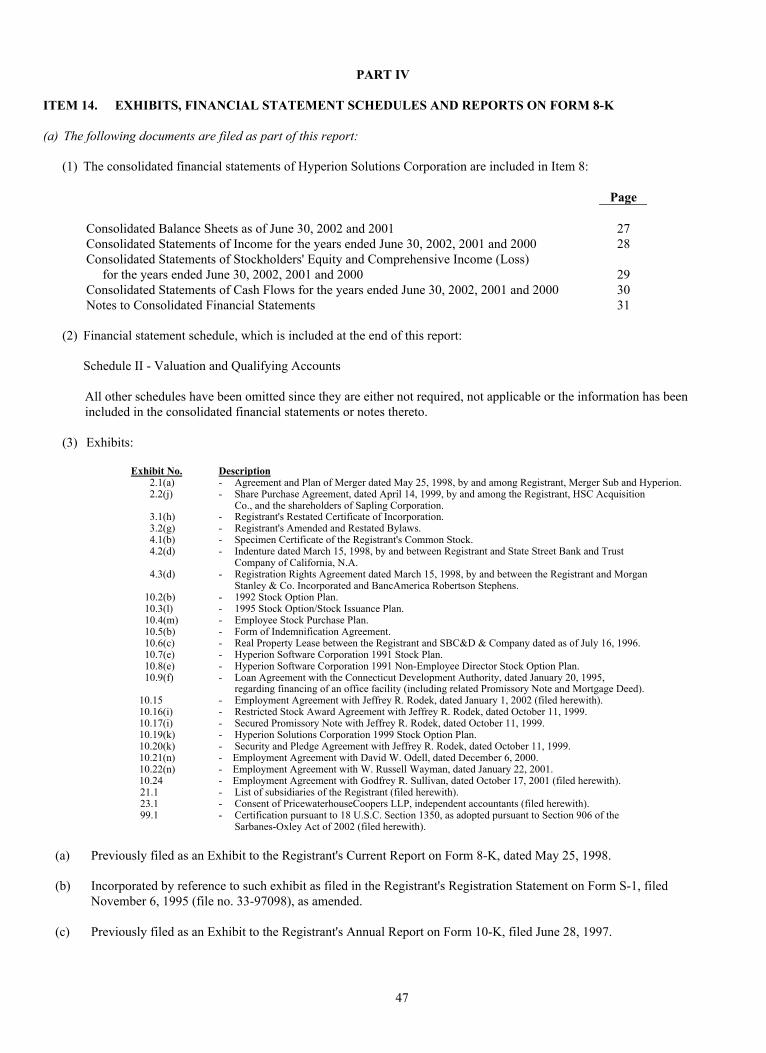
47
PART IV
ITEM 14. EXHIBITS, FINANCIAL STATEMENT SCHEDULES AND REPORTS ON FORM 8-K
(a) The following documents are filed as part of this report:
(1) The consolidated financial statements of Hyperion Solutions Corporation are included in Item 8:
Page
Consolidated Balance Sheets as of June 30, 2002 and 2001 27Consolidated Statements of Income for the years ended June 30, 2002, 2001 and 2000 28Consolidated Statements of Stockholders' Equity and Comprehensive Income (Loss) for the years ended June 30, 2002, 2001 and 2000 29Consolidated Statements of Cash Flows for the years ended June 30, 2002, 2001 and 2000 30Notes to Consolidated Financial Statements 31
(2) Financial statement schedule, which is included at the end of this report:
Schedule II - Valuation and Qualifying Accounts
All other schedules have been omitted since they are either not required, not applicable or the information has beenincluded in the consolidated financial statements or notes thereto.
(3) Exhibits:
Exhibit No. Description2.1(a) - Agreement and Plan of Merger dated May 25, 1998, by and among Registrant, Merger Sub and Hyperion.2.2(j) - Share Purchase Agreement, dated April 14, 1999, by and among the Registrant, HSC Acquisition
Co., and the shareholders of Sapling Corporation.3.1(h) - Registrant's Restated Certificate of Incorporation.3.2(g) - Registrant's Amended and Restated Bylaws.4.1(b) - Specimen Certificate of the Registrant's Common Stock.4.2(d) - Indenture dated March 15, 1998, by and between Registrant and State Street Bank and Trust
Company of California, N.A.4.3(d) - Registration Rights Agreement dated March 15, 1998, by and between the Registrant and Morgan
Stanley & Co. Incorporated and BancAmerica Robertson Stephens.10.2(b) - 1992 Stock Option Plan.10.3(l) - 1995 Stock Option/Stock Issuance Plan.10.4(m) - Employee Stock Purchase Plan.10.5(b) - Form of Indemnification Agreement.10.6(c) - Real Property Lease between the Registrant and SBC&D & Company dated as of July 16, 1996.10.7(e) - Hyperion Software Corporation 1991 Stock Plan.10.8(e) - Hyperion Software Corporation 1991 Non-Employee Director Stock Option Plan.10.9(f) - Loan Agreement with the Connecticut Development Authority, dated January 20, 1995,
regarding financing of an office facility (including related Promissory Note and Mortgage Deed).10.15 - Employment Agreement with Jeffrey R. Rodek, dated January 1, 2002 (filed herewith).10.16(i) - Restricted Stock Award Agreement with Jeffrey R. Rodek, dated October 11, 1999.10.17(i) - Secured Promissory Note with Jeffrey R. Rodek, dated October 11, 1999.10.19(k) - Hyperion Solutions Corporation 1999 Stock Option Plan.10.20(k) - Security and Pledge Agreement with Jeffrey R. Rodek, dated October 11, 1999.10.21(n) - Employment Agreement with David W. Odell, dated December 6, 2000.10.22(n) - Employment Agreement with W. Russell Wayman, dated January 22, 2001.10.24 - Employment Agreement with Godfrey R. Sullivan, dated October 17, 2001 (filed herewith).21.1 - List of subsidiaries of the Registrant (filed herewith).23.1 - Consent of PricewaterhouseCoopers LLP, independent accountants (filed herewith).99.1 - Certification pursuant to 18 U.S.C. Section 1350, as adopted pursuant to Section 906 of the
Sarbanes-Oxley Act of 2002 (filed herewith).
(a) Previously filed as an Exhibit to the Registrant's Current Report on Form 8-K, dated May 25, 1998.
(b) Incorporated by reference to such exhibit as filed in the Registrant's Registration Statement on Form S-1, filedNovember 6, 1995 (file no. 33-97098), as amended.
(c) Previously filed as an Exhibit to the Registrant's Annual Report on Form 10-K, filed June 28, 1997.
48
(d) Previously filed as an Exhibit to the Registrant's Current Report on Form 8-K, filed March 5, 1998.
Incorporated by reference to the exhibits to a Hyperion Software Corporation Registration Statement or CurrentReport (file no. 0-19538):
(e) Form S-1 file no. 33-42855.
(f) Form 10-Q filed in February 1995.
(g) Incorporated by reference to such exhibit as filed in the Registrant's Registration Statement on Form S-4 (file no. 333-57197), as amended, filed on June 18, 1998.
(h) Incorporated by reference to such exhibit as filed in the Registrant's Current Report on Form 8-K, dated August 24,1998 and filed on October 13, 1998.
(i) Incorporated by reference to the exhibits to the Registrant's Quarterly Report on Form 10-Q for the quarter endedDecember 31, 1999.
(j) Incorporated by reference to the exhibits to the Registrant's Annual Report on Form 10-K dated September 28, 1999.
(k) Incorporated by reference to the exhibits to the Registrant's Annual Report on Form 10-K dated September 28, 2000.
(l) Incorporated by reference to the exhibits to the Registrant's Quarterly Report on Form 10-Q for the quarter endedDecember 31, 2000.
(m) Incorporated by reference to the exhibits to the Registrant's Quarterly Report on Form 10-Q for the quarter endedDecember 31, 2001.
(n) Incorporated by reference to the exhibits to the Registrant's Annual Report on Form 10-K dated September 14, 2001.
(b) Reports on Form 8-K:
Hyperion did not file any reports on Form 8-K during the three-month period ended June 30, 2002.
49
SIGNATURES
Pursuant to the requirements of Section 13 or 15(d) of the Securities Exchange Act of 1934, the registrant has duly caused thisreport to be signed on its behalf by the undersigned, thereunto duly authorized.
Date: September 24, 2002 Hyperion Solutions Corporation(Registrant)
By: /s/ David W. Odell David W. OdellChief Financial Officer
By: /s/ Nolene P. Fabre Nolene P. FabrePrincipal Accounting Officer
Pursuant to the requirements of the Securities Exchange Act of 1934, this report has been signed below by the followingpersons on behalf of the registrant and in the capacities and on the dates indicated.
Signature Title Date
/s/ Jeffrey R. Rodek Chairman and Chief Executive Officer September 24, 2002 Jeffrey R. Rodek
/s/ Godfrey R. Sullivan President and Chief Operating Officer September 24, 2002 Godfrey R. Sullivan
/s/ Henry R. Autry Director September 24, 2002 Henry R. Autry
/s/ Kenneth A. Goldman Director September 24, 2002 Kenneth A. Goldman
/s/ Gary G. Greenfield Director September 24, 2002 Gary G. Greenfield
/s/ Aldo Papone Director September 24, 2002 Aldo Papone
/s/ John Riccitiello Director September 24, 2002 John Riccitiello

50
CERTIFICATIONS
I, Jeffrey R. Rodek, Chief Executive Officer, certify that:
1. I have reviewed this annual report on Form 10-K of Hyperion Solutions Corporation;
2. Based on my knowledge, this annual report does not contain any untrue statement of a material fact or omit to state amaterial fact necessary to make the statements made, in light of the circumstances under which such statements weremade, not misleading with respect to the period covered by this annual report; and
3. Based on my knowledge, the financial statements, and other financial information included in this annual report, fairlypresent in all material respects the financial condition, results of operations and cash flows of the registrant as of, and for,the periods presented in this annual report.
By: /s/ Jeffrey R. Rodek Jeffrey R. Rodek
Date: September 24, 2002
I, David W. Odell, Chief Financial Officer, certify that:
1. I have reviewed this annual report on Form 10-K of Hyperion Solutions Corporation;
2. Based on my knowledge, this annual report does not contain any untrue statement of a material fact or omit to state amaterial fact necessary to make the statements made, in light of the circumstances under which such statements weremade, not misleading with respect to the period covered by this annual report; and
3. Based on my knowledge, the financial statements, and other financial information included in this annual report, fairlypresent in all material respects the financial condition, results of operations and cash flows of the registrant as of, and for,the periods presented in this annual report.
By: /s/ David W. Odell David W. Odell
Date: September 24, 2002

51
SCHEDULE II - VALUATION AND QUALIFYING ACCOUNTS(in thousands)
AdditionsBalance at Charged to Charged BalanceBeginning Costs and to Other at End
Description of Period Expenses Accounts (a) Deductions of Period
Year Ended June 30, 2000: Allowance for doubtful accounts $ 11,800 1,460 6,856 3,866 (b) $ 16,250 Valuation allowance for deferred tax assets 4,014 124 - 666 (c) 3,472
Year Ended June 30, 2001: Allowance for doubtful accounts $ 16,250 5,950 21,727 31,451 (b) $ 12,476 Valuation allowance for deferred tax assets 3,472 2,603 - - 6,075 Restructuring components - 31,167 - 3,137 (d) 28,030
Year Ended June 30, 2002: Allowance for doubtful accounts $ 12,476 3,925 18,749 24,490 (b) $ 10,660 Valuation allowance for deferred tax assets 6,075 819 - - 6,894 Restructuring components 28,030 - - 9,418 (d) 18,612
(a) Charged to revenues(b) Write-offs, net of recoveries(c) Recognition and adjustments(d) Cash payments and adjustments

52
EXHIBIT INDEX
Exhibit No. Description2.1(a) - Agreement and Plan of Merger dated May 25, 1998, by and among Registrant, Merger Sub and Hyperion.2.2(j) - Share Purchase Agreement, dated April 14, 1999, by and among the Registrant, HSC Acquisition
Co., and the shareholders of Sapling Corporation.3.1(h) - Registrant's Restated Certificate of Incorporation.3.2(g) - Registrant's Amended and Restated Bylaws.4.1(b) - Specimen Certificate of the Registrant's Common Stock.4.2(d) - Indenture dated March 15, 1998, by and between Registrant and State Street Bank and Trust
Company of California, N.A.4.3(d) - Registration Rights Agreement dated March 15, 1998, by and between the Registrant and Morgan
Stanley & Co. Incorporated and BancAmerica Robertson Stephens.10.2(b) - 1992 Stock Option Plan.10.3(l) - 1995 Stock Option/Stock Issuance Plan.10.4(m) - Employee Stock Purchase Plan.10.5(b) - Form of Indemnification Agreement.10.6(c) - Real Property Lease between the Registrant and SBC&D & Company dated as of July 16, 1996.10.7(e) - Hyperion Software Corporation 1991 Stock Plan.10.8(e) - Hyperion Software Corporation 1991 Non-Employee Director Stock Option Plan.10.9(f) - Loan Agreement with the Connecticut Development Authority, dated January 20, 1995,
regarding financing of an office facility (including related Promissory Note and Mortgage Deed).10.15 - Employment Agreement with Jeffrey R. Rodek, dated January 1, 2002 (filed herewith).10.16(i) - Restricted Stock Award Agreement with Jeffrey R. Rodek, dated October 11, 1999.10.17(i) - Secured Promissory Note with Jeffrey R. Rodek, dated October 11, 1999.10.19(k) - Hyperion Solutions Corporation 1999 Stock Option Plan.10.20(k) - Security and Pledge Agreement with Jeffrey R. Rodek, dated October 11, 1999.10.21(n) - Employment Agreement with David W. Odell, dated December 6, 2000.10.22(n) - Employment Agreement with W. Russell Wayman, dated January 22, 2001.10.24 - Employment Agreement with Godfrey R. Sullivan, dated October 17, 2001 (filed herewith).21.1 - List of subsidiaries of the Registrant (filed herewith).23.1 - Consent of PricewaterhouseCoopers LLP, independent accountants (filed herewith).99.1 - Certification pursuant to 18 U.S.C. Section 1350, as adopted pursuant to Section 906 of the
Sarbanes-Oxley Act of 2002 (filed herewith).
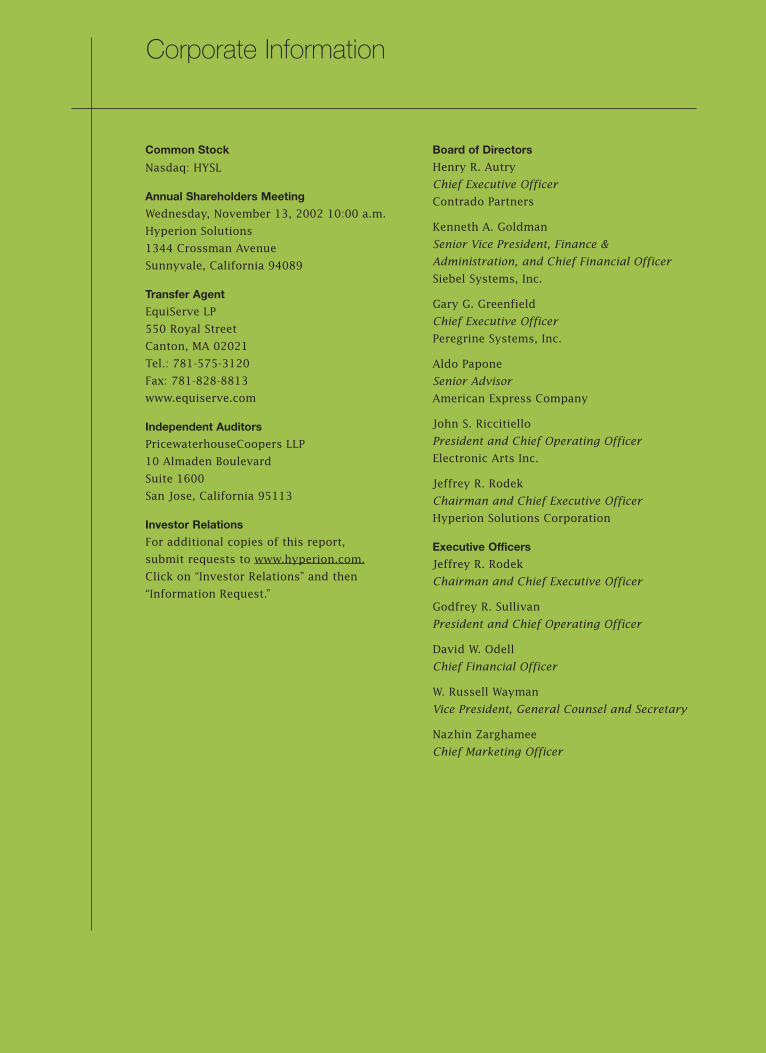
Common Stock
Nasdaq: HYSL
Annual Shareholders Meeting
Wednesday, November 13, 2002 10:00 a.m.
Hyperion Solutions
1344 Crossman Avenue
Sunnyvale, California 94089
Transfer Agent
EquiServe LP
550 Royal Street
Canton, MA 02021
Tel.: 781-575-3120
Fax: 781-828-8813
www.equiserve.com
Independent Auditors
PricewaterhouseCoopers LLP
10 Almaden Boulevard
Suite 1600
San Jose, California 95113
Investor Relations
For additional copies of this report,
submit requests to www.hyperion.com.
Click on “Investor Relations” and then
“Information Request.”
Board of Directors
Henry R. Autry
Chief Executive Officer
Contrado Partners
Kenneth A. Goldman
Senior Vice President, Finance &
Administration, and Chief Financial Officer
Siebel Systems, Inc.
Gary G. Greenfield
Chief Executive Officer
Peregrine Systems, Inc.
Aldo Papone
Senior Advisor
American Express Company
John S. Riccitiello
President and Chief Operating Officer
Electronic Arts Inc.
Jeffrey R. Rodek
Chairman and Chief Executive Officer
Hyperion Solutions Corporation
Executive Officers
Jeffrey R. Rodek
Chairman and Chief Executive Officer
Godfrey R. Sullivan
President and Chief Operating Officer
David W. Odell
Chief Financial Officer
W. Russell Wayman
Vice President, General Counsel and Secretary
Nazhin Zarghamee
Chief Marketing Officer
Corporate Information
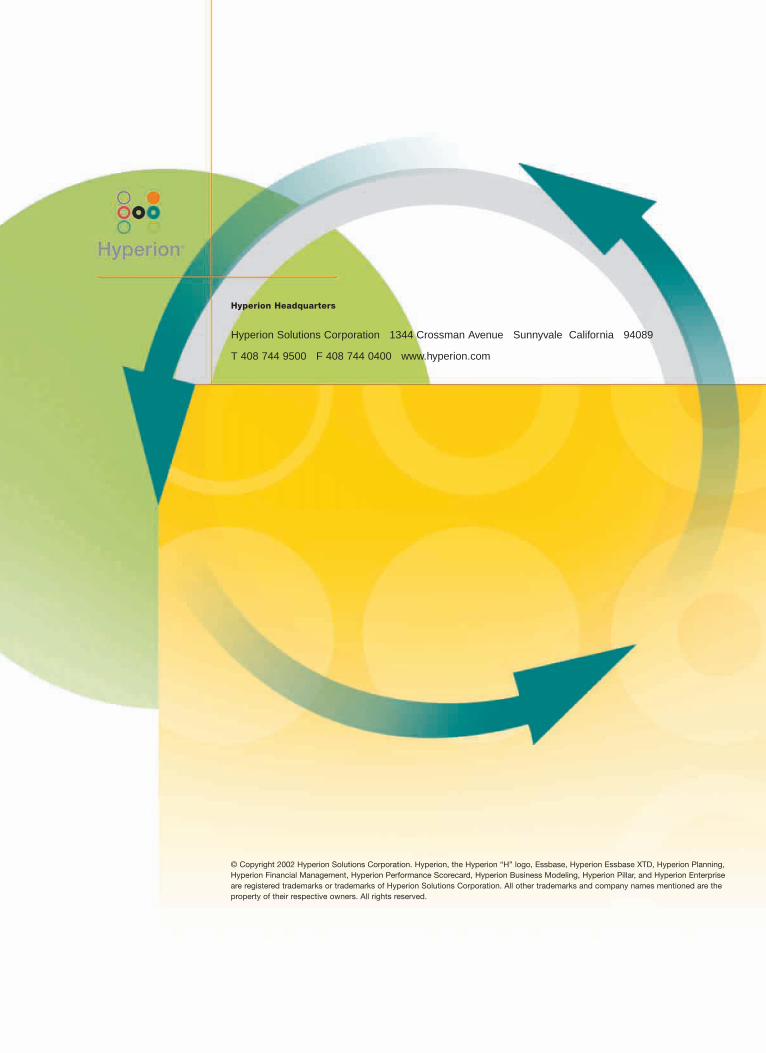
Hyperion Headquarters
Hyperion Solutions Corporation 1344 Crossman Avenue Sunnyvale California 94089
T 408 744 9500 F 408 744 0400 www.hyperion.com
© Copyright 2002 Hyperion Solutions Corporation. Hyperion, the Hyperion “H” logo, Essbase, Hyperion Essbase XTD, Hyperion Planning,Hyperion Financial Management, Hyperion Performance Scorecard, Hyperion Business Modeling, Hyperion Pillar, and Hyperion Enterpriseare registered trademarks or trademarks of Hyperion Solutions Corporation. All other trademarks and company names mentioned are theproperty of their respective owners. All rights reserved.