Embed Size (px)
Citation preview
HYDROTHERMAL TREATMENT OF BIOMASS IN
HOT-PRESSURIZED WATER
A Thesis Submitted to
the Graduate School of Engineering and Sciences of
Ġzmir Institute of Technology
in Partial Fulfillment of the Requirements for the Degree of
MASTER OF SCIENCE
in Biotechnology
by
Saken DADENOV
May, 2015
ĠZMĠR

We approve the thesis of Saken DADENOV
Examining Committee Members:
______________________________________
Assist. Prof. Dr. Aslı YÜKSEL ÖZġEN Department of Chemical Engineering, İzmir Institute of Technology
______________________________________
Assist. Prof. Dr. Ali Oğuz BÜYÜKKĠLECĠ
Department of Food Engineering, İzmir Institute of Technology
______________________________________
Prof. Dr. Oğuz BAYRAKTAR Department of Chemical Engineering, Ege University
15 May 2015
________________________________ _______________________________
Assist. Prof. Dr. Assoc.Prof.Dr.
Aslı YÜKSEL ÖZġEN Mustafa EMRULLAHOĞLU Supervisor, Department of Chemical Co-Supervisor
Engineering Chemistry Department of Chemistry
İzmir Institute of Technology İzmir Institute of Technology
________________________________ _____________________________
Prof. Dr. Volga BULMUġ Prof. Dr. Bilge KARAÇALI Head of the Department of Biotechnology Dean of the Graduate School of
and Bioengineering Engineering and Sciences
ACKNOWLEDGMENTS
First of all I would love to thank to my supervisor Assist. Prof. Dr. Aslı YÜKSEL
ÖZŞEN for her patience, help and immeasurable support in completing my M.Sc. study.
It would not been possible to write this master thesis without her guidance and advises.
I earned the great experience during working in her research team and discover many
things that I did not know before. For this I am sincerely grateful and I will not forget
her.
I am also grateful to my co-supervisor Assoc. Prof. Dr. Mustafa EMRULLAHOĞLU
for his valuable contribution in the improvement of this study.
I wish also thank to Prof. Dr. Volga BULMUŞ and Prof. Dr. Sedat AKKURT for their
kindness and support during my stay in Turkey.
I also would like to express my deep appreciation to all stuff of Izmir Institute of
Technology for good academic and technical facilities. Special thank to Chemist Belgin
TUNCEL KIRKAR for her kindness and assistance during my study. Also, I wish to
thank to Filiz KURUCAOVALI, Handan GAYGISIZ and Esra TUZCUOĞLU YÜCEL
for HPLC, GC-MS and GC-TCD analysis at the Environmental Research &
Development Center. I would like to thank to Deniz ŞİMŞEK for FTIR analysis and
Hüseyin ÖZGENER for Elemental analysis. I also appreciate Center of Materials
Research of Izmir Institute of Technology for SEM analysis.
I would like to express my appreciation to Okan AKIN for his guidance and endless
help during the experiments and analyses. Special thank to Damla TAYKOZ for her
kindness.
I sincerely thank to my friends, Mansiya ZORMANOVA, Saryuna MYLYSKEEVA
and Mehmet Akif TÜTÜNCÜ for their support and sincere friendship.
Finally, I would love to thank to my parents for their endless patience and support
during my whole study in Turkey.
iv
ABSTRACT
HYDROTHERMAL TREATMENT OF BIOMASS IN HOT-
PRESSURIZED WATER
The aim of this study is to observe conversion of cellulose, which is the main compound
of biomass, into its building-block chemicals in hot-pressured water as reaction medium
with no addition of organic solvents. Water in liquid state under temperature and
pressure above boiling point and below the critical point (374. 15 ºC and 22.1 MPa) is
called as hot-pressurized water (or sub-critical water).
Nowadays the biomass has great attention across the World as renewable source of
energy, at the background of the quickly growing energy demand, since it is widely
available and cheap. This technology is totally environmentally friendly and uses water
as a reaction medium. As well known, since plant biomass contains up to 50% cellulose,
it was decided to use it as a model compound in this study. Decomposition of cellulose
leads to formation of various compounds. Among them levulinic acid is the most
attractive chemical. Moreover, this acid marked as “Top 12 Building Blocks” of most
perspective chemicals and obtaining from biomass by hydrothermal treatment is not
widely studied.
During this study, different reaction parameters such as temperature, pressure, reaction
time and external oxidizer addition were studied to clarify their effects on cellulose
decomposition and product yields to achieve the highest selectivity of the desired
product. Addition of H2SO4 led to increase cellulose conversion up to 73% at 200 oC
with a H2SO4 concentration of 125 mM at 60 min reaction time. Under same conditions,
the yield of levulinic acid was successfully achieved to 38% after 60 min.

v
ÖZET
SICAK-BASINÇLI SUDA BİYOKÜTLENİN HİDROTERMAL
BOZUNMASI
Bu çalışmanın amacı, biyokütlenin ana bileşeni olan selülozun, herhangi bir
organik çözücü eklenmeden, sıcak-basınçlı suda organik yapıtaşlarına ayrılmasını
gözlemlemektir. Kaynama noktasının üstünde, kritik noktanın altında basınç ve
sıcaklığa sahip sıvı haldeki suya sıcak-basınçlı su (ya da kritik altı su) denilir. Suyun
kritik noktası 374.15 ºC ve 22.1 MPa’dir.
Günümüzde biyokütle, kolayca erişilebilir ve ucuz olduğu için hızla büyüyen
enerji talebine karşılık yenilenebilir bir enerji kaynağı olarak büyük ilgi görmektedir.
Biyokütlenin enerjiye dönüştürülmesinin tasarım aşamasında birçok uygulaması vardır.
Biyokütlenin hidrotermal bozunması, bu uygulamalar arasında en muhtemel olanlardan
biridir. Bu uygulama tamamen çevre dostudur ve tepkime ortamı olarak suyu kullanır.
İyi bilindiği üzere, bitki biyokütlesinin %50 kadarını selüloz oluşturur ve bu nedenle
selüloz bu çalışmada model bileşik olarak kullanılmak üzere seçilmiştir. Selülozun
ayrışması birçok değişik bileşiğin oluşmasına yol açar. Bunlar arasında en çekici olan
levulinik asittir. Ayrıca, bu asit “12 En Önemli Yapıtaşı” kimiyasallarından biri olduğu
için ve biyokütlenin hidrotermal bozunması üzerinde çok çalışılan bir alan olmadığı için
yeşil kimya alanına bu konuda katkıda bulunmaya karar verdik.
Araştırma sırasında sıcaklık, basınç, tepkime süresi, oksidan eklenmesi gibi
reaksiyon parametrelerinin selüloz bozunması ve ürün verimi üzerindeki etkileri, en
yüksek hedef ürünün üretilmesi amacıyla çalışılmıştır.

vi
To my grandmothers Ozipa Abdukarimova
and Darkhan Atabekova
vii
TABLE OF CONTENTS
LIST OF FIGURES……………………………………………………………………..ix
LIST OF TABLES……………………………………………………………………..xii
CHAPTER 1. INTRODUCTION……..…..……………………………………………..1
1.1. The Main Aim and the Importance of the Study………………………1
1.2. Biomass as a Renewable Energy Source……………………………….2
1.2.1. General Description and Classification of Biomass……………….2
1.2.2. Structure of Biomass………………………………………………4
1.3. Properties of Subcritical Water………………………………….……6
1.4. General Information About Levulinic Acid and 5-Hydroxy
1.5. Methyl Furfural (5-HMF)……………………………………………11
CHAPTER 2. LITERATURE REVIEW……………………………………………….16
2.1. Biomass Conversion Processes………………………………………..16
2.1.1. Thermochemical Processes………………………………………..17
2.1.2. Biochemical Conversation Processes…………………………..….18
2.1.3. Supercritical Fluid Extraction……………………………………..21
2.1.4. Production of Ethanol from Biomass……………………………...21
2.1.5. Supercritical Water Gasification…………………………………..24
2.1.6. Supercritical Water Oxidation……………………………………..27
2.1.7. Autohydrolysis………………………………………………..…...28
2.2. Biomass Treatment in Subcritical Water…………………………..….29
2.3. Biomass Conversion into Levulinic Acid and 5-HMF in
Subcritical Water…….………………………………………….…………33
CHAPTER 3. EXPERIMENTAL…………………………………………..…….…...36
3.1. Chemicals……………………………………………………………36
3.2. Experimental Apparatus (Batch Reactor)…………………………....36
3.3. Experimental Procedure………………………………………...…...37
3.4. Product Analysis…………………………………………………….39

viii
3.4.1. Analysis of Solid Products………………………………………39
3.4.2. Analysis of the Liquid Products………………………………….40
3.4.3. Analysis of Gas Products….…………………………….……….40
3.5. Cellulose Degradation Experiments in Subcritical Water.…….….…40
CHAPTER 4. RESULTS AND DISCUSSION….…………………………………….43
4.1. Effect of Reaction Temperature on Cellulose Degradation and
Product Yields…………………………………………..……………….44
4.2. Effect of Reaction Pressure on Cellulose Degradation and
Product Yields……………………………………………………………52
4.3. Effect of Acid Addition on Cellulose Degradation and
Product Yields…………………………...……………………………….53
4.4. Effect of Acid Type on Cellulose Degradation and Product
Yields..........................................................................................................57
4.5. Effect of Reaction Time on Cellulose Degradation and
Product Yields……………………………………………………………60
4.6. Statistical Analysis by Analysis of Variance (ANOVA)……………61
CHAPTER 5. CONCLUSION.……………………...…………………………………65
REFERENCES……………………………………………………………...………….66

ix
LIST OF FIGURES
Figure Page
Figure 1.1. Biomass content……………………………………………………………..5
Figure 1.2. The structure of cellulose……………………………………………………5
Figure 1.3. The structure of hemicelluloses………………………………………….....5
Figure 1.4. Phenylpropene units of lignin……………………………………………….6
Figure 1.5. Critical point of water and its phases in different temperature and pressure..8
Figure 1.6. Changes of waters properties at different temperature……………………...9
Figure 1.7. Specific heat capacity of water at constant pressure (250 bar)…………….10
Figure 1.8. Levulinic acid………………………………………………………………11
Figure 1.9. Levulinic acids pottential application……………………………………..13
Figure 1.10. Simplified reaction scheme of biomass conversion to levulinic acid…….14
Figure 1.11. 5-hydroxy-methylfurfural………………………………………………...15
Figure 1.12. Potential derivatives of 5-hydroxy-methylfurfural……………………….15
Figure 2.1. Dry biomass conversion and utilization technologies……………………...16
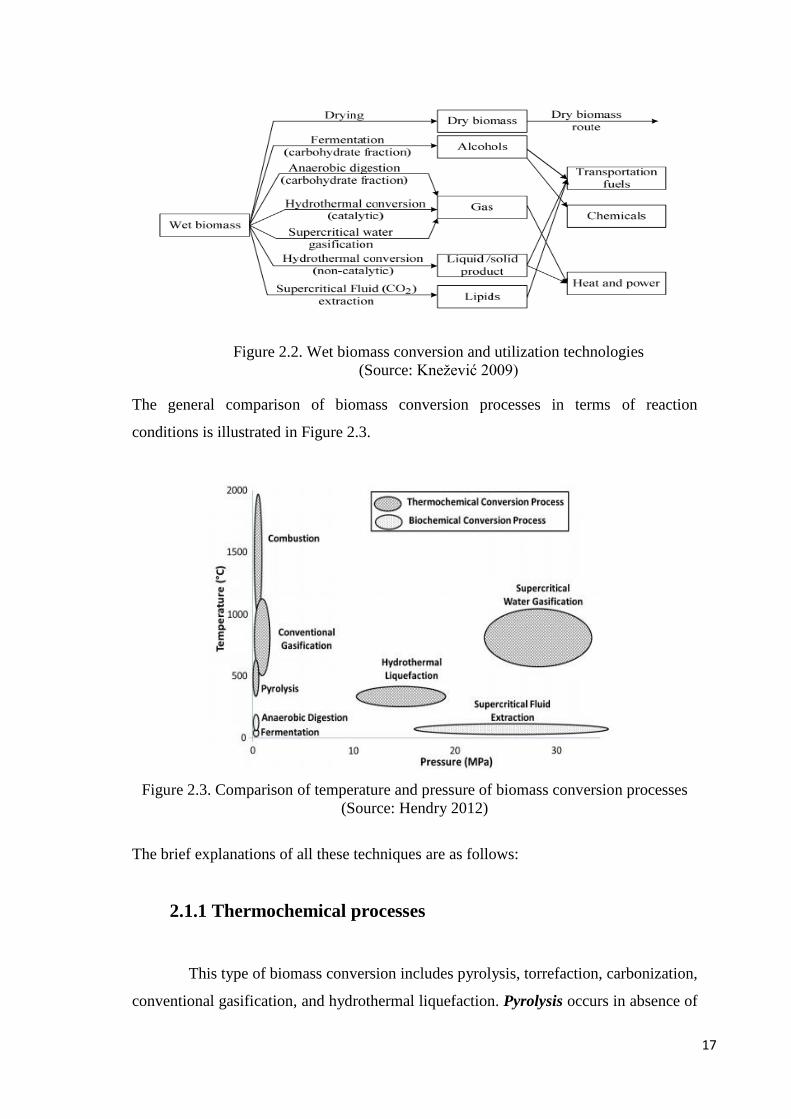
Figure 2.2. Wet biomass conversion and utilization technologies……………………..17
Figure 2.3. Comparison of temperature and pressure of biomass conversion
processes…………………………………………………………………...17
Figure 2.4. Diagram of biomethanation process .............................................................19
Figure 2.5. Acetone-Butanol fermentation……………………………………………..21
Figure 2.6. Melle-Boinot process of ethanol fermentation…………………………….24
Figure 2.7. Wet mill fermentation process of ethanol and high fructose syrup………..25
Figure 2.8. The effect of temperature in Supercritical Water Gasification of wheat
straw wastewater at 25 MPa; (a) Fractions of produced gases, (b) GE,
CE and total gas yield………………………………………………...…....27
Figure 2.9. Simplified diagram of Supercritical Water Oxidation Process…………….29
Figure 2.10. Diagram of authohydrolysis pretreatment of lignocellulosic biomass……30
Figure 2.11. Simplified reaction mechanisms of degradation of carbohydrates in sub-
and supercritical conditions………………………………………………..31
Figure 2.12. Hemicellulose degradation pathway……………………………………...32
Figure 2.13. Cellulose degradation pathway…………………………………………...33
Figure 2.14. Lactic acid selectivity (colums) with respective reaction times (triangles)

x
in catalytic fructose (a) and glucose (b) decompositions at 200-360 ºC,
ZnSO4 concentration is 400 ppm……………………………………….....34
Figure 2.15. Scheme of Zn catalyzed degradation of carbohydrates…………………...34
Figure 2.16. Reaction pathway of levulinic acid production from d-glucose………….36
Figure 2.17. Temperature and pressure dependence of levulinic acid concentration…..36
Figure 3.1. Experimental setup included the reactor, controller and cooler……………39
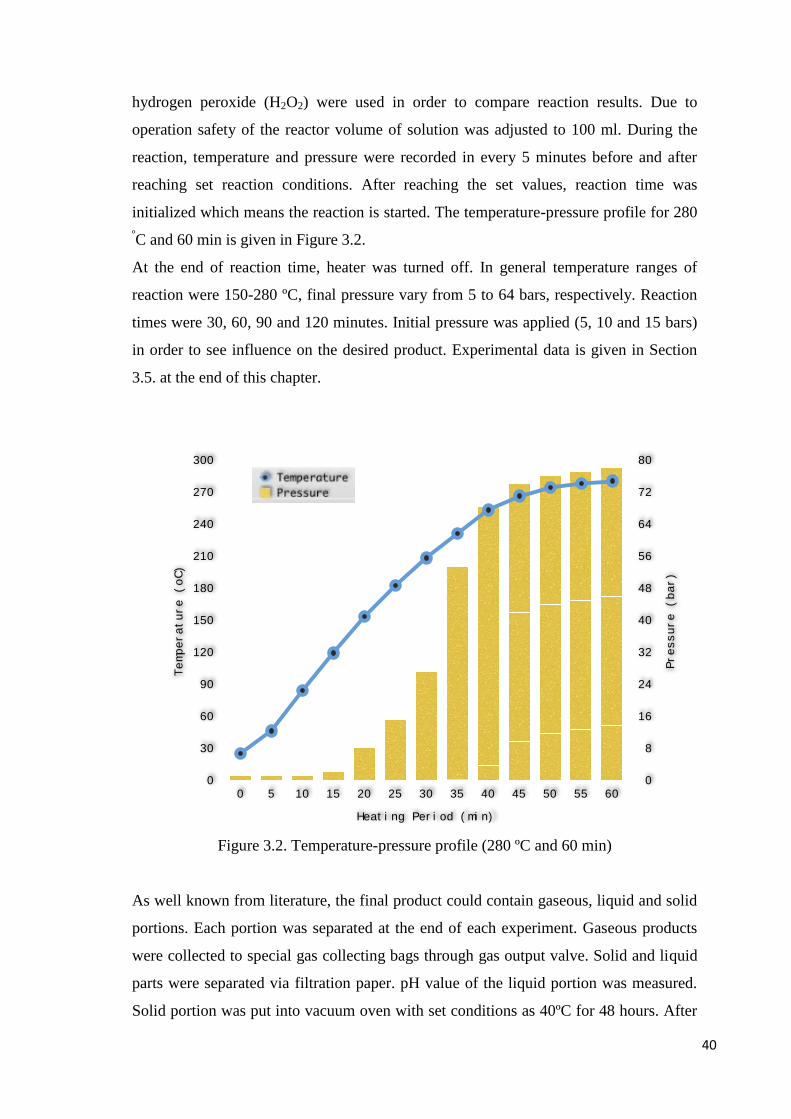
Figure 3.2. Temperature-pressure profile (280 ºC and 60 min)………………………..40
Figure 3.3. Scheme the Steps of Experimental Procedure……………………………..41
Figure 4.1. Refractive index spectral data of standard compounds at a) 50 ºC and
b) 65 ºC……………………………………………………………………46
Figure 4.2. GC-MS chromatogram of the liquid phase recovered after treatment with
125 mM H2SO4 at 200 ºC, 52 bar, 60 min…………………………………47
Figure 4.3. Cellulose Conversion at different reaction times (0-120 mins) and
temperatures (150-280 ºC)………………………………………………....48
Figure 4.4. Conversion of cellulose and distribution of the liquid products with
50 mM H2SO4 at different reaction temperatures..………………………49
Figure 4.5. Levulinic acid yield with 50 mM H2SO4 from 30 min to 120 min reaction
time at various reaction temperatures of 150, 200, 250 and 280 ºC……….50
Figure 4.6. SEM images (same scale-1000X) of a) initial cellulose and solid products
after the treatment at b) 150 ºC; c) 200 ºC; d) 250 ºC; f) humins at 250 ºC
(magnitude 20,000, 5 micrometer)………………………………………...51
Figure 4.7. FTIR spectrum of solid portion at150, 200, 250 and 280 ºC………………52
Figure 4.8. GC-MS spectrum of the liquid products after the treatment with 50 mM
H2SO4 for 60 min at a reaction temperature of a) 150 ºC and b) 280 ºC…..53
Figure 4.9. Gas products identified after the treatment with 50 mM H2SO4 at 280 ºC
for 120 mins…..……………………………………………………………54
Figure 4.10. Influence of initial pressure (5, 10 and 15 bars) on the degradation of
cellulose and acidity of the liquor after hydrothermal treatment with
50 mM H2SO4 for 60 mins……………………………………...…………55
Figure 4.11. Effect of acid addition (H2SO4) on the conversion of cellulose at various
reaction temperatures………………………………………………………56
Figure 4.12. Effect of H2SO4 concentration on the conversion of cellulose and
product yields (reaction time: 60 min; reaction temperature: 200 ºC)……57
Figure 4.13. Levulinic acid yield with and without acid at 150 and 250 ºC…………...58

xi
Figure 4.14. SEM images (same scale-1000X) of a) initial cellulose and solid
products after the treatment with acid at a concentration of b) 0 mM;
c) 25 mM; d) 50 mM; e) 75 mM; e) 125 mM………………..…………58
Figure 4.15. FTIR spectrum of solid portion with a) 0, 5, 25 and 50 mM H2SO4 and
b) 75, 100 and 125 mM H2SO4 at 200 ºC and 60 min………………...…..59
Figure 4.16. Effect of sulfuric acid (H2SO4) and hydrogen peroxide (H2O2) addition
on the conversion of cellulose at 200 ºC after 60 mins…..……………….60
Figure 4.17. Effect of a) sulfuric acid (H2SO4) and b) hydrogen peroxide (H2O2)
addition on the yields of levulinic acid, 5-HMF, formic acid and glucose
at 200 ºC after 60 mins……...…………………………………………….61
Figure 4.18. GC-MS spectrum of the liquid products after the treatment with
a) 125 mM H2SO4 and b) 125 mM H2O2 for 60 min at a reaction
temperature of 200 ºC……………………………………………………..62
Figure 4.19. Effect of reaction time on the product distribution with the addition of
50 mM H2SO4 at 200 ºC…..………………………………………………63
Figure 4.20. Surface plot of temperature (150, 200 and 250 ºC) vs acid concentration
(0, 15, 30 and 45 mM H2SO4) for Levulinic acid yild…………………......65
Figure 4.21. Surface plot of temperature (150, 200 and 250 ºC) vs acid concentration
(0, 15, 30 and 45 mM H2SO4) for 5-HMF yield…………………………...66
Figure 4.22. Surface plot of temperature (150, 200 and 250 ºC) vs acid concentration
(0, 15, 30 and 45 mM H2SO4) for Formic acid yield……………………....67

xii
LIST OF TABLES
Table Page
Table 1.1 Typical biomass and waste compositions (% dry basis)……………………...6
Table 1.2 Substances and their critical temperature and pressure……………………….7
Table 1.3. Characteristics of ambient and supercritical water…………………………...9
Table 1.4. Some characteristics of supercritical and subcritical water…………………11
Table 1.5. Physical propertires of Levulinic acid………………………………………12
Table 2.1. Yield of fractionated portions of cellulose as treated in supercritical water,
subcritical water, and their combined treatments ………………………..35
Table 3.1. List of chemicals used during the study and manufacturers from where
they were purchased……………………………………….……………….38
Table 3.2. Experimental data of study………………………………………………….44
Table 4.1. Elementary composition of solid product formed at 150 ºC and 250º C
with 50 mM of H2SO4 for 60 min…………………………………………..52

1
CHAPTER 1
INTRODUCTION
We live in the period, when whole of the world have a problem with quickly
growing energy demand, and in company with this, we understood that natural
resources which are becoming expensive day by day could be finished in the future
(Kruse et al. 2003). Furthermore, we perceived that to leave clean environment as
legacy to the next generation we cannot go by our ancestors left path of energy
production and consumption. All this problems lead us to find out alternative energy
sources which must be clean in case of nature. Therefore, environmentally friendly
technologies and fields of sciences are becoming new growing trend. To do this,
governments of all countries trying to change their economics and all their industries to
ecologically sustainable ways; sciences’ academies and institutions are looking for
“green” solutions to almost all problems, and new inventions in the first place must be
environmentally friendly. In this case, importance of biomass as a renewable energy
resource is growing every day (Yanik et al. 2007)
1.1. The Aim and the Importance of the Study
The present study is aimed to observe decomposition of cellulose as a model
compound of biomass into its building blocks in subcritical water as a reaction medium
without addition of any organic solvent. Subcritical water can be any temperature,
pressure and time combination that is above the boiling point and below the critical
point. In the case of water, the critical temperature is 374.15 ºC and the critical pressure
is 22.1 MPa. Since water is chemically stable, safe, harmless to environment, easily
available, and cheap subcritical water is chosen as a reaction medium to degrade
biomass into high-value chemicals (levulinic acid, 5-HMF, etc). During the degradation
of cellulose, the effects of various reaction parameters such as temperature, pressure,
acid concentration, reaction time, etc on the cellulose conversion, the product
distribution and yields are being investigated.

2
Production technologies of high-value chemicals are well defined and mostly these
technologies are very harmful in case of human being and nature. During these
commercial processes expensive, hazardous substances are used and mostly highly-
toxic byproducts are produced. Byproducts make problems with their utilization or
disposition (e.g. ammonium sulfate in formic acid production) (Reutemann, W. and
Kieczka, H. 2000). Therefore, other cheap and safer production methods are needed in
designing stage and intensive research to develop a practicable production method.
Significance of this study is that biomass conversion in subcritical water could be one of
those alternative green production methods. Renewable feedstock and safe, cheap
reaction media make this method attractive not only in case of valuable organics
production but also in the utilization and detoxification of organic residues and wastes.
It is an ancillary advantage of subcritical water conversion of biomass. Generically, it
helps to “kill two birds with one stone” – utilize organic waste, produce valuable
chemicals in a harmless production method to nature.
We would like to make a contribution to this important sphere of green sciences and
technology by optimization of reaction conditions and clarification of the reaction
mechanisms in order to obtain high selectivity of desired product from biomass without
using any organic, toxic solvents.
1.2. Biomass as a Renewable Energy Source
Biomass due to its organic content can be used as a raw material in many
applications. Biomass energy or “bioenergy” is a field of science and industry that aims
to obtain any kinds of energy and valuable products from biomass. There are many
technologies and techniques, which can deal with converting biomass into different
needs, from fuel for engines to electricity for daily consumption (Baskar C., Baskar S.,
Dhillon R.S. 2012). These technologies are kept developing, and trying to reach to their
improvements by designing new supplements or new methods.
1.2.1. General Description and Classification of Biomass
The term “biomass” commonly refers to renewable organic substance produced
by plants though photosynthesis process. As well known, during photosynthesis, plants

3
combine carbon dioxide from air and water from soil to form carbohydrates that are
biochemical building blocks of biomass. The solar energy drives this process is
accumulated in the chemical bonds of carbohydrates and other molecules included in
the biomass. If biomass cultivated and harvested in a way such that allows subsequent
growth with no draining nutrients and water, it is a renewable resource, with almost no
additional contributions to greenhouse gas emissions on the Earth.
Biomass is a scientific term for living or recently dead (non-fossilized) organic
substance. Additionally, the word biomass is also used to mark wide range of products
derived from living organisms – plant parts such as stems, leaves, twigs, aquatic plants
and wood from trees, as well as animal wastes. Materials, which have organic
combustible stuff, are also referred under the term of biomass (Jenkins et al.1998)
Biomass can be used as a fuel directly or can be transformed through different ways into
valuable form of fuel. Energy of biomass or “bioenergy” comprehends any solid, liquid
or gaseous fuel, or useful chemical product, or any electric power derived from, organic
matter, which comes from plants directly or plant-derived agricultural and forestry,
urban, commercial or industrial wastes. It means that bioenergy can be produced by
various methods and from wide range of raw materials. Bioenergy is generally
considered as chain of many different feedstock-technology mixed combinations
because there are wide range of potential feedstocks and the different technologies to
produce and process them.
Biomass of all the Earth concentrated in a thin surface layer called the
biosphere. It seems that represents only a tiny fraction of the total mass of the Earth, but
in case of human it is a big store of energy, to be used as food and fuel. More
essentially, it is a store that is continuously replenishing. The source that supplies the
energy is solar energy and it is continuously converting into biomass. The yearly
amount of biomass world is estimated at 146 billion metric tons, mostly from
uncontrolled plant growth (Biomass Conversion. The Interface of Biotechnology,
Chemistry and Materials Science; Editors: Baskar C., Baskar S., Dhillon R.S. 2012).
Only 6% of the global production of biomass can provide energy that equal to current
world need for oil and gas. Biomass is important heating fuel, and in some part of the
world it is the widely used for cooking. This source of energy is beneficial in case of air
pollution; it is not add any net carbon dioxide to the atmosphere.
Biomass has the following advantages:
It is widely available.

4
Technology of production and conversion is clearly understood.
It is pretty appropriate for small or large applications.
Production requires low light and utilization comparatively low
temperature (535ºC)
Storage and transportation comparatively cheap.
There is almost no pollution.
Biomass can be classified as:
Agricultural and forestry remainders.
Herbaceous crops.
Marine and aquatic biomass (algae, aquatic plants, coral reaps etc.).
Wastes (municipal sewage, solid wastes, and industrial wastes) (Baskar C.,
Baskar S., Dhillon R.S. 2012).
Biomass can be wet and dry. The moisture content depends on origin of biomass and
condition of its storage. Dry biomass mainly has low moisture content (about 30 wt %).
Wood, straw, or other sun dried wastes are examples of dry biomass. Other types of
biomass can be classified as wet. For instance: algae suspensions, sugar solutions,
sewage sludge, waste streams from biorefineries, and from biomass processing (Jenkins
et al. 1998). 95% of total biomass has high humidity (Kruse et al., 2003).
1.2.1. Structure of Biomass
As it is previously mentioned, although biomass has different types, it is
mainly plant derived. The plant-derived biomass or lignocellulosic biomass makes up
approximately 50% of total biomass and its chemical composition strongly depends on
its source (Thompson et al., 1979). Generally lignocellulosic biomass consists of 38-
50% of cellulose, 23-32% of hemicelluloses and 15-25% lignin.

5
Figure 1.1 Biomass content
(Source: Girisuta 2007)
Cellulose is a polysaccharide made up of glucose units linked by β (1, 4)-glycosidic
bonds (Figure 1.2.).
Figure 1.2 The structure of cellulose
(Source: Perez et al., 2002)
Cellulose is the most teeming biopolymer synthesized by nature and its amount is
approximately 2×10⁹ tons year (Sasaki et al. 2003). Hemicellulose is a polymeric
material consisting hexoses (glucose, galactose and mannose) and pentoses (principally
arabinose and xylose), and its molecular weight lower than cellulose (Figure 1.3)
Figure 1.3 The structure of hemicelluloses
(Source: Perez et al., 2002)

6
Lignin is cross-linked polymer made from substituted phenylpropene units, as shown in
Figure 1.4, and its function is to hold the cellulose and hemicellulose fibers together.
Figure 1.4 Phenylpropene units of lignin
(Source: Toor et al. 2011)
Biomass due to its nature has a various correlation of three main compound described
before. The content of some types of biomass are displayed in Table 1.1.
Table 1.1 Typical biomass and waste compositions (% dry basis)
(Source: Toor et al. 2011)
According to this data, it is understood that cellulose is the main compound of most of
the plant-derived biomass, which allows us to use it as a model compound in
experiments during this study.

7
1.3. Properties of Subcritical Water
The point at which the substance has indistinguishable phase called as critical
point, and it happens under the certain condition such as temperature, pressure or both
of them. Every substance due to its physical and chemical properties has a different
critical point. When substance reaches its critical point properties of liquid and gas
phases converge and make one – homogeneous supercritical fluid phase. The critical
pressure is equal to vapor pressure at critical temperature. Also, there is critical molar
volume that is molar volume of one mole of substance at critical point. The state of
substance below the critical point called as “subcritical liquid”, whereas above the
critical point it is referred as “supercritical fluid” (Cengel, Y. A., Boles, M.A. 2002).
Some of substances’ critical temperatures and pressures are listed in Table 1.2.
Table 1.2 Substances and their critical temperature and pressure
(Source: Cengel, Y. A., Boles, M.A. 2002).
Substance Critical temperature (ºC) Critical pressure (atm)
NH3 132 111.5
O2 -119 49.7
CO2 31.2 73.0
H −239.95 12.8
C2H5OH 241 62.18
CH4 −82.3 45.79
H2O 374 217.7
As it is well known, water can be in solid, liquid and gas phases. It means that physico-
chemical properties of water such as dielectric constant, density, surface tension,
enthalpy, etc. are changing depending on temperature or pressure. In addition to that
water has high specific heat capacity. This phenomenon makes water useful in several
applications. As it is mentioned before, the critical point of water is 374 ºC and 22.1
MPa and below this point water has subcritical liquid state while above this point it is
referred as supercritical fluid state (Hendry 2012). The main regions of water states
along with temperature and pressure are shown in Figure 1.4.

8
Figure 1.5. Critical point of water and its phases in different temperature and pressure
(Source: http://www.asiabiomass.jp/; 15 March 2015).
Subcritical and supercritical water extensively used in many applications from
supercritical fluid extraction, hydrothermal processing to degradation of hazardous
wastes. Uniqueness of supercritical fluids is mainly arising from their gas-like and
liquid-like properties. The properties like high diffusivity and low viscosity are gas-like,
while high density which is abnormal to gaseous compound is liquid-like behavior.
These characteristics changes are visible when we compare supercritical and ambient
water. Values are given in Table 1.3.

9
Table 1.3. Characteristics of ambient and supercritical water
(Source: Hendry 2012)
Characteristics Ambient Water Supercritical Water
Dielectric constant 78 <5
Solubility of organics Very low Fully miscible
Solubility of gases Very low Fully miscible
Solubility of inorganics Very high Not soluble
Diffusivity (cm2/s) 1x10
5 1x10
-3
Viscosity (g/cm-s) 1x10⁻²
1x10⁻⁴
Density (g/cm3) 1 0.2-0.9
Substantial changes in the properties of water happen in the vicinity of critical point.
For instance, near critical point water is highly compressible. Its density falls nearly two
orders with no change in phase from liquid-like to dense gas-like when temperature
increases from 300 to 450 ˚C. These changes reflect other properties like viscosity,
polarity, solvation energy, degree of hydrogen bonding, dielectric strength, etc.
(Peterson et al. 2008). The changes in thermodynamic properties of water with
temperature is illustrated in Figure 1.5.
Figure 1.6. Changes of waters properties at different temperature
(Source: http://www.criticalprocesses.com/; 25 March 2015).

10
The characteristics of water such as hydrogen bonding make it a good non-organic
solvent. Most of organic matters hardly make hydrogen bonds and that is why they do
not dissolve easily in water. Polarity of water also plays an initial role. Charge
differential within water molecule, one end has a positive charge and other end has a
negative charge, has ability to attract other polar molecules, then helps to dissolve other
polar substances. However, most of organic molecules are nonpolar so they cannot be
dissolved in water. Hydrogen bonding is also important in heat capacity of water. If
temperature of water is rising, the extensive hydrogen bonding interactions break down
and extra energy is needed to put in to break the bonds. For example, at a constant
pressure specific heat capacity changes from 4.8183 kJ/ (kg K) at 20˚ C to 8.138 kJ/ (kg
K) at 350˚ C. When critical point is approached specific heat capacity is rising to infinity
at constant pressure (Peterson et al. 2008). Graph of specific heat capacity is shown in
Figure 1.6.
Figure 1.7. Specific heat capacity of water at constant pressure (250 bar)
(Source: http://www.criticalprocesses.com/; 25 March 2015)
Properties of subcritical and supercritical water are shown in Table 1.4. Thereby, water
in subcritical and supercritical states show different characteristics. Both of them have
their own special application depending on desired product.

11
Table 1.4. Some characteristics of supercritical and subcritical water
(Source: Ehara et al. 2005)
State Temperature
(˚C)
Pressure
(MPa)
Density
(g/cm3)
Ionic product
log Kw (mol2/l
2)
Dielectric
constant
Supercritical
water
400 40 0.5 -12.8 9.6
Subcritical
water
280 40 0.8 -10.9 25.2
1.4. Levulinic Acid and 5-Hydroxy Methyl Furfural (5-HMF)
Levulinic acid, also known as 4-oxopentanoic acid, γ-ketovaleric acid or β-
acetylpropionic acid which has formula C5H8O3, is white crystalline, water soluble and
polar organic solvent, member of keto acids. It has two reactive functional groups, have
the ketone (-C=O) group at the third carbon from the carboxylic acid (-COOH) (Figure
1.7.).
Figure 1.8. Levulinic acid
(Source: Rosatella et al. 2011)
The first time Levulinic acid was synthesized by Dutch scientist G.J. Mulder in 1840,
by heating sucrose with mineral acids at high temperature (Kamm et al. 2006). Some
physical properties are given in Table 1.5. Levulinic acid is a platform chemical, has a
wide range of applications which are shown in Figure 1.8.

12
Table 1.5. Physical properties of Levulinic acid
(Source: Girisuta 2007)
The secret of having great number of applications that levulinic acid could be used is
hidden in the structure of it. It was reported that various reaction pathways are available
to use levulinic acid including methyl, carbonyl and carboxilic functional groups
transformation and oxidation and reduction reactions (Girisuta 2007).
Reactions including the methyl group:
Bromide or chloride used to halogenate methyl group of levulinic acid to form
organic halides. Bromination in methanol is used to obtain 5-bromolevulinic acid. 5-
bromolevulinic acid is a precursor for δ-aminolivulinic acid which is an active ingredient
of a biodegradable herbicide. It is also used in pharmaceutical industry, in photodynamic
detection to visualize bladder cancer in photodynamic cancer treatment. (MacDonald, S.
F. 1974)
Property Value
Dissociation constant (pKa) 4.59
Density 1.14 kg L-1
Melting point 37 ˚C
Boiling point 249 ˚C
Heat of vaporization 0.58 kJ mol -1
Heat of fusion 79.8 kJ mol-1

13
Figure 1.9. Levulinic acids pottential application
(Source: Girisuta 2007).
Reaction including carbonyl group:
In the presence of hydrogen gas and metal catalyst, levulinic acid can react with
ammonium hydroxide or ammonia to obtain 5-methyl-2-pyrrolidone that is a useful
agent for pharmaceutical industry. Also by acid-catalyzed condensation reaction with
aromatic or heterocyclic alcohols levulinic acid can form diphenolic acid that used in
production of different polymers, lubricants, paints and fire-retardant materials (Hayes et
al. 2006).
Reactions involving the carboxylic group:
Carboxylic group of levulinic acid is involved to produce various esters of
levulinic acid by esterification. Usually this reaction needs acid catalyst such as
sulphuric acid, phosphoric acid etc. By esterifying levulinic acid with ethanol ethyl
levulinate can be produced. This chemical can be used as an oxygenate additive in diesel
engines, in flavouring and fragrance industries, and potentially can replace kerosene as
fuel for the direct firing of gas turbines (Hayes et al. 2006).
Oxidation reactions:
Levulinic acid can be oxidized to various derivatives and chemo-selectivity of
this reaction highly depending on type of oxidant. Oxidation using oxygen at high
temperature (365-390˚ C) with catalyst V2O5 gives succinic acid with yield of about

14
80%. . (Willke et al.2004). Succinic acid by-turn has derivatives such as γ-butyrolactone
which intermediate for agrochemicals and pharmaceuticals; 1, 4-butanediol which is
starting material for production of essential polymers such as polyethers, polyesters and
polyurethanes. Polybutylene terephalate that produced from 1, 4-butanediol is used for
plastic engineering, fibers adhesives, films and solvent for polyvinyl chloride (Hayes et
al. 2006).
Reduction reactions:
Levulinic acid may be reduced by platinum oxide, copper-chromite, Raney
nickel etc. during the catalytic hydrogenation to form γ-valerolactone. One of
derivatives of γ-valerolactone is methyltetrahydrofuran that has potential as a gasoline
oxygenate (Girisuta 2007).
By evaluation of all these properties Pacific Northwest National Laboratory, National
Renewable Energy Laboratory and Office of Biomass Program of the United States
Department of Energy added levulinic acid to “Top 12 Building Blocks” that is
accessible from lignocellulosic biomass, on the basis of estimated selling price,
estimated processing cost, and market potential (Werpy and Petersen 2007).
The conversion of biomass to levulinic acid is shown in Figure 1.9.
Figure 1.10. Simplified reaction scheme of biomass conversion to levulinic acid
(Source: Girisuta 2007)
As it is seen from reaction scheme of levulinic acid production, monomer sugars by
dehydration reaction form 5-hydroxy-methylfurfural which by-turn form levulinic acid.
5-hydroxy-methylfurfural (5-HMF) is one of the building block chemicals derived from
biomass. Molecular formula is C6H6O3. Structural formula is given in Figure 1.10. The

15
molecule consist furan ring which has both alcohol and aldehyde functional groups. It is
yellow low-melting solid highly water-soluble (Huber 2006).
Figure 1.11. 5-hydroxy-methylfurfural
(Source: Rosatella et al. 2011)
5-HMF was first reported by Dull et al., who obtained by heating inulin with oxalic acid
solution under pressure, at the end of 19th
century. 5-HMF is very useful not only as
intermediate chemical for the production of our desired product – levulinic acid but also
important for biofuel dimethylfuran and other chemicals such as 2,5-furandicarboxylic
acid, 2,5-diformilfuran, dihydroxymethylfuran and 5-hydroxy-4-keto-2-pentenoic acid
productions which are illustrated in Figure 1.11. (Rosatella et al. 2011).
Figure 1.12. Potential derivatives of 5-hydroxy-methylfurfural
(Source: Rosatella et al. 2011)
In this study we investigated the degradation of cellulose in subcritical water in order to
produce high value chemicals such as 5-HMF, levulinic acid, etc. For this purpose,
different reaction parameters (temperature, pressure, acid amount and kind, reaction
time, etc.) were used to obtain higher yields of desired products.

16
CHAPTER 2
LITERATURE REVIEW
2.1. Biomass Conversion Processes
There are a number of biomass conversion technologies and they are still under
development for both wet and dry types of feedstocks (see Figure 2.1 and Figure 2.2).
These technologies aim to release the energy directly such as heat or electricity, or can
convert into other useful form like biogas or biofuel.
Figure 2.1. Dry biomass conversion and utilization technologies
(Source: Knežević 2009)
Direct combustion process. Mainly feedstocks of this process are residues such as
woodchips, bark, straw, sawdust, bagasse, municipal solid waste and food industry
waste. Furnaces work in two stages. The first is drying and partial gasification, the
second is completely combustion. This method can be used to produce either steam or
heat.
17
Figure 2.2. Wet biomass conversion and utilization technologies
(Source: Knežević 2009)
The general comparison of biomass conversion processes in terms of reaction
conditions is illustrated in Figure 2.3.
Figure 2.3. Comparison of temperature and pressure of biomass conversion processes
(Source: Hendry 2012)
The brief explanations of all these techniques are as follows:
2.1.1 Thermochemical processes
This type of biomass conversion includes pyrolysis, torrefaction, carbonization,
conventional gasification, and hydrothermal liquefaction. Pyrolysis occurs in absence of

18
oxygen, under pressure and at operating temperatures above 480 ºC. During the
pyrolysis of organic materials gas and liquid products are generated, and it leaves
carbon reach solid residue. Ultimate pyrolysis that leaves mostly carbon is called
carbonization. This process is very old and also called as “dry wood distillation”. The
main idea of this process is charcoal production by reducing levels of oxygen and
hydrogen in the wood. Another thermochemical process is Torrefaction which is a mild
form of pyrolysis, operating at 200-320 ºC in presence or absence of oxygen. During
this process water and superfluous volatiles contained in biomass are removed and
cellulose, hemicellulose and lignin emit different types of volatiles. The final product of
torrefaction is solid, dry torrefied biomass or bio-coal. One of the most commonly used
thermochemical process for the conversion of biomass is gasification. In the
gasification process, it is aimed to obtain a gaseous product and it takes place in two
stages: In the first stage gas and charcoal are produced by partially combustion from
biomass. In the second stage charcoal is chemically being reduced to H2O and CO2,
which are produced in the first stage, forming H and CO. The gas contains 8-10% CO2,
2-3% CH4, 18-20% H2 and 18-20% of CO and rest is the nitrogen. These stages are
separated in a gasifier. Gasifier design depends on feedstock properties. Gasification
occurs at temperatures nearly 800 ºC and can be operated at atmospheric pressure or
higher (Kurchania 2012).
2.1.2. Biochemical conversion processes
Anaerobic digestion and fermentation processes are the two most important
biochemical conversion processes used in biomass treatment. Anaerobic digestion, also
known as methane fermentation or biomethanation aims to produce a combustible
gaseous fuel with naturally occurring microorganisms in the absence of air. The gaseous
mixture is generally termed as “biogas”, and comprising primarily of methane (CH4)
and carbon dioxide (CO2) and vestiges of other gases such as nitrogen (N2) and
hydrogen sulphide (H2S) (Shinya Y. and Yukihiko M. 2008). Whole process includes
three steps as schematically shown in Figure 2.4: The first step is the conversion of
organic solid complex by the enzymatic hydrolysis into soluble compounds. The second
step is acidogenesis in which formed soluble organic material converted into mainly
short-chain acids and alcohols. The last step is methanogenesis, in which the products of

19
second step are converted into gases by different species of strictly anaerobic bacteria
which called “metanogenic bacteria”. This process is a microbiological process;
therefore, occurs under normal temperature (5-70˚ C) and pressure; require neutral pH
(6. 4-7. 2) (Capareda 2011).
Figure 2.4. Diagram of biomethanation process
(Source: Shinya Y. and Yukihiko M. 2008)
In anaerobic digestion variety of biomass can be used as a substrate, this not allowed in
fermentation processes due to activities of complex microflora. Another biochemical
conversion process is Fermentation. Fermentation of biomass includes ethanol
fermentation, acetone-butanol fermentation, hydrogen fermentation, lactic acid
fermentation, silage and composting (Shinya Y. and Yukihiko M. 2008). The ethanol
fermentation process will be described widely in section 2.1.4.
Acetone - butanol fermentation, which was industrialized in period of World Wars, to
produce smokeless powder (raw material is acetone) and to produce fuel for war planes
(raw material is butanol) but due to the development of petroleum chemistry, further
development in this industry was fell out. Nowadays this industry got its second wind.
Butanol may be an additive to both gasoline and diesel fuels and has more affinity than
ethanol when it is added to gasoline (Grabbe et al. 2001). In this process, Clostridium, a
microorganism that is widely present in soil, uses glucose. There are mainly two strains
of this microorganism, the first strain produces butanol from starch and called as
Weizmann-type, the second one is Saccro-type and its raw material is sucrose.
Clostridium secretes enzymes amylase, xylanase, protease and lipase. During the

20
fermentation ethanol is also produced that sometimes this process called as ‘acetone-
butanol-ethanol (ABE) fermentation’.
The reaction pathway is shown in Figure 2.5., and stoichiometric equation is given
below:
95C6H12O6 → 60C4H9OH + 30CH3COCH3 + 10C2H5OH+220CO2+120H2+30H2O (2.1)
During the process glucose via EMP pathway is decomposing to pyruvate, acetyl-CoA
and acetoacetyl-CoA and at the end of reaction butanol, acetone and ethanol are
produced. As it seen from equation above, from 95 mol glucose (273 MJ) are produced
60 mol butanol (170 MJ), 30 mol acetone (54MJ), 10 mol ethanol and 120 mol
hydrogen (Ishizaki et al. 1999).
Lactic acid fermentation is a biological process in which sugars are converted to lactic
acid by bacteria or fungi. Poly-lactate is a biodegradable plastic and its demand
increasing day by day. Chemically produced lactic acid has yield D-lactic and L-lactic
acid half by half, and its optical purity is zero. That is why, only lactic acid produced by
fermentation is used for poly-lactate production. Lactic acid bacteria uses only sugars as
energy source and more 50% of consumed sugars can be converted into lactic acid.
Lactobacillus, Leuconostoc, Pediococcus and Streptococcus are species of lactic acid
bacteria which used in industrial scale (Morichi et al. 1990).

21
Figure 2.5. Acetone-Butanol fermentation
(Source: Shinya Y. and Yukihiko M. 2008)
Lactic acid fermentation can be divided into two groups: The first group is homo-lactic
fermentation, in which from one mole of monosaccharide two moles of lactic acid and
two moles of ATP can be produced, has almost 100% yield. The second one is hetero-
lactic fermentation in which lactic acid and other compounds such as ethanol and
carbon dioxide or acetic acid can be produced. Lactic acid bacteria (LAB) have both D
and L lactate-dehydrogenases, which mean both D-lactic acid and L-lactic acid, can be
produced. For poly-lactate production Lactobacillus rhamnosus is used that can produce
only L-lactic acid with almost 100% optical purity (Morichi et al. 1990).
Also, lactic acid bacteria play initial role in silage fermentation process. It can be
prepared from forage grasses and crops and suitable moisture content should be about
50-70%. The epiphytic lactic acid bacteria, which are a major component of forage
crops can convert sugar into lactic acid in ensiling process. The LAB growth with other
plant-associated microorganisms and they generally characterize properties of silage. As

22
a result of water-soluble carbohydrates transformation into organic acids pH is reduced
and forage is preserved (McDonald, P., Henderson A. R. and Heron S. J. E. 1991).
2.1.3 Supercritical Fluid Extraction
Supercritical fluid extraction is the process of separating of one particular
component (the extractant) from another (the matrix) by using supercritical fluids as the
extracting solvent. Supercritical fluids can produce a product with no solvent remaining
(Sapkale et al. 2010). This process can be used as a sample preparation step for
analytical aims or in larger scale either to remove unwanted material from a product (to
produce products such as decaffeinated coffee, cholesterol-free butter, and low-fat meat)
or to collect a desired product (essential oils, flavor and fragrance agents, squalene from
shark liver, etc) (Capuzzo et al.2013). Carbon dioxide (CO2) is the most commonly
used solvent and sometimes in use can be mixed with co-solvents such as methanol or
ethanol. For Supercritical CO2 (SC-CO2) extraction conditions are above its critical
points, which are 31 ˚C and 7.38 MPa. CO2 is inert, tasteless, odorless, non-toxic, non-
flammable, inexpensive, and in addition to this it leaves no residue behind. Due to its
low critical temperature it is widely using in food, essential oils, aromas and
nutraceutical industries. Additionally, SC-CO2 is also commonly used to extract high
value products from natural materials (Sapkale et al. 2010).
2.1.4 Production of Ethanol from Biomass
Ethanol (C2H5OH) or ethyl alcohol can be produced from a different sugar
containing material by fermentation process lead by yeast strains through glycolysis
reaction pathway (Embden-Meyerhof Pathway). In this reaction, one molecule glucose
and two molecules of ATP are used as energy for yeast cells growth. Ethanol
fermentation is a biological reaction that occurs at room temperature and atmospheric
pressure. Humankind used ethanol fermentation for brewery of alcohol drinks, in the
fermented food manufactory, bakery for several thousands of years. In the19-20th
century due to great technological progress in fermentation and distillation, ethanol
became available in the field of different chemical industries, beverage and food
industry, medical use and fuel. As an alternative to fossil fuel and to prevent global

23
warming, large amount of fuel ethanol has been produced from corn in USA and from
sugarcane in Brazil (Kurchania 2012).
Yeast is one of the most commonly used feedstock in fermentation. Yeast cells were
first isolated from beer in Denmark in 1883. Saccharomyces cerevisiae is type of yeast
that has perfect ethanol fermenting ability and ethanol tolerance, widely used for
industrial and fuel ethanol production. Next to S cerevisiae bacterium Zymomomas
mobilis is excellent to ferment limited ranges of carbohydrates of glucose, fructose and
sucrose. Fermentation rate and fermentation yield are better than S.cervisiae but
tolerance to ethanol is not so good (Saiki et al. 1999). S. cerevisiae can ferment many
sugars such as glucose, fructose, galactose, mannose, sucrose, maltose but cannot
ferment pentoses such as xylose and arabinose. As pentose fermenting yeasts Pichia
stipites and Pachysolen tannophilus can be used but their tolerance to ethanol is not
good as S. cerevisiae. Many laboratories are kept working on construction of pentose
fermentable S. cerevisiae strains and other types of microorganisms such as Escherichia
coli and Corynebacterium glutamicum by DNA recombination technology. Other
ethanol fermenting microorganisms such as hetero-lactic bacteria Lactobacillus,
cellulose degrading Clostriduim, anaerobic thermophilic Themoanaerobacter are
producing relatively low concentration of ethanol and byproducts like organic acids.
That is why, Saccharomices serevisiae is the best ethanol fermenter for now. During the
reaction of glucose conversion to ethanol, as it shown in equation below, yeast strains
produce from 100 g of glucose about 51. 14 g of ethanol.
C6H12O6→ 2C2H5OH + 2CO2
100 g 51.14 g 48.86 g
In this reaction nearly 50% of glucose weight is lost as carbon dioxide but about 91%
of energy concentrated in glucose (2.872 MJ/mol) held in ethanol. This makes ethanol
fermentation reaction a perfect biological process to transform biomass to liquid fuel
ethanol (Shinya Y. and Yukihiko M. 2008). (2.2)
The production technology of bioethanol in industrial scale is depending on raw
materials. Producers such as Brazil and India mainly use molasses of sugar cane.
Molasses is a liquid byproduct of sugar production; sugar concentration is about 50%
and contains glucose, fructose and sucrose. These saccharine materials are good
(2.2)

24
substrate for yeasts and Zymomonas to ethanol fermentation (Saiki et al. 1999). Melle-
Boinot process is common ethanol production process in Brazil. Scheme of Melle-
Boinot fermentation process is indicated in Figure 2.6. It is continuous or semi-
continuous fermentation process in which yeast cells are recovered from beer by
centrifugation and recycled to fermentation tank after sterilization of contaminated
microflora by dilution of sulfuric acid at pH3. From cane juice ethanol fermentation at
high concentration of yeast cells can make beer comprising 6-8% of ethanol in about 15
hours of fermentation time. Molasses diluted two-times or mixed with cane juice or
cane juice. If fermentation yield is 82% of total sugar, and sugars level of molasses is
55%, 3.3 t-wet molasses amount is required to produce 1m3 of 95% ethanol (Shinya Y.
and Yukihiko M. 2008).
Figure 2.6. Melle-Boinot process of ethanol fermentation
(Source: Shinya Y. and Yukihiko M. 2008)
A large amount of ethanol is produced from starchy materials, from corn in USA and
sweet potato in China. First starchy raw material is hydrolyzed by amylase enzyme to
glucose.

25
The reaction is shown in equation below:
molecular weight
(C6H10O5)n + nH2O nC6H12O6
n(162.14) n(18.02) n(180.16)
100g 11.11 g 111.11 g
In USA that is largest producer of fuel ethanol, mostly used corn as a feedstock.
Commonly, wet mill process, continuous fermentation process, and batch-wise process
are used. Wet mill process started from immersing of corn in dilute sulfite solution
where it is fractioned into starch, germ, gluten and fiber. Starch fraction is hydrolyzed
with amylases to glucose and then yeast fermentation begins. Scheme of wet mill
process is illustrated in Figure 2.7. 2.4 t-wet of corn is needed to produce 1m3 (kL) of
95% ethanol if starch value is 63% and fermentation yield is 90%. In this process also
high fructose syrup is produced (Saiki et al. 1999).
Figure 2.7. Wet mill fermentation process of ethanol and high fructose syrup
(2.3)

26
(Source: Shinya Y. and Yukihiko M. 2008)
2.1.5 Supercritical Water Gasification
Supercritical water gasification (SCWG) is a method of biomass conversion
that uses special properties of supercritical water and aims to obtain hydrogen rich
gaseous products (Guo et al, 2007). Chemical conversion of this process can be
displayed by the simplified reaction divided into two steps:
1. Steam reforming CHxOy+((1-y)H2O→CO+(1-y+x/2) H2
2. Water-gas shift CO+H2O→CO2+H2 (Zhang 2008).
SCWG has several advantages over conventional gasification and pyrolysis in normal
pressure:
Most organic materials of contained in biomass can be dissolved in
supercritical water.
There is high gasification efficiency and a high molar fraction of
hydrogen. No char and tar occurs. Volumetric ratio of H2 can be greater
than 50%. High pressure of the gaseous product makes easier usage,
transportation, carbon capture and further purification of produced gas
via pressure swing adsorption or steam reforming.
In SCWG of biomass drying is not required. It means higher energy
efficiency can be achieved.
The reaction temperature is much lower than conventional gasification
and pyrolysis. If in SCWG glucose gasification can be reached at 650 ˚C
and 34.5 MPa, the temperature of conventional gasification is always
above 1000 ˚C.
The final product can be very clean. Since no NOX and SOX were
generated in SCWG and concentration of CO is very low, especially
when to enhance water-gas shift reaction catalyst is used (Momba M.
and Bux F. 2010).
For the first time SCWG was described by Modell in 1977. This process mainly suitable
for wet types of biomass; for instance, wastewaters from different production processes

27
(sewage sludge, black liquor from pulping process, wheat straw and olive oil
wastewaters) which sometimes have toxic content. Since reactivity of water is high
under supercritical condition biomass can be gasified quickly and almost completely.
The main products are usually H2, CO2 and CH4, with small portions of CO and C2
(Shinya Y. and Yukihiko M. 2008). The reactor designed depends on raw material and
to enhance the reaction catalysts such as metal, alkali or carbon catalysts can be added.
Supercritical gasification of anaerobic wastewater from wheat straw was investigated
with flow tube continuous reactor system. This wastewater contained organic acids such
as acetic acid, butyric acid and ethanol. During this study at 775 ºC 100% gasification
efficiency (GE) was achieved and carbon conversion efficiency (CE) together with total
gas yield raised when temperature was raised from 700 ºC to 775 ºC. Results are
illustrated in Figure 2.8. Authors concluded that supercritical gasification of wheat
straw wastewater can be used not only to obtain hydrogen but also to reduce
contamination (Guo et al, 2007).
Figure 2.8. The effect of temperature in Supercritical Water Gasification of wheat straw
wastewater at 25 MPa; (a) Fractions of produced gases, (b) GE, CE and total
gas yield (Source: Momba M. and Bux F. 2010).
Despite important advantages of this technique still in stage of development and several
implementations are designed in laboratory scale to avoid following problems:
Plugging; during the gasification process salt and if heating rate of feedstock at the inlet
of the reactor is low char can be formed. Usually to avoid this, pre-heater is used.
However, it may happen at a high feed rate or a high biomass ratio that could result in
expensive solution. Inorganic compounds contained in biomass have low solubility in
water can accumulate into a large particle. As a result, tubes of reactor can be plugged

28
(Guo et al. 2007). Corrosion; in supercritical state water can form OH which by-turn in
presence O2 can form H2O2 which amplify corrosion ability of supercritical water. In
addition to this, metals, alkali and chlorine in the biomass enhance corrosion of the
reactor material.
Economy; during the process to minimize plugging pre-heating of the biomass
suspension and the reactor is needed. High temperature is required to provide 100%
conversion. This could mar profitability of this method (Zhang 2008). This kind of
technological challenges require long time research. Because of high cost presently no
commercial plants have been built. In industrial scale there are three pilot SCWG plants
on stream, VARENA Plant in Germany, TEES Process in USA and Energia Co. plant in
Japan (Shinya Y. and Yukihiko M. 2008).
2.1.6 . Supercritical Water Oxidation
Supercritical water oxidation (SCWO) is an oxidation process that uses supercritical
water as a reaction medium. Distinctiveness of this process are in the unique solvating
properties to provide increased solubility of organic agents and permanent gases, to be a
single-phase environment which does not have inter-phase mass transfer limitation,
faster reaction kinetics and increased selectivity of complete oxidation products. This
process was developed as a result of looking to wet oxidation under more severe
conditions such as higher temperature and pressure. Due to other destruction methods
based on oxidation of liquid wastes such as activated carbon treatment, biological
treatment, wet air oxidation and incineration were insufficient in terms of economic
effectiveness or ecological regulations (which needs complete destruction of some
wastes) (Veriansyah et al. 2006). Simplified diagram of SCWO is given in Figure 2.9. It
contained preheater which function is recovery of heat from the reactor.

29
Figure 2.9. Simplified diagram of Supercritical Water Oxidation Process
(Source: Schmieder et al. 1999).
SCWO process has following advantages:
High oxidation efficiency via higher reaction temperature and density;
Low residence time;
One process step for gaseous and aqueous effluents (no additional process
steps).
It has disadvantages from engineering point of view:
Increased corrosion of materials, especially reactor and heat exchanger;
Fouling and plugging of reactor and feed preheater caused by drastically
decreased solubility of salts resulting in precipitation (Schmieder et al.
1999).
2.1.7. Autohydrolysis
Another method of biomass treatment with water assistance is
autohydrolysis, that is also called as hot water extraction, steam explosion or stream
treatment. The main idea of this method is to involve intermediates, which occurs
during the process from substrate, to further hydrolyze the rest content of substrate.
According to Yoon (1998) the autohydlysis is the method in which biomass heated
(above 150 ºC) by pressurized water and form acids via de-esterification of ester groups
and solubilization of acidic components in hemicelluloses, pH value of liquor drops.

30
The formed acids such as formic acid, acetic acid, glucuronic acid etc. are unsubstantial
and cannot hydrolyze cellulose. That is why, autohydrolysis is mainly used as a
supplementation to lignocellulosic processing methods. As it is known, hemicellulose in
biomass may be an obstacle during the enzymatic hydrolysis of cellulose. Thus makes
autohydrolysis useful in terms of hemicelluloses recovery and total cellulose hydrolysis
(Yoon 1998). After the pretreatment almost all hemicellulose and some lignin are
dissolved and extracted wood chips could be easily delignificated and increase
bleachibility of pulp (Li et al. 2013). Autohydrolysis pretreatment can increase
efficiency of enzymatic hydrolysis of poplar chips up to 90% when efficiency of
untreated ones is 15% (Kumar et al. 2009). In Figure 2.10., authohydrolysis
pretreatment of biomass is illustrated.
Figure 2.10. Diagram of authohydrolysis pretreatment of lignocellulosic biomass
(Source: Li et al. 2013).
Autohydrolysis pretreatment temperature range is from 120 ºC to 240 ºC and reaction
time can differ from several minutes to several hours. Depends on temperature and
reaction time level of degradation of lingocellulosic biomass and produced organics can
change. The high temperature (>200 ºC) and longer reaction time can lead to complete
decomposition of biomass which by-turn results in decreasing sugar content in liquor
(Li et al. 2013).
Microwave irradiation was tested to increase efficiency of autohydrolysis and shows
good results. Also, it was reported that addition of sulfuric acid, hydrogen peroxide,
inorganic ions can enhance efficiency of autohydrolysis by decreasing temperature and
reaction time (Grundas S. 2011)

31
2.2 Biomass Treatment in Subcritical Water
Hydrothermal liquefaction is a type of thermo-chemical process that uses high-
pressure and comparatively medium-temperature to convert wet biomass and waste
streams. In short, it uses subcritical water as a reaction medium and final product is
mainly solid and liquid. During this process, hydrolysis or degradation of
macromolecules leads to obtain smaller molecules. Considerable part of oxygen in the
biomass is removed by dehydration or decarboxylation (Toor et al. 2011). Amount, type
and chemical properties of final product depend on biomass content and reaction
conditions.
As supercritical gasification, which was explained in the section 2.1.5, leads to total
degradation of biomass to mainly gaseous products, whereas the main point of
subcritical water treatment is in obtaining valuable chemicals from biomass. So, their
functions are totally different and it signifies that depends on desired product treatment
of biomass should be chosen. In Figure 2.11. comparison of two types of treatment of
carbohydrates consisting of biomass and possible final products are displayed.
Figure 2.11. Simplified reaction mechanisms of degradation of carbohydrates in sub-
and supercritical conditions (Source: Toor et al. 2011).
Many studies to understand idea of final products formation and influence of conditions
have been done. Kruse et al. (2003) studied degradation of biomass at 330-410 ºC and

32
30-50 MPa. As a substrate they used phytomass from baby food. They aimed to
characterize the chemistry of biomass degradation process, to compare sub- and
supercritical conditions and indentify key intermediate compounds of biomass.
Obtained final products were compared with final products of previous studies in order
to identify reaction pathway. As a result, it was concluded that by increasing
temperature, pH value is changing from acidic to basic, meaning that the production of
organic acid decrease. Also, it was reflected in final products, in conditions above
critical point gaseous products, below liquid organics amounts were high.
Results of studies about hydrothermal treatment of agricultural residues from different
countries (about 17 countries) were collected and screened by Cardenas-Toro et al.
(2014). It was concluded that hydrothermal liquefaction produces valuable products,
which can be used in different applications, from raw materials in food, cosmetic and
pharmaceutical industry to intermediates in chemical industry. Also, based on studies it
was understandable that for conversion of key compounds of agricultural residues such
as components of hemicellulose and starch preferable temperature less than 200ºC, for
cellulose higher than 200ºC. The schemes of main reaction pathways of hemicellulose
and cellulose hydrolysis are respectively given in Figure 2.12 and Figure 2.13.
Figure 2.12. Hemicellulose degradation pathway
(Source: Cardenas-Toro et al. 2014)

33
Figure 2.13. Cellulose degradation pathway
(Source: Cardenas-Toro et al. 2014)
As cellulose is a main compound of plant biomass and its amount can reach up-to 55%
we use it as substrate in our study (Toor et al. 2011). There are many studies about
cellulose treatment in supercritical and subcritical water. According to Ehara et al.,
supercritical water treatment has shown the best result to obtain high yields of
hydrolyzed products. However, it was observed that in subcritical water cellulose was
liable to more dehydration (Ehara et al. 2005).
A new way of lactic acid production by conversion of carbohydrates in subcritical water
with adding metal salts as catalysts to was proposed by Bicker et al. (2005). It was
concluded that the best results were obtained from Zinc sulfate (ZnSO4) and yield of
lactic acid was high in fructose decomposition following by glucose decomposition
(Figure 2.14). Based on data they gave possible scheme of Zn-catalyzed conversion of
carbohydrates in subcritical water as illustrated in Figure 2.15.

34
Figure 2.14. Lactic acid selectivity (colums) with respective reaction times (triangles) in
catalytic fructose (a) and glucose (b) decompositions at 200-360 ºC,
ZnSO4 concentration is 400 ppm (Source: Bicker et al. 2005).
Figure 2.15. Scheme of Zn catalyzed degradation of carbohydrates
(Source: Bicker et al. 2005).
Decomposition of cellulose in subcritical water, supercritical water and their combined
treatment were investigated (Ehara et al.2005). The highest yield of water soluble
portion was obtained in combined treatment. Results are given in Table 2.1.

35
Table 2.1. Yield of fractionated portions of cellulose as treated in supercritical water,
subcritical water, and their combined treatments (Source: Ehara et al.2005).
Treatment Time
(s)
Yield (%)
Water soluble Water
insoluble Water
soluble
Precipitates
Supercritical water (400ºC, 40
MPa)
0.1
0.2
0.3
41.2
58.3
93.9
49.0
41.7
6.1
9.8
0.0
0.0
Subcritical water (280ºC, 40
MPa)
120.0
180.0
240.0
49.5
58.7
82.7
0.0
0.0
0.0
50.5
41.3
17.3
Combined (400ºC, 40 MPa
and 280ºC , 40 MPa)
15.1
30.1
45.1
81.9
88.9
100.0
18.1
11.1
0.0
0.0
0.0
0.0
2.3. Biomass Conversion into Levulinic Acid and 5-HMF
As it was noticed in introduction part of this thesis, Levulinic acid is one of those
organics which has a significant attention across the world as it is multifunctional
platform chemical and has many applications to be used. There are many papers about
technologies of the production of levulinic acid. Among them production from biomass
interested us a lot. During the literature investigation we noticed that mainly studies had
been done on acid-catalyzed hydrolysis and biofine (bio-refining) process was
developed and used in industrial scale. Bio-refining process is a fast chemical
conversion process that was developed by Fitzpatrick S.W. in 1980s. This process use
mainly cellulose and starch as a substrate and depends on region and biomass source
could have supplementation for the necessary pretreatment. As a catalyst sulfuric acid is
mainly used (Rackemann et al.2011).
Acids that have high catalytic activity such as H3PO4, HCl, and H2SO4 are traditionally
used in production process of levulinic acid. However, their drawbacks such as
pollution to environment and corrosion to equipment force to search another ways of
production (Wang et al. 2013).
Among the organics that have been obtained from biomass in subcritical water presence
of levulinic acid was also noticed by many scientists. As in chemical method,
hydrothermal production of levulinic acid is based on rehydration of 5-HMF with two

36
molecules of water (Application of Hydrothermal Reactions to Biomass Conversion.
Edited by Jin F. 2014).
5-HMF by-turn is formed by dehydration of glucose or fructose. Formic acid is a by-
product of levulinic acid and rehydration of 5-HMF gives the same amount of them
(Asghari et al. 2010). Reaction pathway of levulinic acid production from D-glucose is
illustrated in Figure 2.16.
Figure 2.16. Reaction pathway of levulinic acid production from d-glucose
(Source: Zeng et al.2010).
Reaction condition has an initial effect on levulinic acid yield. Kruse et al. 2003
reported that levulinic acid yield falls down when temperature was above critical point
(Figure 2.17.).
Figure 2.17. Temperature and pressure dependence of levulinic acid concentration
(Source: Kruse et al. 2003)
Many types of biomass were treated in subcritical water. During the degradation of rice
bran it was noticed that levulinic acid and other acids such as formic, glycolic were
obtained at temperatures above 190 ºC (Pourali et al. 2009). Treatment of Japanese red
pine wood was done in non-catalytic and catalyzed conditions in order to compare yield

37
of valuable products. It was observed that addition of catalyst (phosphoric acid) leads to
high yield of organic acids included levulinic acid (Asghari et al. 2010).
Based on this literature review, we decided to choose levulinic acid as a desired product
of our study due to the wide application areas of this organic acid (see Figure 1.8 in
introduction section) and insufficient information about its production from cellulose in
subcritical water. We would like to understand the effect of reaction conditions such as
temperature (150, 200, 250 and 280 oC), residence time (30, 60, 90 and 120 min) and
initial pressure (0, 5, 10 and 15 bar). Moreover, different oxidizing agents (H2SO4 and
H2O2) with different amounts (0, 5, 25, 50, 75, 100 and 125 mM) were tested to obtain
higher yield and results were compared with oxidizer free way of treatment.

38
CHAPTER 3
EXPERIMENTAL
3.1. Chemicals
In this study all chemicals were used in their analytical standards and no
purification and other methods were performed. All information about chemicals used
during the experiments is given in Table 3.1. Also, de-ionized water was used during
the preparation of solutions and cleaning processes.
Table 3.1. List of chemicals used during the study and manufacturers from where they
were purchased
Name The product code Producer
Cellulose 31,069-7 Aldrich Sigma
Furfural 8.04012.0500 Merck
Sulfuric Acid 84721 Fluka
Lactic Acid 141034,1211 Panreac
Acetic Acid 1,00063,2500 Merck
Glucose 1,08337,0250 Merck
Formic acid 1,00264,2500 Merck
Fructose F0127-1006 Sigma Aldrich
Glycolic Acid 124737-256 Sigma
Glycolaldehyde dimer G6805-1G Aldrich
Pyruvic Acid 107360-25G Aldrich
5HMF W501808-25G-K SAFC
Levulinic Acid L2009-50G Aldrich
DL-Glycerolaldehyde G5001-500MG Sigma
Glycerol 141339,1212 Pancreac

39
3.2. Experimental Apparatus (Batch Reactor)
All experiments in this study were performed in batch-type Parr 5500 High
Pressure Compact reactor developed by Parr Instrument Company. This reactor has
such characteristics: the vessel is rated for a maximum working of 3000 psi, the
maximum operating temperature is 350 ºC, and volume is 300 ml. The reactor equipped
with gas inlet and outlet valves, liquid sampling valve, pressure gage, safety rupture
disc, internal stirrer and internal thermocouple. The reactor is constructed from stainless
steel type 316. Experimental setup contained the reactor, cooler and controller are
illustrated in Figure 3.1.
Figure 3.1. Experimental setup included the reactor, controller and cooler.
3.3. Experimental Procedure
For solution preparation each time 4 grams of cellulose were weighted and
added to 100 ml of de-ionized water. The pH value of the solution was measured and it
was equal to 6.82 (at 21 °C) in non-oxidizer reaction. This value was taken as initial pH
and used to compare with pH of produced liquor. In each experiment with adding
oxidizer, initial pH was re-measured. As oxidizing agents sulfuric acid (H2SO4) and
40
hydrogen peroxide (H2O2) were used in order to compare reaction results. Due to
operation safety of the reactor volume of solution was adjusted to 100 ml. During the
reaction, temperature and pressure were recorded in every 5 minutes before and after
reaching set reaction conditions. After reaching the set values, reaction time was
initialized which means the reaction is started. The temperature-pressure profile for 280
ºC and 60 min is given in Figure 3.2.
At the end of reaction time, heater was turned off. In general temperature ranges of
reaction were 150-280 ºC, final pressure vary from 5 to 64 bars, respectively. Reaction
times were 30, 60, 90 and 120 minutes. Initial pressure was applied (5, 10 and 15 bars)
in order to see influence on the desired product. Experimental data is given in Section
3.5. at the end of this chapter.
Figure 3.2. Temperature-pressure profile (280 ºC and 60 min)
As well known from literature, the final product could contain gaseous, liquid and solid
portions. Each portion was separated at the end of each experiment. Gaseous products
were collected to special gas collecting bags through gas output valve. Solid and liquid
parts were separated via filtration paper. pH value of the liquid portion was measured.
Solid portion was put into vacuum oven with set conditions as 40ºC for 48 hours. After
0
30
60
90
120
150
180
210
240
270
300
0 5 10 15 20 25 30 35 40 45 50 55 600
8
16
24
32
40
48
56
64
72
80
Te
mp
er
at
ur
e
(o
C)
Heat i ng Per i od ( mi n)
Pr
es
su
re
(
ba
r)

41
drying water insoluble portion was weighted to compare with the initial amount of
cellulose. Differences between weights were considered as dissolved in water and to
calculate cellulose conversion in “%” the equation was used:
(3.1)
This data was used for further calculation of liquid products yield. In early stage of the
study, solid portion was examined in terms of hexane solubility but since there were no
significant differences in the product, it was stopped to analyze hexane soluble portion.
Solid products were taken for further analysis such as SEM-EDX, FTIR, elemental
analysis (CHNS), XRD. Liquid products were analyzed by GC-MS and HPLC and the
gaseous products were monitored by GC-TCD. The general scheme of procedure is
given in Figure 3.3.
Figure 3.3. Scheme the Steps of Experimental Procedure
The yield of each product contained after reaction liquor obtained by HPLC was
measured with this equation:
(3.2)
LIQUID PRODUCT (pH, HPLC, GC-MS)
SEPARATION
SOLID PORTION (DRYING, SEM-EDX, FTIR,
CHNS, XRD)
REACTION STEP COLLECTION OF
GASEOUS PRODUCT
(GC-TCD)
CELLULOSE (SOLUTION)
%100)(
)_()(
initialCellulose
rxnafterCelluloseinitialCellulosex
%100)(_
)(__
ppmcelluloseDegraded
ppmionconcentratAAYield

42
In this equation, to calculate yield of “A” product the concentration obtained from
HPLC analysis (ppm) is divided to degraded cellulose (ppm) and multiplied to 100%.
3.4. Product Analysis
In total about 50 experiments were performed and after each, solid, liquid and
gaseous products were analyzed with different equipment as listed below.
3.4.1. Analysis of the Solid Products
The solid portion of sample was analyzed with SEM-EDX, FTIR and
Elemental (CHNS) analyses. These analyses were performed to confirm results and
support each others. A scanning electron microscopy with energy-dispersive X-ray
spectroscopy (SEM-EDX) was done with a model of Philips XL 30 FEG in the
Materials Research Center at Izmir Institute of Technology (IZTECH) to see visual
changes in the structure and determine carbon and oxygen content of solid portion.
Samples were sputter-coated in gold and were zoomed in 1000, 2000, 5000, 20000 and
50000 times (100µm, 50µm, 20µm, 5µm and 2µm respectively). Additionally, Fourier
transform infrared spectroscopy (FTIR- Shimadzu-8400S) and Elemental (CHNS)
analysis (LECO CHNS) were performed in Chemical Engineering Department and the
Department of Chemistry at IZTECH, respectively.
3.4.2. Analysis of the Liquid Products
To identify content of liquid product high-performed liquid chromatography
(HPLC) was used. This analysis was done in Environmental Development Application
and Research Center IZTECH by chromatograph Agilent 1200 with Refractive Index
Detector. Shodex SH 1011 Sugar column was used which has operating pressure about
30 bar and it was heated up to 50ºC and 65ºC. As a mobile phase 3.75 mM solution of
sulfuric acid in water was used.
To check and support HPLC results gas chromatography – mass spectrometry (GC-MS)
was also performed in the same research center. The instrument was Agilent GC

43
6890N/MS5973 and Restek Stabilwax-DA column was used. Inlet temperature was set
to 240 ºC.
3.4.3. Analysis of the Gas Products
To determine content of gaseous product gas chromatography with thermal
conductivity detector (GC-TCD) was used. It is also located at Environmental
Development Application and Research Center at IZTECH. The instrument is Agilent
6890N Network GC System with Agilent 7683 injector.
3.5. Cellulose Degradation Experiments in Subcritical Water
The study started with oxidizer-free conditions. Different temperatures (150-280
oC) and reaction times (30-120 min) were applied in order to compare the product
distribution, yields and cellulose conversion. As it was mentioned before, during the
study two oxidizing agents at different concentrations were tested to see the differences
in the final products yield. The first oxidizer was sulfuric acid (H2SO4). The
concentration of H2SO4 in experiments were 5, 25, 50, 75, 100 and 125 mM. During the
most of experiments concentration of H2SO4 was 50 mM. Analyses results were
compared with oxidizer-free experiments. Then, it was decided to test hydrogen
peroxide (H2O2) to see the effect of this oxidizer. After getting analyses results and
comparing them with H2SO4, since the yield of levulinic acid was so low with H2O2, the
rest of the experiments were carried in the presence of H2SO4. Additionally, initial
pressure such as 5, 10 and 15 bar was loaded at the beginning of the reaction to see
influence on the final products distribution at temperatures of 200ºC and 250ºC for 60
mins. The gaseous product formation was observed usually at temperatures higher than
200ºC. Data of the performed experiments is given in Table 3.2. Experiments are
numbered according to oxidizing agent concentration and were performed in different
period in order to make easier comparison of results.

44
Table 3.2. Experimental data of study
Experiment
number
Oxidizer amount
(H2SO4) (mM)
T
(oC)
t (min) Initial P (bar)
1 0 150 60 ----
2 0 200 60 ----
3 0 250 60 ----
4 0 150 30 ----
5 0 150 90 ----
6 0 150 120 ----
7 0 200 30 ----
8 0 200 90 ----
9 0 200 120 ----
10 0 250 30 ----
11 0 250 90 ----
12 0 250 120 ----
13 5 150 60 ----
14 5 150 120 ----
15 5 200 60 ----
16 5 200 90 ----
17 5 250 30 ----
18 5 250 60 ----
19 5 250 90 ----
20 5 250 120 ----
21 25 200 60 ----
22 50 150 30 ----
23 50 150 60 ----
24 50 150 90 ----
25 50 150 120 ----
26 50 200 30 ----
27 50 200 60 ----
28 50 200 90 ----
(Cont. on next page)

45
Table 3.2. (Cont.)
29 50 200 120 ----
30 50 250 30 ----
31 50 250 60 ----
32 50 250 90 ----
33 50 250 120 ----
34 50 280 30 ----
35 50 280 60 ----
36 50 280 90 ----
37 50 280 120 ----
38 50 200 60 5
39 50 200 60 10
40 50 200 60 15
41 50 250 60 5
42 50 250 60 10
43 50 250 60 15
44 75 200 60 ----
45 100 200 60 ----
46 125 200 60 ----
H2O2 (mM)
47 50 200 60 ----
48 75 200 60 ----
49 100 200 60 ----
50 125 200 60 ----
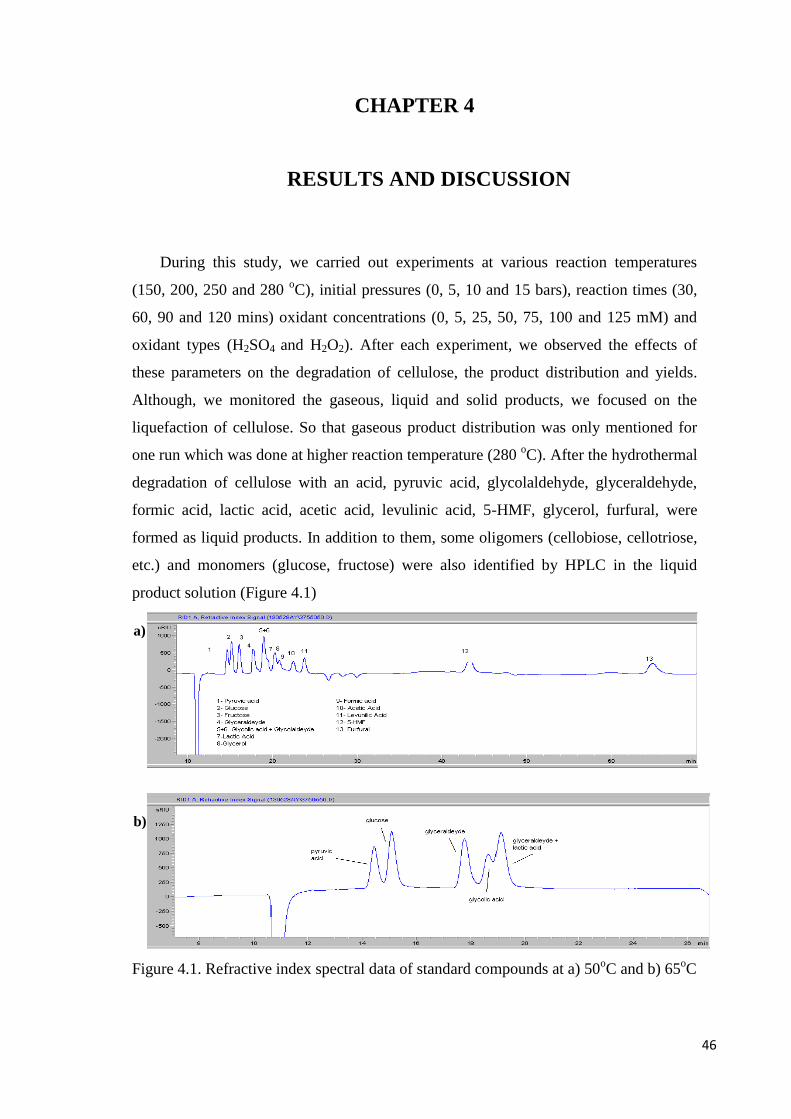
46
CHAPTER 4
RESULTS AND DISCUSSION
During this study, we carried out experiments at various reaction temperatures
(150, 200, 250 and 280 oC), initial pressures (0, 5, 10 and 15 bars), reaction times (30,
60, 90 and 120 mins) oxidant concentrations (0, 5, 25, 50, 75, 100 and 125 mM) and
oxidant types (H2SO4 and H2O2). After each experiment, we observed the effects of
these parameters on the degradation of cellulose, the product distribution and yields.
Although, we monitored the gaseous, liquid and solid products, we focused on the
liquefaction of cellulose. So that gaseous product distribution was only mentioned for
one run which was done at higher reaction temperature (280 oC). After the hydrothermal
degradation of cellulose with an acid, pyruvic acid, glycolaldehyde, glyceraldehyde,
formic acid, lactic acid, acetic acid, levulinic acid, 5-HMF, glycerol, furfural, were
formed as liquid products. In addition to them, some oligomers (cellobiose, cellotriose,
etc.) and monomers (glucose, fructose) were also identified by HPLC in the liquid
product solution (Figure 4.1)
Figure 4.1. Refractive index spectral data of standard compounds at a) 50oC and b) 65
oC
a)
b)

47
Since there were many products in the liquor, the identification of all of them was not
possible. Therefore, by using GC-MS, we tried to re-observe the same products
identified by HPLC and one of the GC-MS chromatogram is given in Figure 4.2.
Figure 4.2. GC-MS chromatogram of the liquid phase recovered after treatment with
125 mM H2SO4 at 200 oC, 52 bar, 60 min.
4.1 Effect of Reaction Temperature on Cellulose Degradation and
Product Yields
As it was mentioned in previous sections of this thesis, the effects of reaction
conditions such as temperature, pressure, oxidizing agent and reaction time were the
main aim of our study. As it was expected, the temperature was a main factor that
effects cellulose conversion that was also mentioned in literatures (Ehara et al. 2005,
Williams et al. 2006, Cardenas-Toro et al. 2014). As it was mentioned, reactions were
carried out at 150, 200, 250 and 280 ºC. The amount of converted cellulose was
measured by weighting remained solid portion, and calculated with respect to the initial
amount of cellulose (4 grams).

48
In acid concentration of 50 mM, the highest cellulose conversion value in different
residence time was seen at 280 ºC with a value of 73.1%, whereas the least amount of
conversion was observed at 150 ºC with a value of 10.9% at the same conditions. The
comparison of cellulose conversion levels at different temperatures and reaction times is
given in Figure 4.3. The second highest result of cellulose conversion was observed at
250 ºC in all reaction times but starting from 60 mins, the differences of cellulose
conversion level between 250ºC and 200ºC are slight.
Figure 4.3. Cellulose Conversion at different reaction times (0-120 mins) and
temperatures (150-280 oC)
Even after 120 mins, level of cellulose conversion was around 70.5% at 200 ºC and
69.3% at 250 ºC respectively. As well known, the thermodynamic properties of water
play a key role during the hydrothermal treatment and increasing temperature and
correspondingly pressure directly affect the treated raw material. Ehara et al., studied
decomposition behavior of cellulose and highlighted that under different conditions of
water, mechanism of cellulose conversion would also be different (Ehara et al. 2005).
As well known from literature (Cardenas-Toro et al. 2014) the main idea of subcritical
condition is to create favorable environment for breakdown glycosidic bonds of
cellulose that have high chemical resistance. It leads to cellulose decomposition to
oligomers. These oligomers have various degree of polymerization (DP) and could be

49
water-soluble (DP<6) and water-insoluble (DP<200). The addition of oxidizing agent
increases the hydrolysis of cellulose and formation of products (Bicker et al. 2005).
Those results were confirmed in our study. Liquid product contains a high number of
various compounds. Among them, we decided to give the results of levulinic acid,
formic acid, acetic acid and 5-HMF. Percentage values of cellulose decomposition and
products yields at different temperatures observed during HPLC analysis are given in
Figure 4.4.
Figure 4.4. Conversion of cellulose and distribution of the liquid products with 50 mM
H2SO4 at different reaction temperatures
In Figure 4.4, it was seen that at 150 ºC, the level of cellulose conversion and yield of
levulinic acid were low but at the same time yield of 5-HMF was comparatively high.
At 200 ºC, the amount of 5-HMF in liquid product dropped while the percentage of
cellulose conversion and yields of levulinic acid and formic acid were higher. It might
be as proposed from the literature that during the conversion of cellulose in the first
stage glucose was formed. Glucose isomerized to fructose, which by-turn formed 5-
HMF (Rosatella et al 2011). 5-HMF was the main intermediate and could form various
final compounds including levulinic acid and its by-product formic acid at higher
temperatures (Zeng et al. 2010, Rosatella et al. 2011, Cardenas-Toro et al. 2014). This
information from literature is totally reflected in our results. As it can be seen from
Figure 4.4, when levulinic acid and formic acid concentrations were high, the

50
concentration of 5-HMF was low which means that 5-HMF was dehydrated. According
to Kruse et al. (2003), acetic acid was one of the minor acid formed from hydrothermal
degradation of cellulose and the effect of temperature on the amount of acetic acid was
low, which could also be seen from Figure 4.4.
In the case of levulinic acid yield as the desired product, the effect of the temperature at
different reaction time is given in Figure 4.5. From this diagram it was seen that the
yield of levulinic acid reached to 24.9% at 200 ºC within 60 mins.
Figure 4.5. Levulinic acid yield with 50 mM H2SO4 from 30 min to 120 min reaction
time at various reaction temperatures of 150, 200, 250 and 280 oC
From Figure 4.5, it could be seen that for the first 30 min, the yield of levulinic acid was
high at 250 ºC. In the case of 200 ºC, there was no levulinic acid detected at 30 min, but
after 60 mins it reached to 25.21 and 18% respectively. In general, as the reaction time
was longer, the yield of levulinic acid decreased, except for 150 ºC for which it
increased by time. The temperature-time correlation is an essential factor in terms of
levulinic acid formation. According to Girisuta et al. (2006), the best result of levulinic
acid yield was obtained at higher reaction temperature but at shorter reaction time. At
the same study, it was concluded that high yield of levulinic acid resulted in less amount
of 5-HMF produced in the liquor. By the increase in temperature, the structure of solid
part was also changing as shown by SEM images in Figure 4.5.

51
Figure 4.6. SEM images (same scale-1000X) of a) initial cellulose and solid products
after the treatment at b) 150 oC; c) 200
oC; d) 250
oC; f) humins at 250
oC
(magnitude 20000, 5 micrometer)
Micrystalline cellulose was taken as an initial (Figure a) to see differences after reaction
solid part. As it is seen from pictures by increasing the temperature of reaction there are
visual changes in structures of solid part. At high temperatures (here is 250ºC) and with
high acid concentrations, formation of black, insoluble particles known as ‘humins’
were observed which is clearly seen in picture f. Clearly visible typical round shaped,
agglomerated humin particles have particle sizes in the range of 5−15 μm.
According Kruse et al. (2003) after hydrothermal treatment the dark brown deposit was
formed and it was not possible to quantitatively identify the content of it. In this study
we tried to describe the content of solid product by FTIR and CHNS analyses. FTIR
spectrum of formed solid portions at 150 ºC, 200 ºC, 250 ºC and 280 ºC is given in
Figure 4.7.

52
Figure 4.7. FTIR spectrum of solid portion at150, 200, 250 and 280 oC.
In ranges from 3335 cm-1
broad O-H stretching vibrations observed which is highest at
150ºC, indicates presence of the functional alcohols, phenols groups. Peak around 2750-
2950 cm-1
of shown C-H stretching vibrations, which indicates presence aromatic
hydrocarbons. The presence of aromatic hydrocarbons in solid product was also
observed in literature (Cardenas-Toro et al. 2014). The peak around 1685-1775cm-1
which is higher at 280ºC, belongs to C=O stretching vibrations which indicates the
presence of aliphatic groups. The peak of 935 cm-1
belongs to medium bonded O–H
shows presence of carboxylic acids functional group. The CHNS results also have
shown the difference between the reaction temperatures of 150 ºC and 250 ºC. The
CHNS analysis results are displayed in Table 4.1.
Table 4.1. Elementary composition of solid product formed at 150 ºC and 250º C with
50 mM of H2SO4 for 60 min
C H N S
150ºC 56.14 6.17 0 0.407
250ºC 72.27 4.17 0 1.326

53
As it is seen from this table, at 250 ºC comparatively higher level of loss in hydrogen
amount was observed. The dehydration occurred during the process of cellulose
conversion, which was also noticed in Kruse et al (2003). The importance of
temperature in cellulose conversion is demonstrably seen in liquid, solid products
formation. Corresponding with HPLC results GC-MS analysis results are given in
Figure 4.8.
Figure 4.8. GC-MS spectrum of the liquid products after the treatment with 50 mM
H2SO4 for 60 min at a reaction temperature of a) 150 oC and b) 280
oC

54
The importance of temperature in cellulose conversion is demonstrably seen in liquid,
solid products formation. Corresponding with HPLC results GC-MS analysis results are
given in Figure 4.8.
The distribution of gaseous product is higher at higher temperature and longer reaction
time (Kruse et al. 2003, Girisuta et al. 2005, Cardenas-Toro et al. 2014). In our study
the maximum value of temperature and reaction time were 280 ºC and 120 mins,
respectively. As gaseous product by GC-TCD analysis, mainly H2, O2, CO, CH4, CO2,
C2H2 and C2H4 were observed as illustrated in Figure 4.9. Similar observations were
obtained in Kruse et al. (2003).
Figure 4.9. Gas products identified after the treatment with 50 mM H2SO4 at 280 oC for
120 mins
4.2 Effect of Reaction Pressure on Cellulose Degradation and
Product Yields
In our study the reaction pressure range from 5 to 64 bars. Also, in order to see
the effect of initial pressure on cellulose conversion and product distribution, initially
pressure in values of 5, 10 and 15 bars were loaded into the reactor vessel. In Figure
4.10, the influence of initial pressure on cellulose conversion and acidity of liquid
product was illustrated.

55
Figure 4.10. Influence of initial pressure (5, 10 and 15 bars) on the degradation of
cellulose and acidity of the liquor after hydrothermal treatment with 50
mM H2SO4 for 60 mins
As it is seen from the figure above, there were no significant changes in cellulose
conversion and pH value of liquid product with the increase in the initial pressure.
Kruse et al. (2003) described the influence of pressure. It was explained that the absence
of significant changes in cellulose conversion and product distribution was also hidden
in water properties. As well known, in subcritical water conditions the pressure of
reaction is equal to vaporized water and its function is to keep water in liquid state, to
control density of environment. Decomposition of substrate will run in two reaction
pathways such as ionic and free-radical. Ionic pathway dominates if there is high
density and below the critical temperature or in supercritical fluid state when pressure is
very high. Free-radical reaction pathway occurs if there is high temperature and low
density. For instance, below critical point of water reaction runs in liquid phase and
there is low dependence of water properties on the pressure, whereas above supercritical
point, water is supercritical and its properties are strongly pressure-depended. Since our
study was carried out at temperatures below the critical point of water, pressure
influence was not observed.
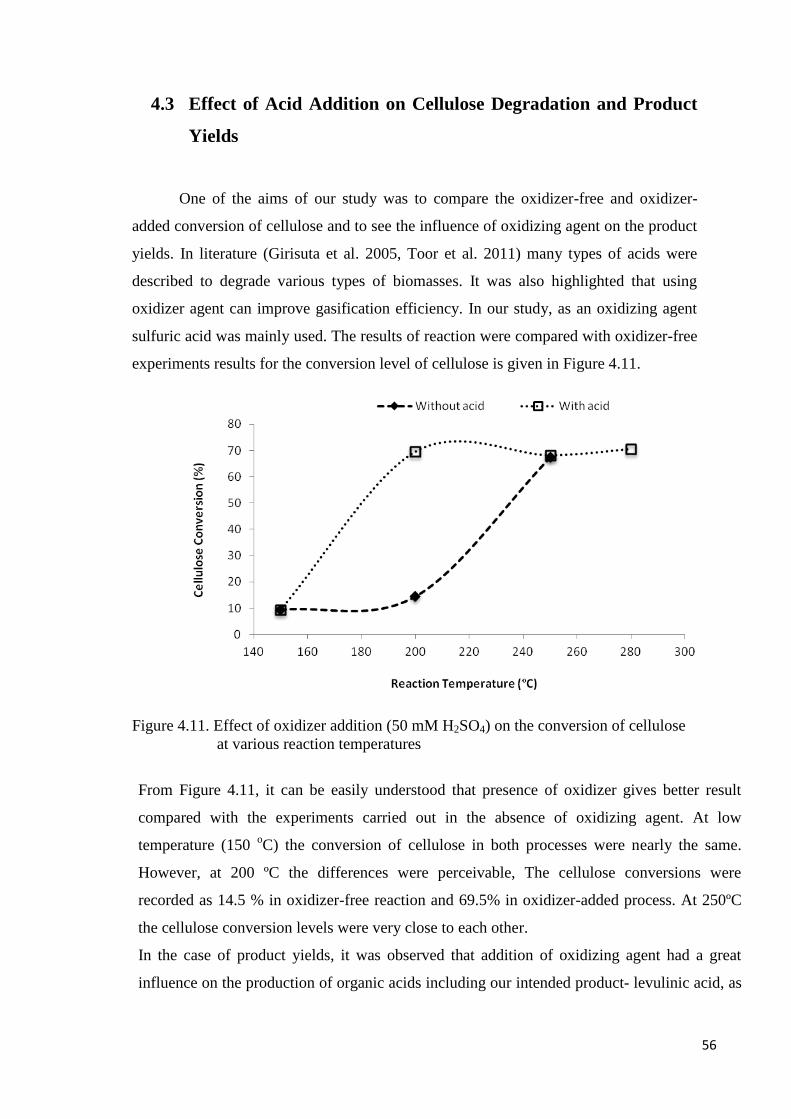
56
4.3 Effect of Acid Addition on Cellulose Degradation and Product
Yields
One of the aims of our study was to compare the oxidizer-free and oxidizer-
added conversion of cellulose and to see the influence of oxidizing agent on the product
yields. In literature (Girisuta et al. 2005, Toor et al. 2011) many types of acids were
described to degrade various types of biomasses. It was also highlighted that using
oxidizer agent can improve gasification efficiency. In our study, as an oxidizing agent
sulfuric acid was mainly used. The results of reaction were compared with oxidizer-free
experiments results for the conversion level of cellulose is given in Figure 4.11.
Figure 4.11. Effect of oxidizer addition (50 mM H2SO4) on the conversion of cellulose
at various reaction temperatures
From Figure 4.11, it can be easily understood that presence of oxidizer gives better result
compared with the experiments carried out in the absence of oxidizing agent. At low
temperature (150 oC) the conversion of cellulose in both processes were nearly the same.
However, at 200 ºC the differences were perceivable, The cellulose conversions were
recorded as 14.5 % in oxidizer-free reaction and 69.5% in oxidizer-added process. At 250ºC
the cellulose conversion levels were very close to each other.
In the case of product yields, it was observed that addition of oxidizing agent had a great
influence on the production of organic acids including our intended product- levulinic acid, as

57
illustrated in Figure 4.12.
Figure 4.12. Effect of H2SO4 concentration on the conversion of cellulose and product yields
(reaction time: 60 min; reaction temperature: 200 oC)
In our study H2SO4 was mainly used in concentration of 50 mM but as it seen from Figure
4.12, to compare the product distribution 5, 25, 75, 100 and 125 mM were also tested. In the
same figure, yield of levulinic acid increased with increasing concentration of added H2SO4
and reached from 4.8 % (with 5 mM H2SO4) to 38% with the adition of 125 mM H2SO4.
Similar trend was observed in the yield of formic acid. The yields were 2.6% and 21% after
the treatment with 5 and 125 mM H2SO4, respectively. However, the yields of other products
such as glucose, fructose, and 5-HMF were decreasing. This could be explained by the
reaction mechanism of cellulose degradation in hot-compressed water. First glucose and
fructose were formed as simple sugars from cellulose. Then they were further converted to 5-
HMF as the main intermediate product. Finally, 5-HMF was decomposed into levulinic acid
and formic acid (Zeng et al. 2010, Rosatella et al. 2011, Cardenas-Toro et al. 2014).
In Figure 4.13. the yield of levulinic acid in the presence and absence of oxidizing agent at
150 ºC and 250 ºC is shown. From this data we can confirm that effect of H2SO4 on the
degradation of cellulose to produce levulinic acid was significant, which was also observed in
literature (Toor at al. 2011).

58
Figure 4.13. Levulinic acid yield with and without acid at 150 and 250 oC
Influence of oxidizing agent on solid product was visually observed by SEM analysis.
The SEM images of solid portions obtained after the treatment with different amount of
H2SO4 are given in Figure 4.14.
Figure 4.14. SEM images (same scale-1000X) of a) initial cellulose and solid products
after the treatment with acid at a concentration of b) 0 mM; c) 25 mM; d)
50 mM; e) 75 mM; e) 125 mM
The effect of H2SO4 can clearly seen in pictures “b” (without any acid) and “f”(with 125
mM acid). Under the effect of 125 mM of oxidizing agent, agglomerated-round shaped

59
humins, which had similar structure obtained at high temperature treatment (280 ºC),
were observed. These changes can be considered as indications of significant effect of
H2SO4 that was mentioned in literature (Toor et al. 2011).
Figure 4.15. FTIR spectrum of solid portion with a) 0, 5, 25 and 50 mM H2SO4 and b)
75, 100 and 125 mM H2SO4 at 200 oC and 60 min
In Figure 4.15, the results of FTIR analysis after the treatment with the presence of
various acid concentrations is shown. In this figure, the concentration of H2SO4 with 0,
5, 25 and 50 mM were grouped as “a”; 75, 100 and 125 mM were grouped as “b”.
In group “a” observed peaks at 3370 cm-1
shows medium N-H stretch bonds indicating
the presence of amides and amines. The peak at 2840 cm-1
corresponds to medium C-H
b)
a)

60
stretch bond refers to alkanes. The peak at 1670 cm-1
shows weak-medium C=C
stretching vibration also indicates the presence of alkenes. The peak at 1050 cm-1
shows
strong C-O bonds that corresponds to carboxylic acids and alcohols. In group “b”, peak
seen at 3400 cm-1
indicates strong O-H bond, which may refer to carboxylic group. The
peak at 1650 cm-1
shows C=C stretching vibration indicating the presence of alkenes.
The peak at 1200 cm-1
shows strong C-O stretching vibration refers to acetates. The
peak at 990 cm-1
shows weak C-H rocking vibrations relating to ethers.
4.4 Effect of Oxidizer Type on Cellulose Degradation and Product
Yields
As it was discussed before, the main idea of using oxidizing agent is to improve
conversion of cellulose and increase the product yields by reducing the reaction
temperature and time which leads to energy saving and saving the time. In the literature
it was reported that many catalysts such as H2SO4, KHCO3, ZnCl2 (Bicker et al.2005),
H3PO4, oxalic acid, HCl, HI (Girisuta et al. 2005), SiO2/Al2O3 (Zeng et al. 2010) and
CO2 (Cardenas-Toro et al. 2014) showed good result in hydrothermal treatment of
biomass. After literature investigation we decided to test H2O2 in order to compare the
results with H2SO4. H2O2 was added to reaction solution with amount of 50, 75, 100 and
125 mM at temperature 200 ºC for 60 mins treatment. The influence on cellulose
conversion and product yield was examined and the results are shown in Figure 4.16 .
Figure 4.16. Effect of sulfuric acid (H2SO4) and hydrogen peroxide (H2O2) addition on
the conversion of cellulose at 200 oC after 60 mins

61
As it is seen from Figure 4.16, the conversion values were totally different in the
presence of H2O2 and H2SO4. Level of cellulose conversion with 125 mM of H2SO4 was
73.2 %, whereas with the same amount of H2O2 it was only 17.6%. pH values with the
same amount of acid addition were 1.64 and 2.97, respectively. It was expected that the
product distribution in the presence of H2O2 and H2SO4 would also be different, was
confirmed by HPLC analysis and the results are illustrated in Figure 4.17.
Figure 4.17. Effect of a) sulfuric acid (H2SO4) and b) hydrogen peroxide (H2O2)
addition on the yields of levulinic acid, 5-HMF, formic acid and glucose at
200 oC after 60 mins
a)
b)

62
After HPLC, the liquid product was screened by GC-MS analysis. The chromatograms
are given in Figure 4.18
Figure 4.18. GC-MS spectrum of the liquid products after the treatment with a) 125 mM
H2SO4 and b) 125 mM H2O2 for 60 min at a reaction temperature of 200oC
The HPLC and GC-MS analyses showed that among these two oxidizing agents, H2SO4
was favorable in terms of levulinic acid production. Totally different final liquid
products of two oxidizing agents allow us to conclude that they can be useful in studies
with different objectives. Bicker et al. (2005) proposed a new way of lactic acid

63
production through hydrothermal decomposition of carbohydrates. The main source was
the glucose, which is monomer of most of carbohydrates. In this case H2O2 can be used
to decompose cellulose. After obtaining the results of analyses and further discussion, it
was decided not to use H2O2 in rest of the experiments due to low level of cellulose
conversion and yield of the desired product.
4.5 Effect of Reaction Time on Cellulose Degradation and Product
Yields
Correlation of all conditions can helps us to understand the reaction mechanism
to achieve high selectivity of the desired product. In our study, reactions were carried
out for 30, 60, 90 and 120 mins. That means, almost all reaction parameters such as acid
concentration, pressure, and temperature were tested in those ranges of reaction time.
However, it should be noted that the experiments mainly were carried out in 60 mins. In
literature (Kruse et al. 2003, Bicker et al. 2005, Girisuta et al. 2005, Ehara et al. 2005)
different reaction times for the degradation of biomass were used depending on
desirable product and objectives of the studies. In our study, time also affected the
cellulose degradation and product yields depending mostly on added amount of
oxidizing agent and reaction temperature. In Figure 4.19, the product yields were given
at different reaction times with 50 mM oxidizing agent at 200 ºC.
Figure 4.19. Effect of reaction time on the product distribution with the addition of 50
mM H2SO4 at 200 oC

64
As it can be seen from Figure 4.19, after 60 min treatment, the products yields started to
decrease by the reaction time. For instance, at 30 mins the yield of levulinic acid
drastically raised and achieved higher yield (25%) after 60 mins. Then, yield of
levulinic acid exhibited a tendency to decrease. Formic acid yield was also decreasing
but not as much as levulinic acid. Other products yield such as glucose, fructose and 5-
HMF, as expected, dropped by the time. That is an evidence of decomposition of main
carbohydrates and 5-HMF to other products including levulinic and formic acids. (Zeng
et al. 2010, Rosatella et al. 2011, Cardenas-Toro et al. 2014). Peng et al. (2010) reported
similar trend in levulinic acid yield decreasing from 10 wt % to 15 wt % as the reaction
time increased. The reason for this effect might probably be related to insufficient
amount of catalyst, feedback inhibition and decrease in reactivity.
4.6 Statistical Analysis by Analysis of Variance (ANOVA)
In order to obtain significance of experimental results, full factorial design of
experiment was investigated via Minitab 16 software program. Factors such as reaction
temperature, time and, concentration of H2SO4 affect the responses of analyzed design.
In this design responses of experiments are the concentration of products. Therefore,
ANOVA analysis quantifies the interaction between responses and factors by
considering the couple affects of factors such as temperature and acid concentration.
ANOVA analysis were applied by accepting the p-value lower than 0.1. The p-values of
factors differ accordingly to the responses. Therefore, same factors can exhibit different
p-values in comparison between responses. ANOVA analysis gives the distribution of
the residual in graphical representation in normal probability plot. The distribution
indicates the applicability of analysis of variance to the response. A small (<0.1, a level
of significance) p-value indicates that the two main factors (reaction temperature and
acid concentration) and coupled interactions have statistically significant effect on the
response.

65
Figure 4.20. Surface plot of temperature (150, 200 and 250 oC) vs acid concentration (0,
15, 30 and 45 mM H2SO4) for Levulinic acid yild at 60 mins
Figure 4.20 shows the surface plot for levulinic acid to analyze the effect of temperature
and acid concentration separately and their coupled effect. P-values for temperature
effect and acid effect were 0.003 and 0.00, respectively. In the case of coupled effect, it
was 0.061 (<0.1) indicating that both temperature and acid concentration have great
influence on the yield of levulinic acid, which was also the case for the coupled effect.
Figure 4.21 shows the surface plot for 5-HMF to analyze the effect of temperature and
acid concentration separately and their coupled effect. When we checked p-value for
acid concentration, we noticed that by itself only, the H2SO4 concentration was not
strongly affected on the yield of 5-HMF since the p-value was 0.206 which was greater
than 0.1. However, when temperature and acid concentration were analyzed together,
we can say that they have a great influence on 5-HMF yield with a p-value of 0.001.

66
Figure 4.21. Surface plot of temperature (150, 200 and 250 oC) vs acid concentration (0,
15, 30 and 45 mM H2SO4) for 5-HMF yield at 60 min
Normal probability plots for both levulinic acid and formic acid were almost linear but
in the case of 5-HMF, there was some deviation from the linearity. This might be cause
by the effect of pressure. In the parameter evaluation by ANOVA, we did not count
pressure since we could not observe significant effect on the degradation of cellulose in
the experimental section. However, there might be some coupled effect (pressure-
temperature or pressure-acid concentration) on the yield of product. This missing info
may cause some deviations in the normal probability plots.
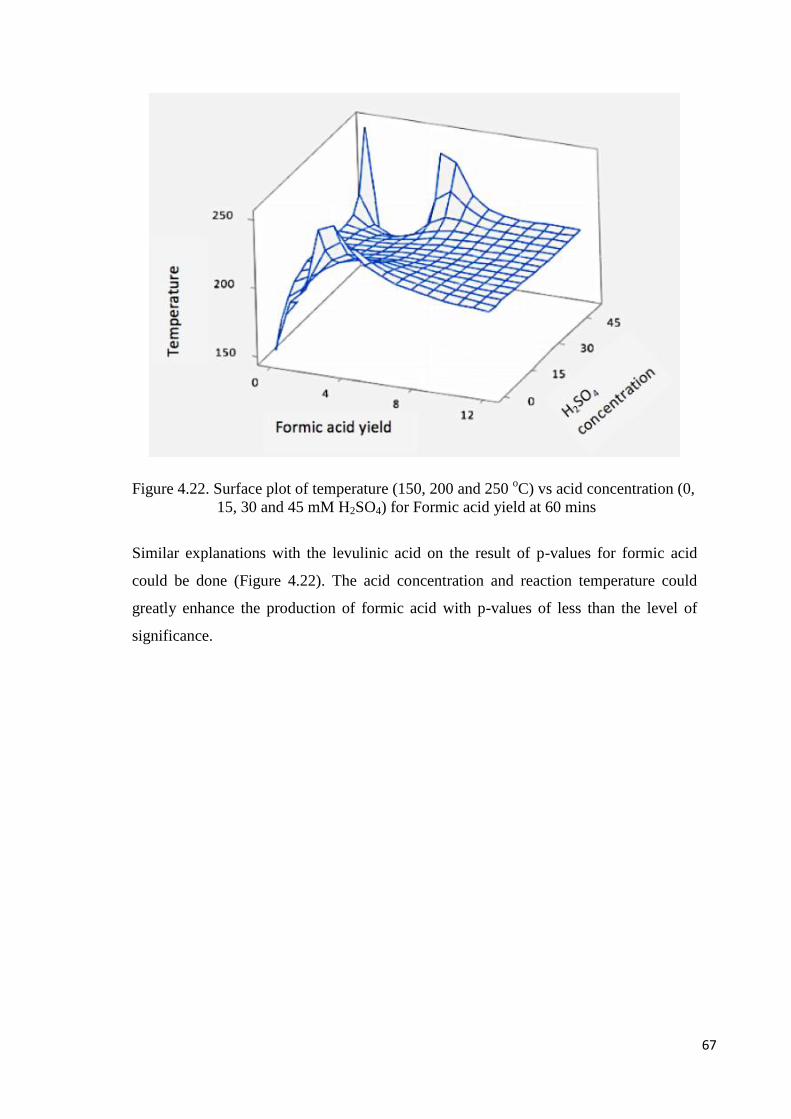
67
Figure 4.22. Surface plot of temperature (150, 200 and 250 oC) vs acid concentration (0,
15, 30 and 45 mM H2SO4) for Formic acid yield at 60 mins
Similar explanations with the levulinic acid on the result of p-values for formic acid
could be done (Figure 4.22). The acid concentration and reaction temperature could
greatly enhance the production of formic acid with p-values of less than the level of
significance.

68
CHAPTER 5
CONCLUSION
The degradation of cellulose as a model compound of biomass in hot-pressurized
water was investigated without addition of any organic solvent. In order to clarify the
effects of reaction parameters on the degradation of cellulose and the yield of desired
liquid products, series experiments were carried out at different reaction temperatures
(150, 200, 250 and 280 ºC), pressures (5-64 bars), oxidizer concentration (0, 5, 25, 50,
75, 100 and 125 mM), oxidizer type (H2SO4 and H2O2) and reaction times (30, 60, 90
and 120 mins). After the hydrothermal degradation of cellulose with H2SO4 in hot-
pressurized water, levulinic acid and 5-HMF were produced in the liquid phase.
Additionally, small amounts of organic acids (formic acid, glycolic acid, lactic acid,
etc.) aldehydes, monomers and oligomers were generated as minor products. Addition
of H2SO4 led to a great increase in the degradation of cellulose with a percentage of
73% at 200 oC with a H2SO4 concentration of 125 mM at the end of 60 min reaction
time. Under same conditions, the yield of levulinic acid was successfully achieved to
38% after 60 min. To clarify the coupled-effect of these parameters, obtained results
were statistically analyzed by ANOVA and surface plots were drawn. According to
these results, temperature and acid concentration greatly influenced the yield of
products and the degradation of cellulose in hot-pressurized water without any organic
solvent addition.

69
REFERENCES
Asghari, F. S. Yoshida H., (2010) Conversion of Japanese red pine wood (Pinus
densiflora) into valuable chemicals under subcritical water conditions.
Carbohydrate Research, 345, 124–131
Baskar C., Baskar S., Dhillon R.S. (Eds.). (2012). Biomass Conversion. The Interface
of Biotechnology, Chemistry and Materials Science. 91-122. doi: 10.1007/978-3-
642-28418-2_2; ISBN: 978-3-642-28418-2
Bicker, M., Endres, S., Ott, L., Vogel, H. (2005). Catalytical conversion of
carbohydrates in subcritical water: A new chemical process for lactic acid
production. Journal of Molecular Catalysis A: Chemicals, 239, 151–157.
doi:10.1016/j.molcata.2005.06.017
Capareda S.C. (2011). Biomass Energy Conversion, Sustainable Growth and
Applications in Renewable Energy Sources. Edited by Nayeripour M., InTech.
doi: 10.5772/25735; ISBN: 978-953-307-408-5
Capuzzo, A.; Maffei, M.E.; Occhipinti, A. (2013). Supercritical Fluid Extraction of
Plant Flavors and Fragrances. Molecules, 18, 7194-7238.
Cardenas-Toro, F.P., Alcazar-Alay, S.C., Forster-Carneiro, T., Angela, M., Meireles, A.
(2014). Obtaining Oligo- and Monosaccharides from Agroindustrial and
Agricultural Residues Using Hydrothermal Treatments. Food and Public Health,
4(3): 123-139 doi: 10.5923/j.fph.20140403.08
Cengel, Y. A.; Boles, M.A. (2002). Thermodynamics: An Engineering Approach.
Fourth Edition. McGraw-Hill. 824-827. ISBN 0-07-238332-1
Knežević., D. (2009). Hydrothermal Conversion of Biomass. PhD dissertation.
University of Twente, Enschede, The Netherlands. ISBN 978-90-365-2871-9
Ehara, K., Saka, S. (2005). Decomposition behavior of cellulose in supercritical water,
subcritical water, and their combined treatments. J Wood Sci. 51, 148–153. doi:
10.1007/s10086-004-0626-2
Girisuta, B. (2007). Levulinic Acid from Lignocellulosic Biomass. PhD dissertation.
University of Groningen. ISBN 978-90-367-3229-1
Grabbe, E., N-Hipolito, C., Kobayashi, G., Sonomoto, K., Ishizaki, A. (2001). Biodiesel
production from crude palm oil and evaluation of butanal extraction and feel
properties. Process Biochim.,37, 65-71.
Grundas, S., (2011). Advances in Induction and Microwave Heating of Mineral and
Organic Materials. In Tech. 697-722. ISBN 978-953-307-522-8

70
Guo, L. J., Lu Y. J., Zhang X. M., Ji C. M., Guan Y. & Pei A. X. (2007). Hydrogen
production by biomass gasification in supercritical water: A systematic
experimental and analytical study. Catalysis Today 129(3-4): 275-286.
Hayes, D. J., Fitzpatrick, S.W., Hayes, M.H.B., Ross, J. R.H., The Biofine Process -
Production of Levulinic Acid, Furfural, and FormicAcid from Lignocellulosic
Feedstocks. In Biorefineries - Industrial Processes and Products: Status Quo and
Future Directions. Volume 1. (2006). Editors: Kamm, B.; Gruber, P. R.; Kamm,
M., Wiley-VCH: Weinheim. doi: 10.1002/9783527619849.ch7
Hendry, D. (2012) Investigation of Supercritical Fluids for Use in Biomass Processing
& Carbon Recycling. PhD dissertation. University of Missouri–Columbia,
http://hdl.handle.net/10355/14997
http://www.asiabiomass.jp/; Sub-critical or Supercritical Water Can Change Waste
Woody Biomass to Useful Energy Resources. Retrieved in 15 March 2015
http://criticalprocesses.com/; Critical Processes, Clean Separation & Extraction.
Retrieved in 25 March 2015
Huber, G.W., Iborra, S., Corma, A. (2006) Synthesis of Transportation Fuels from
Biomass: Chemistry, Catalysts, and Engineering. Chem. Rev., 106 (9), 4044–
4098. doi: 10.1021/cr068360d
Ishizaki, A., Michiwaki, S., Grabbe, E., Kobayashi, G., Sonomoto, K., Yoshino, S.
(1999). Extractive acetone-butanol-ethanol fermentation using methylated crude
plam oil as extractant in batch culture of Clostriduim saccharoperbutyl
acetonicum N1-4 (ATCC12564), J.Biosci, Bioeng, 87, 352-356.
Jenkins, B.M., Baxter, L.L., Miles Jr., T.R., Miles, T.R. (1998). Combustion properties
of biomass. Fuel Processing Technology, 54, 17-46.
Jin, F. (Ed.). (2014). Application of Hydrothermal Reactions to Biomass Conversion.
Springer-Verlag Berlin Heidelberg. 31-59. doi: 10.1007/978-3-642-54458-3.
ISBN 978-3-642-54458-3.
Kamm, B.; Kamm, M.;Gruber, P.R.; Kromus, S., Biorefinery Systems - An Overview.
In Biorefineries - Industrial Processes and Products: Status Quo and Future
Directions. Volume1. (2006). Edited by: Kamm, B.; Gruber, P. R.; Kamm, M.
Wiley-VCH:Weinheim. 3-4. ISBN: 978-3-527-32953-3
Kruse, A., Henningsen, T., Sinag, A., & Pfeiffer, J. (2003). Biomass gasification in
supercritical water: Influence of the dry matter content and the formation of
phenols. Industrial & Engineering Chemistry Research, 42, 3711-3717.
Kumar, P. Barrett D. M., Delwiche M.J., Stroeve, P. (2009). Methods for Pretreatment
of Lignocellulosic Biomass for Efficient Hydrolysis and Biofuel Production. Ind.
Eng. Chem. Res., 48 (8), 3713–3729, doi: 10.1021/ie801542g

71
Li, Z., Qin, M., Xu, C., Chen, X. (2013). Hot Water Extraction of Hemicellulose from
Apsen Wood Chips of Different Sizes. BioResources, 8(4), 5690-5700.
MacDonald,S. F. (1974). Methyl-5-bromolevulinate. Can. J. Chem., 52, 3257-3258.
Materials and processes for energy: communicating current research and technological
developments. (2013). Editor: A. Mendez-Vilas. Formatex Research Center.
ISBN: 978-84-939843-7-3
McDonald, P., Henderson, A. R., Heron, S. J. E., Bucks, M. (Eds.). (1991) The
Biochemistry of Silage (2nd ed.) UK: Chalcombe Publications, 321-323. ISBN 0-
948617-225.
Momba. M., Bux F. (Eds.). (2010). Biomass. Sciyo. 135-142. ISBN 978-953-307-113-8
Morichi, T. (1990) Physiology and metabolism of lactic acid bacteria. Biseibutsu, 6 (1),
27-34.
NBS/NRC steam tables. (1984). Haar, L., Gallagher J. S. and Kell. G. S. Hemisphere
Publishing Corp., Washington–New York–London.
Peng, L., Lin, L., Zhang, J., Zhuang, J., Zhang, B., Gong, Y. (2010). Catalytic
Conversion of Cellulose to Levulinic Acid by Metal Chlorides. Molecules,15,
5258-5272; doi:10.3390/molecules15085258
Pèrez, J., Munoz-Dorado, J., de la Rubia, T., & Martìnez, J. (2002). Biodegradation and
biological treatments of cellulose, hemicelluloses and lignin: An overview.
International Microbiology, 2(2), 53-63.
Peterson, A.A., Vogel, F., Lachance, R.P., Froling, M., Antal, J.M.J., & Tester, J.W.
(2008). Thermochemical Biofuel Production in Hydrothermal Media: A Review
of Sub- and Supercritical Water Technologies. Energy & Environmental Science,
Vol.1, No.1, 32-65, ISSN 1754-5692.
Pourali,O., Asghari, F.S. Yoshida, H. (2009). Sub-critical water treatment of rice bran
to produce valuable materials. Food Chemistry, 115, 1–7.
doi:10.1016/j.foodchem.2008.11.099
Rackemann, D. W., Doherty, W. O. (2011), The conversion of lignocellulosics to
levulinic acid. Biofuels, Bioprod. Bioref., 5: 198–214. doi: 10.1002/bbb.267
Reutemann, W. and Kieczka, H. (2000). Formic Acid. Ullmann's Encyclopedia of
Industrial Chemistry, Wiley-VCH, Weinheim. doi:10.1002/14356007.a12_013
Rosatella, A.A., Simeonov, S.P., Fradea, R.F.M., Carlos A. M. A. (2011). 5 –
Hydroxymethylfurfural (HMF) as a building block platform: Biological
properties, synthesis and synthetic applications Green Chem., 13, 754.

72
Saiki, T.; Karaiki, I.; Roy, K., Handbook of Agrocultural Engineering, Vol V, Energy
and Biomass Engineering (1999). Edited by Kitani O., American Society of
Agricultural Engineers, 139-164.
Sapkale, G. N., Patil, S. M., Surwase U. S. and. Bhatbhage, P. K. (2010). Supercritical
Fluid Extraction Int. J. Chem. Sci.: 8(2), 729-743.
Sasaki,M., Adschiri, T., Arai, K. (2003). Production of cellulose II from nativecellulose
bynear- and supercritical water solubilization. J.Agric.Food Chem., 51, 5376-
5381.
Schmieder, H. and Abeln, J. (1999), Supercritical Water Oxidation: State of the Art.
Chem. Eng. Technol., 22; 903–908. doi: 10.1002/(SICI)1521-
4125(199911)22:11<903::AID-CEAT903>3.0.CO;2-E
Sustainable Growth and Applications in Renewable Energy Sources. (2011). Edited by
Dr. Majid Nayeripour. In Tech. 209-338; ISBN 978-953-307-408-5
Shinya Y., Yukihiko M. (Eds.). (2008) The Asian Biomass Handbook. A Guide for
Biomass Production and Utilization. Japanese Institute of Energy.
Thompson, D.R.; Grethlein,H.E. (1979), Design and Evaluation of a Plug Flow Reactor
for Acid Hydrolysis of Cellulose. Industrial & Engineering Chemistry Product
Research and Development, 18, 166-169.
Toor, S.S., Rosendahl,S., Rudolf, A. (2011). Hydrothermal liquefaction of biomass: A
review of subcritical water technologies. Energy, 36, 2328-2342.
doi:10.1016/j.energy.2011.03.013
Veriansyah B., Kim J.D. (2007). Supercritical water oxidation for the destruction of
toxic organic wastewaters: A review, Journal of Environmental Sciences; 19,
513–522.
Werpy, T., Petersen, G., Aden, A., Bozell, J., Holladay, J., White, J., Manheim, A.,
Eliot, D., Lasure, L., Jones, S. Top value added chemicals from biomass. Volume
1- Results of screening for potential candidates from sugars and synthesis gas,
DTIC Document, 2004.
Willke, T., Vorlop, K.D. (2004) Industrial bioconversion of renewable resources as an
alternative to conventional chemistry. Appl. Microbiol. Biotechnol., 66, 131-142.
Williams, P. T., Onwudili, J. (2006). Subcritical and Supercritical Water Gasification of
Cellulose, Starch, Glucose, and Biomass Waste. Energy & Fuels, 20, 1259-1265.
doi: 10.1021/ef0503055
Yanik, J., Ebale, S., Kruse, A., Saglam, M., Yüksel, M., (2007) Biomass gasification in
supercritical water: Part 1. Effect of the nature of biomass. Fuel. 86, 2410-2415.

73
Yoon, H.H. (1998). Pretreatment of Lignocellulosic Biomass by Autohydrolysis and
Aqueous Ammonia Percolation. Korean J. Chem. Eng., 15(6), 631-636.
Zeng, W., Cheng, D. Zhang, H., Chen, F., Zhan, X. (2010). Dehydration of glucose to
levulinic acid over MFI-type zeolite in subcritical water at moderate conditions.
Reac Kinet Mech Cat, 100, 377–384. doi: 10.1007/s11144-010-0187-x
Zhang J. (2008). Hydrogen Production by Biomass Gasification in Supercritical Water.
“Energeia” 19(6). Editor M. McAlister. University of Kentucky, Center for
Applied Energy Research.