Embed Size (px)
Citation preview
Recent US Climate Change and Hydrology Literature Applicable to US Army Corps of Engineers Missions RIO GRANDE REGION 13
May 2015 FINAL
Climate Change Assessment for Water Resources Region 13 Rio Grande Region
USACE Institute for Water Resources 1 May 18, 2015
CLIMATE CHANGE AND HYDROLOGY LITERATURE SYNTHESIS FOR THE US
ARMY CORPS OF ENGINEERS MISSIONS IN THE UNITED STATES
RIO GRANDE REGION 13
May 18, 2015
CDM Smith
Contract # W912HQ-10-D-0004, Task Order 147
Edited by:
Kathleen D. White PhD, PE, Institute for Water Resources - US Army Corps of Engineers
Jeffrey R. Arnold, PhD, Institute for Water Resources - US Army Corps of Engineers
Prepared by:
Ariane Pinson, PhD, Albuquerque District - US Army Corps of Engineers
Chris Kurtz, PE, CDM Smith
Tim Cox, PhD, PE, CDM Smith
Frannie Bui, PE, CDM Smith
Lauren Klonsky, PE, CDM Smith
Lauren Miller, CDM Smith
Rebecca Jablon, AICP, LEED AP, CDM Smith
Quentin Smith, CDM Smith
Tim Feather, PhD, CDM Smith
Mark Dunning, PhD, CDM Smith
Larry Banks, CDM Smith
David Spector, CDM Smith
VIEWS, OPINIONS, AND/OR FINDINGS CONTAINED IN THIS REPORT SHOULD NOT
BE CONSTRUED AS AN OFFICIAL DEPARTMENT OF THE ARMY POSITION, POLICY,
OR DECISION UNLESS SO DESIGNATED BY OTHER OFFICIAL DOCUMENTATION.
Suggested Citation:
USACE (2015). Recent US Climate Change and Hydrology Literature Applicable to US Army
Corps of Engineers Missions – Water Resources Region 13, Rio Grande. Civil Works Technical
Report, CWTS 2015-11, USACE, Washington, DC

Climate Change Assessment for Water Resources Region 13 Rio Grande Region
USACE Institute for Water Resources 2 May 18, 2015
Table of Contents
Water Resources Region 13: Rio Grande ............................................................. 3
1. Introduction ....................................................................................................................... 3
1.1. A Note on the 2-digit HUC Scale ................................................................................. 6
2. Observed Climate Trends ................................................................................................ 6
2.1. Temperature .................................................................................................................. 8
2.2. Precipitation ................................................................................................................ 14
2.3. Hydrology ................................................................................................................... 20
2.4. Summary of Observed Climate Findings ................................................................... 22
3. Projected Climate Trends .............................................................................................. 23
3.1. Temperature ................................................................................................................ 24
3.2. Precipitation ................................................................................................................ 31
3.3. Hydrology ................................................................................................................... 35
3.4. Summary of Future Climate Projection Findings ....................................................... 41
4. Business Line Vulnerabilities ......................................................................................... 43
Appendix A: References Climate/Hydrology Summary Table .......................................... 46
Appendix B: Reference List ................................................................................................... 46
Climate Change Assessment for Water Resources Region 13 Rio Grande Region
USACE Institute for Water Resources 3 May 18, 2015
Water Resources Region 13: Rio Grande
1. Introduction
U.S. Army Corps of Engineers (USACE) staff are increasingly considering potential climate
change impacts when undertaking long-term planning, setting priorities, and making decisions
that affect resources, programs, policies, and operations, consistent with the 2011 and 2014
policy statements on climate change adaptation by the Assistant Secretary of the Army for Civil
Works, the USACE Climate Change Adaptation Plans, and agency policy and guidance. USACE
is undertaking its climate change preparedness and resilience planning and implementation in
consultation with internal and external experts using the best available – and actionable – climate
science and climate change information. This report represents one component of actionable
science, in the form of concise and broadly-accessible summaries of the current science with
specific attention to USACE missions and operations. This report is part of a series of twenty one
(21) regional climate syntheses prepared by the USACE under the leadership of the Response to
Climate Change Program at the scale of 2-digit U.S. Geological Survey (USGS) Hydrologic
Unit Codes (HUC) across the continental United States, Alaska, Hawaii, and Puerto Rico. The
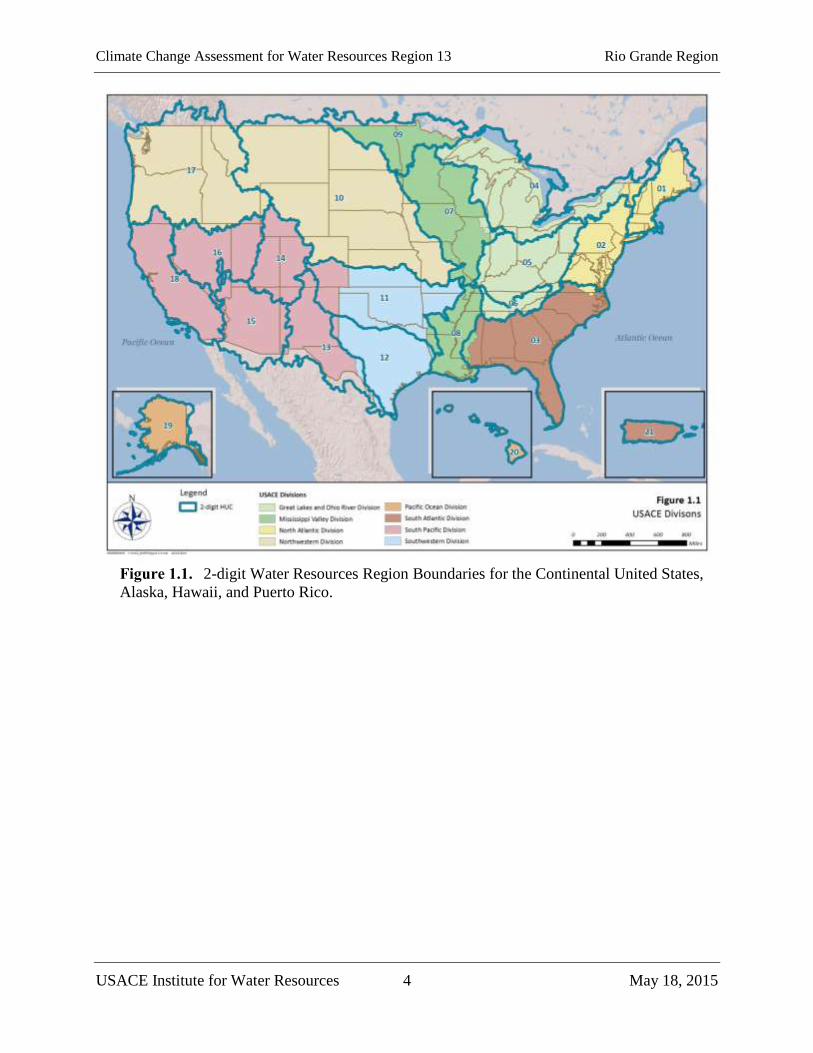
twenty one Water Resources Regions included in this series of reports is shown in Figure 1.1
along with USACE division boundaries. Each of these regional reports summarizes observed and
projected climate and hydrological patterns cited in reputable peer-reviewed literature and
authoritative national and regional reports, and characterizes climate threats to USACE business
lines. They also provide context and linkage to other agency resources for climate resilience
planning, such as sea level change calculation and coastal risk reduction resources, downscaled
climate data for subregions, and watershed vulnerability assessment tools.
This report focuses on Water Resources Region 13, the Rio Grande Region, the boundaries for
which are shown in Figure 1.2. The region encompasses portions of the Albuquerque and Fort
Worth USACE districts.
Climate Change Assessment for Water Resources Region 13 Rio Grande Region
USACE Institute for Water Resources 4 May 18, 2015
Figure 1.1. 2-digit Water Resources Region Boundaries for the Continental United States,
Alaska, Hawaii, and Puerto Rico.

Climate Change Assessment for Water Resources Region 13 Rio Grande Region
USACE Institute for Water Resources 5 May 18, 2015
Figure 1.2. Water Resources Region 13: Rio Grande Region Boundary.
Climate Change Assessment for Water Resources Region 13 Rio Grande Region
USACE Institute for Water Resources 6 May 18, 2015
1.1. A Note on the Water Resources Region Scale
USACE and other resource management agencies require reliable, science-based methods for
incorporating climate change information into the assessments that support water resources
decisions and actions. Such planning assessments must quantify projections of future climate and
hydrology. One common practice is to begin by developing relationships between the currently
observed climate and the projected future possible climate over the assessment region.
However, the numerical models producing these multiple projections of future possible climate
were not designed to support these assessments for local-to-regional scale operations. This
means that intervening steps have to be taken to correct obvious biases in the models' outputs
and to make the outputs relevant at the scales where hydrologic resource assessments can take
place. The commonly used name for these post-processing steps is "downscaling" because one
step is using one or another method to spatially (and temporally) disaggregate or interpolate the
results produced at the numerical climate models' native scale to the scale of the water resources
assessment. The current generation of climate models, which includes the models used to
generate some of the inputs described in this work, have a native scale on the order of one to two
hundred kilometers on each side of the grids used to simulate climate for Earth, substantially too
coarse for the watershed assessments needed to inform resource assessment questions and
decisions.
On the other hand, these questions and decisions should not be addressed with model inputs at
scales so fine that they impart false precision to the assessment. False precision would appear by
suggesting that the driving climate model information can usefully be downscaled, by any
method, to individual river reaches and particular project locations, for example.
The approach at USACE is to consider the questions in need of climate change information at the
geospatial scale where the driving climate models retain the climate change signal. At present,
USACE judges that the regional, sub-continental climate signals projected by the driving climate
models are coherent and useful at the scale of the 2-digit HUC (Water Resources Region), and
that confidence in the driving climate model outputs declines below the level of a reasonable
trade-off between precision and accuracy for areas smaller than the watershed scale of the 4-digit
HUC (Water Resources Subregion). Hence, these summaries group information at the Water
Resources Region scale both to introduce relevant climate change literature and to support the
vulnerability assessment USACE is conducting at the Water Resources Subregion scale. For
Water Resources Region 13, both the 2-digit and 4-digit HUC boundaries are shown in Figure
1.2.
2. Observed Climate Trends
Observed climate trends within Water Resources Region 13 are presented in this section to
generally characterize current, or past, climate in the study region. While the primary cause for
global warming is attributed by the scientific community to human-induced increases in
atmosphere levels of heat-trapping gases (Walsh et al., 2014), this section is not focused on
attribution or cause (either natural or unnatural). Rather, it is specifically focused on the
identification and detection of climate trends in the recent historical record. The

Climate Change Assessment for Water Resources Region 13 Rio Grande Region
USACE Institute for Water Resources 7 May 18, 2015
interrelationships of Earth’s climate systems are complex and influenced by multiple natural and
unnatural (i.e., anthropogenic greenhouse gas emissions) forcings. When additional detail is
needed, the reader is referred to the specific references cited, including the third National
Climate Assessment (NCA), which includes not only regional assessments, but also foundational
resources related to climate science literacy.
The climate trends presented in this section are based on peer-reviewed literature on the subject
of observed climate. To the extent possible, studies specific to Water Resources Region 13 or its
sub-watersheds were relied upon. A focus is placed on identified primary variables including:
mean temperature
extreme temperatures
average precipitation
extreme precipitation events
mean streamflow
In addition to primary variables, peer-reviewed literature addressing climate change within the
geographic region of Water Resources Region 13 (fully or partially) revealed additional,
secondary, climatic variables that have been studied such as the spring index (SI), drought
indices, and soil moisture.
The Rio Grande Region is topographically and geographically diverse. The Rio Grande Region
can be divided into two parts: the Upper Rio Grande (above Elephant Butte Dam) and the Lower
Rio Grande (Elephant Butte Dam to the Gulf of Mexico). The Upper Rio Grande is snowmelt
dominated, with smaller, flashy late-summer storm flows; the Lower Rio Grande is operated for
irrigation with spring runoff held at Elephant Butte Reservoir (and adjoining Caballo Reservoir)
in southern New Mexico for irrigation season use by Texas. Flows in the Lower Rio Grande are
supplemented by flows from the Rio Conchas, Mexico, where flood flows result primarily from
summer rainfall events. The complex topography of the region juxtaposes much cooler, humid
high elevation climates with warmer, more arid lowland climates. Latitude is also important,
with winter limited winter precipitation south of Albuquerque, while contributing a large share of
the annual total in the mountain headwaters areas of northern New Mexico and southern
Colorado.
The major controls on inter-annual variation in temperature and precipitation in the Rio Grande
Region are imperfectly understood. Winter precipitation, in areas receiving any, is affected by
sub-decadal scale variations in El Niño-Southern Oscillation, which refers to cyclical patterns of
sea surface temperature and air pressure in the tropical Pacific that controls the availability of
warm surface waters to serve as sources of atmospheric moisture in the eastern Pacific. In El
Niño years, warm sea temperatures encourage increased winter precipitation and the formation
of large snow packs; in La Niña years, cool sea surface temperatures in the tropical eastern
Pacific reduce the availability of atmospheric moisture to the Southwest, resulting in low winter
precipitation and small snow packs (Sheppard et al., 2002).
Multidecadal changes in Pacific Ocean temperatures known as the Pacific Decadal Oscillation
(PDO) can enhance or suppress the effects of El Niño and La Niña, particularly in concert with
changes in Atlantic sea surface temperatures (McCabe et al., 2004). Controls on the interannual
variability of the North American Monsoon are imperfectly understood, but relate in part to the
Climate Change Assessment for Water Resources Region 13 Rio Grande Region
USACE Institute for Water Resources 8 May 18, 2015
intensity of surface heating during the summer and the amount of available moisture in source
areas of the Gulf of Mexico and the tropical eastern Pacific. Likewise, the number and intensity
of hurricanes in any given season, and the likely distribution of their landfall has proved elusive
to predict.
Trends and observations have varying coverage over the region and therefore, the results from
the studies presented herein are limited. From the studies that cover the region, the results
presented below indicate an increasing trend in temperature for the Rio Grande Region.
However, clear consensus does not exist for precipitation trends. Additionally, studies of
regional streamflow reviewed here present a slight decreasing trend in streamflow, but overall
literature consensus was also low.
2.1. Temperature
A number of studies focusing on observed trends in historical temperatures were reviewed for
this report. These include both national scale studies inclusive of results relevant to the Rio
Grande Region and studies focused more specifically and exclusively on the region. Some
national studies have sparse data coverage or are limited by topographical diversity and therefore
lack truly representative findings for the Rio Grande Region. Those studies are included and are
noted as such. Results from both national and regional types of studies are discussed below.
At a national scale, a 2009 study by Wang et al. examined historical climate trends across the
continental United States. Gridded (0.5 degrees x 0.5 degrees) mean monthly climate data for the
period 1950 – 2000 were used. The focus of this work was on the link between observed
seasonality and regionality of trends and sea surface temperature variability. The authors
identified positive statistically significant trends in recent observed seasonal mean surface air
temperature for most of the U.S. (Figure 2.1). For the Rio Grande Region, no such trend is
identified for the region in the winter (December-February), a slight warming trend in the spring
(March-May), while a slight cooling trend is shown for the summer (June-August) and fall
(September-November) with an exception at the mouth of the Rio Grande River. The authors do
not provide information on statistical significance of the presented observed trends. A later study
by Westby et al. (2013), using data from the period 1949 – 2011, presented similar findings,
presenting both increasing and decreasing trends for the same portions of the region for this time
period (Figure 2.2). Their cooling trend, however, was not statistically significant at a 95%
confidence interval (C.I.).

Climate Change Assessment for Water Resources Region 13 Rio Grande Region
USACE Institute for Water Resources 9 May 18, 2015
Figure 2.1. Linear trends in surface air temperature (a) and precipitation (b) over the United
States, 1950 – 2000. The Rio Grande Region is within the black oval (Wang et al., 2009).
Figure 2.2. Mean winter (December through February) temperature trends from 1949 – 2011
(K/year). Black contours indicate statistical significance at the 95% confidence level. The
Rio Grande Region is within the red oval (Westby et al., 2013).
Climate Change Assessment for Water Resources Region 13 Rio Grande Region
USACE Institute for Water Resources 10 May 18, 2015
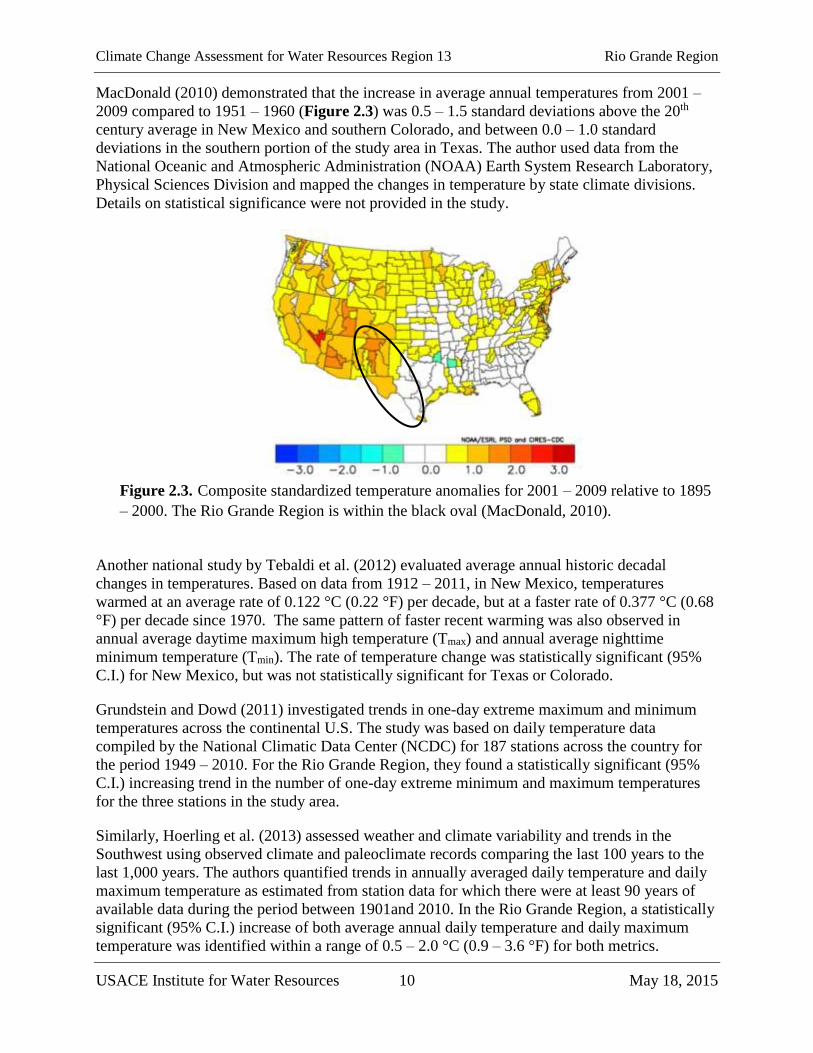
MacDonald (2010) demonstrated that the increase in average annual temperatures from 2001 –
2009 compared to 1951 – 1960 (Figure 2.3) was 0.5 – 1.5 standard deviations above the 20th
century average in New Mexico and southern Colorado, and between 0.0 – 1.0 standard
deviations in the southern portion of the study area in Texas. The author used data from the
National Oceanic and Atmospheric Administration (NOAA) Earth System Research Laboratory,
Physical Sciences Division and mapped the changes in temperature by state climate divisions.
Details on statistical significance were not provided in the study.
Figure 2.3. Composite standardized temperature anomalies for 2001 – 2009 relative to 1895
– 2000. The Rio Grande Region is within the black oval (MacDonald, 2010).
Another national study by Tebaldi et al. (2012) evaluated average annual historic decadal
changes in temperatures. Based on data from 1912 – 2011, in New Mexico, temperatures
warmed at an average rate of 0.122 °C (0.22 °F) per decade, but at a faster rate of 0.377 °C (0.68
°F) per decade since 1970. The same pattern of faster recent warming was also observed in
annual average daytime maximum high temperature (Tmax) and annual average nighttime
minimum temperature (Tmin). The rate of temperature change was statistically significant (95%
C.I.) for New Mexico, but was not statistically significant for Texas or Colorado.
Grundstein and Dowd (2011) investigated trends in one-day extreme maximum and minimum
temperatures across the continental U.S. The study was based on daily temperature data
compiled by the National Climatic Data Center (NCDC) for 187 stations across the country for
the period 1949 – 2010. For the Rio Grande Region, they found a statistically significant (95%
C.I.) increasing trend in the number of one-day extreme minimum and maximum temperatures
for the three stations in the study area.
Similarly, Hoerling et al. (2013) assessed weather and climate variability and trends in the
Southwest using observed climate and paleoclimate records comparing the last 100 years to the
last 1,000 years. The authors quantified trends in annually averaged daily temperature and daily
maximum temperature as estimated from station data for which there were at least 90 years of
available data during the period between 1901and 2010. In the Rio Grande Region, a statistically
significant (95% C.I.) increase of both average annual daily temperature and daily maximum
temperature was identified within a range of 0.5 – 2.0 °C (0.9 – 3.6 °F) for both metrics.
Climate Change Assessment for Water Resources Region 13 Rio Grande Region
USACE Institute for Water Resources 11 May 18, 2015
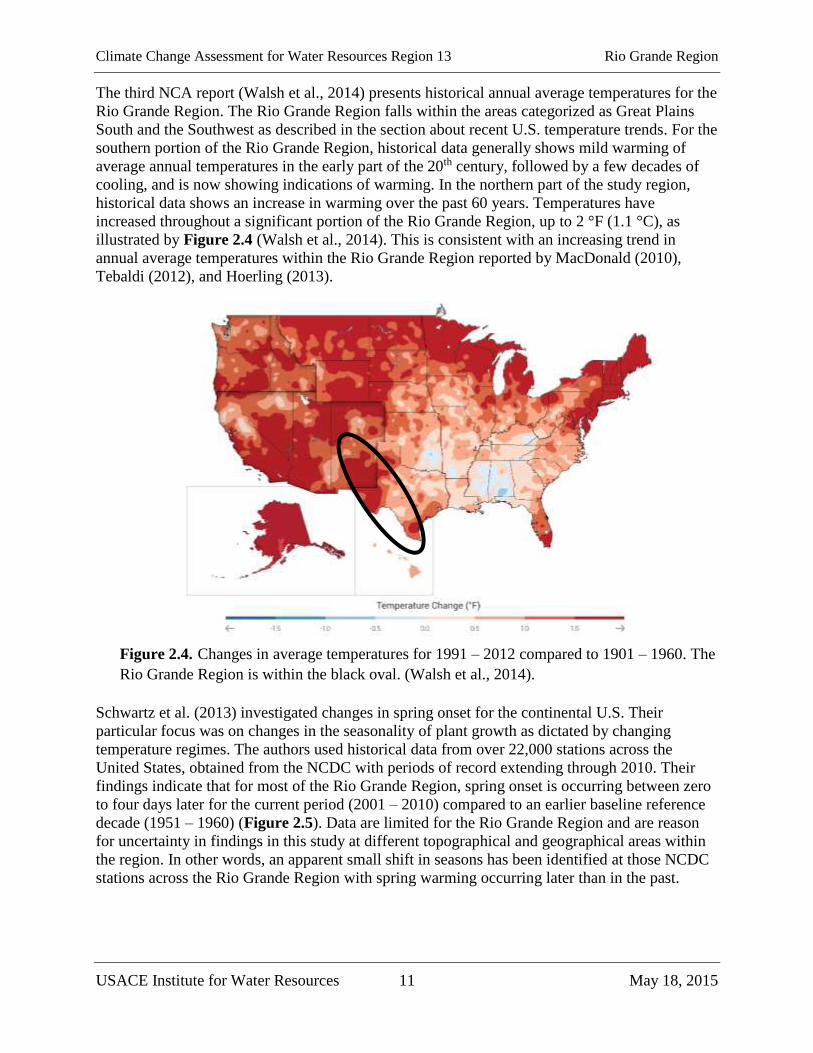
The third NCA report (Walsh et al., 2014) presents historical annual average temperatures for the
Rio Grande Region. The Rio Grande Region falls within the areas categorized as Great Plains
South and the Southwest as described in the section about recent U.S. temperature trends. For the
southern portion of the Rio Grande Region, historical data generally shows mild warming of
average annual temperatures in the early part of the 20th century, followed by a few decades of
cooling, and is now showing indications of warming. In the northern part of the study region,
historical data shows an increase in warming over the past 60 years. Temperatures have
increased throughout a significant portion of the Rio Grande Region, up to 2 °F (1.1 °C), as
illustrated by Figure 2.4 (Walsh et al., 2014). This is consistent with an increasing trend in
annual average temperatures within the Rio Grande Region reported by MacDonald (2010),
Tebaldi (2012), and Hoerling (2013).
Figure 2.4. Changes in average temperatures for 1991 – 2012 compared to 1901 – 1960. The
Rio Grande Region is within the black oval. (Walsh et al., 2014).
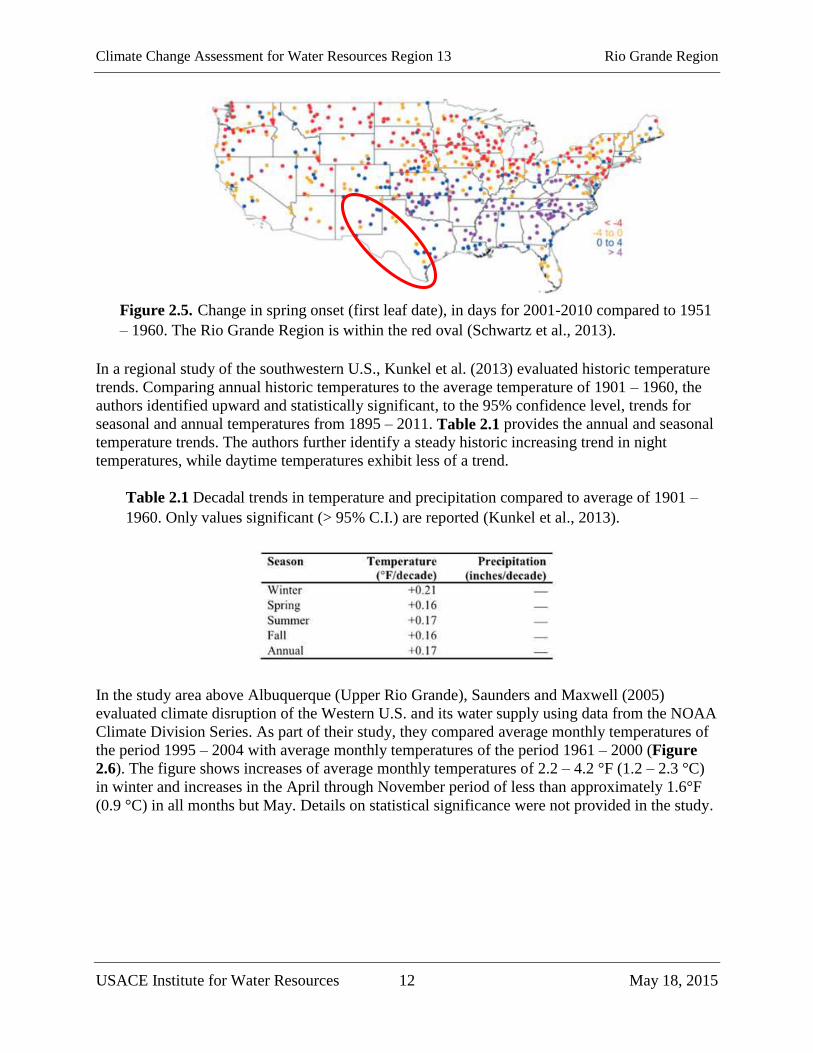
Schwartz et al. (2013) investigated changes in spring onset for the continental U.S. Their
particular focus was on changes in the seasonality of plant growth as dictated by changing
temperature regimes. The authors used historical data from over 22,000 stations across the
United States, obtained from the NCDC with periods of record extending through 2010. Their
findings indicate that for most of the Rio Grande Region, spring onset is occurring between zero
to four days later for the current period (2001 – 2010) compared to an earlier baseline reference
decade (1951 – 1960) (Figure 2.5). Data are limited for the Rio Grande Region and are reason
for uncertainty in findings in this study at different topographical and geographical areas within
the region. In other words, an apparent small shift in seasons has been identified at those NCDC
stations across the Rio Grande Region with spring warming occurring later than in the past.
Climate Change Assessment for Water Resources Region 13 Rio Grande Region
USACE Institute for Water Resources 12 May 18, 2015
Figure 2.5. Change in spring onset (first leaf date), in days for 2001-2010 compared to 1951
– 1960. The Rio Grande Region is within the red oval (Schwartz et al., 2013).
In a regional study of the southwestern U.S., Kunkel et al. (2013) evaluated historic temperature
trends. Comparing annual historic temperatures to the average temperature of 1901 – 1960, the
authors identified upward and statistically significant, to the 95% confidence level, trends for
seasonal and annual temperatures from 1895 – 2011. Table 2.1 provides the annual and seasonal
temperature trends. The authors further identify a steady historic increasing trend in night
temperatures, while daytime temperatures exhibit less of a trend.
Table 2.1 Decadal trends in temperature and precipitation compared to average of 1901 –
1960. Only values significant (> 95% C.I.) are reported (Kunkel et al., 2013).
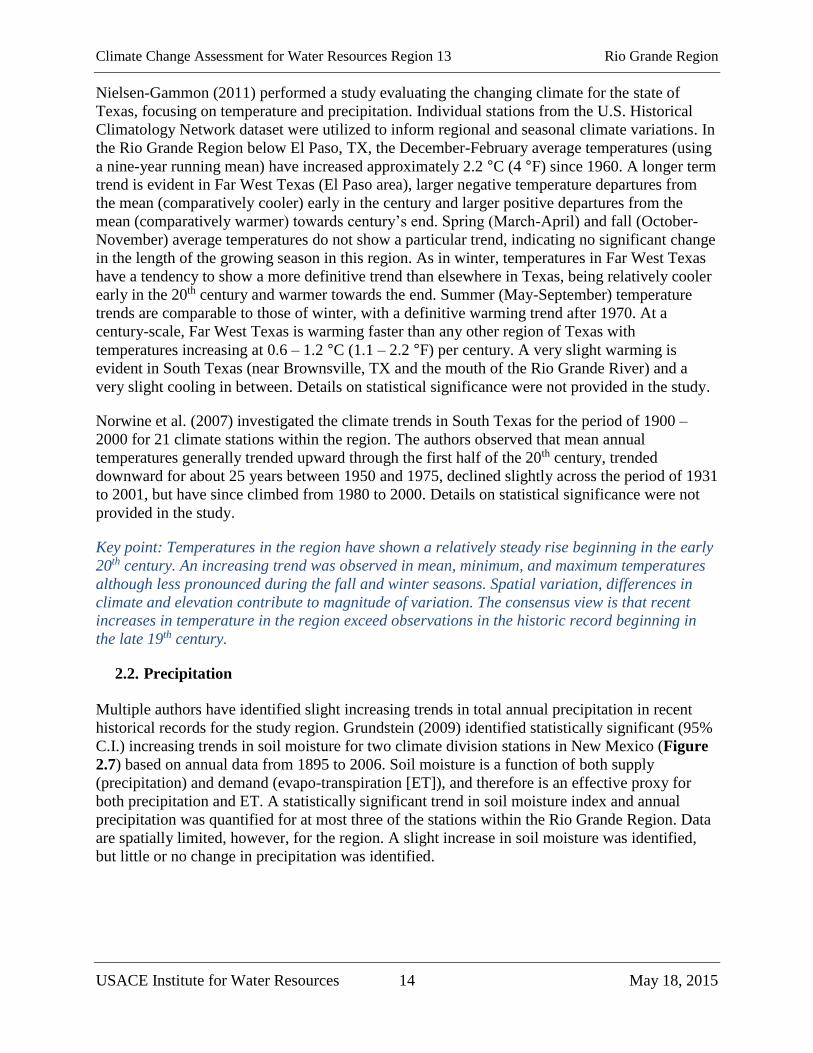
In the study area above Albuquerque (Upper Rio Grande), Saunders and Maxwell (2005)
evaluated climate disruption of the Western U.S. and its water supply using data from the NOAA
Climate Division Series. As part of their study, they compared average monthly temperatures of
the period 1995 – 2004 with average monthly temperatures of the period 1961 – 2000 (Figure
2.6). The figure shows increases of average monthly temperatures of 2.2 – 4.2 °F (1.2 – 2.3 °C)
in winter and increases in the April through November period of less than approximately 1.6°F
(0.9 °C) in all months but May. Details on statistical significance were not provided in the study.

Climate Change Assessment for Water Resources Region 13 Rio Grande Region
USACE Institute for Water Resources 13 May 18, 2015
Figure 2.6. Average monthly temperatures in 1995 – 2004, compared to historical average
monthly temperatures in 1961 – 1990 (Saunders and Maxwell, 2005).
Rates of warming in high elevation areas may be considerably greater than the regional average.
Rangwala and Miller (2010) used data from the National Weather Service and the US
Department of Agriculture (USDA) Natural Resource Conservation Service Snowpack
Telemetry (SNOTEL) in the San Juan Mountains within the Upper Rio Grande Region. They
detected a rate of warming (90% C.I.) of 1°C (1.8°F) between 1895 and 2005 with most of the
warming occurring between 1990 and 2005.
In the adjacent San Luis Valley, a regional analysis of annual average temperatures identified an
increase (C.I. >95%) of 1.1 °C (1.9 °F) for the period 1957 – 2006. Temperature trends were
presented in 30-, 50-, and 75-year time periods, when available, across the state of Colorado
(Ray et al., 2008). A study by Mix et al. (2012) presented information on the San Luis Valley
with temperature data from seven climate stations by focusing on the growing season and related
monthly temperatures. Increases in daily mean, maximum, and minimum temperature were
approximately 0.3 – 1.4 °C (0.5 – 2.5 °F), 0.3 – 1.7 °C (0.5 – 3 °F), and 0.5 – 1.6 °C (0.9 – 2.9
°F), respectively. The temperature increases (95% C.I.) occurred at nearly all of the study
stations for each month within the growing season.
A 2013 study performed by the USACE Albuquerque District analyzed climate trends for the
Upper Rio Grande Region above the Elephant Butte Dam, NM. For the period 1971 – 2012, long
term trends in temperature in the study area showed an average rate of increase (90% C.I.) of
0.35 °C (0.63 °F) per decade on a regional scale. Data indicated a faster increase in nighttime
minimum temperatures (Tmin) of 0.37 °C (0.67 °F) per decade, and a slower increase in daytime
maximum temperatures (Tmax) of 0.25 °C (0.45 °F). The study showed that while daytime and
nighttime warming were approximately similar in low elevation areas, daytime warming was low
and nighttime warming was pronounced in high elevation mountain settings, which are critical
for snowpack accumulation. The study also divided temperature data into two time periods: 1971
– 2000 vs. 2001 – 2012 and showed that the rate of warming of Tmin and Tmax in mountainous
settings has doubled over time, while the rate of warming in low elevation settings has slowed.
Climate Change Assessment for Water Resources Region 13 Rio Grande Region
USACE Institute for Water Resources 14 May 18, 2015
Nielsen-Gammon (2011) performed a study evaluating the changing climate for the state of
Texas, focusing on temperature and precipitation. Individual stations from the U.S. Historical
Climatology Network dataset were utilized to inform regional and seasonal climate variations. In
the Rio Grande Region below El Paso, TX, the December-February average temperatures (using
a nine-year running mean) have increased approximately 2.2 °C (4 °F) since 1960. A longer term
trend is evident in Far West Texas (El Paso area), larger negative temperature departures from
the mean (comparatively cooler) early in the century and larger positive departures from the
mean (comparatively warmer) towards century’s end. Spring (March-April) and fall (October-
November) average temperatures do not show a particular trend, indicating no significant change
in the length of the growing season in this region. As in winter, temperatures in Far West Texas
have a tendency to show a more definitive trend than elsewhere in Texas, being relatively cooler
early in the 20th century and warmer towards the end. Summer (May-September) temperature
trends are comparable to those of winter, with a definitive warming trend after 1970. At a
century-scale, Far West Texas is warming faster than any other region of Texas with
temperatures increasing at 0.6 – 1.2 °C (1.1 – 2.2 °F) per century. A very slight warming is
evident in South Texas (near Brownsville, TX and the mouth of the Rio Grande River) and a
very slight cooling in between. Details on statistical significance were not provided in the study.
Norwine et al. (2007) investigated the climate trends in South Texas for the period of 1900 –
2000 for 21 climate stations within the region. The authors observed that mean annual
temperatures generally trended upward through the first half of the 20th century, trended
downward for about 25 years between 1950 and 1975, declined slightly across the period of 1931
to 2001, but have since climbed from 1980 to 2000. Details on statistical significance were not
provided in the study.
Key point: Temperatures in the region have shown a relatively steady rise beginning in the early
20th century. An increasing trend was observed in mean, minimum, and maximum temperatures
although less pronounced during the fall and winter seasons. Spatial variation, differences in
climate and elevation contribute to magnitude of variation. The consensus view is that recent
increases in temperature in the region exceed observations in the historic record beginning in
the late 19th century.
2.2. Precipitation
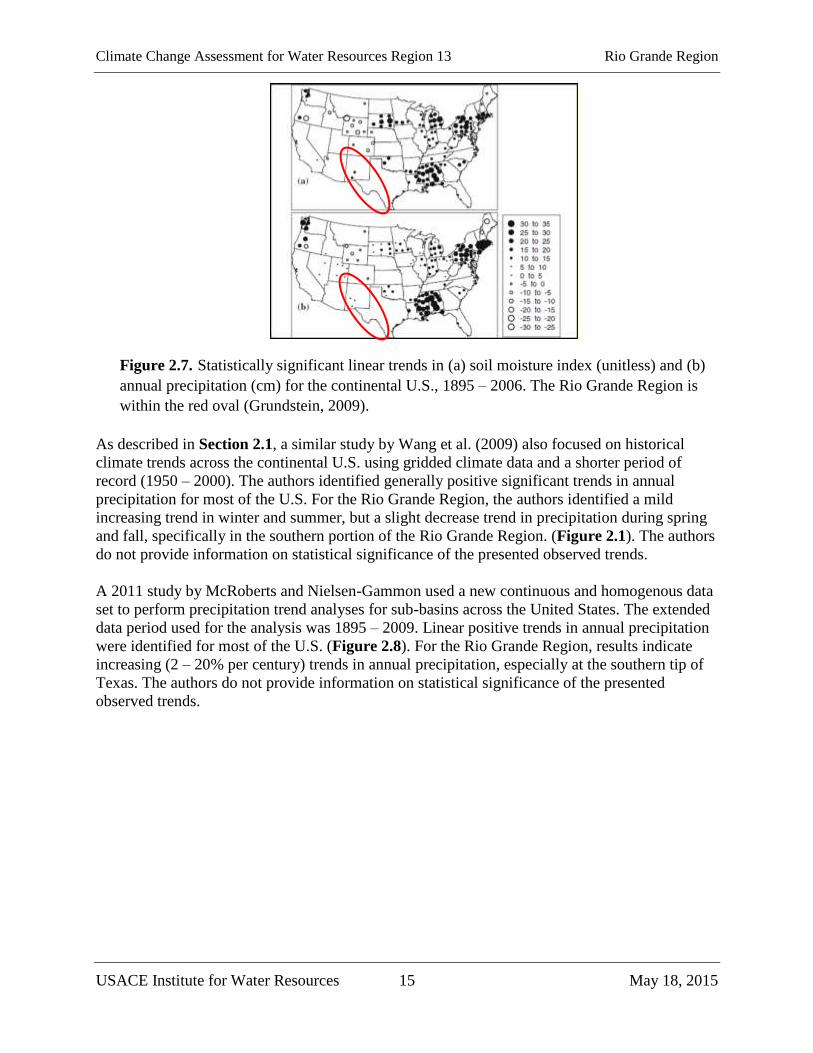
Multiple authors have identified slight increasing trends in total annual precipitation in recent
historical records for the study region. Grundstein (2009) identified statistically significant (95%
C.I.) increasing trends in soil moisture for two climate division stations in New Mexico (Figure
2.7) based on annual data from 1895 to 2006. Soil moisture is a function of both supply
(precipitation) and demand (evapo-transpiration [ET]), and therefore is an effective proxy for
both precipitation and ET. A statistically significant trend in soil moisture index and annual
precipitation was quantified for at most three of the stations within the Rio Grande Region. Data
are spatially limited, however, for the region. A slight increase in soil moisture was identified,
but little or no change in precipitation was identified.
Climate Change Assessment for Water Resources Region 13 Rio Grande Region
USACE Institute for Water Resources 15 May 18, 2015
Figure 2.7. Statistically significant linear trends in (a) soil moisture index (unitless) and (b)
annual precipitation (cm) for the continental U.S., 1895 – 2006. The Rio Grande Region is
within the red oval (Grundstein, 2009).
As described in Section 2.1, a similar study by Wang et al. (2009) also focused on historical
climate trends across the continental U.S. using gridded climate data and a shorter period of
record (1950 – 2000). The authors identified generally positive significant trends in annual
precipitation for most of the U.S. For the Rio Grande Region, the authors identified a mild
increasing trend in winter and summer, but a slight decrease trend in precipitation during spring
and fall, specifically in the southern portion of the Rio Grande Region. (Figure 2.1). The authors
do not provide information on statistical significance of the presented observed trends.
A 2011 study by McRoberts and Nielsen-Gammon used a new continuous and homogenous data
set to perform precipitation trend analyses for sub-basins across the United States. The extended
data period used for the analysis was 1895 – 2009. Linear positive trends in annual precipitation
were identified for most of the U.S. (Figure 2.8). For the Rio Grande Region, results indicate
increasing (2 – 20% per century) trends in annual precipitation, especially at the southern tip of
Texas. The authors do not provide information on statistical significance of the presented
observed trends.
Climate Change Assessment for Water Resources Region 13 Rio Grande Region
USACE Institute for Water Resources 16 May 18, 2015
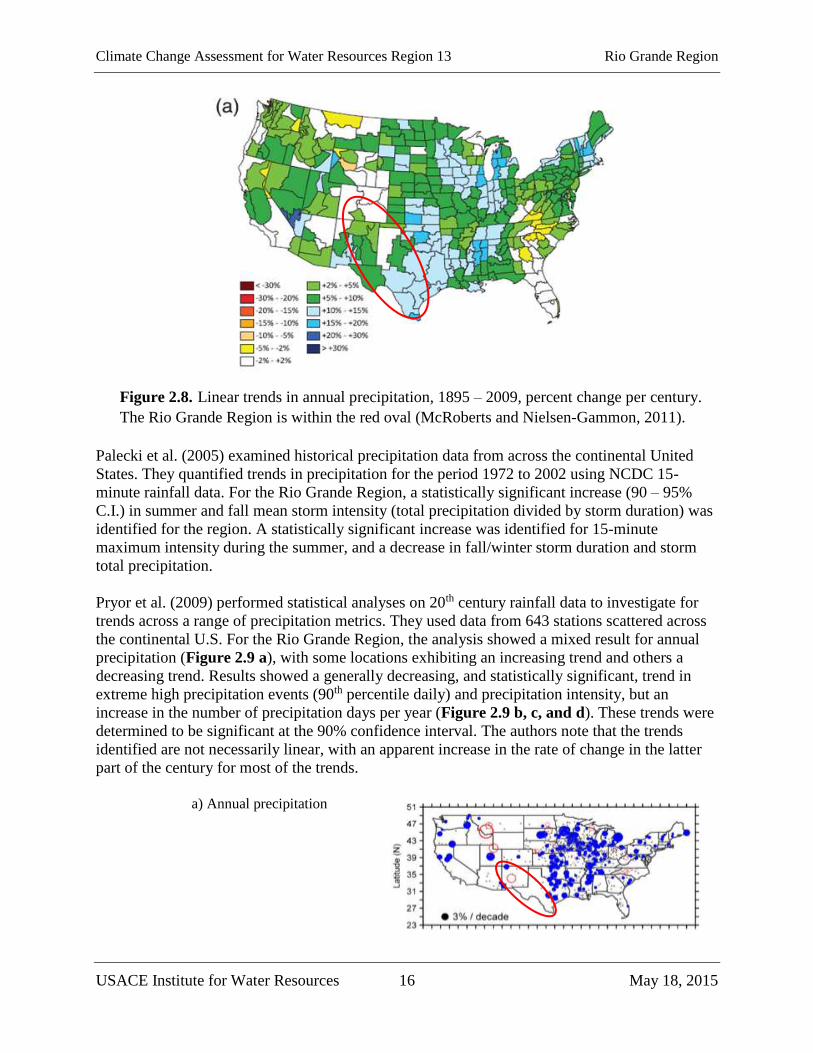
Figure 2.8. Linear trends in annual precipitation, 1895 – 2009, percent change per century.
The Rio Grande Region is within the red oval (McRoberts and Nielsen-Gammon, 2011).
Palecki et al. (2005) examined historical precipitation data from across the continental United
States. They quantified trends in precipitation for the period 1972 to 2002 using NCDC 15-
minute rainfall data. For the Rio Grande Region, a statistically significant increase (90 – 95%
C.I.) in summer and fall mean storm intensity (total precipitation divided by storm duration) was
identified for the region. A statistically significant increase was identified for 15-minute
maximum intensity during the summer, and a decrease in fall/winter storm duration and storm
total precipitation.
Pryor et al. (2009) performed statistical analyses on 20th century rainfall data to investigate for
trends across a range of precipitation metrics. They used data from 643 stations scattered across
the continental U.S. For the Rio Grande Region, the analysis showed a mixed result for annual
precipitation (Figure 2.9 a), with some locations exhibiting an increasing trend and others a
decreasing trend. Results showed a generally decreasing, and statistically significant, trend in
extreme high precipitation events (90th percentile daily) and precipitation intensity, but an
increase in the number of precipitation days per year (Figure 2.9 b, c, and d). These trends were
determined to be significant at the 90% confidence interval. The authors note that the trends
identified are not necessarily linear, with an apparent increase in the rate of change in the latter
part of the century for most of the trends.
a) Annual precipitation

Climate Change Assessment for Water Resources Region 13 Rio Grande Region
USACE Institute for Water Resources 17 May 18, 2015
b) 90th percentile daily
precipitation
c) Precipitation intensity
(annual total / number of
precipitation days)
d) Number of precipitation
days per year
Figure 2.9. Historical precipitation trends (20th century) in a) annual totals, b) 90th percentile
daily, c) precipitation intensity (annual total/number of precipitation days), and d) number of
precipitation days per year. Note that blue dots indicate positive trend, red circles indicate
negative trend, and symbol sizes are scaled to 3% change per decade. The Rio Grande
Region is within the red oval (Pryor et al., 2009).
Changes in extreme precipitation events observed in recent historical data have been the focus of
a number of studies. Studies of extreme events have focused on intensity, frequency, and/or
duration of such events. Wang and Zhang (2008) used recent historical data and downscaled
Global Climate Models (GCMs) to investigate changes in extreme precipitation across North
America. They focused specifically on the changes in the frequency of the 20-year maximum
daily precipitation event. The authors looked at both historical trends in observed data and trends
in future projections. Statistically significant increases in the frequency of the 20-year storm
event were quantified across the southern and central U.S., in both the recent historical data and
the long term future projections (described below). For the Rio Grande Region, there appears to
be a significant change in the recurrence of this type of storm event for the period 1977 – 1999
compared to the period 1949 – 1976. The occurrence of daily precipitation at the 20-year return
level has been doubled between the two time periods for the central portion of the Rio Grande
Region.
Villarini et al. (2013) identified statistically significant (p < 0.05) increasing trends in the
frequency of occurrence of heavy rainfall in a region inclusive of the Rio Grande Region for
multiple climate stations with at least 50 years of historical record. While significant trends were

Climate Change Assessment for Water Resources Region 13 Rio Grande Region
USACE Institute for Water Resources 18 May 18, 2015
identified for a number of stations in the region, an even greater number of stations in the Rio
Grande Region exhibited no significant trends.
Since 2001, large portions of the southwest and west Texas have experienced drought, with
particularly widespread and severe drying in 2002, 2003, 2007, 2009, 2011 and 2012. The
authors identify a general, but episodic, decline in regional participation (Figure 2.10a). During
these extremes, precipitation in the Rio Grande Region ranged from 20% below the 20th century
average in the Upper Rio Grande to 10% above the average in the Lower Rio Grande
(MacDonald, 2010). Similar in interpretation, the mean regional Palmer Drought Severity Index
(PDSI) was lower than average in the Upper Rio Grande versus the Lower Rio Grande region,
but that in West Texas, there was minimal departure from the average (Figure 2.10b). The
author used data from the NOAA Earth System Research Laboratory, Physical Sciences Division
to map spatial and temporal contexts of drought across the U.S. Details on statistical significance
are not provided.
a) Annual precipitation
b) Mean PDSI
Figure 2.10. a) Composite standardized precipitation anomalies for 2001-2009 relative to
1895-2000. b) mean PDSI value for the period 2001-2009. The Rio Grande Region is within
the black oval (MacDonald, 2010).
Trends in the frequency and severity of droughts in the southern U.S. were the subject of studies
by Chen et al. (2012) and Cook et al. (2014). In the first study, historical data (1895 – 2007)
were used to identify trends in drought, as defined by the standard precipitation index (SPI). The
SPI is a metric of precipitation only and neglects the impacts of ET on droughts (Chen et al.,
2012). The authors were not able to identify significant trends in the frequency, intensity, or
duration of droughts in the study region. The second set of authors used tree ring data to assess
the frequency and severity of droughts over the past millennium (1000 – 2005), across the U.S.
For the southwest region, which includes a portion of the Rio Grande Region, the authors
identified a decline in the number of droughts per century, although the finding is not considered
a statistically significant (p = 0.11) decline in drought frequency (droughts per century) over the
Climate Change Assessment for Water Resources Region 13 Rio Grande Region
USACE Institute for Water Resources 19 May 18, 2015
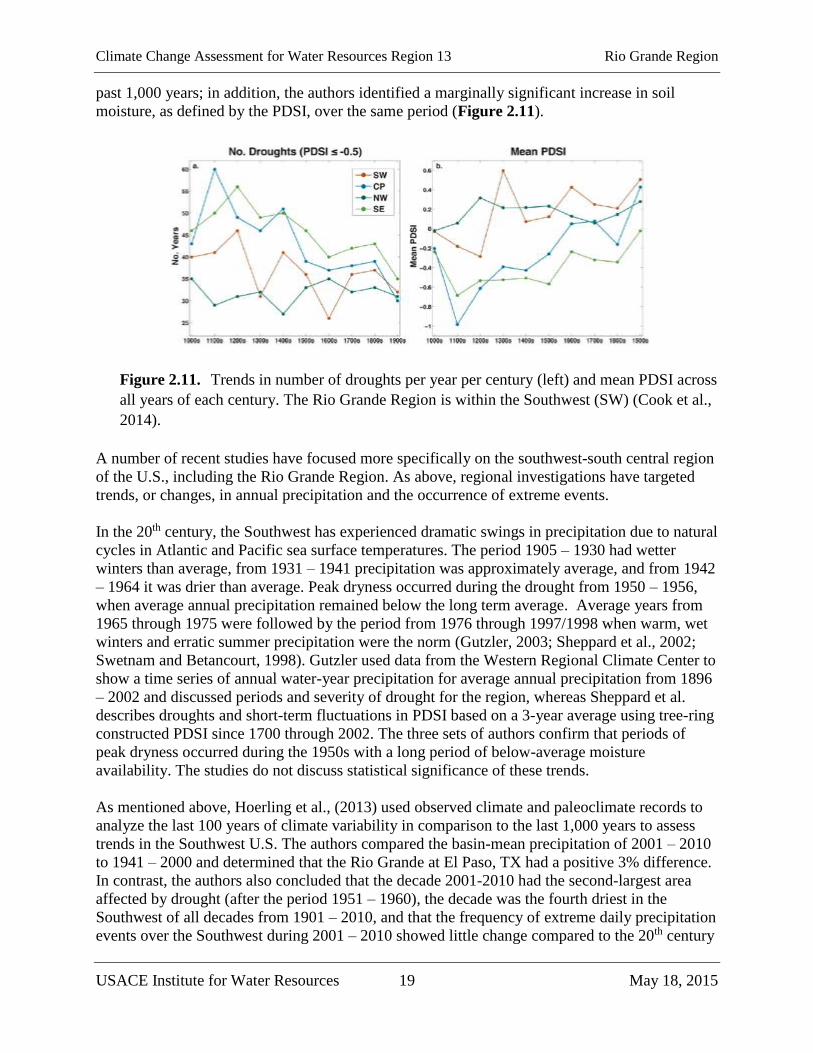
past 1,000 years; in addition, the authors identified a marginally significant increase in soil
moisture, as defined by the PDSI, over the same period (Figure 2.11).
Figure 2.11. Trends in number of droughts per year per century (left) and mean PDSI across
all years of each century. The Rio Grande Region is within the Southwest (SW) (Cook et al.,
2014).
A number of recent studies have focused more specifically on the southwest-south central region
of the U.S., including the Rio Grande Region. As above, regional investigations have targeted
trends, or changes, in annual precipitation and the occurrence of extreme events.
In the 20th century, the Southwest has experienced dramatic swings in precipitation due to natural
cycles in Atlantic and Pacific sea surface temperatures. The period 1905 – 1930 had wetter
winters than average, from 1931 – 1941 precipitation was approximately average, and from 1942
– 1964 it was drier than average. Peak dryness occurred during the drought from 1950 – 1956,
when average annual precipitation remained below the long term average. Average years from
1965 through 1975 were followed by the period from 1976 through 1997/1998 when warm, wet
winters and erratic summer precipitation were the norm (Gutzler, 2003; Sheppard et al., 2002;
Swetnam and Betancourt, 1998). Gutzler used data from the Western Regional Climate Center to
show a time series of annual water-year precipitation for average annual precipitation from 1896
– 2002 and discussed periods and severity of drought for the region, whereas Sheppard et al.
describes droughts and short-term fluctuations in PDSI based on a 3-year average using tree-ring
constructed PDSI since 1700 through 2002. The three sets of authors confirm that periods of
peak dryness occurred during the 1950s with a long period of below-average moisture
availability. The studies do not discuss statistical significance of these trends.
As mentioned above, Hoerling et al., (2013) used observed climate and paleoclimate records to
analyze the last 100 years of climate variability in comparison to the last 1,000 years to assess
trends in the Southwest U.S. The authors compared the basin-mean precipitation of 2001 – 2010
to 1941 – 2000 and determined that the Rio Grande at El Paso, TX had a positive 3% difference.
In contrast, the authors also concluded that the decade 2001-2010 had the second-largest area
affected by drought (after the period 1951 – 1960), the decade was the fourth driest in the
Southwest of all decades from 1901 – 2010, and that the frequency of extreme daily precipitation
events over the Southwest during 2001 – 2010 showed little change compared to the 20th century
Climate Change Assessment for Water Resources Region 13 Rio Grande Region
USACE Institute for Water Resources 20 May 18, 2015
average (high/medium-high confidence). The study area covered by the Hoerling et al. study
includes the Rio Grande Region and the trends reported are relatively indicative of the trends
impacting the region. However, some National Weather Service Historical Climatology Network
stations in west and south Texas show increases of 5-20%, respectively, primarily in the fall, for
the period 1895 – 2006 (Nielsen-Gammon, 2011). The Nielsen-Gammon study did not discuss
statistical significance of this trend.
The third NCA report (Walsh et al., 2014) presents observed precipitation changes for the Rio
Grande Region. As described above, the study area is categorized as Great Plains South and the
Southwest detailed in the section describing recent U.S. precipitation trends. The observed
changes in precipitation are mixed, with some areas within the Rio Grande Region having
increased while others have decreased since 1900. Details on statistical significance are not
provided. These conclusions are founded upon research performed by Kunkel et al. (2013) who
also described that despite recent drought years, no statistically significant trends in annual water
year, seasonal precipitation, extreme precipitation, or frequency of extreme precipitation events
were detected from 1895/1896 through 2010/2011 for the six-state Southwest region (NOAA,
2013b), including Colorado and New Mexico. Seasonal time series show no trends for winter,
spring and summer; fall shows a slight upward, but not statistically significant, trend.
Precipitation on the Southern Great Plains, including Texas, shows no significant trend in any
season (NOAA, 2013a).
Key point: Despite recent drought years, observed trends in precipitation or frequency of
extreme events are varied and no significant trends have been identified. Similar to temperature
trends, spatial variation and differences in elevation contribute to some variation in
interpretation.
2.3. Hydrology
Studies of trends and non-stationarity in streamflow data collected over the past century have
been performed throughout the continental U.S., some of which are inclusive of the Rio Grande
Region. In addition, changes to snowpack, snowmelt, and runoff volume are important in the
snowmelt-dominated portion of the Rio Grande Region above Elephant Butte Dam. Two
important variables with regard to snowpack are the quantity of precipitation falling as snow, and
the amount of water contained in a given volume of snow (snow water equivalent). These studies
typically focus on the mainstem of the Rio Grande, or where long-term stream gages or
instruments exist. Changes to the mainstem of the Rio Grande are more likely to be dominated
by changes to snowpack and snowmelt, whereas tributary watersheds may be more sensitive to
changes in summer precipitation.
A recent study of annual records of unimpaired streamflow stations with data from 1951 to 2010
showed an increasing trend (Sagarika et al., 2014). For the one streamflow station within the
upper region of the Rio Grande Region, an increasing trend was seen in fall, winter, and spring.
There was no discernible trend for summer streamflows. Observed streamflow trends were also
evaluated at the Water Resources Region scale by Kalra et al. (2008). The study utilized
recorded streamflow data from 639 stations (unimpaired) to assess trends and step changes based
on a study period of 1951 – 2002. Streamflow was evaluated based on water year and also
seasonally for autumn/winter and spring/summer. The authors identified an increasing trend

Climate Change Assessment for Water Resources Region 13 Rio Grande Region
USACE Institute for Water Resources 21 May 18, 2015
(95% C.I.) in streamflow during the water year and fall/winter, but not during the spring/summer
for six unimpaired gages located throughout the Rio Grande Region.
Hoerling et al., (2013) analyzed naturalized or near-natural streamflows amounts for the
southwest region’s river basins, including the Rio Grande; data are from the International
Boundary and Water Commission (U.S. Section). During the first decade of the drought in 2001
– 2010, flows in the Rio Grande at El Paso, TX were about 23% lower than the period from 1941
– 2000, even though overall precipitation in the basin was 3% above normal. The Rio Grande at
this location is nearly 100% irrigation flows from the Caballo Reservoir. The low flows resulted
from less precipitation, warm temperatures, and to some extent, water-management impacts that
were not completely accounted for in the natural streamflow records. Hoerling et al. (2013) also
report that streamflow timing for the snowmelt-fed streams of the Southwest. A trend was
identified of earlier timing of annual streamflow from 1950 – 1999 compared to 2001 – 2010. In
the Rio Grande Region, an estimated 5 to 20-day difference in streamflow timing was reported
(95% C.I.). Statistical significance of observed streamflows was not discussed in the study.
Studies have discussed that changes in snowmelt are occurring. There has also been a long-term
decline in the ratio of winter-total snow water equivalent (SWE) to winter total precipitation,
particularly where winter wet-day minimum temperatures averaged were warmer than -5°C for
the period 1949 – 2004. The changes were most pronounced in spring (Knowles et al., 2006).
Changes in snowpack and snowmelt have begun to be evident in spring runoff flows.
Southwestern flood magnitudes over the last 85 years have declined strongly, with the strongest
decreases along the Rio Grande River (Hirsch and Ryberg, 2011). The authors selected 200
stream gages and fit the annual peak streamflow to a regression model in an attempt to quantify
changes of flood magnitudes in relation to CO2 concentrations. Statistical significance was not
discussed in the study.
Other processes associated with aridity can affect the rate of snowmelt. Increased aridity is likely
to reduce vegetation cover, leaving soil exposed to erosion by wind and water. On the Colorado
Plateau, researchers measured dust emissions from different vegetation communities. The
communities were selected as analogs for vegetation changes expected with increasing aridity.
The researchers found that increased temperatures due to climate change will increase wind
erosion across the Colorado Plateau, leading to much higher dust emissions in areas with low
vegetation cover and low rates of biological soil crust (Munson et al., 2011). The dust can move
large distances, and can readily be blown onto areas of mountain snow, changing snowfield
albedo (reflectivity) and thereby helping to accelerate spring snowmelt (Seager and Vecchi,
2010). The authors of this study performed an analysis of 15 coupled climate models that
demonstrated a reduction of winter season precipitation coupled with warming, which is causing
a decline in mountain snow mass and an advance in the timing of spring snow melt. The arid
regions of the southwest are a major dust source and projected drying could lead to increased
dust deposition that will exacerbate the snowpack reduction driven by temperature increases and
thus can affect changes in spring runoff and water supply reservoirs. Statistical significance was
not discussed in this study.
The third NCA report (Garfin et al., 2014) presents observed streamflow changes for the
southwest U.S. and includes a portion of the Rio Grande Region. Over the past 50 years, there
has been a reduction in the amount of snow measured on April 1 as a proportion of the
precipitation falling in the corresponding water-year (October to September), which affects the
Climate Change Assessment for Water Resources Region 13 Rio Grande Region
USACE Institute for Water Resources 22 May 18, 2015
timing of snowfed rivers. The implication of this finding is that the lower the proportion of April
1st SWE to the water-year-to-date precipitation, the more rapid the runoff, and the earlier the
timing of center-of-mass of streamflow in snowfed rivers. Other studies have resulted in similar
conclusions. The observational record of 1948 – 2002 reveals a steady advance in the initiation
of snowmelt across a network of streamflow gages in the western United States and across the
Rio Grande Region (Stewart et al., 2005). The data show earlier beginning (spring pulse onset)
of snowmelt and advances in the center of mass of the annual hydrograph (peak spring runoff) by
one to three weeks (90% C.I.).
In another study evaluating the shifts in snowmelt-dominated areas, Fritz et al. (2011) split the
observational period of 61 years into two periods and compared the percentage of snowmelt
runoff pulses (i.e., the center of mass of flow-weighted timing). The results corroborated the
Stewart et al. (2005) study and identified a similar (i.e., earlier) onset of streamflows in the
region. Statistical significance was not discussed in the study.
Key point: An overall decreasing trend is identified based on this region’s streamflow and
related snowmelt data with some uncertainty in seasonal trends. Additionally, there is consensus
that an earlier onset of snowmelt-driven streamflow has been observed.
2.4. Summary of Observed Climate Findings
Mountain climates are complex and may vary over short distances due to aspect and
topographical differences, which influence temperature and precipitation. The variation across
the Rio Grande Region, in environment/habitat, elevation, and topography, may lead to a variety
of conclusions with regards to observed climate variables. These complexities may lead to some
locations within each dataset to exhibit trends that are different the rest of the sites, and they may
reflect real, local climate differences (Reclamation, 2013). In addition, some observed
temperature and precipitation studies are based on low elevation datasets and may underestimate
changes at higher-altitude critical locations and thus, water supplies.
Evidence has been presented in the recent literature of a relatively steady rise in annual
temperature in the Rio Grande Region beginning in the early 20th century. An increasing trend
was observed in mean, minimum, and maximum temperatures, although this trend was less
pronounced during the observed fall and winter seasons. Spatial variation, differences in climate
and elevation contribute to some variation in results. The consensus view is that recent increases
in temperature in the region exceed observations in the historic record beginning in the late 19th
century. Temperature increases were greater in areas to the south and at lower elevation.
Increases in minimum temperatures coupled with potential decreases in precipitation are
important because these two factor contribute to a longer growing season and decrease period of
snowpack accumulation in winter months (Reclamation, 2013).
Despite recent drought years, no distinguishable trend in precipitation or frequency of extreme
events was identified. In the 20th century, the Southwest has experienced dramatic swings in
precipitation due to natural cycles in Atlantic and Pacific sea surface temperatures. The authors
listed herein provide discussion on seasonal changes, especially changes associated with storm
intensity. In addition, the magnitude of change is variable.
Climate Change Assessment for Water Resources Region 13 Rio Grande Region
USACE Institute for Water Resources 23 May 18, 2015
A slight decreasing trend is identified based on this region’s streamflow and related snowmelt
data with variable interpretation of results associated with trends for certain seasons. The slight
decreasing trend for runoff and streamflow is likely a result of the variable trends associated with
precipitation and an increasing trend in temperatures. Changes to the mainstem of the Rio
Grande are more likely to be dominated by changes to snowpack and snowmelt, whereas
tributary watersheds may be more sensitive to changes in summer precipitation. Based on the
studies that focused on snowpack and snowmelt, there is an implication that precipitation and
temperature changes have created an earlier onset of snowmelt-driven streamflows.
3. Projected Climate Trends
While historical data is essential to understanding current and future climate, nonstationarity in
the data (i.e., a changing climate) dictates the use of supplemental information in long-term
planning studies. In other words, the past may no longer be a good predictor of the future (Milly
et al., 2008). Consequently, the scientific and engineering communities are actively using
computer models of the Earth’s atmosphere and associated thermodynamics to project future
climate trends for use in water resources planning efforts. Although significant uncertainties are
inherent in these model projections, the models, termed global climate models (GCMs), are
widely accepted as representing the best available science on the subject, and have proven highly
useful in planning as a supplement to historical data. A wealth of literature now exists on the use
of GCMs across the globe.
This section summarizes projected climate trends, as projected by GCMs, within the Rio Grande
Region identified in a review of recent peer-reviewed literature. The information presented
should be considered an overview, and similar to Section 2 on observed climate trends, does not
focus on attribution or causation of the projected climate trends or the causal relationships
between climate variables. These relationships are complex and influenced by multiple natural
and unnatural (i.e., anthropogenic greenhouse gas emissions) forcings that influence the Earth’s
climate system. Typical of projected climate studies, often specific (and sometimes multiple)
greenhouse gas emission scenarios (or representative concentration pathways) are modeled by a
single GCM (or ensemble of GCMs). The spectrum of scenarios offer a wide range of “climate
futures” so each study’s assumed emission scenario(s) are noted. When additional detail is
needed, the reader is referred to the specific references cited, including the third NCA which
includes not only regional assessments, but also foundational resources related to climate science
literacy, GCMs, and emission scenarios.
The USACE vulnerability assessments (https://corpsclimate.us/rccvar.cfm) rely on downscaled
climate projection data and hydrologic simulations produced by USACE in conjunction with
Lawrence Livermore National Laboratory, Bureau of Reclamation, U.S. Geological Survey,
Climate Central, Scripps Oceanographic Institute and Santa Clara University, and others. The
data are housed in the publicly accessible Downscaled Climate and Hydrology Projections
website archive, hosted by Lawrence Livermore National Laboratory, which is meant to provide
access to climate and hydrologic projections at spatial and temporal scales relevant to watershed
water resources management decisions. These data, and the vulnerability assessments for which
they provide a foundation, serve as supplements to the information about projected climate
conditions provided in this report.
Climate Change Assessment for Water Resources Region 13 Rio Grande Region
USACE Institute for Water Resources 24 May 18, 2015
Results of this review indicate a strong consensus in the scientific literature that air temperatures
will increase over the next century in the Rio Grande Region. The studies also show that there is
a consensus on a small decrease in streamflows within the region. There is much less consensus
on the future trending, or lack thereof, in projected changes to precipitation.
3.1. Temperature
GCMs have been used extensively to project future climate conditions across the country. At a
national scale, model projections generally show a significant warming trend throughout the 21st
century, with a high level of consensus across models and modeling assumptions. There is much
less consensus on future patterns of precipitation. Results of studies inclusive of the Rio Grande
Region typically fall in line with both of these generalizations.
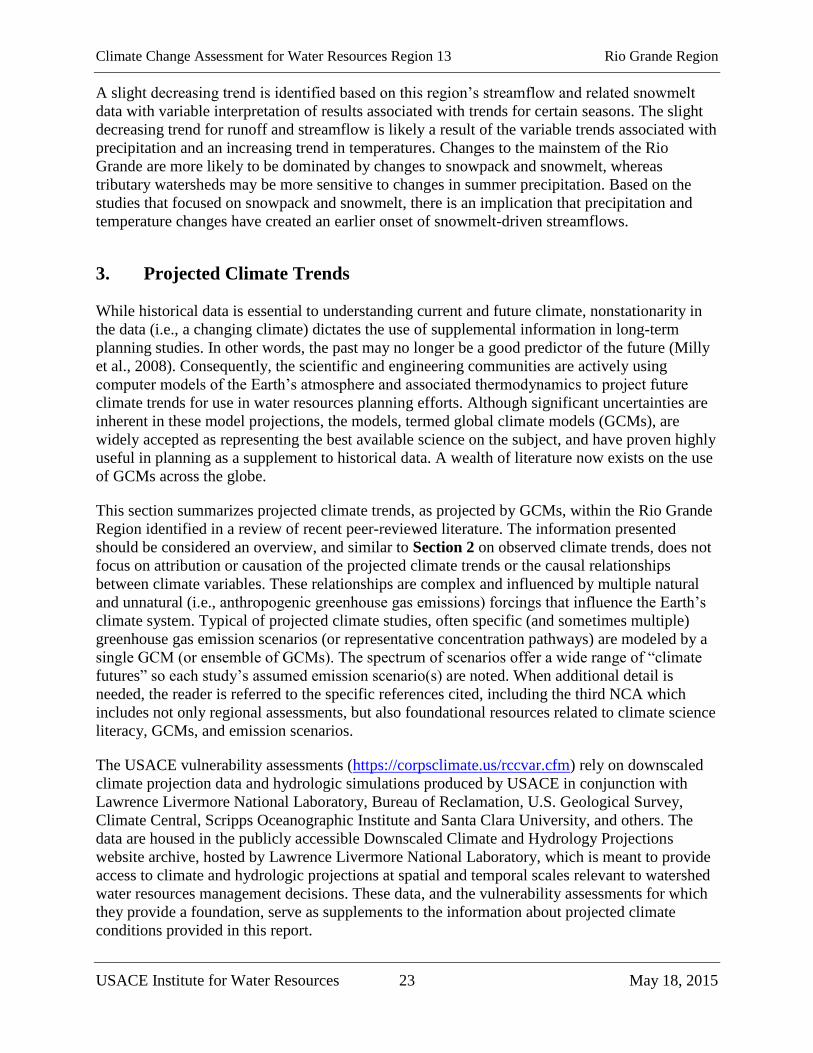
Maximum air temperature projections were investigated by Liu et al. (2013) using a single GCM
and assuming an A2 greenhouse gas emissions scenario (worst case) in a national analysis. The
results of their study, specific to the Rio Grande Region, show a projected increase in winter and
spring maximum air temperature of 2.5 – 3.5 ºC (4.5 – 6.3 ºF) for a 2055 planning horizon
compared to a baseline period of 1971 – 2000 (Figure 3.1). The results of the study project
increases in maximum air temperature from 2.0 – 4.5 ºC (3.6 – 8.1 ºF) for summer and fall
temperatures.
Figure 3.1. Projected changes in seasonal maximum air temperature, ºC, 2055 vs. 1985.
The Rio Grande Region is within the red oval (Liu et al., 2013).
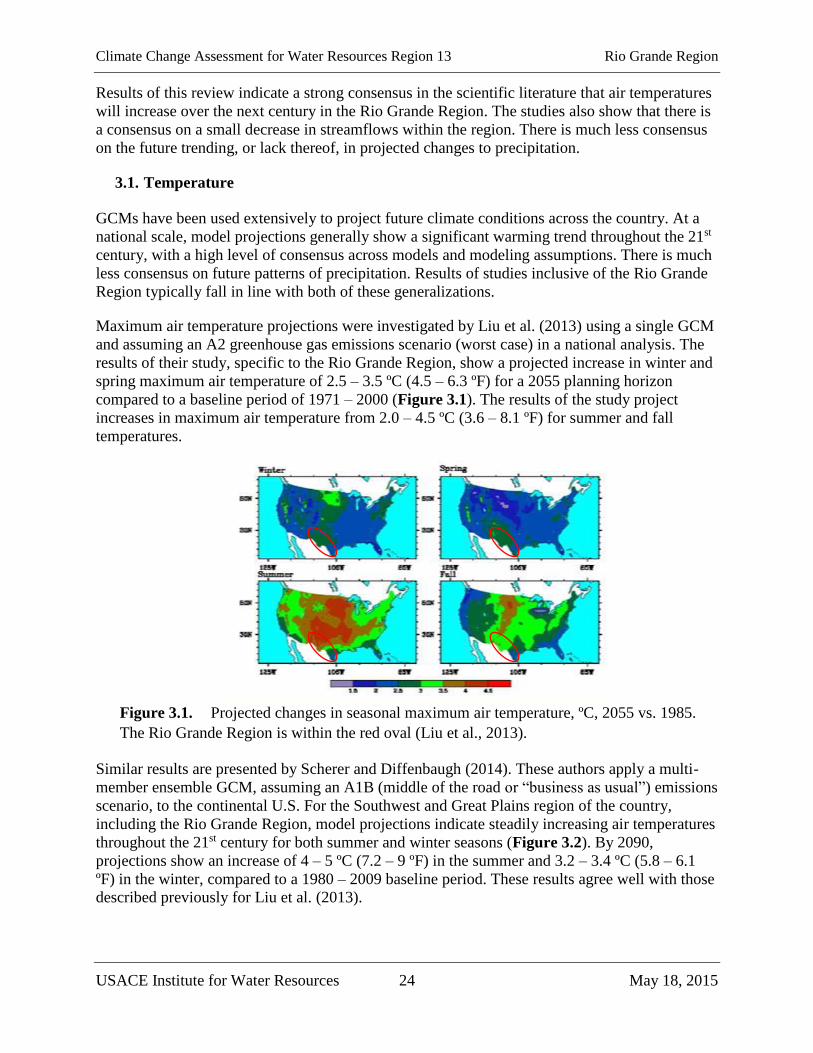
Similar results are presented by Scherer and Diffenbaugh (2014). These authors apply a multi-
member ensemble GCM, assuming an A1B (middle of the road or “business as usual”) emissions
scenario, to the continental U.S. For the Southwest and Great Plains region of the country,
including the Rio Grande Region, model projections indicate steadily increasing air temperatures
throughout the 21st century for both summer and winter seasons (Figure 3.2). By 2090,
projections show an increase of 4 – 5 ºC (7.2 – 9 ºF) in the summer and 3.2 – 3.4 ºC (5.8 – 6.1
ºF) in the winter, compared to a 1980 – 2009 baseline period. These results agree well with those
described previously for Liu et al. (2013).
Climate Change Assessment for Water Resources Region 13 Rio Grande Region
USACE Institute for Water Resources 25 May 18, 2015
a) b)
Figure 3.2. Probability distributions of GCM Projections of daily maximum
temperatures for Years 2000 – 2100 by decade, Southwest and Great Plains region a)
summer months: June – August, b) winter months: December – February. Colors indicate
the decade of the 21st century. Probabilities on the vertical axis are in 0.01%. The value in
the upper left-hand corner of each box is the expected anomaly during the 2090s (Scherer
and Diffenbaugh, 2014).
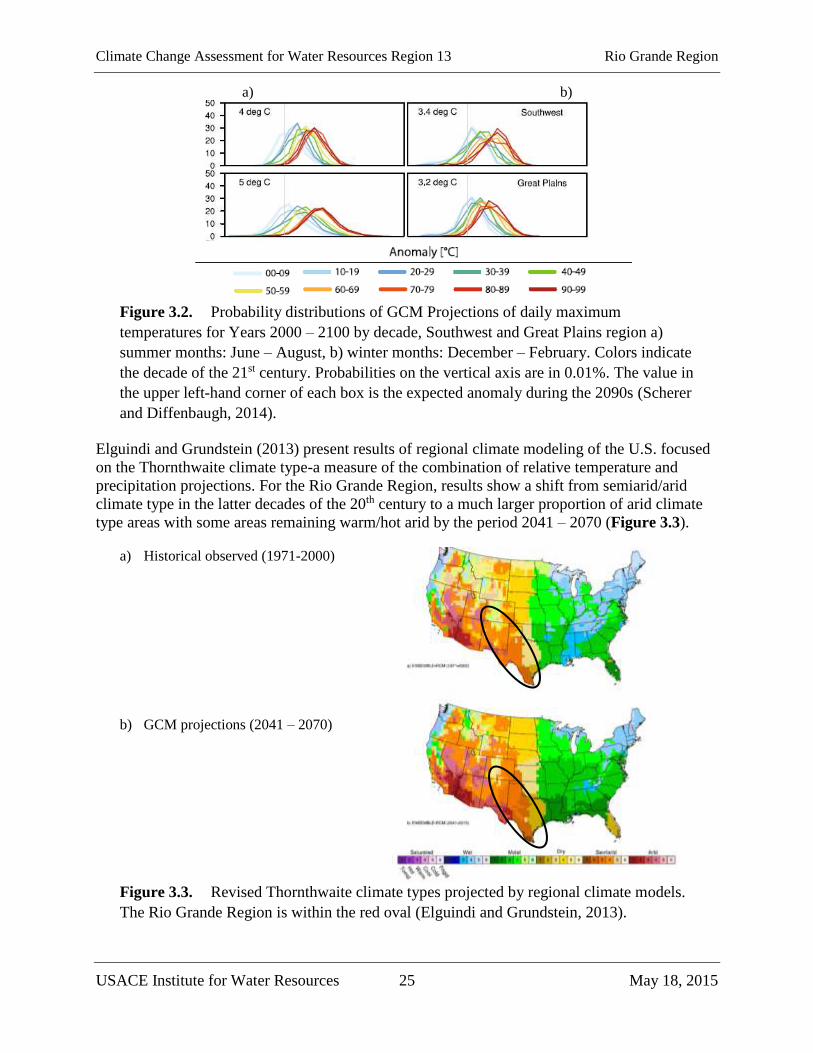
Elguindi and Grundstein (2013) present results of regional climate modeling of the U.S. focused
on the Thornthwaite climate type-a measure of the combination of relative temperature and
precipitation projections. For the Rio Grande Region, results show a shift from semiarid/arid
climate type in the latter decades of the 20th century to a much larger proportion of arid climate
type areas with some areas remaining warm/hot arid by the period 2041 – 2070 (Figure 3.3).
a) Historical observed (1971-2000)
b) GCM projections (2041 – 2070)
Figure 3.3. Revised Thornthwaite climate types projected by regional climate models.
The Rio Grande Region is within the red oval (Elguindi and Grundstein, 2013).

Climate Change Assessment for Water Resources Region 13 Rio Grande Region
USACE Institute for Water Resources 26 May 18, 2015
Projections of changes in temperature extremes have been the subject of many recent studies. A
2006 study by Tebaldi et al. applied nine GCMs at a global scale focused on extreme
precipitation and temperature projections. Model projections of climate at the end of the century
(2080 – 2099) were compared to historical data for the period 1980 – 1999. For the general
region of the southwestern U.S., specifically in the Rio Grande Region, the authors identified a
slight increase in the projected extreme temperature range (0.5 ºC [0.9 ºF] range of annual high
minus annual low temperature), a moderate increase in a heat wave duration index (increase of 3
to 4 days per year that temperatures continuously exceeds the historical norm by at least 5 ºC [9
ºF]), and an increase in the number of warm nights (6 to 8% increase in the percentage of times
in the year when minimum temperature is above the 90th percentile of the climatological
distribution for the given calendar year), compared to the baseline period. The authors state that a
general significant increase of heat waves is observed.
Similar results are presented by Kunkel et al. (2010). In this study, two different downscaled
GCMs were applied to the continental U.S., assuming high greenhouse gas emissions scenarios
(A2 and A1F), with a focus on summer heat wave occurrence and intensity. For the Rio Grande
Region, projections indicate a 3 – 6 ºC (5.4 – 10.8 ºF) increase in three-day heat wave
temperatures and a 70 to 85-day increase in the annual number of heat wave days for a 2090
planning horizon compared to a recent historical baseline.
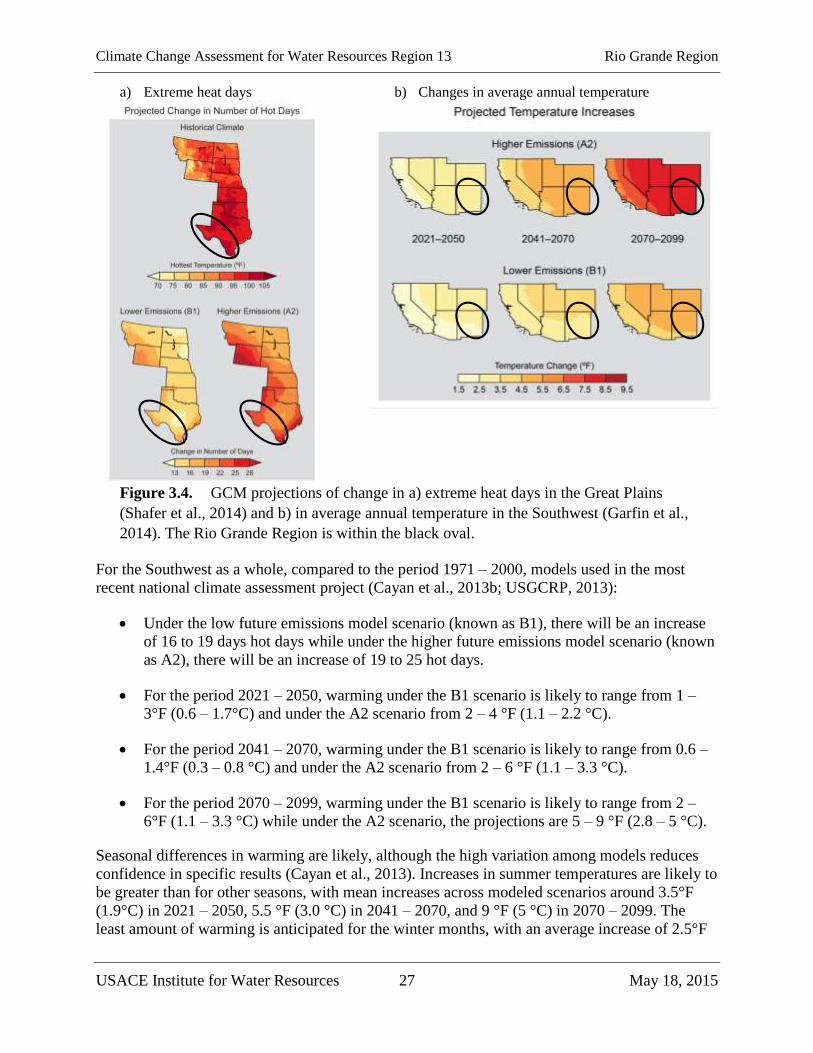
The third NCA generally supports the findings above. The NCA presents information on a
regional basis. The Rio Grande Region spans two of these regions: the Southwest (Garfin et al.,
2014) and Great Plains (Shafer et al., 2014) regions. The U.S. climate model projections
presented in this report indicate a statistically significant increase in both the number of extreme
heat days over the next century and annual average temperature (Figure 3.4).
Climate Change Assessment for Water Resources Region 13 Rio Grande Region
USACE Institute for Water Resources 27 May 18, 2015
a) Extreme heat days b) Changes in average annual temperature
Figure 3.4. GCM projections of change in a) extreme heat days in the Great Plains
(Shafer et al., 2014) and b) in average annual temperature in the Southwest (Garfin et al.,
2014). The Rio Grande Region is within the black oval.
For the Southwest as a whole, compared to the period 1971 – 2000, models used in the most
recent national climate assessment project (Cayan et al., 2013b; USGCRP, 2013):
Under the low future emissions model scenario (known as B1), there will be an increase
of 16 to 19 days hot days while under the higher future emissions model scenario (known
as A2), there will be an increase of 19 to 25 hot days.
For the period 2021 – 2050, warming under the B1 scenario is likely to range from 1 –
3°F (0.6 – 1.7°C) and under the A2 scenario from 2 – 4 °F (1.1 – 2.2 °C).
For the period 2041 – 2070, warming under the B1 scenario is likely to range from 0.6 –
1.4°F (0.3 – 0.8 °C) and under the A2 scenario from 2 – 6 °F (1.1 – 3.3 °C).
For the period 2070 – 2099, warming under the B1 scenario is likely to range from 2 –
6°F (1.1 – 3.3 °C) while under the A2 scenario, the projections are 5 – 9 °F (2.8 – 5 °C).
Seasonal differences in warming are likely, although the high variation among models reduces
confidence in specific results (Cayan et al., 2013). Increases in summer temperatures are likely to
be greater than for other seasons, with mean increases across modeled scenarios around 3.5°F
(1.9°C) in 2021 – 2050, 5.5 °F (3.0 °C) in 2041 – 2070, and 9 °F (5 °C) in 2070 – 2099. The
least amount of warming is anticipated for the winter months, with an average increase of 2.5°F

Climate Change Assessment for Water Resources Region 13 Rio Grande Region
USACE Institute for Water Resources 28 May 18, 2015
(1.4°C) in 2021 – 2050 increasing to almost 3.9°F (1.9°C) in 2070 – 2099. The authors state
medium-high confidence for the key findings.
In a 2007 study, Hurd and Coonrod used three global climate models driven by the A1B scenario
to model hydrology and streamflow changes for the periods 2020 – 2039 and 2070 – 2089 in the
Rio Grande Region. The three models are chosen because one represents a slightly “wetter”
projection, one a slightly “drier” projection and one a “middle of the road precipitation”
projection. In their models, average annual temperatures increased by 1.7 – 3.2 °F (0.9 – 1.8 °C)
by 2030 (Figure 3.5) and by 5.5 – 7.9 °F (3.1 – 4.4 °C) by 2080 (Figure 3.6). Temperature
increases are projected to be greatest in summer under the dry scenario, presumably reflecting
changes in summer cloudiness resulting from a reduced monsoon.
Figure 3.5. Three scenarios for temperature change projected for the Rio Grande Region
in 2020 – 2039 (Hurd and Coonrod, 2007).
Figure 3.6. Three scenarios for temperature change projected for the Rio Grande Region
in 2070 – 2089 (Hurd and Coonrod, 2007).

Climate Change Assessment for Water Resources Region 13 Rio Grande Region
USACE Institute for Water Resources 29 May 18, 2015
A relatively fine-grained analysis was recently conducted by NOAA, in support of the National
Climate Assessment (NOAA, 2013b), using downscaled Coupled Model Intercomparison Project
3 (CMIP3) models and the more recent North American Regional Climate Change Assessment
Program (NARCCAP) models. In maps of average annual temperature change using the CMIP3
multi-model mean simulations, the Upper Rio Grande Region warms 7.5 – 8.5 °F (3.1 – 4.4 °C)
by 2070-2099 under the higher emissions (A2) scenario, and 4.5 – 5.5 °F (2.5 – 3.1 °C) by 2070-
2099 under the lower emissions (B1) scenario (NOAA, 2013b). These changes are considered
significant. In addition, the NARCCAP simulations show that the largest average temperature
increases of 5.5 – 6.0 °F (3.1 – 3.3 °C) are likely to occur in summer and to a lesser degree,
temperature increases in fall, winter, and spring.
Additional projections of temperature change come from studies focusing specifically on
Colorado (Ray et al., 2008) and New Mexico (Gutzler, 2006). Ray et al. also used downscaled,
global climate models to project annual mean temperatures. For Colorado as a whole, an increase
in annual temperature of 1.5 to 3.5 °F (0.8 – 1.9 °C) by 2025 relative to 1950-1999 average
temperatures is expected, with increases of 2.5 – 5.5 °F (1.4 – 3.1°C) expected by 2050. The
authors also noted that summer temperatures are anticipated to increase faster than winter
temperatures. Gutzler used data from the average of eighteen GCMs forced by the A1B scenario
to create a New Mexico statewide average result. The GCM statewide average suggest
substantial increases in temperature of over 5.4 °F (3 °C) are far greater than temperature
increases experienced during the period of instrumental record by the end of the century. Gutzler
reported that in the northern part of New Mexico, model simulations suggested accelerated
summertime warming in the future and up to 7.6 °F (4.2 °C) during the summer (Figure 3.7).
Figure 3.7. GCM projections of seasonal temperature changes in New Mexico in the
21st century for summer (red line; June-August) and winter (blue line; December-
February), compared with model climatology (1971-2000) (Gutzler et al., 2006).
For the San Juan Mountains, Cozzetto et al. (2011) used a series of downscaled models driven by
the A2 (high emissions) scenario. They compared the average temperatures and precipitation for
the baseline period of 1971 to 2000 against the model reference period of 2041 to 2070. In
Climate Change Assessment for Water Resources Region 13 Rio Grande Region
USACE Institute for Water Resources 30 May 18, 2015
summer, fall and winter, daytime high temperatures were expected to increase faster than
nighttime low temperatures, but the pattern is reversed in the spring (Table 3.1).
Table 3.1. Model projections for the San Juan Mountains, average of 2041 to 2070 compared
to 1971 to 2000, median values of model runs (Cozzetto et al., 2011).
Change in
Tmax
(°C)
Change in
Tmin
(°C)
Change in
Precipitation
(%)
Change in
Precipitation
(cm)
Winter 2.5 3.2 4.0 0.5
Spring 2.8 2.5 -5.0 -1.0
Summer 3.7 3.1 -17.0 -2.3
Fall 3.2 2.7 -9.0 -1.3
An increasing trend in average annual temperature was also predicted for the Lower Rio Grande
Region. Based on models from the National Center for Atmospheric Research, the average
projection is for a mean annual temperature increase of 6 – 8 °F (3.3 – 4.4 °C) by 2100 (Norwine
et al., 2007). Statistical significance is not discussed in the study. Another study used a multi-
model ensemble (also from the National Center for Atmospheric Research) for the A1B scenario.
The authors projected an increase of about 1 °F (0.6 °C) for the period 2000-2019 compared to
the 1980 – 1999 baseline period, 2°F (1.1°C) for the period 2020-2039, and close to 4 °F (2.2 °C)
for the period 2040 – 2059 (Nielsen-Gammon, 2011). The range of model values for the 2040-
2059 is from 2 – 5.5 °F (1.1 – 3.1 °C). Statistical significance is not discussed in the study.
Regional differences in warming are evident in model projections of temperature change for the
Great Plains states, including Texas, which show a gradation of change in the Lower Rio Grande,
with greater warming in dryer west Texas and less warming in more humid south Texas (NOAA,
2013a). Under the A2 (high emissions) scenario, compared to the baseline 1971-2000 period, the
period 2041 – 2070 is projected to be, on average, 4.5 – 5.0 °F (2.5 – 2.8 °C) warmer while
coastal south Texas may warm by 3.5 – 4.0 °F (1.9 – 2.2 °C). Seasonal temperature projections
(NOAA, 2013a) indicate little difference in winter warming by 3 – 3.5 °F (1.7 – 1.9°C) across
the Lower Rio Grande, and similar warming in spring with slightly greater warming in the west.
Summer and fall, however, are projected to have much larger contrasts in warming, with west
Texas warming by 4.5 – 5.5 °F (2.5 – 3.1 °C) compared to south Texas, which is projected to
warm by 4 – 4.5 °F (2.2 – 2.5 °C) during these seasons.
Climate change in the Lower Rio Grande below the Falcon Dam was also modeled by the U.S.
Bureau of Reclamation (2013) using the results of 112 gridded climate and hydrology
projections developed for the planning year of 2070 with a time span of 2056-2085. The outputs
are average monthly precipitation and surface air temperature generated from a suite of 16
CMIP3 models forced by the three Intergovernmental Panel on Climate Change (IPCC) future
greenhouse gas emissions scenarios (A2, A1B, and B1). The baseline period for comparison is
the 1990s. The spatial resolution of the model is approximately 12 x 12 kilometers. Projections
from the Variable Infiltration Capacity (VIC) model were used to predict climate factors. The
spatial plots (Figure 3.8) are developed on a water year basis for the reference decade (1990s)
and the mean annual temperature is calculated for each of the 10 water years. The mean annual
temperature is then subsequently averaged to calculate the decadal average of the mean annual
temperature to determine the magnitude change. The results show that the Lower Rio Grande is

Climate Change Assessment for Water Resources Region 13 Rio Grande Region
USACE Institute for Water Resources 31 May 18, 2015
expected to get hotter through successive decades (2020s, 2050s, and 2070s) than it was in the
1990s reference decade.
Figure 3.8. Spatial distribution of simulated decadal mean temperatures for the Lower
Rio Grande. The vertical axes represent latitude, while the horizontal axes represent
longitude. The coloration represents median magnitude change vs. the baseline decade, the
1990s (U.S. Bureau of Reclamation, 2013).
Key point: Strong consensus exists in the literature that projected temperature in the study
region show a sharp increasing trend over the next century. There is also consensus that there is
a projected increase in overnight temperatures and daytime high temperatures.
3.2. Precipitation
In line with projections for the rest of the country, projections of future changes in precipitation
in the Rio Grande Region are variable and generally lacking in consensus among studies or
across models. From a global analysis using three GCM projections, Hagemann et al. (2013)
Climate Change Assessment for Water Resources Region 13 Rio Grande Region
USACE Institute for Water Resources 32 May 18, 2015
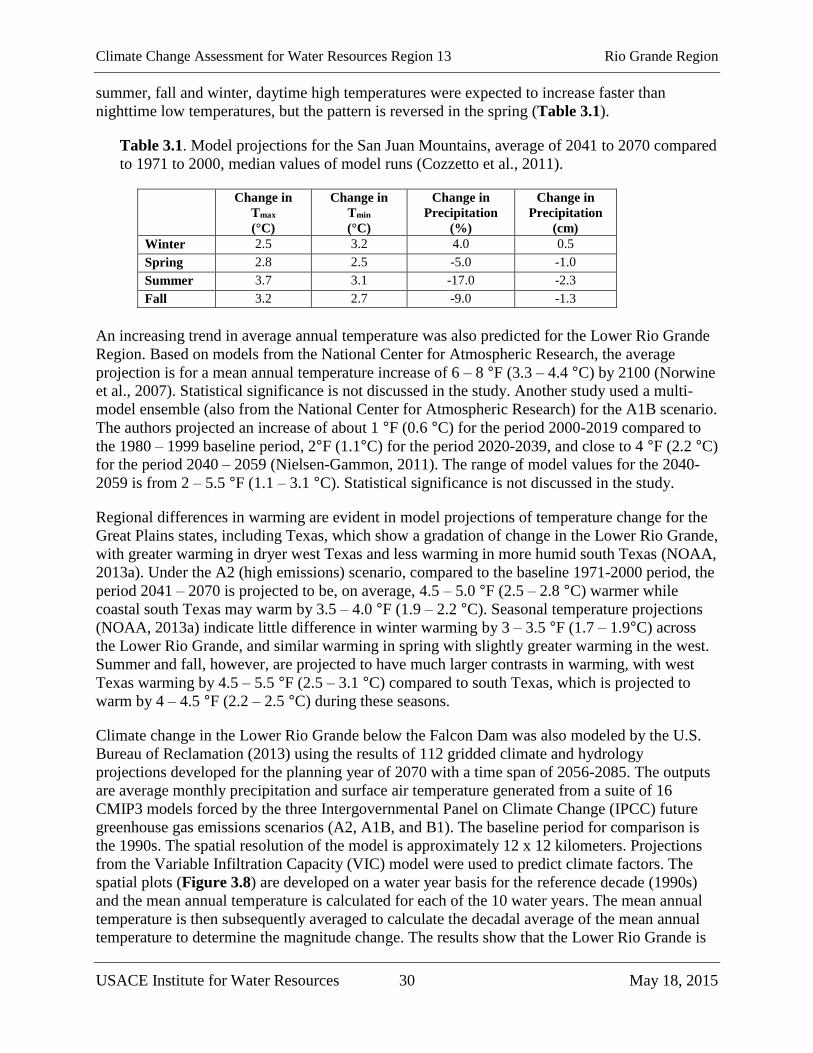
projects a decrease in annual precipitation between 80 to 180 mm per year for the Rio Grande
Region (Figure 3.9).
Figure 3.9. Projected (2071-2100) changes in annual precipitation compared to baseline,
1971-2000, conditions, mm/year. The Rio Grande Region is within the black oval
(Hagemann et al., 2013)
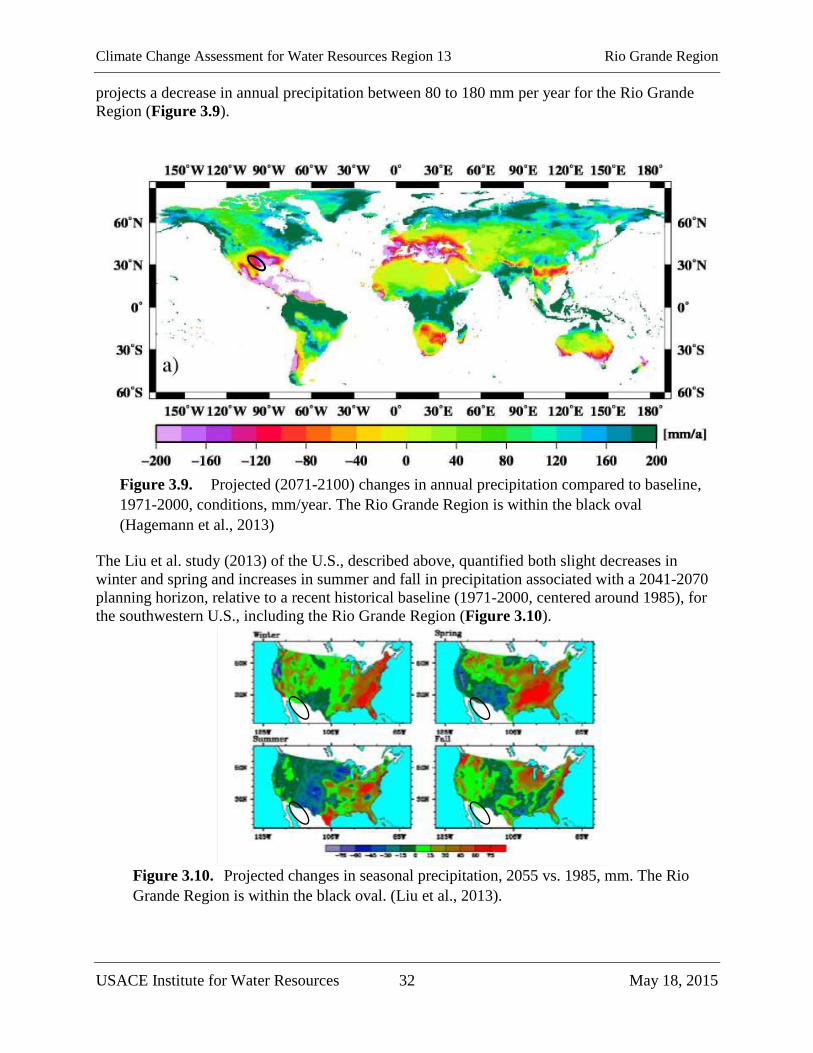
The Liu et al. study (2013) of the U.S., described above, quantified both slight decreases in
winter and spring and increases in summer and fall in precipitation associated with a 2041-2070
planning horizon, relative to a recent historical baseline (1971-2000, centered around 1985), for
the southwestern U.S., including the Rio Grande Region (Figure 3.10).
Figure 3.10. Projected changes in seasonal precipitation, 2055 vs. 1985, mm. The Rio
Grande Region is within the black oval. (Liu et al., 2013).
Climate Change Assessment for Water Resources Region 13 Rio Grande Region
USACE Institute for Water Resources 33 May 18, 2015
Future projections of extreme events, including storm events and droughts, are the subject of
studies by Tebaldi et al. (2006) and Wang and Zhang (2008). The first authors, as part of a global
study, compared an ensemble of GCM projections for the southwest-south central U.S. and a
2080-2099 planning horizon with historical baseline data (1980-1999). They report slight
decreases or no change in the number of high (> 10 mm) precipitation days for the region, a
slight increase in the number of storm events greater than the 95th percentile of the historical
record, and a slight increase in the daily precipitation intensity index (annual total precipitation
divided by number of wet days). In other words, the projections forecast a slight increase in the
intensity of storm events by the end of the 21st century for the general study region with spatial
variability in the future frequency of such events.
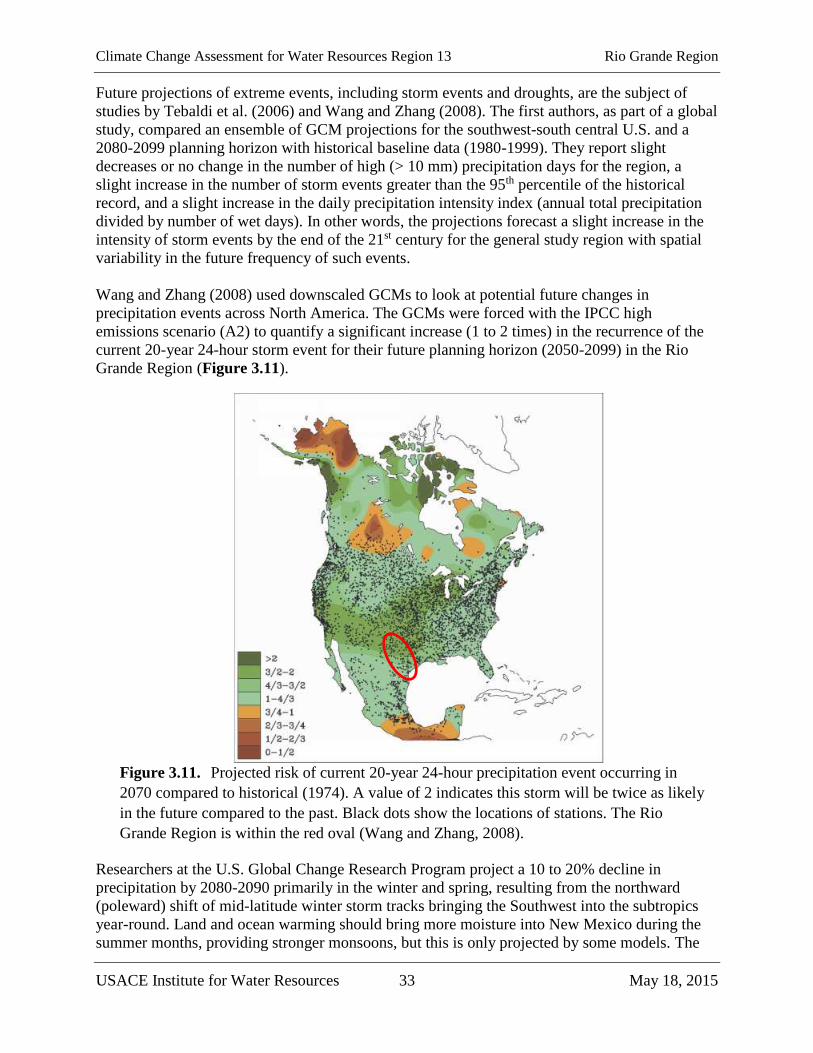
Wang and Zhang (2008) used downscaled GCMs to look at potential future changes in
precipitation events across North America. The GCMs were forced with the IPCC high
emissions scenario (A2) to quantify a significant increase (1 to 2 times) in the recurrence of the
current 20-year 24-hour storm event for their future planning horizon (2050-2099) in the Rio
Grande Region (Figure 3.11).
Figure 3.11. Projected risk of current 20-year 24-hour precipitation event occurring in
2070 compared to historical (1974). A value of 2 indicates this storm will be twice as likely
in the future compared to the past. Black dots show the locations of stations. The Rio
Grande Region is within the red oval (Wang and Zhang, 2008).
Researchers at the U.S. Global Change Research Program project a 10 to 20% decline in
precipitation by 2080-2090 primarily in the winter and spring, resulting from the northward
(poleward) shift of mid-latitude winter storm tracks bringing the Southwest into the subtropics
year-round. Land and ocean warming should bring more moisture into New Mexico during the
summer months, providing stronger monsoons, but this is only projected by some models. The
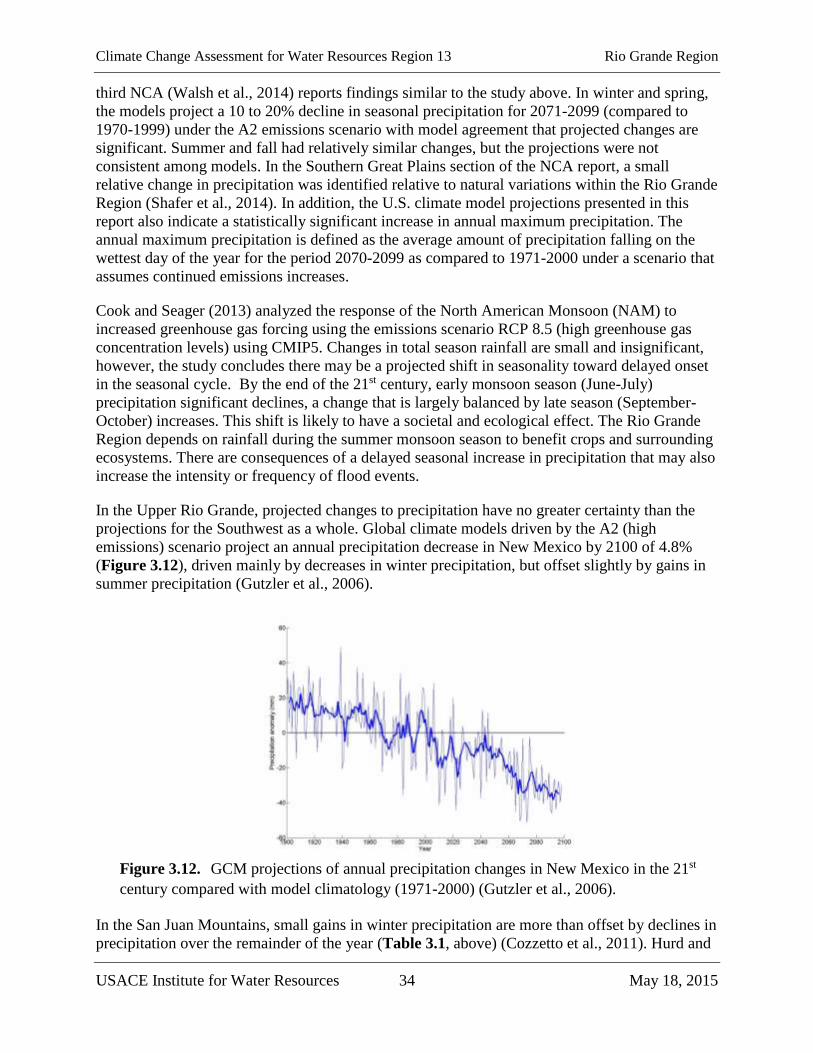
Climate Change Assessment for Water Resources Region 13 Rio Grande Region
USACE Institute for Water Resources 34 May 18, 2015
third NCA (Walsh et al., 2014) reports findings similar to the study above. In winter and spring,
the models project a 10 to 20% decline in seasonal precipitation for 2071-2099 (compared to
1970-1999) under the A2 emissions scenario with model agreement that projected changes are
significant. Summer and fall had relatively similar changes, but the projections were not
consistent among models. In the Southern Great Plains section of the NCA report, a small
relative change in precipitation was identified relative to natural variations within the Rio Grande
Region (Shafer et al., 2014). In addition, the U.S. climate model projections presented in this
report also indicate a statistically significant increase in annual maximum precipitation. The
annual maximum precipitation is defined as the average amount of precipitation falling on the
wettest day of the year for the period 2070-2099 as compared to 1971-2000 under a scenario that
assumes continued emissions increases.
Cook and Seager (2013) analyzed the response of the North American Monsoon (NAM) to
increased greenhouse gas forcing using the emissions scenario RCP 8.5 (high greenhouse gas
concentration levels) using CMIP5. Changes in total season rainfall are small and insignificant,
however, the study concludes there may be a projected shift in seasonality toward delayed onset
in the seasonal cycle. By the end of the 21st century, early monsoon season (June-July)
precipitation significant declines, a change that is largely balanced by late season (September-
October) increases. This shift is likely to have a societal and ecological effect. The Rio Grande
Region depends on rainfall during the summer monsoon season to benefit crops and surrounding
ecosystems. There are consequences of a delayed seasonal increase in precipitation that may also
increase the intensity or frequency of flood events.
In the Upper Rio Grande, projected changes to precipitation have no greater certainty than the
projections for the Southwest as a whole. Global climate models driven by the A2 (high
emissions) scenario project an annual precipitation decrease in New Mexico by 2100 of 4.8%
(Figure 3.12), driven mainly by decreases in winter precipitation, but offset slightly by gains in
summer precipitation (Gutzler et al., 2006).
Figure 3.12. GCM projections of annual precipitation changes in New Mexico in the 21st
century compared with model climatology (1971-2000) (Gutzler et al., 2006).
In the San Juan Mountains, small gains in winter precipitation are more than offset by declines in
precipitation over the remainder of the year (Table 3.1, above) (Cozzetto et al., 2011). Hurd and
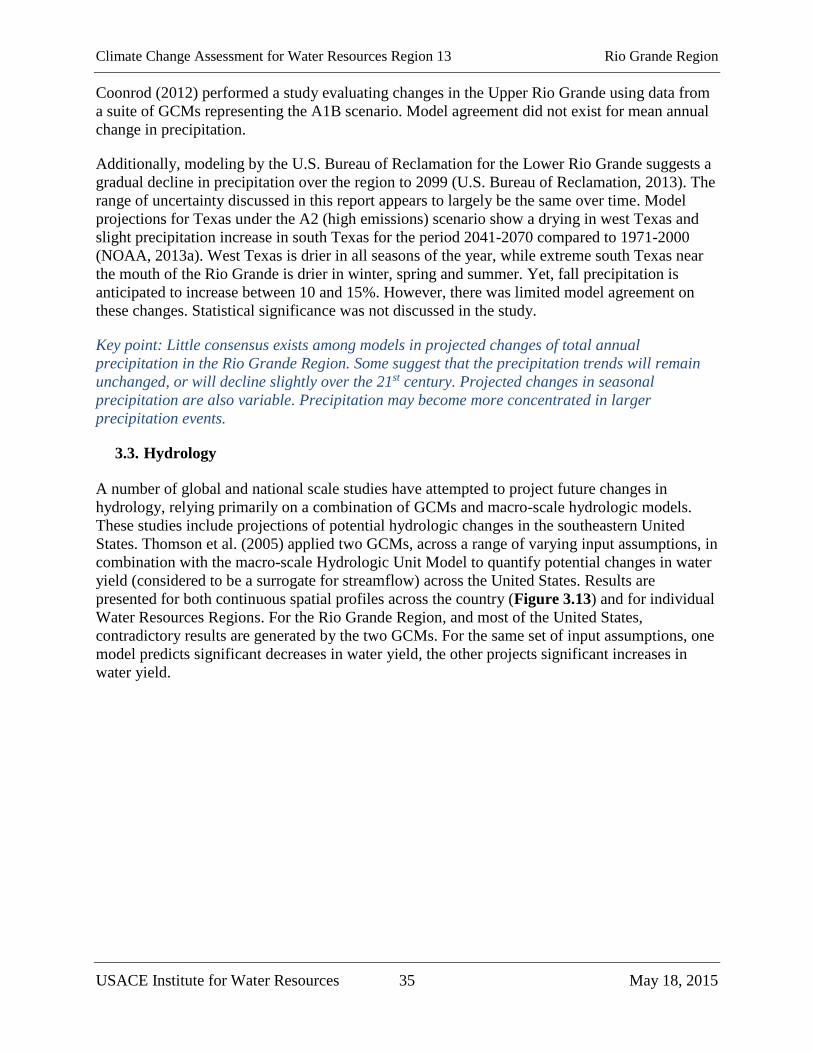
Climate Change Assessment for Water Resources Region 13 Rio Grande Region
USACE Institute for Water Resources 35 May 18, 2015
Coonrod (2012) performed a study evaluating changes in the Upper Rio Grande using data from
a suite of GCMs representing the A1B scenario. Model agreement did not exist for mean annual
change in precipitation.
Additionally, modeling by the U.S. Bureau of Reclamation for the Lower Rio Grande suggests a
gradual decline in precipitation over the region to 2099 (U.S. Bureau of Reclamation, 2013). The
range of uncertainty discussed in this report appears to largely be the same over time. Model
projections for Texas under the A2 (high emissions) scenario show a drying in west Texas and
slight precipitation increase in south Texas for the period 2041-2070 compared to 1971-2000
(NOAA, 2013a). West Texas is drier in all seasons of the year, while extreme south Texas near
the mouth of the Rio Grande is drier in winter, spring and summer. Yet, fall precipitation is
anticipated to increase between 10 and 15%. However, there was limited model agreement on
these changes. Statistical significance was not discussed in the study.
Key point: Little consensus exists among models in projected changes of total annual
precipitation in the Rio Grande Region. Some suggest that the precipitation trends will remain
unchanged, or will decline slightly over the 21st century. Projected changes in seasonal
precipitation are also variable. Precipitation may become more concentrated in larger
precipitation events.
3.3. Hydrology
A number of global and national scale studies have attempted to project future changes in
hydrology, relying primarily on a combination of GCMs and macro-scale hydrologic models.
These studies include projections of potential hydrologic changes in the southeastern United
States. Thomson et al. (2005) applied two GCMs, across a range of varying input assumptions, in
combination with the macro-scale Hydrologic Unit Model to quantify potential changes in water
yield (considered to be a surrogate for streamflow) across the United States. Results are
presented for both continuous spatial profiles across the country (Figure 3.13) and for individual
Water Resources Regions. For the Rio Grande Region, and most of the United States,
contradictory results are generated by the two GCMs. For the same set of input assumptions, one
model predicts significant decreases in water yield, the other projects significant increases in
water yield.
Climate Change Assessment for Water Resources Region 13 Rio Grande Region
USACE Institute for Water Resources 36 May 18, 2015
Figure 3.13. Projected change in water yield (from historical baseline), under various
climate change scenarios based on 2 GCM projections. The Rio Grande Region is within
the red oval (Thomson et al., 2005).
The results presented by Thomson et al. (2005), described above, highlight the significant
uncertainties associated with global climate modeling, particularly with respect to hydrologic
parameters. Additional uncertainty is generated when these climate models are combined with
hydrologic models that carry their own uncertainty. This comparison and quantification of
uncertainty is the subject of a 2013 study by Hagemann et al. In this study, the authors apply
three GCMs, across two emission scenarios to seed eight different hydrologic models for
projecting precipitation, ET, and runoff on a global scale. Their findings, in agreement with
CDM Smith (2012), indicate that the uncertainty associated with macro-scale hydrologic
modeling is as great, or greater, than that associated with the selection of climate models. Study
projections from Hagemann et al. (2013), for the Rio Grande Region show an overall decrease in
runoff by approximately 20-40 mm per year for their future planning horizon (2071-2100)
compared to the recent historical baseline (1971-2000) (Figure 3.14), assuming an A2 emissions
scenario. Similar changes in seasonal runoff are expected year round (Figure 3.15).

Climate Change Assessment for Water Resources Region 13 Rio Grande Region
USACE Institute for Water Resources 37 May 18, 2015
Figure 3.14. Ensemble mean runoff projections (mm/year) for A2 greenhouse gas
emissions scenario, changes in annual runoff, 2085 vs. 1985. The Rio Grande Region is
within the black oval (Hagemann et al., 2013).
Figure 3.15. Ensemble seasonal (a. winter b. spring c. summer d. fall) mean runoff
projections (mm/season) for A2 greenhouse gas emissions scenario, changes in seasonal
runoff, 2071-2100 vs 1971-2000. The Rio Grande Region is within the red oval
(Hagemann et al., 2013).
In the chapter of the NCA that discusses the southwestern United States (Garfin et al., 2014), a
decrease in snowpack is projected in the Rio Grande River headwaters. Decreased snowpack, as
measured by SWE, is strongly related to the amount of runoff and associated natural inflows to
snowpack supplied rivers such as the Rio Grande River headwaters. Projected SWE for the
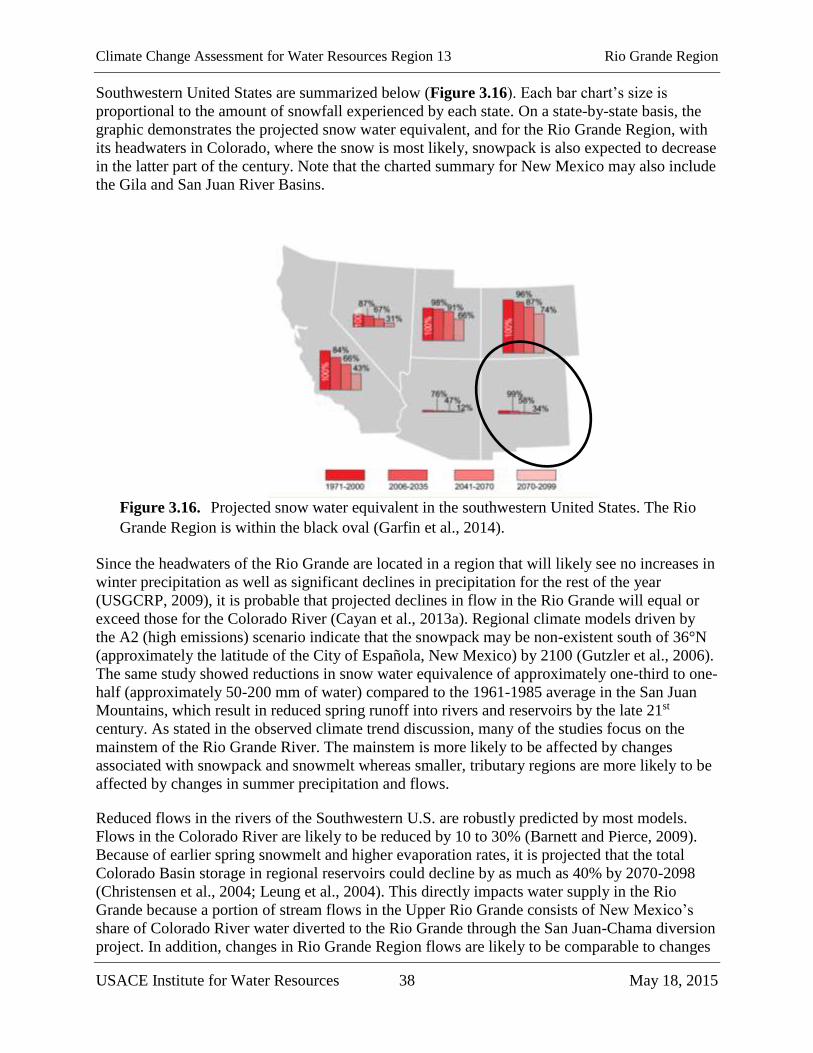
Climate Change Assessment for Water Resources Region 13 Rio Grande Region
USACE Institute for Water Resources 38 May 18, 2015
Southwestern United States are summarized below (Figure 3.16). Each bar chart’s size is
proportional to the amount of snowfall experienced by each state. On a state-by-state basis, the
graphic demonstrates the projected snow water equivalent, and for the Rio Grande Region, with
its headwaters in Colorado, where the snow is most likely, snowpack is also expected to decrease
in the latter part of the century. Note that the charted summary for New Mexico may also include
the Gila and San Juan River Basins.
Figure 3.16. Projected snow water equivalent in the southwestern United States. The Rio
Grande Region is within the black oval (Garfin et al., 2014).
Since the headwaters of the Rio Grande are located in a region that will likely see no increases in
winter precipitation as well as significant declines in precipitation for the rest of the year
(USGCRP, 2009), it is probable that projected declines in flow in the Rio Grande will equal or
exceed those for the Colorado River (Cayan et al., 2013a). Regional climate models driven by
the A2 (high emissions) scenario indicate that the snowpack may be non-existent south of 36°N
(approximately the latitude of the City of Española, New Mexico) by 2100 (Gutzler et al., 2006).
The same study showed reductions in snow water equivalence of approximately one-third to one-
half (approximately 50-200 mm of water) compared to the 1961-1985 average in the San Juan
Mountains, which result in reduced spring runoff into rivers and reservoirs by the late 21st
century. As stated in the observed climate trend discussion, many of the studies focus on the
mainstem of the Rio Grande River. The mainstem is more likely to be affected by changes
associated with snowpack and snowmelt whereas smaller, tributary regions are more likely to be
affected by changes in summer precipitation and flows.
Reduced flows in the rivers of the Southwestern U.S. are robustly predicted by most models.
Flows in the Colorado River are likely to be reduced by 10 to 30% (Barnett and Pierce, 2009).
Because of earlier spring snowmelt and higher evaporation rates, it is projected that the total
Colorado Basin storage in regional reservoirs could decline by as much as 40% by 2070-2098
(Christensen et al., 2004; Leung et al., 2004). This directly impacts water supply in the Rio
Grande because a portion of stream flows in the Upper Rio Grande consists of New Mexico’s
share of Colorado River water diverted to the Rio Grande through the San Juan-Chama diversion
project. In addition, changes in Rio Grande Region flows are likely to be comparable to changes
Climate Change Assessment for Water Resources Region 13 Rio Grande Region
USACE Institute for Water Resources 39 May 18, 2015
in the Colorado River, suggesting similar reductions to the regional water supply. Changes in
spring runoff have future planning implications for irrigation and water allocations in the Rio
Grande Region.
Increased temperatures, greater evapotranspiration, changes in the form and distribution of
precipitation across the year are anticipated to reduce stream flows, both spring runoff flows and
summer baseline flows. In addition, periods of drought are anticipated to be longer and more
severe than observed in the 20th century (Cayan et al., 2010), with average conditions
comparable to the drought of the 1950s emerging by the end of the century (Wehner et al., 2011).
Changes in ET and soil moisture may cause habitat loss in certain areas.
Average annual runoff is likely to decline by as much as 11-20% in the Upper Rio Grande by the
2070s (Reclamation, 2011) (up to 28.7% in 2080 [Hurd and Coonrod, 2007]), accompanied
shifts in the timing of spring runoff to earlier in the year. These declines are likely to be largest
during the spring runoff period due to reductions in peak runoff flows, advances in runoff timing,
and increased evaporation (Gutzler et al., 2006). Evaporation at reservoirs is likely to be higher
under warmer temperatures, accelerating loss of water from the system. In South Texas, reservoir
evaporation is projected to be 116% of normal in average years, and 137% of normal in drought
years by 2050 (Ward, 2011). Statistical significance was not discussed in this study.
Hurd and Coonrod (2012) performed a study evaluating changes in the Upper Rio Grande using
data from a suite of GCMs representing the A1B scenario. They used a conceptual rainfall-runoff
model to determine a water balance between surface runoff and sub-surface flow. The authors
report that lower runoff totals and a shift toward a greater share of runoff occurs earlier, which
reflects both earlier snowmelt, lower snowfall, and diminished snowpack in the headwater
regions of the Rio Grande Region. Statistical significance was not discussed in this study.
Recent modeling of flows in the Upper Rio Grande by the U.S. Bureau of Reclamation, USACE,
and Sandia National Labs projects that native flows in the Rio Grande are like to decrease by
approximately one third by 2100 and peak flows would shift earlier in the year from June to
May, with most flow decreases between June and September (U.S. Bureau of Reclamation,
2013).
The third NCA report section discussing water resources (Georgakakos et al., 2014) provides a
summary of changes regarding annual and seasonal streamflow projections based on the B1,
A1B, and A2 CMIP3 scenarios for the Upper Rio Grande Region. The Rio Grande Region is
projected to experience gradual runoff declines during this century with a slight decrease in the
winter months and a substantial decrease in the summer months (Figure 3.17). Projections are
shown for annual, cool, and warm seasons for three future decades (2020s, 2050s, and 2070s)
relative to the 1990s.

Climate Change Assessment for Water Resources Region 13 Rio Grande Region
USACE Institute for Water Resources 40 May 18, 2015
Figure 3.17. Projected change in annual and seasonal average runoff at the Rio Grande at
Elephant Butte Dam. The percentage change in average runoff is shown with projected
decreases shown below the zero line (Georgakakos et al., 2014).
The U.S. Bureau of Reclamation provides a similar graphic for the Lower Rio Grande for the
same representation of change in average annual and seasonal runoff as the third NCA report’s
graphic for the Upper Rio Grande (Figure 3.18) (U.S. Bureau of Reclamation, 2013). The
average runoff is calculated for three future decades from the reference 1990s decade. The
change in runoff for the 2020s decade is nominal in the Lower Rio Grande, but notable in the
2070s.
Figure 3.18. Projected change in annual and seasonal average runoff at the Rio Grande at
Falcon Dam. The percentage change in average runoff is shown with projected decreases
shown below the zero line. Note that the scale of percent change is different than Figure
3.17 (U.S. Bureau of Reclamation, 2013).
Key point: There is a consensus that there is a projected decreasing trend in streamflow for the
study region through the next century.
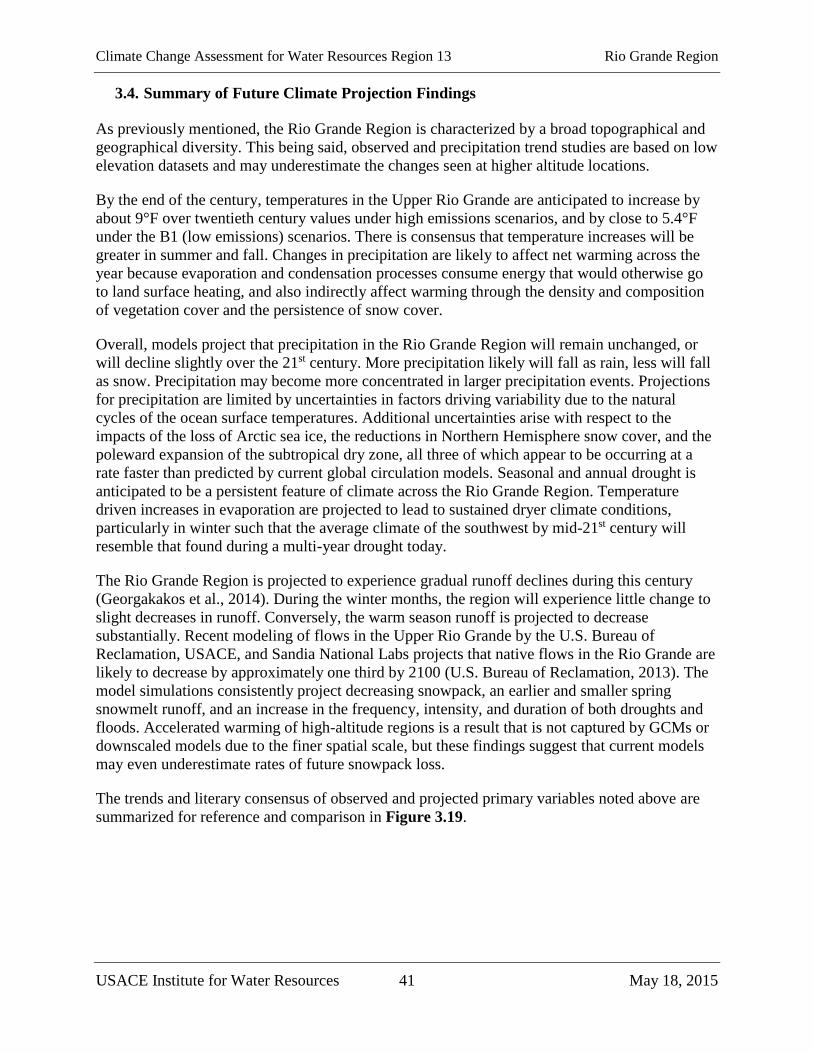
Climate Change Assessment for Water Resources Region 13 Rio Grande Region
USACE Institute for Water Resources 41 May 18, 2015
3.4. Summary of Future Climate Projection Findings
As previously mentioned, the Rio Grande Region is characterized by a broad topographical and
geographical diversity. This being said, observed and precipitation trend studies are based on low
elevation datasets and may underestimate the changes seen at higher altitude locations.
By the end of the century, temperatures in the Upper Rio Grande are anticipated to increase by
about 9°F over twentieth century values under high emissions scenarios, and by close to 5.4°F
under the B1 (low emissions) scenarios. There is consensus that temperature increases will be
greater in summer and fall. Changes in precipitation are likely to affect net warming across the
year because evaporation and condensation processes consume energy that would otherwise go
to land surface heating, and also indirectly affect warming through the density and composition
of vegetation cover and the persistence of snow cover.
Overall, models project that precipitation in the Rio Grande Region will remain unchanged, or
will decline slightly over the 21st century. More precipitation likely will fall as rain, less will fall
as snow. Precipitation may become more concentrated in larger precipitation events. Projections
for precipitation are limited by uncertainties in factors driving variability due to the natural
cycles of the ocean surface temperatures. Additional uncertainties arise with respect to the
impacts of the loss of Arctic sea ice, the reductions in Northern Hemisphere snow cover, and the
poleward expansion of the subtropical dry zone, all three of which appear to be occurring at a
rate faster than predicted by current global circulation models. Seasonal and annual drought is
anticipated to be a persistent feature of climate across the Rio Grande Region. Temperature
driven increases in evaporation are projected to lead to sustained dryer climate conditions,
particularly in winter such that the average climate of the southwest by mid-21st century will
resemble that found during a multi-year drought today.
The Rio Grande Region is projected to experience gradual runoff declines during this century
(Georgakakos et al., 2014). During the winter months, the region will experience little change to
slight decreases in runoff. Conversely, the warm season runoff is projected to decrease
substantially. Recent modeling of flows in the Upper Rio Grande by the U.S. Bureau of
Reclamation, USACE, and Sandia National Labs projects that native flows in the Rio Grande are
likely to decrease by approximately one third by 2100 (U.S. Bureau of Reclamation, 2013). The
model simulations consistently project decreasing snowpack, an earlier and smaller spring
snowmelt runoff, and an increase in the frequency, intensity, and duration of both droughts and
floods. Accelerated warming of high-altitude regions is a result that is not captured by GCMs or
downscaled models due to the finer spatial scale, but these findings suggest that current models
may even underestimate rates of future snowpack loss.
The trends and literary consensus of observed and projected primary variables noted above are
summarized for reference and comparison in Figure 3.19.
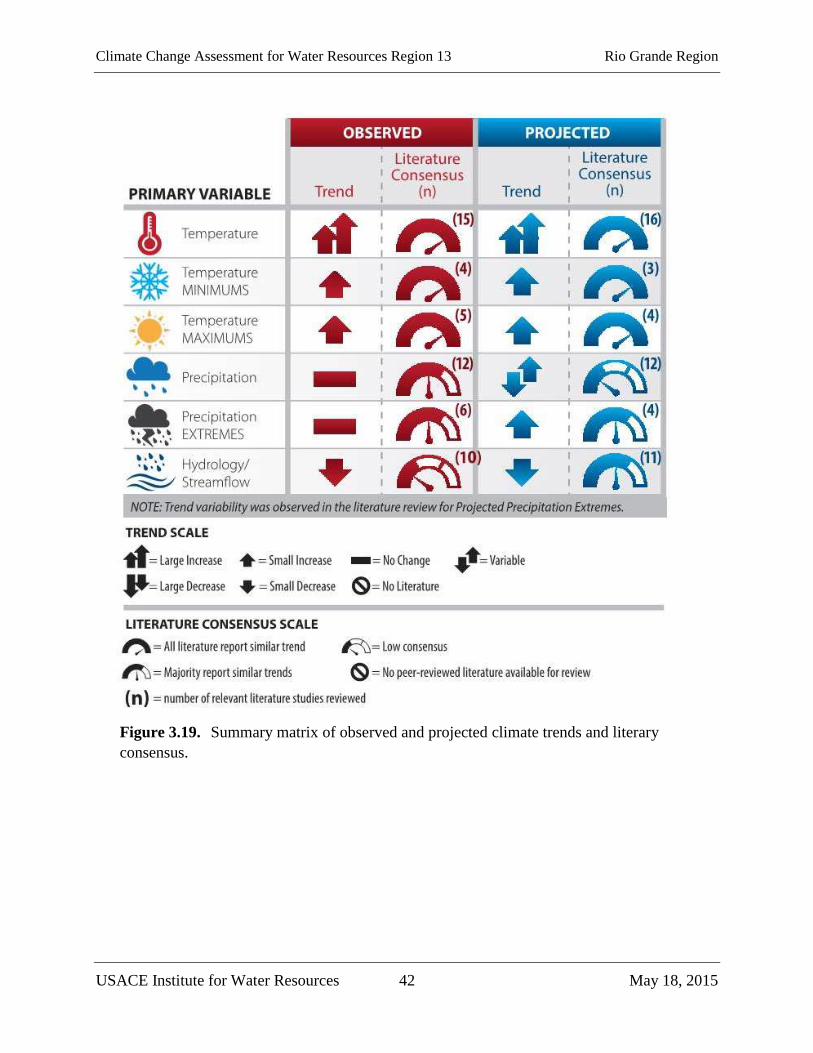
Climate Change Assessment for Water Resources Region 13 Rio Grande Region
USACE Institute for Water Resources 42 May 18, 2015
Figure 3.19. Summary matrix of observed and projected climate trends and literary
consensus.
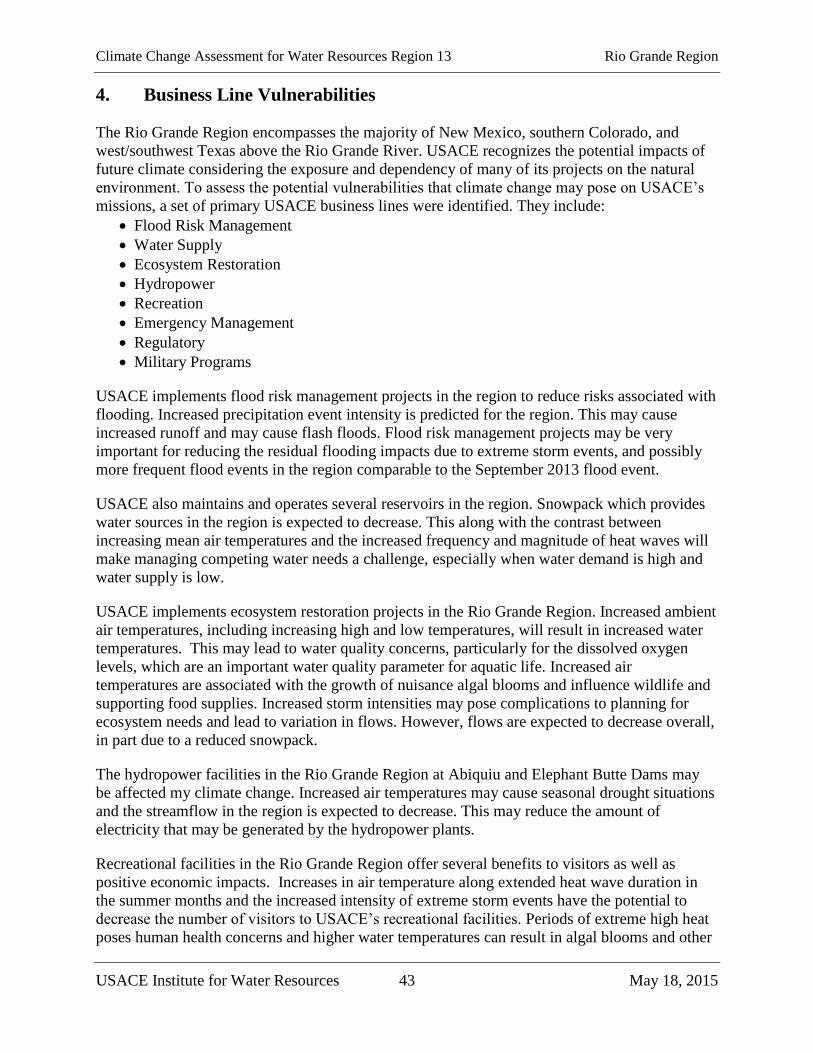
Climate Change Assessment for Water Resources Region 13 Rio Grande Region
USACE Institute for Water Resources 43 May 18, 2015
4. Business Line Vulnerabilities
The Rio Grande Region encompasses the majority of New Mexico, southern Colorado, and
west/southwest Texas above the Rio Grande River. USACE recognizes the potential impacts of
future climate considering the exposure and dependency of many of its projects on the natural
environment. To assess the potential vulnerabilities that climate change may pose on USACE’s
missions, a set of primary USACE business lines were identified. They include:
Flood Risk Management
Water Supply
Ecosystem Restoration
Hydropower
Recreation
Emergency Management
Regulatory
Military Programs
USACE implements flood risk management projects in the region to reduce risks associated with
flooding. Increased precipitation event intensity is predicted for the region. This may cause
increased runoff and may cause flash floods. Flood risk management projects may be very
important for reducing the residual flooding impacts due to extreme storm events, and possibly
more frequent flood events in the region comparable to the September 2013 flood event.
USACE also maintains and operates several reservoirs in the region. Snowpack which provides
water sources in the region is expected to decrease. This along with the contrast between
increasing mean air temperatures and the increased frequency and magnitude of heat waves will
make managing competing water needs a challenge, especially when water demand is high and
water supply is low.
USACE implements ecosystem restoration projects in the Rio Grande Region. Increased ambient
air temperatures, including increasing high and low temperatures, will result in increased water
temperatures. This may lead to water quality concerns, particularly for the dissolved oxygen
levels, which are an important water quality parameter for aquatic life. Increased air
temperatures are associated with the growth of nuisance algal blooms and influence wildlife and
supporting food supplies. Increased storm intensities may pose complications to planning for
ecosystem needs and lead to variation in flows. However, flows are expected to decrease overall,
in part due to a reduced snowpack.
The hydropower facilities in the Rio Grande Region at Abiquiu and Elephant Butte Dams may
be affected my climate change. Increased air temperatures may cause seasonal drought situations
and the streamflow in the region is expected to decrease. This may reduce the amount of
electricity that may be generated by the hydropower plants.
Recreational facilities in the Rio Grande Region offer several benefits to visitors as well as
positive economic impacts. Increases in air temperature along extended heat wave duration in
the summer months and the increased intensity of extreme storm events have the potential to
decrease the number of visitors to USACE’s recreational facilities. Periods of extreme high heat
poses human health concerns and higher water temperatures can result in algal blooms and other

Climate Change Assessment for Water Resources Region 13 Rio Grande Region
USACE Institute for Water Resources 44 May 18, 2015
water quality issues which may cause health risks for those involved in aquatic activities. An
increase in extreme storm events may make recreational activity difficult, dangerous, or
impossible.
USACE has extraordinary capabilities to respond to natural disasters and other emergency
situations throughout the country, and it is a top priority. There are designated emergency
managers and assigned staff in each region and subregion that are able to quickly mobilize.
Extreme storm events are capable of creating emergency situations in which USACE would be
needed to provide assistance in the Rio Grande Region. These types of storms are capable of
intense precipitation and winds. Since these may occur more frequently, USACE can expect an
increased need for their assistance in disaster response and recovery.
USACE’s regulatory mission has a serious commitment to protecting aquatic resources while
allowing for reasonable development. The climate projections may have indirect implications for
permitting in the region, and may result from modifications in federal laws and guidance. This
may spur stricter regulations or an increase in the permitting breadth and depth. While most of
the permitting processes may not change, the volume and frequency of the permitting
requirements may increase-thus increasing the permitting costs for projects.
In addition, USACE provides engineering, construction, real estate, environmental management,
disaster response, and other support or consulting services for the Army, Air Force, other
assigned U.S. Government agencies, and foreign governments. Environmental management
services include the rehabilitation of active and inactive military bases, formerly used defense
sites, or areas that house excess munitions. Expected changes in climate may necessitate
adjustments in rehabilitation approaches, engineering design parameters, and potential types of
military construction/infrastructure projects that USACE may be asked to support.
USACE projects are varied, complex, and at times, encompass multiple business lines. The
relationships among these business lines, with respect to impacts from climate change, are
complicated with cascading effects. The interrelationships between business lines must be
recognized as an essential component of future planning efforts when considering the best
methods or strategies to adapt. Figure 4.1 summarizes the projected climate trends and impacts
on each of the USACE business lines.
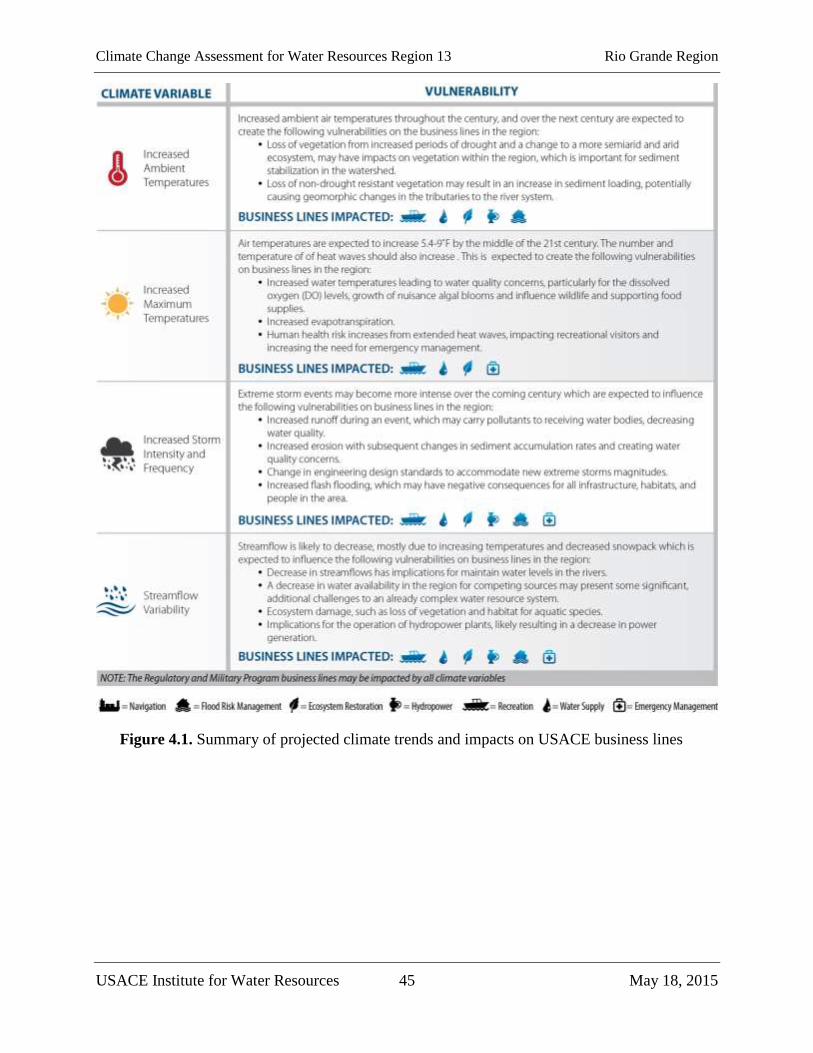
Climate Change Assessment for Water Resources Region 13 Rio Grande Region
USACE Institute for Water Resources 45 May 18, 2015
Figure 4.1. Summary of projected climate trends and impacts on USACE business lines
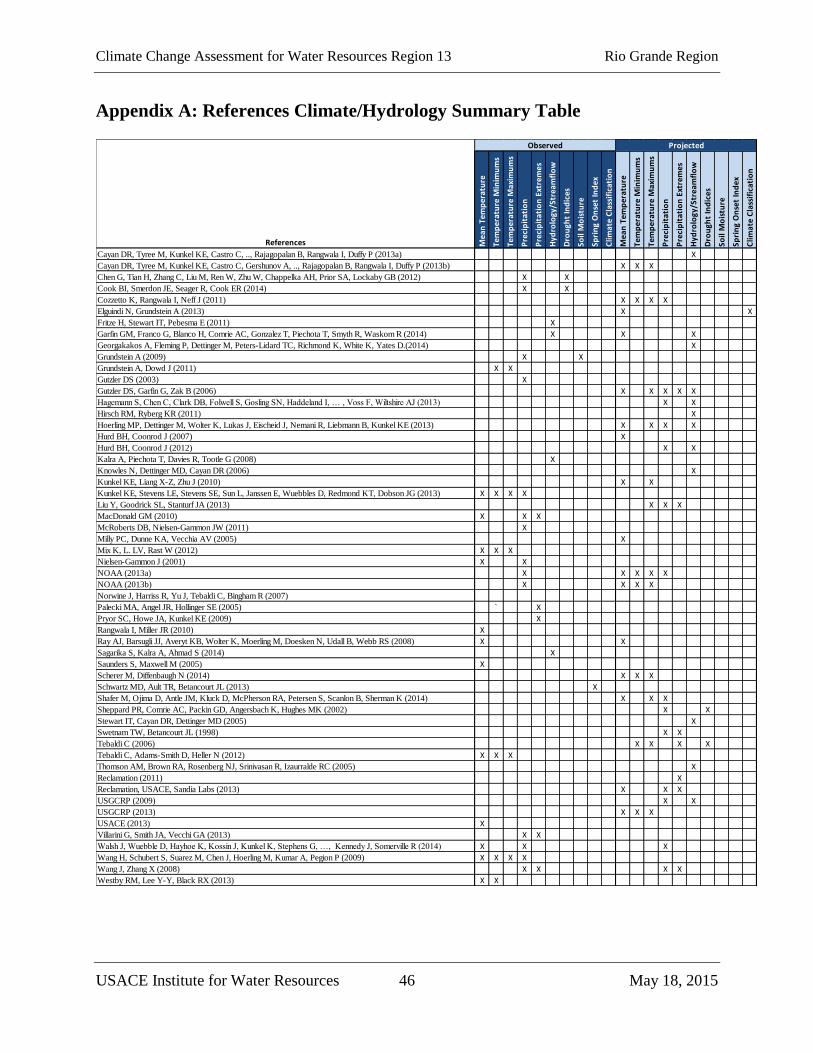
Climate Change Assessment for Water Resources Region 13 Rio Grande Region
USACE Institute for Water Resources 46 May 18, 2015
Appendix A: References Climate/Hydrology Summary Table
Observed Projected
Me
an T
em
pe
ratu
re
Tem
pe
ratu
re M
inim
um
s
Tem
pe
ratu
re M
axi
mu
ms
Pre
cip
itat
ion
Pre
cip
itat
ion
Ext
rem
es
Hyd
rolo
gy/S
tre
amfl
ow
Dro
ugh
t In
dic
es
Soil
Mo
istu
re
Spri
ng
On
set
Ind
ex
Clim
ate
Cla
ssif
icat
ion
Me
an T
em
pe
ratu
re
Tem
pe
ratu
re M
inim
um
s
Tem
pe
ratu
re M
axi
mu
ms
Pre
cip
itat
ion
Pre
cip
itat
ion
Ext
rem
es
Hyd
rolo
gy/S
tre
amfl
ow
Dro
ugh
t In
dic
es
Soil
Mo
istu
re
Spri
ng
On
set
Ind
ex
Clim
ate
Cla
ssif
icat
ion
Cayan DR, Tyree M, Kunkel KE, Castro C, .., Rajagopalan B, Rangwala I, Duffy P (2013a) X
Cayan DR, Tyree M, Kunkel KE, Castro C, Gershunov A, .., Rajagopalan B, Rangwala I, Duffy P (2013b) X X X
Chen G, Tian H, Zhang C, Liu M, Ren W, Zhu W, Chappelka AH, Prior SA, Lockaby GB (2012) X X
Cook BI, Smerdon JE, Seager R, Cook ER (2014) X X
Cozzetto K, Rangwala I, Neff J (2011) X X X X
Elguindi N, Grundstein A (2013) X X
Fritze H, Stewart IT, Pebesma E (2011) X
Garfin GM, Franco G, Blanco H, Comrie AC, Gonzalez T, Piechota T, Smyth R, Waskom R (2014) X X X
Georgakakos A, Fleming P, Dettinger M, Peters-Lidard TC, Richmond K, White K, Yates D.(2014) X
Grundstein A (2009) X X
Grundstein A, Dowd J (2011) X X
Gutzler DS (2003) X
Gutzler DS, Garfin G, Zak B (2006) X X X X X
Hagemann S, Chen C, Clark DB, Folwell S, Gosling SN, Haddeland I, … , Voss F, Wiltshire AJ (2013) X X
Hirsch RM, Ryberg KR (2011) X
Hoerling MP, Dettinger M, Wolter K, Lukas J, Eischeid J, Nemani R, Liebmann B, Kunkel KE (2013) X X X X
Hurd BH, Coonrod J (2007) X
Hurd BH, Coonrod J (2012) X X
Kalra A, Piechota T, Davies R, Tootle G (2008) X
Knowles N, Dettinger MD, Cayan DR (2006) X
Kunkel KE, Liang X-Z, Zhu J (2010) X X
Kunkel KE, Stevens LE, Stevens SE, Sun L, Janssen E, Wuebbles D, Redmond KT, Dobson JG (2013) X X X X
Liu Y, Goodrick SL, Stanturf JA (2013) X X X
MacDonald GM (2010) X X X
McRoberts DB, Nielsen-Gammon JW (2011) X
Milly PC, Dunne KA, Vecchia AV (2005) X
Mix K, L. LV, Rast W (2012) X X X
Nielsen-Gammon J (2001) X X
NOAA (2013a) X X X X X
NOAA (2013b) X X X X
Norwine J, Harriss R, Yu J, Tebaldi C, Bingham R (2007)
Palecki MA, Angel JR, Hollinger SE (2005) ` X
Pryor SC, Howe JA, Kunkel KE (2009) X
Rangwala I, Miller JR (2010) X
Ray AJ, Barsugli JJ, Averyt KB, Wolter K, Moerling M, Doesken N, Udall B, Webb RS (2008) X X
Sagarika S, Kalra A, Ahmad S (2014) X
Saunders S, Maxwell M (2005) X
Scherer M, Diffenbaugh N (2014) X X X
Schwartz MD, Ault TR, Betancourt JL (2013) X
Shafer M, Ojima D, Antle JM, Kluck D, McPherson RA, Petersen S, Scanlon B, Sherman K (2014) X X X
Sheppard PR, Comrie AC, Packin GD, Angersbach K, Hughes MK (2002) X X
Stewart IT, Cayan DR, Dettinger MD (2005) X
Swetnam TW, Betancourt JL (1998) X X
Tebaldi C (2006) X X X X
Tebaldi C, Adams-Smith D, Heller N (2012) X X X
Thomson AM, Brown RA, Rosenberg NJ, Srinivasan R, Izaurralde RC (2005) X
Reclamation (2011) X
Reclamation, USACE, Sandia Labs (2013) X X X
USGCRP (2009) X X
USGCRP (2013) X X X
USACE (2013) X
Villarini G, Smith JA, Vecchi GA (2013) X X
Walsh J, Wuebble D, Hayhoe K, Kossin J, Kunkel K, Stephens G, …, Kennedy J, Somerville R (2014) X X X
Wang H, Schubert S, Suarez M, Chen J, Hoerling M, Kumar A, Pegion P (2009) X X X X
Wang J, Zhang X (2008) X X X X
Westby RM, Lee Y-Y, Black RX (2013) X X
References

Climate Change Assessment for Water Resources Region 13 Rio Grande Region
USACE Institute for Water Resources 47 May 18, 2015
Appendix B: Reference List
Barnett TP, Pierce DW (2009) Sustainable water deliveries from the Colorado River in a
changing climate. Proceedings of the National Academy of Sciences of the United States of
America 106:7334-7338.
Cayan DR, Tyree M, Kunkel KE, Castro C, Gershunov A, Barsugli J, Overpeck J, Russell J,
Rajagopalan B, Rangwala I, Duffy P (2013a) Future climate: projected average. in Garfin G,
Jardine A, Merideth R, Black M, LeRoy S (eds.) Assessment of climate change in the Southwest
United States. Island Press, Washington, D.C., pp. 101-125.
Cayan DR, Tyree M, Kunkel KE, Castro C, Gershunov A, Barsugli J, Ray AJ, Overpeck JT,
Anderson M, Russell J, Rajagopalan B, Rangwala I, Duffy P (2013b) The Southwest climate of
the future - projections of mean climate. in Garfin G (ed.) Assessment of Climate Change in the
Southwest United States: A Report Prepared for the National Climate Assessment. NCA
Regional Input Reports. Island Press, Washington, D.C., p. 509.
Cayan DR, Das T, Pierce DW, Barnett TP, Tyree M, Gershunov A (2010) Future dryness in the
southwest US and the hydrology of the early 21st century drought. Proceedings of the National
Academy of Sciences of the United States of America 107:21271-212
CDM Smith (2012) Incorporating Climate Change into Water Supply Planning and Yield
Studies: A Demonstration and Comparison of Practical Methods
Chen G, Tian H, Zhang C, Liu M, Ren W, Zhu W, Chappelka AH, Prior SA, Lockaby GB
(2012) Drought in the Southern United States over the 20th century: Variability and its impacts
on terrestrial ecosystem productivity and carbon storage. Climatic Change 114:379-397.
Christensen NS, Wood AW, Voisin N, Lettenmaier DP, Palmer RN (2004) The effects of climate
change on the hydrology and water resources of the Colorado River basin. Climatic Change
62:337-363.
Cook BI, Smerdon JE, Seager R, Cook ER (2014) Pan-Continental Droughts in North America
over the Last Millennium. Journal of Climate 27:383-397.
Cook, BI , and R. Seager (2013), The response of the North American Monsoon to increased
greenhouse gas forcing, J. Geophys. Res. Atmos, 118, 1690–1699, doi:10.1002/jgrd.50111.
Cozzetto K, Rangwala I, Neff J (2011) Downscaled air temperature and precipitation projections
for the San Juan Mountain Region. Narrative on regional climate model projections submitted to
the San Juan Public Land Center, Durango, Colorado.
Elguindi N, Grundstein A (2013) An integrated approach to assessing 21st century climate
change over the contiguous U.S. using the NARCCAP RCM output. Climatic Change 117:809-
827.
Fritze H, Stewart IT, Pebesma E (2011) Shifts in Western North American Snowmelt Runoff
Regimes for the Recent Warm Decades. Journal of Hydrometeorology 12:989-1006.
Climate Change Assessment for Water Resources Region 13 Rio Grande Region
USACE Institute for Water Resources 48 May 18, 2015
Garfin GM, Franco G, Blanco H, Comrie AC, Gonzalez T, Piechota T, Smyth R, Waskom R
(eds.) (2014) Ch. 20 Southwest. Climate Change Impacts in the United States, U.S. Global
Change Research Program, p. 462-486.
Georgakakos, A., P. Fleming, M. Dettinger, C. Peters-Lidard, Terese (T.C.) Richmond, K.
Reckhow, K. White, and D. Yates, 2014: Ch. 3: Water Resources. Climate Change Impacts in
the United States: The Third National Climate Assessment, J. M. Melillo, Terese (T.C.)
Richmond, and G. W. Yohe, Eds., U.S. Global Change Research Program, 69-112.
doi:10.7930/J0G44N6T.
Grundstein A (2009) Evaluation of climate change over the continental United States using a
moisture index. Climatic Change 93:103-115.
Grundstein A, Dowd J (2011) Trends in extreme apparent temperatures over the United States,
1949-2010. Journal of Applied Meteorology and Climatology 50:1650-1653.
Gutzler DS (2003) Drought in New Mexico: History, causes and future prospects. in Johnson PS,
Land LA, Price LG, Titus F (eds.) Water Resources of the Lower Pecos Region, New Mexico—
Science, Policy, and a Look to the Future Decision-Makers Field Guide New Mexico Bureau of
Geology and Mineral Resources, Socorro, New Mexico, pp. 101-105.
Gutzler DS, Garfin G, Zak B (2006) Observed and predicted impacts of climate change on New
Mexico's water supplies. in Watkins A (ed.) The impact of climate change on New Mexico's
water supply and ability to manage water resources. New Mexico Office of the State
Engineer/Interstate Stream Commission, Santa Fe, New Mexico, pp. 4-32.
Hagemann S, Chen C, Clark DB, Folwell S, Gosling SN, Haddeland I, Hanasaki N, Heinke J,
Ludwig F, Voss F, Wiltshire AJ (2013) Climate change impact on available water resources
obtained using multiple global climate and hydrology models. Earth System Dynamics 4:129-
144.
Hirsch RM, Ryberg KR (2011) Has the magnitude of floods across the USA changed with global
CO2 levels? Hydrological Sciences Journal 57:1-9.
Hoerling MP, Dettinger M, Wolter K, Lukas J, Eischeid J, Nemani R, Liebmann B, Kunkel KE
(2013) Chapter 5: Present weather and Climate: evolving Conditions. in Garfin G JA, Merideth
R, Black M, LeRoy S (eds.), National Climate Assessment (ed.) Assessment of climate change in
southwest United States : a report prepared for the National Climate Assessment. Island Press,
Washington, D.C., pp. pp. 74-100.
Hurd BH, Coonrod J (2007) Climate Change and its Implications for New Mexico's Water
Resources and Economic Opportunities. New Mexico State University, Agricultural Experiment
Station Technical Report 45, Las Cruces, New Mexico.
Hurd BH, Coonrod J (2012) Hydro-economic consequences of climate change in the upper Rio
Grande. Clim. Res. Climate Research 53:103-118.
Kalra A, Piechota T, Davies R, Tootle G (2008) Changes in U.S. Streamflow and Western U.S.
Snowpack. Journal of Hydrologic Engineering 13:156-163.
Climate Change Assessment for Water Resources Region 13 Rio Grande Region
USACE Institute for Water Resources 49 May 18, 2015
Knowles N, Dettinger MD, Cayan DR (2006) Trends in snowfall versus rainfall in the Western
United States. J. Clim. 19:4545-4559.
Kunkel KE, Liang X-Z, Zhu J (2010) Regional climate model projections and uncertainties of
U.S. summer heat waves. Journal of Climate 23:4447-4458.
Kunkel KE, Stevens LE, Stevens SE, Sun L, Janssen E, Wuebbles D, Redmond KT, Dobson JG
(2013) NOAA Technical Report NESDIS 142-5: Regional Climate Trends and Scenarios for the
U.S. National Climate Assessment. Part 5. Climate of the Southwest U.S. National Oceanic and
Atmospheric Administrayion (NOAA), National Environmenatl Satellite,Data, and Information
Service (NESDIS), pp. 1-79.
Leung LR, Qian Y, Bian X, Washington WM, Han J, Roads JO (2004) Mid-century ensemble
regional climate change scenarios for the western United States. Climatic Change 62:75-113.
Liu Y, Goodrick SL, Stanturf JA (2013) Future U.S. wildfire potential trends projected using a
dynamically downscaled climate change scenario. Forest Ecology and Management 294:120-
135.
McCabe GJ, Palecki MA, Betancourt JL (2004) Pacific and Atlantic Ocean influence on
multidecadal drought frequency in the United States. Proceedings of the National Academy of
Sciences of the United States of America 101:4136-4141.
MacDonald GM (2010) Water, climate change, and sustainability in the southwest. Proceedings
of the National Academy of Sciences of the United States of America 107:21256-21262.
McRoberts DB, Nielsen-Gammon JW (2011) A new homogenized climate division precipitation
dataset for analysis of climate variability and climate change. Journal of Applied Meteorology
and Climatology 50:1187-1199.
Milly PC, Dunne KA, Vecchia AV (2005) Global pattern of trends in streamflow and water
availability in a changing climate. Nature 438:347-350.
Mix K, L. LV, Rast W (2012) Growing season expansion and related changes in monthly
temperature and growing degree days in the Inter-Montane Desert of the San Luis Valley,
Colorado. Clim. Change Climatic Change 114:723-744.
Munson SM, Belnap J, Okin GS (2011) Responses of wind erosion to climate-induced
vegetation changes on the Colorado Plateau. Proceedings of the National Academy of Sciences
of the United States of America 108:3854-3859.
Nielsen-Gammon J (2011) The Changing Climate of Texas. in Schmandt J, Clarkson J, North
GR (eds.) The Impact of Global Warming on Texas, 2nd edition. University of Texas Press,
Austin, TX, pp. 14-38.
NOAA (2013a) Regional climate trends and scenarios for the U.S. National Climate Assessment:
Part 4. Climate of the U.S. Great Plains. U.S. Department of Commerce, National Oceanic and
Atmospheric Administration, Washington, D.C.
Climate Change Assessment for Water Resources Region 13 Rio Grande Region
USACE Institute for Water Resources 50 May 18, 2015
NOAA (2013b) Regional climate trends and scenarios for the U.S. National Climate Assessment:
Part 5. Climate of the Southwest U.S. U.S. Department of Commerce, National Oceanic and
Atmospheric Administration, Washington, D.C.
Norwine J, Harriss R, Yu J, Tebaldi C, Bingham R (2007) The problematic climate of south
Texas 1900-2100. in Norwine J, John K (eds.) The Changing Climate of South Texas 1900-
2100: Problems and Prospects, Impacts and Implications. CREST-RESSACA, Texas A&M
University, Kingsville, TX, pp. 15-55.
Palecki MA, Angel JR, Hollinger SE (2005) Storm precipitation in the United States. Part I:
Meteorological characteristics. Journal of Applied Meteorology 44:933-946.
Pryor SC, Howe JA, Kunkel KE (2009) How spatially coherent and statistically robust are
temporal changes in extreme precipitation in the contiguous USA? International Journal of
Climatology 29:31-45.
Rangwala I, Miller JR (2010) Twentieth Century Temperature Trends in Colorado's San Juan
Mountains. Arctic, Antarctic, and Alpine Research 42:89-97.
Ray AJ, Barsugli JJ, Averyt KB, Wolter K, Moerling M, Doesken N, Udall B, Webb RS (2008)
Climate change in Colorado: a synthesis to support water resources management and adaptation.
A report for the Colorado Water Conservation Board, Boulder, Colorado.
Sagarika S, Kalra A, Ahmad S (2014) Evaluating the effect of persistence on long-term trends
and analyzing step changes in streamflows of the continental United States. Journal of Hydrology
517:36-53.
Saunders S, Maxwell M (2005) Less snow, less water: climate disruption in the West. Rocky
Mountain Climate Organization; Clear the Air, Louisville, CO; Washington, DC.
Scherer M, Diffenbaugh N (2014) Transient twenty-first century changes in daily-scale
temperature extremes in the United States. Climate Dynamics 42:1383-1404.
Schwartz MD, Ault TR, Betancourt JL (2013) Spring onset variations and trends in the
continental United States: Past and regional assessment using temperature-based indices.
International Journal of Climatology 33:2917-2922.
Shafer, M., D. Ojima, J. M. Antle, D. Kluck, R. A. McPherson, S. Petersen, B. Scanlon, and K.
Sherman, 2014: Ch. 19: Great Plains. Climate Change Impacts in the United States: The Third
National Climate Assessment, J. M. Melillo, Terese (T.C.) Richmond, and G. W. Yohe, Eds.,
U.S. Global Change Research Program, 441-461. doi:10.7930/J0D798BC.
Sheppard PR, Comrie AC, Packin GD, Angersbach K, Hughes MK (2002) The climate of the US
Southwest. Climate Research 21:219-238.
Stewart IT, Cayan DR, Dettinger MD (2005) Changes toward earlier streamflow timing across
western North America. J. Clim. 18:1136-1155.
Climate Change Assessment for Water Resources Region 13 Rio Grande Region
USACE Institute for Water Resources 51 May 18, 2015
Swetnam TW, Betancourt JL (1998) Mesoscale disturbance and ecological response to decadal
climatic variability in the American Southwest. J. Clim. 11:3128-3147.
Tebaldi C (2006) Going To The Extremes: An Intercomparison of Model-Simulated Historical
and Future Changes in Extreme Events. Climate Change 79:185-211.
Tebaldi C, Adams-Smith D, Heller N (2012) The Heat is On: U.S. Temperature Trends. Climate
Central, Palo Alto, California, p. 17.
Thomson AM, Brown RA, Rosenberg NJ, Srinivasan R, Izaurralde RC (2005) Climate change
impacts for the conterminous USA: An integrated assessment: Part 4: Water resources. Climatic
Change 69:67-88.
U.S. Bureau of Reclamation (2011) SECURE Water Act Section 9503(c) - Reclamation climate
change and water, report to Congress, 2011. U.S. Department of the Interior, Bureau of
Reclamation, Office of Policy and Administration, Denver, Colorado.
U.S. Bureau of Reclamation, U.S. Army Corps of Engineers (USACE) and Sandia National
Laboratories (Sandia), (2013) West-Wide Climate Risk Assessment: Upper Rio Grande Impact
Assessment. U.S. Bureau of Reclamation, Upper Colorado Region, Albuquerque Area Office
(December 2013), Albuquerque, NM.
U.S. Global Change Research Program (USGCRP) (2009) Global Climate Change Impacts in the
United States. Cambridge University Press, Cambridge, United Kingdom.
USACE (2013) Observed Climate Trends in the Upper Rio Grande Basin. U.S. Army Corps of
Engineers Institute for Water Resources Responses to Climate Change Program, Albuquerque,
NM.
Villarini G, Smith JA, Vecchi GA (2013) Changing Frequency of Heavy Rainfall over the
Central United States. Journal of Climate 26:351-357.
Walsh J, Wuebble D, Hayhoe K, Kossin J, Kunkel K, Stephens G, Thorne P, Vose R, Wehner M,
Willis J, Anderson D, Kharin V, Knutson T, Landerer F, Lenton T, Kennedy J, Somerville R
(2014) Appendix 3: Climate Science Supplement. in Melillo JM, Richmond TC, Yohe GW (eds.)
Ch 2: Our Changing Climate. Climate Change Impacts in the United States: The Third National
Climate Assessment. . U.S. Global Change Research Program:19-67.
Wang H, Schubert S, Suarez M, Chen J, Hoerling M, Kumar A, Pegion P (2009) Attribution of
the seasonality and regionality in climate trends over the United States during 1950-2000.
Journal of Climate 22:2571-2590.
Wang J, Zhang X (2008) Downscaling and projection of winter extreme daily precipitation over
North America. Journal of Climate 21:923-937.
Wehner M, Easterling DR, Lawrimore JH, Heim RR, Vose RS, Santer BD (2011) Projections of
Future Drought in the Continental United States and Mexico. Journal of Hydrometeorology
12:1359-1377.

Climate Change Assessment for Water Resources Region 13 Rio Grande Region
USACE Institute for Water Resources 52 May 18, 2015
Westby RM, Lee Y-Y, Black RX (2013) Anomalous temperature regimes during the cool
season: Long-term trends, low-frequency mode modulation, and representation in CMIP5
simulations. Journal of Climate 26:9061-9076.
Prepared by:
www.cdmsmith.com