Embed Size (px)
Citation preview

DISCOVERY MARINE SURVEY AND SUPPORT
Hydrographic Survey of Newlyn Harbour,
Cornwall.
Imagery ©2017 Infoterra Ltd & Bluesky, DigitalGlobe, Map data ©2017 Google
Survey Report
Date: 30/05/2017
Project: H2O-615-DMS

Hydrographic Survey of Newlyn
Harbour, Cornwall.
Survey Report
Author: Mark Gray
Checker: Matt King
Approver: Trevor Butler
Report No.: H2O-615-DMS
Revision: V1
Date: 30/05/2017
Discovery Marine Survey & Support
24 Galleon Court Newquay TR72AU
T: 07929330762 www.discoverymarinesurvey.co.uk
Swathe Services (UK) Ltd 1 Calenick House
Truro Technology Park Heron Way, Newham
Truro, TR1 2XN
T: +44 (0) 187 227 5642 www.swathe-services.com

Executive Summary
A hydrographic survey was undertaken in the Newlyn Harbour, Cornwall, UK
using an Unmanned Survey Vessel (USV) and Single Beam Echo Sounder (SBES)
sonar system combined with Hemisphere AtlasLink L-band corrections to
provide positioning. The purpose was to gain sufficient bathymetric data of the
designated site to allow for pre-dredge assessment.
All onsite operations took place between 22nd May 2017 and 24th May 2017,
with standard operating hours (including travel to site, mobilisation and
demobilisation and equipment maintenance) between 08:00 – 19:00 (UTC).
Survey operations were carried out utilising the Unmanned Survey Solutions
Mark II, Inception class USV and CEE HydroSystems CEESCOPE-USV SBES.
Survey planning, data acquisition and post-processing were all conducted with
the HYPACK Hydrographic software package. All deliverables and data images
provided with this report have been created by or directly taken from the
processing software, unless expressly stated. The attached charts have been
presented in WGS84, UTM North Zone 30 with depths referenced to Chart
Datum via tidal data from the Newlyn Tide Gauge, provided by the British
Oceanographic Data Centre.
No dangerous incidents or near misses occurred during survey operations.

Newlyn Harbour Survey Report
4 | P a g e
Table of Contents Executive Summary ................................................................................................................................. 3
1. Scope of Work ............................................................................................................................... 5
2. Survey Overview ........................................................................................................................... 6
2.1. Schedule of Activities .................................................................................................................... 6
2.2. Geodetic Parameters .................................................................................................................... 7
3. Equipment ..................................................................................................................................... 7
4. Personnel ...................................................................................................................................... 8
5. Survey Methodology ..................................................................................................................... 8
5.1. Mobilisation, Deployment, Offsets ............................................................................................... 8
5.2. Survey plan and online operations ............................................................................................... 9
5.3. Equipment and survey methodology .......................................................................................... 12
5.3.1. Tide and vertical referencing ................................................................................................. 12
5.3.2. Echo Sounder ......................................................................................................................... 12
5.3.3. Positioning ............................................................................................................................. 12
5.4. Post-processing Summary .......................................................................................................... 14
6. Deliverables ................................................................................................................................ 15
7. Equipment Specifications ........................................................................................................... 17
7.1 Hemisphere AtlasLink ................................................................................................................. 17
7.2 CEE HYDROSYSTEMS CEESCOPE Echosounder ........................................................................... 19
7.3 CEE HYDROSYSTEMS CEE-LINK.................................................................................................... 20
Table of Figures and Tables
+
Figure 1 – Imagery ©2017 Infoterra Ltd & Bluesky, DigitalGlobe, Map data ©2017 Google ________________ 5 Table 1. Schedule of Activities __________________________________________________________________ 6 Figure 2. Geodetic Parameters used for acquiring and post-processing of survey data, as entered in the HYPACK
software. __________________________________________________________________________________ 7 Figure 3. 'Inception' Class USV with CEESCOPE-USV SBES ___________________________________________ 8 Figure 4. CEESCOPE and GNSS offsets in HYPACK __________________________________________________ 9 Figure 5. Planned run lines, further coverage was attained by piloting the USV visually where planned run line
were impractical. ___________________________________________________________________________ 10 Figure 6. Survey Matrix (3m*3m) denoting coverage achieved. ______________________________________ 11 Figure 7. Position check screenshot over OS rivet _________________________________________________ 13 Figure 8. Position check Comparison & location of OS Rivet with Google Maps _________________________ 13 Figure 9. Raw single beam data _______________________________________________________________ 14 Figure 10. Raw single beam data with filter applied (denoted by red X’s). ______________________________ 14 Figure 11. Example Search and filter options, as entered in processing. _______________________________ 15
Newlyn Harbour Survey Report
5 | P a g e
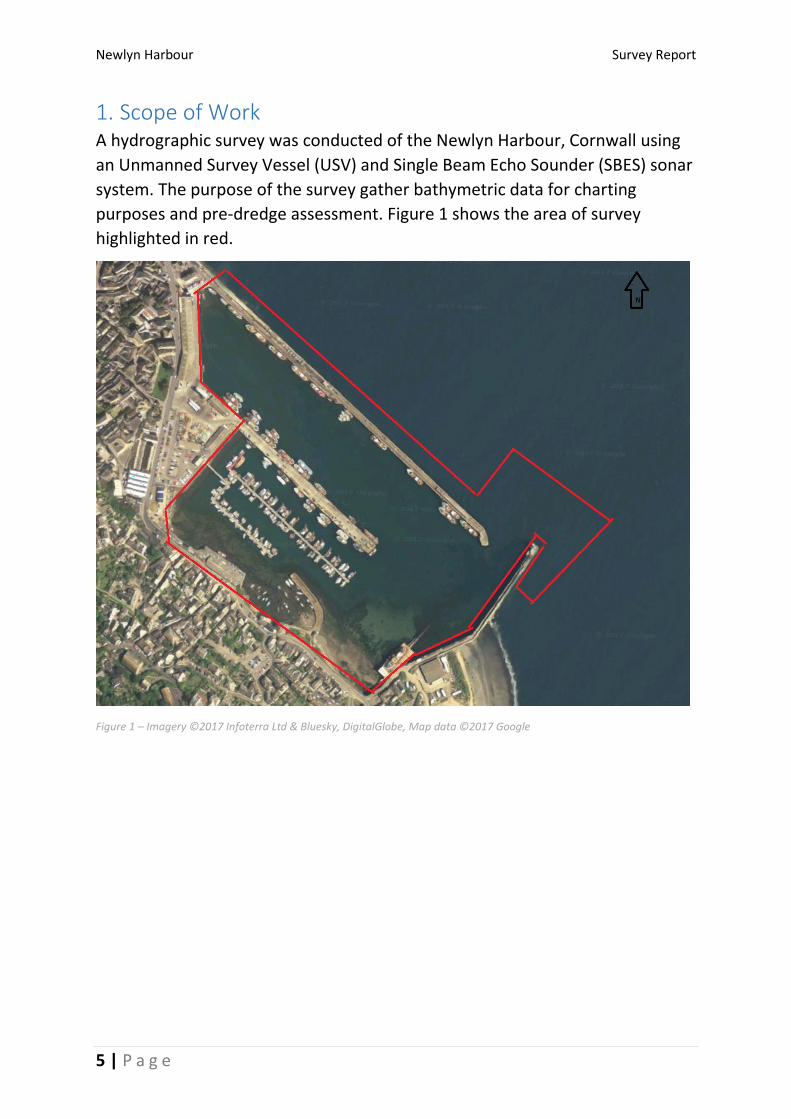
1. Scope of Work A hydrographic survey was conducted of the Newlyn Harbour, Cornwall using
an Unmanned Survey Vessel (USV) and Single Beam Echo Sounder (SBES) sonar
system. The purpose of the survey gather bathymetric data for charting
purposes and pre-dredge assessment. Figure 1 shows the area of survey
highlighted in red.
Figure 1 – Imagery ©2017 Infoterra Ltd & Bluesky, DigitalGlobe, Map data ©2017 Google
Newlyn Harbour Survey Report
6 | P a g e
2. Survey Overview
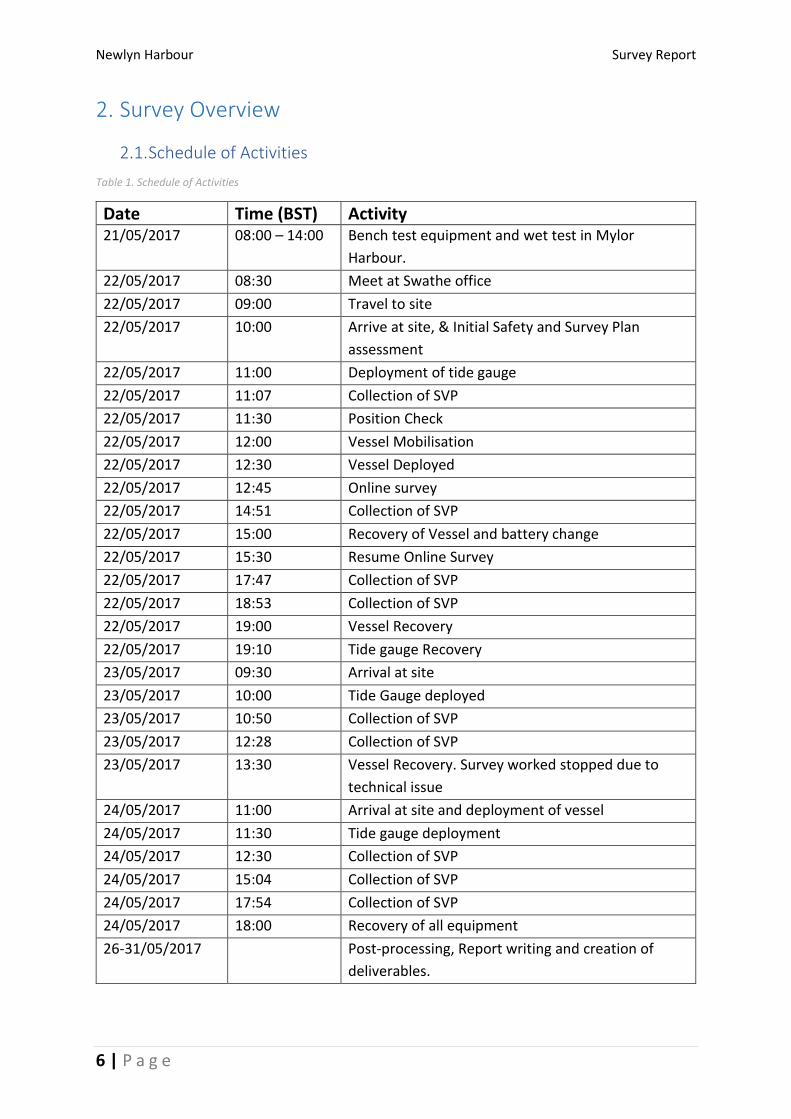
2.1. Schedule of Activities
Table 1. Schedule of Activities
Date Time (BST) Activity 21/05/2017 08:00 – 14:00 Bench test equipment and wet test in Mylor
Harbour.
22/05/2017 08:30 Meet at Swathe office
22/05/2017 09:00 Travel to site
22/05/2017 10:00 Arrive at site, & Initial Safety and Survey Plan
assessment
22/05/2017 11:00 Deployment of tide gauge
22/05/2017 11:07 Collection of SVP
22/05/2017 11:30 Position Check
22/05/2017 12:00 Vessel Mobilisation
22/05/2017 12:30 Vessel Deployed
22/05/2017 12:45 Online survey
22/05/2017 14:51 Collection of SVP
22/05/2017 15:00 Recovery of Vessel and battery change
22/05/2017 15:30 Resume Online Survey
22/05/2017 17:47 Collection of SVP
22/05/2017 18:53 Collection of SVP
22/05/2017 19:00 Vessel Recovery
22/05/2017 19:10 Tide gauge Recovery
23/05/2017 09:30 Arrival at site
23/05/2017 10:00 Tide Gauge deployed
23/05/2017 10:50 Collection of SVP
23/05/2017 12:28 Collection of SVP
23/05/2017 13:30 Vessel Recovery. Survey worked stopped due to
technical issue
24/05/2017 11:00 Arrival at site and deployment of vessel
24/05/2017 11:30 Tide gauge deployment
24/05/2017 12:30 Collection of SVP
24/05/2017 15:04 Collection of SVP
24/05/2017 17:54 Collection of SVP
24/05/2017 18:00 Recovery of all equipment
26-31/05/2017 Post-processing, Report writing and creation of
deliverables.

Newlyn Harbour Survey Report
7 | P a g e
2.2. Geodetic Parameters
All data was acquired in WGS84 UTM North Zone 30. The geodetics in the project was set up by the Swathe Services Surveyor, then checked and agreed upon by the Discovery Marine Survey and Support representative. Figure 2 is a screen shot demonstrating the parameters as entered in HYPACK.
Figure 2. Geodetic Parameters used for acquiring and post-processing of survey data, as entered in the HYPACK software.
3. Equipment
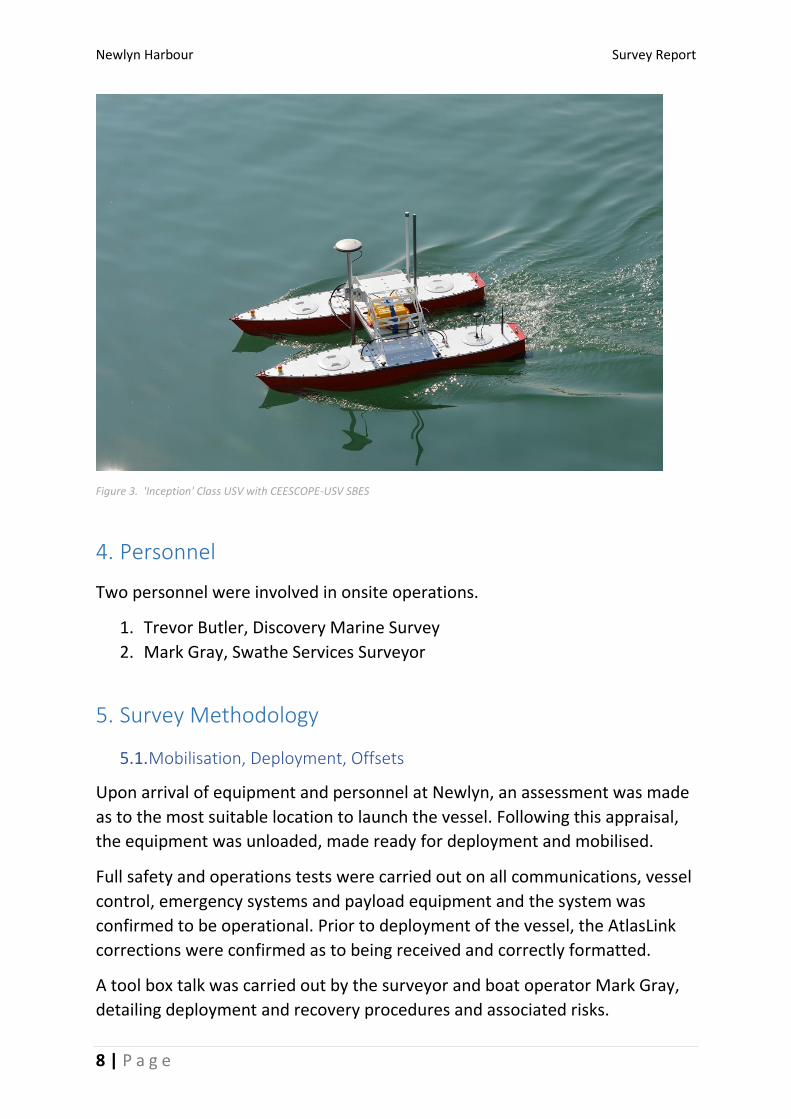
USV ‘Inception’ mark II is a 2m long multi-hulled remote control boat made of
aluminium. It is powered by x2 12v DC lead acid batteries driving x2 brushless
thrusters. The payload consists of a CEE-Hydrosystems CEESCOPE-USV which is
a combined SBES, GNSS and telemetry system.
A Valeport miniSVP Sound Velocity Profiler (SVP) was used to determine the
speed of sound within the harbour. This is required for accurate depth
calculations using the sonar system. Tidal data was also collected using a
Valeport WLR recorder, this acted as a redundancy in case a reliable tide file
from the Newlyn tide gauge was unobtainable.
Newlyn Harbour Survey Report
8 | P a g e
Figure 3. 'Inception' Class USV with CEESCOPE-USV SBES
4. Personnel
Two personnel were involved in onsite operations.
1. Trevor Butler, Discovery Marine Survey
2. Mark Gray, Swathe Services Surveyor
5. Survey Methodology
5.1. Mobilisation, Deployment, Offsets
Upon arrival of equipment and personnel at Newlyn, an assessment was made
as to the most suitable location to launch the vessel. Following this appraisal,
the equipment was unloaded, made ready for deployment and mobilised.
Full safety and operations tests were carried out on all communications, vessel
control, emergency systems and payload equipment and the system was
confirmed to be operational. Prior to deployment of the vessel, the AtlasLink
corrections were confirmed as to being received and correctly formatted.
A tool box talk was carried out by the surveyor and boat operator Mark Gray,
detailing deployment and recovery procedures and associated risks.
Newlyn Harbour Survey Report
9 | P a g e
Once the USV had been successfully deployed, the personnel charged with
deployment then transited the vessel to the specified area of survey for the
given day and commenced hydrographic survey operations.
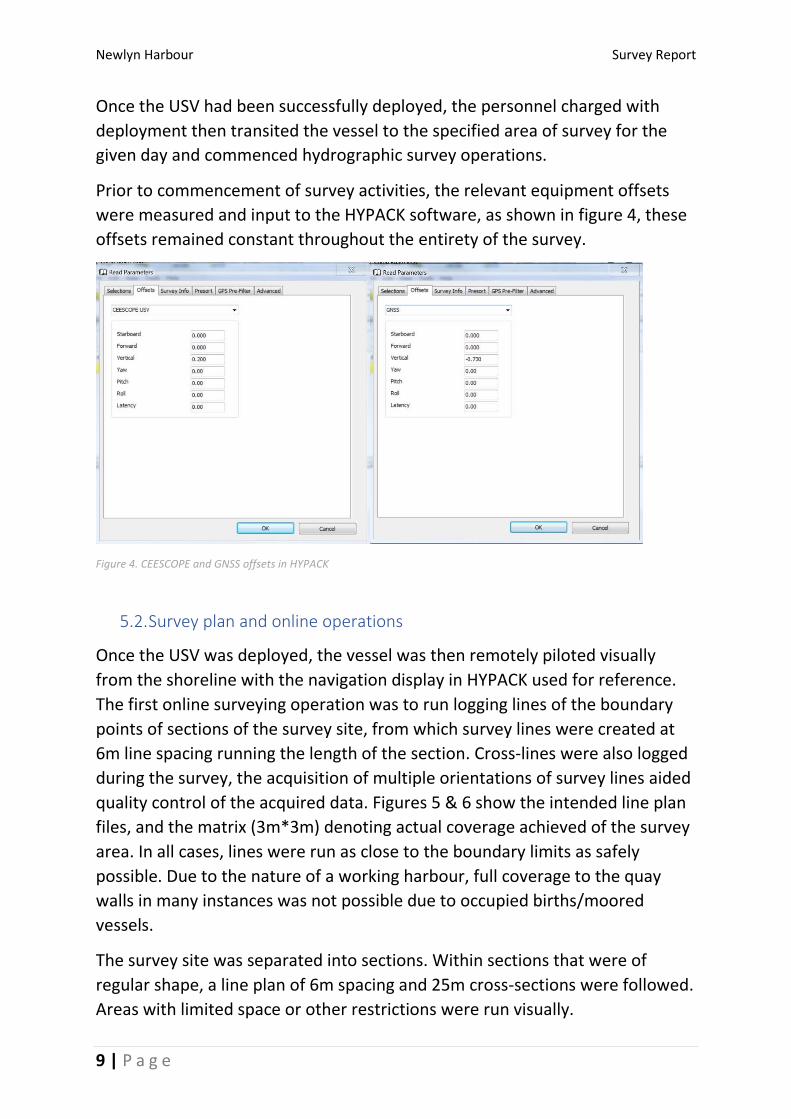
Prior to commencement of survey activities, the relevant equipment offsets
were measured and input to the HYPACK software, as shown in figure 4, these
offsets remained constant throughout the entirety of the survey.
Figure 4. CEESCOPE and GNSS offsets in HYPACK
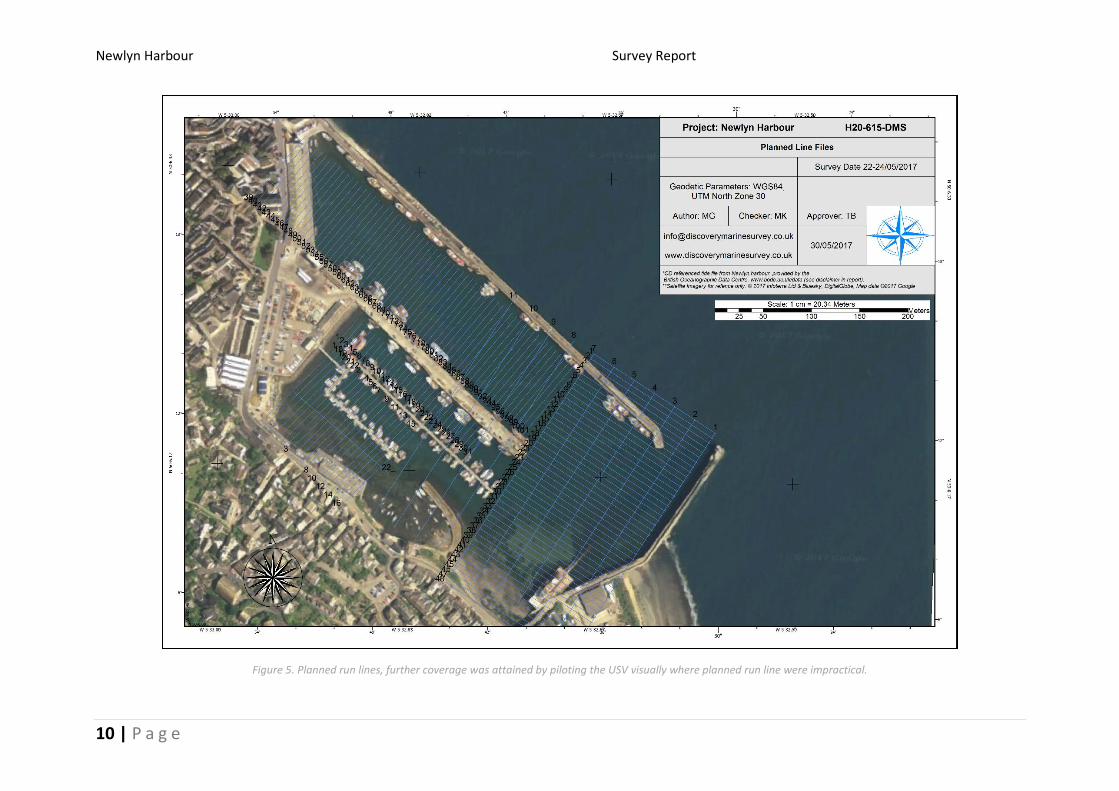
5.2. Survey plan and online operations
Once the USV was deployed, the vessel was then remotely piloted visually
from the shoreline with the navigation display in HYPACK used for reference.
The first online surveying operation was to run logging lines of the boundary
points of sections of the survey site, from which survey lines were created at
6m line spacing running the length of the section. Cross-lines were also logged
during the survey, the acquisition of multiple orientations of survey lines aided
quality control of the acquired data. Figures 5 & 6 show the intended line plan
files, and the matrix (3m*3m) denoting actual coverage achieved of the survey
area. In all cases, lines were run as close to the boundary limits as safely
possible. Due to the nature of a working harbour, full coverage to the quay
walls in many instances was not possible due to occupied births/moored
vessels.
The survey site was separated into sections. Within sections that were of
regular shape, a line plan of 6m spacing and 25m cross-sections were followed.
Areas with limited space or other restrictions were run visually.
Newlyn Harbour Survey Report
10 | P a g e
Figure 5. Planned run lines, further coverage was attained by piloting the USV visually where planned run line were impractical.

Newlyn Harbour Survey Report
11 | P a g e
Figure 6. Survey Matrix (3m*3m) denoting coverage achieved.
Newlyn Harbour Survey Report
12 | P a g e
5.3. Equipment and survey methodology
5.3.1. Tide and vertical referencing
Without provision of a harbour authority approved tide file, all data has been
applied with a tide file obtained from the British Oceanographic data centre.
The data was collected from the Newlyn tide gauge and is referenced to chart
datum. The data is freely available from https://www.bodc.ac.uk/data. Due to
the project time constraints, the applied tide file is RAW and supplied with the
following disclaimer “Raw data files of sea surface elevation are made available
to provide immediate access for the convenience of interested persons. These
data are raw data and have not been through quality control. While BODC
believes the information to be reliable, human or mechanical error remains a
possibility. Therefore, the NERC does not guarantee the accuracy,
completeness, timeliness, or correct sequencing of the information. Neither
BODC, NERC nor any of the sources of the information shall be responsible for
any errors or omissions, or for the use of or results obtained from the use of
this information”. Prior to application, the tidal data was checked and
compared to predicted tides. However, both Discovery Marine Survey and
Swathe Services emphasize, acknowledge and repeat this disclaimer for all tide
applied data submitted to the client.
Whilst an independent tide gauge was deployed for the entirety of the survey
operation, it has been kept as a redundancy system if no Chart Datum
referenced tidal data was available.
5.3.2. Echo Sounder
A CEE HYDROSYSTEMS CEESCOPE echo sounder was used for the survey. Data
was collected at 20Hz ping rate, utilising a 200kHz frequency transducer with a
9-degree beam width.
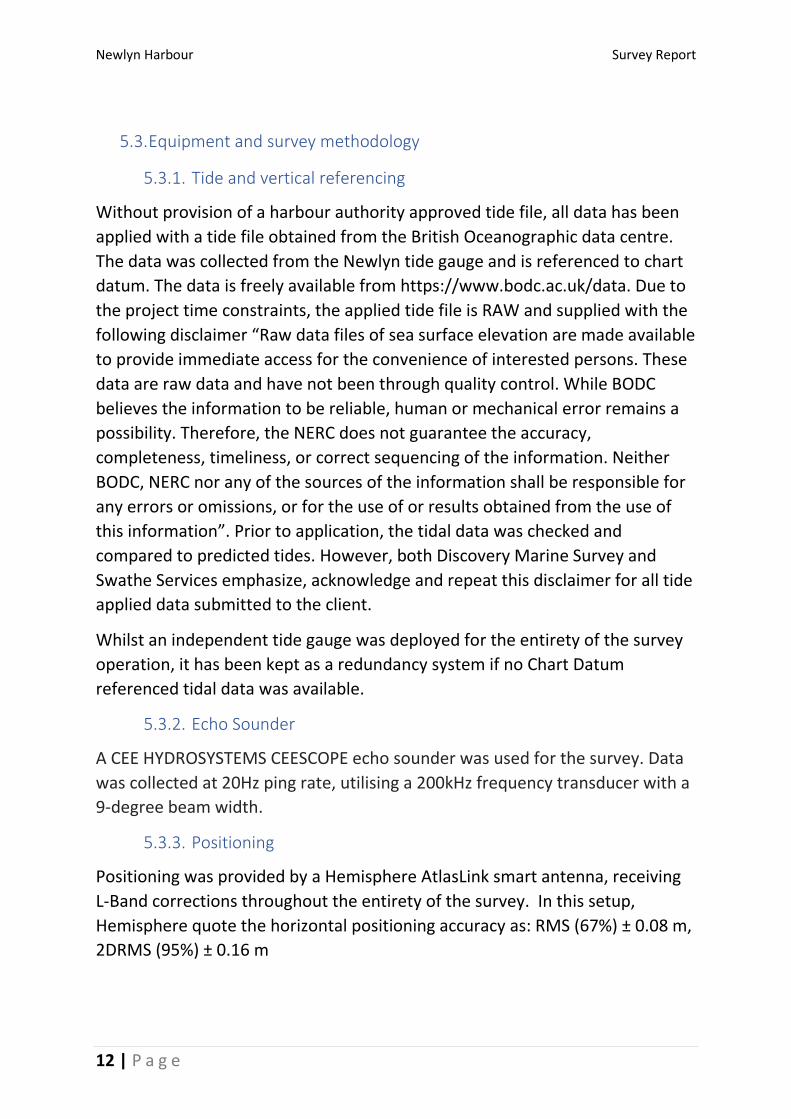
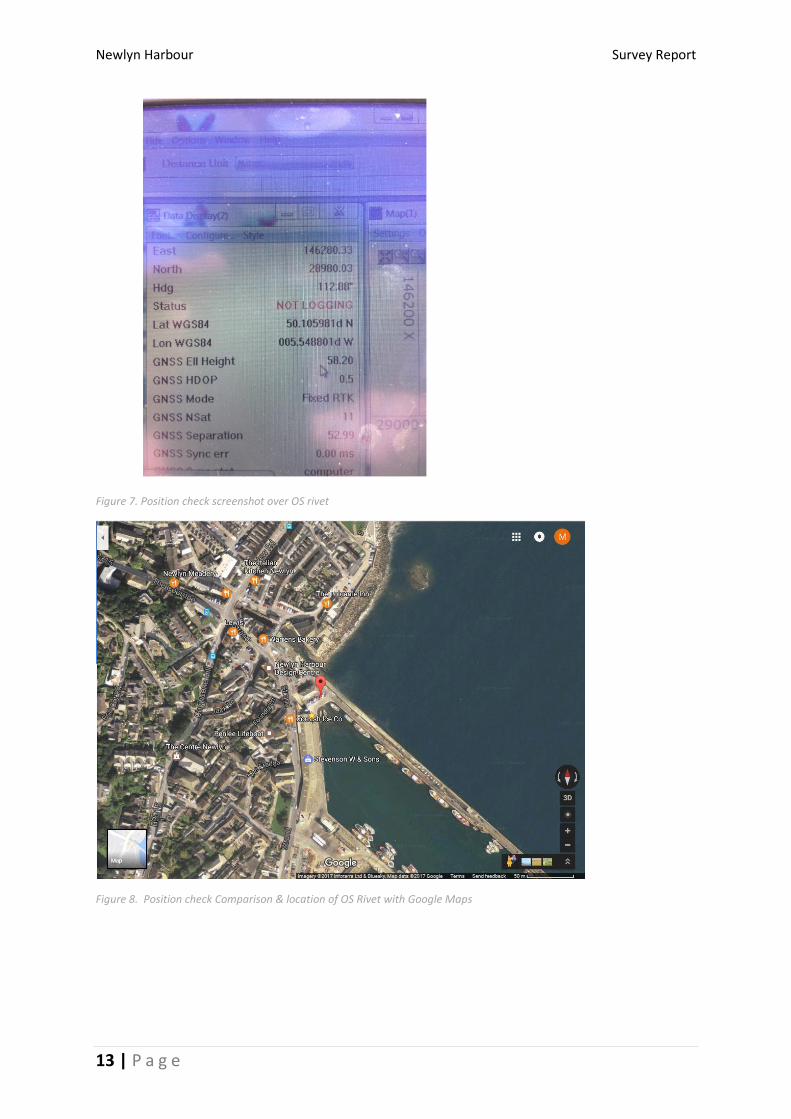
5.3.3. Positioning
Positioning was provided by a Hemisphere AtlasLink smart antenna, receiving
L-Band corrections throughout the entirety of the survey. In this setup,
Hemisphere quote the horizontal positioning accuracy as: RMS (67%) ± 0.08 m,
2DRMS (95%) ± 0.16 m
Newlyn Harbour Survey Report
13 | P a g e
Figure 7. Position check screenshot over OS rivet
Figure 8. Position check Comparison & location of OS Rivet with Google Maps
Newlyn Harbour Survey Report
14 | P a g e
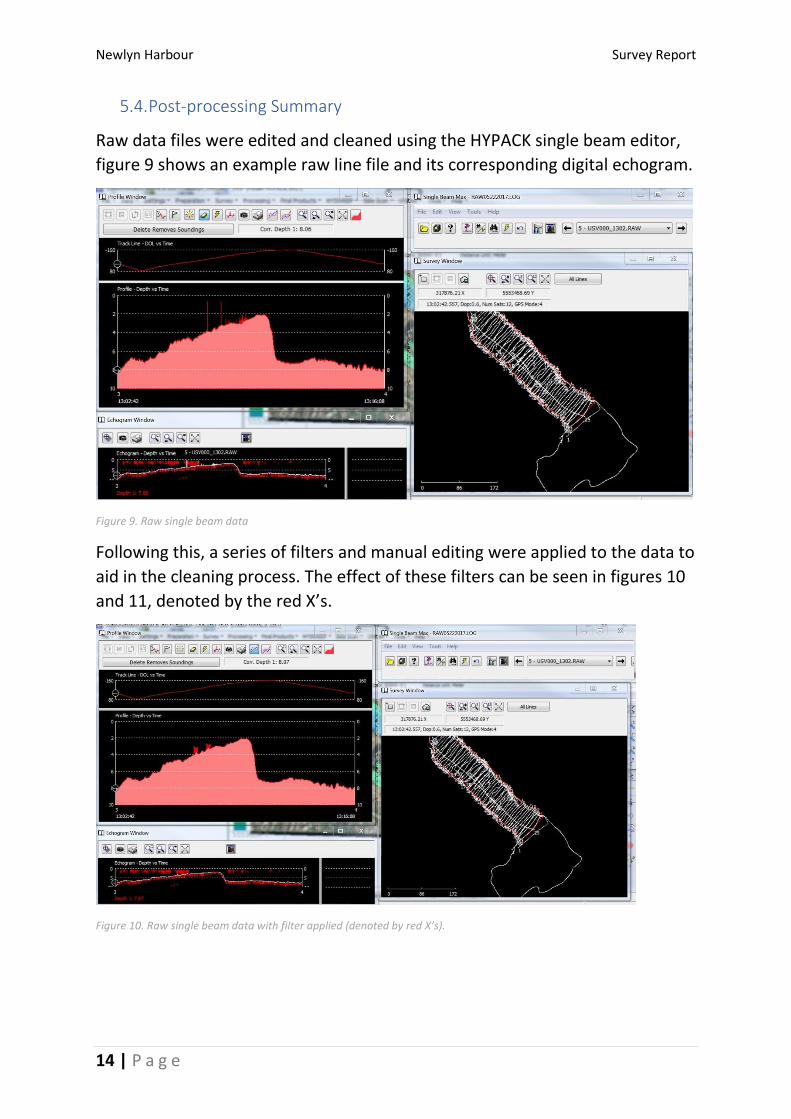
5.4. Post-processing Summary
Raw data files were edited and cleaned using the HYPACK single beam editor,
figure 9 shows an example raw line file and its corresponding digital echogram.
Figure 9. Raw single beam data
Following this, a series of filters and manual editing were applied to the data to
aid in the cleaning process. The effect of these filters can be seen in figures 10
and 11, denoted by the red X’s.
Figure 10. Raw single beam data with filter applied (denoted by red X’s).

Newlyn Harbour Survey Report
15 | P a g e
Figure 11. Example Search and filter options, as entered in processing.
Once editing was complete, data was exported in three main forms. 1. Daily
RAW unprocessed XYZs without the application of tide files or SVPs. 2. Daily
RAW unprocessed XYZs with tide files and SVPs applied. 3. Fully processed
XYZs, with tide files and SVPs applied. These are submitted by day, full site,
inside the harbour, outside the harbour and XYZ sorts at a range of XY
intervals.
These fully processed XYZs were then used to create both the TIN
(Triangulated Irregular Network) models and contours that the charts consist
of. These were created using the HYPACK TIN editor. This program creates
surface models from XYZ data files by connecting adjacent data points in
optimised triangles.
6. Deliverables
• All Raw logged single beam files
• All Edited single beam files, with applied tide and SVPs
• XYZs

Newlyn Harbour Survey Report
16 | P a g e
o Fully Processed: 1m sort, 2m, 3m, 4m, 5m, 10m, and 20m sorted
XYZs
o Daily XYZs: RAW data with no tide or SVPs applied
o Daily XYZs: With the Newlyn tide gauge data and collected SVPs
applied.
A series of charts has been created and supplied with this survey report, this
series consists of:
• Solid fill 0.1m Tin model with 1m contours tin model, depths relevant to
Chart datum
• Solid fill 0.1m Tin Model with 20m*20m sorted soundings, depths
relevant to Chart datum
• Fair sheet denoting survey lines ran (5m*5m sort), depths relevant to
Chart datum.
All printed charts have been appended to this report.

Newlyn Harbour Survey Report
17 | P a g e
7. Equipment Specifications
7.1 Hemisphere AtlasLink

Newlyn Harbour Survey Report
18 | P a g e

Newlyn Harbour Survey Report
19 | P a g e
7.2 CEE HYDROSYSTEMS CEESCOPE Echosounder

Newlyn Harbour Survey Report
20 | P a g e
7.3 CEE HYDROSYSTEMS CEE-LINK