Embed Size (px)
Citation preview
GEOTHERMAL TRAINING PROGRAMME Reports 2010 Orkustofnun, Grensásvegur 9, Number 13 IS-108 Reykjavík, Iceland
183
HYDROGEN SULPHIDE ABATEMENT DURING DISCHARGE OF GEOTHERMAL STEAM FROM WELL PADS:
A CASE STUDY OF WELL PAD TR-18, EL SALVADOR
Luis A. Franco Nolasco LaGeo S.A. de C.V.
15 Avenida Sur, Colonia Utila Nueva San Salvador, La Libertad
EL SALVADOR C.A. [email protected]
ABSTRACT
The emission of hydrogen sulphide (H2S) during geothermal development is a significant environmental aspect that must be considered in an environmental management plan. Wells TR-18 and TR-18A are part of the expansion of the Berlín geothermal power plant in El Salvador. H2S emissions were estimated for these two wells during well discharge, and calculated to be 7.1 and 42.8 g/s, respectively. Maximum H2S concentrations in the air were also determined in the nearby Bob Graham community using a dispersion model (SCREEN3). Four cases were evaluated: nominal flow, 35% of the nominal flow, nominal flow with 90% removal efficiency, and nominal flow with double stack height. Estimated maximum concentrations in the air in the community were 54.9 and 174.2 (μg/m3 24-hour averaged) during TR-18 and TR-18A well discharges, respectively. These estimated concentrations exceeded USEPA-California (43 μg/m3 1-hour averaged) and Icelandic (50 μg/m3 24-hour averaged) regulations. The aim of this project was to suggest mitigating actions and to fulfil recommended environmental regulations. Three methods for H2S removal during well discharge were evaluated: caustic scrubbing, caustic scrubbing with peroxide and scrubbing with iron sulphate. The first method was found to be the most appropriate based on its 90% efficiency and its low chemical costs when compared to the other two methods. Another measure recently introduced by LaGeo is the implementation of the chemical tracer method, which uses isopropanol for steam phase and sodium benzoate for liquid phase. This method is most suitable for flow measurement because it avoids H2S emissions in flow testing. Suggested mitigating actions are to replace the current measurement method (lip pressure) by the chemical tracer method during flow testing but to apply the caustic scrubbing method when it is necessary to discharge wells to the atmosphere from a well pad.
1. INTRODUCTION One of the main effects of geothermal exploitation on the environment is the emission of gases with geothermal steam (Kristmannsdóttir et al., 2000). Carbon dioxide (CO2) and hydrogen sulphide (H2S)

Franco Nolasco 184 Report 13
are proportionally the highest components in geothermal non-condensable gases. When geothermal areas are developed, hydrogen sulphide is usually emitted at a higher rate to the environment than before development (Ólafsdóttir et al., 2010). This has often been a nuisance and raised concerns from nearby populations, for example, at Puna, Hawaii, (D’Alessandro et al., 2009). There are two geothermal fields in El Salvador that have operating power plants for electricity generation: Ahuachapán and Berlín, both owned and operated by LaGeo which is owned by INE (Government Electric Utility) and Enel Green Power from Italy, (Herrera et al., 2010). The main objective of LaGeo’s Environmental Management Policy, is to ensure proper environmental controls and the improvement of performance of the power generation process, taking into account the environmental aspects (Arévalo, 2006). The Berlín geothermal field has, at present, an installed capacity of 109.4 MW and is located in the eastern part of El Salvador. Since its inception in 1992, geothermal development activities have accelerated in an effort to meet increasing power demands and thereby decrease dependence on fossil fuels. Several environmental considerations have been incorporated to achieve sustainable development. However, a recent increase in power production resulted in raised public concerns from the neighbouring communities concerning hydrogen sulphide odours. An environmental assessment carried out in 2010 by LaGeo with a participatory approach (local authorities, neighbouring communities, non-governmental organizations) revealed that the discharge of wells during flow testing in one of the well pads (TR-18) was a nuisance to the inhabitants of the Bob Graham community due to the temporary increase of H2S gas and its characteristic "rotten eggs" odour (LaGeo, 2010a). Regular flow testing is necessary in order to estimate the state of the geothermal reservoir and this is stipulated in the contract of concessions for the Berlín geothermal field. Under normal operating conditions, which prevail most of the year, the inhabitants of the community do not experience this nuisance. This report presents an environmental assessment of H2S emission during well discharge from well pad TR-18, at the Berlín geothermal field. The objectives of this study are, firstly, to calculate H2S emissions in two geothermal wells at well pad TR-18 , then to estimate its maximum concentrations in the air in the Bob Graham community, and finally to evaluate different methods for removal of this gas during well discharging. An alternative method for flow testing that does not require steam discharge at the well pad is also described. The aim is to suggest mitigating actions and to fulfil recommended environmental regulations. 2. HYDROGEN SULPHIDE 2.1 Chemical and physical properties of H2S Hydrogen sulphide (chemical formula H2S; CAS No. 7783-06-4) is also known as hydrosulfuric acid, sulfureted hydrogen, stink damp, sulphur hydride, di-hydrogen mono-sulphide, di-hydrogen sulphide, and sewer gas (HSDB, 2010). It is characterised by an offensive “rotten egg” odour that is detectable at very low concentrations in the air, below 8 μg/m3 (WHO, 1996). It is produced as a result of anthropogenic activities including sanitary landfill sites, sanitary sewer systems, wastewater-treatment plants, reverse-osmosis drinking water plants, septic tank systems, and geothermal plants (Wang et al., 2005). Natural sources account for about 90% of the total hydrogen sulphide in the atmosphere through non-specific and anaerobic bacteria reduction of sulphates and sulphur-containing organic compounds. It is released primarily as a gas and is found naturally in crude petroleum, natural gas, volcanic gases, hot springs and groundwater (WHO, 2003). Hydrogen sulphide’s relative molecular mass is 34.08 and its structural formula is illustrated as H-S-H. Its relative density at atmospheric pressure (101.325 kPa) at 25°C is 1.188 (heavier than air) and its
Report 13 185 Franco Nolasco
vapour pressure at 20°C is 1814 kPa. It is soluble in water, hydrocarbon solvents, ether and ethanol; the water solubility at 20°C is 0.398 g in 100 ml (Kirk-Othmer, 2006). Conversion factors for the concentration of hydrogen sulphide in the air (20°C, 101.3 kPa) are as follows:
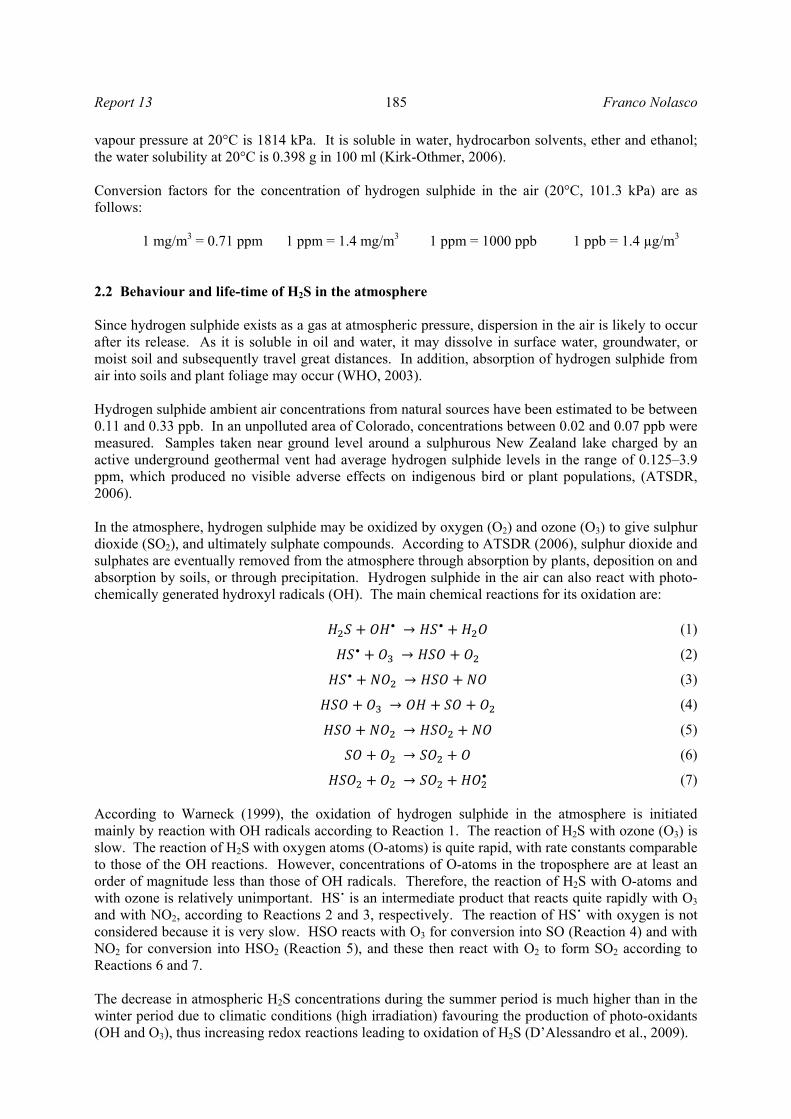
1 mg/m3 = 0.71 ppm 1 ppm = 1.4 mg/m3 1 ppm = 1000 ppb 1 ppb = 1.4 µg/m3 2.2 Behaviour and life-time of H2S in the atmosphere Since hydrogen sulphide exists as a gas at atmospheric pressure, dispersion in the air is likely to occur after its release. As it is soluble in oil and water, it may dissolve in surface water, groundwater, or moist soil and subsequently travel great distances. In addition, absorption of hydrogen sulphide from air into soils and plant foliage may occur (WHO, 2003). Hydrogen sulphide ambient air concentrations from natural sources have been estimated to be between 0.11 and 0.33 ppb. In an unpolluted area of Colorado, concentrations between 0.02 and 0.07 ppb were measured. Samples taken near ground level around a sulphurous New Zealand lake charged by an active underground geothermal vent had average hydrogen sulphide levels in the range of 0.125–3.9 ppm, which produced no visible adverse effects on indigenous bird or plant populations, (ATSDR, 2006). In the atmosphere, hydrogen sulphide may be oxidized by oxygen (O2) and ozone (O3) to give sulphur dioxide (SO2), and ultimately sulphate compounds. According to ATSDR (2006), sulphur dioxide and sulphates are eventually removed from the atmosphere through absorption by plants, deposition on and absorption by soils, or through precipitation. Hydrogen sulphide in the air can also react with photo-chemically generated hydroxyl radicals (OH). The main chemical reactions for its oxidation are:
According to Warneck (1999), the oxidation of hydrogen sulphide in the atmosphere is initiated mainly by reaction with OH radicals according to Reaction 1. The reaction of H2S with ozone (O3) is slow. The reaction of H2S with oxygen atoms (O-atoms) is quite rapid, with rate constants comparable to those of the OH reactions. However, concentrations of O-atoms in the troposphere are at least an order of magnitude less than those of OH radicals. Therefore, the reaction of H2S with O-atoms and with ozone is relatively unimportant. HS˙ is an intermediate product that reacts quite rapidly with O3 and with NO2, according to Reactions 2 and 3, respectively. The reaction of HS˙ with oxygen is not considered because it is very slow. HSO reacts with O3 for conversion into SO (Reaction 4) and with NO2 for conversion into HSO2 (Reaction 5), and these then react with O2 to form SO2 according to Reactions 6 and 7. The decrease in atmospheric H2S concentrations during the summer period is much higher than in the winter period due to climatic conditions (high irradiation) favouring the production of photo-oxidants (OH and O3), thus increasing redox reactions leading to oxidation of H2S (D’Alessandro et al., 2009).
• • (1)
• (2)
• (3)
(4)
(5)
(6)
• (7)
Franco Nolasco 186 Report 13
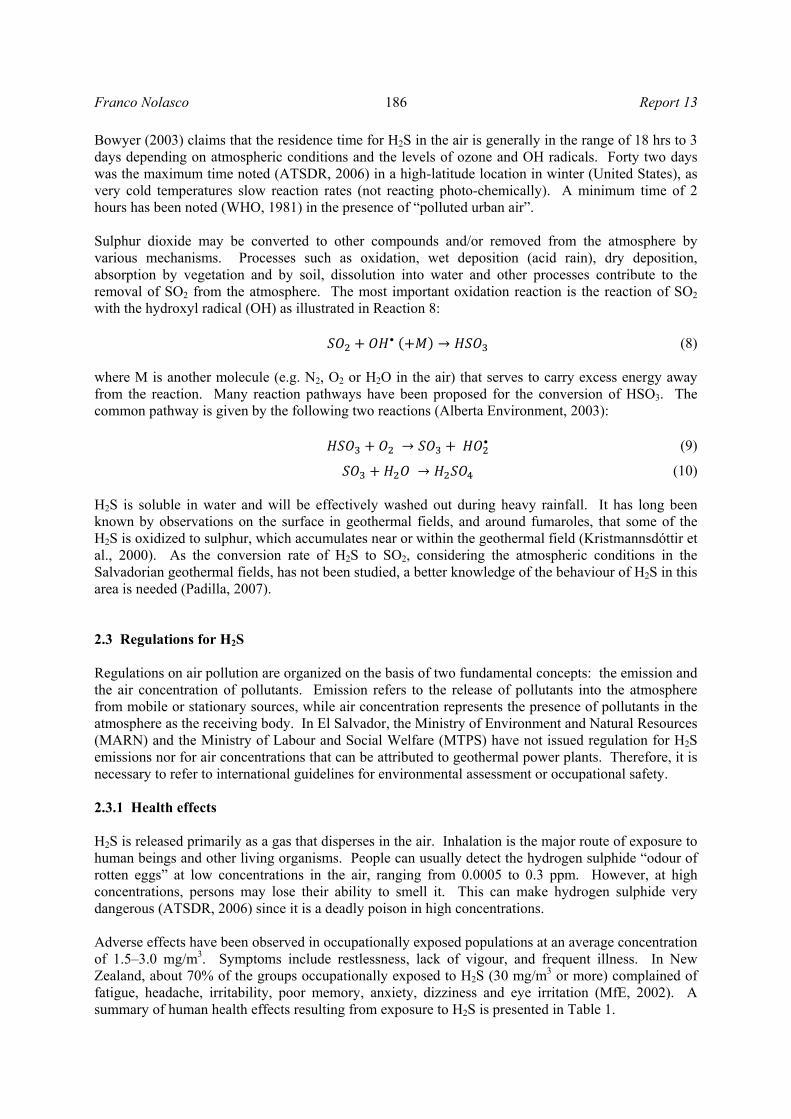
Bowyer (2003) claims that the residence time for H2S in the air is generally in the range of 18 hrs to 3 days depending on atmospheric conditions and the levels of ozone and OH radicals. Forty two days was the maximum time noted (ATSDR, 2006) in a high-latitude location in winter (United States), as very cold temperatures slow reaction rates (not reacting photo-chemically). A minimum time of 2 hours has been noted (WHO, 1981) in the presence of “polluted urban air”. Sulphur dioxide may be converted to other compounds and/or removed from the atmosphere by various mechanisms. Processes such as oxidation, wet deposition (acid rain), dry deposition, absorption by vegetation and by soil, dissolution into water and other processes contribute to the removal of SO2 from the atmosphere. The most important oxidation reaction is the reaction of SO2 with the hydroxyl radical (OH) as illustrated in Reaction 8:
where M is another molecule (e.g. N2, O2 or H2O in the air) that serves to carry excess energy away from the reaction. Many reaction pathways have been proposed for the conversion of HSO3. The common pathway is given by the following two reactions (Alberta Environment, 2003):
H2S is soluble in water and will be effectively washed out during heavy rainfall. It has long been known by observations on the surface in geothermal fields, and around fumaroles, that some of the H2S is oxidized to sulphur, which accumulates near or within the geothermal field (Kristmannsdóttir et al., 2000). As the conversion rate of H2S to SO2, considering the atmospheric conditions in the Salvadorian geothermal fields, has not been studied, a better knowledge of the behaviour of H2S in this area is needed (Padilla, 2007). 2.3 Regulations for H2S Regulations on air pollution are organized on the basis of two fundamental concepts: the emission and the air concentration of pollutants. Emission refers to the release of pollutants into the atmosphere from mobile or stationary sources, while air concentration represents the presence of pollutants in the atmosphere as the receiving body. In El Salvador, the Ministry of Environment and Natural Resources (MARN) and the Ministry of Labour and Social Welfare (MTPS) have not issued regulation for H2S emissions nor for air concentrations that can be attributed to geothermal power plants. Therefore, it is necessary to refer to international guidelines for environmental assessment or occupational safety. 2.3.1 Health effects H2S is released primarily as a gas that disperses in the air. Inhalation is the major route of exposure to human beings and other living organisms. People can usually detect the hydrogen sulphide “odour of rotten eggs” at low concentrations in the air, ranging from 0.0005 to 0.3 ppm. However, at high concentrations, persons may lose their ability to smell it. This can make hydrogen sulphide very dangerous (ATSDR, 2006) since it is a deadly poison in high concentrations. Adverse effects have been observed in occupationally exposed populations at an average concentration of 1.5–3.0 mg/m3. Symptoms include restlessness, lack of vigour, and frequent illness. In New Zealand, about 70% of the groups occupationally exposed to H2S (30 mg/m3 or more) complained of fatigue, headache, irritability, poor memory, anxiety, dizziness and eye irritation (MfE, 2002). A summary of human health effects resulting from exposure to H2S is presented in Table 1.
• (8)
• (9)
(10)

Report 13 187 Franco Nolasco
TABLE 1: Human health effects at various hydrogen sulphide concentrations (WHO, 2003)
Exposure (mg/m3) Effect / Observation
0.011 Odour threshold 2.8 Bronchial constriction in asthmatic individuals 5 Increased eye complaints
7 or 14 Increased blood lactate concentration, decreased skeletal muscle citrate synthase activity, decreased oxygen uptake
5 - 29 Eye irritation 28 Fatigue, loss of appetite, headache, irritability, poor memory, dizziness
> 140 Olfactory paralysis > 560 Respiratory distress ≥ 700 Death
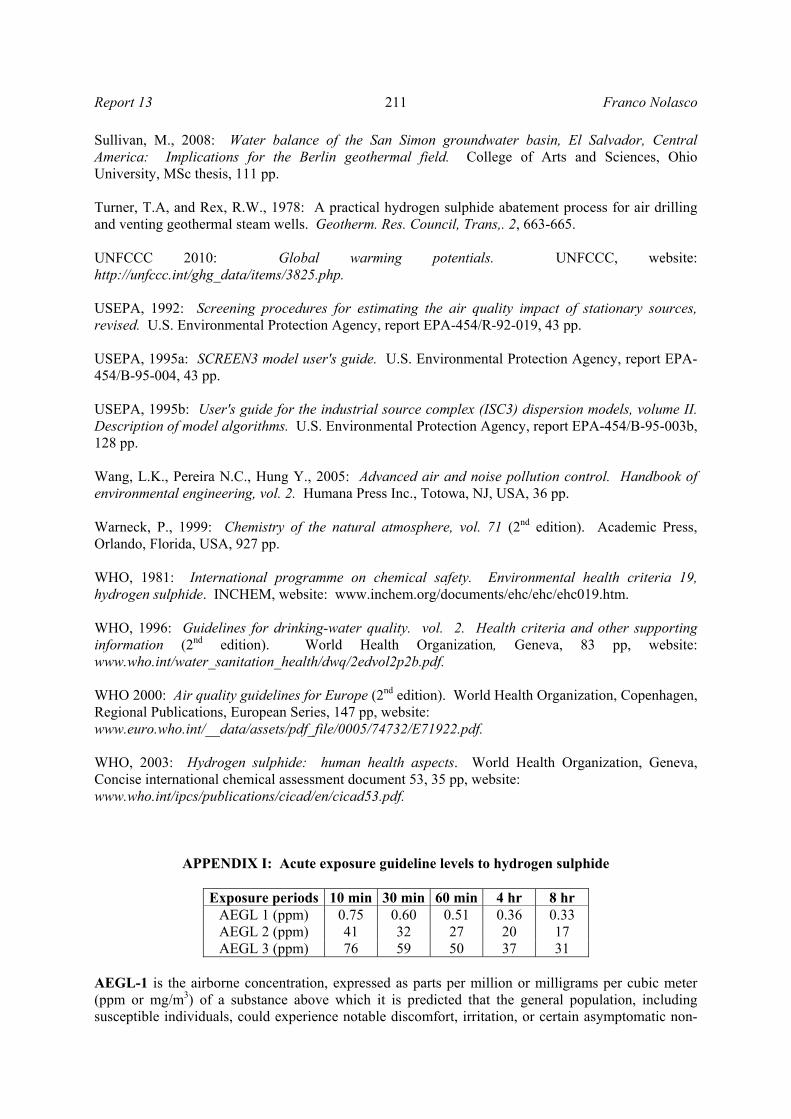
According to Bates et al. (1997) many studies at Rotorua geothermal area (New Zealand), where a large population was exposed to low-levels (10-500 ppb) of H2S, revealed that chronic sub-toxic exposition has only limited effects on human health. Estimates of exposure levels posing minimal risk to humans (MRLs) were made for hydrogen sulphide. An MRL of 0.07 and 0.02 ppm was derived for an acute-duration (1-14 days) and an intermediate-duration (15-364 days) inhalation exposure, respectively, to hydrogen sulphide (ATSDR, 2006). The United States Environmental Protection Agency (USEPA) has developed the Acute Exposure Guideline Levels (AEGLs) to H2S to describe the risk to humans resulting from once-in-a-lifetime, or rare, exposure to airborne chemicals. The lowest reported concentration of H2S is 0.33 ppm for 8 hr exposure, above which it is predicted that the general population, including susceptible individuals, could experience notable discomfort, irritation, or certain asymptomatic non-sensory effects. However, the effects are non-disabling, transient and reversible upon cessation of exposure (Appendix I). 2.3.2 Occupational safety guidelines Occupational safety limits from the United States and the European Commission are given in Table 2. United States guiding entities include the American Conference of Governmental Industrial Hygienists (ACGIH), the Occupational Safety and Health Administration (OSHA) and the National Institute for Occupational Safety and Health (NIOSH).
TABLE 2: International guidelines for H2S exposure limits
Agency Level Averaging period Reference
ACGIH 10 ppm TLV-TWA (8-hour) ACGIH 2009 15 ppm TLV-STEL (15 min) OSHA 20 ppm PEL-C OSHA 2006 29CFR1910.1000, Table Z-2 NIOSH 10 ppm REL-C (10 min) NIOSH publication number 2005-149
The European Commission
5 ppm TLV-TWA (8-hour) EC Directive 2009/161/EU, Annex 10 ppm TLV-STEL (15 min) EC Directive 2009/161/EU, Annex
TLV: Threshold Limit Values are defined as an exposure limit "to which it is believed nearly all workers can be exposed day after day for a working lifetime without ill effect". PEL: Permissible Exposure Limits: are regulatory limits on the amount or concentration of a substance in the air, and they are enforceable. TWA: Time-Weighted Average: the time-weighted average concentration for a conventional 8-hour workday and a 40-hour workweek, to which it is believed that nearly all workers, may be repeatedly exposed, day after day, without adverse effect. STEL: Short Term Exposure Limit: the concentration to which it is believed that workers can be exposed continuously for a short period of time without suffering from Irritation, chronic or irreversible tissue damage, or narcosis. REL-C: Recommended Exposure Levels - Ceiling: the concentration that should not be exceeded during any part of the working exposure.
Franco Nolasco 188 Report 13
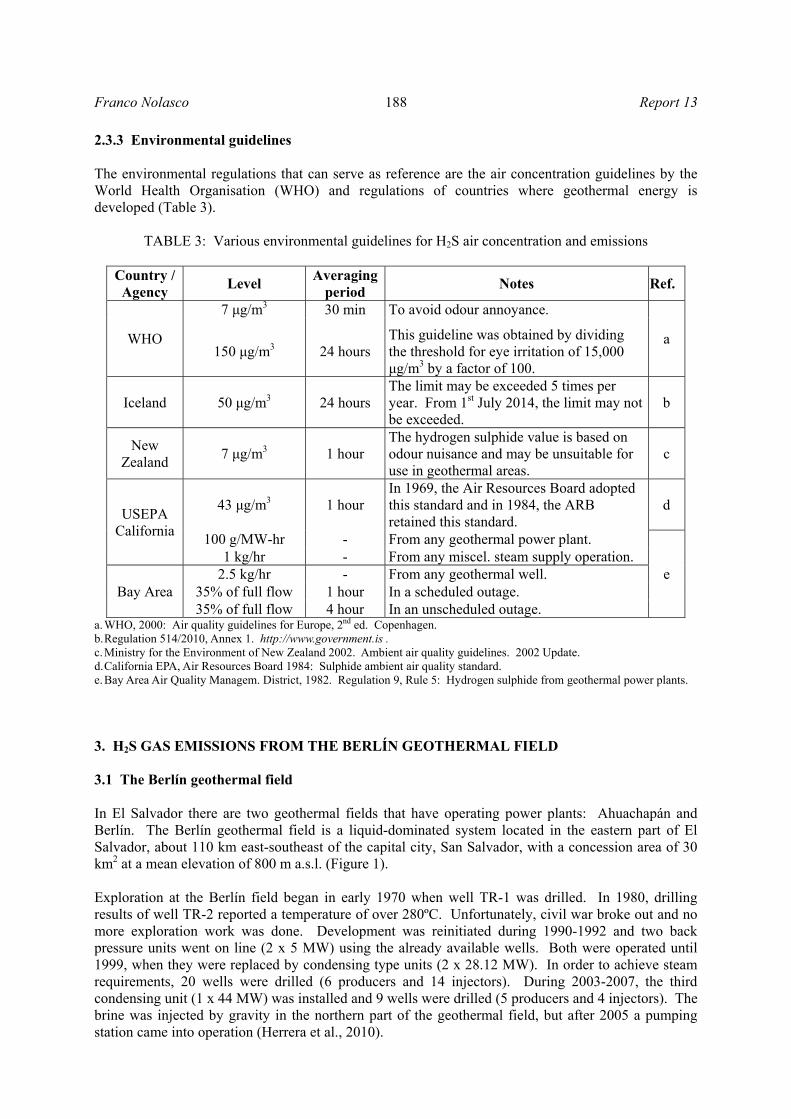
2.3.3 Environmental guidelines The environmental regulations that can serve as reference are the air concentration guidelines by the World Health Organisation (WHO) and regulations of countries where geothermal energy is developed (Table 3).
TABLE 3: Various environmental guidelines for H2S air concentration and emissions
Country / Agency Level Averaging
period Notes Ref.
WHO
7 μg/m3 30 min To avoid odour annoyance.
a
150 μg/m3
24 hours
This guideline was obtained by dividing the threshold for eye irritation of 15,000 μg/m3 by a factor of 100.
Iceland 50 μg/m3 24 hours The limit may be exceeded 5 times per year. From 1st July 2014, the limit may not be exceeded.
b
New Zealand 7 μg/m3 1 hour
The hydrogen sulphide value is based on odour nuisance and may be unsuitable for use in geothermal areas.
c
USEPA California
43 μg/m3 1 hour In 1969, the Air Resources Board adopted this standard and in 1984, the ARB retained this standard.
d
100 g/MW-hr - From any geothermal power plant.
e 1 kg/hr - From any miscel. steam supply operation.
Bay Area 2.5 kg/hr - From any geothermal well.
35% of full flow 1 hour In a scheduled outage. 35% of full flow 4 hour In an unscheduled outage.
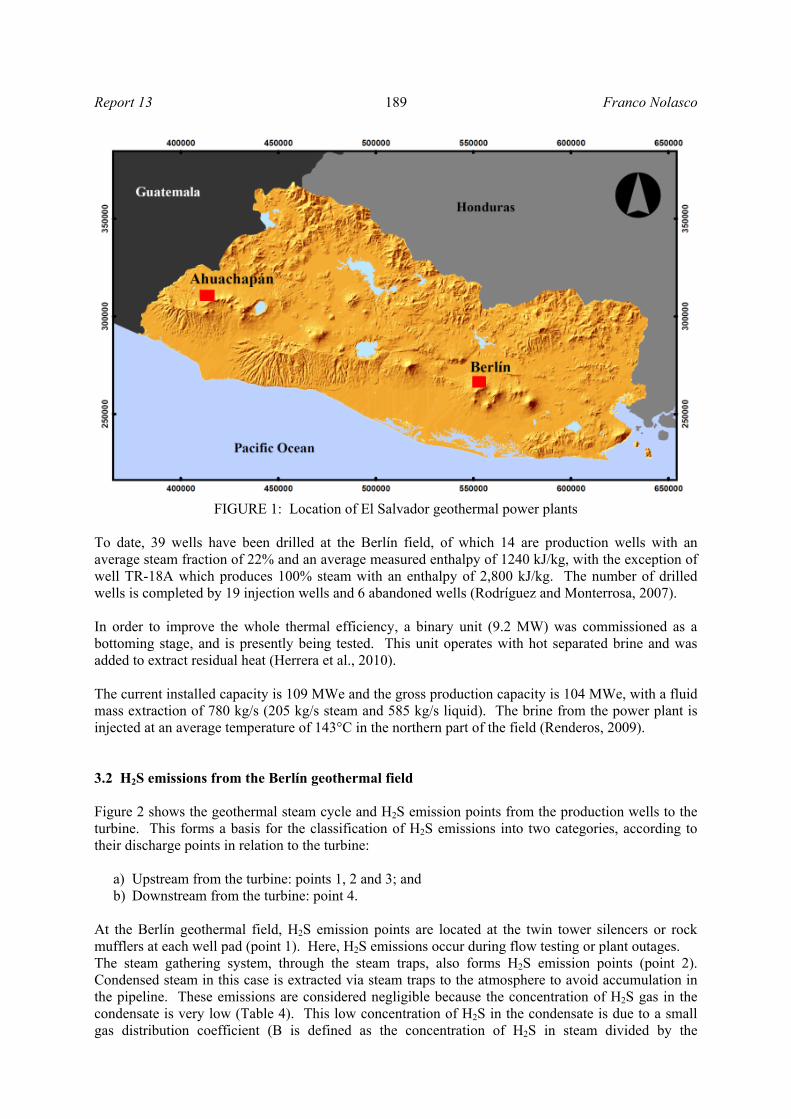
a. WHO, 2000: Air quality guidelines for Europe, 2nd ed. Copenhagen. b. Regulation 514/2010, Annex 1. http://www.government.is . c. Ministry for the Environment of New Zealand 2002. Ambient air quality guidelines. 2002 Update. d. California EPA, Air Resources Board 1984: Sulphide ambient air quality standard. e. Bay Area Air Quality Managem. District, 1982. Regulation 9, Rule 5: Hydrogen sulphide from geothermal power plants. 3. H2S GAS EMISSIONS FROM THE BERLÍN GEOTHERMAL FIELD 3.1 The Berlín geothermal field In El Salvador there are two geothermal fields that have operating power plants: Ahuachapán and Berlín. The Berlín geothermal field is a liquid-dominated system located in the eastern part of El Salvador, about 110 km east-southeast of the capital city, San Salvador, with a concession area of 30 km2 at a mean elevation of 800 m a.s.l. (Figure 1). Exploration at the Berlín field began in early 1970 when well TR-1 was drilled. In 1980, drilling results of well TR-2 reported a temperature of over 280ºC. Unfortunately, civil war broke out and no more exploration work was done. Development was reinitiated during 1990-1992 and two back pressure units went on line (2 x 5 MW) using the already available wells. Both were operated until 1999, when they were replaced by condensing type units (2 x 28.12 MW). In order to achieve steam requirements, 20 wells were drilled (6 producers and 14 injectors). During 2003-2007, the third condensing unit (1 x 44 MW) was installed and 9 wells were drilled (5 producers and 4 injectors). The brine was injected by gravity in the northern part of the geothermal field, but after 2005 a pumping station came into operation (Herrera et al., 2010).
Report 13 189 Franco Nolasco
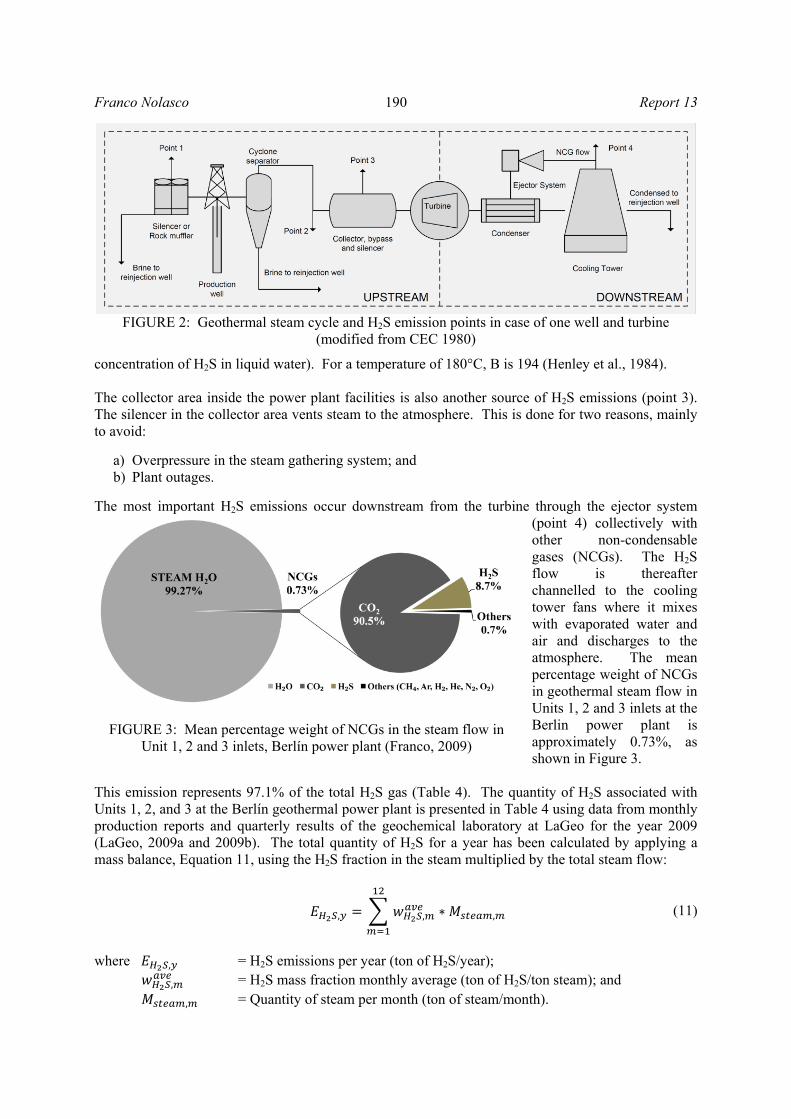
To date, 39 wells have been drilled at the Berlín field, of which 14 are production wells with an average steam fraction of 22% and an average measured enthalpy of 1240 kJ/kg, with the exception of well TR-18A which produces 100% steam with an enthalpy of 2,800 kJ/kg. The number of drilled wells is completed by 19 injection wells and 6 abandoned wells (Rodríguez and Monterrosa, 2007). In order to improve the whole thermal efficiency, a binary unit (9.2 MW) was commissioned as a bottoming stage, and is presently being tested. This unit operates with hot separated brine and was added to extract residual heat (Herrera et al., 2010). The current installed capacity is 109 MWe and the gross production capacity is 104 MWe, with a fluid mass extraction of 780 kg/s (205 kg/s steam and 585 kg/s liquid). The brine from the power plant is injected at an average temperature of 143°C in the northern part of the field (Renderos, 2009). 3.2 H2S emissions from the Berlín geothermal field Figure 2 shows the geothermal steam cycle and H2S emission points from the production wells to the turbine. This forms a basis for the classification of H2S emissions into two categories, according to their discharge points in relation to the turbine:
a) Upstream from the turbine: points 1, 2 and 3; and b) Downstream from the turbine: point 4.
At the Berlín geothermal field, H2S emission points are located at the twin tower silencers or rock mufflers at each well pad (point 1). Here, H2S emissions occur during flow testing or plant outages. The steam gathering system, through the steam traps, also forms H2S emission points (point 2). Condensed steam in this case is extracted via steam traps to the atmosphere to avoid accumulation in the pipeline. These emissions are considered negligible because the concentration of H2S gas in the condensate is very low (Table 4). This low concentration of H2S in the condensate is due to a small gas distribution coefficient (B is defined as the concentration of H2S in steam divided by the
FIGURE 1: Location of El Salvador geothermal power plants
Franco Nolasco 190 Report 13
concentration of H2S in liquid water). For a temperature of 180°C, B is 194 (Henley et al., 1984). The collector area inside the power plant facilities is also another source of H2S emissions (point 3). The silencer in the collector area vents steam to the atmosphere. This is done for two reasons, mainly to avoid:
a) Overpressure in the steam gathering system; and b) Plant outages.
The most important H2S emissions occur downstream from the turbine through the ejector system
(point 4) collectively with other non-condensable gases (NCGs). The H2S flow is thereafter channelled to the cooling tower fans where it mixes with evaporated water and air and discharges to the atmosphere. The mean percentage weight of NCGs in geothermal steam flow in Units 1, 2 and 3 inlets at the Berlin power plant is approximately 0.73%, as shown in Figure 3.
This emission represents 97.1% of the total H2S gas (Table 4). The quantity of H2S associated with Units 1, 2, and 3 at the Berlín geothermal power plant is presented in Table 4 using data from monthly production reports and quarterly results of the geochemical laboratory at LaGeo for the year 2009 (LaGeo, 2009a and 2009b). The total quantity of H2S for a year has been calculated by applying a mass balance, Equation 11, using the H2S fraction in the steam multiplied by the total steam flow:
where , = H2S emissions per year (ton of H2S/year); , = H2S mass fraction monthly average (ton of H2S/ton steam); and , = Quantity of steam per month (ton of steam/month).
FIGURE 2: Geothermal steam cycle and H2S emission points in case of one well and turbine (modified from CEC 1980)
FIGURE 3: Mean percentage weight of NCGs in the steam flow in
Unit 1, 2 and 3 inlets, Berlín power plant (Franco, 2009)
, , , (11)

Report 13 191 Franco Nolasco
TABLE 4: H2S emissions from the Berlín geothermal power plant in 2009
Units in the Berlín geothermal power plant Unit 1 Unit 2 Unit 3 Total Installed capacity (MW) 28 28 44 100 H2S emissions from cooling tower, point 4 (kg/h) 80.6 79.5 323.3 483.4
H2S emissions from cooling tower, point 4 (ton/year) 701.3 666.5 2190.2 3558.0H2S emissions from silencers and collector area, points 1 and 2 (ton/year) 36.8 38.4 29.2 104.4
H2S emissions from traps, point 3 (ton/year) 0.1 0.1 0.3 0.5
Total H2S emissions, points 1 to 4 (ton/year) 738.2 704.9 2219.8 3662.9
In Table 4, the H2S emissions have been quantified for each unit. The largest release of H2S is downstream from the turbine and represents 97.1% by weight of the total emissions in the power plant. Another fact observed is the increase in emissions of H2S by a factor of 2.5 due to the emissions of Unit 3. It is noteworthy that the concentration of H2S in the steam used in Unit 3 is approximately 3.4 times higher than for the other units. During normal operation of the power plant, H2S concentrations in the air were monitored within its facilities and surrounding areas (Figure 4). The concentrations in the atmosphere were mea-sured by a potentio-metric method, using the portable Jerome 631-X sensor. The results are compared against international guidelines for H2S exposure limits for occupational safety and showed concentra-tions that pose no health threat to workers or neighbours of the power plant (Franco, 2009). A preliminary study on emission abatement and the use of gas from geothermal power plants in El Salvador concluded that carbon dioxide and hydrogen sulphide can be successfully treated for purified liquid carbon dioxide production and elemental sulphur recovery (Padilla, 2007). Attractive incomes can be generated by selling liquid CO2 and by obtaining certified emission reductions. H2S emissions observed upstream from the turbine represent only 2.9% of the total emissions (points 1, 2 and 3). These emissions are discharged mainly in the collector area (point 3). A smaller H2S quantity is released at the well pads (point 1). However, this can result in large increase in H2S concentration in the nearby communities because of their proximity to the well pad.
FIGURE 4: H2S concentration (ppm) in the air at the Berlín geothermal power plant in 2009

Franco Nolasco 192 Report 13
3.3 Causes of H2S emissions within well pads The H2S emissions within well pads are due to geothermal steam (which contains 8.7% H2S in NCGs, see Figure 3) discharged from production wells to the twin tower silencers or rock mufflers at the well pads. Discharge at the well pads occurs mainly in two stages of geothermal development in El Salvador. During the drilling stage it occurs during flow testing upon completion of drilling. Additionally, during the operating stage it occurs during flow testing and power plant outages. 3.3.1 Flow testing At the end of drilling, the well is cold and is usually allowed to warm up for a few days before discharge. Discharging refers to the period when a geothermal well is opened and the geothermal fluid flow is channelled to the twin tower silencer for separation where the steam fraction is released into the atmosphere and the liquid (brine) is transported by ducts (or pipes) for reinjection, Figure 5.
Prior to initial flow testing, the well can continue discharging into the atmosphere to remove solids accumulated in the reservoir during drilling for a period of time (can be hours to days). The period is limited by the capacity to manage the brine. The total amount of CO2 and H2S gases discharged into the atmosphere is relatively low. However, due to iso-enthalpic expansion of the gases to the atmosphere, the gases can form a layer at the ground surface (layering phenomena). This layer can have high concentrations of H2S and CO2 (Culivicchi et al., 2000). Once the flow conditions and enthalpy in the well have been stabilized, well flow testing is carried out. During flow testing, important information
(total mass flow, the discharge enthalpy, the non-condensable gas content and the amount of dissolved solids) is generated for use in reservoir analysis and surface plant design. Flow testing is also performed once a year for each production well as stipulated in the contract of concessions for the Berlín geothermal field. The method used for flow testing in geothermal fields in El Salvador is the lip pressure method. A flow test can last approximately 5 hours. Grant et al. (1982) claim that the most versatile method for testing all but the smallest medium-enthalpy wells is the lip pressure method. This method is based on an empirical formula (Equation 12) developed by James (1970). Thus, James’s method consists of measuring the lip pressure and water flow from the silencer, finding the enthalpy of the flow and calculating the mass flow by correcting for the flash to atmospheric pressure. The formula that James deduced is:
where = Total mass flow rate (kg/s);
= Enthalpy (kJ/kg); = Cross-section area of the lip (cm2); and
= The lip pressure in MPa. The lip pressure is measured at the extreme end of the discharge pipe using a liquid-filled gauge to
FIGURE 5: Flow measurement by lip pressure and silencer (Grant et al., 1982)
.. 1680 (12)
Report 13 193 Franco Nolasco
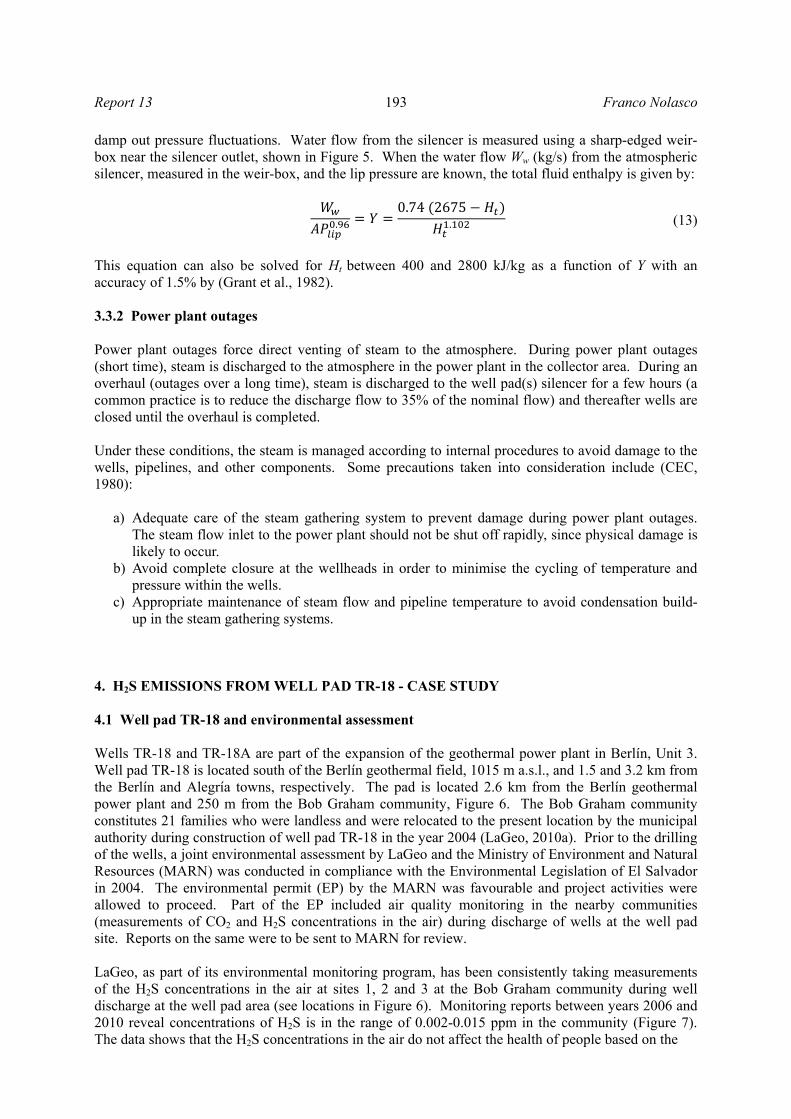
damp out pressure fluctuations. Water flow from the silencer is measured using a sharp-edged weir-box near the silencer outlet, shown in Figure 5. When the water flow Ww (kg/s) from the atmospheric silencer, measured in the weir-box, and the lip pressure are known, the total fluid enthalpy is given by:
This equation can also be solved for Ht between 400 and 2800 kJ/kg as a function of Y with an accuracy of 1.5% by (Grant et al., 1982). 3.3.2 Power plant outages Power plant outages force direct venting of steam to the atmosphere. During power plant outages (short time), steam is discharged to the atmosphere in the power plant in the collector area. During an overhaul (outages over a long time), steam is discharged to the well pad(s) silencer for a few hours (a common practice is to reduce the discharge flow to 35% of the nominal flow) and thereafter wells are closed until the overhaul is completed. Under these conditions, the steam is managed according to internal procedures to avoid damage to the wells, pipelines, and other components. Some precautions taken into consideration include (CEC, 1980):
a) Adequate care of the steam gathering system to prevent damage during power plant outages. The steam flow inlet to the power plant should not be shut off rapidly, since physical damage is likely to occur.
b) Avoid complete closure at the wellheads in order to minimise the cycling of temperature and pressure within the wells.
c) Appropriate maintenance of steam flow and pipeline temperature to avoid condensation build-up in the steam gathering systems.
4. H2S EMISSIONS FROM WELL PAD TR-18 - CASE STUDY 4.1 Well pad TR-18 and environmental assessment Wells TR-18 and TR-18A are part of the expansion of the geothermal power plant in Berlín, Unit 3. Well pad TR-18 is located south of the Berlín geothermal field, 1015 m a.s.l., and 1.5 and 3.2 km from the Berlín and Alegría towns, respectively. The pad is located 2.6 km from the Berlín geothermal power plant and 250 m from the Bob Graham community, Figure 6. The Bob Graham community constitutes 21 families who were landless and were relocated to the present location by the municipal authority during construction of well pad TR-18 in the year 2004 (LaGeo, 2010a). Prior to the drilling of the wells, a joint environmental assessment by LaGeo and the Ministry of Environment and Natural Resources (MARN) was conducted in compliance with the Environmental Legislation of El Salvador in 2004. The environmental permit (EP) by the MARN was favourable and project activities were allowed to proceed. Part of the EP included air quality monitoring in the nearby communities (measurements of CO2 and H2S concentrations in the air) during discharge of wells at the well pad site. Reports on the same were to be sent to MARN for review. LaGeo, as part of its environmental monitoring program, has been consistently taking measurements of the H2S concentrations in the air at sites 1, 2 and 3 at the Bob Graham community during well discharge at the well pad area (see locations in Figure 6). Monitoring reports between years 2006 and 2010 reveal concentrations of H2S is in the range of 0.002-0.015 ppm in the community (Figure 7). The data shows that the H2S concentrations in the air do not affect the health of people based on the
. 0.74 2675. (13)

Franco Nolasco 194 Report 13
exposure limit of 10 ppm for 8 hours, as recommended by ACGIH. However, at this concentration, a "rotten eggs" odour is perceived as a nuisance (LaGeo, 2010b and 2010c). During the second quarter of this year, LaGeo conducted an environmental assessment of the Berlín geothermal field with a participatory approach. A multidisciplinary team comprised of different environmental experts carried out the assessment which involved the local authorities, neighbouring communities, non-governmental organisations and LaGeo. The objective was to identify the environmental aspects that require greater control at the Berlín geothermal field. On the issue of emissions, the report revealed that discharging wells at the well pad TR-18 site caused discomfort to the inhabitants of the Bob Graham community due to temporary increases in H2S odour (characteristic of "rotten eggs" smell) (LaGeo, 2010a).
FIGURE 7: H2S concentrations at the Bob Graham community
during well discharge at well pad TR-18
FIGURE 6: Location of well pad TR-18 in Berlin geothermal field

Report 13 195 Franco Nolasco
Until now H2S environmental assessments have been carried out considering recommended exposure limits in order to preserve people’s health. However, in addition to this, it is necessary to consider the H2S odour nuisance that people in surrounding communities experience as a result of exploitation of geothermal areas. 4.2 H2S gas emissions from the well pad TR-18 - environmental aspects Modern environmental management revolves around one simple concept which is also a fact: the environment is affected by everything we take from it (consumption) and that which we throw at it (emissions). These emissions and consumption are defined as “environmental aspects” in any type of project (Arévalo and Padilla, 2008). Significant environmental aspects: are elements of activities which can interact with the environment and (or can) produce significant environmental impacts (any change in the biotic or abiotic elements which the environment cannot absorb) (Arévalo and Padilla, 2008). DASI method: environmental assessment method based on identification and evaluation of all environmental aspects related to the activities of a project with the objective of selecting measurements for preventing or controlling potential environmental impacts (Arévalo and Padilla, 2008). Considering that the environmental impact of H2S odour in the communities is characterised as a “nuisance”, the first level of the DASI method is applicable to assess the significance of the environmental aspect. Therefore, to assess the significance of the H2S emissions at well pad TR-18, the following tasks should be performed: Identification and interpretation of environmental regulations El Salvador has not formulated H2S regulations. However, for this task the following values from Table 3 will be used:
• 150 μg/m3 for a 24 hour period (WHO guidelines), to ensure the absence of appreciable risks that can cause adverse health effects;
• 50 μg/m3 for a 24 hour period (Icelandic regulation); and • 43 μg/m3 for an hour (USEPA-California regulation), to ensure acceptable levels of odour effects
caused by H2S emissions from geothermal power stations. The value of 7 μg/m3 for a 30-min period recommended by WHO, has not been used due to its unsuitability for application in geothermal areas in accordance with the Ministry for Environment, New Zealand (MfE, 2002). Quantifying of the environmental aspect This task is divided into two stages:
• To calculate the H2S emissions for each well (TR-18 and TR-18A) in Section 4.3.1; and • To estimate the maximum concentrations that can occur at the Bob Graham community (using the
Gaussian dispersion model) in section 4.3.2. The monitoring data at the community is not used in this case because the measurements have not been continuous.
Approach to regulatory limits The environmental aspect will be evaluated as significant if the H2S concentrations in the community are higher than the required reference concentrations (international environmental limits of H2S as given above).

Franco Nolasco 196 Report 13
4.3 H2S emissions and maximum concentrations in the community 4.3.1 H2S emissions from geothermal wells at well pad TR-18 The H2S emissions from well pad TR-18 have been calculated using data from the monthly production reports and quarterly results of the geochemical laboratory at LaGeo for the year 2009 for TR-18 and TR-18A wells. Table 5 shows the average values of the data used for the year 2009 (LaGeo, 2009a; LaGeo, 2009b).
Table 6 shows the H2S emissions and steam exit flows (in kg/s and m3/s) to the pressure of 1 bar (condition during discharge to the atmosphere in the silencer) from wells TR-18 and TR-18A.
4.3.2 Maximum H2S concentrations in the community using SCREEN3 Maximum H2S concentrations in the community were estimated with the SCREEN3 dispersion model. SCREEN3 uses a Gaussian plume model that incorporates source related factors and meteorological factors to estimate pollutant concentrations from continuous sources. It is assumed that the pollutant does not undergo any chemical reactions, and that no other removal processes, such as wet or dry deposition, act on the plume during its transport from the source (USEPA, 1995a). For a steady-state Gaussian plume (USEPA, 1995b), the hourly concentration, C, at downwind distance x (m) and crosswind distance y (m) is given by Equation 14:
where Q = Pollutant emission rate (mass per unit time); K = A scaling coefficient to convert calculated concentrations to desired units
(default value of 1x10⁶ for Q in g/s and concentration in µg/m3); V = Vertical term; D = Decay term; us = Mean wind speed (m/s) at release height; σy, σz = Standard deviation of lateral and vertical concentration distribution (m).
2 12 (14)
TABLE 5: Average data for TR-18 and TR-18A wells in 2009
Name TR-18 TR-18A P (bar-g) 10.5 10.7 T (°C) 186.0 186.8 Total flow (kg/s) 96.7 47.2 x (steam fraction) 0.2 1.0 CO2 (ppm) in steam fraction 3292 23981 H2S (ppm) in steam fraction 365 908
TABLE 6: H2S emissions and steam exit flows from wells TR-18 and TR-18A
Name TR-18 TR-18A P (bar-g) 1.0 1.0 T (°C) 99.7 99.7 Total flow (kg/s) 96.7 47.2 x (steam fraction) 0.34 1.00 Steam exit flow (kg/s) 33.0 47.2 Steam exit flow (m3/s) 55.9 79.9 H2S emission (g/s) 7.1 42.8
Report 13 197 Franco Nolasco
The vertical Term (V) accounts for the vertical distribution of the Gaussian plume. It includes the effects of source elevation, receptor elevation, plume rise, limited mixing in the vertical, and gravitational settling (USEPA, 1995b). The Decay Term (D) takes into account pollutant removal by physical or chemical processes. For SCREEN3, D is 1 because it is not considered (USEPA, 1995b). SCREEN examines a range of stability classes and wind speeds to identify the "worst case" meteorological conditions, i.e., the combination of wind speed and stability that results in maximum ground level concentrations (USEPA, 1995a). The results from SCREEN were estimated at a maximum of 1 hour concentrations (USEPA, 1995a). To obtain the estimated maximum concentration for a 24-hour period, the 1-hour average is multiplied by an adjustment factor of 0.4 (USEPA, 1992). The input data of the emission source and receptor to the SCREEN3 model are the following: Stack steam exit flow rate (m3/s) and emission rate (g/s) Three cases of stack steam exit flow rate were considered for TR-18 and TR-18A wells:
a) Nominal flow (when the valve is fully open and steam is discharged to the atmosphere); b) 35% of nominal flow (because a mitigation measure has been implemented); c) Nominal flow, but 10% of H2S emission (an H2S abatement system has removed 90% of the H2S).
The emission rate for the nominal flow is shown in Table 6. Emission rates of conditions b and c were calculated using the total emission rate multiplied by a factor of 0.35 and 0.1, respectively. Stack height (m) and stack inside diameter (m) The stack is a silencer of twin towers with a height of 7.5 and 1.83 m diameter for each tower. The equivalent diameter of a single tower is 2.59 m and the discharge area is equal to the sum of the two discharge areas of the silencer. A fourth case was also considered: case d) doubling the height of the stack to 15 m. Stack steam exit temperature (K) Stack exit steam temperature is 372.81 K and corresponds to the saturation temperature at an atmospheric pressure of 1 bar. Ambient air temperature (K) Ambient air temperature is 295.24 K and represents the average annual temperature for the year 2004 to 2005 according to Sullivan (2008). Dispersion coefficient SCREEN3 uses two options for the dispersion coefficient: “rural” or “urban”. The criterion for selection is the population density; if it is less than 750 people / km2 it is “rural”, if not it is “urban”. The dispersion coefficient “rural” was selected because the population density is 716 inhabitants per km2 (within a radius of 3 km) according to MINEC (2010). Terrain and discrete distances to the community (m) The terrain is flat because well pad TR-18 and most of the area in the community is at the same height. The Bob Graham community is at a distance of 250-360 m from the emission source, as can be seen in Figure 8. Receptor height (m) The average height of the receptor is 1.5 m above ground level.
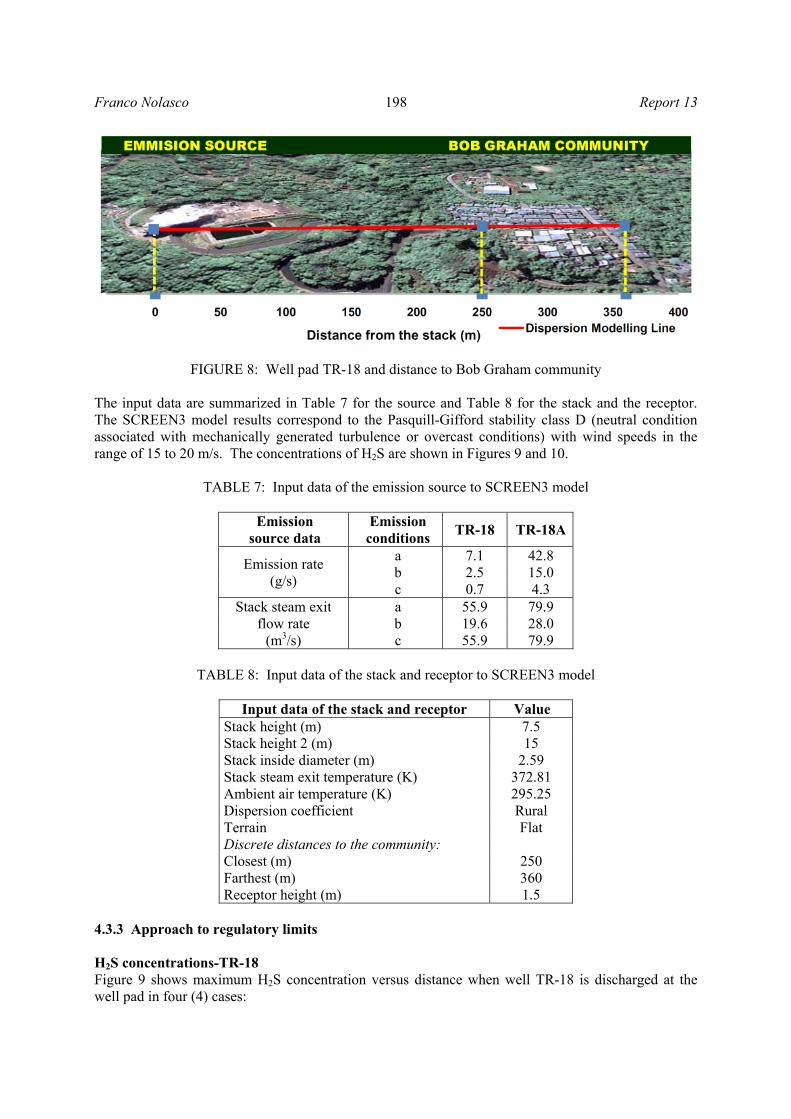
Franco Nolasco 198 Report 13
FIGURE 8: Well pad TR-18 and distance to Bob Graham community
The input data are summarized in Table 7 for the source and Table 8 for the stack and the receptor. The SCREEN3 model results correspond to the Pasquill-Gifford stability class D (neutral condition associated with mechanically generated turbulence or overcast conditions) with wind speeds in the range of 15 to 20 m/s. The concentrations of H2S are shown in Figures 9 and 10.
TABLE 7: Input data of the emission source to SCREEN3 model
Emission source data
Emission conditions TR-18 TR-18A
Emission rate (g/s)
a 7.1 42.8 b 2.5 15.0 c 0.7 4.3
Stack steam exit flow rate
(m3/s)
a 55.9 79.9 b 19.6 28.0 c 55.9 79.9
TABLE 8: Input data of the stack and receptor to SCREEN3 model
Input data of the stack and receptor Value
Stack height (m) 7.5 Stack height 2 (m) 15 Stack inside diameter (m) 2.59 Stack steam exit temperature (K) 372.81 Ambient air temperature (K) 295.25 Dispersion coefficient Rural Terrain Flat Discrete distances to the community: Closest (m) 250 Farthest (m) 360 Receptor height (m) 1.5
4.3.3 Approach to regulatory limits H2S concentrations-TR-18 Figure 9 shows maximum H2S concentration versus distance when well TR-18 is discharged at the well pad in four (4) cases:

Report 13 199 Franco Nolasco
FIGURE 9: Maximum H2S concentration vs.
distance when TR-18 is discharged at the well pad
FIGURE 10: Maximum H2S concentration vs.
distance when TR-18A is discharged at the well pad
Case a) Nominal flow TR-18: The concentrations of H2S in the community were calculated as 137.2 μg/m3 (1-hour average) or 54.9 μg/m3 (24-hour average) which exceeds the USEPA-California and Icelandic regulations. Thus, H2S emission is considered a significant environmental aspect. Concentrations in the community during total flow discharge do not pose a health threat because they do not exceed the 150 μg/m3 (24-hour averaged) value recommended by WHO. Case b) 35% nominal flow TR-18: When flow was reduced, there was an increase in H2S concentrations for distances close to the source. The concentration of H2S in the community increased, reaching values of 156.6 μg/m3 (1-hour average) or 62.6 μg/m3 (24-hour average). A comparison to the regulatory limits shows the same results as in condition a), therefore the reduction of the flow is not a good method of controlling the environmental aspect. Case c) Nominal flow TR-18, but 10% H2S emission: Concentrations in the community were calculated as 13.5 μg/m3 (1-hour average) or 5.4 μg/m3 (24-hour average) and did not exceed USEPA-California and Icelandic regulations. Therefore, an H2S abatement system that removes 90% of the H2S emissions is effective in order to control the environmental aspect. Case d) Nominal flow for TR-18 with double stack height: H2S concentrations in the community measured 64.0 μg/m3 (1-hour average) or 25.6 μg/m3 (24-hour average) and did not exceed Icelandic regulations. This can be considered a good alternative for TR-18 well discharge because it reduced H2S concentrations by 53% compared to case a). H2S concentrations-TR-18A Figure 10 shows the maximum H2S concentration versus distance, when well TR-18A was discharged at the well pad in four (4) cases: Case a) Nominal flow TR-18A: The concentration of H2S at the community rose to 435.5 μg/m3 (1-hour average) or equivalent to 174.2 μg/m3 (24-hour average) which exceeds the value of 150 μg/m3
0
50
100
150
200
250
300
350
400
0 100 200 300 4000
100
200
300
400
500
600
700
800
900
1000
H2S
ave
ragi
ng p
erio
d 24
-hr (μg
/m³)
Distance from the emission source
H2S
ave
ragi
ng p
erio
d 1-
hr (μ
g/m
³)
TR-18 well (a) TR-18 well (b)TR-18 well (c) TR-18 well (d)USEPA California 43 μg/m³ av period 1-hr Iceland 50 μg/m³ av period 24-hr WHO 150 μg/m³ av period 24-hr
Bob Graham community
(a)
(b)
(c)
(d)
0
50
100
150
200
250
300
350
400
0 100 200 300 4000
100
200
300
400
500
600
700
800
900
1000
H2S
ave
ragi
ng p
erio
d 24
-hr (μg
/m3 )
Distance from the emission source
H2S
ave
ragi
ng p
erio
d 1-
hr (μ
g/m
3 )
TR-18A well (a) TR-18A well (b)TR-18A well (c) TR-18A well (d)USEPA California 43 μg/m³ av period 1-hr Iceland 50 μg/m³ av period 24-hr WHO 150 μg/m³ av period 24-hr
Bob Graham community
(b)
(a)
(c)
(d)
Franco Nolasco 200 Report 13
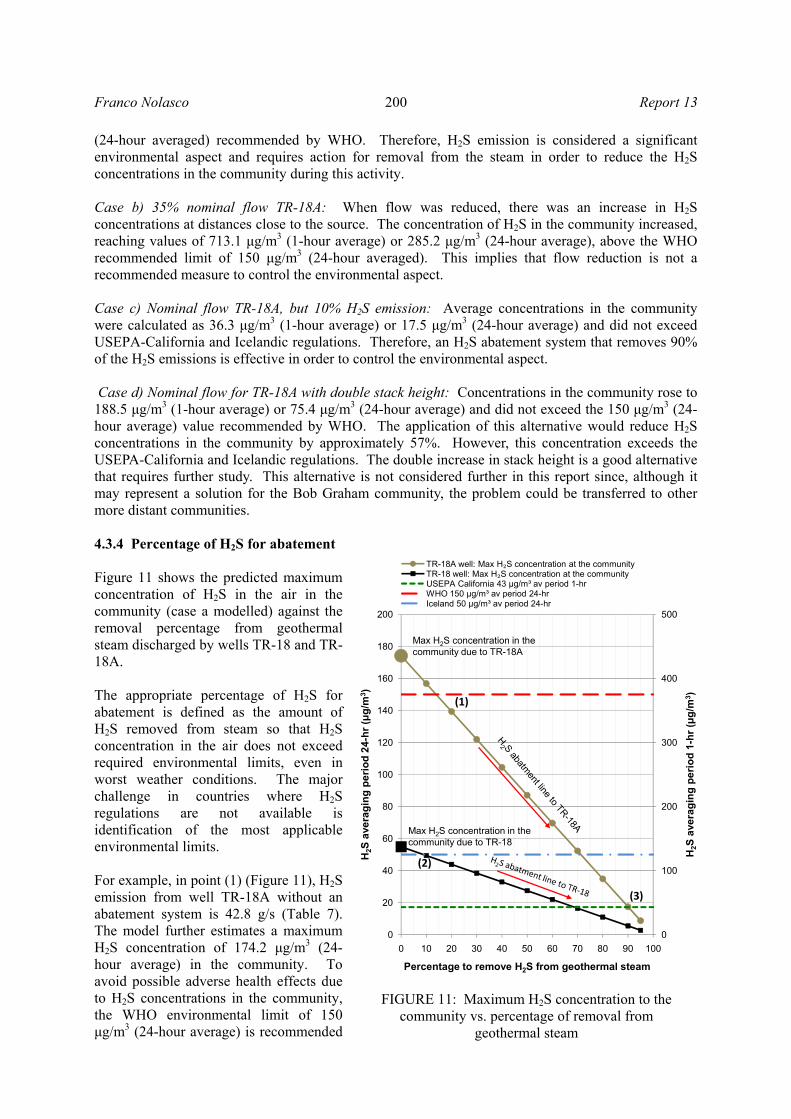
(24-hour averaged) recommended by WHO. Therefore, H2S emission is considered a significant environmental aspect and requires action for removal from the steam in order to reduce the H2S concentrations in the community during this activity. Case b) 35% nominal flow TR-18A: When flow was reduced, there was an increase in H2S concentrations at distances close to the source. The concentration of H2S in the community increased, reaching values of 713.1 μg/m3 (1-hour average) or 285.2 μg/m3 (24-hour average), above the WHO recommended limit of 150 μg/m3 (24-hour averaged). This implies that flow reduction is not a recommended measure to control the environmental aspect. Case c) Nominal flow TR-18A, but 10% H2S emission: Average concentrations in the community were calculated as 36.3 μg/m3 (1-hour average) or 17.5 μg/m3 (24-hour average) and did not exceed USEPA-California and Icelandic regulations. Therefore, an H2S abatement system that removes 90% of the H2S emissions is effective in order to control the environmental aspect. Case d) Nominal flow for TR-18A with double stack height: Concentrations in the community rose to 188.5 μg/m3 (1-hour average) or 75.4 μg/m3 (24-hour average) and did not exceed the 150 μg/m3 (24-hour average) value recommended by WHO. The application of this alternative would reduce H2S concentrations in the community by approximately 57%. However, this concentration exceeds the USEPA-California and Icelandic regulations. The double increase in stack height is a good alternative that requires further study. This alternative is not considered further in this report since, although it may represent a solution for the Bob Graham community, the problem could be transferred to other more distant communities. 4.3.4 Percentage of H2S for abatement Figure 11 shows the predicted maximum concentration of H2S in the air in the community (case a modelled) against the removal percentage from geothermal steam discharged by wells TR-18 and TR-18A. The appropriate percentage of H2S for abatement is defined as the amount of H2S removed from steam so that H2S concentration in the air does not exceed required environmental limits, even in worst weather conditions. The major challenge in countries where H2S regulations are not available is identification of the most applicable environmental limits. For example, in point (1) (Figure 11), H2S emission from well TR-18A without an abatement system is 42.8 g/s (Table 7). The model further estimates a maximum H2S concentration of 174.2 μg/m3 (24-hour average) in the community. To avoid possible adverse health effects due to H2S concentrations in the community, the WHO environmental limit of 150 μg/m3 (24-hour average) is recommended
FIGURE 11: Maximum H2S concentration to the
community vs. percentage of removal from geothermal steam
0
20
40
60
80
100
120
140
160
180
200
0 10 20 30 40 50 60 70 80 90 1000
100
200
300
400
500
H2S
ave
ragi
ng p
erio
d 24
-hr (μg
/m3 )
Percentage to remove H2S from geothermal steam
H2S
ave
ragi
ng p
erio
d 1-
hr (μ
g/m
3 )
TR-18A well: Max H₂S concentration at the communityTR-18 well: Max H₂S concentration at the communityUSEPA California 43 μg/m³ av period 1-hr WHO 150 μg/m³ av period 24-hr Iceland 50 μg/m³ av period 24-hr
(2)
(1)
(3)
Max H2S concentration in the community due to TR-18A
Max H2S concentration in the community due to TR-18
Report 13 201 Franco Nolasco
in this case. This implies that 20% H2S removal easily meets the WHO requirement (150 μg/m3) even in the worst weather conditions even though the community could file complaints of odours. Point (2) represents H2S emissions from well TR-18 (7.1 g/s, Table 7) at a concentration of 54.9 μg/m3 (24-hour average) in the community. Considering the Icelandic H2S limit of 50 μg/m3 (24-hour average), the abatement system should remove at least 10% of H2S from the steam. Compliance with the limit is thereby ensured even in worst weather conditions. An extreme situation is depicted by point (3), when 90% of H2S has been removed from the steam. The concentration in Bob Graham community is now in compliance with the limit given by the USEPA-California of 43 μg/m3 (1-hour average), even in worst weather conditions. Point (3) is used in this study to investigate environmental measures for removal of 90% of the original H2S in order to meet the required USEPA-California limits. Since the abatement method is required only for short periods during flow testing, the method should be chosen with that in mind. The operating cost will be higher and the investment cost lower than for a facility that is operated all the year. 5. ENVIRONMENTAL MEASURES FOR H2S ABATEMENT H2S emissions at well pads in El Salvador have until recently not been identified as a significant environmental aspect. However, there are cases where this does not hold, such as at well pad TR-18, which is an environmental concern due to its proximity to the community and high concentrations of H2S that could be achieved in the air during flow testing. Consequently, environmental management is required to reduce or avoid H2S emissions at the well pads. According to Arévalo and Padilla (2008), environmental measures to ensure the prevention of environmental impacts have 2 levels of intervention:
a) Activity: Focused on H2S emission prevention; and b) Environmental aspect: Focused on H2S emission control in order to avoid a significant
environmental impact. Table 9 shows the levels of intervention for activities during which geothermal steam is discharged at the well pads and environmental measures for H2S abatement.
TABLE 9: Levels of intervention and environmental measures for H2S abatement
Activity Intervention levels Environmental measures
Flow testing Aspect Using caustic scrubbing to remove H2S Activity Using tracer chemical for the flow testing
Power plant outages Activity Minimise duration of steam venting at the well pads 5.1 H2S removal using caustic scrubbing method This process for H2S abatement can be used during flow testing, especially during drilling. According to Sanopoulos and Karabelas (1997), some advantages of using the caustic scrubbing method for H2S abatement include:
a) Over 90% removal of entering H2S; b) No influence of geothermal steam composition;
Franco Nolasco 202 Report 13
c) Low investment but relatively high operating expenses because of the consumption of chemicals; and
d) Simple and flexible process. Due to these advantages, the caustic scrubbing method is the most widely used technique for H2S removal in geothermal exploration (upstream of the turbine). 5.1.1 Caustic scrubbing Caustic scrubbing is a process for removing H2S from geothermal steam. The process involves the injection of sodium hydroxide (NaOH) through spray nozzles into the blooie line to scrub the H2S from the steam into a solution as bisulphide (HS-) and sulphide (S2-) ions according to the following reactions:
Reaction 16 is instantaneous and if the solution has a high pH, Reaction 17 is favoured. Limitations: The efficiency of NaOH for scrubbing H2S is reduced by the presence of carbon dioxide (CO2), because CO2 consumes hydroxide ions of NaOH according to the following reactions:
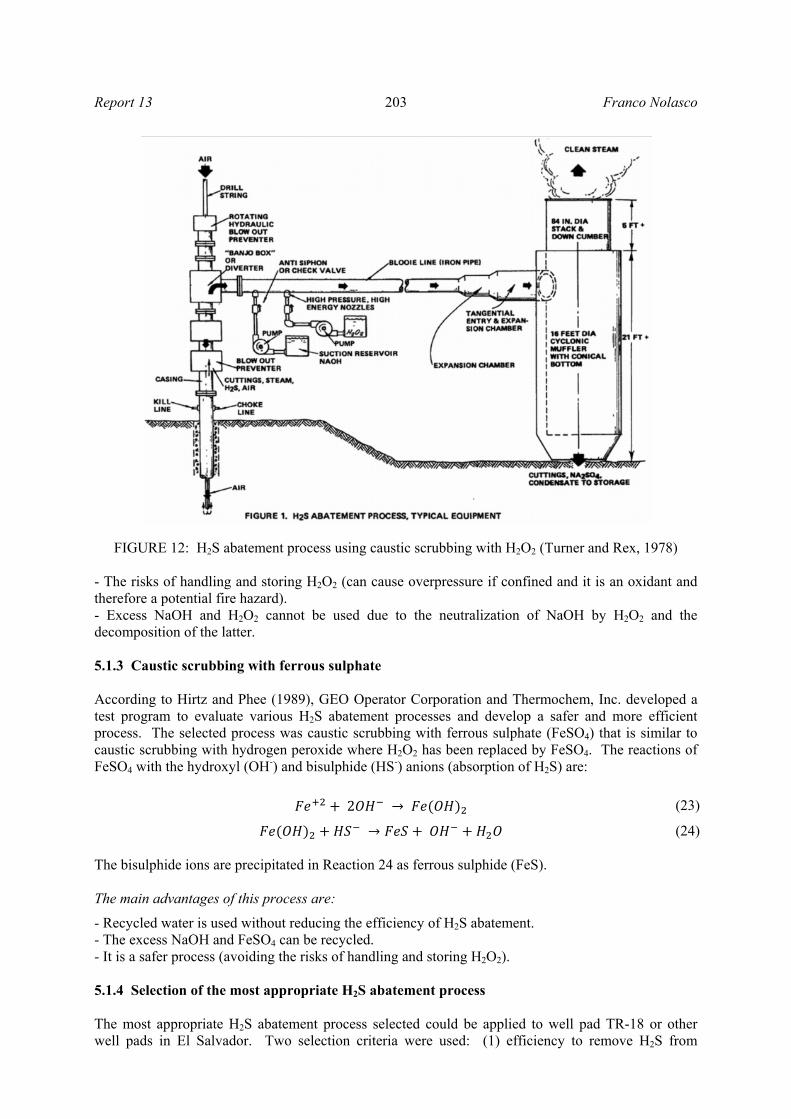
The efficiency of NaOH for scrubbing H2S could also be reduced by the use of recycling water due to a build up of dissolved sulphide (Na2S) produced in Reaction 17 (Hirtz and Phee, 1989). 5.1.2 Caustic scrubbing with hydrogen peroxide According to Turner and Rex (1978), hydrogen peroxide (H2O2) is injected into the blooie line to oxidize the bisulphide and sulphide ions to sodium sulphate (Na2SO4) and sodium bisulphate (NaHSO4), respectively, which would not revert back to hydrogen sulphide according to the following reactions:
Currently this process is the chemical abatement system approved by North Sonoma County Air Pollution Control District (NSCAPCD) and is used to control H2S emissions during well construction and testing in the Geysers geothermal field in California (Calpine-Geysers, 2010). As reported by Hirtz and Phee (1989), the advantage of this process is that it can use recycled water without any significant reduction in the efficiency of H2S abatement. A process flow diagram is shown in Figure 12. Limitations:
- The consumption of H2O2 increases operation costs.
(15)
(16)
(17)
(18)
(19)
(20)
2 4 2 4 (21)
4 4 (22)
Report 13 203 Franco Nolasco
- The risks of handling and storing H2O2 (can cause overpressure if confined and it is an oxidant and therefore a potential fire hazard). - Excess NaOH and H2O2 cannot be used due to the neutralization of NaOH by H2O2 and the decomposition of the latter. 5.1.3 Caustic scrubbing with ferrous sulphate According to Hirtz and Phee (1989), GEO Operator Corporation and Thermochem, Inc. developed a test program to evaluate various H2S abatement processes and develop a safer and more efficient process. The selected process was caustic scrubbing with ferrous sulphate (FeSO4) that is similar to caustic scrubbing with hydrogen peroxide where H2O2 has been replaced by FeSO4. The reactions of FeSO4 with the hydroxyl (OH-) and bisulphide (HS-) anions (absorption of H2S) are:
The bisulphide ions are precipitated in Reaction 24 as ferrous sulphide (FeS). The main advantages of this process are:
- Recycled water is used without reducing the efficiency of H2S abatement. - The excess NaOH and FeSO4 can be recycled. - It is a safer process (avoiding the risks of handling and storing H2O2). 5.1.4 Selection of the most appropriate H2S abatement process The most appropriate H2S abatement process selected could be applied to well pad TR-18 or other well pads in El Salvador. Two selection criteria were used: (1) efficiency to remove H2S from
FIGURE 12: H2S abatement process using caustic scrubbing with H2O2 (Turner and Rex, 1978)
2 (23)
(24)
Franco Nolasco 204 Report 13
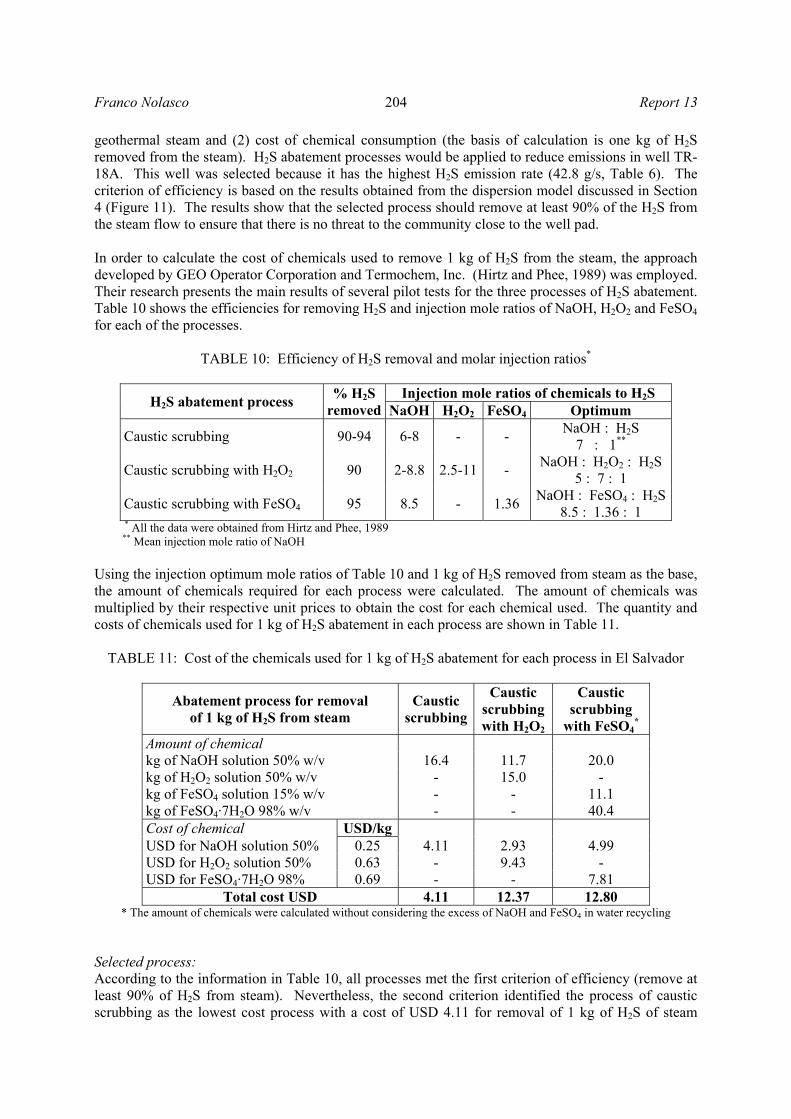
geothermal steam and (2) cost of chemical consumption (the basis of calculation is one kg of H2S removed from the steam). H2S abatement processes would be applied to reduce emissions in well TR-18A. This well was selected because it has the highest H2S emission rate (42.8 g/s, Table 6). The criterion of efficiency is based on the results obtained from the dispersion model discussed in Section 4 (Figure 11). The results show that the selected process should remove at least 90% of the H2S from the steam flow to ensure that there is no threat to the community close to the well pad. In order to calculate the cost of chemicals used to remove 1 kg of H2S from the steam, the approach developed by GEO Operator Corporation and Termochem, Inc. (Hirtz and Phee, 1989) was employed. Their research presents the main results of several pilot tests for the three processes of H2S abatement. Table 10 shows the efficiencies for removing H2S and injection mole ratios of NaOH, H2O2 and FeSO4 for each of the processes.
TABLE 10: Efficiency of H2S removal and molar injection ratios*
H2S abatement process % H2Sremoved
Injection mole ratios of chemicals to H2S NaOH H2O2 FeSO4 Optimum
Caustic scrubbing 90-94 6-8 - - NaOH : H2S 7 : 1**
Caustic scrubbing with H2O2 90 2-8.8 2.5-11 - NaOH : H2O2 : H2S 5 : 7 : 1
Caustic scrubbing with FeSO4 95 8.5 - 1.36 NaOH : FeSO4 : H2S8.5 : 1.36 : 1
* All the data were obtained from Hirtz and Phee, 1989 ** Mean injection mole ratio of NaOH
Using the injection optimum mole ratios of Table 10 and 1 kg of H2S removed from steam as the base, the amount of chemicals required for each process were calculated. The amount of chemicals was multiplied by their respective unit prices to obtain the cost for each chemical used. The quantity and costs of chemicals used for 1 kg of H2S abatement in each process are shown in Table 11.
TABLE 11: Cost of the chemicals used for 1 kg of H2S abatement for each process in El Salvador
Abatement process for removal of 1 kg of H2S from steam
Caustic scrubbing
Caustic scrubbingwith H2O2
Caustic scrubbing
with FeSO4*
Amount of chemical kg of NaOH solution 50% w/v 16.4 11.7 20.0 kg of H2O2 solution 50% w/v - 15.0 - kg of FeSO4 solution 15% w/v - - 11.1 kg of FeSO4·7H2O 98% w/v - - 40.4 Cost of chemical USD/kg USD for NaOH solution 50% 0.25 4.11 2.93 4.99 USD for H2O2 solution 50% 0.63 - 9.43 - USD for FeSO4·7H2O 98% 0.69 - - 7.81
Total cost USD 4.11 12.37 12.80 * The amount of chemicals were calculated without considering the excess of NaOH and FeSO4 in water recycling
Selected process: According to the information in Table 10, all processes met the first criterion of efficiency (remove at least 90% of H2S from steam). Nevertheless, the second criterion identified the process of caustic scrubbing as the lowest cost process with a cost of USD 4.11 for removal of 1 kg of H2S of steam
Report 13 205 Franco Nolasco
(Table 11). Therefore, the process of caustic scrubbing presents the lowest cost in the use of chemicals and was selected as the most appropriate process of H2S abatement. About 554 kg of H2S were emitted during flow testing (for 4 hours) using the lip pressure method in TR-18A. In order to remove 90% of the H2S emitted, the caustic scrubbing method was recommended. The method requires 7800 kg of NaOH 50% w/v, with an estimated cost of 1950 USD. Some considerations to be taken into account when implementing the process of caustic scrubbing are:
• The brine should be re-injected; • Demisters should be used to minimise the drag of NaOH by the steam; and • Use of fresh water. Recycled water reduces the efficiency to remove H2S.
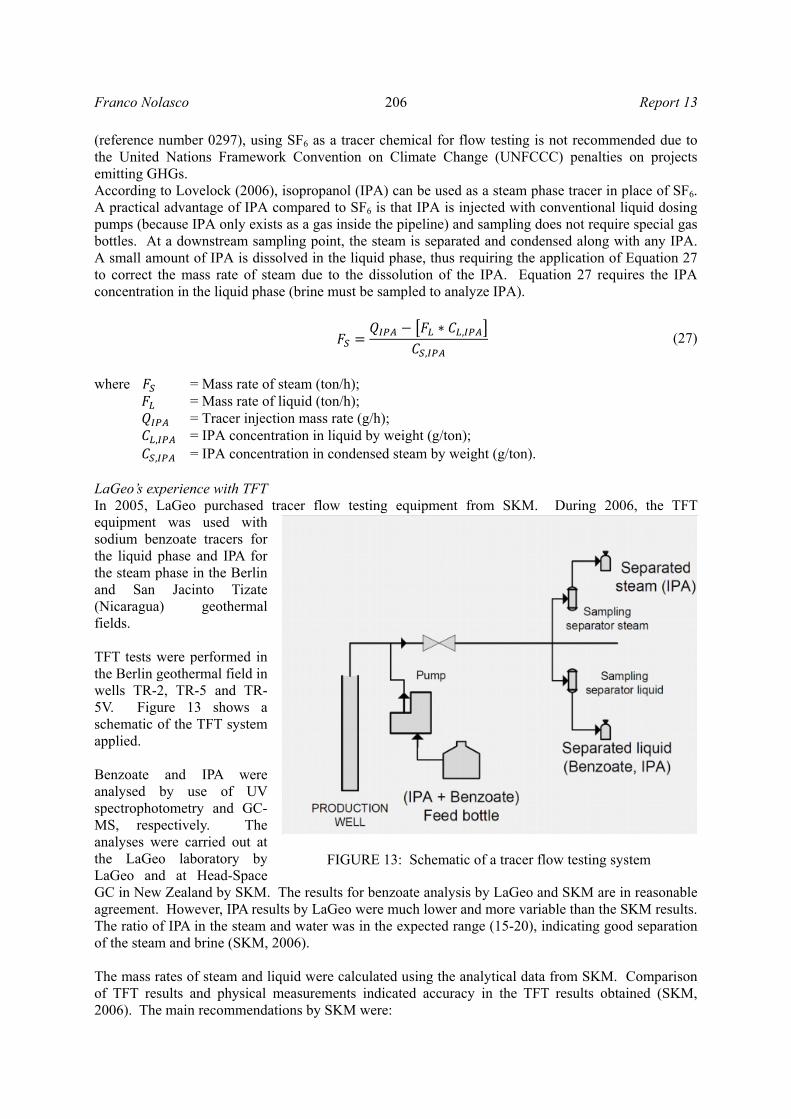
5.2 Using tracer chemicals for flow testing A way to avoid emissions of H2S during flow testing is through the application of new measurement techniques such as using chemical tracers to measure flow, i.e. TFT (Tracer Flow Test). In addition, to avoid discharges to the atmosphere, other advantages of TFT are: flexibility in scheduling testing and power station operations are not disturbed or interrupted. The TFT technique requires precisely metered rates of steam and liquid phase tracers injected into the two-phase flow stream. Samples of each phase are collected with sampling separators at a location far enough downstream of the injection point to ensure complete mixing of the tracers in their respective phases. The water and steam samples are then analyzed for tracer content, and the mass flow rate of each phase is calculated based on these measured concentrations and the injection rate of each tracer (Hirtz et al., 2001). The mass rate of liquid (FL) and steam (FS) is given by:
where , = mass rate of liquid or steam (ton/h);
= tracer injection mass rate (g/h); = tracer concentration by weight (g/ton).
According to Lovelock (2001), the total discharge enthalpy (Ht) can then be calculated from the measured mass rate of steam (FS) and liquid (FL):
where hg and hf are the enthalpy of steam and liquid (obtained from steam tables) using the temperature in the pipeline. NCGs are not included in the above expressions and it is necessary to calculate them separately. Hirtz et al. (2001) assure that sulphur hexafluoride (SF6) and sodium benzoate (NaC6H5CO2) are the most convenient steam- and liquid-phase tracers, respectively. SF6 is the most potent greenhouse gas (GHG) that has been evaluated, with a global warming potential of 23,900 times that of CO2 when compared over a 100 year period (UNFCCC, 2010). To combat GHG emissions and contribute to sustainable development, LaGeo has registered two Clean Development Mechanism (CDM) geothermal projects: Berlin geothermal project, phase two and Berlin binary cycle power plant. Since well pad TR-18 is part of the Berlin geothermal project, phase two registered under the CDM
, (25)
(26)
Franco Nolasco 206 Report 13
(reference number 0297), using SF6 as a tracer chemical for flow testing is not recommended due to the United Nations Framework Convention on Climate Change (UNFCCC) penalties on projects emitting GHGs. According to Lovelock (2006), isopropanol (IPA) can be used as a steam phase tracer in place of SF6. A practical advantage of IPA compared to SF6 is that IPA is injected with conventional liquid dosing pumps (because IPA only exists as a gas inside the pipeline) and sampling does not require special gas bottles. At a downstream sampling point, the steam is separated and condensed along with any IPA. A small amount of IPA is dissolved in the liquid phase, thus requiring the application of Equation 27 to correct the mass rate of steam due to the dissolution of the IPA. Equation 27 requires the IPA concentration in the liquid phase (brine must be sampled to analyze IPA).
where = Mass rate of steam (ton/h);
= Mass rate of liquid (ton/h); = Tracer injection mass rate (g/h); , = IPA concentration in liquid by weight (g/ton); , = IPA concentration in condensed steam by weight (g/ton).
LaGeo’s experience with TFT In 2005, LaGeo purchased tracer flow testing equipment from SKM. During 2006, the TFT equipment was used with sodium benzoate tracers for the liquid phase and IPA for the steam phase in the Berlin and San Jacinto Tizate (Nicaragua) geothermal fields. TFT tests were performed in the Berlin geothermal field in wells TR-2, TR-5 and TR-5V. Figure 13 shows a schematic of the TFT system applied. Benzoate and IPA were analysed by use of UV spectrophotometry and GC-MS, respectively. The analyses were carried out at the LaGeo laboratory by LaGeo and at Head-Space GC in New Zealand by SKM. The results for benzoate analysis by LaGeo and SKM are in reasonable agreement. However, IPA results by LaGeo were much lower and more variable than the SKM results. The ratio of IPA in the steam and water was in the expected range (15-20), indicating good separation of the steam and brine (SKM, 2006). The mass rates of steam and liquid were calculated using the analytical data from SKM. Comparison of TFT results and physical measurements indicated accuracy in the TFT results obtained (SKM, 2006). The main recommendations by SKM were:
,, (27)
FIGURE 13: Schematic of a tracer flow testing system

Report 13 207 Franco Nolasco
a) LaGeo needed to improve the accuracy of their IPA analyses. Prior to this, SKM required that LaGeo should carry out back-up checks using an external laboratory; and
b) Dedicated injection and sampling points were to be installed for TFT. LaGeo has adhered to the above recommendations by SKM, and has carried out further TFT testing. IPA analysis results show no significant difference in comparison to an external laboratory. The most important thing is that LaGeo has equipment and experience in TFT testing. This will help in ensuring that necessary environmental measures are implemented. 5.3 Minimising the duration of steam venting at the well pads Power plant outages force direct venting of steam to the atmosphere. This measure is used to reduce the impact of the vents on the well pads during power plant outages and is divided into 2 events depending on duration: Power plant outages of short duration (1 hour to 3 days): During power plant outages, steam is discharged to the atmosphere in the power plant in the collector area (point 3, Figure 2). This prevents H2S emissions from well pad TR-18 during outages of short duration. Power plant outages of long duration (overhaul, up to 21 days): For overhaul, steam is discharged from the well pad while performing the procedures necessary to close wells TR-18 and TR-18A. In this event, the duration of steam venting at the well pads should be reduced during the closure of the wells by reducing the venting time to less than 1 hour. This reduction in time should not jeopardize the steam gathering system, well integrity and safety of workers. If the time for steam venting from the well pad cannot be reduced to 1 hour maximum, then caustic scrubbing should be considered. Action has been taken on outages of short duration by LaGeo. However, it is necessary to incorporate the event into the internal management processes of Berlin geothermal power plant. 6. CONCLUSIONS AND RECOMMENDATIONS In the Berlín geothermal field, hydrogen sulphide in decreasing magnitude order is emitted mainly in cooling towers, the collector area, well pads and steam gathering traps. This study shows that at well pad TR-18:
a) H2S emissions at nominal flow for wells TR-18 and TR-18A are 7.1 and 42.8 g/s, respectively. b) Estimated maximum concentrations (using SCREEN3) in the Bob Graham community were
54.9 and 174.2 (μg/m3 24-hour average) during TR-18 and TR-18A well discharges, respectively. These values are 3 orders of magnitude lower than ACGIH occupational limits (140,000 μg/m3). However, the estimated concentrations exceeded USEPA-California (43 μg/m3, 1-hour average) and Icelandic (50 μg/m3, 24-hour average) regulations. These results show that these emissions can potentially be a nuisance to nearby populations due to temporary increases in H2S odour.
H2S emission is considered a significant environmental aspect. This requires action to remove H2S from steam in order to reduce the concentrations in the Bob Graham community during discharge of the wells in the well pad. Two alternatives are proposed for H2S abatement at well pad TR-18:

Franco Nolasco 208 Report 13
a) Three methods for H2S removal were evaluated: caustic scrubbing, caustic scrubbing with peroxide and scrubbing with iron sulphate. The first method is the most appropriate due to its good efficiency (90%) and low chemical cost compared to the other two methods.
b) Recently, LaGeo implemented the chemical tracer method, which uses isopropanol for the steam phase and sodium benzoate for the liquid phase. This method is the most suitable for flow measurement because it avoids H2S emissions in flow testing.
This study recommends:
a) Suggested mitigating actions are to replace the current measurement method (lip pressure) by the chemical tracer method during flow testing but apply the caustic scrubbing method when it is necessary to discharge the wells to the atmosphere from the well pad;
b) To minimise well discharge time from well pad TR-18 during power plant outages; c) Well discharge flow reduction as a H2S mitigating action at well pad TR-18 is not
recommended due to increases in H2S concentration in the Bob Graham community; d) Continuous monitoring of H2S concentrations at the Bob Graham community; and e) Further detailed studies of H2S dispersion modelling with different stack heights should be
carried out.
ACKNOWLEDGEMENTS I express my sincere gratitude to the United Nations University Geothermal Training Programme and my employer, LaGeo S.A. de C.V. for giving me the opportunity to participate in the six months training in Iceland. My sincere gratitude to the UNU-GTP staff: Dr. Ingvar B. Fridleifsson, Mr. Lúdvík S. Georgsson, Mr. Markús, A.G. Wilde, Ms. Thórhildur Ísberg, Ms. Dorthe H. Holm and Mr. Ingimar G. Haraldsson. Special gratitude to Gudmundur Gunnarsson for his dedicated guidance and technical support during the preparation of my project. Also a special mention to Paul Hirtz for his advice; it was important to this project. Thanks to my family and friends for their prayers and their affection; I felt it although everyone was so far away. Thanks go to my environmental family (Thecla, Cornelius, Na), also to Manuel and Bi-Yun for your friendship and full support. Thanks to my friends at LaGeo: Ana Silvia de Arévalo, Wallace Valenzuela, Karina, Kevin Padilla, Aníbal Rodríguez, Guido Molina, Ulises Najo, Rosy Escobar, Arnoldo Pérez, Rubén Loy, Luz Barrios, Luis Aguirre, Roberto Renderos, Jaime Hernández and Julio Quijano. I want to express all my gratitude to Jesus Christ, my Lord and saviour, for being so clear to me in Iceland. Thanks to María Antonieta Franco for her unconditional support every day.
REFERENCES
Alberta Environment, 2003: Sulphur dioxide: environmental effects, fate and behaviour. Alberta Environment, Edmonton, Alberta, 61 pp, website: http://environment.gov.ab.ca/info/library/6615.pdf. Arévalo, A.S., 2006: Environmental and social issues in geothermal in El Salvador. Proceedings of the Workshop for Decision Makers on Geothermal Projects in Central America, San Salvador, El Salvador, UNU-GTP and LaGeo, CD SC-02, 4 pp.

Report 13 209 Franco Nolasco
Arévalo, A.S., and Padilla, E.K., 2008: An innovative environmental impact assessment applied to the Chinameca deep exploration project. Papers presented at the 30th Anniversary Workshop of the United Nations University Geothermal Training Programme, UNU-GTP, Reykjavík, CD, 10 pp. ATSDR, 2006: Toxicological profile for hydrogen sulphide. Agency for Toxic Substances and Disease Registry, Public Health Service, U.S. Department of Health and Human Services, Atlanta, 253 pp, website: www.atsdr.cdc.gov/toxprofiles/tp114.html. Bates, M.N., Garrett, N., Graham, B., and Read, D., 1997: Air pollution and mortality in the Rotorua geothermal area. Aust. NZ. J. Public Health, 21, 581–586. Bowyer, J., 2003: Residence time for hydrogen sulphide in the atmosphere literature search results. Division of Air Quality, website: http://daq.state.nc.us/toxics/studies/H2S/H2S_Ambient_Air.pdf. Calpine-Geysers, 2010: Calpine enhanced geothermal systems project. Final environmental assessment. Department of Energy, Golden, Colorado, DOE/EA 1733, website: www.eere.energy.gov/golden/Reading_Room.aspx. CEC, 1980: Assessment of H2S control technologies for geothermal power plants. California Energy Commission, Sacramento, California, 122 pp, website: www.osti.gov/bridge/purl. cover.jsp;jsessionid=81E2417142B6D17AA9AA2B5CAAD671C8?purl=/5226737-k7gkwi/native/. Culivicchi, G., Lenzi, A., Perini, R., and Tarquini, B., 2000: H2S abatement in the cold gas cap of geothermal wells before kick-off tests. Proceedings of the World Geothermal Congress 2000, Kyushu - Tohoku, Japan, 549-552. D’Alessandro, Kyriakopoulos, K.W., Brusca, L., Michas, G. and, Papadakis, G. 2009: Hydrogen sulphide as a natural air contaminant in volcanic/geothermal areas: the case of Sousaki, Corinthia (Greece). Environmental Geology, 57-8, 1723-1728. Franco, L., 2009: Air quality monitoring report for the Berlín geothermal power plant (in Spanish). LaGeo S.A. de C.V., Environmental department, report, 13 pp. Grant, M.A., Donaldson, I.G., and Bixley, P.F., 1982: Geothermal reservoir engineering. Academic Press Ltd., New York, 369 pp. Henley, R.W., Truesdell, A.H., and Barton Jr., P.B., 1984: Fluid-mineral equilibria in hydrothermal systems. Reviews in Economic Geology, 1, 45 pp. Herrera, R., Montalvo, F., and Herrera Ada., 2010: El Salvador country update. Proceedings of the World Geothermal Congress 2010, Bali, Indonesia, 6 pp. Hirtz, P., and Phee, T.M., 1989: Development of a safer and more efficient method for abatement of H2S during geothermal well drilling. Geotherm. Res. Counc., Trans., 13, 403-407. Hirtz, P.N., Kunzman, R.J., Broaddus, M.L., and Barbitta, J.A., 2001: Developments in tracer flow testing for geothermal production engineering. Geothermics, 30, 727–745. HSDB, 2010: Hazardous substances data bank. National Library of Medicine, National Toxicology Program, Bethesda, MD, website: http://toxnetnlm.nih.gov/cgi-bin/sis/search/f?./temp/~A1kljL:1. James R., 1970: Factors controlling borehole performance. Geothermics, Sp. issue, 2-2, 1502-1515.
Franco Nolasco 210 Report 13
Kirk-Othmer, 2006: Sulphur. Kirk-Othmer encyclopedia of chemical technology, vol. 23. John Wiley & Sons, 79 pp, website: mrw.interscience.wiley.com/emrw/9780471238966/kirk/article/sulf.a02/current/pdf Kristmannsdóttir, H., Sigurgeirsson, M., Ármannsson, H., Hjartarsson, H., and Ólafsson, M., 2000: Sulphur gas emissions from geothermal power plants in Iceland. Geothermics, 29, 525-538. LaGeo, 2009a: Generation reports, 2009. LaGeo S.A. de C.V., internal report (in Spanish). LaGeo, 2009b: Report results of gas analysis for carbon credits, 2009. LaGeo S.A. de C.V., internal report (in Spanish). LaGeo, 2010a: Environmental assessment Berlín geothermal power plant 2010. LaGeo S.A. de C.V., Environmental Department, report (in Spanish), 137 pp. LaGeo, 2010b: Air quality monitoring report for well pad TR-18. LaGeo S.A. de C.V., Environmental Department, report (in Spanish), 13 pp. LaGeo, 2010c: Air quality monitoring report for well pads TR-17 and TR-18 during well discharge. LaGeo S.A. de C.V., Environmental Department, report (in Spanish), 10 pp. Lovelock, B.G., 2001: Steam flow measurement using alcohol tracers. Geothermics, 30, 641–654. Lovelock, B.G., 2006: Flow testing in Indonesia using alcohol tracers. Proceedings of the 31st Workshop on Geothermal Reservoir Engineering, Stanford University, Stanford, Ca, 5 pp, website: http://pangea.stanford.edu/ERE/pdf/IGAstandard/SGW/2006/lovelock.pdf. MfE, 2002: Ambient air quality guidelines, 2002 update. Ministry for the Environment of New Zealand, Wellington, NZ, 58 pp. MINEC, 2010: Spatial analysis tool of VI census of population and V of housing 2007 of the Ministry of Economy of El Salvador. Ministry of Economy of El Salvador, website: http://www.censos.gob.sv/gmaps/Gflex/mapsflex.html#. Ólafsdóttir, S., Gardarsson, S.M., and Ármannsson, H., 2010: Concentration of hydrogen sulphide from geothermal power plants in the vicinity of Reykjavik City, Iceland, 2007-2009. Proceedings of the World Geothermal Congress 2010, Bali, Indonesia, CD, 8 pp. Padilla, E.K., 2007: Preliminary study on emission abatement and use of gas from geothermal power plants in El Salvador. Report 18 in: Geothermal Training in Iceland 2007. UNU-GTP, Iceland, 417-446. Renderos, R.E., 2009: Carbon dioxide fixation by calcite and diffusive degassing in the southern region of the Berlín geothermal system, El Salvador. University of Iceland, MSc thesis, UNU-GTP, report 4, 45 pp. Rodríguez, J.A., and Monterrosa, M., 2007: Phased development at Ahuachapán and Berlín geothermal fields. Lecture 2 in: Rodríguez, J.A. (lecturer), Lectures on geothermal in Central America. UNU- GTP, Iceland, Report 1, 7-20. Sanopoulos, D., and Karabelas, A., 1997: H2S abatement in geothermal plants: Evaluation of process alternatives. Energy Sources, 19, 63-67. SKM, 2006: Tracer flow testing. Provision of equipment & services. Sinclair Knight Merz, Auckland NZ, final report AP01076, 20 pp.
Report 13 211 Franco Nolasco
Sullivan, M., 2008: Water balance of the San Simon groundwater basin, El Salvador, Central America: Implications for the Berlin geothermal field. College of Arts and Sciences, Ohio University, MSc thesis, 111 pp. Turner, T.A, and Rex, R.W., 1978: A practical hydrogen sulphide abatement process for air drilling and venting geothermal steam wells. Geotherm. Res. Council, Trans,. 2, 663-665. UNFCCC 2010: Global warming potentials. UNFCCC, website: http://unfccc.int/ghg_data/items/3825.php. USEPA, 1992: Screening procedures for estimating the air quality impact of stationary sources, revised. U.S. Environmental Protection Agency, report EPA-454/R-92-019, 43 pp. USEPA, 1995a: SCREEN3 model user's guide. U.S. Environmental Protection Agency, report EPA-454/B-95-004, 43 pp. USEPA, 1995b: User's guide for the industrial source complex (ISC3) dispersion models, volume II. Description of model algorithms. U.S. Environmental Protection Agency, report EPA-454/B-95-003b, 128 pp. Wang, L.K., Pereira N.C., Hung Y., 2005: Advanced air and noise pollution control. Handbook of environmental engineering, vol. 2. Humana Press Inc., Totowa, NJ, USA, 36 pp. Warneck, P., 1999: Chemistry of the natural atmosphere, vol. 71 (2nd edition). Academic Press, Orlando, Florida, USA, 927 pp. WHO, 1981: International programme on chemical safety. Environmental health criteria 19, hydrogen sulphide. INCHEM, website: www.inchem.org/documents/ehc/ehc/ehc019.htm. WHO, 1996: Guidelines for drinking-water quality. vol. 2. Health criteria and other supporting information (2nd edition). World Health Organization, Geneva, 83 pp, website: www.who.int/water_sanitation_health/dwq/2edvol2p2b.pdf. WHO 2000: Air quality guidelines for Europe (2nd edition). World Health Organization, Copenhagen, Regional Publications, European Series, 147 pp, website: www.euro.who.int/__data/assets/pdf_file/0005/74732/E71922.pdf. WHO, 2003: Hydrogen sulphide: human health aspects. World Health Organization, Geneva, Concise international chemical assessment document 53, 35 pp, website: www.who.int/ipcs/publications/cicad/en/cicad53.pdf.
APPENDIX I: Acute exposure guideline levels to hydrogen sulphide
Exposure periods 10 min 30 min 60 min 4 hr 8 hr AEGL 1 (ppm) 0.75 0.60 0.51 0.36 0.33 AEGL 2 (ppm) 41 32 27 20 17 AEGL 3 (ppm) 76 59 50 37 31
AEGL-1 is the airborne concentration, expressed as parts per million or milligrams per cubic meter (ppm or mg/m3) of a substance above which it is predicted that the general population, including susceptible individuals, could experience notable discomfort, irritation, or certain asymptomatic non-

Franco Nolasco 212 Report 13
sensory effects. However, the effects are not disabling and are transient and reversible upon cessation of exposure. AEGL-2 is the airborne concentration (expressed as ppm or mg/m3) of a substance above which it is predicted that the general population, including susceptible individuals, could experience irreversible or other serious, long-lasting adverse health effects or an impaired ability to escape. AEGL-3 is the airborne concentration (expressed as ppm or mg/m3) of a substance above which it is predicted that the general population, including susceptible individuals, could experience life-threatening health effects or death.