Embed Size (px)
Citation preview

GEOTHERMAL TRAINING PROGRAMME Reports 2006 Orkustofnun, Grensásvegur 9, Number 4 IS-108 Reykjavík, Iceland
1
CIVIL WORKS IN GEOTHERMAL DRILL SITES
Ali Ahmadi Nasirabadi SUNA – Renewable Energy Organization of Iran
Yadegare Emam Highway, Poonake Bakhtari Ave., Shahrake Ghods P.O. Box 14155-6398, Tehran
IRAN [email protected]
ABSTRACT
Mt. Sabalan stratovolcano and geothermal area is located in NW-Iran (Azerbaijan region). It is a high-temperature area under development. Geothermal exploration was started in 1975 by the Ministry of Energy of Iran. Three deep exploration wells and two wells intended for reinjection were drilled in 2002-2004 in the NW-Sabalan area, about 16 km southeast of the town of Meshkin Shahr, by SUNA – the Renewable Energy Organization of Iran. At site A are two wells: NWS-1, which is a vertical well and another well intended for re-injection. Another exploration well, NWS3, was drilled at site A, but directionally. At site C there is one exploration well, NWS-4, also drilled directionally, and a reinjection well. After testing NWS-1 and analysing the results, SUNA intends to drill more wells directed towards the southern part of the field, with four wells scheduled at both sites A and B. Civil works and their design are important during site development. This paper deals with the civil works at a geothermal drill site. Various aspects of making suitable foundations for drilling equipment are discussed, mainly based on compacted soil embankments. The use of various drilling materials, such as bentonite, cement, water and cuttings, are also discussed, as well as the disposal of waste. The main topic of soil classification is discussed. Tests are described to estimate allowable stresses and soil compaction. Finally, calculations were made of stresses and the load bearing capacity of a platform made of gravel, assuming a drill rig of 200 tonne capacity.
1. INTRODUCTION Iran has the second largest gas reservoirs in the world as well as big oil reservoirs. In addition, it has a high potential for renewable energy such as geothermal, solar, wind, biomass, etc. The town of Meshkin Shahr is located in NW-Iran and has a population of 164,000. Mount Sabalan is a stratovolcano, located southeast of Meshkin Shahr. Its peak is at an elevation of 4881 m level and is about 25 km from the town. The Sabalan geothermal prospect lies in the Moeil valley on the western slopes of Mt. Sabalan, approximately 16 km southeast of Meshkin Shahr (Figure 1). Mt. Sabalan was first explored for geothermal resources by Energy Electrica of Italy (ENEL). In 1975, a contract was signed between the Ministry of Energy of Iran (MOEI) and ENEL for geothermal exploration in the

Ahmadi Nasirabadi 2 Report 4
northern part of Iran (Azerbaijan and Dama-vand regions). According to the final report from ENEL, priorities should be given to the Sabalan, Damavand, Khoy-Maku and Sahand regions. After the establishment of the Electric Power Research Centre (EPRC) and SUNA (the Renewable Energy Organization of Iran) in the 1990s, and further investigation, the Sabalan region was recommended for first drilling to explore the possibilities of electrical generation from geother-mal energy in Iran, possibly combined with direct use in the area. Extensive geological, geochemical and geologi-cal surveys were carried out in 1998. The area includes three geothermal fields located in the northern, eastern and southern parts of the Sabalan central volcano; a number of geothermal prospects are associated with these (Sahabi et al., 1999). The Sabalan - Meshkin Shahr prospect has been identified as the best of these prospects. The design of civil works is very important as the soil in the Meshkin Shahr region is not good. It is wind-carried, resulting in damaged pastures in the area. Good pastures are very important for tribal people and for the local economy, as they support livestock meant for meat, milk and wool products. This means that environmental factors are very important in the Meshkin Shahr prospect and development must be limited to as small an area as possible. Also, land reclamation is necessary in areas not needed for further development. Environmental concerns must also consider that near the Sabalan prospect is a river that is used for drinking water in Meshkin Shahr. SUNA has been successful in reclaiming pastures in the area after development, in all about 10,000 m2 at the three drill sites. In this paper, the main topic is the structural design of a drilling platform. Platforms can be made of compacted soil, timber or reinforced concrete, depending on soil conditions established by field tests and laboratory tests. During the first stage, a description of the soil is needed. Because a platform is mainly made of soil, it is very important to study the soil available in the region and make necessary tests in the field or in the laboratory to find out whether the material is suitable for a platform or for
FIGURE 1: Geological map of the Sabalan – Meshkin Shahr prospect (mod. from Yousefi Sahzabi, 2004)

Report 4 3 Ahmadi Nasirabadi
other civil works. Various aspects for making a suitable foundation for drilling equipments, mainly based on compacted soil embankments, are also discussed. Usually soil is divided into four groups, gravel, sand, silt and clay. The particle sizes for each group are different. In order to describe them, the common practise is to use a grading curve plot; its use is described. Also described are calculations on allowable stresses and load bearing of a platform. Another feature that it is important, not least for environmental reasons, is the mud pit. Disposable products during drilling are made from cuttings, bentonite, perlite, silica, cement and water. If the disposal of these products is not managed well, it can lead to environmental pollution and cause problems for the local society. Finally, calculations on drill cuttings, bentonite, cementing and its disposal during the drilling phase, and the disposal of water during drilling are described. 2. EXPLORATION OF THE MESHKIN SHAHR GEOTHERMAL AREA Sabalan is a Quaternary stratovolcano that presently is in a solfatara stage. Surface geological surveys of the Sabalan area show that most of the area is covered by extrusive rocks (Fotouhi, 1995). Mt. Sabalan lies on the south Caspian plate, which thrusts under the Eurasian plate to the north (Bogie et al., 2000). Structurally, the Sabalan area is located in a very complex compressional tectonic zone near the junction of the Eurasian, Iranian and Arabian plates (Bromley et al., 2000). Mt. Sabalan is a large volcanic system, and consists of an extensive central edifice built on a probable tectonic horst of underlying intrusive and effusive volcanic rocks. Enormous amounts of discharged magma caused the formation of a collapsed caldera about 12 km in diameter, with a depression of about 400 m. The lava flows in the Sabalan are mostly tacky andesite and dacite with alternative explosive phases (Khosrawi, 1996). A schematic geological map of the Sabalan – Meshkin Shahr geothermal prospect is presented in Figure 1 and shows the volcanic formations from Eocene to Quaternary. 3. THE PLATFORM Commonly, there are two methods for making a drill platform, a soil platform or soil with timber platform, and a reinforced platform on a soil embankment. The first selection for a platform is soil if the actual stress capacity of the soil after compaction allows for it. Economically, this is the best solution. The contact area between the soil and drill rig equipment is very important, so if the actual stress for the soil is higher than allowable, a timber platform is an option. Timber can increase the contact area between the soil and the drill rig equipment and, hence, distribute the load to a larger area as the actual stress is directly related to the contact area. Thus, if the contact area is increased then the actual stress will be decreased. The other main possibility in making a platform is using reinforced concrete. This method is very costly but is used in areas where the actual stress of soils after compaction or reformation cannot be increased. When designing a platform made of soil, it is necessary to know the soil material in the neighbourhood and find out whether existing material is usable for the platform. Soil mechanics are concerned with particulate materials (soils) found in the ground, which are not cemented or greatly compressed. These soils usually have a sedimentary origin; however, they can also occur as the result of rock weathering without any transport of the particles. Soil particles can be of varying sizes, shapes and mineralogy, although these properties are usually interrelated. For instance, larger sized particles are generally composed of quartz and feldspar minerals that have high strengths with fairly rounded particles, while smaller sized particles are generally composed of the clay minerals kaolin, illite and montmorillonite, minerals that have low strengths and form platy particles. One of the most important aspects of a particulate material is the existence of gaps or voids between the particles. This is influenced by the size, shape and mineralogy of the particles.
Ahmadi Nasirabadi 4 Report 4
Because of the wide range of particle sizes, shapes and minerals in a typical soil, a detailed classification of each soil type would be very expensive and inappropriate for most geotechnical engineering purposes. However, some form of a simple classification system giving information about the engineering properties is required on all sites, because:
a) Usually the soil on site must be used. Soils differ from other engineering materials in that one has very little, if any, control over their properties. Thus, the extent and properties of the soil at the site must be determined;
b) Cheap and simple tests are required to give an indication of engineering properties such as stiffness and strength for a preliminary design.
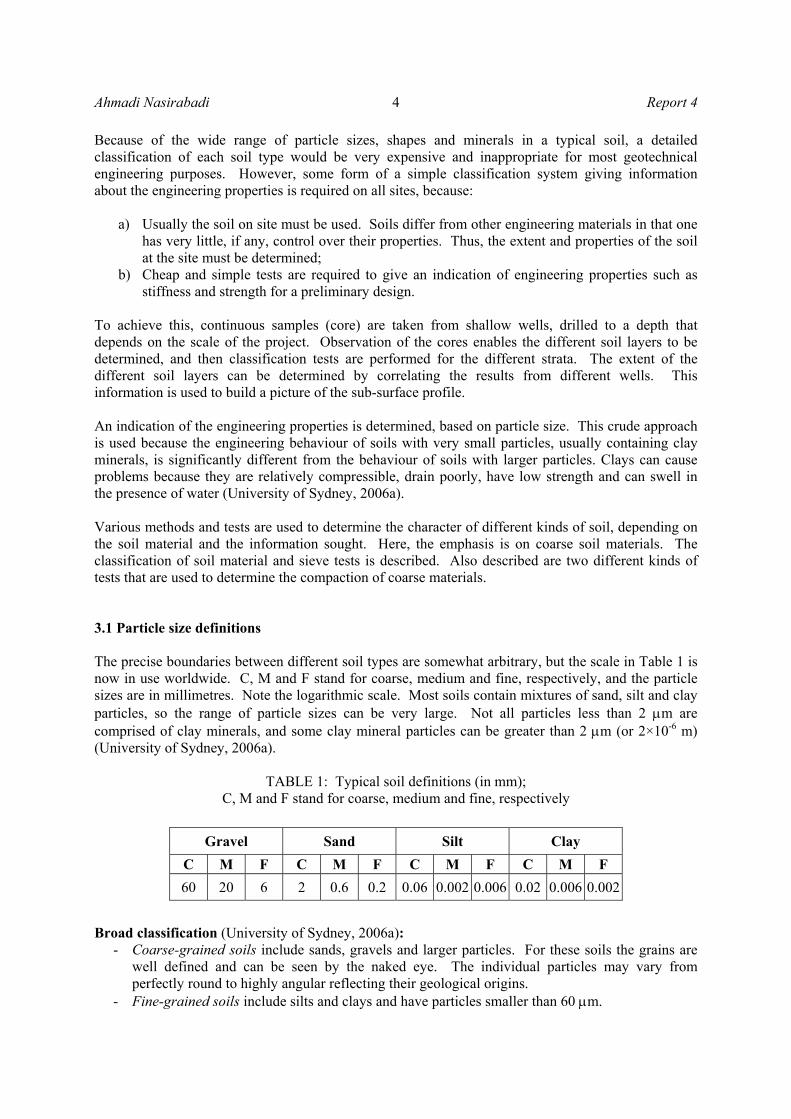
To achieve this, continuous samples (core) are taken from shallow wells, drilled to a depth that depends on the scale of the project. Observation of the cores enables the different soil layers to be determined, and then classification tests are performed for the different strata. The extent of the different soil layers can be determined by correlating the results from different wells. This information is used to build a picture of the sub-surface profile. An indication of the engineering properties is determined, based on particle size. This crude approach is used because the engineering behaviour of soils with very small particles, usually containing clay minerals, is significantly different from the behaviour of soils with larger particles. Clays can cause problems because they are relatively compressible, drain poorly, have low strength and can swell in the presence of water (University of Sydney, 2006a). Various methods and tests are used to determine the character of different kinds of soil, depending on the soil material and the information sought. Here, the emphasis is on coarse soil materials. The classification of soil material and sieve tests is described. Also described are two different kinds of tests that are used to determine the compaction of coarse materials. 3.1 Particle size definitions The precise boundaries between different soil types are somewhat arbitrary, but the scale in Table 1 is now in use worldwide. C, M and F stand for coarse, medium and fine, respectively, and the particle sizes are in millimetres. Note the logarithmic scale. Most soils contain mixtures of sand, silt and clay particles, so the range of particle sizes can be very large. Not all particles less than 2 µm are comprised of clay minerals, and some clay mineral particles can be greater than 2 µm (or 2×10⁻⁶ m) (University of Sydney, 2006a).
TABLE 1: Typical soil definitions (in mm);
C, M and F stand for coarse, medium and fine, respectively
Broad classification (University of Sydney, 2006a):
- Coarse-grained soils include sands, gravels and larger particles. For these soils the grains are well defined and can be seen by the naked eye. The individual particles may vary from perfectly round to highly angular reflecting their geological origins.
- Fine-grained soils include silts and clays and have particles smaller than 60 µm.
Gravel Sand Silt Clay C M F C M F C M F C M F 60 20 6 2 0.6 0.2 0.06 0.002 0.006 0.02 0.006 0.002
Report 4 5 Ahmadi Nasirabadi
- Silts can be visually differentiated from clays because they exhibit the property of militancy. If a moist sample is shaken in the hand, water will appear on the surface. If the sample is then squeezed between the fingers, the water will disappear. Their gritty feel can also identify silts.
- Clays exhibit plasticity; they may be readily remoulded when moist, and if left to dry can attain high strengths.
- Organic soils may consist of either clay or silt sized particles. They contain significant amounts of vegetable matter. As a result, such soils are usually dark grey or black and have a noticeable odour from decaying matter. These are very poor soils for most engineering purposes.
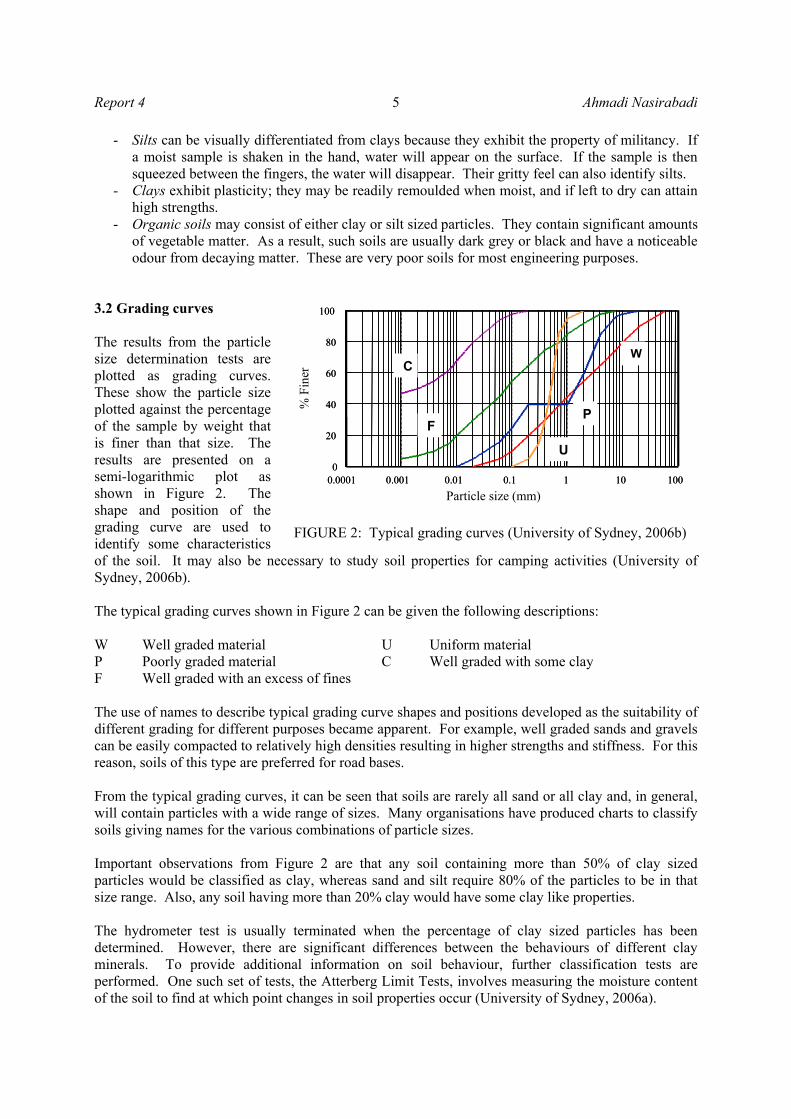
3.2 Grading curves The results from the particle size determination tests are plotted as grading curves. These show the particle size plotted against the percentage of the sample by weight that is finer than that size. The results are presented on a semi-logarithmic plot as shown in Figure 2. The shape and position of the grading curve are used to identify some characteristics of the soil. It may also be necessary to study soil properties for camping activities (University of Sydney, 2006b). The typical grading curves shown in Figure 2 can be given the following descriptions: W Well graded material U Uniform material P Poorly graded material C Well graded with some clay F Well graded with an excess of fines The use of names to describe typical grading curve shapes and positions developed as the suitability of different grading for different purposes became apparent. For example, well graded sands and gravels can be easily compacted to relatively high densities resulting in higher strengths and stiffness. For this reason, soils of this type are preferred for road bases. From the typical grading curves, it can be seen that soils are rarely all sand or all clay and, in general, will contain particles with a wide range of sizes. Many organisations have produced charts to classify soils giving names for the various combinations of particle sizes. Important observations from Figure 2 are that any soil containing more than 50% of clay sized particles would be classified as clay, whereas sand and silt require 80% of the particles to be in that size range. Also, any soil having more than 20% clay would have some clay like properties. The hydrometer test is usually terminated when the percentage of clay sized particles has been determined. However, there are significant differences between the behaviours of different clay minerals. To provide additional information on soil behaviour, further classification tests are performed. One such set of tests, the Atterberg Limit Tests, involves measuring the moisture content of the soil to find at which point changes in soil properties occur (University of Sydney, 2006a).
0.0001 0.001 0.01 0.1 1 10 1000
20
40
60
80
100
Particle size (mm)
% F
iner
0.0001 0.001 0.01 0.1 1 10 1000
20
40
60
80
100
0.0001 0.001 0.01 0.1 1 10 1000
20
40
60
80
100
Particle size (mm)
% F
iner
FIGURE 2: Typical grading curves (University of Sydney, 2006b)
W
U
P
C
F

Ahmadi Nasirabadi 6 Report 4
3.3 Classification systems for soils Several systems are used for classifying soil. These systems have two main purposes:
1. To determine the suitability of different soils for various purposes; and 2. To develop correlations with useful soil properties, for example, compressibility and strength.
The reason for the large number of such systems is the use of particular systems for certain types of construction, and the development of localised systems (University of Sydney, 2006a). An example is the PRA system of AASHO (American Association of State Highway Officials), which ranks soils from 1 to 8 to indicate their suitability as a sub grade for pavements:
1. Well graded gravel or sand, may include fines; 2. Sands and gravels with excess fines; 3. Fine sands; 4. Low compressibility silts; 5. High compressibility silts; 6. Low to medium compressibility clays; 7. High compressibility clays; and 8. Peat, organic soils.
3.4 Requirements for calculation of soil for a platform For calculating a soil platform, a number of things must be considered. One of them is if the available soil is compactible or not. Another is the permeability that determines if we must support the platform from outside influences. This can be done with a diversion channel (drainage) to carry water to the side during rainy days. Allowing water under the soil is very dangerous. Soil can store water. If it becomes saturated, its resistivity reduces which can cause decreased platform strength during loading, which is very dangerous (Sowers and Sowers, 1999). 3.4.1 Stress and effective stress The reaction of soil or rock to stress is the major factor in the design of foundations, embankments, slopes and earth retaining structures. Because of their three-phase composition, soils and rocks do not always behave in the same way as do simple one-phase materials such as steel. The solids are relatively incompressible; they will support static shear stress (although they may distort, and if the shear is sufficiently large, they will fail). Water is likewise relatively incompressible, but will offer only viscous (time-dependent) resistance to shear. The gaseous phase is compressible and has little viscous resistance to shear. Because each phase reacts differently to a load, the distribution of stress between the phases must be determined to establish the effect of that stress on the mass (Sowers and Sowers, 1999). 3.4.2 Compressibility and settlement The problem of building settlements has plagued builders for centuries. Many of the architectural masterpieces of the middle ages disappeared a long time ago because excessive settling caused them to break apart. Others, such as the leaning tower of Pisa, became famous through their defects. But extraordinary structures are not limited to the dark ages. Samples taken directly beneath the zones of the greatest structures indicate the following:

Report 4 7 Ahmadi Nasirabadi
Some soil strata, particularly soft clays, decreased in thickness, an amount equal to the imposed building material. The soil strata that decreased in thickness originally had similar void ratios as the same strata outside the structural zones. The evidence shows that a soil stratum confined by the surrounding mass and subject to a relatively uniform stress increase, decreases significantly in void ratio. Although this should have been suspected for materials that consist of discrete, irregular particles, with small areas of contact and large voids between, it remained for Karl Trezaghi to clarify the mechanics of this process in Erdlbaumechanik from 1952 (Sowers and Sowers, 1999). 3.4.3 Plate test One common method for finding the allowable stress and compaction of soil is the plate test. It is commonly used for compaction tests in coarse-grained soil in Iceland. In this test, force is applied to a steel plate and the surface displacement is plotted on a x-y graph (Figure 3). On the x axis we have the loading force in MPa, and on the y axis the variation in movement under loading, or displacement in mm. After loading in an earmarked place, the second stage is to withdraw the load to study the return movement. During this stage the equation for actual stress is:
E1 = 0.75 × (P2-P1)/ (S2-S1) Then the test is repeated (Figure 4). The method is the same and for this the equation is:
E2= 0.75 × (P2-P1)/ (S2-S1)
In Iceland, typical requirements for a plate test on a platform are:
E2/E1≤ 2.2 or E2 = 120 N/m2 Plate bearing tests are used by a number of organizations for the design and evaluation of asphalt pavement and soil compaction. The plate bearing test can be used to measure the strength at any elevation in asphalt pavement: the surface of the sub grade, the top of the base course, or the surface of the pavement. Like all other soil strength tests, it will not provide a representative measurement of sub grade strength unless it is made when the soil is in the same condition as that expected when in equilibrium with the environmental influences of moisture, density, frost, drainage, and traffic. Equilibrium is not attained until some time
FIGURE 3: Plate test for first loading (Sowers and Sowers, 1999)
FIGURE 4: Plate test for second loading (Sowers and Sowers, 1999)
Ahmadi Nasirabadi 8 Report 4
after the pavement has been superimposed over it.
Generally, before the plate bearing test is started, the following should be done: - Obtain topographical data through the proposed area to be paved; - Classify the sub-grade soil using one of the appropriate soil classification systems; - Perform the following field and laboratory tests: An in-place density test, determine moisture
content, particle size analysis, Atterberg limits, and the moisture-density relation test.
Equipment for a plate bearing test includes a load reaction device, a hydraulic jack assembly, bearing plates, and necessary dial gauges, mounts and miscellaneous tools. The reaction device can be a truck, trailer, a combination of a tractor and trailer, an anchored frame, or some other structure. It is loaded with sufficient weight to produce the desired reaction on the surface under the test. The supporting points (wells in the case of a truck or trailer) should be at least 2.5 m (8 ft) from the circumference of the largest diameter plate being used.
The hydraulic jack assembly must include spherical bearing attachments and be capable of applying and releasing the load in increments. The jack must have sufficient capacity for applying the maximum load required, and be equipped with an accurately calibrated gauge that will indicate the magnitude of the applied load. The bearing plates are steel circular plates not less than 25 mm (1 in.) in thickness and with diameters ranging from 152-762 mm (6-30 in.). The plates are machined so that they can be arranged in pyramid fashion to ensure rigidity. A minimum of four different plate sizes is recommended for pavement design or evaluation purposes. For evaluation purposes alone, a single plate may be used, provided that its area is equal to the entire contact area for the most critical combination of conditions of wheel load and tire pressure. The equipment includes two or more dial gauges, graduated in units of 0.03 mm (0.001 in.), capable of recording a maximum deflection of 25 mm (1 in.). The equipment includes a beam upon which the dial gauges are mounted. The beam is 64 mm (2 ½ in.) standard black pipe or a 76×76 mm (3×3×¼ in.) steel angle; or equivalent. It should be at least 5.5 m (18 ft) long and should rest on supports located at least 2.5 m (8 ft) from the circumference of the bearing plate or the nearest wheel or supporting leg. Miscellaneous tools include a spirit level for use in preparing the surface to be tested and for levelling the bearing plates, dial gauge clamps or holders, a stop watch, fine sand, and plaster of Paris (Asphalt Institute, 1978). 3.4.4 Compaction test Soil compaction can be a very economical method for soil improvement, and it is often used to make ground suitable for the foundations of roads and buildings. It is also used in the placing of soil fills and in the construction of earth dams to ensure suitable soil properties. The compaction is normally achieved through the input of energy into the soil by impact, kneading, vibration or static means. The extent of compaction depends on the moisture content of the soil and the effort used for the impact. In a compaction test the object is to determine the optimum moisture content and maximum dry density achievable with a given compact. A plot of dry density vs. moisture content (Figure 5) indicates that compaction becomes more efficient up to certain moisture content, after which efficiency decreases. The maximum dry density is obtained at this optimum moisture content. If the compaction process is completely efficient, it would be possible (but not necessarily desirable) to expel all air from the voids, in which case the dry density would correspond to a zero-air void state (i.e. the sample would be saturated with water). Since perfect compaction is not possible (except at

Report 4 9 Ahmadi Nasirabadi
high moisture content and low dry density), the compaction curve will always fall below the ideal or zero-air void curve (Figure 5). It should be noted that there are a number of standards for compaction tests, each differing in the amount of energy input into the compaction. For a given soil the different tests will produce different maximum dry densities and optimum moisture contents (i.e. these parameters are not soil properties). The maximum dry density and optimum moisture content are only relevant for a specified compaction procedure which should be stated when presenting the results. In earthworks it is common to specify a dry density within a certain percentage of the maximum density, determined from a specified compaction test. For this to be a sensible procedure, it is important that the effort of the compact used in the laboratory be comparable to that supplied by the field equipment (University of Sydney, 2006b). Procedure: About 2.5 kg of soil is passed through a no. 4 sieve. The soil sample should be mixed with water and placed in the standard mould provided, in three approximately equal layers. Each layer is to be compacted with 25 blows from a special compaction hammer. When the mould is full the weight of the soil should be measured and then two moisture content samples should be taken for drying in an oven. The volume of the conventional mould is approximately 944 cm3 (1/30 ft3) and should be checked by measuring the cylinder height and diameter. The remaining soil should be removed from the mould, broken down until it can again pass through a no. 4 sieve (determined visually), remixed with more water added, and then re-compacted into the mould. The compaction test should be repeated five times with the assumed moisture content used in calculations to ensure that the dry density vs. moisture content plot has points on both sides of the optimum moisture content. This assumed dry density and moisture content plot will later be replaced in the report by a plot in which calculations are based upon the average of the moisture content measured with the sample tins. Two groups performing the experiment should use different compaction hammer weights. To complete the report it is necessary to use dry density vs. moisture content data for both hammer weights (University of Sydney, 2006b). 3.4.5 Load bearing for a rig in several points The following shows calculations of stress in soil for different locations under a drill rig that has a 200 tonnes capacity. Figure 6 shows a photo of an Icelandic rig with this capacity. Figure 7 shows the arrangement of rig equipment on the platform. Calculations of stress in areas a and b (Figure 7) give:
af
=δ = 8,15
2000 = 126.5 kN/m2
Calculations of stress in areas c and d (Figure 7) give:
FIGURE 5: Moisture content of soil (University of Sidney, 2006b)

Ahmadi Nasirabadi 10 Report 4
af
=δ = 625,8
500 = 57.9 kN/m2
Calculations of stress in areas e and f (Figure 7) give:
af
=δ = 4,58
1135 = 19.4 kN/m2
FIGURE 6: Photo of the Icelandic drill rig Geysir, which has a capacity of 200 tonnes
FIGURE 7: Arrangement of rig equipment and locations of loading bearing points

Report 4 11 Ahmadi Nasirabadi
3.4.6 Calculation of allowable stress According to Eurocode 7 (ENV 1997-1:1994), the design for bearing resistance, R, (for drained conditions) can be calculated as follows:
R/A´ = c´Nc sc ic + q´Nq sq iq + 0.5γ’ B´ Nγ sγ i γ The symbols used in the equations are defined as follows:
A´= B´L´ = The effective design foundation area (m2), defined as the foundation base or, in the case of eccentric load, the reduced area of the foundation whose centroid is the point through which the load resultant acts;
B´ = The design effective foundation width (m); L´ = The design effective foundation length (m);
q = The design total overburden pressure at the level of the foundation base (kN); q’ = The design effective overburden pressure at the level of the foundation base (kN); s, i = The design values of the dimensionless factors for the shape of the foundation base,
and the inclination of the load, respectively; the subscripts c, q and γ indicate the influences due to cohesion, the surcharge and the weight of the soil; these coefficients are only valid when the shear parameters are independent of direction.
N = Bearing resistance capacity factor, with subscripts for c, q and γ; V = The vertical load (kN); γ’ = The effective design weight density of the soil below the foundation level (kN/m3); φ’ = The angle of friction for the soil.
The design values of the dimensionless factor for the bearing resistance, N are:
Nq = eπ tan φ’ tan2 (45+φ’/2); Nc = (Nq -1) cot φ’; Nγ = 2 (Nq -1) tan φ’ where δ ≥ φ’/2 (rough base).
The shape of the foundation is:
sq = 1 + (B´/L´) × sin φ’ for rectangular shapes; sq = 1 + sin φ’ for a square or circular shapes; sγ = 1 - 0.3 (B´/L´) for rectangular shapes; sγ = 0.7 for a square or a circular shape; and sc = (sq Nq – 1) / (Nq – 1) for rectangular, square or circular shapes.
The inclination of the load, caused by a horizontal load H parallel to L’ is:
iq = i γ – 1 – H/(V + A’c’ cot φ’); ic = (iq Nq – 1) / (Nq – 1);
and the inclination of the load caused by a horizontal load H parallel to B’:
iq = (1 – 0.7 H/(V + A’c’ cot φ’)3; iγ = (1 – H/(V + A’c’ cot φ’)3; ic = (iq Nq – 1) / (Nq – 1).
We can now calculate the allowable stress for the area under a drill rig which has the highest stress parameters: Length on X axis (L) = 12 m;
Length on Y axis (B) = 1.31 m;

Ahmadi Nasirabadi 12 Report 4
Difference between ground and horizontal = 0 m (the level is the same as ground); Horizontal load in X axis = 200 kN (10% of the vertical load); Horizontal load in Y axis = 200 kN (10% of the vertical load); Vertical load = 2600 kN (1.3 × 2000, where 1.3 is a load factor); Load factor for horizontal load = 1.3; Specific weight for bearing material = 18 kN/m3; Angle of shearing resistance = 40°; c = 0 A´ = 12 × 1.3= 15.6 m2; Nq = 28.99; Iq = 0.37.
This gives the following results:
Design horizontal load = 368 kN Resistance of the foundation against sliding = 1340 kN; Allowable stress = 269 kN/m2 Design stress = 167 kN/m2
Total design horizontal load should be less than the resistance of the foundation against sliding, or
368 kN < 1340 kN which is ok. The design stress should be less than allowable stress, or
167 kN/m2 < 269 kN/m2 , or 62% According to this, a soil with the parameters given above has the capacity to withstand the load from a drill rig with a capacity of 200 tonnes. 4. WASTE DISPOSAL - MUD PIT During drilling, there must be a mud pit for the collection of well cuttings. Before its construction, it is necessary to calculate the amount of solids that must be disposed of in order to calculate the size of the pit needed to accommodate all the waste. 4.1 Disposal from wells The drilling fluid is water-based slurry composed of naturally occurring clay or naturally occurring and synthetic polymers. The clay is insoluble and made up of small particles that fill the spaces surrounding the drill pipe and a sealant that fills the pore spaces surrounding the well. The polymer slurry, commonly known as environ mud, is water-soluble and serves to lubricate and seal the well. The boring process utilizes the drilling fluid pressure to run the mud motor and to cut through the earth material, to seal off fractures in the formation, to lubricate the bore pipe during installation and return cuttings to the surface site. The drilling fluid is pumped down the inside of the drill pipe and exits through the drill bit. The fluid can then return to the drill site through the space between the annular outside of the drill pipe and the walls of the well. The fluid returning to the drill site is called returns. Typically at the beginning of the drilling process, a large percentage of the drilling fluid returns to the surface. As the drilling progresses, more and more of the returns are absorbed by the earth or rock formations and are not returned to the surface. Returns may gradually decrease until a point is reached

Report 4 13 Ahmadi Nasirabadi
where a complete loss may occur, when all or at least most of the drilling fluid will be lost within the subsurface formations. Some may be lost in lateral fractures within the formation. It is important to understand that a complete loss of returns is a fairly normal occurrence during geothermal drilling. A complete and sudden loss of returns is a signal that something more significant may be occurring, therefore possible surface release has to be monitored carefully. The loss of returns or pressure and visual indications can be used to trigger response and mitigating actions. The key to controlling the loss of fluids that may reach the surface, and to limiting their release into surface waters, including the ocean, is detection and quick response by the contractor. Therefore, there must be an action plan to identify activities to be monitored and appropriate response actions to be taken to ensure that any release of drilling fluid is minimized. The plan outlines a process of monitoring the drilling fluid in order to identify a loss-of-returns situation and to determine if there is release to the surface. Specific measures to be taken to reduce the amount and likelihood of surfacing drilling fluid, and other actions to be taken, are included. Figure 8 shows a typical directional high-temperature well. The vertical depth of this well is 1865 m and the total depth (in directional status) is 2000 m. The casing programme is as follows:
Surface casing for this well is 22½" down to 100 m; Anchor casing is 18⅝" to 350 m; Production casing is 13⅜" to 1060 m; The slotted liner is 9⅝" reaching from 1004 m to the bottom of the well (total depth 2000 m).
Directional drilling started from 350 m with 25° ± 3° inclination. Therefore, the well cuttings must be calculated using a 26" bit for a 22½" casing, a 21" bit for a 18⅝" casing, a 17½" bit for a 13⅜" casing,
FIGURE 8: Typical directional high-temperature well (with courtesy of VGK Consult. Eng.)

Ahmadi Nasirabadi 14 Report 4
and a 12¼" bit for a 9⅝" casing. The results are given in Table 2.
TABLE 2: Calculations of cuttings volume
D casing (inch)
D bit (inch)
D bit (m)
Area of bit(m2)
Depth (m)
Length(m)
Theoretical volume (m3)
Loose volume (m3)
22.5 26 0.66 0.342 100 100 34.2 58.1 18.625 21 0.533 0.223 350 250 55.8 94.9 13.375 17.5 0.445 0.155 1060 710 110.1 187.2 9.625 12.25 0.311 0.076 2000 940 71.4 121.4
Sum 2000 271.5 461.6 4.2 Bentonite Mineral clay composed principally of three-layer clays such as montmorillonite is widely used as a mud additive for viscosity and filtrating control. Commercial bentonite ores vary widely in the amount and quality of the swelling clay, sodium montmorillonite. Ores of lower quality, those with more calcium-type montmorillonite, are treated during grinding by adding one or more of the following substances: sodium hydroxide, long-chain synthetic polymers, carboxymethylecellose (CMC), starch or polyphosphate. These help to make the final product meet quality specifications.
The additives may unfortunately not remain effective in "the real mud world" when in use at the rig due to hardness ions in the water, high temperature, bacterial attack, mechanical shear-degradation or other factors that can render these additives ineffective. Bentonite (Figure 9) is produced from clay and water and is used in drilling for two reasons, for decreasing friction between the drill bit and well formation, and to bring cuttings from the well to the surface. It is composed of clay minerals, predominantly montmorillonite, with minor amounts of other smectite group minerals commonly
used in drilling mud. Bentonite swells considerably when exposed to water, making it ideal for protecting formations from invasion by drilling fluids. Bentonite usage commonly depends on the type of bentonite, which can be divided into two groups (poor and rich bentonite). In bentonite usage (poor and rich group), we must multiply the theoretical volume of a well by 2. We must also add solid material to the water for poor bentonite. For example we add 8% of the theoretical volume for solid material such as mica (to decrease flow leakage). Similarly, we must add 5% by weight of solid material for rich or high yield bentonite. Finally, it is very important that the bentonite not be used in the production zone, as it may block aquifers. Bentonite usage is only recommended while drilling for the surface casing, anchor casing and production casing. To calculate the quantity of drilling mud disposed of at the surface, a reasonably accurate rule of thumb is two times the theoretical volume of the part of the well that is drilled with mud as the circulating fluid, i.e. the part of the well that is cased off. Here, the following value can be derived:
FIGURE 9: Photo showing typical bentonite mud

Report 4 15 Ahmadi Nasirabadi
M = 2600 (d2 – d1) / (2.60 – d2) = 2600 (1.05 – 1.00) / (2.60 – 1.05) = 83.87 kg/m3 of mud for drilling mud with 1.05 specific gravity (sg) and Wyoming bentonite with a true density of 2.60 sg. In most cases some of the circulating fluid is lost to the formation during drilling and in some instances a total loss will occur reducing the quantity that will be disposed of at the surface. For our schematic well, the volume is 200.1 m3, as can be seen from Table 2. Hence, the amount of drilling fluid is 200.1 × 2 = ~400 m3. Thus, the quantity of bentonite disposed of is:
400 × 83.87 = 33,548 kg of bentonite solid material; and 400 – 33.5/2.6 = 387.1 m3 of water.
4.3 Cuttings One important part of disposal is that of the cuttings that come out of the well during drilling. Cuttings come from both hard and soft formations. Drilling the formation with a forged bit increases the volume of the material coming from the well, i.e. the cuttings. Also, an increase due to washing out in the wellbore commonly is on the order of 60-80%. So when calculating the volume of disposed cuttings, we must consider this anticipated increase. In this paper, the calculation assumes 70%. Table 2 shows the calculations of the cuttings’ volume, assuming no circulation losses in a well nor absorption of the cuttings. Based on this, the size of the mud pit can be assessed. 4.4 Cement Cementing is used to fill the annulus between the casing and the wall to support the casing and to prevent fluid migration between permeable zones. At high temperatures it is necessary to stabilize the cement with sufficient silica flour to maintain relatively high strength and low permeability. Cementing a geothermal well is considered one of the most critical operations for the integrity of the well. The main consideration in designing a casing programme for geothermal wells is to have sufficient strength to resist longitudinal, tensile and compressive forces and collapse and bursting forces to which the wells may be subjected. Casing of a steam well is affected by temperature and undergoes creep or elongation due to thermal expansion unless it is cemented to the surface. Standard oilfield casing programmes were found satisfactory, particularly when the casing was cemented to the surface. In Iceland inner-string cementing is applied for cementing anchor and production casings in high-temperature wells. The casing string includes the following:
• A guide float shoe on the bottom joint of the casing with a rounded nose to prevent digging into the side of the well’s wall;
• Float collars with a special stab-in device that allows the cement to be pumped through the drill pipe, usually put in the casing string at the two joints above the casing shoe; and
• Centralizers that are attached to the casing, in order to centre the casing in the well. Usually mud is kept in the well while running the casing. After stabbing in the inner string, the well is circulated clean of mud with water using caustic soda to obtain as clean a well as possible. After washing the well clean, the well is cooled down further before cementing. After cold water has been circulated in the well, cementing commences by pumping cement slurry through the drill pipes and out
Ahmadi Nasirabadi 16 Report 4
through the shoe of the casing and up the annulus between the casing and the wall of the well until the cement reaches the surface. A high-temperature cementing mixture commonly used includes the following:
80 l water + 100 kg cement + 40 kg silica + 2 kg of expanded perlite + 2 kg of bentonite = 1.05 tonnes of cement slurry = 1 m3 cement.
The cement disposed of to the surface, during cementing, consists of the excess cement pumped to the surface to ensure sufficient strength of the slurry. In most cases, this is about 8-10 m3 per well. Also, the quantity for cleaning out the inner string can be calculated as:
(1000
1060350100 ++ ) × 9.1 = 13.7 m3
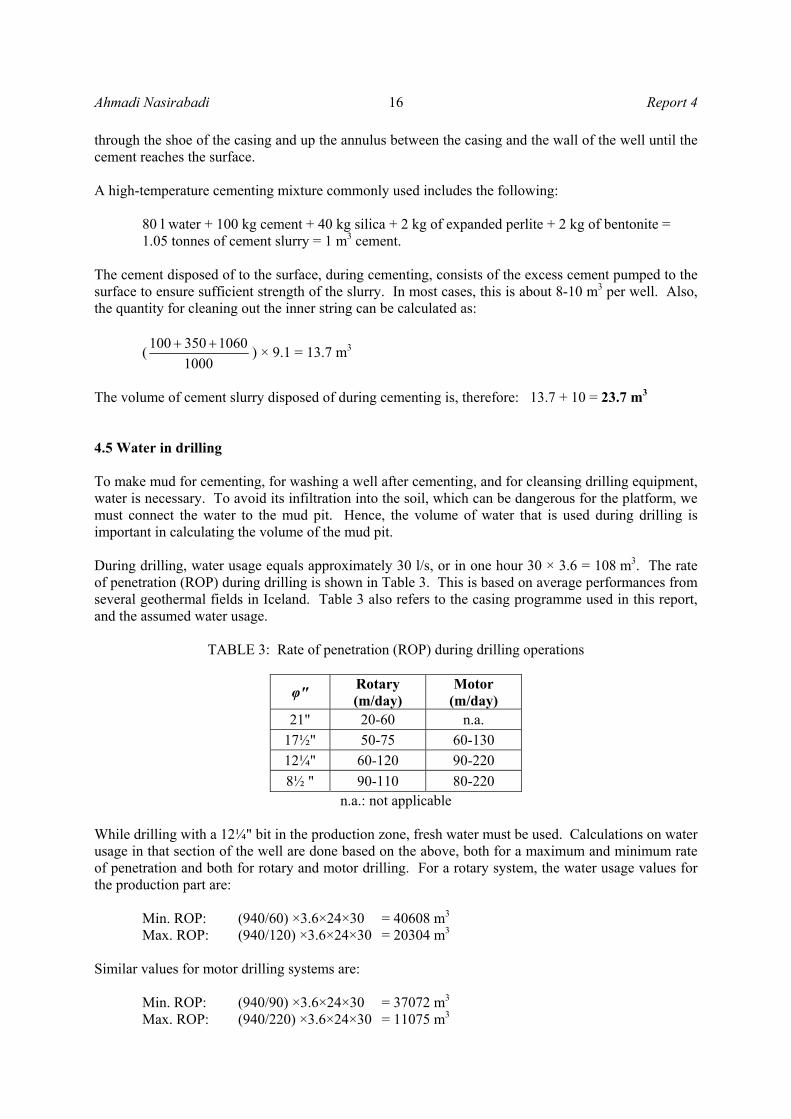
The volume of cement slurry disposed of during cementing is, therefore: 13.7 + 10 = 23.7 m3 4.5 Water in drilling To make mud for cementing, for washing a well after cementing, and for cleansing drilling equipment, water is necessary. To avoid its infiltration into the soil, which can be dangerous for the platform, we must connect the water to the mud pit. Hence, the volume of water that is used during drilling is important in calculating the volume of the mud pit. During drilling, water usage equals approximately 30 l/s, or in one hour 30 × 3.6 = 108 m3. The rate of penetration (ROP) during drilling is shown in Table 3. This is based on average performances from several geothermal fields in Iceland. Table 3 also refers to the casing programme used in this report, and the assumed water usage.
TABLE 3: Rate of penetration (ROP) during drilling operations
φ" Rotary (m/day)
Motor (m/day)
21" 20-60 n.a. 17½" 50-75 60-130 12¼" 60-120 90-220 8½ " 90-110 80-220
n.a.: not applicable While drilling with a 12¼" bit in the production zone, fresh water must be used. Calculations on water usage in that section of the well are done based on the above, both for a maximum and minimum rate of penetration and both for rotary and motor drilling. For a rotary system, the water usage values for the production part are:
Min. ROP: (940/60) ×3.6×24×30 = 40608 m3 Max. ROP: (940/120) ×3.6×24×30 = 20304 m3
Similar values for motor drilling systems are:
Min. ROP: (940/90) ×3.6×24×30 = 37072 m3 Max. ROP: (940/220) ×3.6×24×30 = 11075 m3
Report 4 17 Ahmadi Nasirabadi
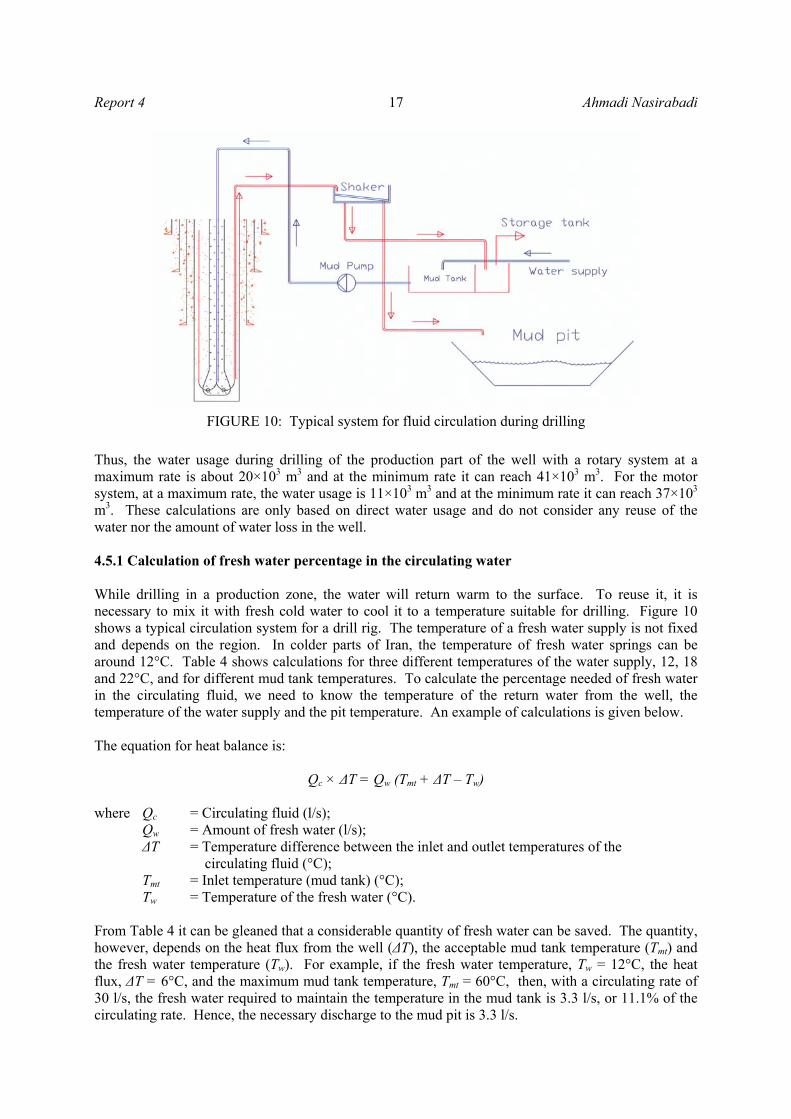
Thus, the water usage during drilling of the production part of the well with a rotary system at a maximum rate is about 20×103 m3 and at the minimum rate it can reach 41×103 m3. For the motor system, at a maximum rate, the water usage is 11×103 m3 and at the minimum rate it can reach 37×103 m3. These calculations are only based on direct water usage and do not consider any reuse of the water nor the amount of water loss in the well. 4.5.1 Calculation of fresh water percentage in the circulating water While drilling in a production zone, the water will return warm to the surface. To reuse it, it is necessary to mix it with fresh cold water to cool it to a temperature suitable for drilling. Figure 10 shows a typical circulation system for a drill rig. The temperature of a fresh water supply is not fixed and depends on the region. In colder parts of Iran, the temperature of fresh water springs can be around 12°C. Table 4 shows calculations for three different temperatures of the water supply, 12, 18 and 22°C, and for different mud tank temperatures. To calculate the percentage needed of fresh water in the circulating fluid, we need to know the temperature of the return water from the well, the temperature of the water supply and the pit temperature. An example of calculations is given below. The equation for heat balance is:
Qc × ∆T = Qw (Tmt + ∆T – Tw) where Qc = Circulating fluid (l/s);
Qw = Amount of fresh water (l/s); ∆T = Temperature difference between the inlet and outlet temperatures of the
circulating fluid (°C); Tmt = Inlet temperature (mud tank) (°C); Tw = Temperature of the fresh water (°C).
From Table 4 it can be gleaned that a considerable quantity of fresh water can be saved. The quantity, however, depends on the heat flux from the well (∆T), the acceptable mud tank temperature (Tmt) and the fresh water temperature (Tw). For example, if the fresh water temperature, Tw = 12°C, the heat flux, ∆T = 6°C, and the maximum mud tank temperature, Tmt = 60°C, then, with a circulating rate of 30 l/s, the fresh water required to maintain the temperature in the mud tank is 3.3 l/s, or 11.1% of the circulating rate. Hence, the necessary discharge to the mud pit is 3.3 l/s.
FIGURE 10: Typical system for fluid circulation during drilling
Ahmadi Nasirabadi 18 Report 4
TABLE 4: Calculation of loss percentage based on mud tank temperature
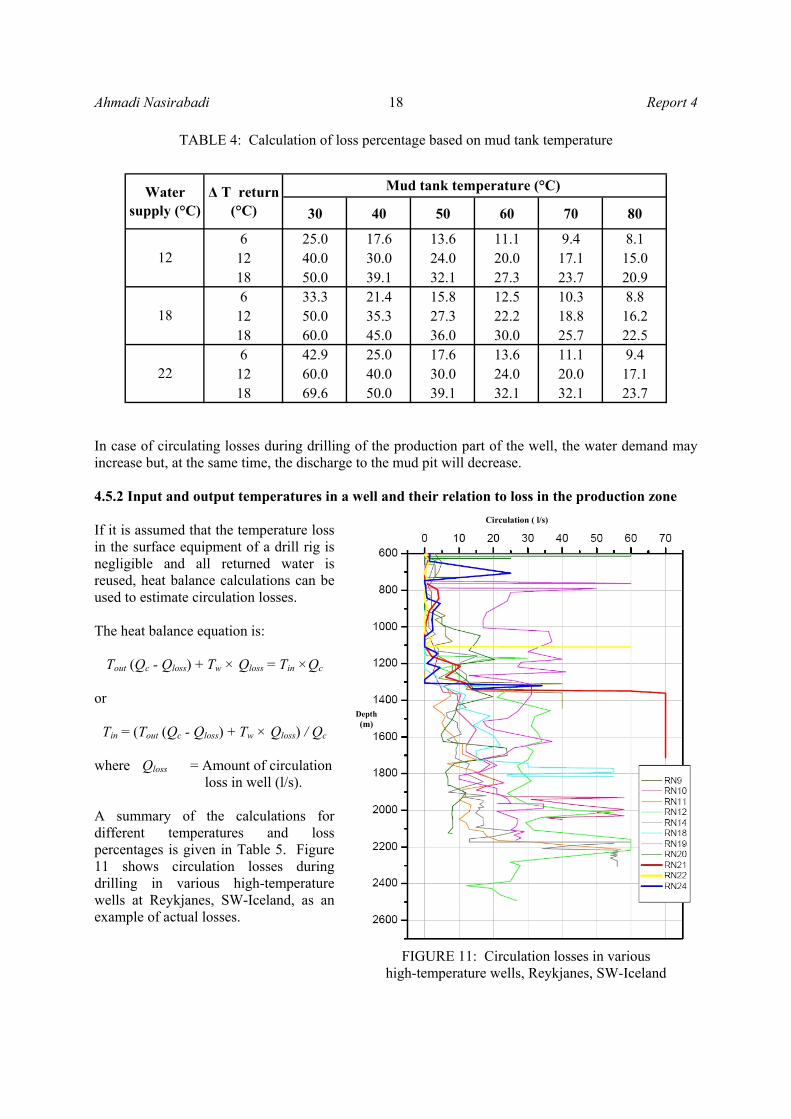
In case of circulating losses during drilling of the production part of the well, the water demand may increase but, at the same time, the discharge to the mud pit will decrease. 4.5.2 Input and output temperatures in a well and their relation to loss in the production zone If it is assumed that the temperature loss in the surface equipment of a drill rig is negligible and all returned water is reused, heat balance calculations can be used to estimate circulation losses. The heat balance equation is:
Tout (Qc - Qloss) + Tw × Qloss = Tin ×Qc or
Tin = (Tout (Qc - Qloss) + Tw × Qloss) / Qc where Qloss = Amount of circulation loss in well (l/s). A summary of the calculations for different temperatures and loss percentages is given in Table 5. Figure 11 shows circulation losses during drilling in various high-temperature wells at Reykjanes, SW-Iceland, as an example of actual losses.
Circulation ( l/s)
Depth (m)
FIGURE 11: Circulation losses in various high-temperature wells, Reykjanes, SW-Iceland
30 40 50 60 70 80
6 25.0 17.6 13.6 11.1 9.4 8.112 40.0 30.0 24.0 20.0 17.1 15.018 50.0 39.1 32.1 27.3 23.7 20.96 33.3 21.4 15.8 12.5 10.3 8.8
12 50.0 35.3 27.3 22.2 18.8 16.218 60.0 45.0 36.0 30.0 25.7 22.56 42.9 25.0 17.6 13.6 11.1 9.4
12 60.0 40.0 30.0 24.0 20.0 17.118 69.6 50.0 39.1 32.1 32.1 23.7
Mud tank temperature (°C)
12
18
22
Water supply (°C)
∆ T return (°C)

Report 4 19 Ahmadi Nasirabadi
TABLE 5: Estimated circulation losses (%) in a well calculated from input temperature of circulation water (Tinput) and its output temperature (Toutput); fresh water temperature is assumed to be 18°C
Figure 12 shows graphs that can be used for the estimation of circulation loss percentages during drilling, based on input and output temperatures in the circulation water. For example, assuming that the input fluid temperature is 30°C and the output fluid temperature is 60°C, Figure 12 shows the loss to be 72%. 5. CONCLUSIONS A study carried out for a soil platform at Hellisheidi, SW-Iceland concluded that the soil strength was enough to support a 200 tonne capacity rig. The calculated stress is 62% of the allowable stress and thus sufficient, assuming a reasonable safety coefficient. Results on soil strength in drilling platforms differ, of course, from one region to another, with changes in material. If the soil is not sufficiently strong after compaction, one solution is to distribute the load of the rig by increasing the contact area, for example by using timber or a steel plate between the rig and the platform to decrease the actual stress. Waste associated with drilling fluids consists of cuttings, bentonite, cement and water. Proper collection of this material is very important for environmental reasons. So their assessment during the operation is important. Calculations are presented for a directional high-temperature well with a casing programme including a surface casing 22½" to 100 m depth, anchor casing of 18⅝" down to 350 m depth, production casing of 13⅜" down to 1060 m and, finally, a slotted liner of 9⅝" to the bottom or total depth, 2000 m. The material that goes into the mud pit at a drill site can be divided
Toutput (°C)70 70 53.0 52.7 44.0 35.3 26.7 18.060 60 48.8 46.0 39.0 32.0 25.0 18.055 55 44.7 42.7 36.5 30.3 24.2 18.050 50 40.5 39.3 34.0 28.7 23.3 18.045 45 36.3 36.0 31.5 27.0 22.5 18.040 40 32.2 32.7 29.0 25.3 21.7 18.035 35 28.0 29.3 26.5 23.7 20.8 18.030 30 23.8 26.0 24.0 22.0 20.0 18.025 25 19.7 22.7 21.5 20.3 19.2 18.020 20 15.5 19.3 19.0 18.7 18.3 18.015 15 11.3 16.0 16.5 17.0 17.5 18.010 10 7.2 12.7 14.0 15.3 16.7 18.05 5 3.0 9.3 11.5 13.7 15.8 18.00 0 6.0 9.0 12.0 15.0 18.0
Circulation loss (%) 0 16.7 33.3 50.0 66.7 83.3 100.0
Tinput (°C)
FIGURE 12: Graphs for estimation of circulation loss percentages during drilling
0
10
20
30
40
50
60
70
80
90
100
0 10 20 30 40 50 60 70 80 90 100Possible loss percentage (%)
Inpu
t tem
pera
ture
(°C
)
T out 70 °C
T out 40 °C
T out 30 °C
T out 50 °C
T out 60 °C
T out 20 °C
Fresh water supply 18°C

Ahmadi Nasirabadi 20 Report 4
into two parts, solid material and liquid material. The liquid material (water) is the main content and reaches high values, since drilling fluid is needed throughout drilling. The reuse of water when possible is, therefore, necessary. The required volume of the pit intended for solid material is comparatively small.
ACKNOWLEDGEMENTS
I would like to express my gratitude to Dr. Ingvar B. Fridleifsson, director, and Mr. Lúdvík S. Georgsson, deputy director, of the UNU Geothermal Training Programme for giving me the opportunity to participate in this special course and for their kindness, and to Mrs. Gudrún Bjarnadóttir and Mrs. Thórhildur Ísberg for their help during the training course. I am sincerely thankful to my supervisors, Matthías Matthíasson from VGK Consulting Engineers and Sigurdur Gudjónsson from Fjarhitun Consulting Engineers for their help and advice throughout the project. Thanks to all UNU-GTP lecturers and staff members at ISOR, especially Sverrir Thórhallsson. I am thankful to SUNA (Renewable Energy Organization of Iran) for supporting me during these 6 months. I also want to thank the UNU Fellows in 2006 for their friendship and cooperation during our training. I am grateful to God for protection during my stay in Iceland and for keeping my beloved family safe. And thanks to my family for moral support during these six months. This project is dedicated to my wife Mitra Ahmadi Nasirabadi and our daughter Deniz for their support, prayers and encouragement during this training. I will be grateful forever.
REFERENCES Asphalt Institute, 1978: Soils manual for the design of asphalt pavement structures. The Asphalt Institute, Manual Series, 10, 238 pp. Bogie, I., Cartwright, A.J., Khosrawi, K., Talebi, B., and Sahabi, F., 2000: The Meshkin Shahr geothermal prospect, Iran. Proceedings of the World Geothermal Congress 2000, Kyushu-Tohoku, Japan, 997-1002. Bromley, C., Khosrawi, K., and Talebi, B., 2000: Geophysical exploration of Sabalan geothermal prospect in Iran. Proceedings of the World Geothermal Congress 2000, Kyushu-Tohoku, Japan, 1009-1014. Fotouhi, M., 1995: Geothermal development in Sabalan, Iran. Proceedings of the World Geothermal Congress 1995, Florence, Italy, 1, 191-196. Khosrawi,K., 1996: Geochemistry of geothermal springs in the Sabalan area, Azerbaijan- Iran. Report 7 in: Geothermal Training in Iceland 1996. UNU-GTP, Iceland, 135-159. Sahabi, F., Khoshlessan, M.R., and Barnett, P.R, 1999: Geothermal exploration of Mt. Sabalan, NW Iran. Geothermal Resources Council, Transactions, 23, 479-484. Sowers, G.B., and Sowers, G.F., 1999: Introductory soil mechanics and foundations. The MacMillan Company, 556 pp. University of Sydney, 2006a: Soil mechanics. University of Sydney, Civil Engineering, web page: www.civil.usyd.edu.au/courses/civl2410/classification.doc. University of Sydney, 2006b: Compaction test. University of Sydney, Civil Engineering, web page: http://www.civil.usyd.edu.au/courses/civl2410/compaction_test_handout.doc. Yousefi Sahzabi, H., 2004: Application of GIS in Environmental Impact Assessment of Sabalan geothermal field, NW-Iran. Report 19 in: Geothermal training in Iceland 2004. UNU-GTP, Iceland, 439-474.