Embed Size (px)
Citation preview
ISIJ International, Vol. 56 (2016), No. 3
© 2016 ISIJ431
ISIJ International, Vol. 56 (2016), No. 3, pp. 431–435
* Corresponding author: E-mail: [email protected]: http://dx.doi.org/10.2355/isijinternational.ISIJINT-2015-191
Hydrogen Permeation into a Carbon Steel Sheet Observed by a Micro-capillary Combined with a Devanathan-Stachurski Cell
Koji FUSHIMI,1)* Misako JIN,2) Yuichi KITAGAWA,1) Takayuki NAKANISHI1) and Yasuchika HASEGAWA1)
1) Faculty of Engineering, Hokkaido University, Kita-13 Jo, Nishi-8 Chome, Kita-ku, Sapporo 060-8628 Japan.2) Graduate School of Chemical Sciences and Engineering, Hokkaido University, Kita-13 Jo, Nishi-8 Chome, Kita-ku, Sapporo 060-8628 Japan.
(Received on March 31, 2015; accepted on June 2, 2015)
A micro-capillary technique was applied to a Devanathan-Stachurski electrochemical cell for local mea-surement of hydrogen permeation into a steel sheet. An electrolyte-flowing design for the hydrogen entry side of the Devanathan-Stachurski cell successfully allowed the detection of hydrogen permeation response on hydrogen exit side electrode in a micro-capillary cell with a diameter of 250 µm. Phase shift of the detected permeation current from a sinusoidal perturbation of the electrolyte flow rate in the hydro-gen entry cell was strongly dependent on the metallographic structure of the steel sheet. A local structure, in which two single grains form grain boundaries, led to hydrogen permeation more frequently than did a local structure of single grains. The results suggested that the diffusion coefficient of the boundaries was at least two-times larger than that of the grains.
KEY WORDS: hydrogen permeation; Devanathan-Stachurski cell; hydrogen evolution reaction; micro-capil-lary cell.
1. Introduction
Permeation of hydrogen into materials has been an impor-tant issue because it is thought to be a trigger of hydrogen embrittlement and/or stress corrosion cracking.1) In order to monitor the permeation of hydrogen into metal sheets, a so-called Devanathan-Stachurski double electrochemical cell,2,3) in which the front and back sides of the metal sheet are exposed to two cell-electrolytes and employed as hydro-gen entry and exit electrodes, respectively, has frequently been used. In a study using the Devanathan-Stachurski cell, Scully and Moran showed the influence of strain on entry into and transport of hydrogen in a high-strength steel in brine.4) Removal of the corrosion product on the surface by cathodic polarization or mechanical strain increased the hydrogen adsorption and exit. Turnbull et al. also carried out a study using Devanathan-Stachurski cell and reported the effects of H2S concentration and pH on hydrogen entry into the steel in brine.5) Addition of H2S to the entry electrolyte and acidification of the electrolyte caused an increase in hydrogen entry. Tsuru et al. evaluated hydrogen permeation into a carbon steel sheet during mechanical deformation6) and atmospheric corrosion7) using modified Devanathan-Stachurski cells. They discussed the permeation efficiency depending on dislocations in the sheet, thickness of the sheet and pH of the electrolyte solution.
In conventional measurement of hydrogen permeation using the Devanathan-Stachurski cell, galvanostatic polar-
ization of the entry side is mostly preferred, though the exit side is polarized potentiostatically under a mass-transport controlling process.1) Transient of the exit current is mathematically simulated and employed for characteriza-tion of hydrogen permeation in a metal sheet. Moreover, Makholouf and Sisson, Jr. reported that fluxes of hydrogen adsorbed on the entry surface and of hydrogen absorbed in the substrate determine the permeation rate.8) On the other hand, Tahara and Hayashi examined the permeation process of hydrogen in a sheet from hydrogen gas under an oscillat-ing pressure condition, in which the Devanathan-Stachurski cell was not used.9)
It is thought that potentiostatic polarization of the entry side might be effective for detailed investigation of the hydrogen flux at the entry surface. The charge transfer process related to hydrogen entry is sensitive to specimen conditions of the surface, material, and preparation and to measurement conditions of electrolyte pH, solvent, and tem-perature.1) Although the detected current in potentiostatic polarization of the entry side might be unstable, investiga-tion of the permeation would be beneficial to discuss the mechanism and kinetics of hydrogen entry reaction. To obtain the further information, potential-controlled measure-ment is generally combined with other physical methods. From the cathodic Tafel slope of the potentiodynamic polar-ization curve of the entry side, the rate-determining step of hydrogen evolution as well as the hydrogen adsorption step can be determined. Some authors found10) that the hydrody-namic flow in the hydrogen entry side of the Devanathan-Stachurski cell inhibited hydrogen permeation into the steel sheet. Sinusoidal perturbation of the electrolyte flow rate
ISIJ International, Vol. 56 (2016), No. 3
© 2016 ISIJ 432
induced a phase shift of the exit current from the entry current. Those authors proposed that the hydrodynamic condition in the modified Devanathan-Stachurski cell might provide new factors for evaluating hydrogen permeation into steel. One of them is a phase shift between hydrogen entry and exit currents, which is discussed in this report.
It is expected that hydrogen permeation is dependent on the metallographic structure of the sheet. If the sheet is com-posed of single crystal grains, the hydrogen adsorption flux corresponds solely to the grains. At the boundary between more than two crystal grains, the flux should be affected not only by the grains but also by the boundary. Therefore, localized hydrogen permeation in a steel sheet has attracted the attention of many researchers. On the other hand, the development of a micro-capillary cell has made it possible to investigate local electrochemistry of the material surface in contact with a solution.11) A micro-capillary cell has been widely used to investigate micro-electrochemistry in the fields of surface finishing and corrosion. Some authors have also investigated local corrosion reactivity on pure iron12) and dual-phase steel13) in sulfuric acid by using a micro-capillary cell. In this study, a micro-capillary cell technique was applied to modify the Devanathan-Stachurski cell in order to measure local hydrogen permeation into a steel sheet.
2. Experimental
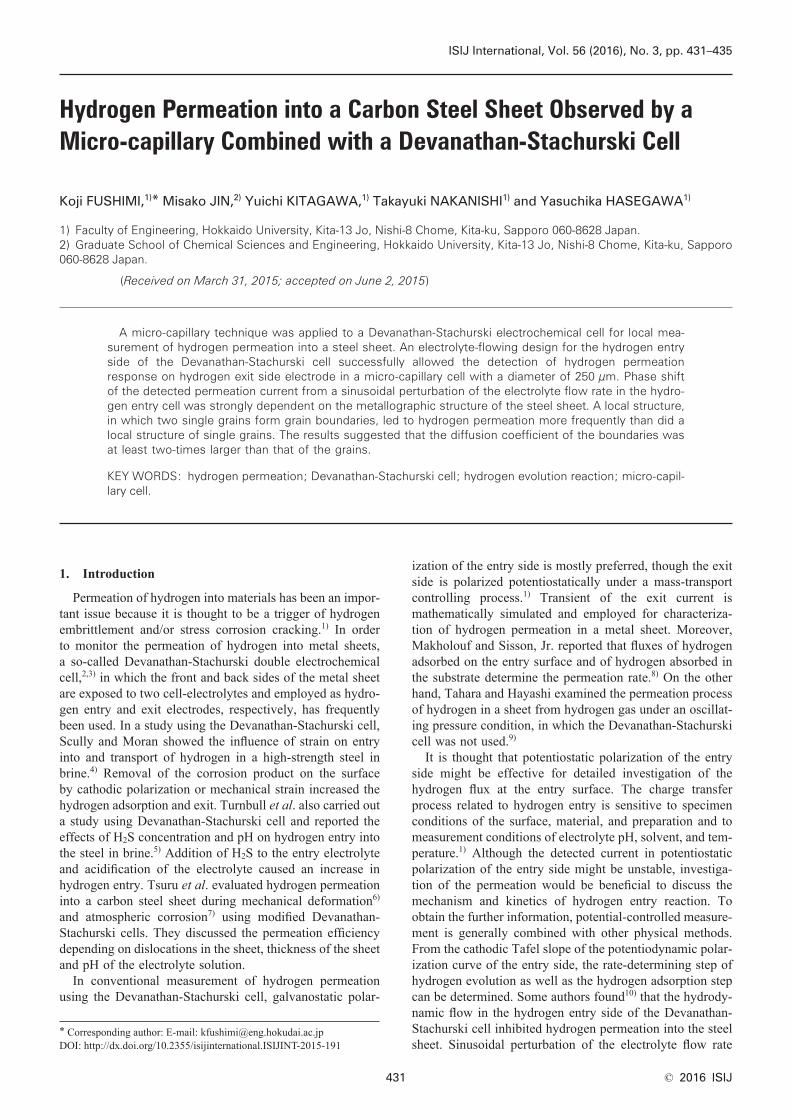
A carbon steel sheet of 0.015 wt.% C was used as a specimen. The sheet with an original thickness of 35 mm was heated at 1 523 K for 1.8 ks and cooled to 1 273 K in air. After grinding, the sheet with a thickness of 4 mm was heated again at 1 273 K for 3.6 ks and cooled, so that both sides of the sheet had a mirror texture of each other as shown in Fig. 1. Both sides of each specimen sheet were
ground and flattened to 0.10 mm by mechanical polishing finally using corroidal silica particles of 0.05 μm in size. The variation in thickness of the specimen sheet was controlled within 5%. The back side of the sheet was electroplated with a nickel layer of 0.5 μm in thickness by cathodic polariza-tion at 0.1 A cm −2 in a Watt bath (1 mol dm −3 NiSO4 + 0.2 mol dm −3 NiCl2 + 0.6 mol dm −3 H3BO3) at 323 K.
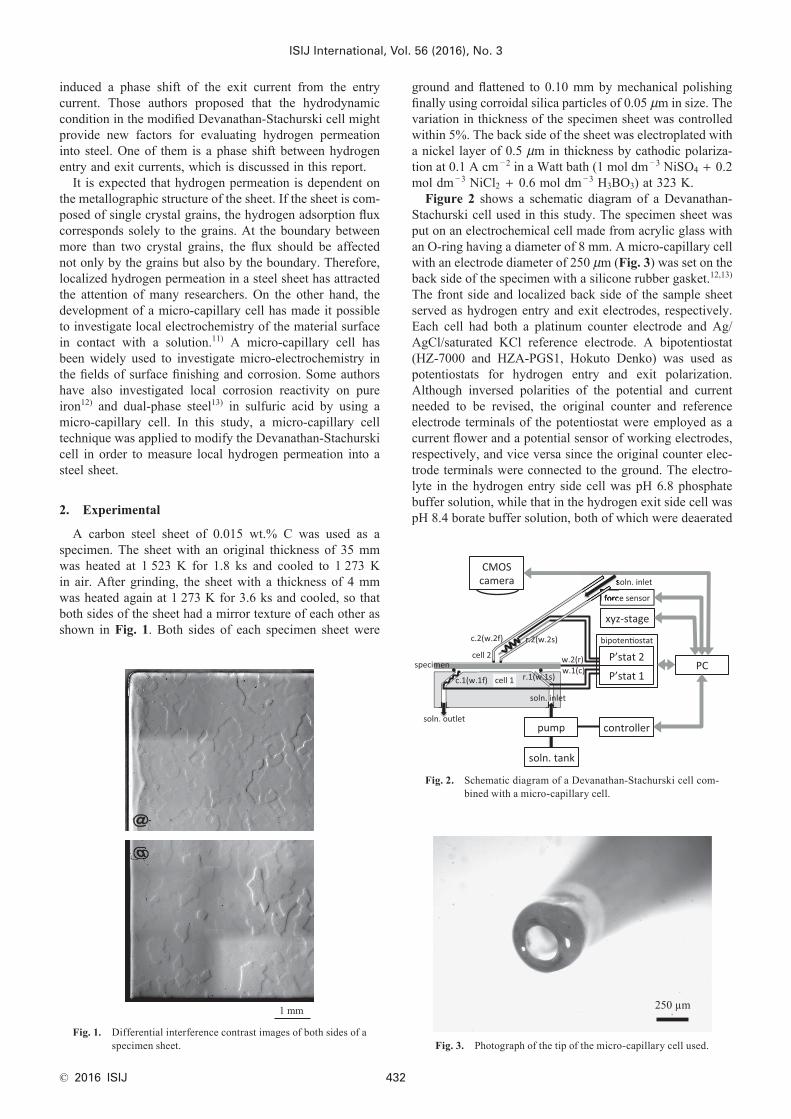
Figure 2 shows a schematic diagram of a Devanathan-Stachurski cell used in this study. The specimen sheet was put on an electrochemical cell made from acrylic glass with an O-ring having a diameter of 8 mm. A micro-capillary cell with an electrode diameter of 250 μm (Fig. 3) was set on the back side of the specimen with a silicone rubber gasket.12,13) The front side and localized back side of the sample sheet served as hydrogen entry and exit electrodes, respectively. Each cell had both a platinum counter electrode and Ag/AgCl/saturated KCl reference electrode. A bipotentiostat (HZ-7000 and HZA-PGS1, Hokuto Denko) was used as potentiostats for hydrogen entry and exit polarization. Although inversed polarities of the potential and current needed to be revised, the original counter and reference electrode terminals of the potentiostat were employed as a current flower and a potential sensor of working electrodes, respectively, and vice versa since the original counter elec-trode terminals were connected to the ground. The electro-lyte in the hydrogen entry side cell was pH 6.8 phosphate buffer solution, while that in the hydrogen exit side cell was pH 8.4 borate buffer solution, both of which were deaerated
Fig. 1. Differential interference contrast images of both sides of a specimen sheet.
Fig. 2. Schematic diagram of a Devanathan-Stachurski cell com-bined with a micro-capillary cell.
Fig. 3. Photograph of the tip of the micro-capillary cell used.
ISIJ International, Vol. 56 (2016), No. 3
© 2016 ISIJ433
by bubbling with pure Ar gas. The electrolyte in the hydro-gen entry side cell was flowed by using a bimorph pump (BPS-215i, Nitto Koki) at a sinusoidally perturbated volume flow rate between 0.145 and 1.50 cm3 s −1 and at a frequency of 0.01 Hz, while the electrolyte in the micro-capillary cell for the hydrogen exit side was stagnant. During the potentio-static polarization of the entry and exit electrodes, currents flowing through both electrodes were recorded with the electrolyte flow rate using a PC controlled by a LabVIEW (National Instruments) program. Phase shifts of hydrogen exit current wave to the entry current wave were obtained from FFT analyses.
Before the measurement, surface texture of the speci-men was observed by an optical microscope in differential interference contrast mode. After the measurement, crystal-lographic orientation of the specimen was measured by elec-tron backscatter diffraction (EBSD) patterning instrument (SC-200, TSL) in an AES apparatus (JAMP-9500F, JEOL).
3. Results and Discussion
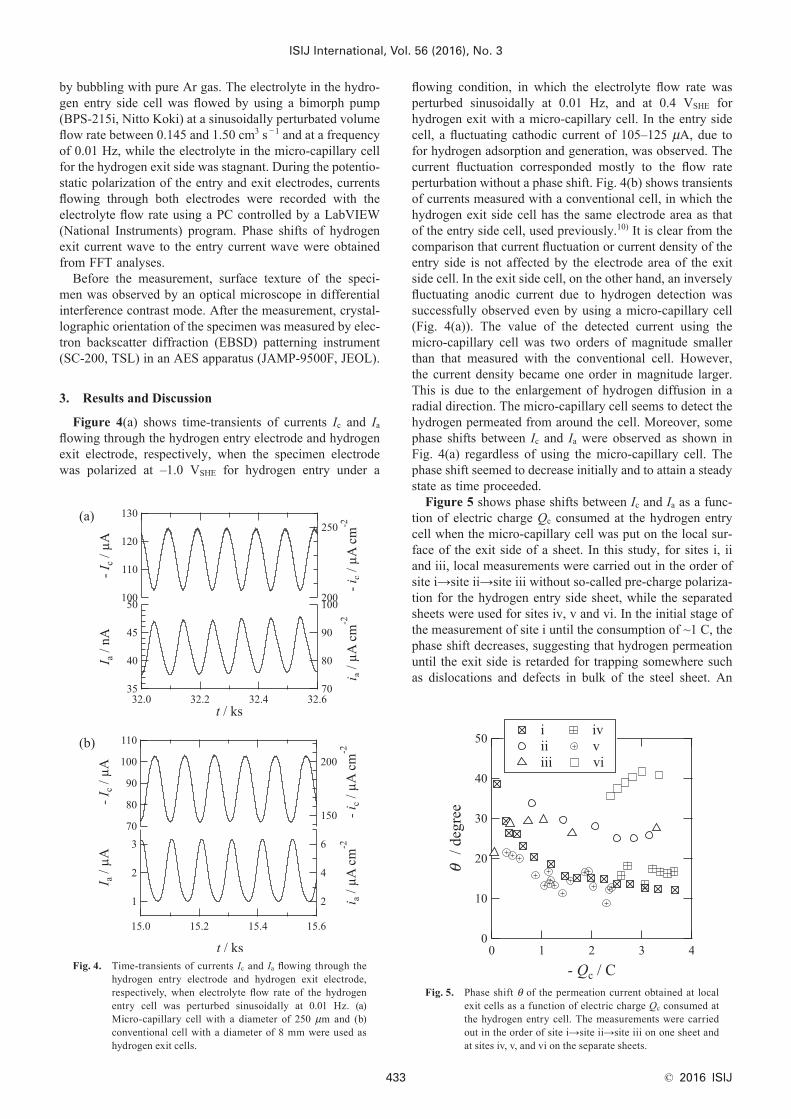
Figure 4(a) shows time-transients of currents Ic and Ia flowing through the hydrogen entry electrode and hydrogen exit electrode, respectively, when the specimen electrode was polarized at –1.0 VSHE for hydrogen entry under a
flowing condition, in which the electrolyte flow rate was perturbed sinusoidally at 0.01 Hz, and at 0.4 VSHE for hydrogen exit with a micro-capillary cell. In the entry side cell, a fluctuating cathodic current of 105–125 μA, due to for hydrogen adsorption and generation, was observed. The current fluctuation corresponded mostly to the flow rate perturbation without a phase shift. Fig. 4(b) shows transients of currents measured with a conventional cell, in which the hydrogen exit side cell has the same electrode area as that of the entry side cell, used previously.10) It is clear from the comparison that current fluctuation or current density of the entry side is not affected by the electrode area of the exit side cell. In the exit side cell, on the other hand, an inversely fluctuating anodic current due to hydrogen detection was successfully observed even by using a micro-capillary cell (Fig. 4(a)). The value of the detected current using the micro-capillary cell was two orders of magnitude smaller than that measured with the conventional cell. However, the current density became one order in magnitude larger. This is due to the enlargement of hydrogen diffusion in a radial direction. The micro-capillary cell seems to detect the hydrogen permeated from around the cell. Moreover, some phase shifts between Ic and Ia were observed as shown in Fig. 4(a) regardless of using the micro-capillary cell. The phase shift seemed to decrease initially and to attain a steady state as time proceeded.
Figure 5 shows phase shifts between Ic and Ia as a func-tion of electric charge Qc consumed at the hydrogen entry cell when the micro-capillary cell was put on the local sur-face of the exit side of a sheet. In this study, for sites i, ii and iii, local measurements were carried out in the order of site i→site ii→site iii without so-called pre-charge polariza-tion for the hydrogen entry side sheet, while the separated sheets were used for sites iv, v and vi. In the initial stage of the measurement of site i until the consumption of ~1 C, the phase shift decreases, suggesting that hydrogen permeation until the exit side is retarded for trapping somewhere such as dislocations and defects in bulk of the steel sheet. An
Fig. 4. Time-transients of currents Ic and Ia flowing through the hydrogen entry electrode and hydrogen exit electrode, respectively, when electrolyte flow rate of the hydrogen entry cell was perturbed sinusoidally at 0.01 Hz. (a) Micro-capillary cell with a diameter of 250 μm and (b) conventional cell with a diameter of 8 mm were used as hydrogen exit cells.
Fig. 5. Phase shift θ of the permeation current obtained at local exit cells as a function of electric charge Qc consumed at the hydrogen entry cell. The measurements were carried out in the order of site i→site ii→site iii on one sheet and at sites iv, v, and vi on the separate sheets.

ISIJ International, Vol. 56 (2016), No. 3
© 2016 ISIJ 434
EBSD inverse pole figure map of the specimen is shown in Fig. 6(a), and the crystallographic orientations of the surface sites, at which the hydrogen permeation was measured, in Fig. 5 are identified as follows. Sites ii and iii are located on single crystals of (3 3 4) and (1 2 2), respectively, while site i is located on two single crystals of (5 3 4) and (22 14 29). The grain boundary of site i is composed of a lat-tice misfit larger than 50° (Fig. 6(b)). Furthermore, it was observed by optical microscopy that sites iv and v were each located on two grains, while site vi was located on a single grain. The sites on a single grain or two grains allow a similar phase shift, regardless of the crystallographic ori-entation. However, the site composed of two grains shows an approximately half phase shift of that on a single grain. It is obvious that the presence of a grain boundary acceler-ates hydrogen permeation. Less anisotropy of hydrogen permeation in a single crystal of the steel indicates that the interstitial space in the lattice of the crystal is relatively large so as to show less dependency of the permeation on the orientation. However, the grain boundary serves as chan-nels to permeate a large amount of hydrogen, although the cross-sectional area of the boundary is much smaller than that of single crystal grains.
Figure 7(a) shows another case of the time-transient of
Fig. 6. (a) EBSD inverse pole figure map of a steel specimen sur-face measured in local hydrogen permeation with a micro-capillary cell on sites i, ii and iii in Fig. 5. (b) EBSD image quality map around site i with blue dots indicating lattice misfit larger than 50°. (Online version in color.)
currents during local hydrogen permeation measurement with the micro-capillary combined cell. After flowing of a hydrogen generation current Ic = ~ –105±20 μA for ~18.5 ks, the mean value and amplitude of Ic increase, indicating that the hydrogen entry reaction is suddenly activated. At the same time, the amplitude of Ia increases, while the mean value of Ia decreases. Figure 7(b) shows phase shift as a function of electric charge Qc of the entry side during whole hydrogen permeation measurement. As discussed above, phase shift is relatively large in the initial stage (–Qc ≤ 1 C), probably due to hindering of hydrogen permeation, and it becomes constant. However, the shift jumps at Qc = –2.2 C and attains a steady state. This change suggests that local measurement of hydrogen detection is very sensitive to the hydrogen entry, though the reason why the surface reaction of hydrogen entry during the local measurement is unclear.
Sekine proposed the frequency response method for determination of the diffusion coefficient during hydrogen permeation measurement.14) When the hydrogen entry and exit currents are sinusoidally changed, the phase shift is expressed by the following equation.
θ = −tan (tan tanh )1 kL kL , ..................... (1)
where k is a function of perturbation frequency f and diffu-
Fig. 7. (a) Time-transients of currents Ic and Ia flowing through the hydrogen entry electrode and hydrogen exit electrode, respectively, with a micro-capillary cell in the same man-ner as that in Fig. 4. Phase shift θ as a function of electric charge Qc consumed on the entry electrode.
ISIJ International, Vol. 56 (2016), No. 3
© 2016 ISIJ435
sion coefficient D as follows:
kf
D= π . .................................. (2)
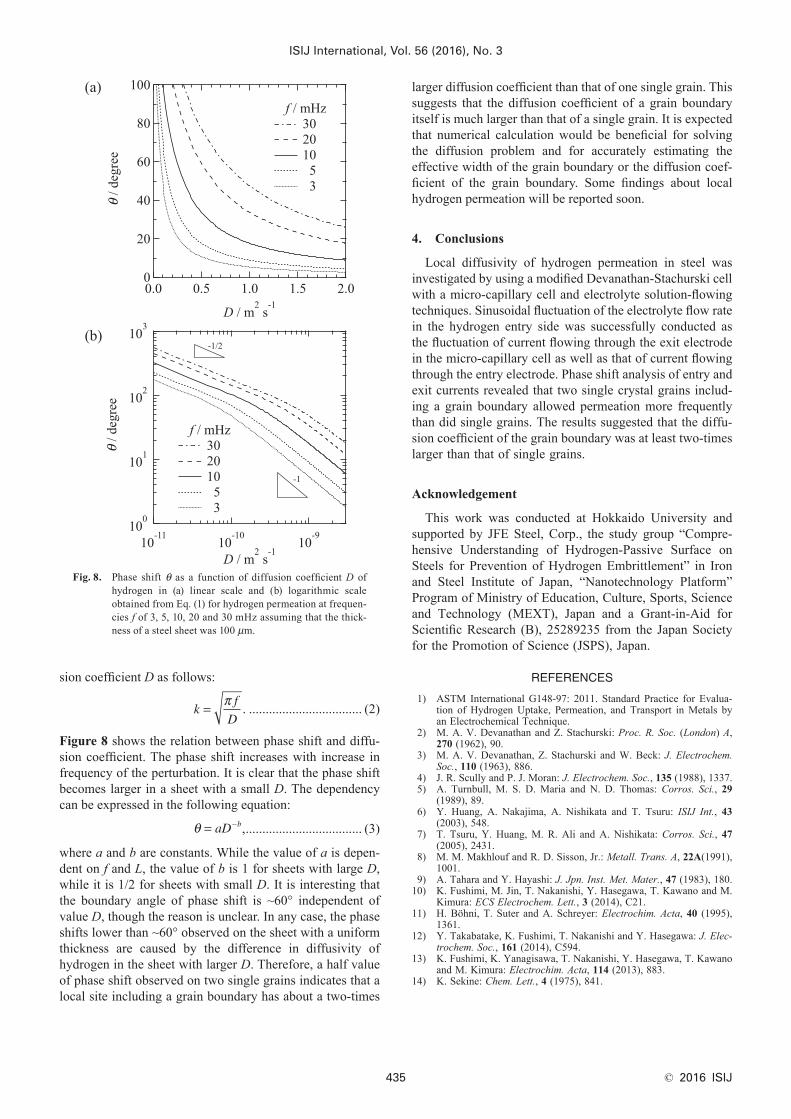
Figure 8 shows the relation between phase shift and diffu-sion coefficient. The phase shift increases with increase in frequency of the perturbation. It is clear that the phase shift becomes larger in a sheet with a small D. The dependency can be expressed in the following equation:
θ = −aD b, ................................... (3)
where a and b are constants. While the value of a is depen-dent on f and L, the value of b is 1 for sheets with large D, while it is 1/2 for sheets with small D. It is interesting that the boundary angle of phase shift is ~60° independent of value D, though the reason is unclear. In any case, the phase shifts lower than ~60° observed on the sheet with a uniform thickness are caused by the difference in diffusivity of hydrogen in the sheet with larger D. Therefore, a half value of phase shift observed on two single grains indicates that a local site including a grain boundary has about a two-times
larger diffusion coefficient than that of one single grain. This suggests that the diffusion coefficient of a grain boundary itself is much larger than that of a single grain. It is expected that numerical calculation would be beneficial for solving the diffusion problem and for accurately estimating the effective width of the grain boundary or the diffusion coef-ficient of the grain boundary. Some findings about local hydrogen permeation will be reported soon.
4. Conclusions
Local diffusivity of hydrogen permeation in steel was investigated by using a modified Devanathan-Stachurski cell with a micro-capillary cell and electrolyte solution-flowing techniques. Sinusoidal fluctuation of the electrolyte flow rate in the hydrogen entry side was successfully conducted as the fluctuation of current flowing through the exit electrode in the micro-capillary cell as well as that of current flowing through the entry electrode. Phase shift analysis of entry and exit currents revealed that two single crystal grains includ-ing a grain boundary allowed permeation more frequently than did single grains. The results suggested that the diffu-sion coefficient of the grain boundary was at least two-times larger than that of single grains.
Acknowledgement
This work was conducted at Hokkaido University and supported by JFE Steel, Corp., the study group “Compre-hensive Understanding of Hydrogen-Passive Surface on Steels for Prevention of Hydrogen Embrittlement” in Iron and Steel Institute of Japan, “Nanotechnology Platform” Program of Ministry of Education, Culture, Sports, Science and Technology (MEXT), Japan and a Grant-in-Aid for Scientific Research (B), 25289235 from the Japan Society for the Promotion of Science (JSPS), Japan.
REFERENCES
1) ASTM International G148-97: 2011. Standard Practice for Evalua-tion of Hydrogen Uptake, Permeation, and Transport in Metals by an Electrochemical Technique.
2) M. A. V. Devanathan and Z. Stachurski: Proc. R. Soc. (London) A, 270 (1962), 90.
3) M. A. V. Devanathan, Z. Stachurski and W. Beck: J. Electrochem. Soc., 110 (1963), 886.
4) J. R. Scully and P. J. Moran: J. Electrochem. Soc., 135 (1988), 1337.5) A. Turnbull, M. S. D. Maria and N. D. Thomas: Corros. Sci., 29
(1989), 89.6) Y. Huang, A. Nakajima, A. Nishikata and T. Tsuru: ISIJ Int., 43
(2003), 548.7) T. Tsuru, Y. Huang, M. R. Ali and A. Nishikata: Corros. Sci., 47
(2005), 2431.8) M. M. Makhlouf and R. D. Sisson, Jr.: Metall. Trans. A, 22A(1991),
1001.9) A. Tahara and Y. Hayashi: J. Jpn. Inst. Met. Mater., 47 (1983), 180.
10) K. Fushimi, M. Jin, T. Nakanishi, Y. Hasegawa, T. Kawano and M. Kimura: ECS Electrochem. Lett., 3 (2014), C21.
11) H. Böhni, T. Suter and A. Schreyer: Electrochim. Acta, 40 (1995), 1361.
12) Y. Takabatake, K. Fushimi, T. Nakanishi and Y. Hasegawa: J. Elec-trochem. Soc., 161 (2014), C594.
13) K. Fushimi, K. Yanagisawa, T. Nakanishi, Y. Hasegawa, T. Kawano and M. Kimura: Electrochim. Acta, 114 (2013), 883.
14) K. Sekine: Chem. Lett., 4 (1975), 841.
Fig. 8. Phase shift θ as a function of diffusion coefficient D of hydrogen in (a) linear scale and (b) logarithmic scale obtained from Eq. (1) for hydrogen permeation at frequen-cies f of 3, 5, 10, 20 and 30 mHz assuming that the thick-ness of a steel sheet was 100 μm.


![Structural and Diffusional Effects of Hydrogen in TiNi embrittlement is observed, similar to other titanium-based alloys [1]. The main hydrogen effects observed in TiNi include reduced](https://img.dokumen.tips/doc/110x75/5b1ebab77f8b9a7f2f8bd69b/structural-and-diffusional-effects-of-hydrogen-in-embrittlement-is-observed-similar.jpg)