Embed Size (px)
Citation preview

World Energy Council 2013 World Energy Resources: Hydro 5.1
5 Hydro Contents
STRATEGIC INSIGHT / page 2
1. Introduction / page 2
2. Technical and economic considerations / page 3
3. Market trends and outlook / page 6
GLOBAL TABLES / page 8
COUNTRY NOTES / page 13

5.2 World Energy Resources: Hydro World Energy Council 2013
Strategic insight
1. Introduction and Global Status
Hydropower provides a significant amount of energy throughout the world. There has been
deployment in more than 100 countries, contributing approximately 15% of the global elec-
tricity production.
The top 5 largest markets for hydropower in terms of capacity are China, Brazil, the United
States, Russia, and Canada, with China far exceeding the others at 249GW. Added to these,
India, Norway, Japan, France and Turkey complete the top 10 countries in terms of capacity.
In addition, in several countries, hydropower accounts for over 50% of all electricity genera-
tion including: Iceland, Brazil, Canada, Nepal and Mozambique.
During 2012, an estimated 27-30GW of new hydropower and 2-3GW of pumped storage
hydropower was commissioned during the year. In many cases, this development was
accompanied by renewable energy support policies and current and planned regional car-
bon markets.
Global growth in installed capacity of hydropower has been concentrated in the emerging
markets in Asia and South America, where increased access to electricity is and improved
reliability are major requirements to support rapid economic development. This trend is
most visible in China where over 15GW was deployed in 2012. China expects this growth to
continue through 2015 to 284 GW to meet the requirements of the 12th 5- year plan. It is also
expected that China will see pumped storage capacity grow to 41GW during this period.
If China reaches the goals in its 5 year plan reports indicate it will be exploiting 71% of its
available hydroelectric power.
In recent years, the increasing demand for the security of supply of both water and energy
continues to drive hydropower development on a regional basis. Hydropower operators
are seeing increased trans-boundary collaboration in the development and operation of
hydropower projects, and in regional interconnections to enable the cross-border sale of the
resulting electricity. In many cases, this cooperation brings benefits in terms of improved
energy access in one or more country, economic opportunities, and improved water ser-
vices.
In addition, the tremendous advances in wind and solar power deployment in many coun-
tries have changed the energy mix substantially, and this trend is clearly set to continue. This
development is having a profound impact on how existing hydropower stations are operated
and modernized, and how new hydropower stations are designed.
Policy
Hydropower development is in many cases supported by renewable energy policies. This
support can be either direct – where hydropower qualifies for a feed-in-tariff or is an eligible

5.3 World Energy Council 2013 World Energy Resources: Hydro
technology under a renewable portfolio standard; or indirect – where hydropower develop-
ment is spurred by the increased penetration of other renewables that are eligible for this
kind of policy/financial support.
Carbon markets also continue to influence hydropower deployment, particularly in develop-
ing countries. The UN FCC Clean Development Mechanism (CDM)and the EU Emissions
Trading Scheme (ETS) are the most prominent players in this area. The CDM is an imple-
menting mechanism of the Kyoto Protocol, where projects can be registered to receive and
sell Certified Emissions Reductions certifications. As of 5 March 2013, of the 8,013 renew-
ables projects active in the CDM pipeline, 2,899 are hydropower projects with a potential
combined installed capacity of 138GW.
CDM projects have historically been concentrated in China and India, with those two coun-
tries accounting for 80% of CDM credits issued to date. However, new host countries in 2012
were Albania, Cambodia, Georgia, Kenya, Lao PDR, Macedonia, and Nicaragua. In 2012-13
the UN also opened two collaboration centres in Africa to encourage further update of CDM
projects on the continent.
The EU ETS is the world’s largest carbon market, established by the EU to help meet its
Kyoto Protocol targets. The EU ETS purchases the vast majority of CERs issued under the
CDM. However, other countries currently working towards establishment of a carbon mar-
ket are California, Australia, Canada and Japan. The World Bank is also providing support
to exploration of carbon markets in Brazil, Mexico, Colombia, Thailand, Vietnam, and South
Africa.
Other policies relevant to hydropower at a domestic level include water policies, energy reg-
ulatory policies, and environmental and social regulation.
2. Technical and economic considerations
Technology
Hydropower – harnessing the energy of moving water for power - has been in use since
ancient times. However, the turbine technology as well as developments in design and con-
struction techniques have advanced significantly and continue to do so today.
There are four broad hydropower typologies:
Run-of-river hydropower – provides regular base-load supply, with some flexibility of
operation for daily fluctuations in demand through water flow that is regulated by the
facility)
Storage hydropower – provides base- and peak-load supply, with enough storage ca-
pacity to operate independently of the hydrological inflow for periods of weeks/months,
and the ability for generation to be shut down and started up at short notice)
Pumped-storage hydropower – provides peak-load supply, utilizing water which is
cycled between lower and upper reservoirs by pumps which utilize surplus energy from
the system at times of low demand, normally on a daily/weekly basis).
Offshore hydropower – a suite of technologies using basic hydropower technology in a
marine environment. This includes wave and tidal technologies.
However, the boundaries between these types of hydropower are not concrete; for exam-
ple, storage projects may incorporate a component of pumping to supplement the water

5.4 World Energy Resources: Hydro World Energy Council 2013
that flows into the upper reservoir naturally. Run-of-river projects may benefit from greater
flow regulation (generation flexibility) from a storage project located upstream. Run-of-river
projects may also incorporate a few hours up to a few days of storage capability. There is no
standard that completely differentiates each typology from the others, but in general these
typologies represent the hydropower sector.
Outside of ocean hydropower, with regard to turbine types, there are two main categories:
reaction and impulse. Impulse turbines utilize the pressure of the water column falling on the
turbine through a concentrated jet. For maximum efficiency, the direction of the water striking
the turbine is turned through 180°, and then falls to a tail-water channel which is open to the
atmosphere. Reaction machines utilize both the pressure of the water entering the turbine
and the suction of the water exiting the turbine through a draft-tube passageway, while flow-
ing towards the downstream water body.
Examples of impulse turbines are Pelton type units; these tend to be used at sites when the
available head at the site is very high and the discharge is small. Reaction turbines tend to
be used when the ratio between head and discharge moves towards lower available head
with higher flows. Moving from higher to lower head, examples are Francis, Kaplan and Bulb
type turbines.
All the above turbine types are at advanced echelons of technical design. Consequently,
extraordinary levels of efficiency can now be expected. Modern hydropower turbines can
achieve efficiencies of 95% across their operating range (design limits of head/discharge)
– something unparalleled in any other turbine technology. Efficiency gains and the trend for
higher capacity equipment to provide peaking generation, continue to drive the market for
the modernization of power stations throughout the world. The upgrading and replacement
of turbine equipment at existing stations currently represents about 15% of the investment in
the hydropower sector. This proportion is likely to remain constant, but will grow in absolute
terms as the world’s fleet of hydropower stations continues to increase (currently estimated
to be about 15,000 in total).
Nonetheless, hydropower technology is regularly refined to optimize performance and
minimize local impacts. Recent advances in hydropower technology include ongoing improve-
ment and increased deployment of tidal hydropower; technological refinements to turbine
operations to enable rapid ramp up and ramp down to accommodate increased penetration
of renewables into electricity systems (i.e., more variable sources of energy in an electricity
system require a technology such as storage or pumped storage hydropower to balance that
variability); improved pumping technology for pumped storage hydropower; and fish-friendly
infrastructure. For example, ongoing developments with variable speed pumps in pumped
storage stations will help enable penetration of more variable renewable energy sources. In
addition, technological advances have the potential to improve the environmental performance
of hydropower. For example, the US Electric Power Research Institute (EPRI) is currently
undertaking research both in the area of development of fish-friendly hydropower turbines that
cause minimal injury to passing fish and in the collection of more general information on fish
behavior at passages and ladders, and the effectiveness of such measures.
With regard to scale, all the above turbine types can be utilized at sites from the very small-
est through the largest capacities. A Francis type turbine, for example, can be used at sites
to generate less than 0.1MW through to 800MW. The basic turbine would look exactly the
same; the only difference would be the dimensions.
As a growing number of low-head sites are being exploited, the number of Bulb type turbine
applications is increasing. For example, on the Madeira River in Brazil, two power plants are
5.5 World Energy Council 2013 World Energy Resources: Hydro
under construction: the Santo Antônio and Jirau projects. Each will utilize 44 Bulb turbines
– an unprecedented number of turbines in single power stations. The projects will add more
than 6000MW capacity to the Brazilian electricity system, enough to power two cities the size
of São Paulo.
Sustainability
Water use for energy, hydropower in particular, is important throughout the world. The spe-
cific characteristics of hydropower are fundamental for the balancing of supply and demand
in electric power systems. In particular, the supportive role of hydropower in backing up the
growing contribution from wind and solar is essential for security of supply. Hydropower’s
ability to store both water and energy is also increasingly valued. Despite the long history of
hydropower development, record levels of deployment have occurred in the last five years.
Notwithstanding this, sustainable development in the context of hydropower has been the
subject of debate. Today, a broad consensus on basic good practice exists, which has been
developed through multi-stakeholder processes, and tools are available for the measurement
of sustainability in the hydropower sector. The following describes some of the hydropow-
er-specific sustainability aspects.
The potential impacts of hydropower projects are well documented1, for example:
Hydrological regimes;
Land-use change;
Water quality;
Sediment transport;
Biological diversity;
Resettlement; Downstream water users;
Public health;
Cultural heritage.
The gravity of the particular negative impacts varies from project to project, as does
the scope for their avoidance or mitigation. Also, the opportunity to maximize positive
impacts (beyond the renewable electricity generated) varies from site to site.
Tools, such as the IFC Performance standards, World Bank Safeguards, and the Equator
Principles, have all contributed to increased awareness of the need to balance technical
and economic benefits with protecting environmental and social outcomes. The Hydro-
power Sustainability Assessment Protocol, a hydropower-specific tool, provides a means
of measuring a project’s performance throughout project’s life-cycle, across all aspects
of sustainability. This tool is the result of a multi-stakeholder process with the objective
of guiding sustainability in the hydropower sector, and is currently being implemented
worldwide (www.hydrosustainability.org).
Increasingly, hydropower developers and owners are using tools such as the Protocol
to guide project decision-making, implementation and operation. As a growing hydro-
power practice, the sustainability benefits are considerable: besides environmental and
social issues being treated with parity to other considerations, such tools ensure that
international practices are applied locally irrespective of variations in national regula-
1. IPCC SRREN, Chapter 5Kumar, A., T. Schei, A. Ahenkorah, R. Caceres Rodriguez, J.-M. Devernay, M. Freitas, D.
Hall, A. Killingtveit,Z. Liu, 2011: Hydropower. In IPCC Special Report on Renewable Energy Sources and Climate
Change Mitigation [O. Edenhofer, R. Pichs-Madruga, Y. Sokona, K. Seyboth, P. Matschoss, S. Kadner, T. Zwickel,
P. Eickemeier, G. Hansen, S. Schlomer, C. von Stechow (eds)], Cambridge University Press, Cambridge, United
Kingdom and New York, NY, USA, at 463, citing IEA, 2000a,b,c,d,e.

5.6 World Energy Resources: Hydro World Energy Council 2013
tions, and provide common frameworks around which project stakeholders can engage
in dialogue around specific projects and their impacts.
Some examples of how specific impacts are being addressed include:
An increased awareness of the need to identify projects with a strategic fit in a
national or regional context, and the use of offsets to compensate for a biodiversity
impact. This ranges from identification of no-go project areas to the protection of
other areas to compensate for project impacts.
In depth interaction with project affected communities, including Indigenous peo-
ple, is moving from impact mitigation and compensation to benefit sharing and
livelihood improvement through long term collaborative initiatives. This includes
increased recognition of risks and identification of opportunities to avoid or mitigate
negative aspects, and to optimize positive impacts through committed engagement
with the affected community. Where resettlement is unavoidable, community-led
decision-making on plans made in partnership with the developer is increasingly
being used to address this most challenging of impacts.
Greater understanding of environmental flows and the impacts of changes to these flows
has moved consideration from revenue generation and flood control driven practises to
the adoption of environmental flow policies that recognise the limitations of pre-deter-
mined minimum flows and focus on maintaining flows to support a broader spectrums of
riverine species, processes and services, adapted to suit individual contexts.
Upstream land use is increasingly being recognized for its impacts on sedimenta-
tion issues, and land-use management practices included in reservoir management
plans.
Technological developments contributing to sustainability considerations include refined
fish ladders and other effective upstream transportation options, ‘fish friendly’ turbines
lowering downstream passage fish mortality, incorporation of generating capacity into
existing storage facilities where previously there was none, and design changes to
minimize or avoid lubricating oil discharges from turbine equipment. Perhaps most im-
portant, is the orientation of equipment and operations at hydropower stations, to back
up the variable generation from other renewables such as wind and solar. This evolution
in the role of hydropower will facilitate an even greater contribution from all renewable
energy sources in the future.
3. Market trends and outlook
Markets
Hydropower development has traditionally been led by public sector developers supported
at least partly by public finances, either from national governments or multilateral develop-
ment banks. However, in recent years, hydropower investment is becoming increasingly
global with investors exploring new regions, and a shift toward more private sector involve-
ment in hydropower development. Examples include South Korea’s investment in Nepal,
Pakistan, and the Philippines, as well as China and India driving investments in Africa.
Private sector investment often enables projects to be built in a shorter timeframe, and also
can enable infrastructure development in areas where local entities are unable to provide
the high level of investments needed to build a hydropower facility. However, private sector
investors will typically require a more solid return on investment and much stronger assur-
ance of future sales through strong power purchase agreements with the local customer.
This also shifts the responsibility for ensuring environmental and social impacts are properly
mitigated and managed to the local planning agencies and regulators, who in many cases
need external support for capacity building in these areas.

5.7 World Energy Council 2013 World Energy Resources: Hydro
With regard to power pools, regional markets for electricity often support the business case
for hydropower development, particularly in locations with hydropower resources and/or
potential that exceed their domestic electricity demand. For example, Ethiopia has tremen-
dous hydropower potential, but does not have sufficient domestic demand to justify its full
development. Neighbouring countries Kenya and Sudan, on the other hand, do not have
domestic hydropower potential and can benefit from the electricity provided by hydropower
development in Ethiopia. Countries may opt to pool their investment resources to jointly
develop hydropower projects such as, for example, the Governments of Burundi, Rwanda,
and Tanzania under the umbrella of the Nile Basin Initiative/Nile Equatorial Lakes Subsidiary
Action Program. These countries, along with the World Bank, are developing a 90-megawatt
hydropower plant at a cost of 400 billion Burundian francs (USD 312 million).
In addition, regional electricity interconnections (and market structures) promote stability
in the electricity system while reducing the need for costly system redundancy. Regional
power pools support this trade in electricity across countries. Examples of regional power
pools that are supported by hydropower assets include the Central American Electrical Inter-
connection System (SIEPAC), the Eastern African Power Pool (EAPP), the Southern African
Power Pool (SAPP), and the European system, and several regional Canadian-US trading
markets.
Traditionally, hydropower has been designed to provide steady base-load supply, with plant
factors exceeding 80%. Projects with storage reservoirs can also release water in a con-
trolled way so as to follow the demand in the electricity grid. With the increasing penetration
of more variable renewable energy services, hydropower is called on to play a supportive
role: starting up at short notice when there is a deficit in the power system, and shutting
down when there is a surplus, rather than providing base load power. In such situations, the
stations may need to be available to operate most of the time, but only utilizing energy when
the demand calls for it; hence the station might be available for 90% of the time but only be
needed to operate for 20% of time. This shift in the way hydropower is operated is benefited
by a shift in the market dynamics and structure. Increasingly, electricity markets are incen-
tivizing this type of flexible generation by rewarding it with much higher prices when energy
is most needed, and giving a price signal to deter generation when there is a surplus in the
system. However, many countries have yet to change their market structures to accommo-
date shifting generation patterns.

5.8 World Energy Resources: Hydro World Energy Council 2013
Global tables
Table 1
Hydropower capability
Gross theoretical capability Technically exploitable
capability
Economically exploitable
capability
Country GWh/year GWh/year GWh/year
Angola 150000
Argentina U 169000
Australia 150000
Austria 150000 75000 56100
Bhutan 263000
Bolivia 126000
Brazil 3040000 1250000 817600
Bulgaria 26540 15056 NA
Cameroon 115000
Canada 757579.60 U U
Chile 162
China 5920000
Colombia 1000
Congo (DRC) 1400
Costa Rica 223500
Croatia 20000 12000 10500
Czech Republic 13100 3978 NA
Ecuador 167000 106000
Estonia 2000 400 250
Ethiopia 650000
Finland 30865 22645 16026
France 100 70
Guinea 26000
Iceland 184000
India 2638000
Indonesia 2150
Iran 179000 50000
Italy 200000 65000 47500
Japan U 136520 U
Kazakhstan 170000 62000 29000

5.9 World Energy Council 2013 World Energy Resources: Hydro
Latvia U U U
Lithuania 2200
Madagascar 321 180
Malaysia 123 16
Myanmar (Burma) 140
Nepal 140160
Norway 22.10
Pakistan 475
Paraguay 111 68
Peru 260
Poland 23000 12000 5000
Portugal U U U
Romania 70000 36000 21000
Russian Federation 2295
Serbia 27200 19447 17733
Spain 162
Sudan 19
Sweden 65000 35000 20000
Tajikistan 2635
Turkey 432000 216000 170000
United Kingdom 4.10
United States of America 2040.00
Uruguay 32 10
Venezuela 731
Vietnam 300
Table 2
Hydropower installed capacity and production in 2011
Installed capacity Actual generation in 2011 Capacity under construction
Country MW GWh MW
Afghanistan 400 Albania 1 432 3 881 Algeria 278 Angola 790 80
Argentina 10 025 31 847 60
Australia 7 800 12 000 80
Austria 13 200 37 701 1 000
Azerbaijan 1 020 2 646 Bangladesh 230 1 485 Belarus 13 Bhutan 1 488 7 134 Bolivia 440 2 300 800
Bosnia-Herzegovina 2 380 7 946 Brazil 82 459 428 571 21 100
Bulgaria 2 018 2 366

5.10 World Energy Resources: Hydro World Energy Council 2013
Cameroon 729 3 850 Canada 75 104 348 110 3 720
Central African Republic 19 Chile 5 946 20 799 342 000
China 249 000 714 000 3 833
Colombia 9 185 45 583 Congo (DRC) 2 410 7 771 Congo (Republic of) 89 Costa Rica 1 510 150
Cote d’Ivoire 606 Croatia 2 141 4 620 Cuba 7 Cyprus 1 Czech Republic 1 055 2 134 Denmark 9 Ecuador 804 9 544 Egypt 2 942 13 540 El Salvador 472 Equatorial Guinea 1 Estonia 8 30 1
Ethiopia 663 Finland 3 084 12 278 France 25 332 50 300 Gabon 170 Georgia 2 635 Germany 4 740 18 188 Ghana 1 180 5 600 400
Greece 3 243 3 793 Guinea 75 220 80
Hungary 51 Iceland 1 900 12 600 India 38 106 131 000 15 627
Indonesia 3 881 12 419 Iran 8 746 11 820 5 083
Iraq 2 273 700 Ireland 529 28 Israel 7 Italy 18 092 45 823 Jamaica 24 Japan 22 362 72 639 291
Jordan 12 Kazakhstan 2 267 7 849 300
Korea (DRC) 4 780 Korea (Republic) 1 605 4 676 Kyrgyzstan 2 910 10 227 Laos 700 5 361
Latvia 1 550 2 810 Lebanon 280 Lesotho 76 Lithuania 101 3
Macedonia 528 29
Madagascar 124 700 Malawi 300

5.11 World Energy Council 2013 World Energy Resources: Hydro
Malaysia 1 910 7 334 3 344
Mali 155 Mauritania 30 Mexico 11 499 35 796 750
Moldova 64 Mongolia 28 Montenegro 658 Morocco 1 265 Mozambique 107 Myanmar (Burma) 1 541 3 900 1 500
Nepal 600 Netherlands 37 56 New Zealand 5 250 24 828 Nicaragua 105 Norway 1 521 6 800 1 021
Pakistan 6 481 27 700 1 600
Paraguay 8 130 53 524 Peru 3 242 21 384 Philippines 3 291 9 346 Poland 940 2 331 Portugal 5 352 12 114 1 447
Puerto Rico 85 149 Romania 6 144 14 954 Russian Federation 49 700 180 000 3 000
Rwanda 55 Senegal 60 Serbia 2 891 9 165 Sierra Leone 4 Slovakia 2 523 4 105 Slovenia 1 253 3 523 Somalia 5 South Africa 661 2 117 Spain 18 540 25 000 450
Sri Lanka 1 300 5 578 Sudan 575 3 804 Suriname 189 Swaziland 61 69 Sweden 16 197 66 000 Switzerland 13 723 32 069 1 995
Syria 1 505 Taiwan 1 938 Tajikistan 5 500 11 200 Tanzania 561 2 548 Thailand 3 481 8 085 Togo 66 Tunisia 70 Turkey 17 259 57 472 8 270
Turkmenistan 1 Uganda 340 250
Ukraine 4 514 13 020 United Kingdom 1 630 5 700 United States of America 77 500 319 355 Uruguay 1 538 6 479

5.12 World Energy Resources: Hydro World Energy Council 2013
Uzbekistan 1 710 10 087 Venezuela 14 627 86 700
Vietnam 5 500 24 000 Zambia 1 730 11 160 Zimbabwe 754 4 089 World Total 934 733 3 229 607 -

5.13 World Energy Council 2013 World Energy Resources: Hydro
Country notes
The Country Notes on Hydropower have been compiled using the information submitted
by WEC Member Committees in 2012 and various national and international reference
publications and other sources, including the International Hydropower Association, The
International Journal on Hydropower & Dams, published by Aqua~Media and other sources.
Note: U stands for an unknown value.
Angola
Gross theoretical capability (TWh/yr) 150
Capacity in operation (MW) 790
Actual generation (GWh) U
Capacity under construction (MW)
Angola’s estimated hydropower potential is 150 TWh/yr, one of the highest in Africa. How-
ever, so far only a small fraction of the country’s hydro potential has been harnessed.
Feasibility Studies are in progress on major hydro schemes at Lauca and Caculo-Cabaca on
the Kwanza river, each with an installed capacity of 2 000 MW, and on a bi-national project at
Baynes Mountain on the Cunene (see country note on Namibia).
Argentina
Gross theoretical capability (TWh/yr) U
Capacity in operation (MW) 10 025
Actual generation (GWh) 31 847
Capacity under construction (MW) 60
Hydroelectricity is an important component of Argentina’s power profile. Though hydroelec-
tric output fluctuates and has declined in recent years, it accounts for between one-quarter
and one-third of Argentina’s total electricity generation. Argentina’s most significant hydroe-
lectric capacity is located in Neuquén, followed by border provinces that share hydroelectric
output with surrounding countries.
Argentina and Paraguay divide power from the large Yacyreta plant, which sits astride the
Paraná River (Corrientes province) with a total installed capacity of 3.1 GW. Likewise, the
Salto Grande hydroelectric plant on the Uruguay River (along Entre Ríos province) has a
capacity of 1.89 GW, from which output is split evenly between Argentina and Uruguay. In
2011, total hydroelectric generation was 39,339 GWh, according to CAMMESA.
The WEC Argentine Member Committee reports that there is an ongoing updating and
improvement of cost-estimation procedures, the review of existing projects using consistent
criteria, and the evaluation of the resource up to the level of technical and economic pre-fea-
sibility.

5.14 World Energy Resources: Hydro World Energy Council 2013
The Committee also reports that Argentina possesses 75 small, mini and micro hydro plants
(of up to 30 MW capacity), with an aggregate capacity of 377 MW and an annual generation
equivalent to 1.6% of national electricity demand.
Australia
Gross theoretical capability (TWh/yr) 150
Capacity in operation (MW) 7 800
Actual generation (GWh) 12 000
Capacity under construction (MW) 80
Australia is the driest inhabited continent on earth, with over 80 per cent of its landmass
receiving an annual average rainfall of less than 600 mm per year and 50 per cent less than
300 mm per year. There is also high variability in rainfall, evaporation rates and tempera-
tures between years, resulting in Australia having very limited and variable surface water
resources. Much of Australia’s economically feasible hydro energy resource has already
been harnessed.
Australia has more than 100 operating hydroelectric power stations with total installed
capacity of about 7800 megawatts (MW). These are located in the areas of highest rainfall
and elevation and are mostly in New South Wales (55%) and Tasmania (29%). The Snowy
Mountains Hydro-electric Scheme, with a capacity of 3800MW, is Australia’s largest hydro
scheme and is one of the most complex integrated water and hydroelectricity schemes in the
world.
The Scheme collects and stores the water that would normally flow east to the coast and
diverts it through trans-mountain tunnels and power stations. The water is then released into
the Murray and Murrumbidgee Rivers for irrigation. The Snowy Mountains Scheme comprises
sixteen major dams, seven power stations (two of which are underground), a pumping sta-
tion, 145km of inter-connected trans-mountain tunnels and 80km of aqueducts. The Snowy
Mountains Hydro-electric Scheme accounts for around half of Australia’s total hydroelectricity
generation capacity and provides base load and peak load power to the eastern mainland
grid of Australia.
Hydro energy is particularly important in Tasmania where it provides much of the state’s
electricity. The Tasmanian integrated hydropower scheme harnesses hydro energy from
six major water catchments and involves 50 major dams, numerous lakes and 29 power
stations with a total capacity of over 2600MW. The scheme provides base and peak load
power to the National Electricity Market, firstly to Tasmania and then to the Australian net-
work through Basslink, the undersea interconnector which runs under Bass Strait. There are
also hydroelectricity schemes in north-east Victoria, Queensland, Western Australia, and a
mini-hydroelectricity project in South Australia.
Austria
Gross theoretical capability (TWh/yr) 150
Capacity in operation (MW) 13 200
Actual generation (GWh) 37 701
Capacity under construction (MW) 1 000

5.15 World Energy Council 2013 World Energy Resources: Hydro
Out of a total gross theoretical hydro potential of 150 TWh/yr, Austria’s technically feasible
potential is estimated at about 75 TWh/yr, of which 75% is considered to be economically
exploitable. At present, the total installed capacity of hydro-electric power stations (exclud-
ing pumped-storage plants) is 13 200 MW; with net generation of approximately 37 TWh.
Most of Austria’s HPPs are of the run-of-river type.
The construction of a number of (mostly fairly small) pure hydro plants and the refurbishment/
extension of some existing stations is under way or planned, but the construction of large
hydro installations in Austria is currently confined to a number of pumped-storage schemes.
Kops II (450 MW) was completed in 2009, while work is continuing at Limburg II, which will
add 480 MW to the capacity of the Kaprun pumped-storage plant in 2012, and at Reisseck
II (430 MW), part of the Reisseck-Kreuzeck hydro complex, scheduled to be completed in
2014.
Bhutan
Gross theoretical capability (TWh/yr) 263
Capacity in operation (MW) 1 488
Actual generation (GWh) 7 134
Capacity under construction (MW) 1 209
Bhutan possesses a huge hydropower resource, its gross theoretical potential being
assessed at over 263 TWh/yr, with a technically feasible capability of more than 99 TWh/yr
(corresponding to a potential generating capacity of around 23 500 MW). Current installed
hydro capacity is 1 488 MW, having recently been augmented by the commissioning of the 1
020 MW Tala HPP, Bhutan’s first bi-national project, developed in conjunction with India.
Two more hydro plants are under construction - Punatsangchhu I (1 095 MW, for completion
by 2015) and Dagachhu (114 MW). A further 2 400 MW of capacity is at the planning stage,
notably Punatsangchhu II (circa 1 000 MW) and Mangdechhu (circa 720 MW).
The Governments of Bhutan and India are jointly planning to construct a total of ten HPPs,
with an anticipated aggregate installed capacity of 11 576 MW, for development by 2020.
The programme includes a number of massive projects, the largest being the Sunkosh Res-
ervoir (4 000 MW), Kuri Gongri (1 800 MW) and Wangchhu Reservoir (900 MW) schemes.
The principal function of the bi-national plants will be to boost Bhutan’s exports of electricity
to India.
Bolivia
Gross theoretical capability (TWh/yr) 126
Capacity in operation (MW) 440
Actual generation (GWh) 2 300
Capacity under construction (MW) 800
Bolivia has a considerable hydro potential, its technically feasible potential being assessed
at 126 TWh/yr, of which 50 TWh/yr is considered to be economically exploitable. Only a small
proportion of the total potential has been harnessed so far. The country’s hydro capacity,
according to OLADE, was 440 MW, with an output of about 2.3 TWh.

5.16 World Energy Resources: Hydro World Energy Council 2013
Hydropower & Dams World Atlas 2009 reports that 88 MW of additional hydro capacity was
under construction in early 2009. A wide range (2 338-3 064 MW) is quoted for planned
hydro capacity, some of which relates to projects forming part of the Rio Madeira scheme
outlined below.
Bolivia is working with Brazil on a huge joint project to exploit the hydro-electric potential of
the Rio Madeira complex in the Amazon region. Within this project are the 800 MW Cachuela
Esperanza plant sited entirely in Bolivia and the Guajara-Mirim plant (3 000 MW) to be
located on the border between the two countries.
Brazil
Gross theoretical capability(TWh/yr) 3 040
Capacity in operation (MW) 82 459
Actual generation (GWh) 428 571
Capacity under construction (MW) 21 100
Hydroelectric power is one of Brazil’s principal energy assets: the country has by far the larg-
est hydropower resources on the continent. The Brazilian WEC Member Committee reports
that the gross theoretical capability is estimated to be 3 040 TWh/yr, with an economically
exploitable capability of about 818 TWh/yr, of which over 45% has so far been harnessed..
According to the Member Committee, Brazil had 82 458 MW of operational hydropower capac-
ity at the end of 2011, generating in that year 428 571 GWh of electricity. The country had 21
100 MW of additional hydro capacity under construction at the end of 2011, with an estimated
annual generation of around 41 TWh. Further hydro capacity reported to be planned for future
development totalled 68 000 MW, with a projected annual output of some 327 TWh.
Furthermore, small-scale hydro (since 1998, defined in Brazil as plants with a capacity of
<30 MW) has an economically exploitable capability of 11 200 GWh/yr. ThJe aggregate
installed capacity of small HPPs was 1 237 MW at end-2008, and they produced a total of
6 280 GWh in 2008, equivalent to just over 56% of the assessed economic potential. A total
of 513 MW of small-hydro capacity is planned for future installation which, if all the plans are
implemented, will add some 2.5 TWh to Brazil’s electricity supply.
Cameroon
Gross theoretical capability (TWh/yr) U
Capacity in operation (MW) 729
Actual generation (GWh) 3 850
Capacity under construction (MW) 0
The technically exploitable hydro capability (115 TWh) is the fourth largest in Africa but the
current level of utilisation of this potential is, like that in other hydro-rich countries in the conti-
nent, very low. Within a total hydro capacity of 729 MW, Cameroon’s major stations are Song
Loulou (installed capacity 396 MW) and Edéa (264 MW), for both of which contracts have
been awarded for refurbishment. Annual hydro-electric output is about 3 850 GWh, implying
a capacity factor of around 0.60.The Cameroon WEC Member Committee reported that a
number of projects is being negotiated but no further details are available.

5.17 World Energy Council 2013 World Energy Resources: Hydro
Canada
Gross theoretical capability(TWh/yr) 758
Capacity in operation (MW) 75 104
Actual generation (GWh) 348 110
Capacity under construction (MW) 3 720
Canada possesses enormous hydropower potential – the Canadian Hydropower Association
assessed Canada’s ‘total unexploited technical hydro potential’ in 2011 as 163 GW, of which
over half was in Québec, Alberta and British Columbia. At the end of 2011, total installed
hydroelectric capacity was 75 104 MW.
Approximately 475 hydroelectric generating plants across the country produce an average
of 350 terawatt-hours per year — one terawatt-hour represents enough electricity to heat and
power 40,000 houses. In 2011 the actual total generation for the year was 348 TWh.
With many rivers across the country, Canada has hydropower in all regions. The top-pro-
ducing provinces are Quebec, British Columbia, Manitoba, Ontario, and Newfoundland and
Labrador, with more than 95 percent of the total hydropower generation in Canada.
Canada still has immense undeveloped potential — over twice the current capacity — and
all provinces and territories have some hydropower potential.
There are a number of significant hydroelectric projects under construction. In total, these
projects will increase hydro generation capacity by more than 2 350 MW, with a probable
annual generation of 11.15 TWh. According to Natural Resources Canada, hydro capacity
reported to be in the course of planning adds up to a massive 14 500 MW, potentially sup-
plying more than 68 TWh/yr.
The total installed capacity of small hydro plants (of <10 MW) totalled 1 001 MW, with an
estimated annual generation of 4 650 GWh. Small-scale HPPs are located throughout the
country, notably in British Columbia, Ontario, Québec, Nova Scotia, Newfoundland and
Labrador. A total of 188 MW of additional small hydro capacity is reported as planned, with a
projected generation of 873 GWh/yr.
Chile
Gross theoretical capability (TWh/yr) 162
Capacity in operation (MW) 5 946
Actual generation (GWh) 24 300
Capacity under construction (MW) 0
There is a substantial hydropower potential, with a technically exploitable capability esti-
mated at about 162 TWh/yr, of which about 15% has so far been harnessed. Hydro output in
2011 was 24.3 TWh, equivalent to just over 40% of Chile’s total net electricity generation.
More than 5 800 MW of new HPPs is at the planning stage, including major projects at Alto
Maipo (531 MW), Angostura (309 MW), Neltume and Choshuenco (580 MW) and Rio Cuervo
(440-600 MW), together with five plants (total capacity of approximately 2 750 MW) on the
Baker and Pascua rivers in the southern region of Aysen.

5.18 World Energy Resources: Hydro World Energy Council 2013
China
Gross theoretical capability(TWh/yr) 5 920
Capacity in operation (MW) 231 000
Actual generation (GWh) 714 000
Capacity under construction (MW) 111 000
With its vast mountain ranges and numerous rivers, China’s hydropower potential is the
largest in the world. China is the world’s largest producer of hydroelectric power and is
aggressively building dams. Hydropower accounts for about 16 percent of China’s electricity
and 7 percent of its total energy consumption. It is planned to increase hydro-generating
capacity by nearly two-thirds over the next five years.
While China is racing ahead to install more wind- and solar-power capacity, the energy gen-
erated by these technologies is considered too costly and insufficient to satisfy the country’s
huge power needs. The drought in 2011 reduced the output of hydroelectric power, contrib-
uting to a government decision to raise the cost of electricity for industrial use in 15 areas.
In 2010, China generated 714 TWh of electricity from hydroelectric sources. Installed hydro-
electric generating capacity was 231 GW in 2011, according to FACTS Global Energy,
accounting for over a fifth of total installed capacity. The China Electricity Council has plans
to increase hydro capacity to 342 GW by 2015. The world’s largest hydro power project, the
Three Gorges Dam along the Yangtze River, was completed in July 2012 and includes 32
generators with a total capacity of 22.7 GW. The dam’s annual average power generation is
anticipated to be 84.7 TWh.
JBesides the Three Gorges project, there are many other massive plants in hand. Examples
of such projects inclJJude Xiluodu (12 600 MW), Xiangjiaba (6 000 MW), Longtan (6 300
MW), Jinping II (4 800 MW), Xiaowan (4 200 MW), Laxiwa (4 200 MW), Jinping I (3 600 MW),
Pubugou (3 600 MW), Dagangshan (3 600 MW) and Goupitan (3 000 MW).
Colombia
Gross theoretical capability (TWh/yr) 1 000
Capacity in operation (MW) 9 185
Actual generation (GWh) 45 583
Capacity under construction (MW) 3 833
Colombia’s theoretical potential for hydropower is considerable, up to 1 000 TWh/yr, of which
20% is classed as technically feasible. Hydro output represents around 30% of the eco-
nomically exploitable capability of 140 TWh/yr and accounted for about three-quarters of
Colombia’s electricity generation.
According to the Colombian Member Committee of WEC, there was 9 185 MW of hydro-
power in operation in 2011, generating a total of 45 583 GWh of electricity in that year.

5.19 World Energy Council 2013 World Energy Resources: Hydro
Congo (Democratic Republic)
Gross theoretical capability (TWh/yr) 1 400
Capacity in operation (MW) 2 410
Actual generation (GWh) U
Capacity under construction (MW) 0
The assessed potential for hydropower is by far the highest in Africa, and one of the highest
in the world. The gross theoretical potential of the Congo River is almost 1 400 TWh/yr and
the technically feasible exploitable capacity is put at 100 000 MW. The current level of hydro-
electric output is equivalent to only around 3% of the republic’s economically exploitable
capability. Hydro provides virtually the whole of its electricity.
The national public electricity utility SNEL has 17 hydro plants, of which 11 plants have an
installed capacity of over 10 MW. The total rated capacity of SNEL’s hydropower plants is 2
410 MW; with the largest stations being Inga 1 (351 MW) and Inga 2 (1 424 MW). The power
plants of these stations are either being (or planned to be) refurbished, in order to boost their
faltering performance by an additional 660 MW. Moreover, a significant increase in capac-
ity would be provided by the Inga 3 project (4 320 MW), which is currently in the planning
phase.
There is also a huge scheme (Grand Inga, 40 000 MW or more), incorporating the supply of
electricity to other parts of Africa via new long-distance high-voltage transmission lines. Both
the power generating plant and transmission network have been the subject of preliminary
investigations and pre-feasibility studies.
These studies identified three major African interconnection HVDC projects:
Northern Highway (Inga to Egypt);
Southern Highway (Inga to South Africa);
Western Highway (Inga to Nigeria).
These electricity Highways would supply the five African power pools: SAPP, WAPP, PEAC,
EAPP and COMELEC.
Costa Rica
Gross theoretical capability (TWh/yr) 223.5
Capacity in operation (MW) 1 510
Actual generation (GWh) U
Capacity under construction (MW) 150
Costa Rica has a large hydroelectric potential. Its gross theoretical potential is estimated at
223.5 TWh/yr, within which a hydropower capacity of 5 694 MW has been assessed as eco-
nomically feasible (after exclusion of areas within national parks).According to the Instituto
Costarricense de Electricidad, aggregate installed hydro capacity was 1 510 MW at end-
2008, equivalent to about 64% of Costa Rica’s total generating capacity, and about 27% of
its estimated economic potential.

5.20 World Energy Resources: Hydro World Energy Council 2013
Several new hydro plants are under construction or planned: nearing completion are Pirris
(128 MW) and Toro 3 (50 MW), both due to enter service in 2011, together with three BOT
schemes, each with 50 MW capacity and scheduled for operation in 2013: Torito on the
Reventazon river, at the end of the tail-race of the Angostura HPP, and Capulin-San Pablo
and Chucas on the Tarcoles. Two larger projects reported to be at the feasibility stage in
2009 were Diquís (622 MW), planned for completion in 2016, and Reventazón (298 MW),
planned for 2014.
Czech Republic
Gross theoretical capability (TWh/yr) 13.1
Capacity in operation (MW) 1055
Actual generation (GWh) 2 134
Capacity under construction (MW) 0
The overall potential for all sizes of hydropower is quite modest (technically exploitable
capability: 3 978 GWh/yr, as reported by the Czech WEC Member Committee). Total hydro-
electricity output in 2011 was 2 134 GWh, representing 51% of this potential. Hydropower
furnishes less than 3% of the republic’s electricity generation.
A relatively high proportion (nearly 40%) of the technically exploitable capability is classified
as suitable for small-scale schemes; installed capacity in this category at the end of 2011
was 297 MW, equivalent to about 28% of the Czech Republic’s total hydro capacity. Actual
generation from small-scale schemes in 2011 was 1 159 GWh.
The State Energy Concept provides support for the construction of further small-scale
HPPs, in particular through favourable feed-in tariffs, which guarantee a positive return on
investment. Investment subsidies serve as another effective stimulus. The number of sites
available for the construction of small hydro plants is reported to be small. Licensing proce-
dures are fairly complex and often somewhat protracted.
The only planned extensions to the Czech Republic’s hydro generating capacity comprise
two small plants presently under construction; a 5 MW plant at Litomerice on the Elbe (Ener-
go-Pro Co.) and a 0.5 MW plant at Melnik (CEZ, plc). Over half of the existing small HPPs
use obsolete technology (dating from 1920-1950). There are plans to modernise the technol-
ogy, with the aim of improving efficiency by up to 15%.
Ecuador
Gross theoretical capability (TWh/yr) 167
Capacity in operation (MW) 804
Actual generation (GWh) U
Capacity under construction (MW) U
The gross theoretical hydro potential is substantial, at about 167 TWh/yr, within which there is
estimated to be an economically feasible capability of nearly 106 TWh/yr. Preliminary work at
the site of the largest of the plants is under way, Coca Codo Sinclair (1 500 MW), have been
completed; commercial operation is scheduled to commence in 2015.

5.21 World Energy Council 2013 World Energy Resources: Hydro
Most of Ecuador’s hydro capacity is located in Azuay province, in the south-central high-
lands. Paute-Molino is the country’s single-largest hydroelectric complex, and alone claims
almost 1.1 GW of capacity. Droughts in late 2009 affected flows in Paute River and caused
the government to implement rolling blackouts from November 2009 to January 2010. To
address capacity shortages, Ecuador plans to build six new hydroelectric power plants in
the coming decade. Financing for all of the new projects have come from China.
Ethiopia
Gross theoretical capability (TWh/yr) 650
Capacity in operation (MW) 663
Actual generation (GWh) U
Capacity under construction (MW) 2 150
There are enormous resources for hydro generation, the gross theoretical potential (650
TWh/yr) being second only to that of Congo (Democratic Republic) in Africa. The Ethiopian
WEC Member Committee reports that only a small share of the assessed potential has been
developed. Currently, hydropower provides more than 95% of Ethiopia’s electricity.
Further capacity increases, at various stages of planning, total more than 7 500 MW. A con-
tract was signed with China in July 2009 for constructing the Gibe IV and Halele Werabesa
schemes, which will add 2 150 MW to Ethiopia’s hydro capacity.
Finland
Gross theoretical capability (TWh/yr) 174
Capacity in operation (MW) 3 084
Actual generation (GWh) 12 278
Capacity under construction (MW) U
Hydropower accounts for about 4% or Finland’s total energy consumption. Hydropower’s
share of electricity production in Finland has varied in recent years within the range 10-15%,
depending on precipitation levels and other hydrological conditions. Hydropower is Fin-
land’s second most widely exploited renewable energy source, after bioenergy. These plants
have a total capacity of approximately 3,084 MW. Their total annual production has varied
between 9.5 and 16.8 TWh, according to water conditions, in 2011 production totalled almost
12.3 TWh.
It could still be possible to increase Finland’s hydropower capacity, though the main potential
sources are generally well exploited. The total unexploited hydropower potential along river
systems that are not protected for landscape or nature conservation is estimated at more
than an annual production potential of 2 468 GWh. Of this potential 1 330 GWh/year is con-
sidered as economically exploitable. It is unlikely that hydropower developments could be
launched along any remaining totally unharnessed rivers, for conservation reasons.

5.22 World Energy Resources: Hydro World Energy Council 2013
France
Gross theoretical capability (TWh/yr) 100
Capacity in operation (MW) 25 332
Actual generation (GWh) 50 300
Capacity under construction (MW) U
France is one of Western Europe’s major producers of hydroelectricity, but its technically
feasible capacity has now been very largely exploited. The total hydroelectric generating
capacity (excluding pumping) stands at
25 332 MW. The year’s net production of 50.3 TWh compares with an estimated technically
exploitable capability of 100 TWh/yr, of which 70% is considered to be economically exploit-
able.
The total output capacity of small-scale (less than 10 MW) plants is approximately 1 850 MW,
which generated almost 7 TWh.
The PPI (long-term plan for investments in electricity generation) for the period 2009-2020
envisages targets for an increase of 3 TWh/yr in electricity output and of 3 000 MW in
installed capacity through the installation of new small units and the enlargement of existing
facilities.
Ghana
Gross theoretical capability (TWh/yr) U
Capacity in operation (MW) 1 180
Actual generation (GWh) 5 600
Capacity under construction (MW) 400
There are 17 potential hydro sites, of which only Akosombo (upgraded in 2005 from 912 to 1
038 MW) and Kpong (160 MW) have so far been developed; their total net capacity, accord-
ing to the Volta River Authority (VRA) website, is 1 180 MW. Electricity generation in Ghana is
a responsibility of the VRA, which was established in 1961. The average annual output of its
two existing hydro stations (circa 5 600 GWh) is equivalent to about half of Ghana’s techni-
cally exploitable hydro capability.
Construction of the 400 MW Bui dam on the Black Volta is underway by China’s Sino Hydro
Corporation, and scheduled for completion in 2012.
Guinea
Gross theoretical capability (TWh/yr) 26
Capacity in operation (MW) 75
Actual generation (GWh) U
Capacity under construction (MW) 80
Guinea is well-endowed with water resources, having 1 165 watercourses draining into 23
hydrographic basins, of which 16 are shared with neighbouring countries. The WEC Member
5.23 World Energy Council 2013 World Energy Resources: Hydro
Committee reported that the gross theoretical hydro capability had been assessed as 26
TWh/yr, the technically exploitable capability as 19.3 TWh/yr and the economically exploita-
ble capability as 19 TWh/yr.
The capacity potential corresponding to the technically exploitable capability of 19.3 TWh/
yr is 6 100 MW, located mainly in the regions of Basse Guinée (46%) and Moyenne Guinée
(43%), with minor amounts in Haute Guinée (8%) and Guinée Forestière (3%). Some 40% of
the national hydro potential lies in the basin of the River Konkouré.
Additional hydro output which might feasibly become available in the longer term was put
at over 5 100 GWh/yr. Taken together with the planned development of hydro capacity, this
would imply an eventual total output of some 9.5 TWh/yr, equivalent to more than half the
currently assessed economically exploitable capability.
Guinea intends to use its hydroelectric potentials to replace the supply of electricity by
thermal power stations which is considerably more expensive. The country still faces some
problems in this area. In the capital Malabo, power supply is assured 60% by one thermal
power station and 40% by private generating sets. Unfortunately the supply of these private
generating sets is small. To overcome these differences, the hydroelectric power station at
Musala near Luba was built where its network covers an area of 1460km. In the same light,
a hydroelectric power station with a capacity of 3.6 megavolts was built on the Rio Riaba.
On the mainland, the thermal power station of Bata on Rio Muni has been equipped with two
sets with a unit capacity of 700kw.
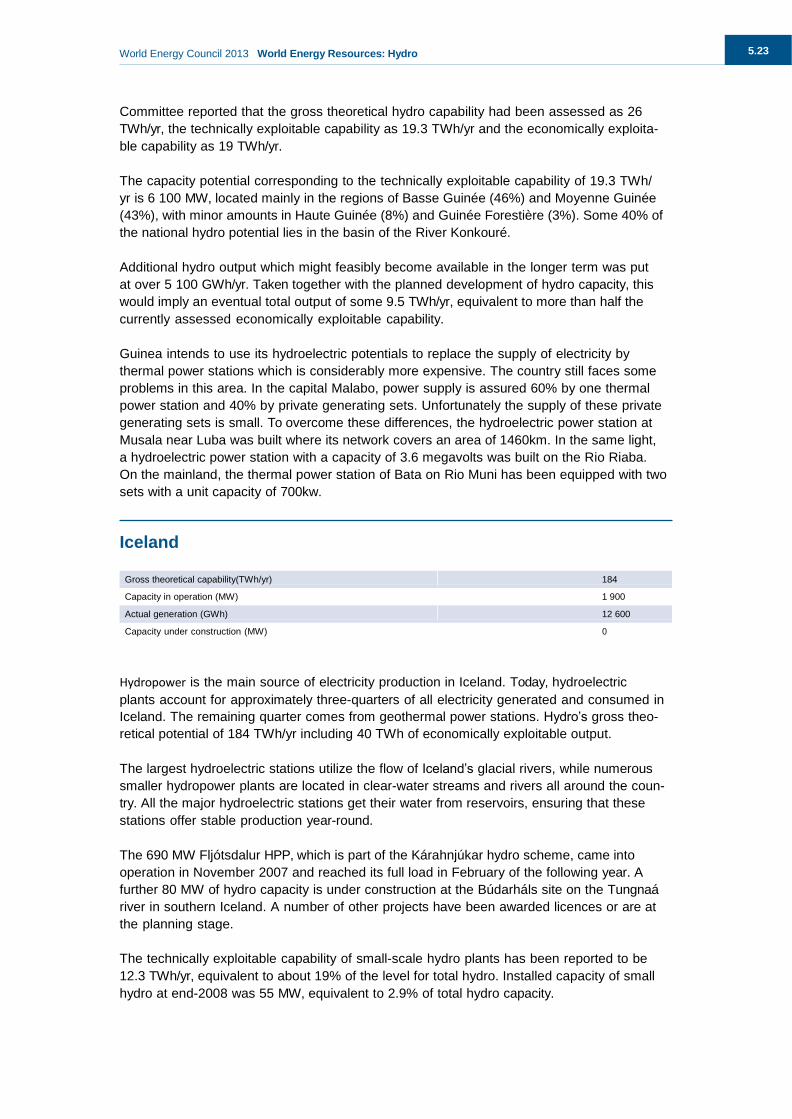
Iceland
Gross theoretical capability(TWh/yr) 184
Capacity in operation (MW) 1 900
Actual generation (GWh) 12 600
Capacity under construction (MW) 0
Hydropower is the main source of electricity production in Iceland. Today, hydroelectric
plants account for approximately three-quarters of all electricity generated and consumed in
Iceland. The remaining quarter comes from geothermal power stations. Hydro’s gross theo-
retical potential of 184 TWh/yr including 40 TWh of economically exploitable output.
The largest hydroelectric stations utilize the flow of Iceland’s glacial rivers, while numerous
smaller hydropower plants are located in clear-water streams and rivers all around the coun-
try. All the major hydroelectric stations get their water from reservoirs, ensuring that these
stations offer stable production year-round.
The 690 MW Fljótsdalur HPP, which is part of the Kárahnjúkar hydro scheme, came into
operation in November 2007 and reached its full load in February of the following year. A
further 80 MW of hydro capacity is under construction at the Búdarháls site on the Tungnaá
river in southern Iceland. A number of other projects have been awarded licences or are at
the planning stage.
The technically exploitable capability of small-scale hydro plants has been reported to be
12.3 TWh/yr, equivalent to about 19% of the level for total hydro. Installed capacity of small
hydro at end-2008 was 55 MW, equivalent to 2.9% of total hydro capacity.

5.24 World Energy Resources: Hydro World Energy Council 2013
Iceland’s precipitation has an enormous energy potential or up to 184 TWh/yr. Much of it is
stored in ice caps and groundwater, and dissipated by evaporation, groundwater flow and
glacier flow.
In total, all the hydropower stations in Iceland have a capacity of just under 1 900 MW and
generate around 12 600 GWh annually. Due to new hydropower projects the capacity and
generation will increase substantially in the next few years.
Iceland’s largest hydropower station is Fjótsdalsstöð (Fljotsdalur Station) in Northeast Ice-
land, with a capacity of 690 MW. It generates close to 4,700 GWh annually. This is almost
three times more than the power plant that comes in second place, which is Búrfellsstöð
(Burfell Station) in the highlands of South Iceland. The powerful glacial rivers of South
Iceland are the main source of Iceland’s hydropower generation; numerous reservoirs and
power stations in this area now generate more than 5,000 GWh annually.
India
Gross theoretical capability (TWh/yr) 2 638
Capacity in operation (MW) 38 106
Actual generation (GWh) U
Capacity under construction (MW) 15 627
India’s hydro resource is one of the largest in the world, its gross theoretical hydropower
potential is estimated to be 2 638 TWh/yr, within which is a technically feasible potential
of some 660 TWh/yr and an economically feasible potential of 442 TWh/yr. Out of the total
power generation installed capacity in India of 1,760,990 MW (June, 2011), hydro power
contributes about 21.6% i.e. 38,106 MW. A total capacity addition of 78,700 MW is envis-
aged from different conventional sources during 2007-2012 (the 11th Plan), which includes
15,627 MW from large hydro projects. In addition to this, a capacity addition of 1400 MW
was envisaged from small hydro up to 25 MW station capacity. The total hydroelectric power
potential in the country is assessed at about 150,000 MW, equivalent to 84,000 MW at 60%
load factor. The potential of small hydro power projects is estimated at about 15,000 MW.
As part of India’s 11th Five Year Plan, Teesta V (510 MW) in Sikkim and Omkareshwar (520
MW) in Madhya Pradesh have both recently been commissioned. Large hydro plants cur-
rently under construction within the 11th Five Year Plan include Subansiri Lower (2 000 MW)
in Assam, and Parbati II (800 MW) and Parbati III (520 MW) in Himachal Pradesh.
Numerous other hydro projects are under way or at the planning stage. In addition, 55 hydro
schemes have been designated as suitable for renovation and upgrading, which could in
due course result in an increment of some 2 500 MW to India’s generating capacity.
Indonesia
Gross theoretical capability (TWh/yr) 2 150
Capacity in operation (MW) 3 881
Actual generation (GWh) 12 419
Capacity under construction (MW) 0

5.25 World Energy Council 2013 World Energy Resources: Hydro
At some 2 150 TWh/yr, Indonesia’s gross theoretical hydro potential is the third largest in
Asia. Its technically feasible potential is just over 400 TWh/yr, of which about 10% is con-
sidered to be economically exploitable. Average annual hydro output is about 12.5 TWh,
indicating the evident scope for further development within the feasible potential. Hydro
presently provides approximately 8% of Indonesia’s electricity supply.
Iran (Islamic Rep)
Gross theoretical capability (TWh/yr) 179
Capacity in operation (MW) 8 746
Actual generation (GWh) U
Capacity under construction (MW) 5 083
Hydropower & Dams World Atlas 2009 quotes the gross theoretical hydropower potential as
179 TWh/yr, of which 50 TWh/yr is regarded as technically feasible.
The Iranian WEC Member Committee reports that installed hydropower capacity was 8 746
MW at end-2011, and that Iran had 5 083 MW of hydro capacity under construction and that
a further 10 426 MW was in various phases of planning.
Italy
Gross theoretical capability (TWh/yr) 200
Capacity in operation (MW) 18 092
Actual generation (GWh) 45 823
Capacity under construction (MW) 0
In Italy 67% of energy produced by renewable sources comes from hydroelectric. In Europe,
Italy is one of the three major producers of hydroelectric energy, together with France and
Spain. According to the Italian Member Committee of WEC current installed capacity is 18
092 MW. In 2011, total hydropower production amounted to 45 TWh of electricity. It has
been calculated that the hydroelectric potential of the Italian territory could be approximately
200 TWh, of which 47 TWh is economically exploitable. When compared with the amount of
energy produced, this indicates that the potential of the hydroelectric resources in Italy is
exploited to about 95% and the maximum limit of possible exploitation has been reached. It
therefore does not seem to be a sector that can expand further.
The fact that more favourable and convenient sites, from a technical and economical point
of view, are already being utilized, contributes to the “closing” of this sector, and a number
of technical, environmental and economic obstacles have arisen with regard to the real-
ization of new high-capacity and high-output power stations. Consequently the future of
hydroelectricity in Italy seems to consist in the realization of only the low-output (<100 kW)
so-called micro-hydro plants, that imply a poor economic and technical commitment and
have a very low impact on the environment.
The gross theoretical capability of small-scale HPPs in Italy is put at 38 000 GWh/yr (one-fifth
of total hydro), within which the economically exploitable component is estimated to be 12
500 GWh/yr, as derived from the aforementioned Italian Position Paper.

5.26 World Energy Resources: Hydro World Energy Council 2013
Plants with a capacity of less than 10 MW represented approximately 14% of total installed
hydro capacity, with facilities in the 1-10 MW class accounting for about 11% and the smaller
plants for around 3%. As there are problems in building large HPPs, future increases in hydro
output may be provided very largely by small hydropower projects.
Japan
Gross theoretical capability (TWh/yr) U
Capacity in operation (MW) 22 362
Actual generation (GWh) 72 639
Capacity under construction (MW) 291
A high proportion of Japan’s massive potential for hydro generation has already been
harnessed. Most of the sites suitable for the installation of large-scale conventional hydro-
electric plants have now been developed. The great majority of the larger hydro
projects presently under construction or planned in Japan are pumped-storage schemes. In
2011 Japan had about 291 MW of all types of hydro capacity under construction.
The technically exploitable capability for small-scale hydro developments is reported by the
Japanese Member Committee to be 47 TWh/yr, a relatively high proportion (34%) of the total
hydro level. Developed small-hydro capacity at end-2011 was about 3.5 GW, equivalent to
12.5% of total conventional hydro capacity. Small-scale capacity planned for construction
totalled 30 MW, with a probable annual generation of 304 GWh.
Jordan
Gross theoretical capability (TWh/yr) U
Capacity in operation (MW) 0
Actual generation (GWh) 0
Capacity under construction (MW) 10
The Jordanian WEC Member Committee reported that pre-feasibility studies had indicated
a technical hydro potential of 400-800 MW through exploiting the difference in elevation
of about 400 metres between the Red Sea and the Dead Sea. Terms of Reference for this
project were approved by the three parties concerned (Jordan, Palestine and Israel) during
a conference held at the Dead Sea in May 2005. In July 2008, the World Bank awarded a
contract for a feasibility study, which was expected to take 24 months to complete.
Conventional hydropower resources in Jordan are limited, owing to the fact that surface
water resources are almost negligible at present. There are two small HPPs: the King Talal
Dam with a rated capacity of 5 MW and a scheme at Aqaba thermal power station which
utilises the available head of returning cooling seawater, also with a capacity of 5 MW. There
are no plans for the expansion of conventional hydro capacity.

5.27 World Energy Council 2013 World Energy Resources: Hydro
Kazakhstan
Gross theoretical capability(TWh/yr) 170
Capacity in operation (MW) 2 267
Actual generation (GWh) 7 849
Capacity under construction (MW) 300
The WEC Member Committee reports that the main hydropower resources are located in the
eastern and southeastern regions of the country:
on the Irtysh river – Bukhtarma (675 MW), Ust-Kamenogorsk (332 MW) and Shulbinsk
(702 MW);
on the Ili river – Kapchagay (364 MW);
on the Syrdarya river – Shardara (100 MW).
The Moinak HPP (300 MW) is presently under construction. By 2020 it is planned to com-
mission Kerbulak (50 MW), Bulak (68 MW) and number of smaller HPPs with a total installed
capacity of 56 MW.
In Kazakhstan, according to existing legislation, small-scale HPPs include those with a
capacity of up to 35 MW.
Laos
Gross theoretical capability (TWh/yr) U
Capacity in operation (MW) 700
Actual generation (GWh) U
Capacity under construction (MW) 5 361
Only a very small proportion of Laos’s massive hydro endowment has so far been harnessed.
Its technically feasible potential is quoted by Hydropower & Dams World Atlas 2009 (HDWA)
as 18 000 MW, whereas its total installed hydropower capacity at end-2008 was less than
700 MW.
According to HDWA, the Ministry of Energy and Mines lists 60 HPPs, with a total installed
capacity of 16 061 MW, as being at various stages of construction or planning. Six hydro
schemes, with a total capacity of 2 131 MW, were under construction in 2009, with twelve
more totalling 3 230 MW reported to be at an advanced stage of negotiation. An additional
42 projects, totalling 10 700 MW, are the subject of feasibility studies.
Much of the new hydro generating capacity is destined to meet demand from neighbouring
countries; export arrangements are already in place with Thailand, Vietnam and Cambodia.
Among the plants presently under construction, the largest are:-
Nam Ngum 2 (615 MW), scheduled for completion in 2013;
Nam Theun 1 (424 MW), due to enter operation in 2014 (exporting to Thailand);
Xe Kaman 3 (250 MW, completion expected in 2010 (90% of its output to be sold to Vietnam).
In March 2010, the Nam Theun 2 HPP (1 070 MW) began commercial exports of electricity to
the Thai state utility EGAT.

5.28 World Energy Resources: Hydro World Energy Council 2013
Lithuania
Gross theoretical capability (TWh/yr) 2
Capacity in operation (MW) 101
Actual generation (GWh) U
Capacity under construction (MW) 3
The Lithuanian WEC Member Committee states that, based on the provisions of the National
Energy Strategy, the possibility of constructing HPPs (with capacities of more than 10 MW)
on the River Neris could be considered. However, their construction is uncertain, in view of
environmental restrictions.
The Kruonis pumped storage plant was built in 1992-1998 and comprises four units, each
with a capacity of 225 MW. The plant serves to supply the peak and semi-peak loads of Lith-
uanian consumers and neighbouring countries.
Opportunities for the construction of small HPPs with capacity of less than 10 MW are limited.
The total probable annual generation of existing and new small hydro plants is expected by
the Member Committee to reach about 160 GWh in 2020.
Up to now, hydropower has been the main renewable energy source for power production.
Due to the topographical conditions, the potential for hydropower is rather low. The econom-
ically feasible potential for hydro resources is estimated at 2.2 TWh/ year . Approximately
14% of this resource is currently being exploited. Legislation protecting many of Lithuania’s
rivers from development for ecological and cultural reasons hampers further exploitation of
hydropower . 130 possible locations have been identified for the renovation or construction
of small hydropower plants, with a potential production of up to 60 million kWh/year.
Macedonia (Republic)
Gross theoretical capability (TWh/yr) U
Capacity in operation (MW) 528
Actual generation (GWh) U
Capacity under construction (MW) 29
Out of a number of hydro plants being planned as BOT schemes in 2009, the largest were
Galishte (194 MW) on the river Vardar, and a 333 MW pumped-storage plant at Chebren on
the Black river.
Madagascar
Gross theoretical capability (TWh/yr) 321
Capacity in operation (MW) 124
Actual generation (GWh) 700
Capacity under construction (MW) 29
Madagascar has a considerable land area (greater than that of France, for example) and
heavy annual rainfall (up to 3 600 mm). Consequently, the potential for hydropower is corre-
spondingly large: gross theoretical potential is put at 321 TWh/yr, within which the technically
feasible potential is 180 TWh/yr, of which about 27% is deemed to be economic. With current

5.29 World Energy Council 2013 World Energy Resources: Hydro
installed capacity standing at 124 MW and annual hydro output about 700 GWh, the island’s
hydro capability has scarcely begun to be utilised.
There are three HPPs of over 10 MW installed capacity in service: Mandraka (24 MW),
Andekaleka (58 MW) and Sahanivotry (15 MW). An additional 29 MW unit is being installed
at Andekaleka, while Mandraka II (57 MW) will be developed to utilise the full head available
at the site.
With the abundance of small rivers on the island, hydropower has become the environmen-
tally sound choice for generating electricity, and Madagascar’s seven hydro-electric power
stations contribute two-thirds of the country’s electric power.
The 15-MW Sahanivotry Hydro-Electric Power Station was commissioned in 2008 on the
Sahanivotry River south of Antsirabe in the province of Antananarivo. It is Madagascar’s first
privately owned and operated hydro plant and the first to be built on the island since 1982.
Currently producing 10 percent of the island’s electricity supply, Sahanivotry feeds the Anta-
nanarivo and Antsirabe grid, which have experienced chronic power outages.
Malaysia
Gross theoretical capability (TWh/yr) 123
Capacity in operation (MW) 1910
Actual generation (GWh) 7346
Capacity under construction (MW) 3 344
There is a substantial potential for hydro development in Malaysia, with a total technically
feasible potential of about 123 TWh/yr, most of which is located in Sarawak (87 TWh/yr) and
Sabah (20 TWh/yr); a considerable proportion of Peninsular Malaysia’s technically feasible
potential of 16 TWh/yr has already been developed.
Construction of the 2 400 MW Bakun hydro plant in Sarawak is being completed. Work on
the 944 MW Murum hydro project (also in Sarawak) is progressing, with the plant due to
commence operations in 2013.
Mexico
Gross theoretical capability (TWh/yr) 42 000
Capacity in operation (MW) 11 499
Actual generation (GWh) 35 796
Capacity under construction (MW) 750
Historically, Mexico has derived much of its power from hydroelectric facilities. Many small,
technologically-dated hydroelectric power plants are still operating in remote areas of the
country, some of which date back to the 1920s. Hydroelectric plants presently account for
more than 11,499 megawatts (MWe) of electric generation capacity, or about one-fourth of
the total generation capacity in Mexico.
Mexico has not exhibited a policy promoting large-scale expansion of hydroelectric power
like many of its Latin American neighbours. Because of the relative arid conditions over

5.30 World Energy Resources: Hydro World Energy Council 2013
much of the northern part of the country, there are relatively few sites suitable for new hydro-
electric development. Current estimates for Mexico’s total hydroelectric potential are about
42,000 MWe. However, environmental concerns and the need to relocate rural communi-
ties stand in the way of greater utilization of the country’s water resources for hydroelectric
energy.
Projects to harness the Usumacinta River and other waterways have been cancelled due to
opposition from local groups. One such project was the El Caracol power plant on the Balsas
River, where a doubling of the facility’s 609 MWe capacity had been planned.
However, severe droughts in parts of Mexico in the past few years have significantly curtailed
hydroelectric power generation. The drought of summer 2000 took 900 MWe of hydroelectric
capacity in northeast Mexico offline and forced the CFE to depend on hydroelectric facili-
ties in the southeast where water levels allowed normal hydroelectric operations. As of June
2002, dry conditions in Sinaloa and Sonora states
For the present Survey, the Mexican WEC Member Committee has reported that La Yesca
(750 MW) is under construction for CFE, and that 1 374 MW of hydro capacity is planned by
CFE for future development. Generating capacity at La Villita Michoacán is being boosted by
400 MW, and at Infiernillo Guerrero by 200 MW, through refurbishment and uprating pro-
grammes. The start of construction work on CFE’s La Parota (900 MW) hydro project on the
Papagayo river has been put back by three years, with completion now scheduled for 2021.
Installed capacity of small-scale hydropower is reported by the Mexican WEC Member Com-
mittee to have been 125 MW.
Mozambique
Gross theoretical capability (TWh/yr) U
Capacity in operation (MW) 107
Actual generation (GWh) U
Capacity under construction (MW) 1 500
The main electricity authority in the country is Electricidade de Mozambique (EDM),
established by the state in 1977, two years after independence. EDM is responsible for
generation, transmission and distribution, but there are other companies that produce and
distribute electricity. The main one is Hidroelectrica de Cahora Bassa, a company jointly
owned by Portugal (82%) and Mozambique (18%) and the biggest hydroelectric scheme in
Southern Africa.
Operations at Cahora Bassa, on the south side of the Zambezi River, are operating at higher
capacities following restoration of the DC transmission line from Cahora Bassa to South
Africa by EDM and Eskom, the South African power utility. Other large hydro power plants
in Mozambique have continued to operate at less than full capacity, including Mavuzi (44.5
MW effective capacity out of 52 MW nominal capacity); Chicamba (34 MW of 38.4 MW); and
Corumana (14 of 16.6 MW).
Mozambique is seeking to boost power output as demand grows in South Africa. The
country also needs to meet a national growing demand from a planned titanium plant and a
possible future expansion to an aluminium plant.

5.31 World Energy Council 2013 World Energy Resources: Hydro
Mozambique is one of the largest power producers in the SADC region. It is also a member
of the Southern African Power Pool (SAPP).
By mid-2009, a framework agreement had been signed for the 1 500 MW Mphanda Nkuwa
hydro scheme, and environmental studies had been completed. Other potential future hydro
projects in Mozambique include Boroma (444 MW) and Lupata (654 MW).
Myanmar (Burma)
Gross theoretical capability (TWh/yr) 140
Capacity in operation (MW) 1 541
Actual generation (GWh) 3 900
Capacity under construction (MW) 1 500
The country is well endowed with hydro resources: its technically feasible potential is given
by Hydropower & Dams World Atlas as 39 720 MW. At an assumed annual capacity factor of
0.40, this level would imply an annual output capability of almost 140 TWh; actual output in
2011 was only 3.9 TWh. There thus appears to be ample scope for substantial development
of hydropower in the long term.
The Shweli 1 plant (600 MW) on the Shweli river in northeast Myanmar was completed in
2008. Work on the Yeywa (790 MW) project on the Myitnge river, towards the centre of the
country, is nearing completion. Longer-term projects include a major export-orientated
scheme, Ta Sang (7 110 MW) on the Thanlwin (or Salween) river, from which it is planned to
supply 1 500 MW to Thailand.
In March 2010, construction of this project (the first of a planned series of five HPPs on
this river) was reported to be getting under way. More than 5 000 MW of additional hydro
capacity is planned, involving 14 projects, including Shweli 2 (640 MW), Shweli 3 (360 MW),
Shwezaye (660 MW) and Tanintharyi (600 MW).
Namibia
Gross theoretical capability (TWh/yr) U
Capacity in operation (MW) 0
Actual generation (GWh) 0
Capacity under construction (MW) 0
Namibia’s only perennial rivers are the Kunene and Kavango (forming borders with Angola
and Zambia in the north) and the Orange River bordering South Africa in the south. Any
plans to develop hydro power are thus subject to lengthy bilateral negotiations. Another
problem leading to limited exploitation of hydro resources is the scarcity of rain and the
extensive droughts.
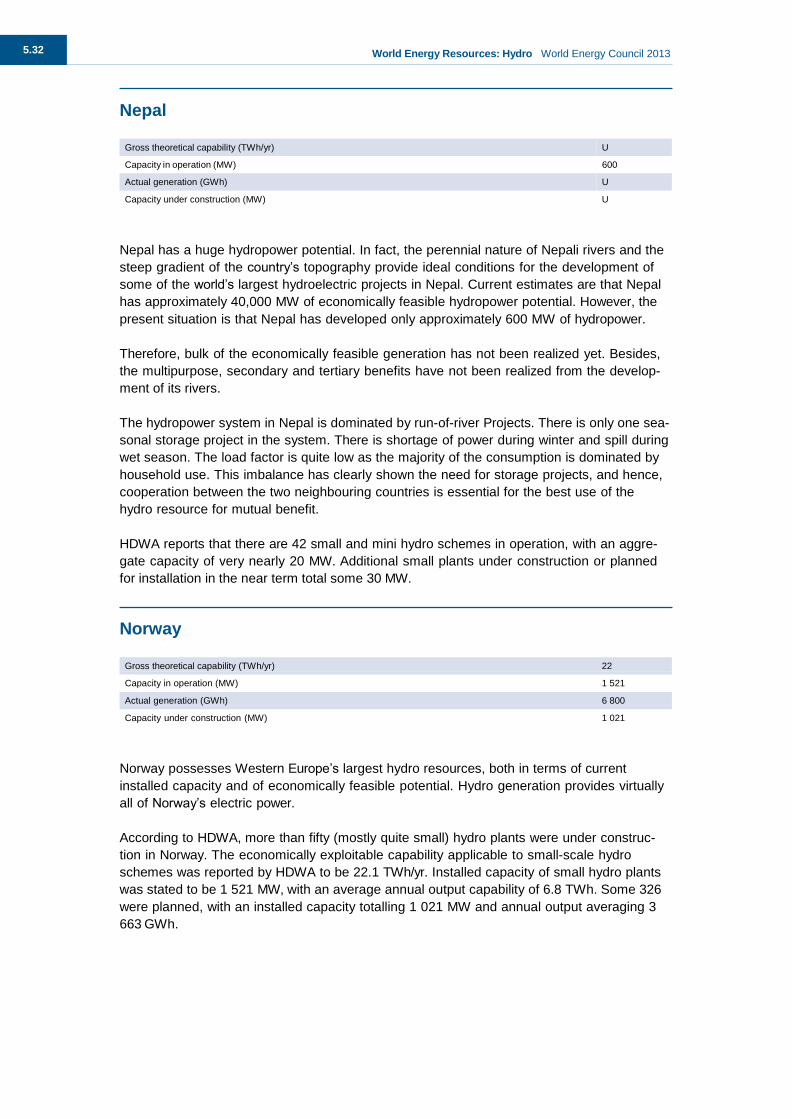
5.32 World Energy Resources: Hydro World Energy Council 2013
Nepal
Gross theoretical capability (TWh/yr) U
Capacity in operation (MW) 600
Actual generation (GWh) U
Capacity under construction (MW) U
Nepal has a huge hydropower potential. In fact, the perennial nature of Nepali rivers and the
steep gradient of the country’s topography provide ideal conditions for the development of
some of the world’s largest hydroelectric projects in Nepal. Current estimates are that Nepal
has approximately 40,000 MW of economically feasible hydropower potential. However, the
present situation is that Nepal has developed only approximately 600 MW of hydropower.
Therefore, bulk of the economically feasible generation has not been realized yet. Besides,
the multipurpose, secondary and tertiary benefits have not been realized from the develop-
ment of its rivers.
The hydropower system in Nepal is dominated by run-of-river Projects. There is only one sea-
sonal storage project in the system. There is shortage of power during winter and spill during
wet season. The load factor is quite low as the majority of the consumption is dominated by
household use. This imbalance has clearly shown the need for storage projects, and hence,
cooperation between the two neighbouring countries is essential for the best use of the
hydro resource for mutual benefit.
HDWA reports that there are 42 small and mini hydro schemes in operation, with an aggre-
gate capacity of very nearly 20 MW. Additional small plants under construction or planned
for installation in the near term total some 30 MW.
Norway
Gross theoretical capability (TWh/yr) 22
Capacity in operation (MW) 1 521
Actual generation (GWh) 6 800
Capacity under construction (MW) 1 021
Norway possesses Western Europe’s largest hydro resources, both in terms of current
installed capacity and of economically feasible potential. Hydro generation provides virtually
all of Norway’s electric power.
According to HDWA, more than fifty (mostly quite small) hydro plants were under construc-
tion in Norway. The economically exploitable capability applicable to small-scale hydro
schemes was reported by HDWA to be 22.1 TWh/yr. Installed capacity of small hydro plants
was stated to be 1 521 MW, with an average annual output capability of 6.8 TWh. Some 326
were planned, with an installed capacity totalling 1 021 MW and annual output averaging 3
663 GWh.

5.33 World Energy Council 2013 World Energy Resources: Hydro
Pakistan
Gross theoretical capability (TWh/yr) 475
Capacity in operation (MW) 6 481
Actual generation (GWh) 27 700
Capacity under construction (MW) 1 600
The total Hydropower resource in Pakistan is estimated at about 50,000 MW. Most of the
resources are located in the North of the country, which offers sites for large scale (100 MW
to 7,000 MW) power projects. Smaller (less than 50 MW) sites are available throughout the
country. In addition, canal system with total of 58,450 km watercourses, farm channels and
field ditchers running another 160,000 km in length has a huge hydropower potential at
numerous sites/locations on each site, ranging from 1 MW to more than 10 MW hydro plants
can be installed.
The total installed hydro capacity was 6 481 MW, almost exactly one-third of total national
generating capacity. According to Hydropower & Dams World Atlas, Pakistan has a gross
theoretical hydro potential of approximately 475 TWh/yr, of which some 204 TWh/yr is
regarded as technically feasible. The main potential sources of hydropower are on the rivers
Indus and Jhelum, plus sites at Swat and Chitral.
Hydro capacity in operation included major plants at Tarbela (3 478 MW), Ghazi Barotha (1
450 MW) and Mangla (1 000 MW); gross hydro-electric output during the year was 27.7 TWh,
accounting for 30% of Pakistan’s electricity generation.
In 2009 the 969 MW Neelum Jhelum hydro scheme and various smaller schemes in the
70-130 MW bracket were reported to be moving ahead. Several huge public sector projects
– including Bunji (7 100 MW), Diamer Basha (4 500 MW) and Dasu (4 320 MW), all sited on
the Indus – are being developed, as well as private-sector schemes such as Kohala (1 100
MW) on the Jhelum. Total hydro capacity reported to be under construction in early 2009 was
some 1 600 MW. About 17 000 MW of additional hydro capacity is planned for construction
starts over the next ten years.
HDWA quotes Pakistan’s small-scale (1-22 MW) hydro potential as 302 GWh/yr, but states
that only 68 MW out of an installed capacity of 107 MW is actually in operation. A total of 350
MW of small hydro capacity is reported to be planned.
Paraguay
Gross theoretical capability (TWh/yr) 111
Capacity in operation (MW) 8 130
Actual generation (GWh) 0
Capacity under construction (MW) U
Paraguay has replaced all thermal power by hydro power in 1970s. Now the country com-
pletely relies on 2 hydroelectric plants for electricity.
The hydroelectric plants are Yacryetá and Itaipú. The Itaipu dam is situated in the eastern
side of Paraguay, near the city of Ciudad del Este. The dam is built on the River Parana
which is on the border between the two nations, Brazil and Paraguay. The original intention
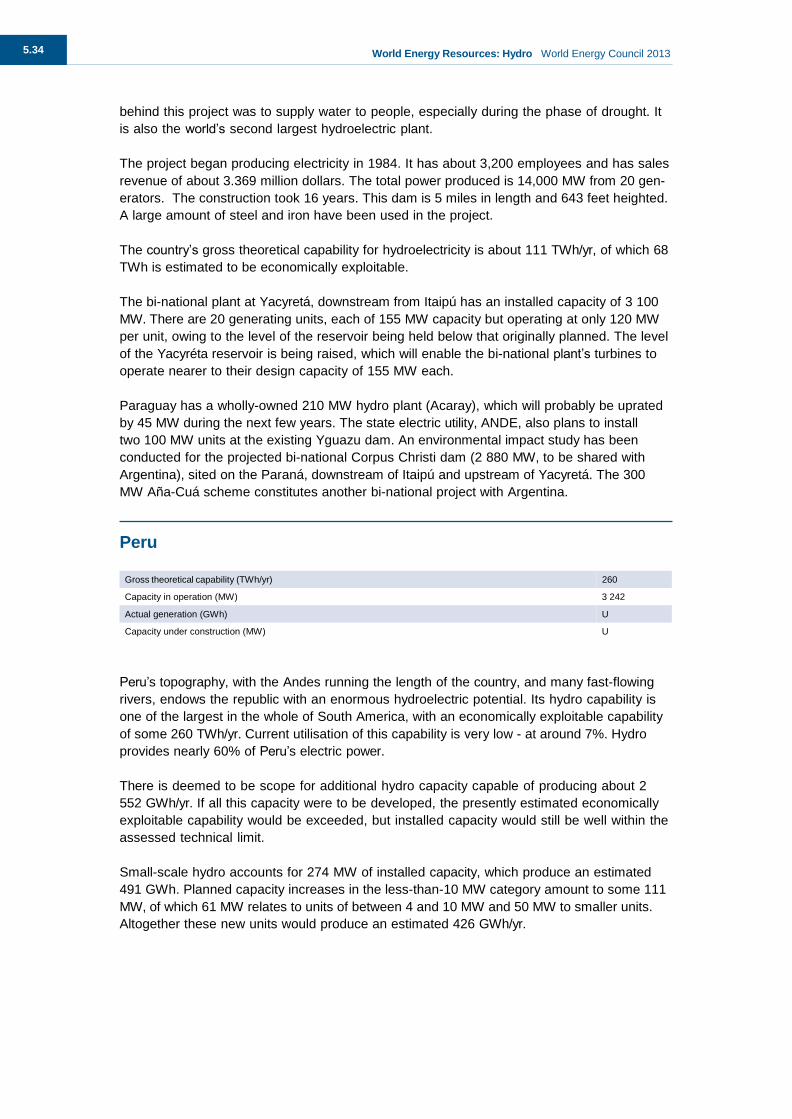
5.34 World Energy Resources: Hydro World Energy Council 2013
behind this project was to supply water to people, especially during the phase of drought. It
is also the world’s second largest hydroelectric plant.
The project began producing electricity in 1984. It has about 3,200 employees and has sales
revenue of about 3.369 million dollars. The total power produced is 14,000 MW from 20 gen-
erators. The construction took 16 years. This dam is 5 miles in length and 643 feet heighted.
A large amount of steel and iron have been used in the project.
The country’s gross theoretical capability for hydroelectricity is about 111 TWh/yr, of which 68
TWh is estimated to be economically exploitable.
The bi-national plant at Yacyretá, downstream from Itaipú has an installed capacity of 3 100
MW. There are 20 generating units, each of 155 MW capacity but operating at only 120 MW
per unit, owing to the level of the reservoir being held below that originally planned. The level
of the Yacyréta reservoir is being raised, which will enable the bi-national plant’s turbines to
operate nearer to their design capacity of 155 MW each.
Paraguay has a wholly-owned 210 MW hydro plant (Acaray), which will probably be uprated
by 45 MW during the next few years. The state electric utility, ANDE, also plans to install
two 100 MW units at the existing Yguazu dam. An environmental impact study has been
conducted for the projected bi-national Corpus Christi dam (2 880 MW, to be shared with
Argentina), sited on the Paraná, downstream of Itaipú and upstream of Yacyretá. The 300
MW Aña-Cuá scheme constitutes another bi-national project with Argentina.
Peru
Gross theoretical capability (TWh/yr) 260
Capacity in operation (MW) 3 242
Actual generation (GWh) U
Capacity under construction (MW) U
Peru’s topography, with the Andes running the length of the country, and many fast-flowing
rivers, endows the republic with an enormous hydroelectric potential. Its hydro capability is
one of the largest in the whole of South America, with an economically exploitable capability
of some 260 TWh/yr. Current utilisation of this capability is very low - at around 7%. Hydro
provides nearly 60% of Peru’s electric power.
There is deemed to be scope for additional hydro capacity capable of producing about 2
552 GWh/yr. If all this capacity were to be developed, the presently estimated economically
exploitable capability would be exceeded, but installed capacity would still be well within the
assessed technical limit.
Small-scale hydro accounts for 274 MW of installed capacity, which produce an estimated
491 GWh. Planned capacity increases in the less-than-10 MW category amount to some 111
MW, of which 61 MW relates to units of between 4 and 10 MW and 50 MW to smaller units.
Altogether these new units would produce an estimated 426 GWh/yr.

5.35 World Energy Council 2013 World Energy Resources: Hydro
Romania
Gross theoretical capability (TWh/yr) 36
Capacity in operation (MW) 6 144
Actual generation (GWh) 14 954
Capacity under construction (MW) 0
Romania has an estimated total usable hydro power of approximately 36 TWh per year and a
significant part of this potential is already used for electricity generation.
Hydro power is one of the main contributors to the total electricity generation in Romania,
with a contribution of around 30% of the total power delivered to the grid. In 2010 hydro
power plants had a total installed capacity of over 6400 MW and produced 19.8 TWh elec-
tricity.
The vast majority of this production results from large-scale reservoir hydro power plants.
Run-of-the-river Small Hydro Power Plants (SHP) were built for a long period of time, but only
recently, after the emergence of the Renewable Energy Act 220/2008, the interest in building
and operating such power generators was revamped
Russian Federation
Gross theoretical capability(TWh/yr) 2 295
Capacity in operation (MW) 49 700
Actual generation (GWh) 180 000
Capacity under construction (MW) 3 000
Russia’s hydro resource base is enormous - the gross theoretical potential is some 2 295
TWh/yr, of which 852 TWh is regarded as economically feasible. The bulk of the Federation’s
potential is in its Asian regions (Siberia and the Far East). Hydro generation in 2011 (approx-
imately 180 TWh) represented 21% of the economic potential and accounted for about 19%
of total electricity generation.
The largest hydro scheme currently under construction in the Russian Federation is the 3 000
MW plant at Bogucchany on the Angara river in southeast Siberia..
Major hydro developments are under consideration for the Volga-Kama cascade (expanding
capacity by 2 010 MW), and for up to seven HPPs on the Timpton river in South Yakutia (with
a total installed capacity of 9 000 MW). The first plant to be built under the latter scheme
would be Kankunskaya (1 600 MW).
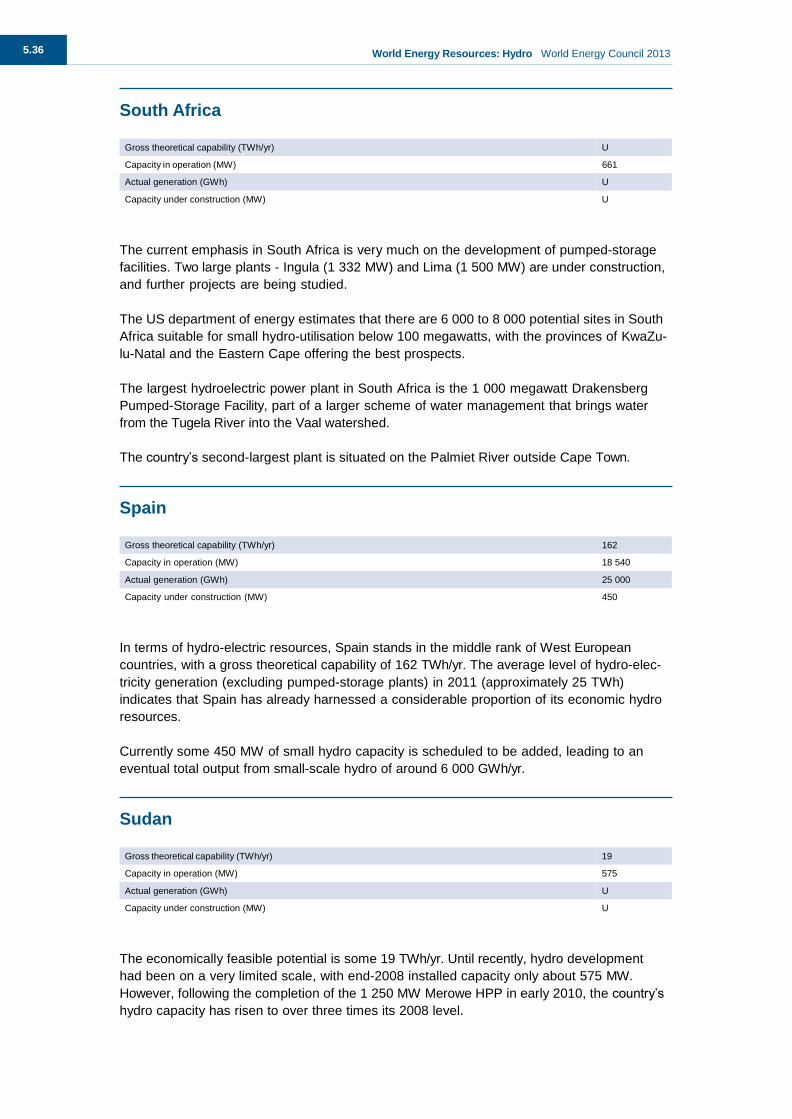
5.36 World Energy Resources: Hydro World Energy Council 2013
South Africa
Gross theoretical capability (TWh/yr) U
Capacity in operation (MW) 661
Actual generation (GWh) U
Capacity under construction (MW) U
The current emphasis in South Africa is very much on the development of pumped-storage
facilities. Two large plants - Ingula (1 332 MW) and Lima (1 500 MW) are under construction,
and further projects are being studied.
The US department of energy estimates that there are 6 000 to 8 000 potential sites in South
Africa suitable for small hydro-utilisation below 100 megawatts, with the provinces of KwaZu-
lu-Natal and the Eastern Cape offering the best prospects.
The largest hydroelectric power plant in South Africa is the 1 000 megawatt Drakensberg
Pumped-Storage Facility, part of a larger scheme of water management that brings water
from the Tugela River into the Vaal watershed.
The country’s second-largest plant is situated on the Palmiet River outside Cape Town.
Spain
Gross theoretical capability (TWh/yr) 162
Capacity in operation (MW) 18 540
Actual generation (GWh) 25 000
Capacity under construction (MW) 450
In terms of hydro-electric resources, Spain stands in the middle rank of West European
countries, with a gross theoretical capability of 162 TWh/yr. The average level of hydro-elec-
tricity generation (excluding pumped-storage plants) in 2011 (approximately 25 TWh)
indicates that Spain has already harnessed a considerable proportion of its economic hydro
resources.
Currently some 450 MW of small hydro capacity is scheduled to be added, leading to an
eventual total output from small-scale hydro of around 6 000 GWh/yr.
Sudan
Gross theoretical capability (TWh/yr) 19
Capacity in operation (MW) 575
Actual generation (GWh) U
Capacity under construction (MW) U
The economically feasible potential is some 19 TWh/yr. Until recently, hydro development
had been on a very limited scale, with end-2008 installed capacity only about 575 MW.
However, following the completion of the 1 250 MW Merowe HPP in early 2010, the country’s
hydro capacity has risen to over three times its 2008 level.

5.37 World Energy Council 2013 World Energy Resources: Hydro
In 2008, a contract was awarded for the design of five hydro schemes in northern Sudan.
Most of Sudan’s pre-2008 hydro plant is at least 40 years old, providing a potential for uprat-
ing estimated at about 200 MW.
Swaziland
Gross theoretical capability (TWh/yr) U
Capacity in operation (MW) 61
Actual generation (GWh) 69
Capacity under construction (MW) 0
According to the Swaziland Electricity Company, there is 60.4 MW of hydropower capacity in
operation in 2011. These plants produce approximately 15% of the country’s total electricity
demand, the remainder being imported from neighbouring countries.
Sweden
Gross theoretical capability (TWh/yr) 65
Capacity in operation (MW) 16 197
Actual generation (GWh) 66 000
Capacity under construction (MW) 0
Today the total number of hydropower plants in Sweden is 2 057 of which 1 615 have an
installed capacity of maximum 10 MW. The total capacity is 16 197 MW of which 1 050 MW is
small hydro (plants less than 10 MW).
The total electricity production is 66 TWh during a normal year 4.6 TWh of which is produced
in SHP. According to the BlueAGE study issued by ESHA in 2001, Sweden has a fifth position
in energy winning in small hydropower in Europe having Italy, France, Germany and Spain
ahead.
The construction of new hydro plants has largely ceased, on account of environmental and
political considerations. Future activity is likely to be very largely confined to the modernisa-
tion and refurbishment of existing capacity.
As in many European countries large hydro is considered almost fully developed, but there is
still a potential for developing small hydro in Sweden. The BlueAGE study shows a Swedish
potential of almost 2 TWh in upgrading existing plants and constructing new plants taking
into account technical, economical and environmental constraints.
The Swedish manufacturing industry has been very successful with the first commercial
turbines manufactured in 1845 and with well known manufacturers as KMW, NOHAB, Finshy-
ttan and ASEA with products spread all over the world.
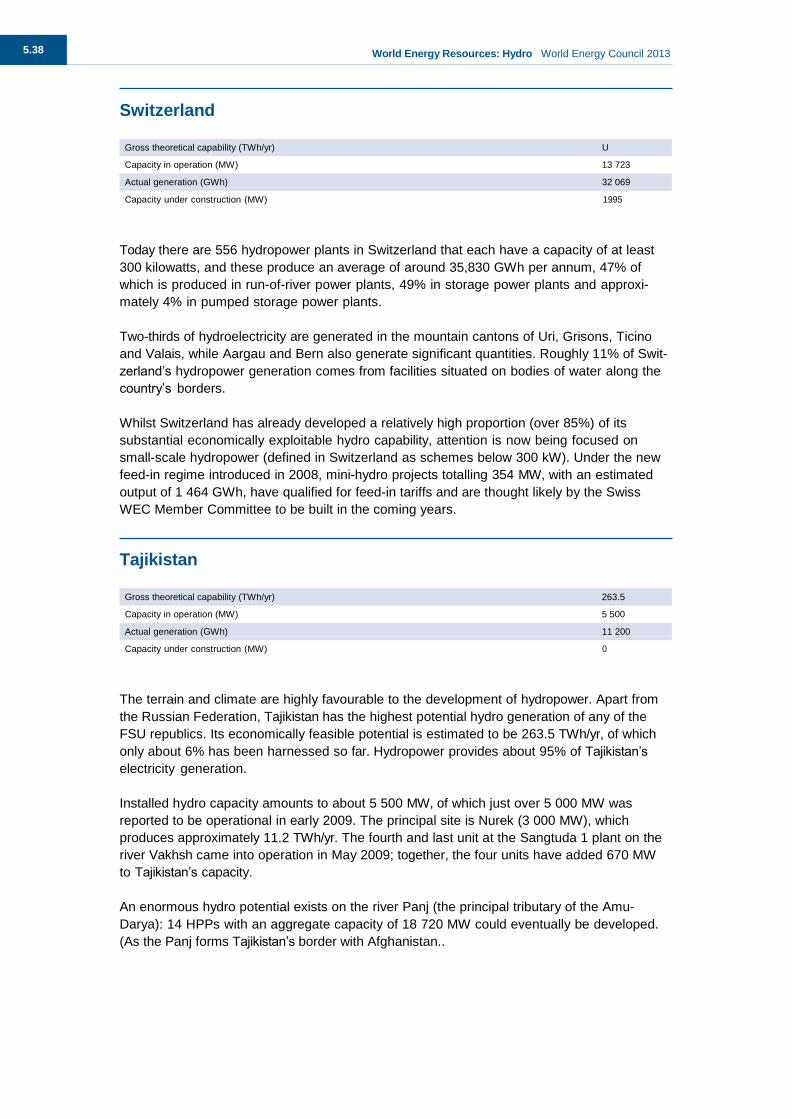
5.38 World Energy Resources: Hydro World Energy Council 2013
Switzerland
Gross theoretical capability (TWh/yr) U
Capacity in operation (MW) 13 723
Actual generation (GWh) 32 069
Capacity under construction (MW) 1995
Today there are 556 hydropower plants in Switzerland that each have a capacity of at least
300 kilowatts, and these produce an average of around 35,830 GWh per annum, 47% of
which is produced in run-of-river power plants, 49% in storage power plants and approxi-
mately 4% in pumped storage power plants.
Two-thirds of hydroelectricity are generated in the mountain cantons of Uri, Grisons, Ticino
and Valais, while Aargau and Bern also generate significant quantities. Roughly 11% of Swit-
zerland’s hydropower generation comes from facilities situated on bodies of water along the
country’s borders.
Whilst Switzerland has already developed a relatively high proportion (over 85%) of its
substantial economically exploitable hydro capability, attention is now being focused on
small-scale hydropower (defined in Switzerland as schemes below 300 kW). Under the new
feed-in regime introduced in 2008, mini-hydro projects totalling 354 MW, with an estimated
output of 1 464 GWh, have qualified for feed-in tariffs and are thought likely by the Swiss
WEC Member Committee to be built in the coming years.
Tajikistan
Gross theoretical capability (TWh/yr) 263.5
Capacity in operation (MW) 5 500
Actual generation (GWh) 11 200
Capacity under construction (MW) 0
The terrain and climate are highly favourable to the development of hydropower. Apart from
the Russian Federation, Tajikistan has the highest potential hydro generation of any of the
FSU republics. Its economically feasible potential is estimated to be 263.5 TWh/yr, of which
only about 6% has been harnessed so far. Hydropower provides about 95% of Tajikistan’s
electricity generation.
Installed hydro capacity amounts to about 5 500 MW, of which just over 5 000 MW was
reported to be operational in early 2009. The principal site is Nurek (3 000 MW), which
produces approximately 11.2 TWh/yr. The fourth and last unit at the Sangtuda 1 plant on the
river Vakhsh came into operation in May 2009; together, the four units have added 670 MW
to Tajikistan’s capacity.
An enormous hydro potential exists on the river Panj (the principal tributary of the Amu-
Darya): 14 HPPs with an aggregate capacity of 18 720 MW could eventually be developed.
(As the Panj forms Tajikistan’s border with Afghanistan..

5.39 World Energy Council 2013 World Energy Resources: Hydro
Tanzania
Gross theoretical capability (TWh/yr) U
Capacity in operation (MW) 561
Actual generation (GWh) U
Capacity under construction (MW) U
The 900 MW Stieglers Gorge hydro project on the river Rufiji appears to be moving ahead,
with the Canadian-registered company Energem Resources acquiring a 40% stake in the
scheme.
Tanzania’s interconnected grid system has an installed capacity of 773MW, of which 71% is
hydropower. The largest hydropower complexes are the Mtera and Kidatu Dams and they
are situated on the Great Ruaha River. The Mtera Dam is the most important reservoir in the
power system providing over-year storage capability. It also regulates the outflows to main-
tain the water level for the downstream Kidatu hydropower plant
The installed capacity of the hydropower facilities are: - the Kidatu power station, which has
the capacity of 204 MW; - the Kihansi power station, which has the capacity of 180 MW; - the
Mtera power station, which has the capacity 80 MW; - the Pangani power station, which has
the capacity of 68 MW; - the Hale power station, which has the 21 MW; and - Nyumba ya
Mungu, which has the capacity of 8 MW The total capacity of hydropower generation is 561
MW.
Turkey
Gross theoretical capability (TWh/yr) 432
Capacity in operation (MW) 17 259
Actual generation (GWh) 57 472
Capacity under construction (MW) 8 270
There is about 432 TWh per year in hydropower potential in Turkey. About 35 per cent of
hydropower potential is used to generate electricity and hydropower plants with an installed
capacity of 17 MW in operation, generating 57 GWh in 2011. Many private companies are
developing small and medium size hydropower projects.
A further 8.2 GW of capacity was under construction, with an envisaged total average output
of around 25 TWh/yr. Some 23 TWh of additional capacity is planned for development over
the longer term.
According to HDWA, Turkey’s small-scale hydropower potential is an estimated 39 000 GWh/
yr. The total installed capacity of such HPPs is quoted as 636 MW, providing an average
output of 2 545 GWh/yr.

5.40 World Energy Resources: Hydro World Energy Council 2013
Uganda
Gross theoretical capability (TWh/yr) U
Capacity in operation (MW) 340
Actual generation (GWh) U
Capacity under construction (MW) 250
Following a successful financial closure at the end of 2008, contracts have been awarded for
the 250 MW Bujagali scheme, and work is now well under way. The project is for five 50 MW
units, to be installed at a site on the Victoria Nile, approximately 8 km downstream of the 180
MW Nalubaale (formerly Owen Falls) station, and is scheduled for commissioning in 2011-
2012.
United Kingdom
Gross theoretical capability (TWh/yr) 4
Capacity in operation (MW) 1 630
Actual generation (GWh) 5 700
Capacity under construction (MW) 0
While the overall amount of installed hydro-electric capacity is extremely modest, opportuni-
ties for development do exist, especially in the small-hydro sector (defined in this context as
plants up to 5 MW). Hydropower & Dams World Atlas quotes the technically feasible poten-
tial for small hydro so defined as 4 100 GWh/yr, with the economically feasible potential for
undeveloped sites as 1 000 GWh/yr.
The UK WEC Member Committee reports that a study into the potential hydro resource is
currently under way. The draft findings of this study show a potential of up to 248 MW of
small-scale hydro left to be developed in England and Wales. This study complements one
undertaken in Scotland on behalf of the Forum for Renewable Energy Development in Scot-
land, which showed a potential for up to 657 MW of small-scale hydropower.
The 2008 Energy Act provided the wherewithal for the Government to introduce feed-in
tariffs (FIT). From 1 April 2010 renewable energy electricity-generating technologies, up to
a maximum of 5 MW, qualify for generation and export tariffs. FITs will work alongside the
Renewables Obligations. In the case of new hydro schemes, where both the product and
installer are certificated, the generation tariffs are on a decreasing scale from GBP 0.199/
kWh for up to 15 kW capacity to GBP 0.045/kWh for installations of 2-5 MW. These rates will
remain the same for a period of 20 years (although adjusted for inflation through a link to the
Retail Price Index). The tariff payable for electricity exported to the grid is GBP 0.03/kWh,
regardless of the size of the installation.
The UK currently (2011) generates about 1.5% (5,700 Gwh) of its electricity from hydroelec-
tric schemes - most of which are large-scale schemes in the Scottish Highlands.
Hydroelectric energy uses proven and efficient technology; the most modern plants have
energy conversion efficiencies of 90% and above. Hydro has a typical load factor of 35 to
40%.

5.41 World Energy Council 2013 World Energy Resources: Hydro
United States of America
Gross theoretical capability(TWh/yr) 2 040
Capacity in operation (MW) 77 500
Actual generation (GWh) 319 355
Capacity under construction (MW) 0
The hydro resource base is huge: the United States WEC Member Committee reports that
the gross theoretical potential was assessed in 2006 as 2 040 TWh/yr, and that the annual
technically exploitable capability is 1 339 TWh, based on publications of the U.S. Depart-
ment of Energy (Idaho National Environmental and Engineering Laboratory), other U.S.
Departments and the Electric Power Research Institute (EPRI). The end-2011 hydro capacity
of 77.5 GW had an average annual capability of about 268 TWh, equivalent to 20% of the
assessed technical potential.
The Member Committee states that there have been no comprehensive assessments of the
U.S. potential for all economically exploitable hydropower, and that, moreover, the economics
of these projects is unknown and is in constant flux due to policy and commodity pricing.
On the issue of Exploitable Capability, the U.S. Member Committee quotes from the 2006
report by the Idaho National Laboratory:
‘It is concluded from the study results that there are a large number of opportunities for
increasing U.S. hydroelectric generation throughout the country that are feasible based on
an elementary set of feasibility criteria. These opportunities collectively represent a potential
for approximately doubling U.S. hydroelectric generation (not including pumped storage),
but more realistically offer the means to at least increase hydroelectric generation by more
than 50%.
The reported technically exploitable capability of small-scale hydropower (5 MW and below)
is 782 TWh, with about 198 TWh/yr rated as economically exploitable. The installed generat-
ing capacity of small hydro plants totalled 2.86 GW at end-2008; probable annual generation
is put at 10 154 GWh, but actual generation in 2008 was some 18% higher, at 11 973 GWh,
equivalent to 4.8% of total U.S. hydro output.
Various incentives for small-scale hydro exist in the form of Federal and State production
tax credits and Federal grants and loan guarantees. Moreover the Federal Energy Regu-
latory Commission, which is responsible for the licensing of private, municipal and State
hydro-electric projects, has an exemption for hydro projects with an installed capacity of 5
MW or less which also meet certain conditions.
In the United States, hydropower has grown steadily, from 56 GW in 1970 to more than 95
GW today.[4] As a percentage of the U.S. electricity supply mix, however, it has fallen to 10
percent, down from 14 percent 20 years ago, largely as a result of the rapid growth in natural
gas power plants. In terms of electricity production, hydropower plants account for about
seven percent of America’s current power needs.[5]
In some parts of the country, hydropower is even more important. For example, the Pacific
Northwest generates more than two-thirds of its electricity from 55 hydroelectric dams.[6]
The Grand Coulee dam on the Columbia River is one of the largest dams in the world, with a
capacity of nearly 6,500 megawatts (MW).

5.42 World Energy Resources: Hydro World Energy Council 2013
In addition to very large plants in the West, the United States has many smaller hydro plants.
In 1940 there were 3,100 hydropower plants across the country, but by 1980 that number
had fallen to 1,425. Since then, a number of these small plants have been restored; there are
currently 2,378 hydro plants (not including pumped storage) in operation.[7]
These plants account for only a tiny fraction of the 80,000 dams that block and divert our
rivers. As a result, there is a significant opportunity for growth according to the National
Hydropower Association, which estimates that more than 4,300 MW of additional hydropower
capacity can be brought online by upgrading existing facilities.[8]
Uruguay
Gross theoretical capability (TWh/yr) 32
Capacity in operation (MW) 1 538
Actual generation (GWh) 6 479
Capacity under construction (MW) 0
Between 2003 and 2007, 68% of Uruguay’s energy needs were met by hydroelectric dams
on the Uruguay River. The largest of these impoundments, the Salto Grande, a facility shared
with Argentina, has generated up to half of Uruguay’s electricity in the past. Apart from the
bi-national Salto Grande, with a total capacity of 1,890 MW, existing plants are Terra (152
MW), Baygorria (108 MW), Constitucion (333 MW). All the potential for large hydro in Uru-
guay has already been developed.
According to the Uruguayan Member Committee of WEC the technically exploitable potential
is 10 TWh/yr, within a gross theoretical potential of 32 TWh. Some 6 TWh/yr of hydro capacity
is regarded as economically feasible for development at present. At the end of 2011 opera-
tional capacity was 1 538 MW with a total production of 6 479 GWh of electricity that year. No
new capacity was under construction at the time.
During the 1980s almost all of Uruguay’s incremental generating capacity was in the form of
hydropower, notably through the commissioning of the bi-national Salto Grande (1 890 MW)
plant on the river Uruguay; the republic shares its output with Argentina. No hydro plants
are reported to be presently under construction and only about 70 MW is planned: future
increases in generating capacity are likely to be largely fuelled by natural gas.
Venezuela
Gross theoretical capability (TWh/yr) 731
Capacity in operation (MW) 14 627
Actual generation (GWh) 86 700
Capacity under construction (MW) 0
Hydroelectricity provides the bulk of Venezuela’s electricity supply. Most of the country’s
hydro production facilities are located on the Caroni River in the Guayana region. The
8,900-megawatt Guri Hydroelectric Power Plant on the Caroni is one of the largest hydroe-
lectric dams in the world and provides the majority of Venezuela’s electric power.
Water levels at the Guri Dam dropped to record-low levels during the 2009-2010 drought,

5.43 World Energy Council 2013 World Energy Resources: Hydro
forcing the country to implement rolling blackouts, reduce industrial production, and fine
large users for excessive consumption. Venezuela plans to expand hydroelectric production
in the future.
Hydropower & Dams World Atlas (HDWA) reports a gross theoretical hydropower potential
of 731 TWh/yr, of which 261 TWh/yr is considered as technically feasible and approximately
100 TWh/yr economically exploitable. Hydro-electric output in 2008 was 86.7 TWh. About
73% of the republic’s electricity requirements are met from hydropower.
In early 2009, hydro capacity in operation amounted to 14 627 MW. The principal HPPs
under construction were Tocoma (2 160 MW) on the river Caroní and La Vueltosa (514 MW)
in the Andean region.
A large increase in hydro-electric capacity occurred during the 1980s, the major new plant
being Guri (Raúl Leoni), on the Caroní in eastern Venezuela - its installed capacity of 8 850
MW makes it one of the world’s largest hydro stations. The Tocoma HPP, located 18 km
downstream of Guri, is the last in the series of major hydro plants constructed by the state-
owned company EDELCA on the lower Caroní. Eventually, the total installed capacity on the
lower Caroní (comprising, in order of flow, Guri, Tocoma, Caruachi and Macagua) will exceed
16 000 MW.
HDWA states that no very large hydro plants are firmly planned for the next ten years, but
mentions a number of schemes that have been studied, including several on the upper and
middle reaches of the Caroní and others on the Colorada in the Andean region.
Vietnam
Gross theoretical capability (TWh/yr) 300
Capacity in operation (MW) 5 500
Actual generation (GWh) 24 000
Capacity under construction (MW) 0
Vietnam has abundant hydro resources, particularly in its central and northern regions. Its
gross theoretical potential is put at 300 000 GWh/yr, with an economically feasible potential
of 100 000 GWh/yr. Total installed hydro capacity was about 5 500 MW at end-2008 and an
output of about 24 TWh provided about one-third of Vietnam’s power supply. The largest
HPPs currently in operation are Hoa Binh (1 920 MW), Yali (720 MW), Tri An (420 MW) and
Ham Thuan (300 MW).under BOT or IPP arrangements.
Zambia
Gross theoretical capability (TWh/yr) U
Capacity in operation (MW) 1 730
Actual generation (GWh) U
Capacity under construction (MW) U
Zambia’s two major hydro plants are being refurbished and upgraded: the 900 MW Kafue
Gorge (Upper) station by 90 MW and Kariba North Bank (presently 600 MW) by 120 MW.
Economic and technical feasibility studies are being conducted on the Kafue Gorge Lower
5.44 World Energy Resources: Hydro World Energy Council 2013
IPP project (750 MW) and a 210 MW scheme at Kalungwishi. Further rehabilitation and new-
build projects are being developed or studied, including the 120 MW Itezhi Tezhi scheme on
the Kafue river and the 1 800 MW Baroka Gorge bi-national project with Zimbabwe.
The national installed capacity presently stands at 1,730 Mega Watts (MW) but the demand
is more than 2, 000 MW.
So far, there are only two important inter-connectors to Zimbabwe and the Democratic
Republic of Congo (DRC) which are the most important electricity export grids.
Apart from the Kabompo power project which was recently commissioned, other projects
aimed at averting power deficit include the 120 MW Itezhi-tezhi power project, rehabilitation
of the 360 MW Kariba North Bank Station and the 750MW Kafue Gorge Lower project.
Under the Power Rehabilitation Project (PRP) by Zesco, the projects involved the rehabilita-
tion and up rating of the three major hydro power stations namely, Kafue Gorge, Kariba North
Bank and Victoria Falls.
The major achievements of the PRP has been the rehabilitation and upgrading of the Kafue
Gorge Power Station from 900 to 990MW, the reinstating of the Victoria Falls Power Station
to its full generating capacity of 108 MW as well as the up-rating of the Kariba North Bank
power station from 600 MW to 720 MW.