Embed Size (px)
Citation preview
Schoolyard Hydro-Ecology Teachers’ Handbook - Baltimore Ecosystem Study
Draft 2 – July 19, 2005 Lesson 3 - page 1
Stormwater Basics Stormwater flows into the stormwater
system through storm drains, which are
frequently located along the curbs of
parking lots and roadways. The grate
and holding tank that prevents larger
objects from flowing into the storm
sewer system is called a catch basin.
Once below ground, the stormwater
flows through pipes that lead to an
outfall where the stormwater enters a
stream, river or lake.
In some areas, the outfall may lead to a
stormwater management basin. These
basins control the flow of stormwater
and can also improve water quality,
depending on how they are designed.
In some urban areas, the stormwater and
sanitary sewer systems may be
combined (not in Baltimore). In this
situation, both stormwater and sewage
from households and businesses travel
together in the same pipes. Both
stormwater and sewage are treated at
sewage treatment plants except during
heavy rains. During these occasions,
both the stormwater and untreated
sewage exceed the capacity of the
treatment plant and this overflow is
directed into local waterways untreated.
Lesson 3 – Pervious and Impervious Surfaces
Background for Teachers
WHAT HAPPENS TO RAIN AND SNOW WATER?
Before urbanization, water recharge happened when precipitation fell on pervious surfaces
(including grassland and woods) and infiltration occurred. When cities developed and the
amount of pervious surfaces decreased, leading to less ground water recharge and a huge
increase in surface runoff.
Impermeable surfaces tend to become fully saturated very quickly and thereafter all of the
precipitation becomes runoff, though some of that runoff may be absorbed by adjacent
permeable areas and may not enter any drainage
network. Once these impermeable surfaces have been
wetted the percentage of runoff does not vary greatly.
With the increase in impervious surfaces (roads,
rooftops, parking lots and other hard surfaces that do
not allow stormwater to soak into the ground), the rate
of stormwater runoff increases. This means more
water reaches the waterway faster and less water
infiltrates into the ground. In streams, more erosion of
stream banks and scouring of channels occurs because
of runoff. This degrades habitat for plants and animals
that depend on clear water. Sediment in the water
clogs the gills of fish and blocks light needed for
plants. The sediment also settles to fill in channels of
streams, lakes, and reservoirs.
Rainwater will carry chemicals, nutrients, sediments
and other substances into local streams (either directly
or through storm sewers) if the water is not absorbed
by soil and vegetation. The increased runoff can also
carry along debris such as litter, cigarette butts, motor
oil poured down the storm sewer, air pollutants that
settle from car exhaust, and fertilizers, and pesticides
from lawn care. The reduced amount of infiltrating
water can lower ground water levels, which in turn can
stress downstream environments which depend on
steadier flows of water. New sources of groundwater
can also develop in urban areas, although they are not
from the most desirable places (septic tanks,
percolation basins, industrial waste injection wells,
Schoolyard Hydro-Ecology Teachers’ Handbook - Baltimore Ecosystem Study
Draft 2 – July 19, 2005 Lesson 3 - page 2
agricultural and residential irrigation).
IMPACTS OF IMPERVIOUSNESS
Once an area is cleared of vegetation, graded and compacted, and an impervious surface or
partially pervious surface is constructed or installed, the area generally will not return to a
naturally vegetated state. New impervious surfaces change natural drainage patterns and impact
the environment by affecting the way that stormwater and, in some cases, tidal water moves over
the landscape and through the soil. New impervious surfaces can affect the quantity, velocity,
and quality of stormwater resulting in impacts to nearby land and water bodies.
Permeable surfaces react differently. As the storm progresses the upper layers of the soil become
wetter and wetter and when the rainfall exceeds the rate at which it can soak into the ground the
rainfall is turned into runoff. When the rainfall intensity drops below the soakage rate the runoff
ceases even though rainfall may still continue. Therefore the percentage runoff varies throughout
the duration of the storm.
IS IT PERVIOUS?
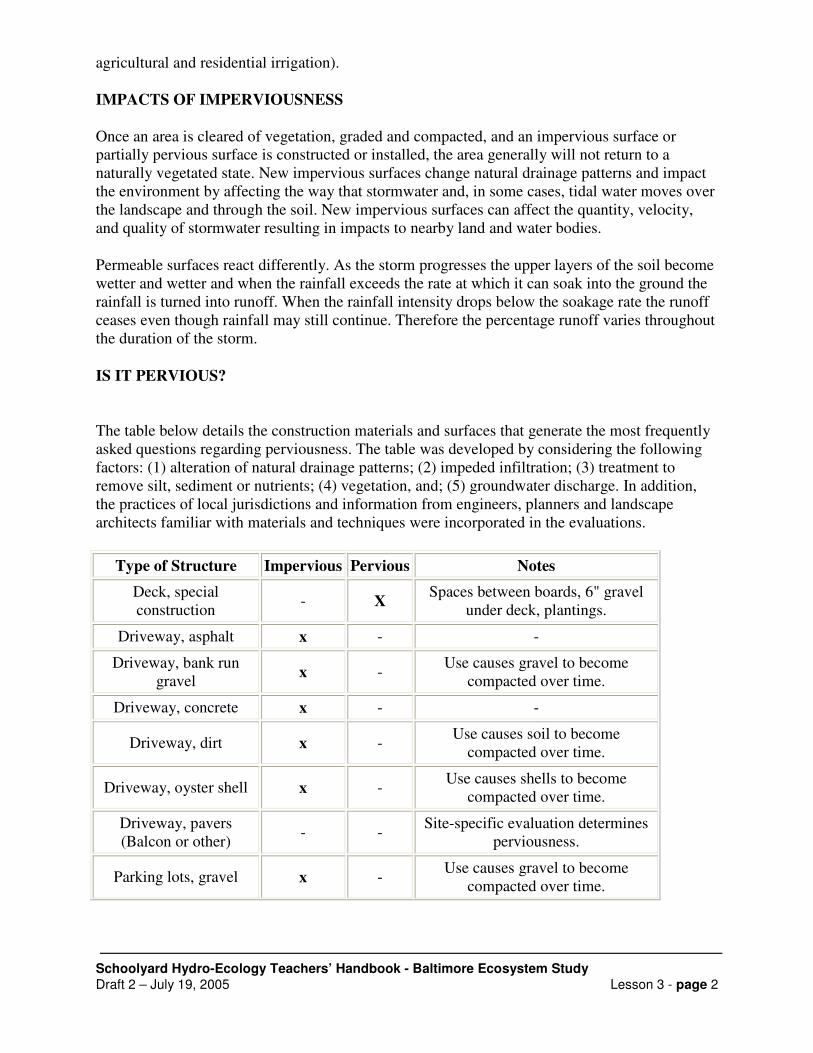
The table below details the construction materials and surfaces that generate the most frequently
asked questions regarding perviousness. The table was developed by considering the following
factors: (1) alteration of natural drainage patterns; (2) impeded infiltration; (3) treatment to
remove silt, sediment or nutrients; (4) vegetation, and; (5) groundwater discharge. In addition,
the practices of local jurisdictions and information from engineers, planners and landscape
architects familiar with materials and techniques were incorporated in the evaluations.
Type of Structure Impervious Pervious Notes
Deck, special
construction - X
Spaces between boards, 6" gravel
under deck, plantings.
Driveway, asphalt x - -
Driveway, bank run
gravel x -
Use causes gravel to become
compacted over time.
Driveway, concrete x - -
Driveway, dirt x - Use causes soil to become
compacted over time.
Driveway, oyster shell x - Use causes shells to become
compacted over time.
Driveway, pavers
(Balcon or other) - -
Site-specific evaluation determines
perviousness.
Parking lots, gravel x - Use causes gravel to become
compacted over time.
Schoolyard Hydro-Ecology Teachers’ Handbook - Baltimore Ecosystem Study
Draft 2 – July 19, 2005 Lesson 3 - page 3
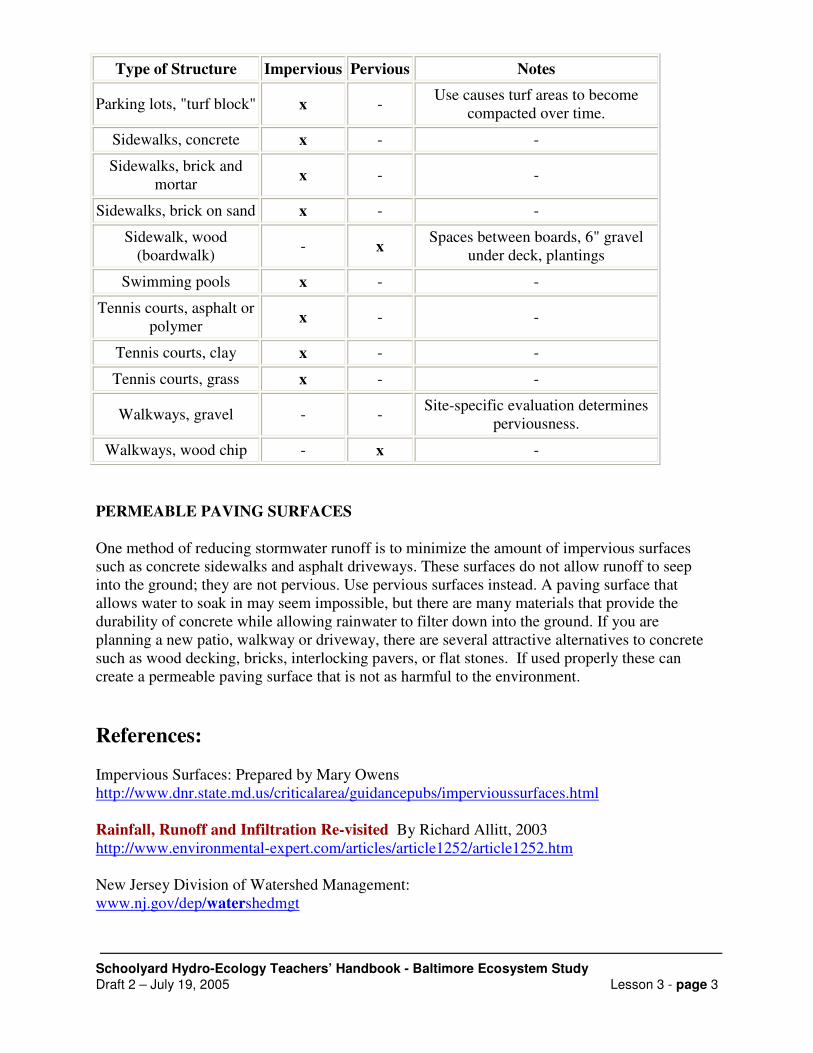
Type of Structure Impervious Pervious Notes
Parking lots, "turf block" x - Use causes turf areas to become
compacted over time.
Sidewalks, concrete x - -
Sidewalks, brick and
mortar x - -
Sidewalks, brick on sand x - -
Sidewalk, wood
(boardwalk) - x
Spaces between boards, 6" gravel
under deck, plantings
Swimming pools x - -
Tennis courts, asphalt or
polymer x - -
Tennis courts, clay x - -
Tennis courts, grass x - -
Walkways, gravel - - Site-specific evaluation determines
perviousness.
Walkways, wood chip - x -
PERMEABLE PAVING SURFACES
One method of reducing stormwater runoff is to minimize the amount of impervious surfaces
such as concrete sidewalks and asphalt driveways. These surfaces do not allow runoff to seep
into the ground; they are not pervious. Use pervious surfaces instead. A paving surface that
allows water to soak in may seem impossible, but there are many materials that provide the
durability of concrete while allowing rainwater to filter down into the ground. If you are
planning a new patio, walkway or driveway, there are several attractive alternatives to concrete
such as wood decking, bricks, interlocking pavers, or flat stones. If used properly these can
create a permeable paving surface that is not as harmful to the environment.
References:
Impervious Surfaces: Prepared by Mary Owens
http://www.dnr.state.md.us/criticalarea/guidancepubs/impervioussurfaces.html
Rainfall, Runoff and Infiltration Re-visited By Richard Allitt, 2003
http://www.environmental-expert.com/articles/article1252/article1252.htm
New Jersey Division of Watershed Management:
www.nj.gov/dep/watershedmgt
Schoolyard Hydro-Ecology Teachers’ Handbook - Baltimore Ecosystem Study
Draft 2 – July 19, 2005 Lesson 3 - page 4
Lesson 3 – Pervious and Impervious Surfaces
Lesson Plan for Teachers: Pervious vs. Impervious
Surfaces
Objectives: Students will learn to describe the difference between pervious and impervious surfaces in order to explain the impact of their use in cities.
Content Standard(s): Please see the “Background” section of the handbook and pick out standards that are appropriate for your grade level.
Read Aloud: Pick a second selection from the “history of asphalt” (attached to schoolyard observation lesson)
Context of Lesson: Students need to understand the difference between pervious and impervious surfaces in order to explore how their use affects water flow in cities.
Vocabulary:
1. pervious: water can soak into or through it 2. impervious: water will not soak into or through it – instead, it pools on top of the
surface or runs off of the surface.
Warm Up: Describe the area around your house or apartment – is it covered with cement, asphalt, grass, or dirt? Why do you think people chose that covering for the area?
Background information: see attached
Materials:
1. Basic runoff lab (slope) materials 2. Runoff Lab with surfaces materials 3. soil percolation lab materials 4. paper to set up student data sheets for each lab
Activities:
1. Students take 5 minutes to complete the warm up, and the teacher reviews the objective for the day with them.
2. Discuss pervious vs. impervious surfaces and make a t-chart on the board showing different pervious and impervious surfaces students can come up with.
3. Labs: you can set the labs up as stations or you can have students do one at a time in small groups. That is up to teacher preference. You may want to do one lab each day and then discuss them as a whole group afterwards.
4. Make sure that students record data from each one of the labs that can be presented in a graph form
5. Independent work time for students to turn data from at least one of the labs into a graph form
6. Discussion of the different labs: what did we learn? 7. Wrap up/review objective/oral quiz on the difference between pervious and
impervious surfaces.
Homework: Compare and contrast pervious and impervious surfaces. You may use a chart if you choose.
Extensions: Brochure on impervious surface removal (attached)

Schoolyard Hydro-Ecology Teachers’ Handbook - Baltimore Ecosystem Study
Draft 2 – July 19, 2005 Lesson 3 - page 5
Lesson 3 – Pervious and Impervious Surfaces
Lesson Plan for Teachers: The Impact of Slope on Runoff
– A Demonstration
Objective: To learn the impact of slope on runoff
Materials:
• Large piece of non-porous material, such as a 12x12 tile
• Metric Ruler
• Stopwatch
• Assorted small objects to prop up under one edge of the tile to create a variety of different
slopes (paper clips, blocks, whatever else is handy)
• Data Table or notebook
• Small Graduated cylinder or measuring cup
• Permanent marker
• Sponge, rag, or paper towels for water cleanup
• Basin
• Food Coloring (optional)
Procedure:
1. Ask students to predict what will happen to 5mL of water when poured in the middle of a flat
tile. Have them record their hypotheses in “if-then” format (If 10mL of water is poured on a flat
surface, then the water will________).
2. Carry out the investigation, having a student time from the moment the first drop of water
hits an ‘X’ in the middle of the tile (use permanent marker for this).
3. The water should stay in roughly the same spot. After students are satisfied that the water has
stopped moving, wipe off the model.
4. Place something such as a paper clip (about 1 mm high) under one edge of the model,
measure the height from the table to the top of the highest edge of the model (cm).
5. Repeat steps 1-3, stopping the timer when the water stops moving.
6. Continue to increase the slope of the surface and running water through the model until a
steep slope is developed and students see the relationship between runoff and slope.
Conclusion:
Students write grade-level appropriate summaries (length, content) of the relationship between
runoff and slope. For older students, have them tie in real-world examples, and relate how this
impacts the community they live in.

Schoolyard Hydro-Ecology Teachers’ Handbook - Baltimore Ecosystem Study
Draft 2 – July 19, 2005 Lesson 3 - page 6
Extensions:
1. Have students calculate the slope of each different trial (remember slope = rise over run).
2. Plot the relationship between runoff time and slope.
Sample Data Table:
Trial Number Height off of the Table (mm) Time (sec) Slope (rise/run)
Schoolyard Hydro-Ecology Teachers’ Handbook - Baltimore Ecosystem Study
Draft 2 – July 19, 2005 Lesson 3 - page 7
Lesson 3 – Pervious and Impervious Surfaces
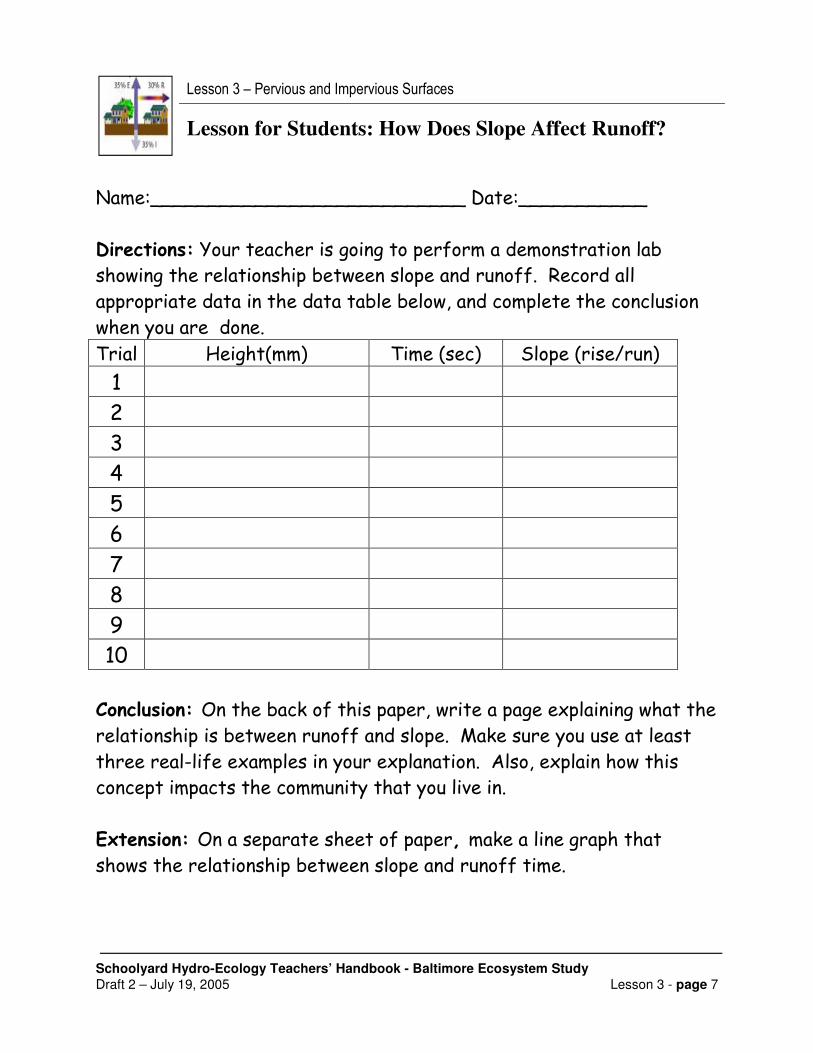
Lesson for Students: How Does Slope Affect Runoff?
Name:___________________________ Date:___________
Directions: Your teacher is going to perform a demonstration lab showing the relationship between slope and runoff. Record all appropriate data in the data table below, and complete the conclusion when you are done. Trial Height(mm) Time (sec) Slope (rise/run)
1 2 3 4 5 6 7 8 9 10
Conclusion: On the back of this paper, write a page explaining what the relationship is between runoff and slope. Make sure you use at least three real-life examples in your explanation. Also, explain how this concept impacts the community that you live in.
Extension: On a separate sheet of paper, make a line graph that shows the relationship between slope and runoff time.
Schoolyard Hydro-Ecology Teachers’ Handbook - Baltimore Ecosystem Study
Draft 2 – July 19, 2005 Lesson 3 - page 8
Lesson 3 – Pervious and Impervious Surfaces
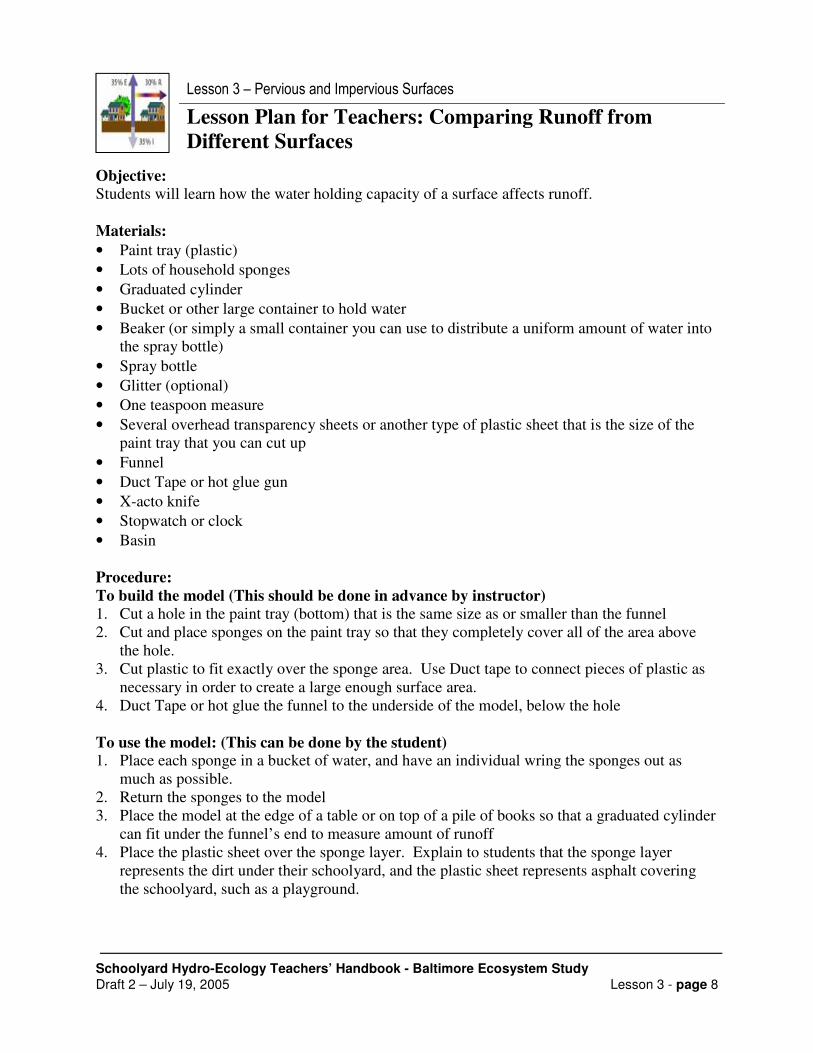
Lesson Plan for Teachers: Comparing Runoff from
Different Surfaces
Objective:
Students will learn how the water holding capacity of a surface affects runoff.
Materials:
• Paint tray (plastic)
• Lots of household sponges
• Graduated cylinder
• Bucket or other large container to hold water
• Beaker (or simply a small container you can use to distribute a uniform amount of water into
the spray bottle)
• Spray bottle
• Glitter (optional)
• One teaspoon measure
• Several overhead transparency sheets or another type of plastic sheet that is the size of the
paint tray that you can cut up
• Funnel
• Duct Tape or hot glue gun
• X-acto knife
• Stopwatch or clock
• Basin
Procedure:
To build the model (This should be done in advance by instructor)
1. Cut a hole in the paint tray (bottom) that is the same size as or smaller than the funnel
2. Cut and place sponges on the paint tray so that they completely cover all of the area above
the hole.
3. Cut plastic to fit exactly over the sponge area. Use Duct tape to connect pieces of plastic as
necessary in order to create a large enough surface area.
4. Duct Tape or hot glue the funnel to the underside of the model, below the hole
To use the model: (This can be done by the student) 1. Place each sponge in a bucket of water, and have an individual wring the sponges out as
much as possible.
2. Return the sponges to the model
3. Place the model at the edge of a table or on top of a pile of books so that a graduated cylinder
can fit under the funnel’s end to measure amount of runoff
4. Place the plastic sheet over the sponge layer. Explain to students that the sponge layer
represents the dirt under their schoolyard, and the plastic sheet represents asphalt covering
the schoolyard, such as a playground.

Schoolyard Hydro-Ecology Teachers’ Handbook - Baltimore Ecosystem Study
Draft 2 – July 19, 2005 Lesson 3 - page 9
5. Sprinkle 1 teaspoon of glitter on the top of the plastic sheet, if desired. Explain that this
represents debris on the ground.
6. Fill up the spray bottle with the appropriate amount of water.
7. For older grades, set up a student to time water running through the model, and another
student to record at intervals (establish) the level of water in the graduated cylinder. Later,
they can use this to create a hydrograph (see below)
8. Begin to spritz the model with water at a consistent rate. Continue until the spray bottle will
spray no more.
9. Continue timing until no more water runs into the graduated cylinder
10. Record the amount of runoff, the surface, and the time it took for the runoff, and amount of
glitter present in the runoff (if used).
11. Remove all parts of the model, rinse out any glitter from the sponges/pan and return the
sponges to the pan. Repeat the procedure above without the plastic sheet in place.
Data Table:
Surface type Amount of Runoff (mL) Time (sec) Glitter?
Plastic (impervious)
Sponge (pervious)
Advanced Data Table Model for Impervious Surface:
Time Total Runoff
discharge(mL)
Discharge in
that interval
0-5 sec
5-10 sec
10-15 sec
15-20 sec
Performance Assessment:
1. Your class wants to start an asphalt removal project at your school. Explain in a letter to the
school board the benefits of asphalt removal. Make sure that your letter explains the difference
between pervious and impervious surfaces, and their effect on runoff.
Extensions:
1. Construct a hydrograph (water discharge over time) for each of the surface types.
2. Use the plastic sheeting and sponge model to illustrate how the school might decrease runoff
by completing a restoration project involving asphalt removal.
3. Compare the effect of removing the same amount of asphalt, but in different arrangements.
Schoolyard Hydro-Ecology Teachers’ Handbook - Baltimore Ecosystem Study
Draft 2 – July 19, 2005 Lesson 3 - page 10
Lesson 3 – Pervious and Impervious Surfaces
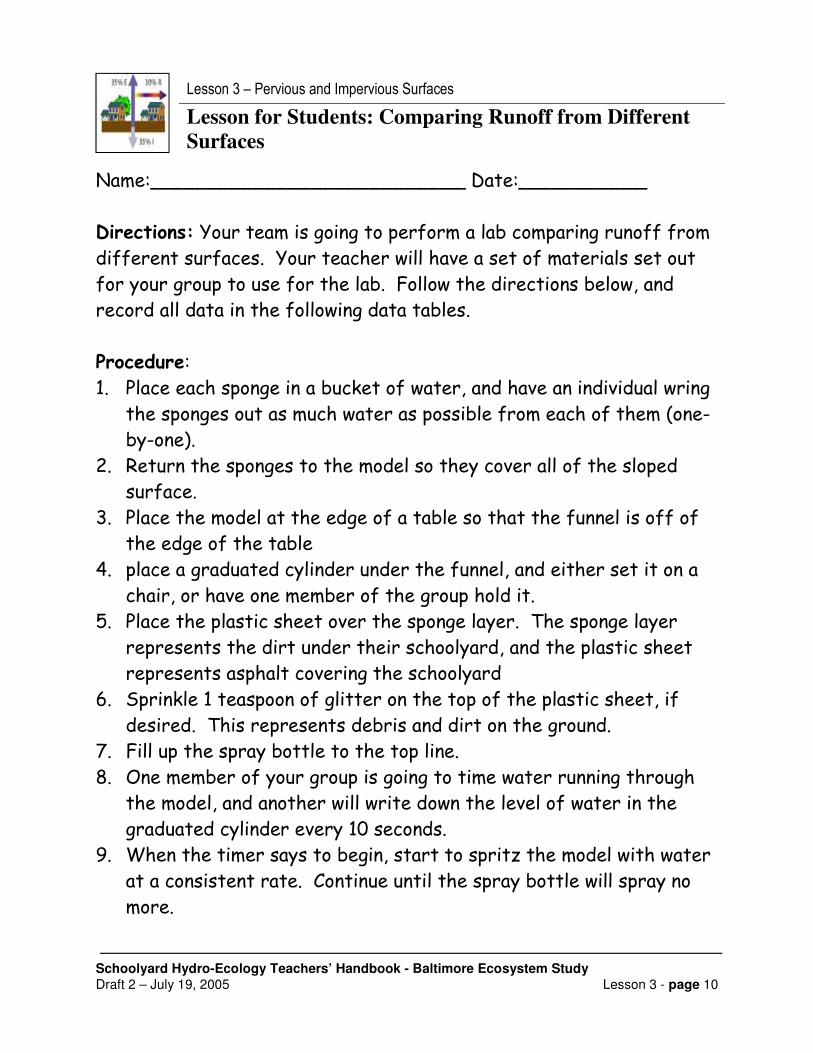
Lesson for Students: Comparing Runoff from Different
Surfaces
Name:___________________________ Date:___________
Directions: Your team is going to perform a lab comparing runoff from different surfaces. Your teacher will have a set of materials set out for your group to use for the lab. Follow the directions below, and record all data in the following data tables. Procedure: 1. Place each sponge in a bucket of water, and have an individual wring
the sponges out as much water as possible from each of them (one-by-one).
2. Return the sponges to the model so they cover all of the sloped surface.
3. Place the model at the edge of a table so that the funnel is off of the edge of the table
4. place a graduated cylinder under the funnel, and either set it on a chair, or have one member of the group hold it.
5. Place the plastic sheet over the sponge layer. The sponge layer represents the dirt under their schoolyard, and the plastic sheet represents asphalt covering the schoolyard
6. Sprinkle 1 teaspoon of glitter on the top of the plastic sheet, if desired. This represents debris and dirt on the ground.
7. Fill up the spray bottle to the top line. 8. One member of your group is going to time water running through
the model, and another will write down the level of water in the graduated cylinder every 10 seconds.
9. When the timer says to begin, start to spritz the model with water at a consistent rate. Continue until the spray bottle will spray no more.
Schoolyard Hydro-Ecology Teachers’ Handbook - Baltimore Ecosystem Study
Draft 2 – July 19, 2005 Lesson 3 - page 11
10. Continue timing until no more water runs into the graduated cylinder (not just when they are done spritzing
11. Record the total amount of runoff, the surface, and the time it took for the runoff, and amount of glitter present in the runoff (if used).
12. Remove all parts of the model, rinse out any glitter from the sponges/pan and return the sponges to the pan. Repeat the procedure above without the plastic sheet in place.
Data Analysis: Using Microsoft Excel, you are responsible for constructing a hydrograph. A hydrograph shows the water collected from the model over time.
Directions: 1. Open Excel 2. Put the two columns on the right hand side of your data table into
the spreadsheet. Title the first column “With Plastic (impervious)” and the second column “No Plastic (pervious)”. You don’t have to worry about font size or anything like that
3. Click on the “Chart Wizard” button 4. Select “LINE” as the chart type 5. Choose the type of line chart you would like to draw 6. Click “Next” 7. Give the chart a title, and label the y-axis as time (sec) and the
x-axis as Water Discharged (mL) 8. Click Finish. Your hydrograph should look similar to the one
below, however the two lines on the graph will be much different looking than these, since this chart wasn’t made with real data.

Schoolyard Hydro-Ecology Teachers’ Handbook - Baltimore Ecosystem Study
Draft 2 – July 19, 2005 Lesson 3 - page 12
Hydrograph
0
10
20
30
40
50
60
70
1 2 3 4 5 6 7
Water Discharged (mL)
Tim
e
With Plastic
(impervious)
No Plastic (pervious)
Performance Assessment:
Your class wants to start an asphalt removal project at your school. Explain in a letter to the school board the benefits of asphalt removal. Make sure that your letter explains the difference between pervious and impervious surfaces, and their effect on runoff.
Extensions:
1. If you are interested in learning more about how surfaces affect runoff, compare the effect of removing parts of the asphalt but not all of it (cut holes in the plastic sheeting, once receiving approval from your teacher). Follow the same lab procedure as outlined above.
2. Compare the effect of removing the same amount of asphalt in different places/patterns.

Schoolyard Hydro-Ecology Teachers’ Handbook - Baltimore Ecosystem Study
Draft 2 – July 19, 2005 Lesson 3 - page 13
Data Table:
Time (sec)
Amount of Water(mL) With Plastic down
Amount of Water With No Plastic (mL)
10 20 30 40 50 60 70 80 90 100 110 120 130 140 150 160 170 180 190 200 210 220 230 240 250 260

Schoolyard Hydro-Ecology Teachers’ Handbook - Baltimore Ecosystem Study
Draft 2 – July 19, 2005 Lesson 3 - page 14
270 280 290 300 310 320 330 340 350 360 370 380 390 400
Surface type Runoff (mL) Time (sec) Glitter?
Plastic (impervious)
Sponge (pervious)

Schoolyard Hydro-Ecology Teachers’ Handbook - Baltimore Ecosystem Study
Draft 2 – July 19, 2005 Lesson 3 - page 15
Lesson 3 – Pervious and Impervious Surfaces
Lesson for Students: Infiltration in Soil
Schoolyard Hydro-Ecology Teachers’ Handbook - Baltimore Ecosystem Study
Draft 2 – July 19, 2005 Lesson 3 - page 16
Lesson 3 – Pervious and Impervious Surfaces
Lesson for Students: Soil Water Studies
Source Alan Berkowitz, Institute of Ecosystem Studies.
Questions • How much water does soil hold? • What determines how much water soil holds? • What happens to water the enters pervious surfaces (soil) from
impervious surfaces?
Overview Soil holdS water, slowing it down where it might otherwise move quickly over the land surface or down into the groundwater. The water holding capacity of soils helps protect streams from the detrimental effects of rapid floods following rain and snowfall, and snow melt. It also gives the water a chance to interact with the living and physical components of the soil where pollutants might be removed or altered. In this study, you will learn how to measure the amount of water in soil. Then, you’ll have a chance to look at several areas in your schoolyard ecosystem and find out if water is being added to the soil from nearby impervious surfaces.
Materials In field: G soil corer G 30 m tape for locating sample spots G ca. 20 ziplock freezer bags (1 qt.) G permanent marker for marking bags G map or air photo of school grounds to locate sampling spots G optional flagged stakes to mark sampling spots In lab: G paper bags o G scale for weighing wet and then dried soil samples G drying oven at 60 degrees centigrade

Schoolyard Hydro-Ecology Teachers’ Handbook - Baltimore Ecosystem Study
Draft 2 – July 19, 2005 Lesson 3 - page 17
Procedure 3 A. Decide on what comparison you want to make, then select
sampling spots. 1. Select spots to study based upon your question, e.g., if your
question is, “How much water is in soil near paved areas sloping towards versus paved areas sloping away from the soil?,” then find at least one location that satisfied each condition but where all other conditions are as similar as possible. Or if your question is, “How much water is in soil near a driveway versus further away?”, then find you might establish transects and sample at random or regular intervals from right near the driveway to farther away.
2. Choose at least two spots for (as replicates) each of the two+ situations you've decided to focus on. All spots should be as similar as possible in all ways other than the variable condition your comparing in your study.
3. Mark each spot with a flagged stake if possible, and then take a photo to demonstrate the contrast you are examining in your study.
3 B. Soil samples for soil moisture determination.
1. Push soil corer into the ground to the pre-determined depth (5 cm is easy, 10 cm is better, 15 cm is best but probably too hard). You may have to try several locations near your chosen spot to find a place where you don’t hit rocks and can get to the desired depth.
2. Twist the corer to separate the sample cleanly from the surrounding soil and then remove it carefully from the soil. MAKE SURE TO KEEP THE CORER HORIZONTAL ONCE IT IS REMOVED WITH THE OPENING OF THE CORER FACING UP AND THE SAMPLE IN TACT.
3. Carefully push the sample up into the open part of the corer, and remove the small amount of vegetation and litter at the top of the sample (you want just the soil part of the sample).
4. Carefully pour the sample into an open Ziploc bag and then seal bag.
5. Mark the bag with the appropriate label.

Schoolyard Hydro-Ecology Teachers’ Handbook - Baltimore Ecosystem Study
Draft 2 – July 19, 2005 Lesson 3 - page 18
Procedure(continued)
3 C. Determine soil moisture content of samples.
1. Weigh wet soil sample in sealed Ziploc bag and record weight.
2. Empty bag into a labeled paper lunch bag, turning plastic bag inside out and including it in the paper bag.
3. Place paper bags in a drying oven, ideally at 60ºC. 4. Dry for 3 days. 5. Weigh dry soil sample with bags. 6. Discard soil sample and then weigh the two bags empty.
3 D. Calculate soil moisture content. 1. One way of expressing soil moisture content is by weight.
The formula is: [(weight of water)/(weight of dry soil)]*100, which can be calculated: [(sample weight wet – sample weight dry)]/(sample weight dry – weight of bags)]*100.
2. Another way to express soil moisture content is by volume. In order to do this, first measure the diameter of the soil corer, and determine the volume of the sample you took (e.g., volume (cc) = (0.5*diameter (cm))² * 3.14 * height of sample (cm)). Then calculate volumetric water content of the sample: [(sample weight wet – sample weight dry)]/(volume of sample)]*100.
3. A third way to express soil moisture is by depth. In order to do this, first measure the diameter of the soil corer, and determine the area of the sample you took (e.g., area (cm²) = (0.5*diameter (cm))² * 3.14). Then calculate depth of water in the sample: [(sample weight wet – sample weight dry)]/(area of sample)].
Schoolyard Hydro-Ecology Teachers’ Handbook - Baltimore Ecosystem Study
Draft 2 – July 19, 2005 Lesson 3 - page 19
Lesson 3 – Pervious and Impervious Surfaces
Lesson for Students: Creating a Brochure about
Removing Impervious Surfaces
A brochure is an inexpensive yet effective tool people use to dispense information. They can be used to advertise, educate, persuade, or inform. Brochures are usually made of pieces of paper folded twice in order to organize the space into different sections. You will be making a brochure informing your community of the upcoming impervious surface removal at your school and educating them about how runoff pollution reaches the Chesapeake Bay through storm drains. That is a lot to cover on a small piece of paper, so we will go step by step through the information that should be included in each section. Once you complete this worksheet, write the information, IN YOUR OWN WORDS, onto the attached brochure template. Add any drawings or diagrams that you think will make your brochure more powerful and helpful.
Your brochure, like most brochures, will look like this:
(paper is folded twice so there are 3 panels on each side)
Let’s go through the pages as they are numbered above one at a time and think about what should be included on each. Certain information will need to be on everyone’s brochure. This information is already printed on the appropriate pages for you. Page 1: Title Page When creating the title of the brochure, be clear and succinct (not too wordy). You want to get your readers attention without making them

Schoolyard Hydro-Ecology Teachers’ Handbook - Baltimore Ecosystem Study
Draft 2 – July 19, 2005 Lesson 3 - page 20
read a long sentence. Reread the first paragraph on this page. What is the topic of this brochure? ________________________________ You might want your title to be straight forward, or you might want it to be catchy. Don’t be afraid to be creative! Once you come up with your title, write it onto page 1 either above or below the box. Use the space inside the box to draw a picture that you think will help make the subject of the brochure more clear to the reader. Page 2: Introduction This is probably the first page the reader will look at when he or she opens the brochure up. That makes this an ideal place for you to introduce the purpose of the brochure and outline any background information they will need to know in order to understand the rest of the brochure. If you can answer the following questions, you are well on your way to writing a good introduction. What is the purpose of this brochure? (hint: there are two, look for them in the first paragraph on this page) _________________________________________________
Who is your audience? _______________________
This brochure is about something that will be happening in your community to help fix a problem. What is the problem we are trying to fix? Be specific.
_________________________________________________

Schoolyard Hydro-Ecology Teachers’ Handbook - Baltimore Ecosystem Study
Draft 2 – July 19, 2005 Lesson 3 - page 21
Why should the reader care?
_____________________________________________________
_____________________________________________
After you have answered these questions, use your answers and any other ideas you want to include to write an organized paragraph that will serve as your introduction. Copy it into the brochure on page 2, adding any graphics you see fit. Page 3: The Specifics So far we’ve told the reader that there is a problem that we feel needs to be addressed, now let’s tell them what is going to be done about it. This page should give details about the main idea of the brochure. Use the following questions to help you think of information that should be included here. What is being done to help correct the problem we talked about in the introduction? _____________________________________________________
_____________________________________________
How will this help?
_____________________________________________________
_____________________________________________
When is it happening?
________________________________________
Where is it happening?
_______________________________________
How can the reader get involved?
_________________________________________________

Schoolyard Hydro-Ecology Teachers’ Handbook - Baltimore Ecosystem Study
Draft 2 – July 19, 2005 Lesson 3 - page 22
What other information should the public know?
_____________________________________________________
_____________________________________________
Once you’ve assembled this information, write it onto page 3. It doesn’t need to be in paragraph form, but make sure it is organized so that it is easy to understand and you like how it looks!
Page 4: Facts Hopefully your audience will be interested by this point and will want to know more information. Use this page to list any facts that might answer further questions the reader may have or convince them of the importance of this project. Think about what you have learned from the activities you have done with the Living Classrooms Foundation teachers (the runoff model, the water cycle, the history mystery), and what facts about the topic struck you as interesting or made you want to learn more. Use the space below to brainstorm and create a list of facts you might want to include. If your having trouble, use the questions on the next page to help you. The answers to any of those questions would make great facts to include in your brochure. Choose your three favorites (or more!) and write these facts on page 4 of your brochure. _________________________________________________
_________________________________________________
_________________________________________________
_________________________________________________
_________________________________________________
_________________________________________________
_________________________________________________
Schoolyard Hydro-Ecology Teachers’ Handbook - Baltimore Ecosystem Study
Draft 2 – July 19, 2005 Lesson 3 - page 23
Page 5: Partners Whether you know it or not, there are a lot of organizations involved in bringing this project to your school. This page lists them in case the reader is interested in finding out more about related projects. It’s like the credits after a movie! These organizations include: the Living Classrooms Foundation, Baltimore City Public Schools, the Parks and People Foundation, the National Oceanographic and Atmospheric Administration (NOAA), the Department of Recreation and Parks, and the City of Baltimore. Look them up to find out what these organizations are all about! Just the facts, ma’am: Use this list of questions to help you come up with facts to be included on page 4 of your brochure. How does the type of things we put on our land (roads, buildings, gardens, etc.) affect the quality and quantity of our runoff? What is a watershed? Do you have to live right next door to the Bay to have and affect on its health? Explain. How has Baltimore’s landscape changed throughout history? How does this affect the runoff coming from the city?

Schoolyard Hydro-Ecology Teachers’ Handbook - Baltimore Ecosystem Study
Draft 2 – July 19, 2005 Lesson 3 - page 24
What is the biggest source of pollution to the Chesapeake Bay? Does water go to the same place after it flows into storm drains as it does after it flows down your sink drain?