Embed Size (px)
Citation preview

Journal of ASTM International, Vol. 8, No. 1Paper ID JAI103033
Available online at www.astm.org
Kimberly B. Colas,1 Arthur T. Motta,1 Mark R. Daymond,2 Matthew Kerr,2 andJonathan D. Almer3
Hydride Platelet Reorientation in Zircaloy Studied withSynchrotron Radiation Diffraction
ABSTRACT: Hydrogen ingress into zirconium alloy fuel cladding in light water reactors can degrade clad-ding performance as a result of the formation of brittle hydrides. In service, hydrides normally precipitate inthe circumferential direction and are homogeneously distributed through the cladding thickness in idealcases. However, temperature and stress gradients in the cladding can promote hydrogen redistribution.This hydrogen redistribution is responsible for the formation of hydride rims, dissolution, and reorientationof hydride precipitates and for the formation of brittle hydrides at stress concentration locations, all of whichcan reduce cladding resistance to failure. Thus, it is crucial to understand the kinetics of hydride dissolutionand precipitation under load and at temperature. Studies of hydrogen behavior in zirconium alloys arenormally performed post facto, which causes them to suffer both from a scarcity of data points and from theconfounding effects of studying hydrides at room temperature that might be dissolved at higher tempera-ture. In the current study, we have used synchrotron radiation diffraction to study the kinetics of hydrideprecipitation and dissolution in situ �under load and at temperature�. Samples of hydrided Zircaloy-4 wereexamined in transmission by using 80 keV synchrotron radiation while undergoing heating and cooling in afurnace. Temperatures ranged from 20 to 550°C, and loads from 75 to 100 MPa were applied. The hydridesdissolved and reprecipitated in a different orientation when sufficiently high loads were applied. Throughcareful study of the intensities and full-width half maxima of the diffraction peaks as a function of time, load,and temperature, it was possible to identify the characteristic diffraction patterns for the reoriented hydridesso that the kinetics of dissolution, reprecipitation, and orientation of the hydrides could be followed. Theanalysis of the diffraction patterns allowed a detailed understanding of the kinetics of hydride evolutionunder temperature and stress, as presented in this work.
KEYWORDS: zirconium hydrides, reorientation, synchrotron radiation diffraction, strain broadening
Introduction
Zirconium alloys used for reactor core structural components and fuel cladding can be embrittled by thepresence of zirconium hydride precipitates, which form as a result of hydrogen ingress due to the phe-nomena associated with reactor corrosion and water radiolysis �1�. The hydrides observed in fuel claddingexposed to reactor environment are most often face-centered-cubic �-hydrides ZrHx �where x�1.6� �2�,although �- and �-hydrides are occasionally observed �3,4�. �-hydrides are shown by electron microscopyto be platelet-shaped and to form with a near �111�� � �0002�� orientation relationship with the �-zirconiummatrix �5�. The larger hydride plates observed optically have been reported to be constituted of a stackingof several of these smaller platelets �6�. The orientation and morphology of these larger hydrides plates areprimarily dependent on the zirconium matrix microstructure, thermal history, and stress state �both appliedand residual�. During drying and storage, high temperatures �of up to 400°C� can be attained, and part ofthe hydride population can dissolve and reprecipitate with a different orientation. In the absence of anapplied stress field, hydride precipitation is dependent on the texture of the zirconium matrix and isgoverned by the orientation of the last compressive step in the thermo-mechanical treatment which nor-mally results in planar or “circumferential” hydrides �7�. However, the presence of a sufficiently highapplied tensile stress field �typically starting at around 80 MPa� during cooling causes the hydride plateletsto precipitate preferentially perpendicular to the applied tensile stress direction. The level of applied stressrequired for hydride reorientation depends on the microstructure, prior processing, and hydrogen concen-
Manuscript received February 8, 2010; accepted for publication October 23, 2010; published online December 2010.1 Dept. of Mechanical and Nuclear Engineering, Penn State Univ., University Park, PA 16802.2 Dept. of Mechanical and Materials Engineering, Queen’s Univ., Kingston, ON K7L 2N8,Canada.3
Advanced Photon Source, Argonne National Laboratory, Argonne, IL 60439.Copyright © 2011 by ASTM International, 100 Barr Harbor Drive, PO Box C700, West Conshohocken, PA 19428-2959.
2 JOURNAL OF ASTM INTERNATIONAL
tration as well as thermo-mechanical loading �8�. Because of this, concern has arisen that such hydridereorientation could occur during dry storage of spent fuel, especially in the case of high burn-up andcorresponding high hydrogen concentrations, causing the fuel cladding to become more brittle. As a result,an understanding of hydride reorientation phenomena is of great technological importance.
Most analyses of changes in hydride microstructure have been performed post facto, at room tempera-ture, and after applied stress has been removed. Typically, the hydride orientation is determined by usingmetallography before and after the heating/loading cycles �9–11�. It would be of great interest to combinethe post facto metallographic techniques with in situ measurements of hydride reorientation. Recent stud-ies using high energy synchrotron X-ray diffraction have demonstrated that it is possible to observezirconium hydride phases and to distinguish the crystallographic nature of the hydride phases present ��from �, for example� �12�. The strain measurements of zirconium hydrides embedded in a zirconium alloymatrix have also been conducted, both in the bulk and at notch tips �13,14�. Synchrotron measurementshave proven to be reliable in measuring internal strains, comparing favorably to measurements made atneutron diffraction sources �15,16�. The advantage of a synchrotron source is that these measurements canbe made with shorter exposure times and with higher resolution, owing to the high photon flux available.In addition, high energy beams allow the examination of thicker samples.
The in situ synchrotron diffraction experimental set-ups such as the one presented in this paper couldbe used to study many essential features of the behavior of hydrides under temperature and stress. In thisstudy, high energy X-rays were used in transmission to obtain diffraction data while the sample was loadedat temperature. These techniques were used to observe hydride reorientation in the matrix of zirconiumalloys during heating and cooling cycles under stress. Further experiments could be conducted involvingfull reorientation of the entire population of hydrides, multiple temperature cycles to study the possiblememory effect on hydride precipitation, and/or materials with composition and textures differences. Thework on the determination of the terminal solid solubility of hydrogen using this technique has also beenperformed and will be published elsewhere. The aim of this study is to follow the process of hydridereorientation in situ by using synchrotron X-ray diffraction.
Experimental Procedures
Material and Sample Preparation
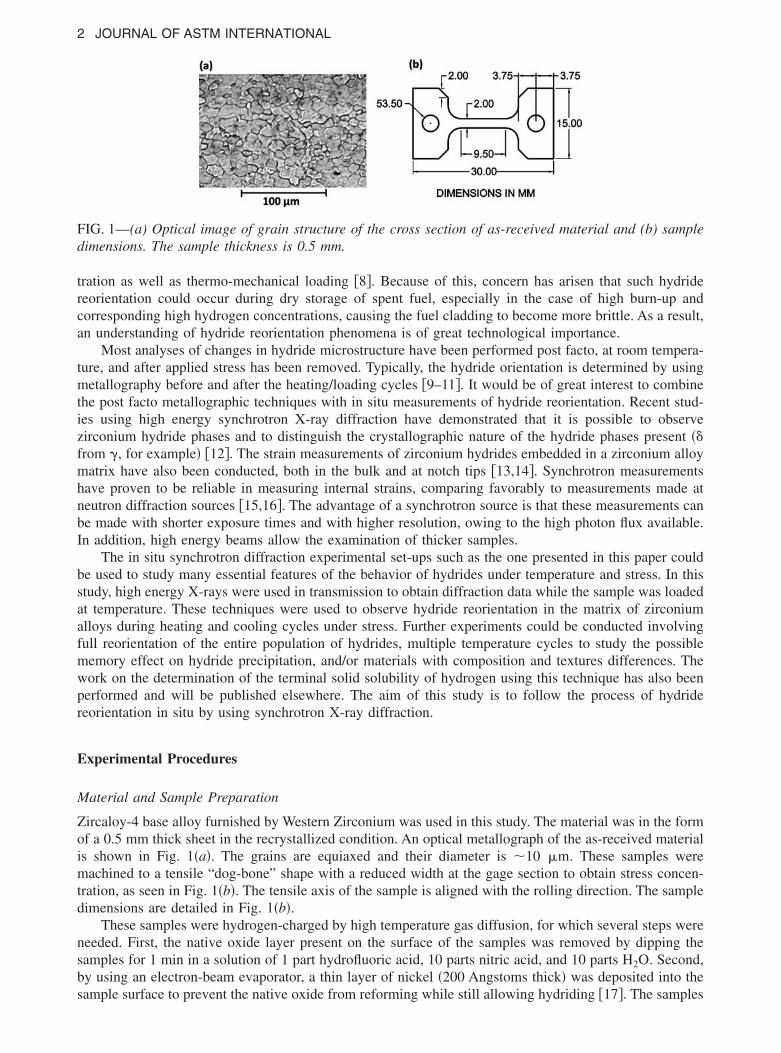
Zircaloy-4 base alloy furnished by Western Zirconium was used in this study. The material was in the formof a 0.5 mm thick sheet in the recrystallized condition. An optical metallograph of the as-received materialis shown in Fig. 1�a�. The grains are equiaxed and their diameter is �10 �m. These samples weremachined to a tensile “dog-bone” shape with a reduced width at the gage section to obtain stress concen-tration, as seen in Fig. 1�b�. The tensile axis of the sample is aligned with the rolling direction. The sampledimensions are detailed in Fig. 1�b�.
These samples were hydrogen-charged by high temperature gas diffusion, for which several steps wereneeded. First, the native oxide layer present on the surface of the samples was removed by dipping thesamples for 1 min in a solution of 1 part hydrofluoric acid, 10 parts nitric acid, and 10 parts H2O. Second,by using an electron-beam evaporator, a thin layer of nickel �200 Angstoms thick� was deposited into the
FIG. 1—(a) Optical image of grain structure of the cross section of as-received material and (b) sampledimensions. The sample thickness is 0.5 mm.
sample surface to prevent the native oxide from reforming while still allowing hydriding �17�. The samples

COLAS ET AL. ON HYDRIDE PLATELET REORIENTATION IN ZIRCALOY 3
were then hydrogen-charged in a vacuum furnace using a mixture of 12 % hydrogen and 88 % argon,introduced at 450°C. Several temperature cycles were necessary to charge to the desired levels of hydro-gen. The total time at 450°C was 3 h, so no significant recrystallization occurred �18�. The final hydrogencontents of the sample were measured by hot vacuum extraction performed by Luvak, Inc. The samplesused in this study were charged to 525�10 wt ppm of hydrogen.
After hydrogen-charging, metallography was performed to characterize the hydride morphology. Thesamples were mounted in a cross section in epoxy casts and mechanically polished to 1200 grit siliconcarbide paper, followed by chemical etching using the same solution used for oxide layer removal. Thissolution preferentially etched the zirconium hydrides, which allowed their observation by using opticalmicroscopy. One example of such an examination is shown in Fig. 2 for a sample with 525 wt ppm ofhydrogen. It is seen that in the initial state, the hydride platelets �dark lines� are mostly perpendicular to thenormal direction �ND�, and thus they are in-plane, or circumferential hydrides. The hydride orientationwas estimated using image analysis. Each individual particle was counted as a circumferential hydride, amixed hydride, or a radial hydride. The circumferential hydrides were those whose normals were orientedbetween 0° and 40° from the ND �or radial direction for a cladding tube�, the mixed hydrides were thosewhose normals were oriented between 40° and 65° from the ND, and the radial hydrides were those whosenormals were oriented between 65° and 90° from the ND �19�.
Temperature and Load
While being analyzed by synchrotron X-ray diffraction, the samples underwent heating and cooling cyclesunder load. The samples in this study were heated up to 550°C in order to dissolve all the hydrides in thematrix �the solubility of hydrogen in zirconium at 550°C is about 640 wt ppm �20��, then cooled back toroom temperature under tensile load applied in the rolling direction �RD�. An example of a typicaltemperature/load run is shown in Fig. 3. Each sample was cycled only once, and the time at maximumtemperature �550°C� was at most 15 min, so no significant grain growth or recrystallization has occurred�18�. The testing temperature was controlled by using an optical furnace and the sample temperature wasmonitored by using K-type thermocouples, which were spot welded into the sample surface. The MTS®
FIG. 2—Optical metallograph of a Zircaloy-4 sample hydrided to 525 wt ppm. The sample orientation isrepresented by the black arrows.
frame used for tensile testing allowed the computer monitoring of the applied load and the displacement or

4 JOURNAL OF ASTM INTERNATIONAL
the displacement rate of the crosshead. The applied �engineering� stress was determined by dividing theapplied force by the initial gage cross section.
Synchrotron Data Acquisition
The X-ray diffraction examination of the samples was conducted at beamline 1-ID at the Advanced PhotonSource at Argonne National Laboratory with the objective of observing the dissolution and precipitationkinetics of the zirconium hydrides. The experimental geometry is described in Fig. 4. The experimentswere conducted in transmission geometry by using 80 keV X-rays ��=0.015 nm� and a beam size of0.3�0.3 mm2 �21�. This experimental set-up allows the observation of the hydride diffracted intensity asthe sample is heated or cooled under load. A high-speed area detector �1 s time resolution� was used tocollect diffraction patterns, allowing the full diffraction rings to be recorded. Because the data was ob-tained in transmission, the diffraction signal is averaged over the full sample thickness. The diffractionrings can be integrated over their full circumference or over selected angular ranges to obtain the diffractedintensity from planes oriented in particular directions of interest relative to the macroscopic sampledirections. A typical diffraction pattern integrated over the full circumference for a sample with 525wt ppm of hydrogen is presented in Fig. 5. For this study, it was chosen to integrate the diffraction rings
FIG. 3—Typical in situ heat/load cycle.
FIG. 4—Experimental set-up of beamline 1-ID. The integration directions are indicated on the area
detector.
COLAS ET AL. ON HYDRIDE PLATELET REORIENTATION IN ZIRCALOY 5
around specific orientations close to the RD and transverse direction �TD� as illustrated in Fig. 4. Thediffraction signals from the “TD” come from crystallographic planes with normals parallel to the TD�within a �10° angular range around the TD� and diffraction signals in the “RD” come from crystallo-graphic planes, which have their normals parallel to the RD �in a �10° angular range around the RD�.
Synchrotron Data Analysis
The typical raw data obtained during this experiment was in the form of ten two-dimensional imagessuccessively obtained using the plate detector for each diffraction pattern recorded �this was necessary toavoid saturation of the detector for the high intensity Zr peaks while still obtaining good statistics for theweak hydride peaks�. The ten images were summed and averaged to create the diffraction pattern. Usinga computer routine, the full diffraction rings were integrated over four specific angular ranges of �10°around 0°, 90°, 180°, and 270°. The data from the angular ranges obtained was then averaged �average ofthe sum of 0° and 180° ranges �RD� and average of the sum of 90° and 270° ranges �TD�� and reduced toa file suitable for analysis. The diffraction peaks obtained were then analyzed by using a single peak fittingroutine available within the GSAS/Rawplot® program �22�. General structure analysis system �GSAS� isprimarily a Rietveld refinement program that can fit all the different parameters that would affect peakheight, shape and position. Rawplot is a subroutine that allows faster fitting of only the peak shape,position and intensity of the raw data. The peaks were fitted using a pseudo-Voigt function, which is aconvolution of Gaussian and Lorentzian peak shapes. In the GSAS fitting routine, the Lorentzian full-width at half maximum �FWHM� was kept constant, while the Gaussian FWHM was allowed to vary; theLorentzian FWHM is normally associated with instrumental broadening �which was determined indepen-dently in this study by using a calibration powder to be 0.22�10−2 degrees in 2�, whereas the GaussianFWHM is normally associated with sample broadening, such as size or strain broadening �23�. Thebackground was fitted over the entire diffraction range by using a third-degree polynomial function andsubtracted from the data prior to fitting. This allowed iterative fitting of the diffraction peaks to obtain �i�the peak positions, �ii� the integrated intensity, and �iii� the Gaussian FWHM of the refined peaks. Theinstrumental broadening was determined by running a ceria standard powder used as a reference forbroadening and subtracted in quadrature from each peak to isolate the sample contribution to line broad-ening. When measured under stress, the peak positions can be related to the elastic strain of the diffractingcrystallites, while peak broadening can originate from various causes, including size broadening, inhomo-geneous elastic strain, and from plastic strain broadening �23�.
Results and Discussion
As explained in the previous section, the analysis of the diffraction data yields peak positions �and thus
FIG. 5—X-ray diffraction pattern of a Zircaloy-4 material sample with 525 wt ppm of hydrogen (logarith-mic scale).
d-spacing�, integrated intensities, and FWHM for each peak. As mentioned above, these values can be

6 JOURNAL OF ASTM INTERNATIONAL
obtained by integration over the full diffraction ring or along portions of the ring oriented along particulardirections. As a sample is heated and cooled under load, diffraction patterns are constantly recorded,enabling us to observe each of the parameters mentioned above as a function of time. The evolution of theabove parameters with time allows us to follow the evolution of strain and stress of the phases present asa function of temperature and applied load. It should be noted, however, that the strain �and resultingstress� is calculated from the d-spacing shift and peak broadening and is not directly measured in ourexperiment.
X-Ray Diffraction Patterns
The diffraction pattern presented in Fig. 5 results from integration over the full diffraction ring of a samplecontaining 525 wt ppm of hydrogen. The �-zirconium and �-hydride peaks were indexed using expectedd-spacing values from the powder diffraction files indicated in Table 1 from Ref 2. Three �-hydride peaks�111��, �200��, and �220�� and five �-zirconium peaks are observed. For the zirconium matrix, the intensityof the �002�� peak is small compared to that of the �100�� and �101�� peaks �the prism planes and thepyramidal planes, respectively�. This results from the basal texture created upon cold rolling, causing thebasal poles to be preferentially aligned along the ND, and thus not in a strong diffraction condition in ourtransmission set-up. Table 1 shows a comparison of the peak positions determined from the experimentand those from the respective powder diffraction files. The �-zirconium peaks correspond well to thepowder diffraction files, to the fourth significant digit, while the �-hydride peaks agree to the thirdsignificant digit. The difference between the observed and theoretical peak position in the hydrides couldindicate that the hydrides are elastically strained in the compressive direction due to the thermal expansionmismatch between the hydrides and the �-zirconium matrix or that the hydrides have a slightly differentstoichiometry than that reported in the literature.
If it is assumed that such a d-spacing change is caused by elastic strain, it is possible to estimate thestresses. When integrating the diffraction data obtained for this sample along the two particular directions,TD and RD, we obtain information on planes that are oriented perpendicular to these directions. Figure 6shows the diffraction patterns integrated over the TD and RD for the sample shown in Fig. 5 �525 wt ppmof hydrogen�. Only the 2 region encompassing the �111�� and the �100�� peaks is shown. The expectedpeak positions from Ref 2 are represented by the solid vertical lines. While the zirconium matrix peak isclose to the expected peak position, the �-hydride peak is shifted towards a lower d-spacing, suggestingthat the hydrides precipitate particles are under a compressive strain. This is true both for hydrides orientedin the TD and the RD. The strain can be calculated from this difference in d-spacing by the following
TABLE 1—Measured and expected peak positions for a Zircaloy-4 sample with 525 wt ppm of hydrogen (for two integration directions)for an X-ray energy of 80 keV. PDF stands for powder diffraction file, which serve as a reference for our phases [2].
Phase HKL Integration Direction Powder Diffraction Files Values �°� Experimental 2 �°� Difference �%�
�-Zr�PDF number: 5-0665�
100 TD 3.1461 3.1460 0.0032
RD 3.1461 3.1447 0.0445
�-hydride�PDF number: 34-0649�
111 TD 3.1894 3.2032 0.4327
RD 3.1894 3.2030 0.4264
�-Zr�PDF number: 5-0665�
002 TD 3.4213 3.4191 0.0643
RD 3.4213 3.4211 0.0058
�-Zr�PDF number: 5-0665�
101 TD 3.5800 3.5800 0.0000
RD 3.5800 3.5774 0.0726
�-hydride�PDF number: 34-0649�
200 TD 3.6818 3.6877 0.1602
RD 3.6818 3.6853 0.0951
�-Zr�PDF number: 5-0665�
102 TD 4.6484 4.6460 0.0516
RD 4.6484 4.6446 0.0817
�-hydride�PDF number: 34-0649�
220 TD 5.2098 5.2352 0.4875
RD 5.2098 5.2334 0.4530
�-Zr�PDF number: 5-0665�
110 TD 5.4486 5.4513 0.0496
RD 5.4486 5.4484 0.0037
formula:

COLAS ET AL. ON HYDRIDE PLATELET REORIENTATION IN ZIRCALOY 7
� = �dmeasured − dPDF�/dPDF �1�
where:�=strain,dmeasured=d-spacing measured from X-ray diffraction, anddPDF=d-spacing reported in Ref 2.For the TD we find �TD= �2.752−2.76� /2.76=−2.9�10−3, and for the RD we find �RD= �2.747
−2.76� /2.76=−4.7�10−3. Using the values of �100 GPa for the elastic constant of the �-hydride �24�and �0.322 for Poisson’s ratio for the hydrides �25�, the stresses were calculated in the two directionsbased on a tri-axial stress state. Using the plane strain assumption to account for the condition in theun-measured ND direction, we obtain �TD=740 MPa in compression in the TD and �RD=870 MPa incompression in the RD. For a plane stress condition, we find �TD=490 MPa in compression in the TD and�RD=630 MPa in compression in the RD. The actual stress state in the hydrides will be somewherebetween the values obtained for the assumptions of plane stress and plane strain. Given the geometry ofthe hydrides platelets and the preferential orientation relationship between the hydrides and the matrix inthe ND, we expect the hydrides to be closer to a plane strain condition than plane stress. Given the planestrain assumption, we obtain a maximum stress component of 870 MPa �in compression� that can becompared to the value of �800 MPa obtained by Kerr et al. for hydride fracture under a tensile appliedload �26�. To compare the measured values with a yielding condition, we calculate the von Mises equiva-lent stress for a plane strain assumption �308 MPa� and for a plane stress assumption �570 MPa�, both aresomewhat below the hydride yield stress measured by Puls et al. of �500–800 MPa for hydride plasticityat room temperature using microhardness indentation �24�.
A compressive stress state is expected for the hydrides since under stress-free conditions, since thehydride phase is less dense than the zirconium matrix from which it is formed �i.e., undergoes a volumeexpansion relative to the matrix�. The fact that the hydride planes are slightly more stressed in the RD thanin the TD could be due to the difference in the basal plane fraction in these two directions. If a directioncontains a higher percentage basal poles aligned with it �within �10°�, then the thermal expansion coef-ficient will be different in this direction compared to the other directions due to the anisotropic propertiesof zirconium �18�, which could lead to small differences in the compression of the hydride planes as theyprecipitate upon cooling. In our sample, there is a higher fraction of basal poles parallel to the RD �typicalrecrystallized texture �18��, thus leading to a larger thermal expansion coefficient and to higher compres-sive strains in the hydride in that direction.
FIG. 6—X-ray diffraction pattern of the two integration slices of a Zircaloy-4 sample with 525 wt. ppm ofhydrogen (respective TD and RD angles of �10°). The expected peak position for ��111� and ��100� arerepresented by the solid vertical lines.
The observation of the evolution of peak position and FWHM has been carried out systematically for

8 JOURNAL OF ASTM INTERNATIONAL
samples that showed reoriented hydrides after thermal cycling under load and for samples that did not.Figures 7 and 8 compare the �111�� and �220�� hydride peaks for a sample that was heated and cooledunder an applied tensile load of 75 MPa along the RD �no reorientation�. In Fig. 7, it is observed that the�111�� peaks in the TD and the RD are initially of the same width and located approximately at the samepeak position. After applying load in the RD, the �111�� peak in the RD appears to have shifted to a largerd-spacing, which is consistent with the fact that the planes in the RD are in tension. On the contrary, theplanes in the TD have shifted towards a smaller d-spacing, implying that those planes are in compression.This is consistent with the fact that as a tensile load is applied in the RD, Poisson’s ratio implies that theplanes perpendicular to the RD �such as the TD planes� would be compressed. The same behavior isobserved in the �220�� planes �Fig. 8�. The RD planes shift to larger d-spacing �and thus they are intension�, while the TD planes shift towards a smaller d-spacing �and thus are in compression�. It shouldalso be noted that in their final state, we also observe a broadening of �111�� and �220�� RD peaks relativeto the initial value but not of the peaks in the TD. This is most likely due to non-uniform strain broadening,as discussed below.
FIG. 7—Diffraction patterns of a sample with 525 wt ppm of hydrogen at the initial state and after loadingat 75 MPa (no reorientation). Close-up on the ��111� hydride peak.
FIG. 8—Diffraction patterns of a sample with 525 wt ppm of hydrogen at the initial state and after loading
at 75 MPa (no reorientation). Close-up on the ��220� hydride peak.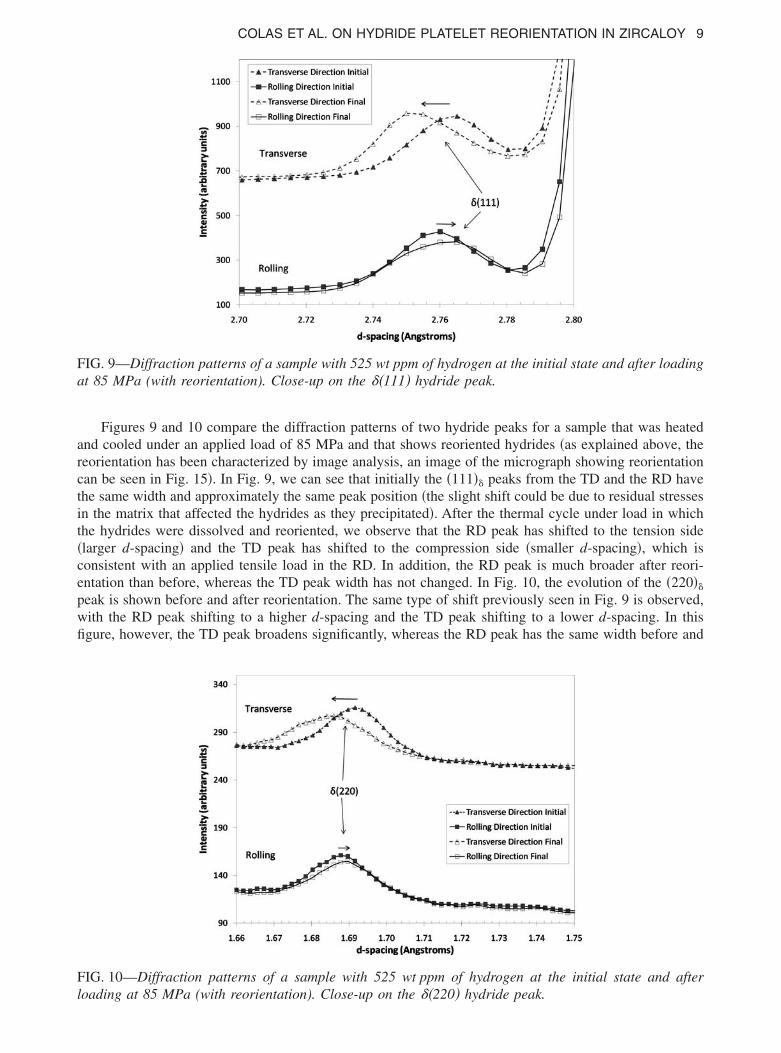
COLAS ET AL. ON HYDRIDE PLATELET REORIENTATION IN ZIRCALOY 9
Figures 9 and 10 compare the diffraction patterns of two hydride peaks for a sample that was heatedand cooled under an applied load of 85 MPa and that shows reoriented hydrides �as explained above, thereorientation has been characterized by image analysis, an image of the micrograph showing reorientationcan be seen in Fig. 15�. In Fig. 9, we can see that initially the �111�� peaks from the TD and the RD havethe same width and approximately the same peak position �the slight shift could be due to residual stressesin the matrix that affected the hydrides as they precipitated�. After the thermal cycle under load in whichthe hydrides were dissolved and reoriented, we observe that the RD peak has shifted to the tension side�larger d-spacing� and the TD peak has shifted to the compression side �smaller d-spacing�, which isconsistent with an applied tensile load in the RD. In addition, the RD peak is much broader after reori-entation than before, whereas the TD peak width has not changed. In Fig. 10, the evolution of the �220��
peak is shown before and after reorientation. The same type of shift previously seen in Fig. 9 is observed,with the RD peak shifting to a higher d-spacing and the TD peak shifting to a lower d-spacing. In thisfigure, however, the TD peak broadens significantly, whereas the RD peak has the same width before and
FIG. 9—Diffraction patterns of a sample with 525 wt ppm of hydrogen at the initial state and after loadingat 85 MPa (with reorientation). Close-up on the ��111� hydride peak.
FIG. 10—Diffraction patterns of a sample with 525 wt ppm of hydrogen at the initial state and after
loading at 85 MPa (with reorientation). Close-up on the ��220� hydride peak.
10 JOURNAL OF ASTM INTERNATIONAL
after reorientation. The observed peak broadening is attributed to different strains in hydrides that arereoriented compared to strains in hydrides that are not reoriented, as discussed in more detail below.
Evolution of d-Spacing with Time and Temperature
Recording data while heating and loading enables us to observe the evolution of selected parameters withtime and temperature. Figure 11�a� and 11�b� shows the evolution of the d-spacing of the �100�� peak andthe �111�� peak for both integration directions for a sample heated and cooled under an applied load of 75MPa. Factors influencing the lattice parameter include the temperature �thermal expansion�, elastic stress/strain, and chemical composition. In the left-hand side of Fig. 11�a� and Fig. 11�b� �between 0 and 3000s�, the temperature steadily increases �at 0.2°C /s�, which entails an increase of the d-spacing of thezirconium peaks by thermal expansion. Some expected points for the thermal expansion of the zirconiumpeaks �27� are plotted as stars for reference. Once at 550°C �around 3300 s�, the tensile load is applied inthe RD. When the load is applied, the RD peaks of both the zirconium and the hydride shift to a largerd-spacing, whereas the TD peaks of both phases shift to a smaller d-spacing. The shift away from theinitial value of the hydride planes in the TD and the RD is �3.1�10−3 Å. That of the zirconium planesin the TD and the RD is �1.5�10−3 Å.
In Fig. 12, the same graphs shown in Fig. 11 are plotted for a sample that showed partial reorientationafter being loaded at 85 MPa during cooling. The �100�� and �111�� peaks behave similarly, as shown inFig. 11: When the load is applied, the RD peaks shift to a larger d-spacing than initially, whereas the TDpeaks shift to a smaller d-spacing than initially. The previous observations are confirmed by Fig. 13 wherethe same plots as in Figs. 11 and 12 are shown for a sample partially reoriented under 100 MPa load. Inthis case, we observe the same expected behavior for the zirconium peaks and for the hydride peaks. Thelast point of the graphs �after 1500 s� was recorded under zero applied load. We see that the hydride peaksare still shifted with respect to their initial peak position, indicating that this difference in strain is causedby permanent strain in the hydrides rather than by elastic stress from the applied load.
Intensity and Full-Width at Half Maximum Evolution with Time and Temperature
Observing the evolution of the integrated intensity and the FWHM for the �111�� hydride peaks with timeand temperature can give additional information on the dissolution and precipitation of hydrides and on thebroadening of the peaks. The evolution of the FWHM and the integrated intensity of the �111�� ispresented in Fig. 14 for both TD and RD as a function of time for a sample heated and cooled under 75MPa applied load. In this case, the hydride particles did not undergo reorientation. The temperature curveis shown as a dotted line, linked to the right-hand ordinate axis. The tensile load was applied in the RDonce the sample temperature reached 550°C as shown in the bottom of the figure and most of the hydrideswere dissolved. The load was kept constant thereafter. The metallographs of the cross section of the sample
FIG. 11—The d-spacing of (a) ��100� and (b) ��111� peaks for a Zircaloy-4 sample with 520 wt ppm ofhydrogen for hydrides precipitated under 75 MPa applied load in the RD without reorientation (theexpected thermal expansion stars come from Ref 24).
taken before and after the experiment are also shown in Fig. 14 �it should be noted that metallography was

COLAS ET AL. ON HYDRIDE PLATELET REORIENTATION IN ZIRCALOY 11
performed on the exact same sample before and after the X-ray diffraction experiment; after the firstmetallographic observation, the sample was repolished to remove any effect from etching�. On both ofthese metallographs, the hydride platelets are perpendicular to the ND, confirming that no hydride reori-entation has occurred. In this figure, we can follow the dissolution of the hydride particles as the hydridepeak intensity curve decreases as the temperature reaches �550°C and returns to higher values uponcooling.
The examination of the changes in the �111�� peak FWHM can be related to strain or size broadening.Initially, the FWHM for both TD and RD are similar �as also shown in Fig. 7�. When the hydrides start todissolve, the �111�� hydride peak FWHM diminishes. This could be because since the hydrides are smaller,they are less strained in the zirconium matrix or because the most strained hydrides dissolve preferentially.The shape of the hydride particles dissolving could also be changing, leading to a lower strain on thehydride planes. When cooling under load, as the hydride particles reprecipitate, the FWHM increases. This
FIG. 12—The d-spacing of ��100� and ��111� peaks for a Zircaloy-4 sample with 525 wt ppm of hydrogencooled under 85 MPa applied load in the RD (the stars indicate the expected thermal expansion starscome from Ref 24). This cycle resulted in hydride reorientation.
FIG. 13—The d-spacing of ��100� and ��111� peaks for a Zircaloy-4 sample with 525 wt ppm of hydrogencooled under 100 MPa applied load in the RD (the expected thermal expansion stars come from Ref 24).
This cycle resulted in hydride reorientation.
12 JOURNAL OF ASTM INTERNATIONAL
is likely due to strains developed during the hydride growth process due to the thermal expansion mis-match between the hydrides and the matrix. As the temperature decreases, the hydrides contract faster thanthe matrix, thus implying a higher strain on the precipitates and a higher strain broadening �the thermalexpansion coefficient of the hydrides is �hydrides=14.2�10−6 / °C and that of �-zirconium is �Zr=6�10−6 / °C �18��. Once the load is applied in the RD, the FWHM in both directions increases as straindevelops in the hydride particles in both the TD and the RD. Since the hydrides are under a tensile load inthe RD, a TD strain results from Poisson’s ratio, and thus both integration directions exhibit broadening.This broadening is likely tensile in the RD and compressive in the TD, although this cannot be readilydetermined from the diffraction peak widths.
Similar curves were plotted for samples cooled under 85 and 100 MPa, respectively. in Figs. 15 and16. The analysis of the hydride peak intensities before and after heat treatment, performed using GSAS,shows that the diffracted intensities of the hydride peaks for the reoriented samples do not change signifi-cantly. The study of the peak shape �specifically peak broadening�, however, was able to provide a
FIG. 14—Time evolution of the FWHM (and intensity) of the ��111� peaks of a Zircaloy-4 sample with 525wt ppm of hydrogen heated and cooled under 75 MPa applied load in the RD (no reorientation ofhydrides). The applied load and temperature are also shown.
FIG. 15—Time evolution of the FWHM (and intensity) of the ��111� peaks of a Zircaloy-4 sample with 525wt ppm of hydrogen heated and cooled under 85 MPa applied load in the RD (this resulted in hydride
reorientation). The applied load and temperature are also shown.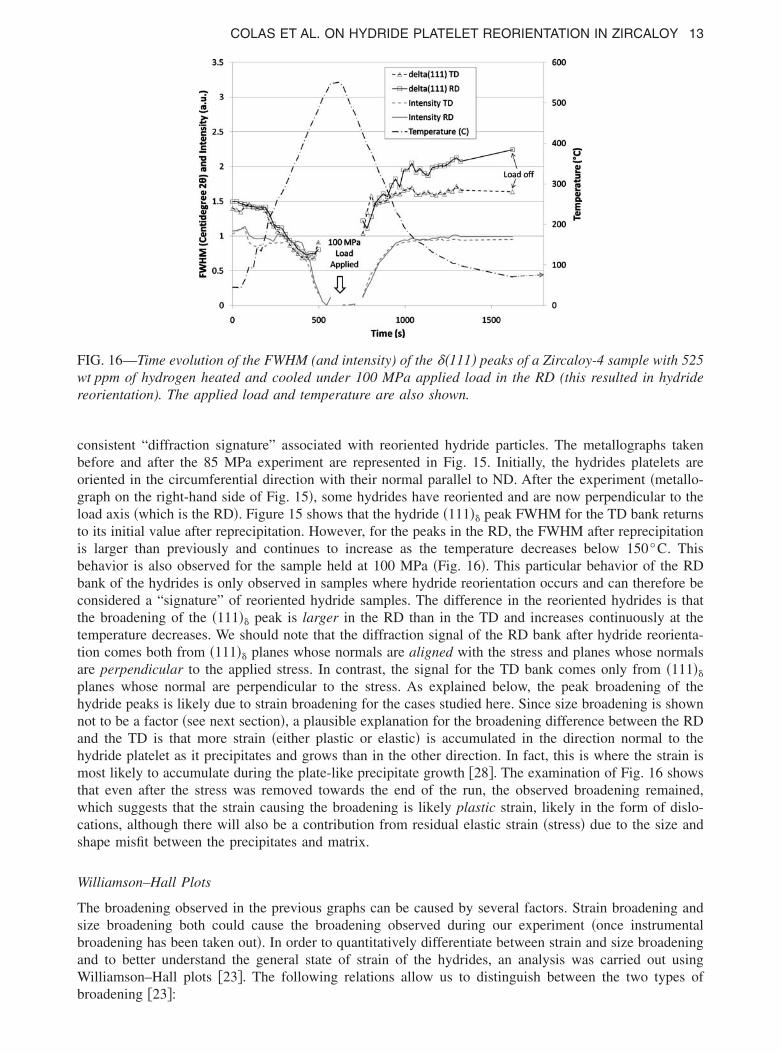
COLAS ET AL. ON HYDRIDE PLATELET REORIENTATION IN ZIRCALOY 13
consistent “diffraction signature” associated with reoriented hydride particles. The metallographs takenbefore and after the 85 MPa experiment are represented in Fig. 15. Initially, the hydrides platelets areoriented in the circumferential direction with their normal parallel to ND. After the experiment �metallo-graph on the right-hand side of Fig. 15�, some hydrides have reoriented and are now perpendicular to theload axis �which is the RD�. Figure 15 shows that the hydride �111�� peak FWHM for the TD bank returnsto its initial value after reprecipitation. However, for the peaks in the RD, the FWHM after reprecipitationis larger than previously and continues to increase as the temperature decreases below 150°C. Thisbehavior is also observed for the sample held at 100 MPa �Fig. 16�. This particular behavior of the RDbank of the hydrides is only observed in samples where hydride reorientation occurs and can therefore beconsidered a “signature” of reoriented hydride samples. The difference in the reoriented hydrides is thatthe broadening of the �111�� peak is larger in the RD than in the TD and increases continuously at thetemperature decreases. We should note that the diffraction signal of the RD bank after hydride reorienta-tion comes both from �111�� planes whose normals are aligned with the stress and planes whose normalsare perpendicular to the applied stress. In contrast, the signal for the TD bank comes only from �111��
planes whose normal are perpendicular to the stress. As explained below, the peak broadening of thehydride peaks is likely due to strain broadening for the cases studied here. Since size broadening is shownnot to be a factor �see next section�, a plausible explanation for the broadening difference between the RDand the TD is that more strain �either plastic or elastic� is accumulated in the direction normal to thehydride platelet as it precipitates and grows than in the other direction. In fact, this is where the strain ismost likely to accumulate during the plate-like precipitate growth �28�. The examination of Fig. 16 showsthat even after the stress was removed towards the end of the run, the observed broadening remained,which suggests that the strain causing the broadening is likely plastic strain, likely in the form of dislo-cations, although there will also be a contribution from residual elastic strain �stress� due to the size andshape misfit between the precipitates and matrix.
Williamson–Hall Plots
The broadening observed in the previous graphs can be caused by several factors. Strain broadening andsize broadening both could cause the broadening observed during our experiment �once instrumentalbroadening has been taken out�. In order to quantitatively differentiate between strain and size broadeningand to better understand the general state of strain of the hydrides, an analysis was carried out usingWilliamson–Hall plots �23�. The following relations allow us to distinguish between the two types of
FIG. 16—Time evolution of the FWHM (and intensity) of the ��111� peaks of a Zircaloy-4 sample with 525wt ppm of hydrogen heated and cooled under 100 MPa applied load in the RD (this resulted in hydridereorientation). The applied load and temperature are also shown.
broadening �23�:

14 JOURNAL OF ASTM INTERNATIONAL
FWHMsample � �sin
cos strain broadening �2�
FWHMsample �0.9�
t cos size broadening �3�
where:FWHMSample=measured FWHM minus the instrumental broadening �in radians 2�,=Bragg angle �in radians�,�=lattice strain,t=sample particle size �in nanometre�, and�=X-ray beam wavelength �in nanometre�.A Williamson–Hall plot presents FWHM�cos �noted B� as a function of sin for different peaks of
the same phase. Strain broadening varies with the 2 value of the peak under consideration, whereas sizebroadening is independent of angle when plotted in the Williamson–Hall plots. Therefore, the slope of thecurves plotted is proportional to strain, and the y-intercept is proportional to the amount of size broadening�23�. A Williamson–Hall plot is presented in Fig. 17�a� for the same Zircaloy-4 sample as observedpreviously with 525 wt ppm of hydrogen for hydrides precipitated at slow cooling rate under no load andshown in Fig. 6. Only two, �111�� and �220��, out of the three hydride peaks are used in these graphs sincethe third hydride peak �200�� is too small and is highly convoluted with a very large �-zirconium peak andthus its shape cannot be fitted properly. By fitting the two points to a linear curve, we observe that they-intercept is close to zero for both TD and RD. This implies that there is negligible size broadening of thehydride peaks. This is likely because the hydride particles we are detecting are too big to induce significant
FIG. 17—Williamson–Hall plot for the final state of a Zircaloy-4 with 525 wt ppm of hydrogen heated up550°C and cooled: (a) Under no load; (b) under 75 MPa applied load in the RD (no reorientation); (c)under 85 MPa applied load in the RD (hydride reorientation); and (d) under 100 MPa applied load in theRD (hydride reorientation).
size broadening. The slopes of the fitted line in Fig. 17�a� are similar for both TD and RD. This is

COLAS ET AL. ON HYDRIDE PLATELET REORIENTATION IN ZIRCALOY 15
consistent with the previous observation from the d-spacing calculation that both directions are strained toa similar amount, although the RD is slightly more strained than the TD �probably due to the presence ofmore basal planes of the zirconium matrix in the RD�.
Figure 17�b� shows the Williamson–Hall plot for a diffraction pattern taken from a sample loaded at 75MPa and taken at time t=7500 s, which corresponds to the final data point in Fig. 14. Similarly to Fig.17�a�, no hydride size broadening is observed in this sample. The slopes of the curve have increasedslightly, suggesting that more strain accumulates in the hydrides as they are pulled in tension. Also, thehydride peaks in the RD seem to be more strained than the ones in the TD with a very large broadeningof the �220�� peak. This means that the �220�� peaks oriented perpendicular to the loading direction aremore strained than the �111�� peaks oriented in the same direction. This is likely due to different strainaccommodation in the hydride platelet �the �111�� direction comes out of the hydride platelet�.
Figure 17�c� and 17�d� shows Williamson–Hall plots for the 85 MPa and the 100 MPa reorientedsamples, respectively. Again, no size broadening is observed. The analysis of the slopes from Fig. 17�c�and 17�d� compared to those in Fig. 17�a� suggests that the strain is larger on the TD than the RD �higherslope�. This is paradoxical, considering the larger strain broadening observed in the �111�� in Figs. 15 and16. However, because hydride reorientation was not complete �half of the hydrides present at the end arein-plane hydrides�, it is likely that much of the �220�� peak intensity in the RD comes from in-planehydrides. The analysis mentioned above is only properly valid if the same hydride particle contributes tothe intensity of both �111�� and �220��. To summarize, the data is consistent with greater strain observedin the direction normal to the hydride platelets.
In summary, the observed strain in the direction normal to the hydrides platelets is likely caused by acombination of the accommodation of size-mismatch �volume expansion during hydride precipitation� anddifferential thermal expansion of the hydrides and matrix. The data collected in this study shows anidentifiable diffraction signature for hydride reorientation. The main feature of this signature is that theFWHM continues to increase in the RD with time as the temperature decreases, whereas the FWHMremains unchanged in the TD. The second observation is that the strain in the TD is much higher than thatin the RD. The d-spacing behavior of reoriented hydrides is the same as the behavior for samples undertensile stress without reorientation. This implies that this reorientation signature is not due to differencesin the d-spacings but to another phenomenon. A possible explanation is that the diffraction signal from the�220�� peaks comes mostly from circumferential hydrides, whereas the diffraction signal from the �111��
peaks comes mostly from reoriented hydrides.
Conclusions
Detailed X-ray diffraction measurements were performed on various hydrided zirconium alloys samplesusing synchrotron radiation. The objective of the study was to understand the state of strain of hydrides asthey precipitate in a zirconium matrix under load and when reorienting. The secondary objective of thisstudy was to determine if there is a diffraction signature associated with hydride reorientation. Both in situand ex situ experiments were performed on samples of different orientations, under different levels of load,and the results were compared to metallographical examination. The hydride strain was measured bycomparing both d-spacing variations and the hydride peak broadening. The conclusions are as follows.
�1� Hydrides particles precipitated under zero applied load are strained in compression in both direc-tions �TD and RD�, but the stresses remain in the elastic regime.
�2� The analysis of the dependence of the observed hydride peak broadening on sin indicates thatmost of the hydride peak broadening is caused by strain rather than by size. This is true both in theas-prepared hydrided samples and in those that underwent heat treatment and cooling under stress.
�3� When hydrides are heated and stressed in the RD during cool-down but do not reorient, the peakFWHM in the TD and in the RD changes in a constant manner �i.e., reaches a plateau� relativelyto the initial value. The variations in the hydride plane d-spacing are consistent with the planeswhose normals are parallel to the loading axis �RD� being under tension and those whose normalsare perpendicular to the loading axis �TD� being under compression.
�4� A distinct diffraction signature associated with hydride reorientation has been identified for hy-drided Zircaloy-4 samples, which are heated and cooled under stress applied in the RD. This
signature is present only when the sample is cooled under an applied stress sufficient to reorient
16 JOURNAL OF ASTM INTERNATIONAL
hydrides. The FWHM of the �111�� hydride peaks in the RD and TD is markedly different insamples with reoriented hydrides compared to those in which reorientation did not occur. Insamples where reorientation occurred, the FWHM of the �111�� peaks in the TD returns to theinitial value upon cooling, while that for the RD increases steadily as temperature is lowered andprecipitation proceeds. In contrast, in the non-reoriented samples, the FWHM of the �111�� peaksfor both TD and RD return to the original value.
Acknowledgments
This research was funded by the Materials World Network Grant No. DMR-0710616 from the NationalScience Foundation, with corresponding funding from NSERC for the Canadian partners. The writers aregrateful for their support. The research for this publication was supported by the Pennsylvania StateUniversity Materials Research Institute Nano Fabrication Network and the National Science FoundationCooperative under Agreement No. 0335765, National Nanotechnology Infrastructure Network, with Cor-nell University. The use of the Advanced Photon Source was supported by the U.S. Department of Energy,Office of Basic Energy Sciences under Contract No. DE-AC02-06CH11357.
References
�1� Coleman, C. E. and Hardie, D., “The Hydrogen Embrittlement of �Alpha�-Zirconium—A Review,” J.Less-Common Met., Vol. 11�3�, 1966, pp. 168–185.
�2� International Center for Diffraction Data, The Powder Diffraction File, Newton Square, PA, 2006.�3� Bradbrook, J. S., Lorimer, G. W., and Ridley, N., “The Precipitation of Zirconium Hydride in
Zirconium and Zircaloy-2,” J. Nucl. Mater., Vol. 42�2�, 1972, pp. 142–160.�4� Beck, R. L., “Zirconium-Hydrogen Phase System,” Transactions of the ASME, Vol. 55, 1962, pp.
542–555.�5� Perovic, V., Weatherly, G. C., and Simpson, C. J., “Hydride Precipitation in �a�/�b� Zirconium
Alloys,” Acta Metall., Vol. 31�9�, 1983, pp. 1381–1391.�6� Chung, H. M., Daum, R. S., Hiller, J. M., and Billone, M. C., “Characteristics of Hydride Precipi-
tation in Spent-Fuel Cladding,” Zirconium in the Nuclear Industry: 13th International Symposium,ASTM STP 918, 2002, ASTM International, West Conshohocken, PA, pp. 78–101.
�7� Ells, C. E., “Hydride Precipitates in Zirconium Alloys �A Review�,” J. Nucl. Mater., Vol. 28�2�,1968, pp. 129–151.
�8� Kearns, J. J. and Woods, C. R., “Effect of Texture, Grain Size, and Cold Work on the Precipitation ofOriented Hydrides in Zircaloy Tubing and Plate,” J. Nucl. Mater., Vol. 20�3�, 1966, pp. 241–261.
�9� Singh, R. N., Kishore, R., Singh, S. S., Sinha, T. K., and Kashyap, B. P., “Stress-Reorientation ofHydrides and Hydride Embrittlement of Zr-2.5 wt% Nb Pressure Tube Alloy,” J. Nucl. Mater., Vol.325�1�, 2004, pp. 26–33.
�10� Hardie, D. and Shanahan, M. W., “Stress Reorientation of Hydrides in Zirconium-2.5 % Niobium,”J. Nucl. Mater., Vol. 55�1�, 1975, pp. 1–13.
�11� Kammenzind, B. F., Berquist, B. M., Bajaj, R., Kreyns, P. H., and Franklin, D. G., “The Long-RangeMigration of Hydrogen Through Zircaloy in Response to Tensile and Compressive Stress Gradients,”Zirconium in the Nuclear Industry: 12th International Symposium, ASTM STP 1354, 2000, ASTMInternational, West Conshohocken, PA, pp. 196–233.
�12� Daum, R. S., Chu, Y. S., and Motta, A. T., “Identification and Quantification of Hydride Phases inZircaloy-4 Cladding Using Synchrotron X-Ray Diffraction,” J. Nucl. Mater., Vol. 392�3�, 2009, pp.453–463.
�13� Kerr, M., Daymond, M. R., Holt, R. A., Almer, J. D., and Stafford, S., “Observation of Growth of aPrecipitate at a Stress Concentration by Synchrotron X-Ray Diffraction,” Scr. Mater., Vol. 62�6�,2010, pp. 341–344.
�14� Kerr, M., Daymond, M. R., Holt, R. A., Almer, J. D., Stafford, S., and Colas, K. B., “Fracture of aMinority Phase at a Stress Concentration Observed with Synchrotron X-Ray Diffraction,” Scr.Mater., Vol. 61�10�, 2009, pp. 939–942.
�15� Turski, M., Bouchard, P. J., Steuwer, A., and Withers, P. J., “Residual Stress Driven Creep Cracking

COLAS ET AL. ON HYDRIDE PLATELET REORIENTATION IN ZIRCALOY 17
in AISI Type 316 Stainless Steel,” Acta Mater., Vol. 56, 2008, pp. 3598–3612.�16� Daymond, M. R., Young, M. L., Almer, J. D., and Dunand, D. C., “Strain and Texture Evolution
During Mechanical Loading of a Crack Tip in Martensitic Shape-Memory NiTi,” Acta Mater., Vol.55�3929�, 2007, pp. 3929–3942.
�17� Pierron, O. N., Koss, D. A., Motta, A. T., and Chan, K. S., “The Influence of Hydride Blisters on theFracture of Zircaloy-4,” J. Nucl. Mater., Vol. 322�1�, 2003, pp. 21–35.
�18� Douglass, D. L., “The Metallurgy of Zirconium,” Atomic Energy Review, Z. I. Turkov, Ed., Interna-tional Atomic Energy Agency, Vienna, Austria, 1971.
�19� Raynaud, P. A. C., Crack Growth Through the Thickness of Thin-Sheet Hydrided Zircaloy-4, Ph.D.Thesis, The Pennsylvania State University, University Park, 2009.
�20� McMinn, A., Darby, E. C., and Schofield, J. S. “The Terminal Solid Solubility of Hydrogen inZirconium Alloys,” Zirconium in the Nuclear Industry: 12th International Symposium, ASTM STP1354, 2000, ASTM International, West Conshohocken, PA, pp. 173–195.
�21� Haeffner, D. R., Almer, J. D., and Lienert, U., “The Use of High Energy X-Rays from the AdvancedPhoton Source to Study Stresses in Materials,” Mater. Sci. Eng., A, Vol. 399�1–2�, 2005, pp. 120–127.
�22� Larson, A. C. and Von Dreele, R. B., General Structure Analysis System (GSAS), Los AlamosNational Laboratory, Los Alamos, NM, Report LAUR 86-748, 2000.
�23� Snyder, R. L., Fiala, J., and Bunge, H., Defect and Microstructure Analysis by Diffraction, Interna-tional Union of Crystallography Monographs on Crystallography, Oxford University Press, NewYork, NY, 1999.
�24� Puls, M. P., Shi, S.-Q., and Rabier, J., “Experimental Studies of Mechanical Properties of SolidZirconium Hydrides,” J. Nucl. Mater., Vol. 336�1�, 2005, pp. 73–80.
�25� Yamanaka, S., Yamada, K., Kurosaki, K., Uno, M., Takeda, K., Anada, H., Matsuda, T., and Koba-yashi, S., “Characteristics of Zirconium Hydride and Deuteride,” J. Alloys Compd., Vol. 330–332,2002, pp. 99–104.
�26� Kerr, M., Daymond, M. R., Holt, R. A., and Almer, J. D., “Strain Evolution of Zirconium HydrideEmbedded in a Zircaloy-2 Matrix,” J. Nucl. Mater., Vol. 380�1–3�, 2008, pp. 70–75.
�27� Yamanaka, S., Yoshioka, K., Uno, M., Katsura, M., Anada, H., Matsuda, T., and Kobayashi, S.,“Thermal and Mechanical Properties of Zirconium Hydride,” J. Alloys Compd., Vol. 293–295, 1999,pp. 23–29.
�28� Massih, A. R. and Jernkvist, L. O., “Stress Orientation of Second-Phase in Alloys: Hydrides inZirconium Alloys,” Comput. Mater. Sci., Vol. 46, 2009, pp. 1091–1097.