Embed Size (px)
Citation preview

/
Cl >::c
,;
0 Lt\ .::t-
0 "
::c
HYDRAULICS BRANCH OFFICIAL FILE COPY
~-----
~,.,,,. I
UNITED ST ATES DEPARTMENT OF THE INTERIOR
BUREAU OF RECLAMATION
/ .,,, ,/ . ,T - /..,
SOME EFFECTS OF SUSPENDED SEDIMENT ON
GROW TH OF SUBMERSED PONDWEEDS
General Laboratory Report No. Gen-27
DIVISION OF ENGINEERING LABORATORIES
COMMISSIONER'S OFFICE DENVER, COLORADO
July 12, 1960
BUREAU OF RECLAMATION HYDRAULIC LABORATORY,
\ ,,. OFFICE F!tE tOPY
WHEN BORROWED RETURN PROMPTLY

Summary• • • • • • • • • Introduction •••••• Materials and Methods • •
CONTENTS
. . . . . . . . . . . . . . . . . . . . • • • • • • • • • • • • • • • • • • • • • • • • • • • • • • • • • • • • • • • •
Page
i 2 2
Construction of Special Equipment • • • • • • • • • • • • • • 2 Limnophotometer Used for the Measurement of Radiant Energy • • 3 Calibration of the Limnophotometer. • • • • • • • • • • • • • 4 Sediment Used and Method of Determining and Maintaining
Concentrations. • • • • • • • • • • • • • • • • • • • • • • 4 Tests Conducted • • • • • • • • • • • • • • • • • • • • • • • 5 Biological Testing. • • • • • • • • • • • • • • • • • • • • • 6
Results and Discussion • • • • • • • • • • • • • • • • • • • • •
Radiant Energy Measurements • • • • • Biological Response •••••••••
. . . . . . . . . . . . . . . . . . . . . • • •
Conclusions ••••••••• Literature Cited •••••• Acknowledgments •••••••
• • • • • • • • • • • • • • • • • • • • • • • • • • • • • • • • • • • • • • • • • • • • • • • • • • • • • •
7
7 8
9 ll 12
Table
Representative Limnophotometer Readings. • • • • • • • • • • • • l Dry Weights of Plant )laterial. • • • • • • • • • • • • • • • • • g Morphological Effects of Low Concentrations of Bentonite on
Plant Species • • • • • • • • • • • • • • • • • • • • • • • • • 3
Apparatus to Bold Fine Sediment in Suspension •••••••••• Limnophotometer Assembly •••••••••••••••••••• Spectral Curves of the Limnophotometer Photocell
Characteristics •••••••••••••••••••••••• Conversion of Pyrheliometer Readings to Foot C&lidl.es •••••• Conversion of Litmophotometer Readings to Foot Candles ••••• Gradation--Wet Condition of Sediments •••••••••••••• Arrangement of Drums During Test • • • • • • • • • • • • • • • • Sediment Concentrations and Water Temperatures in Drums
Containing Propagules--Test l ••••••••••••••••• Sed:lment Concentrations in Drums Containing Established
Culture--Test 1 • • • • • • • • • • • • • • • • • • • • • • • • Concentrations of Montmorillonite Sediment and Water
Temperature--Test 2 • • • • • • • • • • • • • • • • • • • • • •
Figure
1 2
3 4 5 6 7,
8
9
10

CONTENTS--Continued
Concentration ot Angostura Sediment--Test 2 •••••••••• Sediment Concentration and Water Temperature in Drums
Containing Propagules--Test 3 •••••••••••••••• Sediment Concentration in Drums Containing Established
Cultures--Test 3 ••••••••••••• • • • • • • • • • Jackson Turbidimeter Equipment •••••••••••••••• Percent Reduction of Total Solar Ra.diation Produced by
Figure
11
12
13 14
Angostura Sediments • • • • • • • • • • • • • • • • • • • • • 15 Percent Reduction of Total Solar Radiation Produced by
CODIDlercial Bentonite Sediments. • • • • • • • • • • • • • • • 16 Maximum Penetration Depth of Light into Sediment-laden Water. • 17 Plant Weight Reduction Produced by Suspended Sediments • • • • 18 Typical Growth of Plant Specimens Exposed to Suspended
Sediments • • • • • • • • • • • • • • • • • • • • • • • • • • Typical Growth ot Plant Specimens Exposed to Suspended
·Sediments • • • • • • • • • • • • • • • • • • • • • • • • • •
APPEIIDIX
19
20
~
Appendix A--Petrographic Description ot Bentonite Sediment • • 14 Appendix B--Petrographic Description ot Sediment from
A.Dgostura Reservoir. • • • • • • • • • • • • • • 15 Appendix c--some Engineering Considerations. • • • • • • • • • 16
11

UNITED STATES DEPARTME1'1' OF.THE Ill'l'ERICB
BUREAU OF RECLAMATIOB
COIIBllissioner's Office--Denver General Report No. Gen-27* Division of Engineering Laboratories Written by: N. E. Otto Chemical·Engineering .Laboratory Branch P. F. Enger Hydraulic Laboratory Branch Checked by: T. R. Bartley Denver, Colorado E. J. Carlson :July 12, ,1960 Reviewed by: L. o. Timblin,
c. w. Thomas Submitted by: w. u. Garstka
B. M. Martin
Subject: Some effects ot suspended sediment on growth of submersed pondweed&
Jr.
A joint investigation by the Chemical Engineering Laboratory Branch and
the B)draulic Laboratory Branch was undertaken to study the shading effects of suspended .. sediments on certain bydrophytes. Species ot submersed pond.weeds, commonly found in irrigation canals, were planted in pots and grown in drums containing a range ot suspended sediment concentrations. tJngerm1!1$ted plant propagules and established cultures ot pondweed& were used in the study.
Two ditterent sediments were used, om a commercial sodium-base montmorillonite-type bentonite, and the other a natural occurring bentonite-type sediment obtained from Angostura Reservoir.
Light quantity and spectral quality, penetrating the sediment-laden water, were measured by use of a limnophotometer which has a specially constructed photoelectric cell syetem. Light measurements indicated tbe intensity and SP.!Ctral quality of suniight were considerably changed upon
· penetration into water containing suspended sediment. The sediment from Angostura Reservoir caused greater light reduction at lower con~entrations than did the commercial bentonite.
When plants were exposed to reservoir sediment concentrations of 50 ppm, the percent reduction of dry weight of plant •terial was approxinately 33 percent less than the dry weight ot plant •terial in the control drum. Reservoir sediment concentrations greater than 1,250 ppm were not effective in producing additional significant growth reductions than that attained at the 1,250-ppm level. The commercial bentonite sediment caused growth reductions ot a similar trend but required greater concentrations than field sediment to produce similar effects.
*Same as Laboratory Reports No. SI-21 and Byd-450.

However, from this study, it appears that concentrations of suspended sediment greater than 1,250 ppm would have to be naintained in canal water to create plant growth inhibition that might be considered critical to the plant• s survival. MLintaining a concentration of fine sediment of 1,250 ppn by weight in most canals appears generally infeasible.
A fie1d study would be necessary to determine that shading from suspended sediments is the primary factor responsible for plant growth reduction. MLny other environmental factors that affect the growth of pondweed& would have tobe determined and observed in any type of fie1d study. Obviously, optimum light availability 1s only one of the nany interacting environmental factors that exhibit controlling influences over a plant's metabolic-activity.
I1'1'ROD~TION
In the past, fie1d observations have frequently been nade regarding a possible correlation between the amount of suspended sediment contained in canal water and the amount of aqmtic plant growth in canals. Fie1d observations have o:f'ten indicated that as suspended sediment increases, the amount of aqmtic weed growth decreases. Reports of observations reviewed.have in no case given details of various factors contributing to suppression of aqmtic plant growth. These statements have been of a ·general nature. To obtain more intonation under controlled conditions on this subject, a joint study by the Weed Control Investigations Unit of the Ph1sical Investigations Laboratory Section,!/ Chemical Engineering Laboratory Branch, and the Sediment Investigations Unit of the Hydraulic Laboratory Branch •s initiated to dete~ shading effects of suspended sediment on aqmtic weeds. The scope of the program consisted of determining the growth response of various speciea of submersed·pondweeds exposed to environment of various concentrations of two types ot suspended sediments.
The study was nade over a 2-year period. During the first year, the need for modification in procedures and techniques became evident. Therefore, data obtained in the initial test are not fully ccmparable to those obtained later. ·
MATERIALS AND METHODS
Construction of Special Equipnent
Circulating systems designed to naintain fine sediment in suspension were installed in eight. 55-gallon metal drums. The system consisted
Y Weed control studies are conducted under a cooperative program between the Bureau of Reclamation, u. s. Department of the Interior; and the Agricultural Research Service, U. s. Department of Agriculture, Denver, Colorado.
2

mainly ot a propeller driven by a l/30-horsepower motor, a 26-1/2-inchlong by 2-1/2-inch-inside-diameter pipe, and a perforated false bottan, Figure 1. The propeller forced water, at a discharge of 0.147 cubic foot per second, through the 2-1/2-inch-diameter pipe at 4.31 feet per second (:tps). Water spread beneath the false bottan and discharged through twenty-five l/2-inch-diameter holes and a circumferential opening approximately 1/16 inch wide around the false bottom. Average velocity through these openings was 2.28 fps, and resulting upward velocity in the drum was approximately 0.055 fps, or 1.7 cm/sec. The 1/30-horsepower motors operated at 1,550 rpm and were designed to operate continuously while in the vertical position. Because tests were conducted outdoors, hoods were installed to keep the motors dry. To prevent possible phytotoxic contamination of the culture water, all submersed metallic parts were painted with an appropriate primer preparation and vinyl-based paint.
Limnophotaneter Used for the Measurement of Radiant Energy
The limnophotometer was manufactured by a private instrument manufacturer in the United States and is similar to that described by Atkins et al(l)** for measurement of submarine daylight. This instrument consists basically of two selenium barrier-type photoelectric cells, one of which is sealed in a heavy brass case with a glass window. This unit is used for the measurement of subsurface illumination. Terminals of the submersible cell are connected to a waterproof electric cable to facilitate measurement of cell output current at the surface. The surface or reference cell is encased in a gimbal-mounted brass case. This unit is used to measure total (within sensitivity limits of the cell) radiant energy avail.able at the water's surface.
Readings are obtained by measuring the electrical current emitted by the light-excited photocell on a microammeter contained in the control box. The meter is shunted to allow readings from direct connection to multiples of 10, 100, and 8oo. A selector switch enables the rapid switching from the surface to the submersed cell for comparative readings.
Fl.ashed opal glass discs are used to cover each photocell. The opal glass serves to prevent variations caused by unequal light diffusion and to permit the measurement of oblique light rays. Both cells are equipped with detachable red and blue filters to allow separation and measurement of portions of the spectrum known to be efficient in photosynthesis. The red filter transmits wave lengths from 600 to 700 millimicrons, and the blue filter transmits wave lengths from lJoo to 500 millimicrons.
The complete limnophotometer is shown in Figure 2. Figure 3 shows the .spectral range of sensitivity of the photocells, transmission ranges of the filters, and spectral range of relative photosynthetic rates.
**Numbers in parentheses ref'er to references at end of report.
3

Calibration of the Limnophotometer
Calibrations of the individual photocells were made to obtain separate cell readings tbat would be comparable tor calculation of percent light reduction. The two cells varied considerably in their output at a given energy level. The submersible cell output was less than the surface cell output. This was due to individual cell characteristics and a thicker cover glass on the submersible cell. These differences were compensated tor by increasing the submersed cell readings in all reported light data. This was accanplished by calculating average differences of the two cells from numerous light measurements at varying energy levels to obtain a correction factor.
A curve was established tor the conversion of microampere readings from the instrument to approximate toot candle units. The toot candle conversion data tor this graph were •de tram readings obtained with the surface cell equipped with the flashed opal dittuser.
Da~ tor conversion of microammeter reading to toot candle were obtained by calibrating the limnophotometer with a standard pyrheliometer. output of the pyrheliometer, which is measured with a potentiometer, is in linear relationship to light intensity. On this basis, a rectilinear plot was established by plotting readings fran a toot candle meter with comparable pyrheliometer readings. Due to the limited mximum range ot the toot candle meter, the established line was extrapolated to 10,000 toot candles to include the greater radiant energy levels occurring in full sunlight. Comparative readings were then mde using the pyrheliometer (indicating millivolts) and the limnophotometer (indicating ~croamperes) from low to high radiant en~rgy intensities. The pyrhelioineter readings were converted to equivalent toot candles frail the first graph and these data plotted with comparable limnophotometer readings to establish the conversion curve shown in Figure 5.
During the course of the study, radiant energy measurements were •de weekly at various water depths in drums containing sediment and in control drums. For all readings obtained from the submersed cell, the percent reduction of tbat obtained frail the surface cell or full sunlight we.a calculated.
sediment Used and Method of Determining and Mlintaining Concentrations
Two.types of sediment were used in the studies:
One was a camliercial sodium-base montmorillonite-type bentonite, which appeared light gray in color. Petrographic analysis of this •terial is given-in Appendix A. In the wet condition, 96 to 97 percent of the DBterial is smaller than 44 microns, 93 to 94 percent is BDBiler than 5 microns, 87 to 89 percent is smiler than O .05 microns, and 60 to 65 percent is smiler than 0.1 micron, Figure 6.

The other sediment was obtained from Angostura Reservoir, South Dakota. It was brown in color, and its petrographic analysis is given in Appendix B. In the wet condition, approxillBtely 99 percent of' the mterial is smller than 4o microns, 95 percent is smiler than 10 microns, 83 percent is smaller than 5 microns, and 49 percent is smiler than l micron, Figure 6.
Drums were arranged as shown in Figure 7, and sediment was added to drums after premixing with a malted milk mixer. Concentrations of' sediment were checked at approxillBtely 2-day intervals. When concentrations were found to be below the desired level, additional sediment was added. Concentrations decreased as sediment settled in areas of' low velocity. Graphs of' concentrations mintained in drums are shown in Figures 8, 9, 10, 11, 12, and 13.
Suspended sediment concentrations were determined with a modified turbidimeter, Figure 14. A vented light el:lmimtor, to prevent outside light from entering the area near the candle and to create a near-constant light condition around the candle, was designed and is shown in Figures llta and llfc.
The turbidimeter (2) consists of a calibrated glass tube, a standard candle, and a spring-loaded stand and support which aline the candle and the tube. In use, the sample is poured into the glass tube until the 1.IIBge of' the candle flame just disappears from view and the observer sees a uniformly illuminated field with no bright spots. Depth of water in the tube when the candle flame disappears is a measure of suspended sediment concentration in ppn by weight.
The turbidimeter evaluates the effect ot optical properties of the sample, which causes light rays to be scattered and absorbed. As optical properties are attected by size, shape, refractive index, and transparency of the mterial in suspension, the turbidimeter vas calibrated in parts per million by weight tor each sediment.
Tests Conducted
Test 1 was conducted during the growing season of 1958. In this test, the drums were divided into two 4-drum groups. One 4-drum group contained potted ungerminated plant propagules, and the other group contained potted established vegetative cultures. One drum from each group was used as a control and contained no sediment. To cover a wide range of' sediment levels, the approximate concentrations in parts per million by weight (ppn) maintained in one drum from each group were 50, 200, and 8oo ppn. Graphs of concentrations maintained in the drums are shown in Figures 8 and 9. The light-gray montmorUJ.onite-type bentonite was used as the sediment throughout the test.
5

Test 2 was conducted during the early 1959 growing season. Each of the eight drums contained a propa.gule and a vegetatively established culture of each plant species being tested. Two drums were used as control and contained no sediment. In three drums., the light-gray montmorillonitetype bentonite was maintained at concentrations of approximately 1.,250., 2.,500., and 5,000 ppn. In the three remaining drums., brown Angostura Reservoir sediment was maintained at concentrations of approximately 1.,250., 2.,500, and 5,000 ppm. Graphs of concentrat:ions maintained in the drums are shown in Figures 10 and 11.
Test 3 was conducted during the late 1959 growing season. The drums were divided into two 4-drum groups. One group contained potted ungerminated plant propa.gules and the other group contained potted established vegetative cultures. One drum from each group was used as a control and contained no sediment. Angostura Reservoir sediment was added to the remaining six drums. Approximate concentrations maintained in one drum for each group were 50., 250., and 8oo ppn. Graphs of concentrations maintained in each drum are shown in Figures 12 · and 13.
Biological Testing
Three species of' the Potamogeton genus were used as test plants in Test l., conducted during the stmmer of 1958. These species were sago pondweed., p. pectimtus L.; leafy pondweed., P. f'oliosus Raf'.; and American pondweed., p. nodosus Poir. Tests 2 and 3, conducted in 1959, utilized the same species excepting leafy pondweed., which did not develop properly during the course of the first study. CODDllOn waterweed., Elodea canadensis Michnx., was substituted because of its adaptability to cultivated situations.
Cultures were established by using vegetative propagules: (1) tubers of the sago pondweed., (2) winter buds of the American pondweed., (3) axillary winter buds of· the leafy pondweed, and (4) excised stems of waterweed. These propagules were planted in 6-inch clay pots filled with topsoil.
Two types of cultures were used in the study. The first type was a vegetative mature series where propa.gules were planted and allowed to reach a stage of' growth near vegetative maturity before being exposed to the various concentrations of suspended sediment. This required a period of' 3 to 4 weeks for sago pondweed, American pondweed., and cODDllOn waterweed., and 2 months for leafy pondweed. The other type was a propa.gule series where ungerminated or excised propa.gule naterials were planted in the potted soil and immediately placed in the suspended sediment environment. Plants in two different stages of growth were used to determine the effects of sediment shading on pondweeds already vegetatively established., as compared to effects of sediment shading on the germination and establishment of an infestation of pond.weeds.
6

Replications of two pots per species were used in each drum of each treated and control series, excepting Test 2. Three species were. represented in the various conditions of treatment in all tests.
Plant cultures were exposed to the suspended sediment concentrations for a period of 6 weeks in the first test, 5 weeks in the second, and 4 weeks in the third. The drums were located in a position outdoors to receive full sunlight.
A continuous record of water temperature was obtained by the use of a mechanically operated thermograph. Temperature recordings were mde in the control drums for each test and are shown graphically in Figures 8, 10, and l2. Temperatures of all drums varied with the ambient air.
Miximum stem length data were obtained in the initial study to differentiate between the plants' growth response to the various sediment environments. These data were found to be of limited value, so in subsequent studies., dry weights of all plant material above the ground line were obtained. Below-ground plant parts were not sampled due to the extreme difficulty encountered in separating all root and rhizome mterial from soil particles. It is felt that above-ground parts reflected the variations in growth response as well as total plant mterial. Additioml tubers and winter buds were not developed on these cultures during the relatively short period of growth. Plant mterial was collected by species at the termination of the tests, ovendried at 62° C for 72 hours., and weighed. Visual observations were also ma.de of the plants' general morphological developnent during exposure to the various sediments and concentration ranges.
RESULTS AND DIS:::USSION
Radiant Energy Measurements
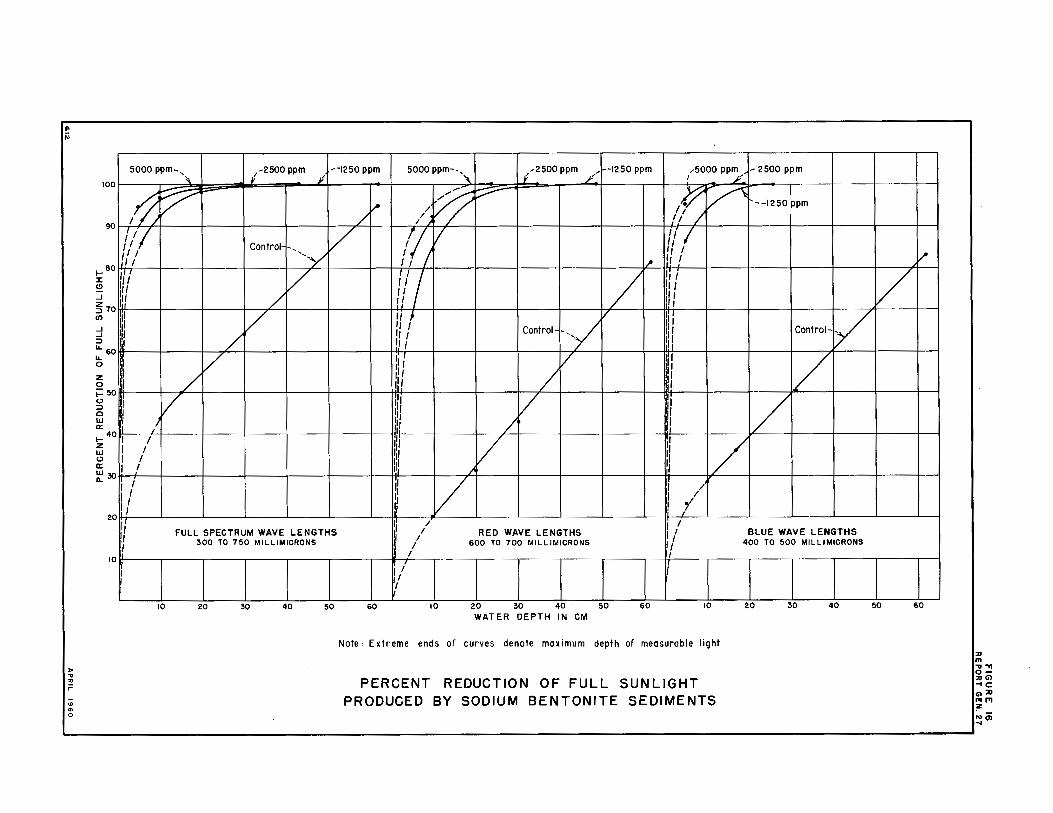
Results of radiant energy measurements, ma.de during the course of the study, are graphically represented in Figures 15 and 16. Data representing measurement of the full spectrum (within sensitivity limits of the photocell) were converted to foot candle units before reducing the values to percent loss of total surface solar radiant energy. These figures we>uld represent more accurate values as they reflect the nonlinear output characteristics of the photocells. The data representing the red and blue wave lengths were direct microampere readings reduced to percent loss of surface energy. *thema.tical models of light reduction results obtained from the limnophotometer and of dry weights of plants are given in Appendix C •
A comparison of the radiant energy measurements in the two sediments shows that Angostura sediment was more efficient in reducing radiant energy levels than was bentonite at a given concentration.
1

As shown in Figure 15, total solar radiant energy, available at the surface, was reduced to l percent or less at a depth of 1 toot (30.5 cm) in all concentrations of Angostura sediment, excepting 50 ppm. Total radiant energy was reduced about 63 percent at 1-foot -water depth by the filtering action of the water itself, as measured in the control situation. A further reduction of 29 percent was effected by the addition of 50 ppm of Angostura sediment at the 1-foot depth. Near-maximum shading effect -was obtained at a depth of 20 cm by 250-ppm sediment level.
Spectral quality measurements tend to indicate that the red wave lengths were able to penetrate somewhat further into the sediment-laden waters than were the shorter blue wave lengths, Figure 17. Investigations by Birge and Juday (3) showed that the short wave radiation is more affected by stains and suspended matter than is radiation of longer wave lengths; whereas radiation from the red end of the spectrum is more rapidly absorbed by water and less affected by stain and suspended matter. Measurements in the control situation of this study indicated that the blue wave length energy levels were somewhat less than red wave length levels in the water depths. Apparently the water in the control contained enough stain and planktonic suspension to affect the blue wave lengths, although the differences between the two were not great.
A representative record of radiant energy measurements 1s shown in Table l. This table indicates microampere readings obtained at various water depths in the control and high sediment concentration situations and corresponding toot candle values.
Biological Response
The growth response of the various plant species to shading with the two types of suspended sediments are graphically shown in Figure 18 and tabulated by individual ovendry weights in Table 2. The curves shown in Figure 18 indicate the average overall percentage weight reduction of all species and of individual species. Percent weight reduction was determined by considering the plant growth in sediment cultures to be a portion of that attained in control situations. Angostura sediment concentration of 50 ppm caused a plant growth reduction of approximately 33 percent less than that developed in the control situation. Increased growth reduction vas evident as the Angostura sediment concentration increased to 1,250 ppm, where the average plant growth was approximately 90 percent ·less than control plants. Angostura sediment concentrations greater than 1,250 ppm were not effective in producing further significant growth reduction.
Commercial bentonite caused growth reductions of a similar trend but required concentrations greater than the field sediment to produce similar results. Data for the first tests indicated commercial bentonite concentrations of 8oo ppm and less did not produce significant shading
8

of solar radiation to significantly reduce plant growth. These data were obtained by visual observation only, and dry weight data were not obtained. Results of the initial test are shown in Table 3.
All species exhibited near-normal growth characteristics at low sediment concentration ( 50 ppm) in both sediments and in the control drums. As the concentrations of sediments increased, certain changes in growth characteristics became evident. Some of these characteristics were elongation of stems in internodal areas, basal submersed leaves and stems became chlorotic. Also, changes in the developnent of chlorophyll and other photosynthetic pigments were noted in upper submersed leaves.
Sago pondweed was morphologically modified more than the other species. As the shading effect became greater, growth characteristic~ typifying apical clom1nance were pronounced. In sediment concentrations of 2,500 and 5,000 ppn, leaf and stem tissue were becoming extremely chlorotic at the termination of the test.
Sago pondweed appeared to be the least shade tolerant of all species tested and waterweed the most tolerant of shading. These differences are due in part to the variation in leaf area, waterweed having considerably more total leaf area. stem elongation and pigmentation changes observed during these tests may be a response to the decrease in available radiant energy of the complete visible and near-visible spectrum or specific portions of that spectral range. Interpretation of these specific cause and effect factors is beyond the scope of the study and would require further extensive laboratory investigations.
The photographs of plant specimens in Figures 19 and 20 show some typical responses to shading by suspended sediments.
CO?CLUSIONS
Data obtained under the conditions described in this report indicate that suspended sediments have a considerable effect on reducing the intensity and spectral quality of solar radiant energy penetrating sediment-laden waters. These effects vary considerably with sediment type and become more pronounced as sediment concentration increases.
Submersed aquatic plants• response to this shading effect varied somewhat with the species tested, but in general, data fraa this study indicate that low concentrations (50 to 100 ppn) of suspended sediment create sufficient shading to produce some growth reductions of submersed aquatic plants. This amount of growth reduction would not be considered critical to the extended survival ability of the plants .. Sediment concentrations greater than 1,250 ppm would be necessary to cause plant growth reductions that might be considered critical to the plants• ability to survive.
9

In the authors' opinion, maintaining a concentration of fine sediment of 1,250 ppm by weight in most canals would appear generally infeasible. A field study would be necessary to determine any possibility of control for each canal.
This was a limited study in which only 3 species ot weeds and 2 types of sediment were tested at 6 levels of concentrations.
10

1. Atkins, W.R.G., G. L. Clarke, H. Petterson, H. H. Poole, C. L. Utterback, and A. Angstrom, "Measurement ot Subn&rine Daylight," Extra.it du Journal du Conse1,l Internation Pour L'Exploration de la Mer, Volume XIII, No. 1, 1938
2. "standard Methods tor the Examination ot Water, Sewage, and Industrial Wastes," Tenth Edition, by APBA and AWWA, 1955
3. Birge, C. A., and C • Juday, "Transmission ot Solar Radiation by Waters of Inland Lakes," Volume 25, Transactions Wisconsin Academy ot Science, 1933
4. Withrow, R. B., and A. P. Withrow, "Generation, Control, and Measurement ot Visible and Near-Visible Radiant Energy," Radiation Biology, McGraw-Hill, 1956
5. Meyer, B. s., and D. B. Anderson, "Plant P~iology," D. Van Nostrand Company, Incorporated, 1947
11

ACKNCllLEDGMENTS
The authors express their appreciation to Messrs. R. A. Dodge, Jr., and D. F. Nelson ot the Sediment Investigations Unit, Hydraulic Laboratory Branch, tor their assistance in establishing and naintaining sediment concentrations during the course ot the study., to G. w. DePuy and c. J. Benton of the Petrographic Laboratory Section, Chemical Engineering Laboratory Branch, tor petrographic descriptions ot the sediment naterials used in the study, and tow. M. Batts ot the Division ot Engineering Laboratories tor the photography.
12

Table 1
Representative limnophotometer readings taken on_July 11 1959, from 9:30 to lla.m. on a cloudless day. Corresponding approximate toot candle values indicated. Instrument readings indicated 1ri microamperes. Initial readings indicate water depth where first measurable light occurred ranging trom. Oto 0.2 microamperes.
ACCESSORY EQUIFME?n' USED OVER CELLS • • O,pal dittuser and . Opal d1ftiiser and • . •
Sediment type: Ml glass diftuser : red tilter : blue tilter and . :Water: siirlace :Submersed:Water: Surface :su'bmersed:Water . SUrface ce : su'bmersed cell
concentration: : Foot • : Foot :depth,: cell • cell :depth,: cell : · cell :depth, • •
:Microa.mps :_canclles:Microanaps: ~a:. cm :Mlcroa.mps:Ricroamps: cm :Mlcroamps :Mlcroamps: cm • • . . • • • • • • . . • • • . . • . • • .
5,000 ppn • 7,200 : 9,620 : Initial : · -- . 26·· : 1,050 : Initial : 19 • 700 : Initial: 8 • . •
Bentonite • 7 200 · • 9 620 • · --192 • 75: • i . • , • ·. • 2,500 ppn • 7,206 : 9.,620 : Initial-: -- • • • Bentonite • 7,200. : . 9 620 : 105 · : 42 : 20 ~ • . . . . 1, 50 ppn . 7,200 • 9 -••'i t . -- . : Initial:
• • I .. - .-~· • • • . 7;200 : 9,620 : . .77 . 30: 31 • • . 10 . 700 • 29 • 10 . . . . . . . . . 7,209 : 9,620·: 275 . ll6: 20 • • • • • • • • • • • • . • 7,200 ~ . • ~'IV : "' • ... , • .
• 7,200 • : 4,100 : 31 • 1,050 • 700 • 31 . 6oo . 385 : :31 • • . . • . • . 7,200 • : 5,100: 20 . 1.,050 . 770 . 20 . 6oO • 420 . 20 . • . • . • • • • 7,200 . : 6,180: 10 . 1,050 . 81Jo . 10 . 6oo • 490 • 10 • . • . • • • . . 7.,200 : 6,180: 5 . 1,050 . 81Jo • 5 • 600 . 56o .. 5 • . . . . . •
,,_.,v Pllll . : . -- . . 1,100 : Initial : 17 • 50 : Initial: 10 . • . . Angostura . : . . 7 : 10 . 1,100 ; 20 . 8 . . . . . • • . . • .. • ll6 : 5 • • . •
• • . • • • 2, ppn •· . • -- . 10 . : Initia 50 : In ti.al.: . . • • • Angost\11'& • • • . • • . . • • .
• • . • . • • ·• .. • • 5,000 ppn . 7,200 : 9,626: Initial: -- . :- 4 . 1,·200 · : Init:lal : 4 . 700 · : Initial.: 2 . • . ~ostura_ -: . • • • . . • • • •
- -. . • • . . • • . •

Table 2
DRY WEIGHTS OF PLANT MA'JERIAL EXPOSED TO SUSPENDED SEDD1ENTS
(Plant Material Sampled Above Soil Line)
oven dried 62° c--72 hours Averye weight two replications : : Species {weignt Iii grams J
Type of . Sediment and . culture concentration :P. pectinatus:P. nodosus:E. canadensis . .
Propagule Control 0.08, 1.465 1.212 · Propagule . Angostura, 50 ppm 0.23 : 1.490 0.653 .
Propagule Angostura, 250 ppm . 0.611 0.760 0.363 . Propagule : Angostura 8oo ppm 0.096 . o.468 0.218 . Esta l.ished : Control • 9 . 2 • • 9 . Establ.ished : Angostura, 50 ppm 1.188 . 1.814 4.753 . Established : Angostura, 250 ppm 0.097 0.989 3.030 Established : Angostura, 8oo ppm 0.074 . 0.504 1.719 . Propagu).e : Control . 8.018 1.686 0.471 . Propagule : Angostura, 1,250 ppm . 0.198 : 0 0.193 . Propagule : Angost.ura, 2,500 ppm . 0.085 0 0.055 . Propagule : Angostura, 5,000 ppm • o.u6 . 0.085 : 0.049 . . Established : Control 3.443 • 2.149 4.2§8 • Establ.ished : Angostura, 1,250 ppm . 0.081 1.05 0.925 . Established : Angostura, 2,500 ppm 0.090 • o.453 1.017 . Established : Angostura2 52000 ppm 0.365 • 0.065 0.928 . Propagule Control 1.229 . 0.664 1.071 . Propagule . Bentonite, l.,250 ppm : 0.542 : o.4oo 0.041 . Propagule Bentonite, 2,500 ppm 0.222 0.077 0.124 Pro e Bentonite, 5,000 ppm: 0.162 . 0.017 0.091 . Es a ishe Contro . • • . Established : Bentonite, 1,250 ppm: 3.933 . 1.864 0.812 . Established : Bentonite, 2,500 ppm: 0.638 : 0.687 0.907 Established • Bentonite2 52000 ppm : 0.247 0.112 • 1.273 . .

Table 3
~TS OP SHADING BY VARIOUS CONCENTRATIONS OF COMMERCIAL SODIUM BEN'l'ONI'l'E SEDIMENT ON CERTAIN POTAM)GE'l'ON S~IIS (Test 1)
: : Sedi-Culture :lllum ment tlE!, : Bo. : OODC P. ~tinatus :Growth*: :Growth*: P. toliosus :Growtli*
Propagule culture
: 1 :Control:Norma.l growth, some chlorotic and
: necrotic tissue, not
11 12
. . : Normal growth, not . flowering .
: : : flowering : : : :
29 18
:Small amount of' growth,: 7 : not fruiting : 8
-- - -- . _:-·owtl'-, not : 2 : 50 ppm:Normal. growth, not : :Normal gr -~· -~ 24 -L - and • 6 ~ . rr . noweri!!§ . . : : nowering : : noweri : 24 : fine not fruiti : 24 _,.... ______ -rth, emergent 3 : ppm:Normal growt :Normal growt-. -------- ~, -n-- ,. __ ,_ -------·-- - .. ':3 . ~ . leaves, slight elonga . . - - , : leaves, slight elonga- : 31 : growth, leaves and 31
ppm:Normal growth, excepting elongation of
: lower portion of stems. floweri
. . :
29 29 . .
. tion of' lower portion . . of stems I not nower . :Normal growth, one pot : slightly ch1orotic, . abnormal pigmentation, . . notnowe .
-: 5 :Control:Normal growth, nature : 14 :Normal. growth, some
. . : ~
30 . . . . :"'"2l>
. . stems very fine
: Propigules did not develop
- - is of' emergent . 24 . : : : stage of growth, not : 13 : necros - _ -· - _ __ s, not nowering . . : : : nower1ng : : leave . . . . . --. . . . .
: b :50 ppm :Norma.J. grOWtin, rrui.t1ng: :c!::S :l'fornal growth, submersed: 33 :Small. amount of : : : : 20 : leaves, exhibited : 32 : not flowering
: 6 . . . . :0
0 : . . :13' . 10 . :
: : : : : abnormal pigmentation, : : :
Vegetatively : : : : : fruiting : : : established: 7 :200 ppm:NormaJ. growth, not : 22 :Nonal growth, submersed : 32 :Mature stage of growth,: 18 culture : : : flowering : 20 : leaves, exhibited : 30 : not flowering : 12
: : : : : abnormal pigmentation, : : : : : : : fruiting : : :
: 8 :866 ppm:Norma.l growth, one : 29 :Normal growth, submersed: 35 :One culture normal, one: 28 : : : culture not well : 13 : leaves, exhibited : 31 : culture did not : o : : : developed, not : : abnormal pigmentation, : : survive, not : : : : flowering : : elongated internodes on: : nowering : : : : : : lower stem, fruiting : : :
*Designates total terminal growth in inches tor each replication of potted plants following exposure to concentrations of'
suspended sediment tor a period of' 6 weeks. _

,f\ ·~
l> "O :0 r
ID Ol 0
PLANTS·\ rPERFORATIONS !!,
o I ' ' ,~ cf ~ ,VANES 0 f......_ J' 0 I
I '-'- /
\. '~ 0 ~- -j.._ 0 0 .......__, ( ,,J:. \
0 Q I ,, .,,,.._ \ ,, ' \ n (-'\o ,_Lv. ...... r,
HALF PLAN } I ,
I
MOTOR __ ., ___ _
SCREEN~
w. s. -3i ~I
FUNNEL--" , PROPELLER_,
t .. t I ) 2i Pl PE--,, v
' --II
-- 22 I.D. DRUM ---A
~---- FLOW ----ti PERFORATED FALSE BOTTOM,,
3411
I I I I I I I I I I I I I I
J: A A~I l: ·----•------·-.~-~ I '-I " I '--1 I IA '- _y_
'---VANES--' VE RTICAL SECTION
APPARATUS TO HOLD FINE SEDIMENT IN SUSPENSION
:0 111..,.. .,._ OG> :oc -I ;:o G)ITI Ill ~-NI ....

Figure 2 Report Gen 27
Limnophotometer assembly, consisting of two photocells, one a submersible unit (2), the other a surface unit (5), a control box with appropriate instrumentation (4), and colored filters (3).

OI
"' I I I I I 1 I I . I I I I
-------------ULTRAVIOLET--------- VIOLET ->t-C- - - BLUE ------ GREEN -- --->1¥ELLO\V*C·ORANGE-..,.c ------- ----RED - --- - -------INFRA 1407 ~ I I I I I I RED
N
130 BLUE FILTER
-------TRANSMISSION .J
t:::,
120-1 8300 r---11----,----t-----t-----+-----+---~L+~~--l-----J .J 110 .J LLJ 0 0100 l-o iE 90
u. O 80
>-1-> 70 j::
~ 60 LLJ (/)
LLJ 50 > j:: cl: 40 _J
LLJ a:
30 ::,!? 0
20
10
0
> m 0 LLI 2 50 .----- _ a: ~ ct LLI :E ~2001r--- I ~ I / V ~ "'l ' -r i" 1 •o I \ I,__ __ "' , • I ~ \ I
RED FILTER . TRANSMISSION
0 ::c a. LL. 100 0
en LLJ tct a: 50t-------,r-1r------t-------+-------+-------+-------+-------+----.----+-----;----1
UJ > tct _J LLI a: 300 350 400 450 500 550 600 650 700
WAVE LENGTHS MILLICRONS
a---o RELATIVE RATES OF PHOTOSYNTHESIS
(FROM MEYER AND ANDERSON)
-RELATIVE SENSITIVITY OF PHOTOCELL
SPECTRAL RANGE I. RELATIVE RATES OF PHOTOSYNTHESIS 2. BLUE AND RED FILTERS 3. LI MNOPHOTOMETER PHOTOCELLS
750
::u
"'"" -o-0 G) ::uc -t :ti G>l'TI m :2ua I\) ....

~ N
13.0
Cl) ...
12
II
10
9.
..J 8. 0 > ::i 7. ..J
::E 6.
5
4
3
2
0
,o
~
::,
::,
0
0
0
0
... ·-,o
0
0/ 0
.. VjO" V'
~
1000
V ,
/ /
/ /
V ,,,,
/ /
/ /
.-V ,,
/ /
/ V
~
2000 3000 4000 5000 6000 7000 8000 9000
FOOT CANDLES
CONVERSION OF MILLIVOLTS TO FOOT CANDLE UNITS (MILLIVOLT READING OBTAINED FROM PYRHELIOMETER)
/ fl"
~ V
10,000 11,000
:u 11'1 'Tl ,, -OG) :uc -I ::0 G) I'll 11'1
iZ ~ IO ..,

(/)
IJJ 0:: IJJ
7000
6000
5000
0.. 4000 :ii: Cl 0 0:: 0
:ii: 3000
2000
1000
0 0 1000 2000 3000 4000 5000 -6000 7000 8000
FOOT CANDLES
CONVERSION OF MIOROAMPERES TO FOOT OANDLE UNITS (MICROAMPERE READING OBTAIN ED FROM LIMNOPHOTOMETER)
9000 10,000
::u ,,, "D 'Tl
-~G) -iC G') :0 ~rn • (Jt NI
_______________________________________________________ __,...,

~ 100 NI ---~
~
MONTMORILLONITE CLAY-,.. ~
t ~
r
ID CJ)
0
90
80 z <( I I-
a: w 70
V -' -' <(
:E Cl)
~ 60 w 0 a: w Q..
50
40
30 0.1
/ /
0.2
' ~
.... /,
V V /
/ /'f
/ /
/ / ,
/ <ANGOSTURA RESERVOIR SI DIMENT
J
)I ,
/.,,
/ 'f'
V
/ 0.4 0.6 0.8 1.0 2.0 4.0 6.0 10.0
DIAMETER OF PARTICLE IN MICRONS
GRADATION - WET CONDITION OF SEDIMENTS
----
20.0 40.0 ::0 fT1 "'O o,, ::0 ---i G>
C :::u
G> rn ITI Za, I\) .....

Fig
ure
7 R
epo
rt Gen
27

1000
\
900 \ \
\
\ '"-.. 800
\ \ \
"' \ i\
\ \ .""" \ '"' 700 '-I- \ \ \ ,(,
\ P-< z ---DRUM 4
IIJ ::.
\ i5 IIJ (/)600 0 \ ~ I !
80 r;l , ,, I ~ 'i 11 A a. ,, I '1 ,1
(/) '1 d II I I A I I :::::, I I ,, I I (/)500 IL l I I
,, p I ,\ ,, 11 I I I I
, , , ,\ II I I 11 I I I I I :1
0 ,, :i : 11 I I I I I: I II I 11
I , . ,• I 11 I I I II 70 I-
11 I I I
:c /', ,~ I I ,, I 11 11 l' :, 1 ,: I 1'
1 ' I~ '
I I I: , If I II I ,1 C) ,, ,1 I I
,, I\ ,' V
1f 11 '1 I II ,, I ,1
i4oo I I I II . , '1 I 1, f I I I 1, I
~ ,' ' I ,, ,'\, II
I I I I I ' II I I
>- 11 ' ,, t 11 ' I ' I I
m If I ~ I I ,'1: 60::. " I I
~ a. ' 1• ' ,, I Q. ' IL 300
0 I
IIJ II: :::::,
"' ~
' ,-ORUM 3
9,.. II: 200
I IIJ
" ""'" ~I"- j<..... a. \ r----- '"--::. r---.... IIJ I- '\ ~
...,
100 r---'-o...... J_ -- -DRUM 2
50 I
............. ......, r--o ~
'"" "'--- i'-....
~ I"'
I ~ • -TEMP. °F- DRUM 5 I ,1 ,,.,,. I I
/1 I ,: ~ ,\ " I t ,1 ,, I I 1 ,1 I I
I I /1 I • " ,, ,, I II " I I
I 11 1 I :,1 I I I/ fl,. II : / I I I II
I 11 ~ ~ I 1, I I 1 1 II I I I I I II I '1 '', I:, ' , , I
I 11 I ~ ,, I I
" ,, I
f ~ " I ' I ' I ,, I
I '
'ii.. " N I'\. ", "' " ........
" " - ' ~ r-----.. ............ "
FIGURE 8 REPORT GEN 27
~ ............ ..........
\ \ \
~ I I " 4 ~ I I
l1 I
" /I I
I I I 1, 11 I I , , ~ ', 1
' 1' I I 11
,, I 1, I ,, II II I I f ' r I ,, I
,~ , I
., '.• 1f I
\ \
\.
'-"~
" I~ ' 014 16 18 20 22 24 26 28 30 I 3 5 7 9 II 13 15 17 19 21 23 25 27
JULY AUGUST
SEDIMENT CONCENTRATIONS AND WATER TEMPERATURES
IN DRUMS CONTAINING PROPAGULES -TEST I
612

FIGURE 9 RFP0RT r.FN. 27
1000
\ \ \ \ 900
\ \ \ I'\ Ills \
\ r--- ....___ \ \ \ \ 800
\ \ '\ ~ i"' \ \ ~
\ \ '"" '\ i\ I"' \ r-.... ['-..
700
\ \ \"' I- ""· ··DRUM 8 z llJ :ii
' \ i5 llJ 1/) O 600 - ----llJ 0 z llJ a. 1/) ::> 1/l 500 IL 0 I-::c (!)
iii 31: 400
>-m :;; a. a.
300
"' \. \ DRUM 7 \ --l'--o-. , -~
200
I\ \ 't-- ..... J'
._ "~ --I'--. "'---- ~ -.......
\ I'-100
I'.. I'-.
,._ ~ 0.. .,,-- ~RUIM 6 - \ ~ "' "'-r--. ~ "' 50 ...., "'A 'I r-o ---- l..J' ........ \ - ..........
"" '\ "r..... ~"'---- "'----0
14 16 18 20 22 24 26 28 30 I 3 5 7 9 II 13 15 17 19 21 23 25 27 JULY AUGUST
SEDIMENT CONCENTRATIONS IN DRUMS CONTAINING ESTABLISHED CULTURES-TEST I
612

<n
""
100
~90 l&J
°' ::>00 I-<(
°' ~70 :::E l&J I- 60
eoooi-----t--t--t---t---t----t---t--1Q--t--t--t----,1----t---+--+--+--+-+-+-+--+--+--+--+-----,1--~1------,--+--+--+--+--+----l---l---l------l-------l
I\ '
7000 I t t I I ~ k I 11 ~t I I I r 01 I t- 6000 z l&J
\ \
:::E 0 l&J
~ 5000 l&J 0 z l&J
\ / ,, Y.
0. IJ)
;;: 4000 u.. 0
~ 1'1 11 \J i-ir D+~?"' j\11 r I'\
II I I
\ V\ I '1 \ // I j I \ I \ I \ I \ V \/ \ / ,
V
{\ 1. I f\
\ 'I ··1 . Ii \ I V \ / \ I " -,
11\ I \ I \ I V
\ \ I
V
f1
I I I l \ I! u
I\ I I
' ' '-'-, "t
DRUM 2-,
(\ I' l
'J
"-\, 1/ lJ.
~ i I 1_,, \ \ I \
I 'I I ,, ·---, / V 1/
V
I I 01 I 011 Hffi I I H=I I I I I 1--4-.
TEMPERATURES DURING TEST NO. 2,
' '-\ ~\ Ir\ " I 1/\ \'1\Ji,1\J\ V_ \!I \q \JI \ Ii .•
:\ . I ........ 1 " / I r, \ 1 \f\ ~- I 'I I \ I \ _, \ \ I \ //
\J \, \I \/ \_,
i.,., ~' \ ~ \ I
\, \ / \ ·1' f' " 'v \
•
l-\ i'"I
I l!h
\ I \ ; \ , \ ;I \ 11 \ / \ I \ I , I \ I \,1 d \_/ \ I \ I \1 'I
"i ~:+Nffi, ~ 3000 N >-
N ~ ....
li . ........, ~I rt---+- I'll N-LLLJ
m
~ ""ut+tt,N. DRUM 3,,
r-+-1\ r-+--L rt--t- 1r--t-aL o&.... iN--L
1000
0'--....1.-...L.--'--'----'-----'-...L.-..L..--'--'----''------'-...L.-..L.._.,___J'------L-...L.-..L..-..L...-'----'--...J.-...L._.J..._..L..._J.___J_...J._....L.._.J..._..__.__----'-....L..-..L..--I
17 18 19 20 21 22 23 24 25 26 27 28 29 30
JUNE 2 3 4 5 6 7 8 9 10 12 13 14 15 16 17 18 19 20 21 22 23 24
JULY
SEDIMENT CONCENTRATIONS AND WATER TEMPERATURE
IN DRUMS CONTAINING MONTMORILLONITE SEDIMENT-TEST 2
100
90 ~ l&J
°' 80 ::>
~ °' 70 l&J 0. :::E l&J
60 1-
50
,, i:l Tl o,, C,)
""'c "' ::0 ~1'11
""O ...

~
6000
1-z 5000 LIJ :. iS LIJ 1/)
0 LIJ !i! 4000 LIJ a. 1/)
ii! LI. 0 1-:i:: Cl)
;;:; ;i:
~
l a.
3000 I
2000 I
' 1000
0
\ ~ t-,...
r---..... I' f I"' ........... 'r--
r--..... "'-- r-- ....__
" 1..........., • r-..,... ....... r"-. ·DRUM B
I\ ~
"' I'---... "" It-- Ir-- II'---.._ ,..._ -- r--.... ---..._ ,..._ - ---~ -.. r---- "~ --~ ....... ~--... r--, - -DRUM7
t--
'" r-... t----. - It- ....... 1~ ~ ~ ~
,..._ -- .... -.... -.. r-- ~-r--...,
-,..._ --f--..c -t--la..
••• ·DRUM 6
"
~ ~ ~ 20 ~ ~ ~ ~ ~ ~ V U ~ 30 2 3 4 5 6 7 8 9 10 II 12 13 14 15 16 17 18 19 20 21 22 23 24
JUNE JULY
SEDIMENT CONCENTRATIONS IN DRUMS
CONTAING ANGOSTURA SEDIMENT-TEST 2
=

O>
"'
100
~90 I
llJ
~80 !;;; a:: l&.170 D.. :::E llJ I- 60
50 1200
1100
1--1000 z llJ :::E 900 ci llJ Ill
I 0 800 llJ 0
~hoo I D.. Ill ::,
I Ill 600 IL 0 , I- 500 :c tl)
I ~ 400
>
I I
'"
r--...
m , ......... :::E 300 D.. D..
I zoo
' 100 ,__
, ... \' IJ
~
........
-
,\
I\ , , I / I I I\
I \ I I ' I
I I
~ ,, ,J \ I \
\/ \! y
I"\ ["-. I'-..
'\ ,, ....._
-" 1--...
...............
" --
I I I TEMPERATURE ~. • ~ I\ I r\ I
I ,'\ ,., I \ I I \ I ,, \ I \/ \ \ \ \ \ ' V I/ V " \ , \ I " \/ \ ~ \! ,,
.
~ DRUM I, ',
" .t.
I'\. ---I"--- r-.. r- r-.
DRUM 2, r, 0.... :,.
o-_ -.J --Pl. 1 ~ " ~
" - ~
" ... g,- ', -.:t. " ~
I I I I I I ; I DURING, TEST NO. 3,, i ;
! ' ii ' ! I ~. I\ I fl
" I\ I '\ . I A • \ \ I
/\ I\ \ I \ I t, I\ ,, \ I I f\ \ \ \j \ 1\ I \ I\
I \ \ \. 'v I I I \ I
' \ I I \ \
\I I \ \, I V I I \.i \J I .
I
" " r\... r--.... \ "" - ~~ \
\ " I'-.. I\ ~
I\
:,. ~
'I'-... .......... 1 - ...... ~ ---, I'--I'---.... .... t---'(
- " ----., -r -- ----. -, 0-14 15
~ 16 17 18 19 20 21 22 23 24 25 26 27 28 29 30 31
AUGUST 2 3 4 5 6 7 8 9 10 II 12 13
SEPTEMBER
SEDIMENT CONCENTRATIONS AND WATER TEMPERATURE
IN DRUMS CONTAING WINTER BUDS AND ANGOSTURA SEDIMENT-TEST 3
!
I !
!
100
90 t a::
80::, I< a::
70 llJ D.. :::E llJ
60 I-
50
"' i:;.,.. o-,OG) ... C: C> ::u ~(Tl
~"5

!!! "'
1300
1200
1100
~ 1000 II.I :E i;i 900 1/1
fi:l 800 C z II.I 0. 700 1/1 ::::, 1/1 i,.. 600 0 I-~ 500
iii 31:: >- 400 m
f 300 0.
200
100
0
I\ ' I\
\
~
" P-- r--
DRUM 8--
i
~ ~~ \ .........
I\
CRUM 7-
I"-
"" "" f'\. ~r--
r--r-
' I"-\i \~ I'\ ·, I
\ I\ "~
r----- I\
''). I'\.
"' r-..... ~ '-. '
f'\. DRU~ 6 ,i", r'\ r--... r--- N-~ r--r-. "'
\
\ l,.
I",._
\ ' i\. ~
' \ I\ '\ \ I"-. I\ I", \ '\
I\ \,
~ \
I~ '
I'-
~I', r--... " I n
I'\) ....,,
r-..... I ....... r--, r--r-.... " r--- " -0 - \ ~ I'\.
""- \, - r----. ~r---.... ~ r-,.. r- r----. r--I""- r---, r-14 15 16 17 18 19 20 21 22 23 24 25 26 27 28 29 30 31 2 3 4 5 6 7 8 9 10 11 12 13 14
AUGUST SEPTEMBER
SEDIMENT CONCENTRATIONS IN DRUMS CONTAINING
ESTABLISHED PLANTS AND ANGOSTURA SEDIMENT-TEST 3 :u 11;,. o-:a G)
""c G> ::tJ ~ITI
Ito oi ....

(a)
Jackson Turbidimeter Equipment
Figure 14 Report Gen 27
(b)

~ ..
I> .. :u ,...
"' a, 0
1-5000ppm I /aoo ppm I I I , , -2500 ppm, ,,250 ppm ,-aoo ppm,-250 ppm
100 [7.;::!;:~$=="":;:~::!:==!=;:/;::;.==r=--t----=~l::.-i;7.y~---::;;;;-:::~-=::::::=+'="==-=-j-...----i------t:----r~":?-:::l---:::~~r----,---r-----r----i------::::::~----1
80 ? I I I Y
I- " , 1 / ':··v / / ,, 1;· / v
~ 11 / Control----- ::// / ::I~ ~ 11 I / d!1 • !1lil / ::i 70
(/) 'l' / / ljll// V / ij / V ::J I I. I dl 11 Control- ---»/ '1 1 Control- -
::> I/ / 111 / I
11. 60 1 I '" I
~ I I I V 'ill I / :,, I / z I 1 / ,11 / I! / ~ 50 I I I ,, ,~ I
g II/ 111 / I/ ~ o 11 11 I I I UJ I 11 / /
: 40 ;'.. / '! : V ~ V z 1t I I I I UJ 11 I I / I
~30',1// I .I !( o.. 'i't I / I/ /
Ill I I I I If / 1'1' I I ,, ,,, I I I
20 lfj I I
V FULL SPECTRUM WAVE LENGTHS ,, / RED WAVE LENGTHS // BLUE WAVE LENGTHS
I/ 300 TO 750 MILLIMICRONS ~ / 600 TO 700 MILLIMICRONS // 400 TO 500 MILLIMICRONS
,, , I I
10 ~ I I I I I I i/ I I I I I I t I
10 20 30 40 50 60 10 20 30 40 50 60 10
WATER DEPTH IN CM
Note, Extreme ends of curves denote maximum depth of measurable light
PERCENT REDUCTION OF FULL SUNLIGHT
PRODUCED BY ANGOSTURA SEDIMENTS
20 30 40 50 60
:u "'"fl ,,_ OG>
~i G>111
"' z-• (JI
"' ....
"' ;;;
,. ,, :u r
"' Cl> 0
100
90
1--80 :i:: C)
...J z :::> 70 rn ...J ...J :::> LL LL 60 0
z 0 i= 50 0 :::> 0 11.J a: I- 40 z 11.J 0 a: ~30
20
10
5000 ppm-, /,2500 ppm --1250 ppm 5000 ppm--, ~2500 ppm ~ --1250 ppm ,-5000 ppm -2500 ppm
'It f JI \\. if ;:' I /
Ii V ~
.,,.,..... /J.? ~ I
/' / '--1250 ppm
/ / ,/ / /
Ii/ / 11/ I/ ,· I I I Control
I I
I I I -- I I I
!11 ',y I I I I I I I? ,!
I' I / I I I / It/ / ,11 II 11 / ,,, /
I I t1 I I If
,,, hi
/ I/ , / ,,, / I I I Control----/ ,,,
Control-
/ 11 / ,,,
!! / 'd ,,
V /
11 / I / I I I I I I I I
I / I I I / I/
I' ,f FULL SPECTRUM WAVE LENGTHS
I 300 TO 750 MILLIMICRONS
" I I I I
10 20 30 40 50
II I / 'I' / '1 I ,,,
1 I / I ,1, !t ,1, V / "' ,,,
/ ,l! !I
ill ~v / '1' '1' l:1 'I /
,, ,, / ,, /
,, ,1 i
'I / I
I// RED WAVE LENGTHS I I 600 TO 700 MILLIMICRONS ,/
I , I II
I I I I
60 10 20 30 40 50 60 10
WATER DEPTH IN CM
Note, Extreme ends of curves denote maximum depth of measurable light
PERCENT REDUCTION OF FULL SUNLIGHT
PRODUCED BY SODIUM BENTONITE SEDIMENTS
BLUE WAVE LENGTHS 400 TO 500 MILLIMICRONS
20 30 40 50
v-
60
"' ... "V "11 o"' G> ... c G> ;:o 1'111'1
~-"' a, ....

OI 1\1
J> "ti ::u r
II) a, 0
10U~-+----+-----+---------r-7
ti)
2 0
~ ~l-¼--+--+--+-------1----------.l-~ I z 0
le( ~ 501--fh-t--+--t-------1-----------1------l IILi z ILi a. 2 40 =, 2 X ct
::E 301-+-tt-+\-+--t-------1-----------1------l I&. 0
:c IQ. ILi 20 Q
~ ILi I-
-FULL SPECTRUM
-RED WAVE LENGTHS
; 10 1 I I,/ I 'L:::: -,~ I I I \
50 250
'BLUE WAVE
800 1250 2500 5000 SEDIMENT CONCENTRATION -PPM
ANGOSTURA SEDIMENT
101--+-------11-------------+----f
601--~------+------------+----t
501--~----+---+------------+----t
,,FULL SPECTRUM
401-+---------1---..,----------1-----1
30 I I I ~ - .. ,, '• I \ .........
20 '
BLUE WAVE l .1
LENGTHS- .,,
',RED WAVE ', LENGTHS '
--------101--+-------11-------------+----f
1250 2500 5000
SEDIMENT CONCENTRATION - PPM BENTONITE SEDIMENT
AVERAGE MAXIMUM PENETRATION DEPTH OF LIGHT INTO SEDIMENT LADEN WATER
::u I'll .,, "11-0(i) ::uc -I ::tJ G)l'Tl I'll z_ ;_, -.I ....

~
"'
J> ,, :u ,-
co OI 0
z 0
100 .-------------r-----"T""-------r-----...... ---..----"T""----..... -----.------
901---------------1-----+---------t------+----,..-t---+-+-~----1-----+--,,lf--------1
aoi-------------+-----+-------+-----+-t---...... +-+---+-----+-+--+------1.--------1
AVERAGE REDUCTION ANGOSTURA SEDIMENT---
I(,)
~ roL---------+-----+---_:_--t/~~~+--t----1--1---t----,--7 ~ P. peclinolus 1_.--AVERAGE REDUCTION .._ ANGOSTURA r BENTON ITE SEDIMENT :i:
~ SEDIMENT----- /
~ ~L--------+----+--~l--~~---+--t-----t:._ __ -t ___ 1 ___ 1 1-z C( ..J a.
E50L----------l-------j~f---/L--f-------+--7f---f-------t----1---1 (,)
a: .... a.
£. conodensis _,-ANGosTuRA .,,.-
SEDIMENT----
40 i------------t----.,-+-+-----+-----+--+---1-------1--------1----__J P. nodosus ANGOSTURA
'--SEDIMENT 30 t-------------+-----+-------+------+----+-----+------1-------1------1
20 ,._ __________ _,_ ____ _._ ______ ._ ____ j.,_ __ .... __ ....L, ____ ...L, ____ ...L, ____ _,
50 100 250 500 800 1250 2500
SEDIMENT CONCENTRATION - PPM BY WEIGHT
PERCENT PLANT WEIGHT REDUCTION PRODUCED BY SUSPENDED SEDIMENTS
5000 21 I'll
~:!! 21G) -tc G) :0 :111 ~iii

Growth of an established culture of Elodea after 4 weeks in a control drum
Growth of P. pectina tus propagules after 4 weeks in a control drum
Figure 19 Report Gen 27
Growth of an established culture of Elodea after 4 week exposure to 5000ppm cone. of Angostura sediment
Growth of P. Sectinatus propagulesaier a 4 week exposure to 5000ppm cone. of Angostura sediment
Typical growth of submersed aquatic plants exposed to shading produced by suspended sediments

Growth of an established culture of P. pectinatus after 4 week exposure to 1250ppm cone. of bentonite
Growth of an established culture of P. nodosus after 4 weeks in -a control drum
Figure 20 Report Gen 27
Growth of P. pectinatus propagules-after a 4 week exposure to 2500ppm cone. of Angostura sediment
Growth of an established culture of P. nodosus after 4 week exposure to 2500ppm cone. of Angostura sediment
Typical growth of submersed aquatic plants exposed to shading produced by suspended sediments

13

APPENDIX A
PETROGRAPHIC DESCRIPTION OF COMMERCIAL SODIUM-BASE BEN'l'ONITE SEDIMDI'
The bentonite is light gray in color with a slight greenish cast. Particles are generally subrounded in shape. Size of the particles ranges :f'rom less than 0.0l mm to 1 mm in diameter, averaging about 0.1 .m.
X-ray diffraction analysis of the bentonite indicates that it is composed essentially of sodium montmorillonite clay, minor amounts of feldspar ( including both potash and plagioclase feldspar), quartz, and trace amounts of calcite. Clay-staining techniques· were employed, and a montmorillonite color reaction was obtained on the sample. The estimated quantitative analysis of the bentonite, based upon microscopic observation and X-ray diffraction line intensities, is as follows:
Montmorillonite Feldspar {plagioclase and potash) Quartz Calcite
94 percent 4 percent 2 percent
Trace

APPENDIX B
PETROGRAPHIC EXAMINATION OF SEDIMENT FROM ANGOSTURA RESERVOIR
X-ray diffraction and differential thermal analyses tests were conducted on the clay sample. The sample of clay was round to have the following approxinate mineralogical composition:
Calcium beidellite Quartz and chalcedony Illite and mica Kaolinite Feldspar Calcite Organic natter
4o-6o percent 15-20 percent 10-15 percent
5-10 percent 2 percent 5 percent
Small amount
The calcium beidellite is a montmorillonite-type clay which contains frequent silica-for-alumina substitutions in the crystal lattice, and also has most of' the exchange positions occupied by calcium ions. It is a swelling-type clay, but not to as great an extent as a $odium montmorillonite. The other clay minerals, kaolinite and illite, are nonexpanding clays and also will disperse in water, as will the beidellite. All of' these clay minerals will contribute to the opacity of a suspension of the sample in water.
15

APPENDIX C
Some Engineering Considerations by P. F. Enger
Limnophotometer readings were plotted to determine percent of light reduction, at various depths, from intensity of light at the water surface. Plots of data, Figures 1 and 21 indicate percent reduction to be a log normal function. Data plotted well with practically no deviation (skewness) at the tails; however, some deviation from the log normal function occurred in central terms. The tails, which are of greatest interest, can be easily and fully described by substituting for the depth below water surface (y), a function of the log of the depth Y~·
y~ • log2 y
As there is no skewness of the tails, the normal or Gaussian equation resulting can be written in the form:
where:
100 f Y<f, .l. (Y;-M~)2. f (Yt6) = O"tf, v'fic -oo e i 0'4> . dytJ,
(y~) = percent reduction in light tor depth y~ below surface
~ = lo~ ot a mean depth where 50 percent light reduction would occur, if normal equation were to follow tails condition
6~ • standard deviation in terms of log2 of y,, 100- is used as a constant to change light reduction to a percentage
For the substitution log to the base 2 (log2) was selected. 'Dlis results in easy plotting as log2l = 0 1 log22 = 11 log24 = 21 10828 = 3, etc.
The M,6 and 01, values for the curves determined with the opal glass are shown in Figures 1 and 2.
To determine percent light reduction due to sediment, the percent light reduction tor a given depth in the control drum was subtracted ·from the perce11t light reduction at the same depth in drums containing sediment. Plots of the results are shown in Figures 3 and 4. 'lhe figures show light reduction for total visible portions of the spectrum.
16

Studying the figures shows that tor depths ot less than 1 toot (30.5 cm) below the water surface, percent light reduction due to various concentrations ot suspended sediment varies considerably. However, at depths ot more than 1 foot below the water surface, all sediment concentrations approach the same percentage light reduction. One exception is the low concentration of 50-ppm Angostura Reservoir sediment. '!be 50-ppm curves appear to dif'ter f'rom the curve families by f'rom 5 to 10 percent. No light reduction readings were obtained at concentrations of' less than 1,250 ppm tor the sodium-base montmorillonite bentonite.
'lbese.graphs indicate that at depths ot water greater than 1 toot, a 25Crppm concentration of' a given suspended sediment would be nearly as effective in reducing radiant energy as a 5,000-ppm concentration of' suspended sediment, and that a 50-ppm concentration would be only slightly less effective. This conclusion is, of' course, restricted to the range of' light waves measured, and the accuracy of' the instrument.
To establish relations of' percent reduction by weight ot weed growth versus concentration of' suspended sediment, least square lines were titted to the data of' Table 2. Two logarithmic least square lines were fitted to Angostura sediment data, and one to the limited range of data available tor the commercial bentonite. For Angostura data, one line was generally fitted to data of less than 11000-ppm concentration, and another line for data greater than 11000 ppm. The resulting curves are shown in Figure 5. Though the number of' data available were limited, correlation coefficients were obtained. Correlation coefficients were generally high f'or data below 11000 ppm. Scatter of data at concentrations greater than 1,000 ppm, and a flattening of' the curve resulted in lower correlation coefficients. Equations resulting from titting least square curves, with their limits and correlation coef'f'icients, follow:
ANGOSTURA SEDIMENT
Plant Equation : :Correlation : Limits :coefficient . . . .
P. pecttnatus :R = -42.3 + 46.4 Log C: 50<C<900 . 0.99 . P. pectinatus :R = 84.6 + 3.52 Log C:9QO<C<5,000: o.46 P. nodosus :R = -50.9 + 45.0 Log C: 50<C<850 . 0.99 . P. nodosus :R = 49.5 + 10.7 Log C:850<C<5,000: 0.32 E. canadensis :R = -19.5 + 33.4 Log C: 50<C<780 : 0.99 E. canadensis :R = 68.8 + 2.74 Log C:78o<C<5,000: 0.77 Average of' the:R = ~37.5 + 41.5 Log C: 50<C<850 : 0.99
three plants:R = 67.3 + 5.76 Log C:850<C<5,000: o.49 . • . . : SODIUM-BASE BENTONITE
Average :R = -94.8 + 50.8 Log c:ta; C 5,000: 0.91 condition . .
Where: R = percent reduction by weight of' growth. C = concentration of' suspended sediment in parts
per million by weight. 17

The experiments described in the report were conducted in drums where the mean velocity was directed toward the water surface and there was no resulting average horizontal velocity. In flowing canals or laterals the opposite is true, or, the mean velocity is in the direction ot the canal or lateral, and there is no resulting average upward velocity. As plants are by no means rigid, any resulting horizontal velocity will tend to deflect them. (In these tests, resulting upward velocities did not tend to create a horizontal deflection of the plant.) In the field, any lateral velocity would force plants to deflect at various angles, depending on the velocity ot the water and the condition of the plant. This would require the plant to produce longer stems than those produced by plants in these tests before its tip reached a comparable light intensity. Figure 6 is a graph of' the additional elongation required versus the angle ot deflection. Assuming a channel 3 feet deep and that light for aiding plant growth is not available at depths ot greater than 1 foot below the water surface, the figure indicates that it the velocity were such that a deflection between plant tip and root of 60° resulted, -it would be necessary for the plant to become twice as long to reach the same level ot light intensity as those tested. However, velocity fluctuations of the flowing water rray result in fluctuations of the plant which would aid in reducing the effective elongation necessary to reach the light source. There is the possibility that resulting deflections plus fluctuations rray contribute such srrall corrections that they can be neglected. It is also possible that the plants rray be forced to such lengths as to actually create more obstruction to the flow.
From preceding discussions, it becomes obvious that reduction in growth of a given plant 1n a flowing channel cannot be related simply to the concentration of suspended sediment, but must be a
function of: (1) concentration of suspended sediment, (2) type of. suspended sediment, (3) velocity of' water in the channel, and (4) depth of water in the channel. Also, plant response will depend on type of plant and other biological factors within the plant and soil. These discussions show the equations given should be considered as applying only to the test conditions used in this study, and that additional studies would be necessary to evaluate other effects.
18

99.99 100
60
40
UJ20 0
~ IA
99.9 99.8 99.5 99 98
-r BJ II.Ii~
CONC. PPM
BY WT.
~ CONTROL
50 250 800
1250 2500 5000
95 90
I M9)
4.5 3.7
3.0 1.8 1.2 0.5
,-Q.6
-1.6
0"9)
1.08 5.17
ill !..:.!§. ~ 1.10 1.00
0.99
80 70 60 50 40 30
.:.J-c
,c;m-
-t=l:t:'1-t.-Et:~-
o:·t + -~-,-+-:f'T-=i=-,
+X·i::j:
20 10 5 ,.1 2
1+
tr~
-p: J-t-
llt!:1-
™I' ,r,-H+, Tlf I ~\ -,,.m / , I
0.5 0.2 _0.1 0.05 J!_.01
I r:1:t·
,-l-
+ •j,HOOfl'lt'
Ir ::, (/)
:E ·O Ir
I I I I 11 I I I I I 1 I I I I I 1 I ! 11 ! I i, ; I I\" I I 11.l''I I I I I I I I- 1 1 1 111 I' 1 1 1 1 11 r! I 1 1 1 11 r I ! r, /. Tr I' I I Al 1111 I I I I ll . I 11 111 I 11 I I ii t I ,~ / f.L I I 1111111 I I I
LL 10
:ii 0
z
::c IIL UJ 0
11· I ! I 111 I 11 I I ii, · 7 , · I I / ,11: , 11 111111 -r 1 111 1., v. r u .~ 1 1/\.
,_/:J? .. '1£F=I_:+ B"
+
~::i
--- r=r.:
II mlllll 11 I l IITT
1 ~. 1111111111111 1 !11111111111 -I 1111111111111111111111111111111111111111111111111111111111111-1 I 1 11111111111111111111111 I_ r1 0.01 0.05 0.1 0.2 0.5 I 2 5 10 20 30 40 50 60 70 80 90 95 98 99 99.5 99.8 99.9
PERCENT
PERCENT OF LIGHT REDUCTION
LIGHT REDUCTION RECORDED WITH OPAL GLASS -IN WATER CONTA:INING ANGO$TURA RESERVOIR SEDIMENT
PLACE IN
99.99
)> ,, ,, I'll z ~ X
? :u I'll ,, 'Tl o:u C) -IC: G> ::u 1111"1'1 ;z_ N ....

.99.99 100
99.9 99.8 99.~ 99 9.8 95 90 80 70 60 50 40 30 20
:p:
' m-, 60 ,±$,
.:f+l--!--t- tL if4+-P
40
l&J u20 ct II. 0: :::, (/)
::!l 0 0: U.10
::!l (.)
~
::c IQ.
cL-ttt ~1±:E
-l-.--1-
~ 1··tH+ ,-1
EL+t~ ~=rt!
-E~c'\?l'
-~~:i.1r:
-t+t-H
CONC. PPM BY WT.
1250 2500
"~f_t,,5000
M¢
4.5 3.7 T:4 0.6 0.3
<1"¢
1.08 5.17 1.47 I .55 1.52
_J_
!-
St i--,~~£t-: :gtJm:--tii~~
LJJ1Jt~l - ~ ii II I 11 munmmntl1Utffiflfflff 1--t--1-1-i I !!!ii! 1111 I I I 11 i 111111
CTilil~~. Jjnti~ t f 1-+-+-+-+-+H-1-H-HI-H 111 I I I I I I I I I I l-1++-lll+l-!+++++++H-H+H-H
H+rtt rrttl-Htl+H I ~:r,j,:t=ti===t=l==l=!=t,,t=tt:1::rt:!=l":f::~=l=!'::l=l:l±tll*I:~~~ -·¥nr-=1=t~i:1~-.-- H-+:•
_gg"' '-·,r-:· r=F...!:~} -+="ft-~-
:-•±J t:-.
;+-t-1
l&J L" • 0
±:
_i
t-
10
E
5 2
~i f
0.5 0.2 Q,I O._Oli
B
·I .-.Jg__ - , 0.01 0.05 0.1 0.2 0.5 2 5 10 20 30 40 50 60 70 80 90 95 98 99 99.5 99.8 99.9
PERCENT OF LIGHT REDUCTION
PERCENT LIGHT REDUCTION RECORDED WITH OPAL GLASS IN PLACE IN WATER CONTAINING SODIUM-BASE MONTMORILLONITE BENTONITE
o_.01
99.99
J> ,, ,, IT'I z 0
X
n I
;Q IT'I ,, 'Tl o;QC) _,c
;;o ~ITI ;z I\)
N ...,

50 PPM, 50 PPM,
' --t "' ............ ,
250 PPM,,. I IO I I I ' I ::-,, I ' \ I LT uu ,.,.,. __ . :::-,, ' 1,P'. ~ £ I I , < < :...- I <ll>
~ 20 I I I \I I X/ ! I :.ff I r I I I
I-~ 4011 I l-j?l?~7~=---t---J~5~ w I / ~ o r ,~ I ,, ' 7 :,1 r 7 I I I I I
OPAL GLASS
RED FILTER ---
BLUE FILTER----
50
60 "--..1...-----~.....,,r; ____________ ...... _____ __. _____________ .,__ _________ ~ 10 20 30 40 50 60 70
PERCENT REDUCTION OF LIGHT INTENSITY DUE TO SEDIMENT
PERCENT REDUCTION OF LIGHT INTENSITY DUE TO ANGOSTURA RESERVOIR SEDIMENT CONCENTRATIONS AT VARIOUS DEPTHS BELOW THE WATER SURFACE
80
J> "O "O Ill z 0 x 0 I
::u Ill "11. "0-0c., ::uc ~:u ffllTI j2 (>I I\)
~

e u
w 0
1250 PPM---
10
~ 20
~ ~ ~ ~ ,
0 J
~~
:I: la. w 0
,- 5000 PPM
OPAL GLASS
RED FILTER -
BLUE FILTER----
40 1----1--------+------.,C,C.--+--------+-----."----+--------+---------,f---------1----1
/
/ 50
10 20 30 40 50 60 70 80
PERCENT REDUCTION OF LIGHT INTENSITY DUE TO SEDIMENT
PERCENT REDUCTION OF LIGHT INTENSITY DUE TO SODIUM-BASE MONTMORILLONITE BENTONITE
SEDIMENT CONCENTRATIONS AT VARIOUS DEPTHS BELOW THE WATER SURFACE
):,, ,, ,, 1"11 z 2 X
? ~ 1"11"1'1 ,,_ Oc;, ~c .... ~ ~I'll ;z .e. N ...,

30
40
50
0: I z 0
I- 60 0 ::::, C l&J 0:
I- -70 z l&J 0 0: l&J 0.
80
90
100 0
I I
ANGOSTURA SEDIMENT-
\ R PECTINATUS: --
\ R=-42.3 + 46.4 109 C (50<C<900) R= 84.6 + 3.52 109 C (900<C<5000)
P. NODOSUS:-- -
\ R =-50.9 + 45.0 109 C (50<C<850)
\\ R= 49.6 + 10.7 109 C (850<C<5000)
ELODEA:----,,-
'~ \ R =-19.5 + 33.4 109 C (50< C< 780) R • 68.9 + 2.74 109 C (780<C<5000)
~ AVERAGE CONDITION: -----
R =-37. 5· + 41.5 I 09 C (50< C< 850)
\ R = 67.3 + 5.75 109 C (850< C<5000)
SODIUM BASE BENTONITE-
~ ... '\. -............_ AVERAGE CONDITION:------
\ "\,0- ,.............._ R • - 94.9 + 50.8 109 C ( 1250< C< 5000) ,,............_, __
I\,,~~ .___, __
~,-~,---- -----... , SODIUM BASE BENTON I TE
.. , ------------------- ELODEA
"' "· ~----~ ............_ __ --- - - P. NODOSUS - - - AVERAGE CONDITION
~ P. PECTINATUS
200 500 1000 1500 2000 SEDIMENT CONCENTRATION (PPM) - C
PERCENT REDUCTION BY WEIGHT OF DIFFERENT PLANT MATERIALS AS A FUNCTION OF THE SEDIMENT CONCENTRATION
l> "ti "ti 111 z !:! X 0 I
;a ITl"TI ,,_ oc:, ;a C: -I ::u G> r,, 111 :Z (JI
N ...,

100
.... 75 !... z 0
I-(.) ILi ...I IL ILi 0
0 ILi II.I 3 IL 0
ILi ...I (!)
z <(
50
25
0 0
'
V ~
/
100 200 300 400 500 600 700 800 PERCENT OF INCREASE IN LENGTH
PERCENT INCREASE IN STEM LENGTH NECESSARY FOR PLANT TO REACH A COMPARABLE LIGHT INTENSITY IF PLANT IS DEFLECTED BY VELOCITY
900
J> 'ti 'ti 111 z ~ X
? ::0 111-., 'tlOc;, ::0 C: -i ::0 ffllTI /Z a, N ...