Embed Size (px)
Citation preview

University Microfilms, Inc., Ann Arbor, Michigan
HUSSAIN, Md. Sultan, 1940-A GENETIC STUDY OF THE GRAY HYDROMORPHICSOILS OF THE HAWAIIAN ISLANDS.
67-13,699
This dissertation has beenmicrofilmed exactly as received
University of Hawaii, Ph.D., 1967Agriculture, soil science

A GENETIC STUDY OF THE GRAY HYDROMORPHIC
SOILS OF THE HAWAIIAN ISLANDS
A -DISSERTATION SUBMITTED TO THE
GRA"DUATE DIVISION OF THE UNIVERSITY OF HAWAII
IN PARTIAL FULFILLMENT OF THE REQUIREMENTS
FOR THE DEGREE OF
DOCTOR OF PHILOSOPHY
IN
SOIL SCIENCE
JANUARY 1967
--By
Md. Sultan Hussain
COMMITTEE IN CHARGE:01"'. Leslie O. Swindale, Chairman01"'. G. Donald Sherman01"'. Gordon A. MacdonaldDr. Yoshino1"'l Kanehi1"'oDr. Ralph Moberly, Jr.

ACKNOWLEDGEMENT
The author wishes to express his thanks to all his fellow
students who helped him throughout his stay in Hawaii.
Thanks are due to H. Kimura, G. Tsuji, and R. Voss for
their helpful suggestions in many parts of this work.
Thanks are also due to the Center for Cultural and Techni
cal Interchange Between East and West for awarding a scholarship
which made it possible for me to come to the United States of
America for graduate studies.

11
ABSTRACT
The morphological, physical, chemical and mineralogical
properties of six soil profiles representing typical Gray Hydro-
morphic soils of the Hawaiian Islands were studied. The unique
morphological feature common m all but one of these soils was
-the presence of mottled horizons in the subsoil. Presence of
mottles was· considered to bear testimony to a fluctuating water
table in the profile throughout the year. Clay-sized materials in
these soils ranged from 60-90%.
Cation exchange capacities were moderate to high (21-85
m. eq. per 100 grams of soil). . Ca++ and Mg++ were the two
dominant cations present, but considerable amounts of Na+· were
also found. Percent base saturation in all but one soil profile
was very high.
Moisture retention at 0.33 bar was higher than the moisture
equivalent value except in one profile. Moisture retention at
moistu~e equivalent showed a significant correlation with moisture
content at 0.33 bal".
The pH values In most of these soils were high. Despite
high base saturation the 6pH (pH in N KCI solution - pH in
H 20) were unusually high and ranged from 0.30 to 1.25 pH
units.
Free iron oxides were low in gley horizons and increased
near the surface of the soils. In less hydromorphic soils free

iii
iron oxide remained constant throughout the profile. Free
manganese oxides followed a similar distribution pattern to that of
free iron oxides.
Montmorillonite was the dominant mineral in the clays of
strongly hydromorphic soils, whereas metahalloysite was dominant
in the clays of less hydromorphic ones. In the clay fractions of
all soils there was a trend of an increase of montmorillonite and
a decrease of metahalloysite with depth. The montmorillonite type
mineral was identified as an iron-rich montmorillonite or nontronite.
Chemical analysis of the purified fine clay fr-action of IIICca hori
zon of Nohili soil gave the following structural formula:
(XO. 74KO.ll) (Si7 .S2AIO.48) (All.8sFel.66MgO.3STiO.l0)
°20(OH)4
This mineral had a sur'face area of 720 sq. m/gm of clay and a
cation exchange capacity of 94 meq/l00 gms of clay.
Gleization was considered as the major soil-forming process
In operation in these soils, the intensity of which increased with
increasing drainage impedance. The presence of high amount of
metahalloysite in the least hydromorphic soils was explained on
the basis of the principle of "pedogenic hysteresis".
The decrease in metahalloysite content with depth was con
sidered to be authigenetic. High concentrations of bases and silica
in .soil solutions derived from weathering basalts of nearby uplands
is suggested as the cause of synthesis and stability of montmoril-
iv
lonite clays.
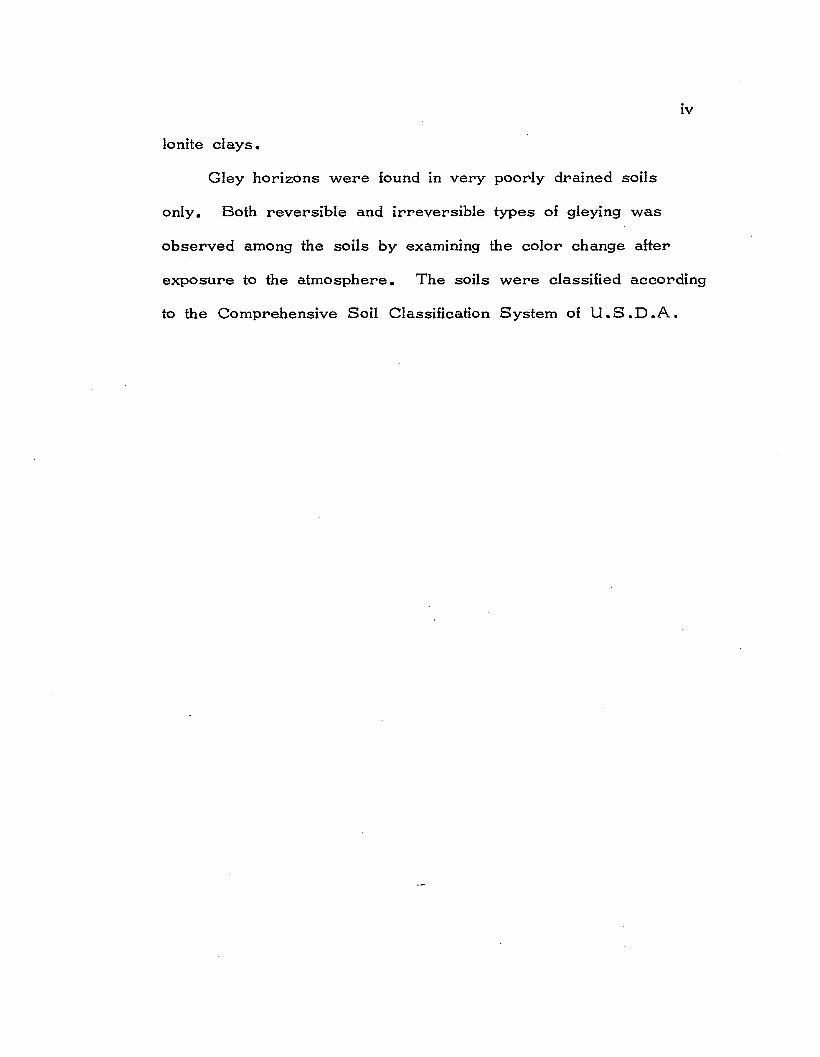
Gley horizons were found in very poorly drained soils
only. Both reversible and irreversible types of gleying was
observed among the soils by examining the color change after
exposure to the atmosphere. The soils were classified according
to the Comprehensive Soil Classification System of U. S •D .A .

TABLE OF CONTENTS
v
. . . . . . . . . . .. . .
ACKNOWLEDGEMENT.
ABSTRACT ••••
LIST OF TABLES
. .• 0 0 0 0 •
. . . .· . . .· . . .
. . . .• • • •
Page
11
xii
LIST OF FIGURES · . . . . . . · . . xv
INTRODUCTION • • • • • • · . . . · . . . . • • • 1
REVIEW OF LITERATURE · . . . . . . . . . . . 4
Early Ideas on Hydromorphic Soils · . . . . . . 4
Locational and Environmental Factors in the. Genesis of Hydromorphic Soils • • • • • • · . . 5
Location in the landscape • • • • • • • • 5
Environmental factors. • • • • • • • • • 5
The functional-factorial approach • • • • • • • 6
· . . . . . . . . . . .State factor equation
Role of drainage • • • • . . . • • • • • • •
7
8
Groundwater Table in Hydromorphic Soils • · . . 9
Morphology of Hydromorphic Soils • o • • • • • 0 11
Epipedon . . . . . . . . . . . . . . . . . 11
Mottled horizon • · . . . . . . . . . . . 12
Gley horizon. • . . . . . . . · . . . • • • 12
Chemical Properties of Hydromorphic Soils · . . 14
. . . . . . . . . . . . .Reduction of iron
Cycle of manganese · . · . . . . . . .14
16

VI
TABLE OF CONTENTS (CONTINUED)
Page
Mineralogical Composition of Hydromorphic Soils.. 18
Clay minerals • • • • • • • • • • • • • • • 19
Processes of Glei Formation • • • • • • • • • • 20
Chemical theory
Microbial theory
• • • • • • • • • • • • • •
• • • • • • • • • • • • • •
22
25
Processes of Secondary Mineral Formation inHydromorphic Soils •• • • • • • • • • • • • • 26
• • • • • • • • • • • •
Synthesis of clay minerals
Transformation of minerals,THE PARENT MATERIAL
• • • • • • • • •
• • • • • • • • •
27
30
34
Types of Parent Materials • • • • • • • • • • • 34
Noncalcareous alluvium • • • • • • • • • • • 35
Alluvium from weathered basalts. •
Alluvium from hydrothermally-alteredrocks .'. • • • • • • • • • • • •
• • •
• • •
35
36
Calcareous alluvium • • • • • • • • • • • • 38
THE SOILS •••••••• • • • • • • • • • • • • 40
Gray Hydromorphic Soils of Hawaii • • • .' . • • 40
General information on soil environments • • • 41
Location of sampling sites. • • • • • • • • • 44
EXPERIMENTAL METHODS. • • • • • • • • • • • 48
Physical Methods. • • • • • • • • • • • • • • • 48

..Vll
TABLE OF CONTENTS (CONTINUED)
Page
Soil moisture retention • • • • • • eo. 0 0 48
Maximum moisture holding capacity andmoisture equivalent • • • • • • • • • • • • • 48
15-bar pressure moisture.· • • • • • • • • • 49
o•33 bar pressure moisture • • • • • • • • • 49
Separation into Size Fractions • • • • • • • • • 50
X-ray Diffraction Methods. • • • • • • • • • • • 51
Using K-saturated, parallel-oriented specimens 51
Using Mg-saturated, ethy''1ene glycol-solvatedparallel-oriented specimens • 0 •• • • • • • 52
Using random powder • • • • • • • • • • • 52
Chemical Analyses • • • • • • • • • • • • • • • 53
• • • • • •
Organic matter •
• • • • • • • • •Soil pH • • •
... • • • • • • • • • • • •
53
53
Free iron oxide • • • • • • • • 8 • • • • • 54
Free manganese oxide • • • • • • • • • • • 54
Carbonate determination. • • • • • • • • • • 54
Total nitrogen • • • • • • • • • • • • • • • 55
Cation exchange capacity (CEC) • • • • • • 55
Ammonium acetate extractable cations • • • • 56
Total analysis • • • • • • • • • • • • • • • 56
Determination of ferrous iron • • • • • • • • 59
Heating Weight- Loss Studies • • • • • • • • • • 59

viii
TABLE OF CONTENTS (CONTINUED)
Page
Petrography • • • • • • • • • • • • • • • • • 60
Differential Thermal Analysis (DTA ) • • • • • • 60
Estimation of Mineralogical Composition of FineSilt and Clay Fractions •••••••••••• 60
&
Preparation of Standard Curve for Kaolinite byX-ray Analysis • • • • • • • • • • • • • • •• 62
Calculation of montmorillonite formula. • • • • 63
RESULTS AND DISCUSSION • • • • • • • • • • • 65
Morphological Characteristics
Depth of solum. • • • •
• • •
• • •
• •
• •
•
•
• • • •
• • • •
65
65
Mottles . . . . . . . . . . .- . . . . . . . 65
Glei horizon • • • • • • • • • • • • • • • • 72
Carbonate horizon • • • • • • • • • • • • • 73
Gypsic horizon • • • • • • • • • • • • • • • 74
Color of soils • • • • • • • • • • • • • • • 75
Causes of morphological differences · . . ~ . 76
Physical Properties • • • • • • • • • • • • • • 77
Soil moisture retention • • • • • • • • • • • 77
Maximum moisture holding capacity • • • 77
Moisture equivalent and 0.33 bar moisture 78
15-bar moisture • • • • • • • • • • • • 88
Particle size distribution • • • • • • • • • • 90
Clay fraction • • • • • • • • • • • • • 90

-,lX
TABLE OF CONTENTS (CONTINUED)
• • • • • • • • • • • • • •
• • • • • • • • • • • • •
• • • • • • • 00. e •
• • • • • • • • • • •
Page
92
93
94
94
95
96
98
99
104
106
109
111
111
113
116
118
123
127
129
130
136
136•
•
• •
• •
• •
•
• •
• •
• •
• •
• ••
•
• • •
•
•
•
• •
• •
• •
• •
• •
• •
•
•
•
• • • • •
•
•
•
•
•
• • • • •
•
•
•
•
•
•
• • • •
• • • • • •
•
•
• • •
•
•
•
•
• • •
•
• • • • • • •
•
•
•
•
•
•
•
•
•
•
•
• •
•
•
•
•
•
•
•
•
•
•
•
• • •
• • • • • • • • •
•
•
• • • • • • • • • • •
••
•
•
• • • • • • •
•
• • • •
• •
•
• •
• • • • • • •
• • •
• •
•
pH values with water. •• ••
pH values usmg N K CI solution •
Carboninitrogen (C/ N) ratios •
Calcium carbonate
Free iron oxide
Cation exchange capacity
Exchangeable bases • •
Exchangeable Ca++ •
Exchangeable Mg++ •
Exchangeable Na+ •
.6.pH values
Organic matter.
Honouliuli soil
Free manganese oxide
Soil pH •
Total phosphate
Titanium oxide.
Silica and sesquioxides •
Silt fraction
Sand fraction
Chemical Properties
Clay Mineralogy
x
TABLE OF CONTENTS (CONTINUED)
Page
Pearl Harbor soil • • • • • • • • • • • 141
K alihi soil • • • • • • • • • • • • • • • 142
Laie soil
Kaloko soil
• • • • • • • • • • • • • • •
• • • • • • • • • • • • • •
150
.154
Nohili soil • • • · . ... . • • • • • • • 158
PROPERTIES AND FORMATION OF INDIVIDUALSOIL •• . • . • . • • . • • . . . • • . • . • .• 169
Honouliuli Soil • • • • • • • . . . • • · . . • • 169
Soil formation and weathering • • • • • • • • 170
Pearl Harbor Soil • • c • •.• • • • • • • • • • 172
Soil formation and weathering • • • • • • • • 175
Kalihi Soil • • • • • • • • • • • • • • • • • • 177
Soil formation and weathering • • • •
Laie Soil • • • • • • • • • • •
• •
• • •
• •
• • • • •
179
182
• • •
• • • • • • • • • • • • • • • • • •
Soil formation and weathering •
K aloko Soil • • • • • • • • • • •
Soil formation and weathering •
Nohili Soil
Soil formation and weathering •
• •
• •
• •
• • • •
• • • • •
• • • • •
• • • • •
185
186
189
190
193
Origin of Quartz and Mica in the Kalihi and LaieSoils . . . . . . . . . . . . . . • • . . . .. 194
GENESIS OF GRAY HYDROMORPHIC SOILS • • • 198
Explanation of Formation of Minerals from Alluvium 202

Xl
TABLE OF CONTENTS (CONTINUED)
Page
The source area • • • • • • • • • • • • • 202
The nature of depositional sites . . . . . ~ . 202
• • • • • • • • • •
Post-depositional changes •
Processes of Soil Formation
• • • • • • • • • 203
206
Explanation of the formation of Gray Hydromorphic soils of Hawaii in terms of the processof gleization • • • • • • • • • • • • • • •• 208
CLASSIFICATION OF SOILS • • • • • • • • • • • 212
Classification According to the Present System • • 212
Proposed Modification • • • • • • • • • • • • • 215
• • • • • • • • • • • •Conclusion of the Study
SUMMARY •• • • • • • • • • • • • • • . ... • • •
218
223
LITERATURE CITED • • • • • • • • • • • • • • • 228
APPENDIX • • • • • • • • • • • • • • • • • • • • 238

Table 1.
LIST OF TABLES
General Information on the Six GrayHydromorphic Soils • • • • • • • • • •
..Xli
Page
43
Table la.
Table lb.
Table Ic.
Table Id.
Table Ie.
Table If.
Coded Morphological Properties ofHonouliuli Clay • • • • • • • • •
Coded Morphological Properties ofPearl Harbor Clay • • • • • • •
Coded Morphological Properties ofKalihi Clay • • . • • • • • • • •
Coded Morphological Properties ofLaie Clay . . • • • . . • • • •
Coded Morphological Properties ofKaloko Clay • • • • • • • • • .
Coded Morphological Properties ofNohili Clay . . • • . • . • • • .
• • •
• • •
. . .
· . .
· . .
· . .
66
67
68
69
70
71
Table II.
Table III.
Table IV.
Moisture Retention of Gray HydromorphicSoils at Saturation, lS-Bar Pressure,and % Clay/1S-Bar Moisture Ratios. . .
Moisture Retention at Moisture Equivalentand 0.33 Bar, 6HOH (0.33 - M.E.)and 0.33 Bar/M. E. Ratios • • • . • •
Particle Size Distribution Analysis forthe Gray Hydromorphic Soils •• • . .
79
82
91
pH in Water, in N K CI Solution at 1: 2 . SSoil to Water Ratio and 6pH Values ofDifferent Horizons of Gray Hydromorphic
Table V.
Soils. . . . . . . . . . . . . . . . . 97
Table VI. Percent Organic Matter, Total Nitrogen,C/ N Ratios and Cation ExchangeCapacities in me. /100 gms. of Soils inGray Hydromorphic Soils . . • . • • • 100

Table VII.
LIST OF TABLES (CONTINUED)
Exchangeable Ca++, Mg++, K+, andNa+ in me/l00 gms. of Soil in GrayHydromorphic Soils .. .. .. .. .. .. • .. .. ..
xiii
Page
110
Table VIII.
Table IX.
Table X.
Table XI.
Table XII.
Table XIII.
Table XIV.
Table XV.
Table XVI.
Percent Calcium Carbonate, Loss onIgnition, Base Saturation and Exchangeable Ca++/ Mg++ Ratios of GrayHydromorphic Soils .. .. • .. • .. • .. .. ..
Percent Total Fe203, Free Fe203,FeO, and AI203/Fe203 Ratios of GrayHydromorphic Soils .. .. • .. • .. • .. .. ..
Percent Total Manganese Oxide, FreeManganese Oxide, Total Titanium Oxide,and Total Phosphate in Gray Hydro-morphic Soils .
Percent Total CaO, MgO, K20, andNa20 of Gray Hydromorphic Soils .. .. ..
Percent Total Silica, Alumina, SiIicaSesquioxide Ratios and Silica-AluminaRatios of Gray Hydromorphic Soils.. .. ..
Mineralogical Composition of Coarse Silt,Fine Silt, Coarse Clay, and Fine ClayFractions of Honouliuli Soil .... • .. .. ..
Mineralogical Composition of Coarse Silt,Fine Silt, Coarse Clay, and Fine ClayFractions of Pearl Harbor Soil ... .. ..
Mineralogical Composition of Coarse Silt,Fine Silt, Coarse Clay, and Fine ClayFractions of Kalihi Soil .. .. • .. • .. • ..
Mineralogical Composition of Coarse Silt,Fine Silt, Coarse Clay, and Fine ClayFractions of Laie Soil.. • • • • .. • .. •
114
119
125
128
131
139
145
149
153

LIST OF TABLES (CONTINUED)
Page
Table XVII. Mineralogical Composition of Coarse Silt,Fine Silt, Coarse Clay, and Fine ClayFractions of Kaloko Soil. • • • • • •• 157
T able XVIII. Mineralogical Composition of Coarse Silt,Fine Silt, Coarse Clay, and Fine ClayFractions of Nohili Soil • • • • • • •• 159
Table XIX. Loss on Ignition of Fine Clays « O. 21J,)of Gray Hydromorphic Soils • • • • •• 163
Table XX. Percent Tota! P205, MnO, MgO, andK 20 in Fine Clays of Gray HydromorphicSoils. • • • • • • • • • • • • • • •• 164
Table XXI. Percent Silica, Alumina, SilicaSesquioxide Ratios and Silica-AluminaRatios of Fine Clay Fractions of GrayHydromorphic Soils • • • • • • • • •• 165
Table XXII. Percent Total Fe203, Ti02 and A1203/F e203 Ratios of Fine Clay Fractions ofGray Hydromorphic Soils • • • • • •• 167
Table XXIII. Mineralogical Composition of the ClayFractions' « 21J,) of Six Gray Hydro-morphic Soils. • • • • • • • • • • •• 199
T able XXIV. The Classification of the Six GrayHydromorphic Soils According to theu. S • D.A. Comprehensive Soil Classifi-cation System. • • • • • • • • • • •• 214
Table XXV Classification of Gray HydromorphicSoils According to the ProposedModification • • • • • • • • • • • • . . 219

xv
LIST OF FIGURES
Page
Fig. 1. Map of Oahu, Hawaii, Showing theLocations of Sampling Sites of HonouliuliSoil in Ewa Sugar Plantation, PearlHarbor Soil Near Pearl Harbor and LaieSoil Near "Waimanalo •••••••• • • • 45
Fig. 2.
Fig. 3.
Map of Kauai, Hawaii, Showing theLocations of Kalihi Soil to the South ofHaupu Caldera, and Kaloko and NohiliSoils in the Mana Plain • • • • • • • •
Correlation Between Percent Moisture at0.33 Bar and at Moisture Equivalent(Kalihi profile excluded from this figure).
• •
• •
46
81
Fig. 4. Correlation Between Percent Moisture at0.33 Bar and at Moisture Equivalent inthe Kalihi Soils • • • • • • • • • • • • • • 84
Fig. 5.
Fig. 6.
Distribution of l:IHOH (0.33 bar HOH Moisture Equivalent HOH) "With Depth. •
Correlation Between l:I HOH and PercentMontmorillonite in the Kalihi Soils. • • •
• •
• •
85
86
Fig. 7. Distribution of Mean Percent Moistures atMoisture Equivalent, 0.33 Bar and at 15 Barof Some Gray Hydromorphic Soils • • • •• 87
Fig. 8. Distribution of Organic Matter with Depth inSix Gray Hydromorphic Soils • • • • • •• 103
Fig. 9. Distribution Pattern of Total Nitrogen withDepth in Six Gray Hydromorphic Soils • •• 107
Fig. 10. Profile Distribution of Excha~geable Na+ inSome Gray Hydromorphic Soils. • • • •• 112
Fig. 11. Distribution of Percent Fe203, CaC02Equivalent and Si02/R203 Ratio of SomeGray Hydromorphic Soils with IncreasingDegree of Hydromorphism • • • • • • • •• 117

XVI
LIST OF FIGURES (CONTINUED)
Page
Fig. 12. Vertical Distribution Pattern of Free IonOxide in Six Gray Hydromorphic Soils • • • 121
Fig. 13. Distribution of Percent Free Fe203, MnOand Total TiOZ in Some Gray HydromorphicSoils with Increasing Degree ofHydromorphism • • • • • • • • • • • • •• 124
Fig. 14. Profile Distribution of Free ManganeseOxide in Some Gray Hydromorphic Soils • • 126
Fig. 15. Distribution of Percent Si02, Al203 andSi02/Al203 Ratios of Gray HydromorphicSoils with Increasing Degree ofHydromorphism • • • • • • • • • • • • •• 133
Fig. 16. Distribution of Percent Alumina, Si02/R203Ratios and Si02/Al203 Ratios of Fine Claysof Gray Hydromorphic Soils • • • • • • •• 134
Fig. 17. X-ray Diffraction Patterns of Fine Clays inthe Surface Horizon (Ap ) of Honouliuli SoilUsing Preferentially Oriented Specimens ofMg-Saturated, Glycolated, K-Saturated andHeated at 25°, 110°, 350° and 550°C 137'
Fig. 18. X-ray Diffraction Patterns of Fine Clays ofBottom Horizon (C2) of Honouliuli SoilUsing Preferentially Oriented Specimens ofMg-Saturated, Glycolated, K-Saturated andHeated at 25°, 110°, 350° and 550°C ••• 138
Fig. 19. Correlation Between Percent Fe203 andPercent Montmorillonite in Deferrated FineClays of Some Gray Hydromorphic Soils •• 140
Fig. 20. X-ray Diffraction Patterns of Fine Clays ofSurface Horizon (Al) of Pearl Harbor SoilUsing Oriented Specimen of Mg-Saturated,Glycolated and K-Saturated and Heated at 25 ° ,110°, 350° and 550°C. • • • • • • • • •• 143

..XVll
LIST OF FIGURES (CONTINUED)
Page
Fig. 21. X-ray Diffraction Patterns of Fine Clays ofthe Bottom Horizon (IIC2g) of Pearl HarborSoil Using Oriented Specimen of MgSaturated, Glycolated and K-Saturated andHeated at 25°,· 110°, 350° and 550°C • •• 144
Fig. 22. X-ray Diffraction Patterns of Fine Clays ofSurface Horizon (Ap1) of Kalihi Soil UsingOriented Specimen of Mg-Saturated, Glycolatedand K-Saturated and Heated at 25 0, 110 ° ,350° and 550°C. • • • • • • • • • • • •• 147
Fig. 23. X-ray Diffraction Patterns of Fine Clays ofthe Bottom Horizon (IICG) of Kalihi SciilUsing Oriented Specimen of Mg-Saturated,Glycolated and K-Saturated and Heated at25°, 110°, 350° and 550°C • • • • • • •• 148
Fig. 24. X-ray Diffraction Patterns of Fine Clays ofthe Surface (Ap1) Horizon of Laie SoilUsing Oriented Specimen of Mg-Saturated,Glycolated and K-Saturated and Heated at25°, 110°, 350° and 550°C • • • • • • •• 151
Fig. 25. X-ray Diffraction Patterns of Fine Clays ofthe Bottom Horizon (B3g3) of Laie SoilUsing Oriented Specimen of Mg-Saturated,Glycolated and K-Saturated and Heated at25°, 110°, 350° and 550°C • • • • • • •• 152
Fig. 26. X-ray Diffraction P~tterns of Fine Clays ofthe Surface Horizon (Ap1) of Kaloko SoilUsing Oriented Specimen of Mg-Saturated,Glycolated and K-Saturated and Heated at25°, 110°, 350° and 550°C. • • • • • •• 155
Fig. 27. X-ray Diffraction Patterns of Fine Clays ofLowest Horizon (III C 1G) of K aloko SoilUsing Oriented Specimen of Mg-Saturated,Glycolated and K-Saturated and Heated at25°, 110°, 350° and 550°C. • • • • • •• 156
Fig. 28.
Fig. 29.
Fig. 30.
Fig. 31.
Fig. 32.
Fig. 33.
LIST OF FIGURES (CONTINUED)
X-ray Diffraction Patterns of Fine Clays ofSurface Horizon (Ap l) of Nohili SoilUsing Oriented Specimen of Mg-Saturated,GIycolated, and K-Saturated and Heated at25 0
, 110 0, 350 0 and 550°C ••••••••
X-ray Diffraction Patterns of Fine Clays ofthe Bottom Horizon (lVC) of Nohili SoilUsing Oriented Specimen of Mg-Saturated,Glycolat3d and K-Saturat....)d and Heated at25 0
, 110 0, 350 0 and 55lJ o C ••••••••
Differential Thermal Analysis Patterns of FineClays of Surface Horizons of GrayHydromorphic Soils • • • • • • • • • • • •
Differential Thermal Analysis Patterns ofFine Clays of the Bottom Horizons of GrayHydromorphic Soils • • • • • • • • • • • •
Distribution of Percent Kaolinite andMontmorillonite of Clay Fractions of SomeGray Hydromorphic Soils • • • • • • • • •
Distribution of Percent Total Iron Oxide andA1203/Fe203 Ratios' in Fine Clays of GrayHydromorphic Soils .. • • .. .. • .. • • • • •
...XVlll
Page
160
161
200
201
205
210

INTRODUCTION
Gray Hydromorphic soils are a non-homogeneous group of
soils because of different provenance of their parent materials.
Materials from different types of rocks and different weathering
histories have been brought down along the slope by the agencies
of transport, and deposited neal" the lower elevations of landscape.
On these materials of diverse origin the effects of impeded
drainage are superimposed. Whatever be the cause of this
drainage impedance, the ultimate product is the same. For any
soil property, the intensity of change depends on the intensity of
drainage impedance.
Drainage, therefore, may be regarded as a unifying factor
In the formation of hydromorphic soils. If the degree of drainage
impedance is strong, the soils will assume new characteristics
both in morphology and mineralogy in consonance with their new
environment. Soils, where the intensity of drainage impedance
is weak, will show morphological characteristics of their present
environment but will reflect the mineralogy of their source region.
Determination of the genesis of a particular soil is a com
plex problem. This is because in any particular soil a host of
processes are operating simultaneously. The characteristics that
a given soil assumes are the reflections of the cumulative effect
of all the soil forming processes. Although it is difficult to

2
fractionate quantitatively the role of each of the processes involved
In its formation by studying the properties of a particular soil, it
is certainly possible to determine the role of the prominent
process.. This may best be done by choosing soils from suitable
sites where all the soil forming factors, except the one under
study, are practically constant. Soil scientists for a long time
have tried to undertake such studies in various locations and for
various purposes. The study of the effect of drainage on soil
formation is a common one, and terms like "catenary sequence"
and "hydrologic series" in soil sCIence are but attempts toward
the direction of determining the degree of the effects of this
particular factor - drainage.
The hydromorphic soils occur over a large part of the face
of the earth. Usually, they are present on alluvial flats, flood
plains, deltas, backswamps and valley bottoms.. All these are
locations where deposition of sediments is the primary phenomenon
in the formation of landscape ..
In Hawaii the gray hydromorphic soils are located along the
coastal fringes on alluvial flat lands.. These soils are affected by
varying degrees of drainage impedance.. The present investigation
embodies morphological, chemical and mineralogical analyses of a
number of soils from this gray hydromorphic group interpreted in
the light of the intensity of hydromorphism .. The objectives of this
project are:

3
1. To identify the minerals present In various fractions of
these soils and to estimate their amounts.
2. To correlate the mineralogical distributions and physical
and chemical properties with the environmental conditions of the
soils.
3. To determine to what extent poor drainage overrides
other factors of soil formation.
4. To examine the genesis of gray hydromorphic soils of
the Hawaiian Islands.
5. To classify the gray hydromorphics of the Hawaiian
Islands according to the new American system of soil
classification.

4
REVIEW OF LITERATURE
Early Ideas on Hydromorphic Soils
Due to their immense agricultural importance, hydromorphic
soils have drawn the attention of soil scientists from the inception
of soil science itself~ Sibirtzev (1914) was among the first to
recognize these soils and classify them in the "Intrazonal group"
of his soil classification scheme. Vilensky (1927) distinguished
four broad divisions of soils on the basis of the dominant factors
responsible in their formation. According to him, the soils of
the hydrogenic division were formed mainly in cold climates.,
Here, soil formation proceeds chiefly under water-logged con-
ditions with the development .of peaty humus. Neustreuev (1927),
on the other hand, made an attempt to classify soils according to
the processes by which they had been formed, and introduced the
term "hydromorphous" in soil science. He defined this term as
th.e process of soil formation influenced by ground water. He
later divided the hydromorphous process into two types. In the
first type capillary rise of water was a dominant condition which
gave rise to soils like saline soils and meadow with turf soils.
In the second type anaerobic conditions dominated, due to the
presence of a high water table, and gave rise to meadow and
peat soils. Joffe (1935, 1949) studied the hydromorphic soils
quite thoroughly and put them under the title "climatogenically

5
subdued" soils.
Locational and Environmental Factorsin the Genesis of Hydromorphic Soils
Location in the landscape:
Hydromorphic soils usually develop on the lowland areas
where the underground water· table can easily influence the soil\
forming process. Ruhe (1960) emphasized that the physiographic
history and geomorphic evolution of the landscape are involved in
the catena concept. He visualized four landscape elements in a
fully developed terrain: upland, pediment backslope, pediment
footslope and alluvial toeslope. It is on the alluvial toeslope of
Ruhe (1960) that most of the hydromorphic soils are located.
He further noted that soil materials on these four elements of
landscape differ from one another due to differential erosion and
deposition. This point was emphasized by Milne (1936) in his
study of soils in East Africa. In his concept of "catenary
sequence ", Milne (1936) recognized that geomorphic evolution
brings about dissimilar soH materials on different elements of land-
scape from a formation originally similar in lithologic characters.
He noted that the differential drainage conditions on such a land-
scape are the real cause for the formation of a catena ..
Enyironmental factors:
Dokuchaev (1898) may be given the credit for bringing into
clear focus the idea of an equation for soil formation with three

6
soil-forming factors. His equation was:
s = f (cl, 0, p)
where s represents soil, cl the climate of the region, 0 the
organisms (both animal and plant), and p the geologic substratum.
In the same paper Dokuchaev (1898) further noted that relief is
also important especially in the formation of extra-normal soils.
The functional factorial approach:
A host of factors are responsible for the formation of a
soil. Jenny (1941) in his fundamental equation of soil formation
has chosen five primary factors as variables. o He considered
them as independent variables and put them in the following
equation:
s = f (cl, 0, 1", p, t ••• )
where s = any soil property,
f = functional relationship,
cl = environmental climate,
o = organisms and their frequencies,
1" = topography, also including certain hydrologicfeatures (e. g. water table),,
p = parent material, defined as state of soil at soilformation time zero,
t = age of soil, absolute period of soil formation,
= additional unspecified factors.
( 1 )
In this equation Jenny (1941) has replaced the independent
01 ( I I I I II 0 h h 0 h 0variables in SOl s cl, 0, 1", p, t J wit t ose In t e environment

7
( el, 0, 1" , p, t) on the assumption that el' and el are fuz:>-ctionally
related in such a way that the value of one is uniquely determined
by the value of the other.
A change in any soil property (s) depends on all the
changes of all the soil forming factors, and Jenny (1941) has
expressed this as follows:
(osu (as) ( as) (os)ds = - del + - do + - dr + - dpocl 0,1", p, t 00 el, 1", p, t 'Or el, 0, p, t op el, 0,1", t
+ (OS)dt + •••at el, 0,1", P
But this equation does not indicate any means for ascertain-
mg the relative importance of individual variables in the formation
of a soil. To determine the role played by each soil forming
factor, it was necessary to keep the remaining factors constant,
then the soil forming fundamental equation was broken into
individual equations of soil forming factor s .:
a) s = f (Climate) to,r,p,., •••
b) s = f (Organism)el 1" p t, , " ...c) s = f (Relief) el , 0 , p, t, •••
d) s = f (Parent material) cl 0 r t, , , , ...e) s = f (.Time)cl 0 1" P, , , ,...
State factor' equation:
In a recent paper, Jenny (1961) considered soil as a part
of the ecosystem. The change in properties of this system has

8
been viewed as influxes mmus outfluxes of matter and energy.
He proposed a generalized "state factor equation" which may be
written as follows:
l,s,v,a = f (Lo ' Px' t) (3)
where I = ecosystem properties,
s = soil properties,
v = vegetation properties,
a = animal properties,
L o = initial state of the system, assemblage of propertiesat time zero,
P x = external flux potential of the system,
t = age of the system.
The factors define the state of the soil system or ecosystem
at a particular time.
Role of drainage:
In any soil, when the ground water table moves near the
surface, the drainage ( relief) tends to assume an Increasingly
dominant role in the process of soil formation. In such a
situation the differential terms in Jenny's (1941) equation may be
written as:
as «< osoel or
os «< osop or
os «< os00 or
os «< osot or
Which means that the differential of any soil property (os)

9
with respect to climate (~~l)' organism (~~), parent material
(~~) and time (~~) becomes infinitely small when compared to
os and may be assumed to be zero. The above terms, there01"
fore, drop out of Jenny1s (1941) equation, and it may finally be
written as:
ds = (OS)dr01" c1,o,p,t
Again, relief may be subdivided into two sub....factors:
o = drainage,sl = slope,
and since the slope sub-factor may be taken as zero In the
alluvial flats, the above equation further reduces to
ds = (.Q.§..)dD00 c1 , 0 , sl , p , t
Ground Water Table in Hydromorphic Soils
(4)
(5)
The maJor determining factor in the formation of hydro-
morphic soils is the excessive amount of water. Robinson (1951)
stated that the excessive wetness in a profile may be due to two
reasons: firstly, it may be -due to the presence of a regional
water table sufficiently near the surface; and secondly, it may be
a consequence of the impervious character of soil material
anywhere in the profile.
Wentworth (1951) studied the ground waters in Hawaii and
indicated that three types of ground water are important from the
point of view of soil formation. He named these ground water

10
types as: (a) Surficial ground water, which is water held in
the soil and ground immediately below the surface 0 This kind of
watel:~ is susceptible to return to the surface by evaporation.
(b) Vagrant percolating water, which is water moving downward
or laterally in accordance with the structure of permeable materials,
between the overlying zone of surficial water and the underlying
water table. (c) Perched or confined high level water, where
percolating water accumulates in pervious materials above some
impervious layer and forms· a local water table standing above an
unsaturated layer.
Robinson (1951) studied in great detail the development of
hydromorphic soil profiles in relation to the location of the ground
water table. He recognized three zones of influence of ground
water table in' soils: ( a) A shallow surface zone above the
highest level of ground water table in which conditions are always
aerobic. This is the zone where epipedons of most hydromorphic
soils are found. (b) A zone marked by the limits of fluctuations
of ground water table in which oxidation and reduction conditions
alternate throughout the year. In this zone, mottled horizons of
hydromorphic soils usually occur. (c) A zone below the lowest.
level of water table where the conditions are always anaerobic.
The gley horizons of hydl"omorphic soils develop in this zone.
11
Morphology of Hydromorphic Soils
Although the degree of wetness is the predominant factor In
molding the morphology of a hydromorphic soil, many other
factors tend to exert their influence. Differences in climate,
parent material and degree of maturity sometimes produce modi
fications which may lead to a bewildering variety of profile
morphology (Crompton, 1952).
Three distinct horizons usually are present in a well
developed hydromorphic soil. They are: ( a) an epipedon,
(b) a mottled horizon and (c)a gley horizon.
Epipedon:
Epipedons In the hydromorphic soils usually range from
thin ochric epipedons in the sandy soils to histic epipedons in the
intensely wet heavy ones.
The type of epipedon depends on climatic conditions such as
temperature and rainfall. Crompton (1952) has described the
typical epipedon in poorly drained soils as being "fairly dark
brownish gray" with a crumb to soft granular structure with
abundant grass roots. In most poorly drained soils the epipedon
usually has sufficient organic matter to be either mollie or umbric.
Another important feature of hydromorphic soils is that,
although in the lower horizons there may be no structure present,
the epipedon often has some kind of structure. This is especially
true in the gray hydromorphic soils of Hav.'aii where surface

12
horizons have a sub-angular blocky to granular structure while
the lower hOl"izons are all massive (Cline et al., 1955).
Mottled horizons:
Mottled horizons are always present in the "slightly poorly
drained" soils of G lentworth and Dion (1949) and in the upper
horizons of intensely hydromorphic soils, if there IS a fluctuation
of water table in the soil throughout the profile.
As mentioned earlier, the presence of a mottled horizon in
the soil is an indication of ·alternation of oxidation-reduction
conditions. Crompton (1952) in his study of hydromorphic soils
found mottles along the root channels, the size and shape of
which depended on permeability of the soil materials.
Differences in profile texture and structure are responsible
for variation in the size,. shape and pattern of mottling.
Gley horizons:
Until recently the study of hydromorphic soils was confined
mostly to the description of soil profiles. Although the effects of
eluviation and illuviation are not well-marked, there is still a
distinct pedologic organization in ....the profile. The most spectacu
lar feature in such soils is the development of bluish or greenish
gray horizons known as gley (G) horizons.. The word gley and
glei are used inter-changeably in this study. The process that
give rise to the gley horizons In a soil profile is known as
gleization (Joffe, 1934).

13
In most cases gley horizons occur deep In the profile, below
the permanent level of ground water (Robinson, 1951). But they
may develop anywhere in the profile, and Taylor (1959) has
suggested names for them as A-gleying, B-gleying, and C-gleying.
An extensive work on gleization andglei soils was done by
Zavalishin (1928). He described a typical glei horizon as
follows:
It is of a light gray or gray color, with a bluishhue, or sky-blue tinge. The color is not uniform; itdepends on the intensity of gleiing and on the mechanical composition of the material. Usually, the grayblue background is mottled with large red spots andveins. These spots, found more frequently with clays,are associated with cracks and root paths. Aroundthe roots, the spots may be of two kinds. If decomposed organic substances are present in the root path,a light gray-bluish glei formation with a reddish bandon the outside develops. If, on the other hand, thegleying has proceeded very far and the root path isnothing more than a tube through which air passes,then a red ring forms around it on a light-gray-bluishbackground. When the gleying is very strong ~ thematerial is of a homogenous gray-blue culorationwithout any spots or veins.
The gleization process causes certain changes In the physical
properties of soils. Regarding physical properties, Zavalishin
(1928) noted that the glei horizons are usually without structure,
more or less compact, sticky, smeary and appear to be more
clayey than the adjoining parent material.
Commenting on the change of structure of a gleyed horizon
Rode (1962) stated:

14
A structured clay, in the glei process, will turninto a continuous mass with only a few minute channelsdue to decayed rootlets. Also, the soil particlesbecome more tightly packed, so that volumetric weightincreases and porosity decreases.. Lower porosityentails a lesser degree of permeability. Thus, theglei process, caused by excess moistening, results inthe course of its own development in still worse conditions of moisture. In other words, it is able todevelop progressively.
Chemical Properties of Hydromorphic Soils
The chemical characteristics of a poorly-drained soil differ
markedly from those of a well-drained soil. In a soil from a
well-drained area the oxidized constituents such as Fe3+, Mn4+,
N03 and S04- are the characteristic ions, while in a poorly-
2+ 2+drained soil their reduced counterparts such as Fe, Mn ,
+ =NH4
and S are present~ The course of decomposition of
organic matter is changed drastically in hydromorphic soils, where
instead of carbon dioxide, organic acids and methane are produced.
Reduction of iron:
Iron occurs in soils in several forms, such as primary
minerals, anhydrous and hydrated oxides-and in clays~ Among
these, the hydrated oxides, both amorphous and crystalline, are
the most important, since they react easily to the nature of the
environment. Under reduced conditions, a large amount of iron
goes into solution and as a consequence, the phosphate-fixing
power of the soil is reduced (Bloomfield, 1952).

15
In a poorly-drained soil, especially where the conditions are
favorable for intense reduction, the concentration of carbon
dioxide is several hundred times its value in air (Ponnamperuma,
1955). This carbon dioxide, therefore, plays an important role
m the precipitation and solution of ferrous iron.
Although a large amount of iron is reduced in a poorly
drained soil, the actual concentration of ferrous ion in the soil
solution may be relatively low because of its precipitation as
ferrous hydroxide, ferrous carbonate and ferrous sulfide
(Bloomfield, 1952). Ionic equilibria govern the precipitation
reactions of iron.
Rode (1962) studied the chemical aspect of the formation of
gleys in soils. He reported that the first compound to form in
the reduction process is usually ferrous bicarbonate, Fe ( H CO3) 2.
Coming in contact with oxygen at the end of reduction, the ferrous
bicarbonate oxidizes with the formation of ferric hydroxide:
4Fe(HC03)2 + O 2 + 2H20 ~4Fe(OH)3 + 8C02
Yarkov et ale (1950) studied the effect of temperature in the
reduction process of iron in soils. Incubation of a waterlogged
soil at 0 0 C for 12 days did not bring about any increase in the .
ferrous ion, while at 30 0 C the concentration of the ion increased
manyfold.
The effect of organic complexes in the reduction of iron was
studied by Mortimer (1941) in a reduced lake mud. He reported

16
that the ferrous ion was present In the form of organic complexes
which are slightly dissociated.
Schuylenborgh (1965) studied the reactions of iron In a
reduced soil and put forward his findings as follow:
Fe(OH)2(S) ~ Fe2+ + 20H-, with
log KSO
= log Fe2+ + 210g OH- = -14.6
Fe2+ + H 20 '(~ FeOH+ + H+, with
log K1 = log FeOH+ - pH - log Fe2+ = -7.6
Cycle of Manganese:
The transformation of manganese in a poorly-drained soil
follows a pattern similar to that of iron. Manganese is more
soluble than iron.
In well-drained soils the important forms of manganese
oxides are Mn02' Mn203 and Mn304. Under reduciQ3 condition
these higher oxides are transformed entirely to the Mn2+ form.
The quantitative relationship between Mn2+ concentration, on the
one hand, and H+ concentration and oxygen tension on the other
may be given by the expression (Ponnamperuma, 1955):
pMn2+ = 0.0 + 2 pH '- 1/2 p02
Where' pMn2+ and p02 stand for negative logarithms of the con
centration of Mn2+ in moles per liter and the partial pressure of
oxygen in atmospheres, respectively.
All forms of manganese in a soil are In a state of dynamic
equilibrium with each other causing the existence of a manganese

17
cycle in soils. The two trends of reactions are: (a) The
reduction of higher oxides of manganese due to increase of H+
concentration, lowering of oxygen tension, increase of C02
pressure, and biological reactions; (b) The oxidation of Mn2+ to
the higher valence states which is brought about by a decrease
in H+ concentration and an increase in oxygen tension. In a
hydromorphic soil the oxidative portion of the cycle is suppressed
by a low tension of oxygen.
Following the condition of dynamic equilibria of different
forms of manganese in soils Mann and Quastel (1946) has given
the manganese cycle as follows:
Dismutation
Mn2+ oxidation ) Mn3+(Exchangeable) ....<:--__________ (Mn203 x H20 )
Dismutation and biologicalreduction
Biological reduction
Fujimoto and Sherman (1948) found that the addition of
organic substances to a soil caused a marked increase in the
level of exchangeable Mn2+. When the quantities of organic
matter application was increased, the amount of Mn2+ also

18
increased. These authors examined a manganese cycle given by
Dion and Mann (1946) in Hawaiian soils. They found it
inapplicable in Hawaiian conditions and proposed a manganese
cycle of their own.
Hurwitz (1948) studied the effect of temperature on the
reduction of manganese in soils in the presence of organic matter.
He reported that there was no appreciable increase in the content
of exchangeable manganese below 30 0 C. However, the rate of
formation of Mn2+ increased abruptly in the range of 37 0- 47 0 C.
He noted a logarithmic relationship between rate of manganese
reduction and temperature above 30 0 C.
Mineralogical Composition of Hydromorphic Soils
Some characteristic minerals are associated with the
development of glei soils. Ferrous iron in the presence of organic
matter mixes with them and forms organo-metallic complexes.
According to Glinka (1932) minerals like vivianite (Fe3(P04)2·
8H20), pyrite (FeS2), marcasite (FeS2) and siderite (FeC03)
are found in gley soils.
Kamoshita et ale (1959) studied the mottled material from
the genetic glei horizon using differential thermal and X-ray
analyses. He found the mottles to be composed mainly of
lepidochrosite with some hematite.
Iwasa (1959) studied. concretions from the gley horizon of
paddy soils of a river floodplain. He l'eported the predominance

19
of FeC03 in the paddy soils. Yamasaki et ale (1961) also
found FeCOS in the poorly-drained paddy soils in Japan. X-ray
analysis showed them to be crystallized FeCO3 or siderite.
Clay Minerals:
The dominant clay mineral in hydromorphic soils is an
expanding lattice micaceous type (Gill and Sherman, 1952).
Neutral pH and high base saturation is a favorable environment
for the synthesis of the montmorillonite type of mineral. Fieldes
(1959) reported that long gleying in New Zealand soils produces
a montmorillonite type of clay while the absence of such
montmorillonite in gley soils probably indicates short exposure to
gleying effects.
Masui (1959) made an extensive study of the clay minerals
in some poorly-drained soils in Japan. He reported that in these
osoils an iron-rich variety of montmorillonite and a 7 A kaolin
mineral were mechanically mixed, although these minerals were of
mixed layer in the upland soils. He further noted that clay
mineral composition was considerably the same with increasing
depth, and that montmorillonite alone seemed to vary in composi-
tion with the soil environment.
Bidwell and Page (1951) studied the clay mineral composi-
tion of the Miami catena in Ohio and found illite to be the main
clay mineral. Holowaychuk (1953) working with a Brookston-
hydromorphic profile reported a substantial percentage of

20
montmorillonite in the clay fraction. Thorp et ale (1949)
reported the clay minerals in a poorly-drained soil in Indiana as
consisting of about 10% kaolinite, 10 to 25% montmorillonite and the
remaining being hydrous mica.
Arneman and McMiller (1955) working with a Minnesota
Webster profile reported that illite was the dominant secondary
mineral present in the coarse clay fraction while the fine clay of
<0.2\-1 fraction was mainly montmorillonite.
Processes of Glei Formation
The mechanism of the development of gley horizon in a
hydromorphic soil is not too clearly understood even today. The
whole process is considered to hinge on the reduction of some
elements such as iron, manganese, and sulfur due to the presence
of anaerobic conditions. The presence of organic matter accentu-·
ates this reduction (Miller, 1959). The extent of reduction is
measured by redox potential.
The redox potential is a physico-chemical property that
indicates the tendency of a system to reduce or oxidize further.
The oxidized state of a well-drained soil shows high redox potential
while the reducing condition that usually prevails In a poorly-drained
soil is reflected by a low redox potential.
Many authors (Quispel, 1947; Halvorson, 1931; and Starkey
and Wight, 1945) undertook the task of measuring the redox
21
potential of many natural and artificial systems. Halvorson and
Starkey (1927) c;Ierived a relationship based on mass law, con
necting oxygen pressure and pH with the amount of ferric and
ferrous ion in solution, and studied the effects of mixed culture
of soil microorganisms in the dissolution and precipitation of iron.
Starkey and Wight (1945) in an extensive study on anaerobic
corrosion of iron reported that sulfate-reducing bacteria play an
important role and may be the most important factor in anaerobic
corrosion. They indicated the reduction of sulfate as follows:
H 2S04 --+H2S03 ---+H2S02 ~H2S0 --+H2S
There exists two schools of thought regarding the mechanism
of development of reduction conditions in soil: ( a) chemical, and
(b) microbial.
The question as to whether the microbial action is essential
in a gleying process has not been settled as yet. Bloomfield
( 1959) reported that when ferric oxide is treated with a sterile
. extract of fermented grass, iron is' mobilized, but to a much
lesser extent than a non-sterile extract. Bromfield (1954) on the
other hand found that the gleyed faces of structural elements in a
heavy clay contained iron-reducing bacteria at a depth of two feet,
but that no such microorganism could be found in material collected
from a depth of ten feet, although the degree of gleying appeared
to be equally intense. This indicates that at the lower levels, the
gleying is due mainly to chemical action of soluble organic compounds.

22
Robinson (1930) studied the soil solutions produced under
submerged conditions and reported that in the absence of organic
matter the solubilities of iron, magnesium, calcium and manganese
were not increased. Soil solutions from old bogs did not contain
particularly high concentrations of iron or manganese, but their
concentration in bog water was higher than that in ordinary
drainage water.
Chemical theory:
Miller (1959) studied the formation of gleys from a chemical
viewpoint. Commenting on the causes of gleying he observed:
Saturation with water, however, seems a necessary and sufficient condition for gleying and a definitionon this basis would satisfy all but the most stringentrequirements.
He enumerated four stages in the process of gleization:
(a) reduction of elements, (b) complex formation with organic
molecules, ( c) adsorption/precipitation, and (d) transport.
In the gley soils the tendency for reduction, in the presence
of organic matter, is high and considerable amount of ferrous ion
may be found in solution. This formation of a strong base often
leads to an appreciable increase in pH. The highly active ferrous
ion forms colloidal and simple complexes with organic chelates.
'.
In the gleying process there is always movement of these organo-
metallic complexes, at least, from the gleyed zone. Iron and
manganese in the gleization process always move, and the extent

23
of removal may gIve an indication of intensity of gleying (Miller,
1959) •
The most extensive study on the mechanism of gleization
was done by Bloomfield (1949, 1951, 1952, 1955) 0 Working
with straw extract as the reducing agent in his laboratory
experiment on gleization, he concluded that the production of gley
soil is caused, at least in part, by plant degradation products and
not by any specific microorganism (Bloomfield, 1951).
In another experiment Bloomfield (1949) studied the dis-
solution of iron by anaerobic incubation in a sugar solution. He
reported that to produce gleying in a non-gleyed soil it was often
necessary to inoculate the system with suspensions of gleyed
material. The rate of reduction of the ferric io'n was greater
when calcium carbonate was added to the system. Referring to
the development of bluish colors in the gleization Bloomfield (1954)
stated:
After incubation with plant remains and removal ofthe dissolved iron, the soil is dark gray in colour, oftenbecoming light grey on drying. It seemed at first thatthe process was simply removing ferric oxide from theclay particles and that the colour of these soils wasmerely that of clay substrate, originally masked byferric oxide. It may well be so, but it is now apparentthat the gleying process is not simply one of solutionand removal of ferric oxide; it seems that part of theiron in some form other than ferric oxide is retained bythe clay in a manner that prevents its removal by water.
In dealing with the formation of organo-metallic c<i>mplex in
the process of gleization Bloomfield (1954) further stated:
24
On the assumption that the residual iron in thegleyed soil might be sorbed on the clay in the form ofan organic complex, an attempt has been made toremove greater amounts of iron by leaching with compounds known to form stable complexes with iron. Inmost cases considerably less iron was removed, andthe most efficient of these extractants (acetyl acetate,cupferron, and sodium diethyl-dithiocarbonate) removedno more iron than did ammonium acetate.
Sinta (1960) studied the dynamic nature of the gleying pro-
cess both in the field and in the laboratory. He reported a
heavy gleying in one year followed by a complete oxidation due to
a change In the water table. He found iron far more active than
aluminum in the gleying process, and magnesium and sodium as
the most readily mobilized cations. In discussion the genesis of
gley soils Schafer and Holowaychuk (1958) reported that high
base status, particularly a high calcium status in the parent
material, appears to be an important factor in the formation of
such soils.
Swindale (1959) made a comparison between the mechanisms
of the processes of podzolization and gleization and indicated that
the formatio!1., of complexes between iron and organic chelatesis
the fundamental step, common to both processes. In the gleization
process iron is reduced first, and it is with this form of iron that
the organo-metallic complexes are formed. The complexed iron
then moves from the zone of gleization and is oxidized if conditions
are favorable. Some organo-ferrous complexes stay in the gley
horizon and give it its characteristic bluish tinge.

25
Microbial theory:
The role of microorganisms is regarded by some authors
(Vysotskii, 1950; Kalakutskii and Duda, 1961) as the major
cause of oxidation-reduction reactions in soil. Stout (1959) dif-
ferentiated between aerobic and anaerobic metabolism of microbial
populations in soil. At high oxygen tensions substrates tend to be
completely oxidized, whereas under reduced oxygen tensions
fermentation products accumul,ate and these in turn may affect the
mobility of soil minerals. Stout ( 1959) further noted that source
of the water was the primary determinant in the gleying process
as the oxygen tension in water would vary according to the source
of water. He suggested that the origin of the waterlogging might
be used as a criterion for the genetic classification of gley soils.
Roberts (1947) examined more than 200 microorganisms and
reported that only certain strains of B. polymyxa were capable of
dissolving ferric oxide. In recent years Bromfield (1954)
objected to the statement of Roberts (1947) and noted that
B. polymyxa was not a unique organism among soil microbes for
the purpose of dissolving iron.
The role played by bacteria in the transformations of Iron
was described by Halvorson (1931) as follows:
The solution and precipitation of iron in nature areseen to be associated with equilibrium conditions whichdepend upon oxygen tension, carbon dioxide tension,
, acidity, and the presence of organic compounds. Theseconditions may be modified extensively by bacterial

26
activity ••• Their effect upon the solution of iron canhardly be overemphasized in that they can effect changesfavoring solution which do not occur simultaneously 0
Processes of Secondary Mineral Formation in Hydromorphic Soils
The mineralogical composition of the clay fraction of soils is
strongly influenced by the minerals in the clay of the original
deposit (Cady, 1960). The clay mineral distribution and the clay
content in the various horizons of the profile are affected by
weathering and movement of clay.
The kind of constituents retained In the soil from which
secondary minerals are formed, and the kind leached out during
the weathering process depend on the chemical -environment of the
system. From a study of river waters in relation to the composi-
tion of rocks of their catchment areas, Polynov (1937) demon-
strated the different rates of mobility of the constituent elements and
established a sequence. Taking chloride, the most mobile, as
100, Polynov (1937) suggested the relative rates of mobilities as
follows:
Phase I
Phase II
CI- 100.00
SO = 57.004
Ca++ 3.00
Na+ 2.40
Mg++ 1.30
K+ 1.25

27
Phase III Si02 0.20
Phase IV Fe203 0.04
Al20 3 0.02
The elements are divided into phases on the basis of their
Synthesis of clay minerals:
The formation of secondary minerals during soil formation
depends mainly on the constituents released, the opportunity of
their interaction and the suitability of the microenvironment.
Crompton (1960) regarded weatherins and leaching as two distinct
processes. If leaching is intense, as in the freely drained area,
the soluble products may be removed in the drainage water,
while under impeded drainage the immediate products of weathering
may develop higher concentration in the soil solution. Crompton
( 1960) considered weathering/leaching ratio as becoming very
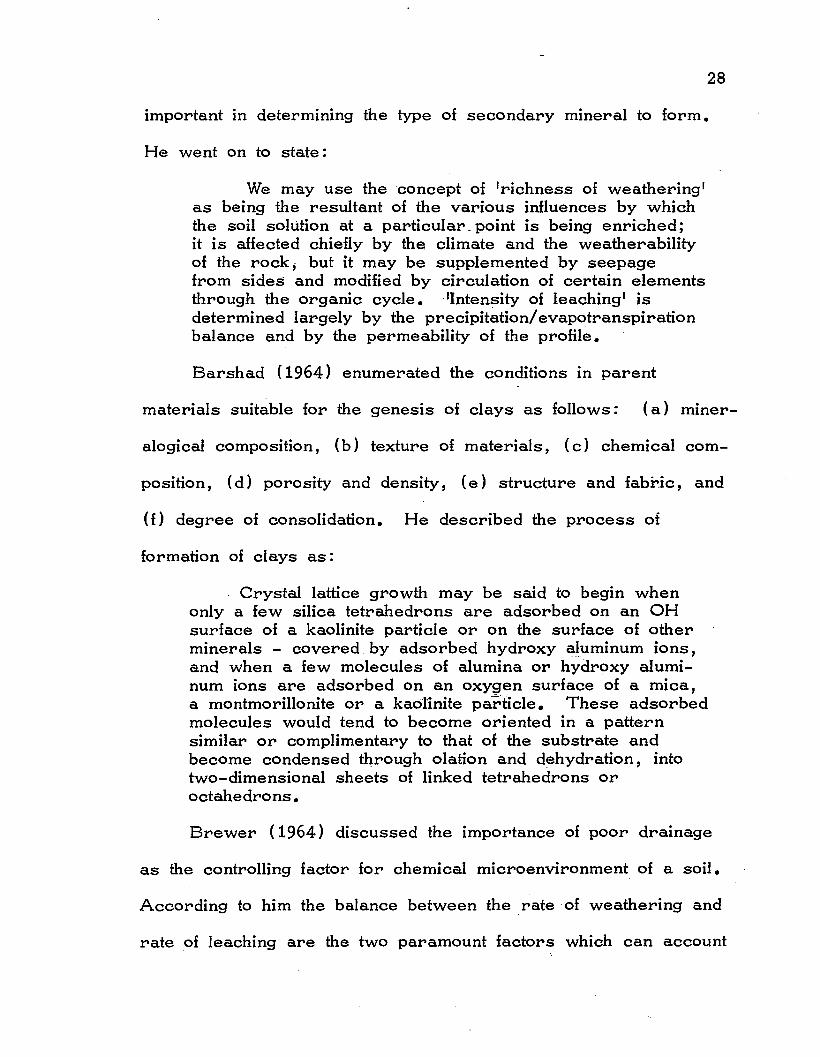
28
important in determining the type of secondary mineral to form.
He went on to state:
We may use the concept of 'richness of weathering'as being the resultant of the various influences by whichthe soil solution at a particular. point is being enriched;it is affected chiefly by the climate and the weatherabilityof the rock; but it may be supplemented by seepagefrom sides and modified by circulation of certain elementsthrough the organic cycle. 'Intensity of leaching' isdetermined largely by the precipitation/evapotranspirationbalance and by the permeability of the profile.
Barshad (1964) enumerated the conditions in parent
materials suitable for the genesis of clays as follows: (a) miner-
alogical composition, (b) texture of materials, ( c) chemical com-
position, (d) porosity and density, (e) structure and fabr.ic, and
(f) degree of consolidation. He described the process of
formation of clays as:
Crystal lattice growth may be said to begin whenonly a few silica tetrahedrons are adsorbed on an OHsurface of a kaolinite particle or on the surface of otherminerals - covered by adsorbed hydroxy Cl.luminum ions,and when a few molecules of alumina or hydroxy aluminum ions are adsorbed on an oxygen surface of a mica,a montmorillonite ora kaolinite particle. These adsorbedmolecules would tend to become oriented in a patternsimilar or complimentary to that of the substrate andbecome condensed through olation and dehydration, intotwo-dimensional sheets of linked tetrahedrons oroctahedrons.
Brewer (1964) discussed the importance of poor drainage
as the controlling factor for chemical microenvironment of a soil.
According to him the balance between the rate of weathering and
rate of leaching are the two paramount factors which can account

29
for the formation of a wide range of secondary mineral species In
soils. Impeded drainage conditions tend to form more complex
layer-silicates because a large number of constituents are neces
sary for their formation. On the other hand free drainage tends
to produce simpler secondary minerals (White, Bailey, and
Anderson, 1960).
F ormation of montmorillonite types of minerals in soils
depends, therefore, on the high weathering/leaching ratio to allow
a sufficient concentration of constituent ions to occur in soil solution.
The type of mineral formation depends on the amounts and propor
tions of the cations present.
Many workers have shown that kaolinite tends to form at low
pH and montmorillonite at high pH. Mollot (1953) reported that
kaolinite is formed by an acid reaction in an anaerobic medium.
The higher concentrations of organic matter and sulfides accentuate
this reaction. Weaver 11956) after examining clay minerals from
thousands of sediments concluded that any of the major clay
minerals can occur in abundance in any of the major depositional
environments and there is no consistent coincidence between specific
clay minerals and specific depositional environments.
The pH of a soil depends on drainage status and the nature
of parent material. Poorly-drained areas usually have higher pH
(Correns,. 1962). Smith (1958) has shown that. in certain soils
formed on freely drained basic igneous rocks in Scotland the

30
fOr'mation of montmorillonite and vermiculite occurs in cleavage
planes in augite and plagioclase, but the stronger leaching on the
outside of the primary particle leaves a prominent sesquioxide
residue.
A similar phenomenon was observed by Sherman and Uehara
(1956) in Hawaiian basalts. In .dealing with weathering of olivine
basalts these authors observed that secondary mineral formation
depends on type of weathering and the ~te of removal of bases.
On the exfoliated layers on the upper side of a boulder where
drainage was good, kaolinite type of minerals developed, while
neal'" the under-side of the boulder where the soil is moist and con
ditions are good for the accumulation of bases, montmorillonite
types of clays were formed.
Transformation of Minerals:
Since most of the common rock-forming minerals do not
resemble the layer lattice type of secondary minerals present in
soils their manner of transformation has been explained in different
ways. Fieldes and Swindale (1954) proposed that the first stage
of weathering of the primary minerals is the destruction of crystal
lattice and release of amorphous hydrous oxides which may subse
quently form crystalline oxides 01'" be resilicified to form layer-lattice
silicates.
On the other hand DeVore (1959) observed that breakdown of
primary minerals to completely amorphous oxides as a stage in the

31
formation of layer silicate minerals is not necessary. He stated
that the mica-like surface chemistry of the feldspar may act as
nucleation sites for layer-lattice minerals.
Jackson et ale (1948) in their study of weathering sequence
of colloidal minerals expressed the view that during the formation
of soils, ( a) one colloidal mineral may in some cases be a parent
material of successive colloidal products as the weathering pro-
cesses continue, and (b) the weathering reactions are reversible.
The "successive parent material principle" of Jackson et ale
(1948) is an important observation in the transformation of minerals
where there is an extra source of ions from outside. .Thus, in
alluvial soils (where a new supply of silica and bases from
weathering are constantly coming from upland areas and are
deposited in the lowland areas due to the prevalence of poor
drainage there) this transformation readily occurs. Referring to
the reversibility of weathering reactions, Jackson et ale (1948)
stated that resilication can proceed on to the montmorillonite and
mica stages under some special circumstances, particularly In
alluvium. They postulated a sequence as follows:
Montmorillonitedesilication( )0 kaoliniteresilication
desilication'E ~
resilicationgibbsite
Many authors have observed similar phenomenon in their
studies of secondary mineral formation. Alexander, Hendricks,
and Faust (1941) noted that gibbsite formed as a weathering

32
product of mica and suggested that this gibbsite may normally be
resilicated to kaolinite in the zone neal" the unweathered parent
rock surface. Harrison (1933) reported resilication of gibbsite
through rise of silica from the ground water.
The desilication-resilication problem in the Hawaiian islands
was studied by Abbott (1958), Bates (1962), and Uehara, Ikawa,
and Sherman (1966). Although opposing viewpoints prevail among
these authors, there are possibly examples of both resilication and
desilication in Hawaii. Resilication from gibbsite to halloysite is a
simple phenomenon which usually takes place in acidic reaction.
But during resilication from gibbsite to montmorillonite or from
halloysife to montmorillonite presence of suitable cations in the
system is necessary. Mohr (1959) and Hardon (1950) emphati-
++ ++ .cally stated the need for the presence of Ca and Mg In the
soil solution. Hardon (1950) determined the Mg/Al ratio of some
clays and these ratios showed a significant correlation with
increasing content of montmorillonite.
MohrC1959) emphasized the importance of the presence of
both ferrous and ferric iron in the formation of montmorillonite.
Organic matter in association with certain bacteria, may also play
a part in causing conditions for dissolving or reducing iron in the
poorly-drained soils (Bloomfield, 1954). The presence of dis-
solved iron will stimulate montmorillonite formation by supplying
Fe2+ and Fe3+ which may substitute in the octahedral position of

33
montmorillonite. Bates (1960) and Sherman, Ikawa, Uehara,
and Okazaki (1962) have found iron-rich montmorillonite in poorly
drained patches of weathering belts of olivine basalts in Hawaii.
34
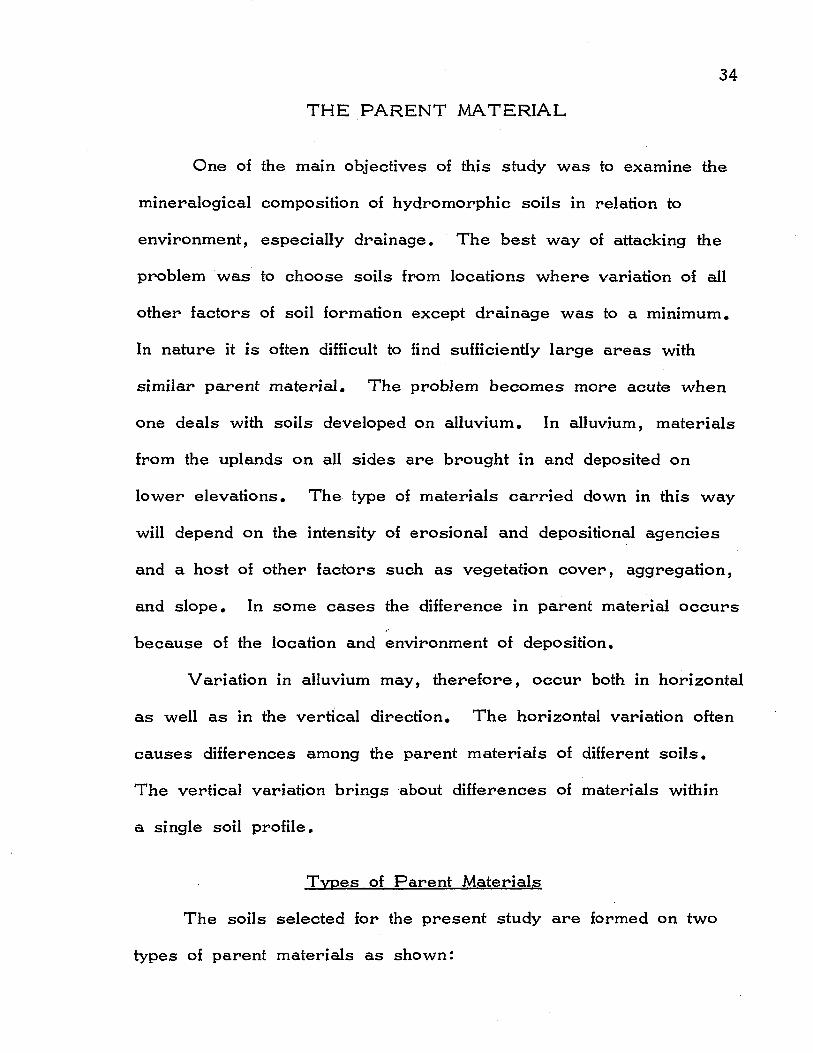
THE PARENT MATERIAL
One of the mam objectives of this study was to examine the
mineralogical composition of hydromorphic soils in relation to
environment, especially drainage. The best way of attacking the
problem was to choose soils from locations where variation of all
other factors of soil formation except drainage was to a minimum.
In nature it is often difficult to find sufficiently large areas with
similar parent material. The problem becomes more acute when
one deals with soils developed on alluvium. In alluvium, materials
from the uplands on all sides are brought in and deposited on
lower elevations. The· type of materials carried down in this way
will depend on the intensity of erosional and depositional agencies
and a host of other factors such as vegetation cover, aggregation,
and slope. In some cases the difference in parent material occurs..
because of the location and environment of deposition.
Variation in alluvium may, therefore, occur both m horizontal
as well as in the vertical direction. The horizontal variation often
causes differences among the parent materials of different soils.
The vertical variation brings about differences of materials within
a single soil profile.
Types of Parent Materials
The soils selected for the present study are formed on two
types of parent materials as shown:

Parent material
1) Noncalcareous alluvium
2) Calcareous alluvium
35
Source rock
( a) Weathered basaltic rocks(b) Hydrothermally-altered rocks
Most of the older alluvia in the Hawaiian Islands were formed
during the Pleistocene Epoch and were" therefore, affected by the
eustatic changes of sea level during that time. Noncalcareous
alluvium usually occurs in those areas where deposition took place
under fresh water ,or where the location of deposition was beyond
the sea level at any time.
Noncalcareous alluviu~:
Noncalcareous alluvium may come from different source
regions. In the present study the source rocks were (a) weathered
basalts, and (b) hydrothermally altered rocks.
Alluvium from weathered basalts:
This material occurs extensively in the Ewa-Waipahu-Pearl
Harbor region. The materials were derived from the highly-
weathered basalts of the southern slopes of the Waianae range.
Ruhe et ale (1965) have studied the nature of alluvium of this
region. According to these authors, the sampling site of the
Honouliuli soil falls in the geomorphic region of Ewa Coastal Plain.
Ruhe et al. (1965) have divided the Ewa Coastal Plain into two
geomorphic surfaces: 1) Ewa Clay Plain, and 2) Ewa Coral
Plain. The Ewa Clay Plain occurs at a higher elevation to the

36
north of the Coral Plain. This Plain was formed by shallow
water deposition of clays from the latosolic soil areas at the upper
regions. Ruhe et ale (1965) made an attempt to determine the
age of the Ewa Coastal Plain. According to the available evidence
it is of mid-Pleistocene age which corresponds to the Yarmouth
stage of Pleistocene interglaciation.
The Pearl Harbor series occurs to the east of the Honouliuli
series but on a different geologic formation. It constitutes a small
area around the western loch of Pearl Harbor Bay. According to
Ruhe et ale (1965) this area falls in the Kapakahi surface. The
materials were deposited on marshy. areas covered by peat. These
are regarded as embayment sediments in the Pearl Harbor Bay.
Depending on the carbon-dating of the peat below the Kapakahi
surface, Ruhe et ale (1965) calculated the age of this material in
terms of years to be <670 + 100.
Alluvium from hydrothermally-altered rocks:
In the present study, two soils were selected from localities
where the parent materials were derived from hydrothermally
altered rocks. The Laie soil, located at Waimanalo, Oahu, devel
oped on parent material which was derived from hydrothermally
altered rocks of the Kailua Volcanic Series on the eastern side of
Oahu. The Kalihi soil developed on parent material, a portion of
which was derived from hydrothermally-altered rocks along the edge
of the Haupu· caldera on the southeastern side of the island of Kauai.

37
The Laie soil is located at the bottom of a valley which is
surrounded by the Koolau mountains to the west and the rocks of
the Kailua volcanic series· to the north. The rocks in this area
are mostly basalts. The rocks along the old caldera and the rift
zone of the Koolau volcano were hydrothermally altered by gaseous
emanations (Stearns and Vaksvik, 1935). The parent material of
Laie soil came from this hydrothermally-altered belt and was
mixed with alluvium from the other sides of the valley. Some of
the minerals present in this soil reflect their source region.
No extensive study on these rocks has yet been made.
Moberly (1963) in his study of marine sediments in the Kaneohe
Bay and the surrounding area concluded that some of the materials
in the bay must have come from these hydrothermally-altered rocks.
Depending on the elevations of the sampling site, the age of
the Laieo soil has been estimated to be Late Sangamon. It may be
mentioned here that in the above estimation the effect of faulting or
folding was not taken into consideration. Only the eustatic move
ment was taken into account.
The Kalihi soil was collected from the flat bottom of the
Mahaulepu valley in southeastern Kauai. The valley is surrounded
on two sides by mountain rims consisting of olivine basalt and
picrite basalt of the Koloa Volcanic Series. On the northern edge
of the valley lies the edge of the Haupu caldera which has possibly
been hydrothermally altered by gaseous emanations. The parent

\
38
materials of this soil constitute a mixture of materials of
hydrothermally-altered rocks with materials from weathered
basalts from the other side of the valley. The alluvial materials
seem to be deposited on basalts and in some places the alluvial
veneer is only a few feet thick.
Lack of any carbonate material m this soil and the low pH
possibly indicate that these materials were deposited in fresh water
basins. Its elevation of 15 feet above the present sea level indi
cates that these materials are possibly of Late S angamon age.
Calcareous alluvium:
The Koloko and Nohili soils have developed on calcareous
alluvium in the Mana Plain of western Kauai. The Mana Plain
was a shallow inland bay surrounded by a barrier of coral reef.
The water in this bay was brackish. The weathered basalts
from the uplands to the east of this bay supplied the alluvial
materials for this bay plain. The innumerable gullies and streams
that dissect this upland carried materials and deposited them in the
Mana Lake forming alluvial fans and flats. Fine-grained particles
moved further away while the coarse-grained ones were deposited
near the place wh.ere the streams entered the lake. The bulk of
the materials were deposited near the eastern part of this inland
lake and gradually thinned out toward the west. F or this reason
the Nohili soil, which is located towards the eastern side of the
Mana Plain, has a deeper profile than the Kaloko soil, which is

39
located towards the western side. The alluvium is underlain by
coraline limestone and are mechanically mixed with it.. The age of
this material may be Pleistocene to Recent in Ruhe1s (1965)
terminology.
The calcic and gypsic materials that occur in these two .soil
profiles were possibly not formed by the processes of soil
formation. They were present there and are regarded as part of
the parent material.
Before reclamation the ground water table was above the
surface of the Mana Plain and in the soil solution there were high
concentrations of Na+ and Mg++. Around 1920 the area was
drained and the soil was used for the cultivation of sugarcane.
This human interference has caused a change in the original
environment of these two soils. The exchange positions in the soil
were originally saturated with Na+ and Mg++ (Ewart, 1960). After
slow leaching with fresh irrigation water and the lowering of the.
water table by surface drainage, these ions have moved down and
the exchange complex is now predominantly occupied by Ca++ and
M ++g •

40
THE SOILS
Gray Hydromorphic Soils of Hawaii
The poorly-drained soils of the Hawaiian Islands were
studied by Cline et al. (1955). These authors classified and
mapped them as the Gray Hydromorphic great soil group. The
basis of their classification was the degree of expression of
hydromorphic characteristics in the soil profiles. Depending on the
morphological features and some physical properties of these soils
Cline et al. (1955) established three families and eight serIes
under this great soil group.
1
2
3
Soil Family
Honouliuli
Kalihi
Kaloko
Soil Series
Honouliuli*S62Ha7-3- (1-5 )**
Keaau
Kalihi*
Kaena
Laie*
Kaloko*
Nohili~~
S63Ha2-8- (1-7 )*~~
DifferentiatingCharacteristics
Slightly poorly-drained.Grayish brown, moderatelysticky and plastic. Faintmottles in the substratum~'
Poorly-drained. Darkbrown color, very plasticand sticky. B-horizon ishighly mottled.
Very poorly-drained soilover marly material.Mottles extend up to thesurface of the soil.
Pearl Harbor*----------~* Included in the present study.** Soil Conservation Service number.

41
General information on soil environment:
The main soil-forming factors for the SIX soils are summarized
In T able I. All the soils have been affected by different degrees
of poor drainage.
The. soils of the Honouliuli family are the least hydromorphic
of the Gray Hydromorphics of Hawaii. They have a grayish-
brown clayey B horizon in which· mottles are not visible with the
unaided eye. The profile differentiation in the soils of this family
. IS very weak. The water table is not present within the profile,
but the micromottles are caused by the impeded downward move-
ment of water.
The degree of hydromorphism is stronger in the soils
belonging to the Kalihi family than in those of the Honouliuli family.
The mottles appear below the A horizon in these soils. The mot-
tIes are formed due to the vertical movement of underground water
table throughout the year. Soils of this family have an A horizon
of very dark brown to reddish-brown color. There is no trace of
carbonates in these soils. The soils are very plastic and very
sticky. The lower horizons have a massive structure.
The soils belonging to the Kaloko family are the wettest
members of the Gray Hydromorphic great soil group. In these
soils the water table, iJ;l some seasons, is almost at the surface.
Mottles are present at times in the A horizon.p
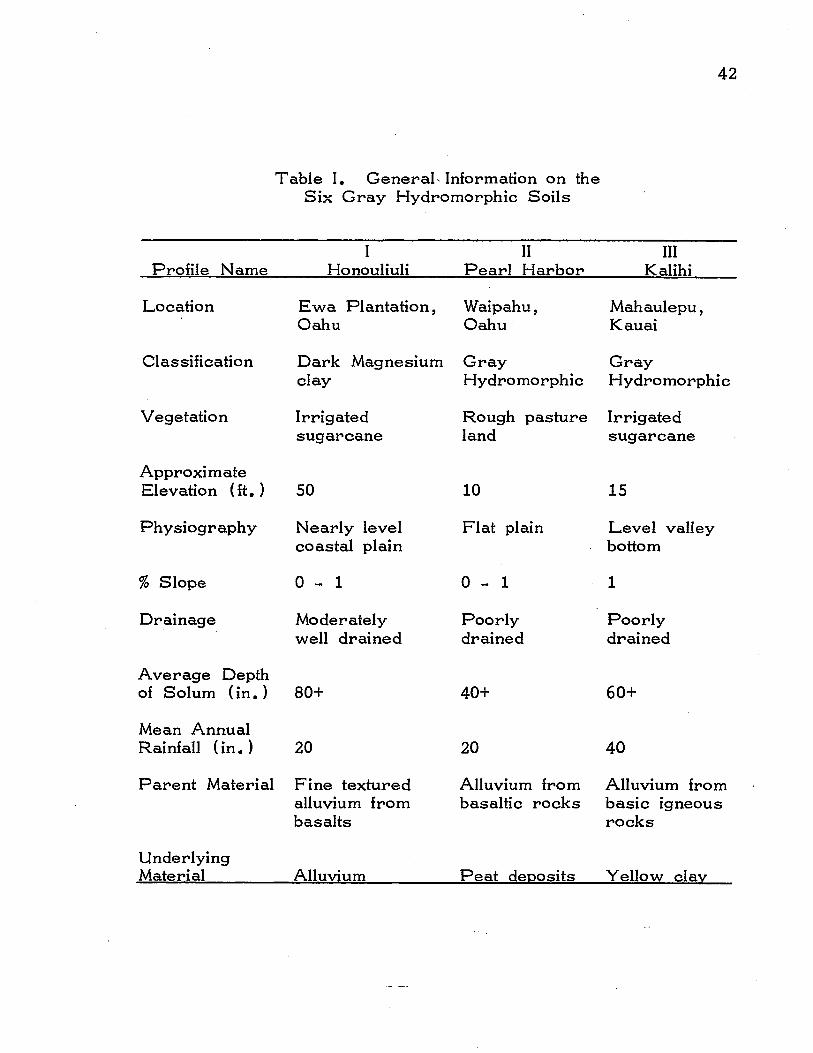
T able I. General, Information on theSix Gray Hydromorphic Soils
42
Profile Name
Location
Classification
IHonouliuli
Ewa Plantation,Oahu
Dark Magnesiumclay
IIPearl Harbor
Waipahu,Oahu
GrayHydromorphic
IIIKalihi
Mahaulepu,Kauai
GrayHydromorphic
Vegetation Irrigated Rough pasture Irrigatedsugarcane land sugarcane
ApproximateElevation (ft. ) 50 10 15
Physiography Nearly level Flat plain Level valleycoastal plain bottom
% Slope o - 1 o - 1 1
Drainage Moderately Poorly Poorlywell drained drained drained
Average Depthof Solum (in.)
Mean AnnualRainfall ( in. )
Parent Material
UnderlyingMaterial
80+
20
Fine texturedalluvium frombasalts
Alluvium
40+
20
Alluvium frombasaltic rocks
Peat deposits
60+
40
Alluvium frombasic igneousrocks
Yellow clay

Table 1. General Information on theSix Gray Hydromorphic Soils (Continued)
43
IV V VIProfile Name Laie Kaloko Nohili
Location Waimanalo, Mana Plain, Mana Plain,Oahu Kauai Kauai
Classification Gray Gray GrayHydromorphic Hydromorphic Hydromorphic
Vegetation California Irrigated Irrigatedgrass sugarcane sugarcane
Approximate .Elevation (ft. ) 15 5 7
Physiography Flat bottom Level coastal Nearly levelof a basin plain coastal plain
% Slope 2 - 3 0-2 o - 2
Drainage Poorly Poorly Poorlydrained drained drained
Average Depthof Solum (in. ) 50+ 60+ 60+
Mean AnnualRainfall (in. ) 40 <20 <20
Parent Material Alluvium from Alluvium from basic igneousbasaltic rocks rocks deposited in marshy
lagoon
UnderlyingMaterial Alluvium Coraline limestone

44
The morphological description of these soils were made
following the method given by the U. S •D.A. Soil Survey Manual
( 1951) • For color, Munsell color notations and names were
used. The coded morphological description of the present soils
are presented in tables 1a to H.
Location of the sampling sites:
The series names which were introduced by Cline et ale
(1955) for these soils have been used in this study to avoid con
fusion. The soil which was sampled in the Pearl Harbor series
was actually a better drained inclusion within the series and does
1 not truly represent the central concept of the serIes. The typical
Pearl Harbor series has peat underlying the profile, but the
present Pearl Harbor soil does not have any peat below it.
The distribution of the series and the soil sampling locations
are shown in Figs. 1 and 2. All the soils were collected from
plains of 0-2% (level) slope but are located at different elevations
above sea level.
The sampling site of the Honouliuli soil was located on an
alluvial toeslope of the Ewa Clay Plain. It was collected at Ewa
Plantation, Field No. 41, 228 steps south of Reservoir No. 6 and
100 feet west of the road.
The Pearl Harbor clay was collected from a flat plain along
the western loch of Pearl Harbor, about 100 yands south of the
Sewage Treatment Plant. The pit was dug in the middle of an old

45
OAHU
5 miles1- 0oo
-(
'"7c::.
158 0 00 1
~
7.",.
7~
7~
1>7
1,,-Q
210
20' H . ~·l·onouhu 1
Fig'ure 1. Map of Oahu, Hawaii, Showing the Locationsof Sampling Sites of HonouIiuIi Soil in Ewa Plantation,
Pearl Harbor Soil Neal'" Pearl Harborand Laie Soil at Waimanalo

46
22° 10'
KAUAI
2 4 6 8 miles
FiguI"e 2. Map of Kauai, Hawaii, Showing the Locationsof Kalihi Soil to the South of Haupu· CaldeI"a,and Kaloko and Nohili Soils in the Mana Plain
of WesteI"n Kauai

47
sugarcane field, south of Farrington Highway.
The Kalih,i clay was collected from the Mahaulepu valley of
southeastern Kauai. The sampling site was In the middle of a
sugarcane field about three miles east of Koloa township.
The Laie clay was collected from a valley near Waimanalo on
the eastern side. of Oahu. The location was about 50 yards west
of Saddle City and at about 150 yards east of the highway.
The Kaloko clay was collected from Kekaha Sugar Plantation
at western Kauai. The site was in the middle of sugarcane Field
No. 231 of Kekaha Plantation.
The Nohili soil was collected from the Mana Plain at western
Kauai. The actual location was 3.6 miles north of the junction of
highways 50 and 550 near the town of Nohili.
Both Nohili and Kaloko soils are located in the same area.
The distinction between these two series was made arbitrarily by
Cline et ale (1955) on the basis of the thickness of their profiles.
Nohili soil is deep and is located to the northeastern side of the
Mana Plain. Kaloko soil is shallow and is located to the south-
western side of the same plain.

48
EXPERIMENTAL METHODS
Most of the methods employed in the present study were
published procedures. A brief outline of each procedure has been
given in all cases.
Physical Methods
Soil moisture retention:
Maximum moisture holding capacity and moisture equivalent:
Maximum moisture holding capacity and moisture equivalent of
the soils were determined in duplicate. Approximately 25 grams
of samples were weighed into moisture equivalent boxes and allowed
to stand overnight in one-half inch of water in a dish for full
saturation. The saturated· soil was allowed to drain for an hour
and weighed~ This weight is the weight of soil at maximum
moisture holding capacity.
The moisture boxes were then put in a centrifuge and were
subjected to a centrifugal force equivalent to 1(~.OO times that of
gravity for half an hour. The moisture boxes were immediately
taken out and were weighed again. This weight is the weight of
soil at moisture equivalent. The soils were removed from the
moisture equivalent boxes to aluminum cans and dried in an oven at
105°C for 24 hours. The cans were put in a desiccator and
weighed again to obtain the dry weight of the soil.

49
lS-bar pressure moisture:
A suitable amount of soil was placed in the rmgs m a
pressure membrane apparatus and saturated with water from below.
The soil was then subjected to a pressure equivalent to 15 bars
until such time as the moisture in soil was in equilibrium with this
pressure. The soil was then put in a moisture can and weighed.
This weight gave the weight of soil at lS-bar' pressure. The can
was placed in a.n oven at 105 0 C for 24 hours and weighed again to
obtain the dry weight of the soil. The results were expressed on
percent moisture on O. D. basis of soil.
0.33 bar pressure moisture:
The moisture retention capacity of soils at 0 .. 33 bar pressure
was also determined in a pressure membrane apparatus in which a
suitable amount of soil was placed in rings in a pressure membrane
and saturated with water from below. It was then subjected to a
pressure equivalent to 0.33 bar until the soil system came in equili-
brium with that pressure. The soil was then taken in a moisture
can and weighed. This weight gave the weight of the soil at 0.33
bar pressure. By putting the soil in an oven at 105 0 C and
subsequently weighing, the dry weight of the soil was determined.1
lTheauthor is indebted to the Director of the Hawaiian SugarPlanters Association Experiment Station for kindly allowing the useof their laboratory for determination of 0.33 bar moisture retentionof these soils.

50
Separation into size fractions:
Prior to separation into different SIze fractions, the soils
were pretreated to ensure complete dispersion according to the
method given by Jackson (1956). Fifteen grams of soil were
first treated with N NaGAc buffered at pH 5.0. The carbonate
free soil was then treated with hydrogen peroxide for the removal
of organic matter and the dissolution of manganese oxides. Soluble
salts and bases were removed by several washings with 50% and
99% methanol.
Free iron oxides were removed according to the method
given by Aguilera and Jackson (1953) in which sodium dithionite
was employed to reduce iron oxides and removed as a chelated
citrate complex in a neutral system (pH 7.3). This deferration
was repeated foul" times in all the soil samples. The soil was
then washed with sodium citrate and with 50% and 99% alcohol to
remove all the chemicals used for deferration.
To l?emove free silica and alumina in the soil sample, the
soil was treated with 2% sodium carbonate and boiled for five
minutes. The soil sample was centrifuged and washed with 2% hot
sodium carbonate solution. The soil su spension was then separated
into different size fractions by sieving and centrifugation techniques,
using dilute sodium carbonate (2 gms of Na2C03/18 liters of
water) solution (pH 9.5) as the dispersing agent.

51
The following size fractions were obtained:
Grade
Coarse
Fine
Sand
>50~
Silt
50-5~
5-2~
Clay
2-0.2~
"0.2~
The sand and coarse silt fractions were washed free of
salts, dried and preserved in glass vials for X-ray and petro
graphic analysis. Clay suspensions and fine silt suspensions were
stored in glass bottles.
The mechanical composition of the soils was determined by
adding the different size, fractions. Free iron oxide was also
added with these fractions to gIve 100% of soil materials.
X-ray diffraction methods:
Using K-saturated, parallel-oriented specimen:
Separated and deferrated clay suspensions were washed
several ti'mes with N potassium chloride to saturate with potassium,
then washed twice with 50% methanol and then with 99% methanol
until the decantate was chloride-free. The sample was then
washed twice with acetone. About 100 mg of this sample was sus
pended in 4 mls. of water, 1 mI. of which was transferred to a
glass slide and allowed to settle and dry in the atmosphere. An
X-ray pattern was obtained from this parallel oriented clay using a
North American Philips X-ray diffractometer with a copper target
tube and a chart recorder.

52
The oriented slide was then heated in a muffle furnace at
110°C, 350°C, and 550°C for three hours. X-ray patterns of
each sample were obtained after each heating with the same X-ray
equipment.
Using Mg-saturated, ethylene-glycol solvated, parallel-oriented
specimens:
In order to identify halloysite and montmorillonite types of
clays in the clay and fine silt fractions, Mg-saturated glycolated
samples were used. The separated clays and fine silts were
saturated with magnesium by washing them several times with N
magnesium chloride. It was· then washed with 50% alcohol and 99%
alcohol and acetone to remove excess· magnesium. Following the
acetone washing the specimen was brought into suspension with
distilled water and a measured amount of clay suspension was
transferred on a glass slide and allowed to settle and dry in the
atmosphere. The air-dry slide was put In a covered can containing
ethylene glycol and the can was placed in an oven at 70 ° C for three
hours. X-ray patterns were obtained from these glycolated slides
with the same X-ray unit.
Using random powder:
Separated clay speCImens were saturated with magnesium and
washed with 50% and 99% alcohol to remove excess salts, then
washed with anhydrous acetone and placed on a watch glass at
room temperature to dry. The sample was then powdered and
53
passed through a 100-mesh sieve.
The X-ray pattern for a powder sample for 060 reflection
was obtained by using the same X-ray equipment as mentioned
previously. The main objective of this powder sample pattern was
to determine the di- or tri-octahedral nature of clay minerals. In
the samples where both I: I and 2: I layer lattice type of minerals
were present the 060 reflection might have been due either to one
of them or both. To remove the effect of I: I minerals, the
powder sample was heated to 550 0 C and the X-ray pattern was
repeated. This time the 060 reflection was due to 2: I type of
clay minerals alone.
Chemical Analyses
Soil pH:
Soil pH was determined with a Beckman pH meter. A soil
water ratio of I: 2.5 was used. The pH measurements were made
after allowing the suspension of soil and water to stand for one
hour. pH was measured in two ways: ( I) with water and
(2) with N K CI solution.
Organic matter:
The chromic acid method based on spontaneous heating by
dilution of H 2S04 and the consequent oxidation of organic matter
was used for the determination of organic matter. The unused
chromic acid was back-titrated with standard ferrous sulfate solution
in the presence of phosphoric acid using diphenylamine as indicator

54
(Walkley and Black, 1934). Percent orgamc matter was obtained
by multiplying percent organic carbon with a conversion factor of
1.724.
Free iron oxide:
Free iron oxide was determined by the modified Kilmer's
( 1960) method in which iron oxides were reduced by dithionite
solution, adjusted at pH 3.5 and allowed to stand for one-half
hour. Dissolved iron oxide was determined in the supernatant
liquid by the potassium permanganate titration method.
Free manganese oxide:
Sodium dithionite-extractable manganese In soil has been called
"free manganese oxide" by Daniels et ale (1962). In this method,
2 grams of soil was treated with sodium dithionite to reduce the
manganese oxides. After shaking for four hours, the pH of the
suspension was adjusted to 3.5 to 4 by adding N H CI and allowed
to stand for one hour. Manganese oxide was determined from a
portion of supernatant liquid colorimetrically according to the period
ate method in the presence of nitric and phosphoric acid.
Carbonate .determination :
Carbonate present in soils was determined and expressed as
calcium carbonate even though there may be present some other
forms of carbonates. Fo this determination Piper's (1950) rapid
titration method was used in which 5 grams of soil was transferred
to a beaker and 100 mI. of N hydrochloric acid was added to this

55
and stirred several times during an hour. It was then allowed to
settle and an aliquot from the supernatant liquid was used for the
determination of calcium carbonates by back-titrating the excess acid
with N sodium hydroxide using bromthymol blue as the indicator.
Total nitrogen:
Total nitrogen from soils was determined by the modified
Kjeldahl method in which the soil was digested with concentrated
H2S04.in the presence of potassium sulfate, ferrous sulfate, and
copper sulfate. Nitrogen in the soil was thus converted to
(NH4)2S04. The system was then made slightly alkaline by
adding 40% NaOH and NH3 was distilled over and collected in a 4%
boric acid solution. Ammonium borate thus formed was titrated
with standard 0.02 N H~SO4 solution using a methyl red-methylene
blue mixed indicator.
Cation exchange capacity (CE C) :
Cation exchange capacity was determined by the standard
ammonium acetate method in which N NH40Ac buffered at pH 7.0
was added to the soil to saturate it with ammonium ions. Excess
salts were washed out with methyl alcohol. Adsorbed NH4+ was
removed from the exchange complex of soil by shaking with 200 mI.
"of 4% K CI solution. The soil was then filtered and subsequently
washed with more portions of K CI solution. From this extract
NH3 was distilled over in an alkaline medium and absorbed in 4%
boric acid solution. The absorbed ammonia was titrated with

56
standard 0.02 N H 2S04 solution using methyl red-methylene blue
mixed indicator.
Ammonium acetate extractable cations:
Exchangeable cations determined in these soils include Ca++ ,
Mg++, K+ and Na+• N NH40Ac buffered at pH 7.0 was added
to 25 grams of air-dried soil and shaken well. After standing for
24 hours the suspension was filtered and washed four times with
ammonium acetate solution.
The -filtrate plus washings of ammonium acetate were used
for the determination of individual cations in the soils. Calcium was
determined volumetrically by precipitating as calcium oxalate and
titrating with standard potassium permanganate in the presence of
sulfuric acid. Magnesium was determined gravimetrically by pre
cipitating as magnesium ammonium phosphate below 150 C tempera
ture. The filtered precipitate was ignited at 800 0C and weighed as
magnesium pyrophosphate.
Potassium and sodium were determined in the ammonium
acetate extract with a Beckman D U flame photometer (Jackson,
1960) •
Total analysis:
Total elemental analysis of soils was carried out according to
the method developed and used by Shapiro and Brannock (1956,
1962) of the U. S. Geological Survey for rapid analysis of dif
ferent types of rocks. The elements determined are Si02 , A120 3 ,

57
Fe203' FeO, MgO, CaO, Ti02 , MnO, P205' K 20 and Na20.
The major part of this analysis was made from two separate
solutions designated as solution A and solution B. Solution A was
used for the determination of Si02 and A1203. Fifty milligrams
of soil and USGS standard sample W1 were placed in two nickel
crucibles of 75 mI. capacity containing dried NaOH. The samples
were then fused for about 5 minutes to a dull red heat. After
cooling, the melts were dissolved in water and the solution was
acidified with dilute hydrochloric acid solution in a 600 mI. beaker.
A reference blank solution was prepared in the same way as
solution A except that the sample powder was omitted.
Solution B was used for the determination of Fe203' Ti°2 ,
MnO, P205' MgO, CaO, Na20 and K20. A 400-milligram
sample was digested overnight on a steam bath with HF, H 2S04
and HN03 in a large platinum crucible. Organic matter was des
troyed by the addition of a few drops of a mixture of perchloric
and nitric acids (1 + 3) prior to heating to sulfuric acid fumes.
Silica was determined colorimetrically from an aliquot of 5 mI.
of solution A. For this determination the yellow silico-molybdate
complex was reduced to molybdenum blue and the transmission of
Hght was measured at 650 millimicrons (Bunting, 1944).
Aluminum was also determined colorimetrically· from solution
A by measuring the transmission of light at 475 millimicrons of the
solution containing the complex aluminum, calcium and alizarin red-S.

58
Both iron and titanium may interfere in this complex formation with
alizarin red- S _ Interference from iron was eliminated by the
formation of ferrous ferricyanide prior to adding alizarin red-S
15olution to the sample. The effect of titanium was found empirically
and a' comparatively small correction, based on the determined
TiO2 value was subtracted from the apparent value for percent
Al2 0 3 obtained from the total absorption at 475 mil-
Total ir-on was determined from solution B by measuring the
transmission of light at 560 millimicrons of an aliquot containing the
orange ferrous orthophenanthroline complex after the iron was
reduced with hydroxylamine hydrochloride and the solution was buf
fered with sodium citrate.
To determine Ti02 the transmission of IigM was measured at
400 millimicrons for the solution containing a yellow complex pro
duced by the reaction .of titanium with H202 in the presence of
sulfuric and phosphoric acids_
Phosphorus was determined by measuring the light transmitted
at 430 millimicrons in the solution containing the yellow molybdivanado
phosphoric acid complex_
Manganese was determined by measuring the light transmitted
at 525 millimicrons by a sample solution in which manganese has
been oxidized to permanganate with potassium periodate in the
presence of phosphoric and sulfuric acids.

59
Calcium was determined volumetrically by precipitating as
calcium oxalate and titrating the calcium oxalate with standard
potassium permanganate in the presence of sulfuric acid.
Magnesium was determined gravimetrically by precipitating as
magnesium ammonium phosphate below 15°C. After filtration the
precipitate was ignited and weighed as magnesium pyrophosphate.
Both potassium and sodium were determined by using a
Beckman DU flame photometer.
Determination of ferrous iron:
The procedure outlined by Sarver (1927) was used for the
determination of ferrous iron. 0.5 gm of soil was placed in a
platinum crucible of about 100 mI. capacity and was decomposed
with a mixture of 10 mI. (1 + 3) H 2S04 and 5 mI. HF. The
crucible:was brought to a boil on a hot plate. When the mixture
was boiling gently a stream of steam came out. After the solution
had boiled ·for about 15 minutes, the crucible was immersed In a
beaker containing 400 mI. of 2.5% boric acid plus 20 mI. of (1 + 3)
H 2S04. The crucible was kept covered after immersion until just
before titration. It was then titrated with a standard potassium
dichromate solution using diphenylamine sulfonic acid as the indicator.
Heating Weight Loss Studies
The fine clay sample was transferred into a weighed crucible
and placed in an oven at 105°C for 24 hours. The specimen was
weighed and then heated to 350, 550 and 1000°C. The weight loss

60
at every interval was recorded and the percentage of loss
determined on the basis of the weight of specimen at 105 0 Co
Petrography
In soils where the amount of sand was high, petrographic
method was employed to determine minerals in grain mounts. The
proportion of quartz and plagioclase was determined in the sand .
fraction in some soils by this study.
All the sand and silt fractions were first studied by the X-ray
diffraction method. Petrographic methods were used for only a
few sample~ when it was deemed necessary.
Differential Thermal Analysis eDTA)
Organic matter-free and deferrated clay fractions were analy-
zed with a differential thermal analysis apparatus of Stone and
Company for the quantitative determination of kaolinite and haIIoysite.
Standard curves were drawn for kaolinite and halloysite but due to
the overlapping of second endothermic peaks of haIIoysite and
montmorillonite in the present samples, this method could not be
used for quantitative determination of these minerals.
Estimation of Mineral Compositionsof Fine Silt and Clay Fractions
The chemical composition of some clay fractions was deter-
mined to help in the calculation of a modal mineralogical composition
of the samples. X-ray diffraction results were used for the

61
identification and the estimation of relative amounts of minerals
present in samples. Heating weight loss data were employed to
determine the percentage of kaolinite, metahalloysite, and mont
morillonite, and differential thermal analysis was used to give an
approximate estimate of metahalloysite. The different estimates
were then adjusted in such a way that a chemical composition cal
culated for the total mineralogical composition agreed with chemical
composition found experimentally.
An illustration of the procedure used and the assumptions
made is given below using fine clay fractions « O. 21..d III Cca
horizon of Nohili soil as an example.
With the help of X-ray diffraction analysis of this sample the
following minerals were identified and their approximate. percentages
calculated as: kaolinite 8%, montmorillonite 85%, and halloysite 7%.
But the percent weight loss in the interval between 350 - SSO 0 C
indicated a much higher percentage for kaolinite and halloysite,
respectively. This is possibly an indication that montmorillonite has
started losing water below 550 0 C, and, therefore, the percent
weight loss values cannot be used for the estimation of mineral per
centages In this sample.
As has been mentioned previously, the differential thermal
analysis of the sample unde·r consideration showed no endothermic
peak around 650 0 C where the usual montmorillonite peak is
supposed to occur. Instead, the second order endothermic peak

62
occurred around 500 0 C. This is clearly an overlapping of peaks
of montmorillonite and kaolinite types of minerals.
Preparation of standard curve for kaolinite by X-ray analysis:
A standard curve for kaolinite was then prepared by using
intensity of peaks of X-ray diffraction charts. Standard API
sample No. 17 from Bath, South Carolina, was used as a kaolinite
standard. Kaolinite and halloysite contents were determined by
comparing areas on appropriate diffraction patterns.
Different amounts of standard kaolinite were mixed with
suitable amounts of sample specimens under study, i. e., fine clay
from III Cca horizon of Nohili clay. The oriented slides with equi
valents of 10, 20, 30, 40, and 60% of kaolinite were prepared.
The area under first order kaolinite peaks was calculated, and the
standard curve was drawn. The above standard curve for kaolinite
was used on the basis of the following assumptions:
1. That the kaolinite from standard API sample No. 17 from
Bath, South Carolina has the same degree of crystallinity as that
of the present clays;
2. That the particle sizes of these two kaolinites do not differ
significantly.
The estimates of the minerals obtained by using all the avail
able information were rounded out to the nearest 1% and the
mineralogical composition reported In the Tables XIII - XVIII.

63
Not a single fine clay fraction of the present soils contained
more than three secondary minerals, and, therefore, this made
their determination fairly simple. Only a smaller number of
assumptions was involved and the degree of possible error was,
therefore, less. Since no chemical analysis was done on coarser
fractions on these soils, the estimation of minerals was mostly
made on the basis of X-ray diffraction results.
The percentage of amorphous minerals in the present
samples was not determined, although it was felt that co nsiderable
amount of amorphous minerals might be present in the Kalihi soil.
However, during the pretreatment prior to separation into size
fractions the soil samples were deferrated and then boiled for five
minutes with 2% sodium carbonate solution. The last treatment was
done to reduce the portion of amorphous minerals in the soils.
Since the amorphous minerals represent an intermediate stage
(Fieldes and Swindale, 1954) in the formation of new secondary
minerals, their presence was regarded as of little significance in
the objective of the present study.
Calculation of montmorillonite formula:
F rom the known formula of kaolinite and halloysite minerals the
estimated amount of Al2
03
and Si02
required was calculated and
subtracted from the amounts of Al F3 and Si02 found by chemical
analysis. The remaining Al20 3 and Si02 was allocated to
montmorillonite. In the X-ray diffraction chart there was no trace

64
of any gibbsite peak in this fine clay fraction, so all the AIZ0 3 was
allocated to montmorillonite 0
It was assumed that sodium and calcium ions were not present
in the crystal lattice, but in the exchange sites. And since the
clay was saturated with sodium and subsequently washed with
alcohol and dried, prior to total analysis, there would be no
exchangeable calcium in the samples.
The calculation of the montmorillonite formula was done follow
mg the methods given by Kelley (1945) and Sawhney and Jackson
(1958). Montmorillonite present in the IIICca horizon of Nohili
soil was taken as the standard montmorillonite for this study.

65
RESULTS AND DISCUSSION
Morphological Characteristics
The general characteristics of -the six profiles of gray
hydromorphic soils are given in Table I. The coded morphologi
cal descriptions are given in Tables Ia to If. All the soils have a
dark gray color neal" the surface, a heavy clay texture, and a
plastic and sticky consistence. The variation of morphological
properties among six profiles is more pronounced in the subsoil
horizons than in the surface horizons.
Depth of solum:
Due to the presence of ground water table, it was not possi
ble to collect soils down to equal depths in all the soils. The
depth ranged from 40 - 80 inches. In the Honouliuli soil, ground
water table was far below the solum. In other soils the water
table was within five feet of the surface at the time of sampling.
Mottles:
Mottles are present in all the soils except Honouliuli. Since
mottling indicates the alternation of oxidizing and reducing conditions
in soils, its presence has been employed to determine the range of
fluctuation of ground water table. In all soils except Honouliuli the
ground water tables go up to the lower part of the A horizon in
some seasons. In most soils mottles are of medium size. The
only exception is the 822g1 horizon of Laie soil where unusually big
mottles are present. The small size of mottles indicates "the poor

Table Ia. Coded Morphological Properties of Honouliuli Clay
0"10"1
,.
s
Horizon DepthColor
Tex- Structure Consistency Bound- Mottles Special Features(in Dry Moist ture .ary
inches)
A p 0-24 5YR 5YR C 2fm, gr dh, mfi , cs - Few shiny speck3/1 3/2 wvs, wvp magnetite. Many
medium roots
B21 24-35 5YR 5YR C 2m sbk dh, mfr cs - Many roots; man3/3 3/3 ws wvp ganese concre-
tions; magnetitesoecks oresent.
822 35-43 5YR 5YR C 2m sbk dh, mfr cs - Manganese con-3/3 3/3 ws wvp cretions; magne-
tite snecks.
C1 43-53 5YR 5YR C 2m sbk db, mfr cs - Some deeply3/3 3/3 breaks to wvs, 'wvp grooved slicken-
2£ sbk sides. Orientedat about 20. to 30degrees with the!=:urface.
C2 53-80 5YR 5YR C 2fm sbk dh, mfr, -- - Many strong3/3 3/3 wvs wvp deeply grooved
slickensides.Common manga-ne~e concretions.
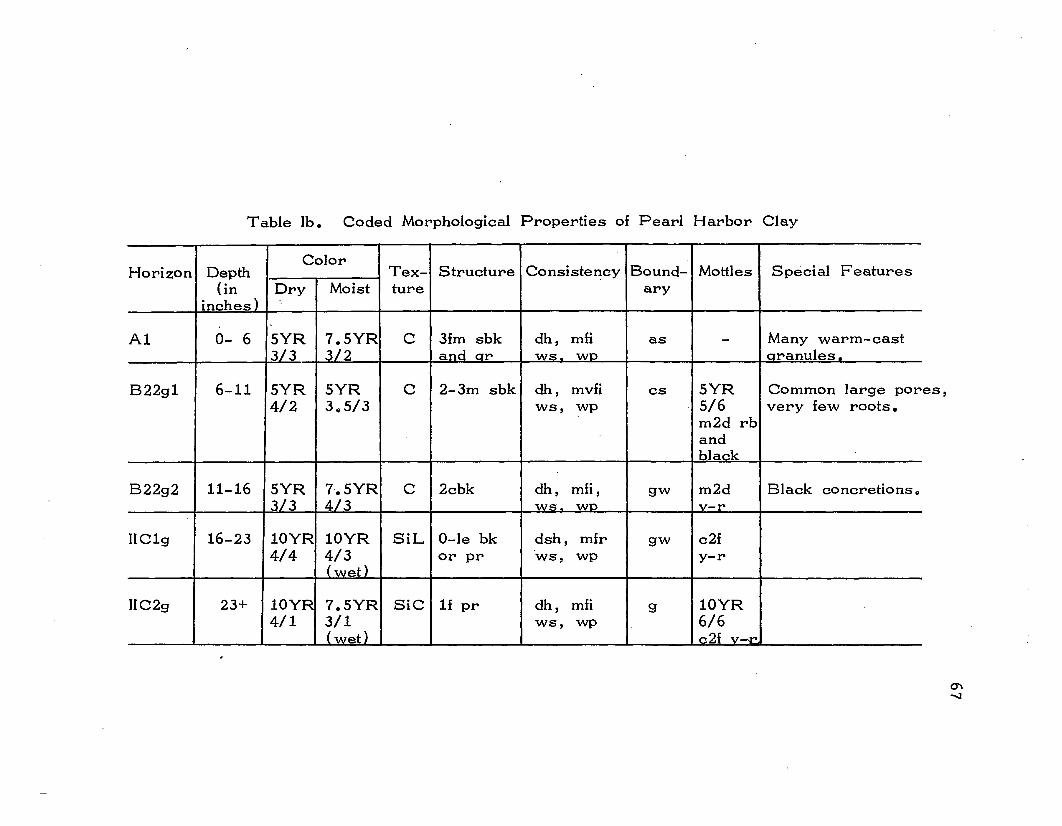
Table lb. Coded Morphological Properties of Pearl Harbor Clay
ColorBound- Special FeaturesHorizon Depth Tex- Structure Consistency Mottles
(in Dry Moist ture aryinches)
A1 0- 6 5YR 7.5YR C 3fm sbk dh, mfi as - Many warm-cast3/3 3/2 and or ws. we oranules.
B22g1 6-11 5YR SYR C 2-3m sbk dh, mvfi cs 5YR Common large pOl"4/2 3 .. 5/3 ws, wp 5/6 very few roots.
m2d rbandblack
B22g2 11-16 5YR 7-o 5YR C 2cbk dh, mfi , gw m2d Black concretions.3/3 4/3 'loN5; 'loNO V-I"
IIC1g 16-23 10YR 10YR SiL O-le bk dsh, mfr gw c2f4/4 4/3 or PI" ws, wp y-r
(wet)
IIC2g 23+ 10YR 7.SYR SiC 1£ PI" dh, mfi 9 10YR4/1 3/1 ws, wp 6/6
( 'loNet ) c2f v-r-
es,
~
--.J
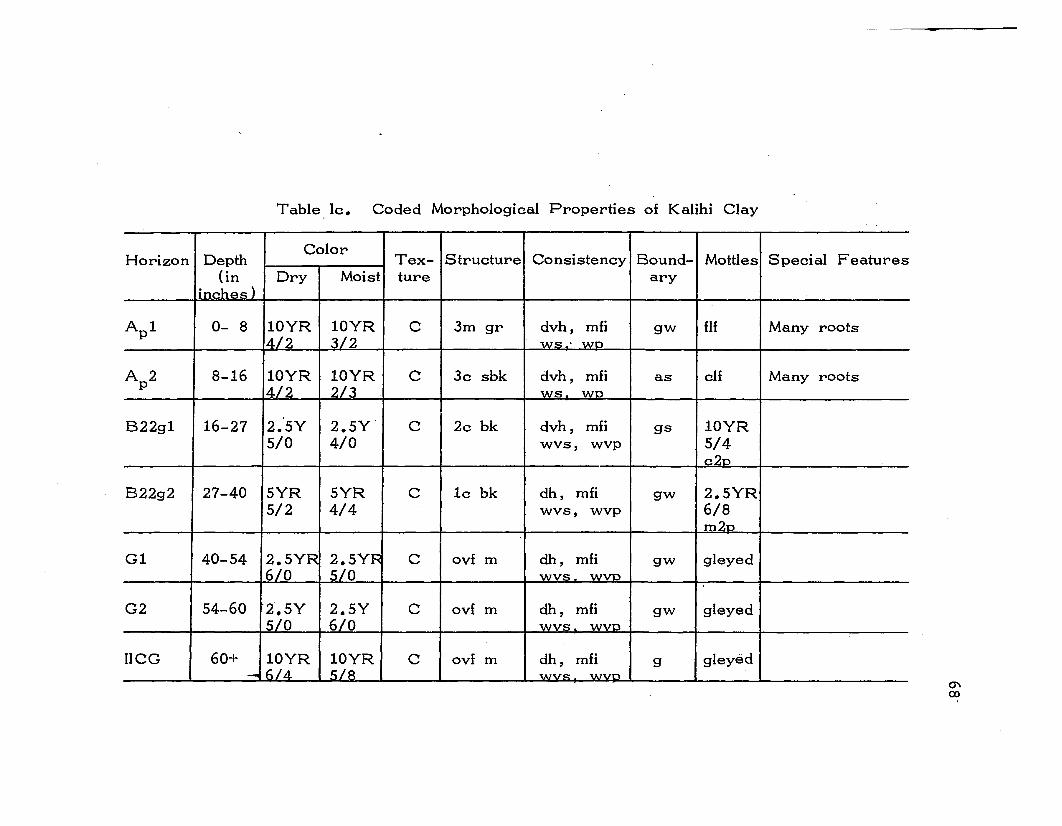
Table Ic. Coded Morphological Properties of Kalihi Clay
DepthColor
Tex- Structure Consistency Bound- Mottles Special FeaturesHorizon(in Dry Moist ture ary
inches)
A p 1 0- 8 10YR 10YR C 3m gr dvh, mfi gw flf Many roots4/2 3/2 '\Al~ • '\AlD
A p 2 8-16 10YR 10YR C 3c sbk dvh, mfi as clf Many roots4/2 2/3 ws WD
B22g1 16-27 2.'5Y 2.5Y· C 2c bk dvh, mfi gs 10YR5/0 4/0 wvs, wvp 5/4
c2n
822g2 27-40 5YR 5YR C 1c bk dh, mfi gw 2.5YR5/2 4/4 wvs, wvp 6/8
m2n
G1 40-54 2.5YR 2.5YR C ovf m dh, mfi gw gleyed6/0 5/0 wvs wvn
G2 54-60 ·2.5Y 2.5Y C ovf m dh, mfi gw gleyed5/0 6/0 '\AlVS wvn
nCG 60+ 10YR 10YR C ovf m dh, mfi 9 gleyed- 6/4 5/8 '\Alv~ '\Alvn0'\ex>

Table Id. Coded Morphological Properties of Laie Clay
Horizon DepthColor
Tex- Structure Consistency 8ound- Mottles Special Features(in Dry Moist ture ary
inches)
A p l 0- 4 10YR 10YR C 3fs bk dvh, mvfi cw - Abundant fine roots;3/2 3/1 wvs .. wvo many tubular oores.
A p 2 4-12 10YR 10YR C 3vf sbk dvh, mvfi cs 2.5YR Fine pores3/1 3/1 . wvs, wvp 4/6
fld
822g1 12-20 5Y 5Y SC om Pl'" dh, mfi, gs 5YR More than 20% of5/1 4/1 to sbk wvs, wvp 3/4 total mass are
m3n mottles.
822g2 20-27 5Y 5Y C o Pr dh, mfi gs c2p Mottles found along5/1 3/2 VI1~ root channels
83g1 27-35 10YR 5Y C 1£ Pr dh, mfi dw f2d5/1 3/2 wvs
83g2 35-41 5Y 5GY C 1m gr dh, mfi dw f2d Very fine pores.5/1 5/1 ws wo
83g3 41-48 5Y 5Y C 3m gr dh, mfi d f2f Fine tubular pores.4/1 5/1 ws wo
0'\0

Table Ie. Coded Morphological Properties of Kaloko Clay. 1
Horizon DepthColor
Tex- Structure Consistency Bound- Mottles Special Features(in Dry Moist ture ary
inches)
A p l 0- 6 5YR 5YR C 2m gr dh, mfi gs flf Many roots present4/3 3/3 ws we many white flecks.
A p 2 6-12 7.5YR 5YR C 3m sbk vdh, mfi gw flf Roots conn, many14/2 4/3 ws we clay films.
822 12-20 7.5YR 7.5YR C 3c sbk dh, mfi aw c2d Few roots, slight8/2 5/2 I reaction withws, wp
hydrochloric acid
IICcag 20-29 2.5Y 7.5YR SiC lc gr ds, mvfr as mp No roots, strong8/2 8/4 wso, wpo reaction with
hydrochloric acid.
IIIC1G 29-33 2.5Y lOG Sl o f sg dl, mvfr as - Slight reaction to7/0 6/1 wso, wpo hydrochloric acid,
gypsum crystalsDt"FH::ent"
IIIC2G 33-43 2.5Y lOG C ovf m ds, mvfr gs - Vigorous reaction7/0 5/1 wso, wpo with hydrochloric
acid.
IIIC3G 43+ 7.5YR lOG 81 o f m-sg dl, mvfr 9 - Slight' reaction with5/0 6/1 ~ wso woo hydrochloric acid ....:J
o

Table If. Coded Morphological Properties of Nohili Clay
ColorTex- Structure Consistency Bound- Mottles SpecialHorizon Depth
(in Dry Moist ture ary Featuresinches)
A p 1 0-14 7.5YR 5YR C 1c sbk dsh, mfi gs 10YR 4/1 Abundant roots,4/2 3/3 wvs, wvp c2d slight reaction
to HCI.A p 2 14-22 5YR 5YR C of m dsh, mfi ab 10YR 4/1 Many fine roots,
4/3 3/3 ws, wp m2d slight reactionto HCI
B22 22-31 10YR 7.5YR C If sbk dsh, mfi aw lfd Thin nearly3/1 2/2 wvs, wvp continuous clay
films.IIC1 31-37 2.5Y 5Y C 1vf sbk dsh, mfi gw 10YR 2/2 Thin discon-
7/0 5/1 wvs, wvp 2fd tinuous clayfilms in someoores.
IIC2 37-46 2.SY 2 0 SY C if sbk ds, mfi as 10YR 3/4 Thin discon-8/2 5/2 &' wvs, wvp tinuous clay
10YR films in some4/1 oores.
lIICca 46-55 2.5Y 2.5Y CaC03 of m ds, ml, as 7 .5YR 3/2 Strong reaction8/0 5/2 wvs &' 7.5YR with dilute H CI.
4/4 coat-inas If
IVC 55-60+ 2.5Y 5Y 4/1 C o vf m dsh, mfi -- Moderate7/0 &,10YR wvs, wvp reaction to
7/1 dilute HCL
"'-lf-l

72
structure of soils and heavy soil materials, whereas big mottles
indicate good structure and better aeration. The absence of mot
tles in the Honouliuli soil bears testimony to the fact that in this
soil drainage impedance does not occur from below due to the
·absence of ground water table.
On the basis of the abundance of mottling, the present soils
can be graded from strongly hydromorphic to weakly hydromorphic
as follows: Nohili > Kaloko > Laie > Kalihi > Pearl Harbor >
Honouliuli •
The hues of the mottles range from 2.SYR to 2.SY.
Glei horizon:
The soil horizons which develop below the permanent level of
the ground water table assume a characteristic color which is
usually bluish gray or greenish gray. Among the present soils,
gley horizons were found in four soils, Kalihi, Laie, Kaloko and
Nohili. In some cases the typical color of gley is permanent and in
some cases the color fades out on exposure to the atmosphere.
The III C3G horizon of the Kaloko soil lost its original color after it
was exposed to the atmosphere but in the IIIC1G and IIIC2G hori
zons of the same soil did not lose their original color appreciably.
In the IIIC3G horizon the hue in the field was lOG and after drying
it became 7.SYR, whilst in IIIC1G and IIIC2G the hues in the field
were lOG. On drying these soils gave a hue of 2. 5Y • The
III C3G horizon of Kaloko soil is an example of reversible gleying,

73
whereas II1C1G and IIIC2G are examples of irreversible or fixed
gleying as has been suggested by Taylor (1959).
The reason for this kind of behavior of gleys 1S not clearly
understood. From field observation it appears that IIIC3G horizon
has higher content of gypsum and less clay, whilst II1C2G horizon
of Kaloko clay has higher content of clay and no gypsum. The
high amount of clay and. the amount of associated reduced iron,
present in the soil is possibly the reasons for this irreversibility.
The reduced iron mixed with organic matter may be absorbed on
the surface of clays in such a way that the clays did not lose color
even on drying.
Bloomfield (1959) in explaining the causes of this irreversible
type of gleying noted that gley soils containing no ferrous sulfide
retain their gley color on exposure to the air, although the color is
usually much lighter when the soil is dry.
The Honouliuli and Pearl Harbor soils contain no gley hori
zons in their profiles.
Carbonate horizon:
The Kaloko and Nohili soils have secondary coraline lime
horizons in their profiles. In both the soils, clay and limestones
were mixed and deposited together in the form of marl. Marl
content is higher in the lower horizons of Nohili soil than in Kaloko.
In both soils the clay content decreases with depth as calcium
carbonate content increases. The IlCcaG horizon of K aloko and

74
and IIC2 hOl"'izon of Nohili have as much as 54.5 and 48.5 pel"'cent
calcium cal"'bonate equivalent l"'espectively 0 Such highel'" amounts
of calcium cal"'bonate content qualify these hOl"'izons to be called
calcic hOl"'izons accol"'ding to the definition in the 7th appl"'oximation
(u. S •D.A. Staff, 1960). These calcic hOl"'izons did not develop
dul"'ing the fOl"'mation of these soils, and, thel"'efol"'e, they cannot be
called pedocalcic. They al"'e possibly petl"'ocalcic. In the othel'"
foul'" soils such as Honouliuli, Peal"'l Hal"'bol"', Kalihi, and Laie,
thel"'e is no appl"'eciable amount of calcic matel"'ial in theil'" pl"'ofiles.
Gypsic hOl"'izon:
Only the IIIC1G and I1IC3G hOl"'izons of Kaloko soil contains an
appl"'eciable amount of gypsum. These hOl"'izons' al"'e thin - thl"'ee to
foul'" inches in thickness. Accol"'ding to the definition in the 7th
appl"'oximation (U.S.D.A. Staff, 1960), the above hOl"'izons may be
called gypsic. They, too, al"'e not pedogypsic. They possibly al"'e
petl"'ogypsic hOl"'izons fOl"'med by pl"'ecipitation. DUl"'ing the dl"'Y
season when the watel'" in the intel"'iol'" basin of the Mana Plain
evapol"'ated, gypsum cl"'ystals wel"'e fOl"'med and pl"'ecipitated.
Since petl"'ocalcic hOl"'izons al"'e pl"'esent ovel'" the petl"'ogypsic
hOl"'izons, it may be assumed that these petl"'ogypsic hOl"'izons al"'e
not impol"'tant in the pl"'esent cycle of soil fOl"'mation. No gypsic
hOl"'izon was found in any othel'" soils of the pl"'esent study. This may
lead to the conclusion that undel'" the hydl"'omol"'phic pl"'ocess of soil
fOl"'mation gypsic hOl"'izon usually does not develop. This may cause

75
a real difference between gray hydromorphic soils on the one hand
__and dark magnesium clays on the other. Raymundo (1965) in his
study of the latter soil group noted that gypsum forms during the
development of dark magnesium clays in Hawaii. But in gray
hydromorphic soils there is no trace of any gypsum crystals
formed during soil formation. This absence of gypsum, therefore,
is suggested as a differentiating criterion between these two great
soil groups of Hawaii.
Color of soils:
The variation of color in the epipedons of present soils is not
appreciable. The hues range from 5YR to 10YR in both moist
and dry soils. The values of the moist soils are around 3. In a
few cases, on drying the values increase by about 1 unit. This
IS possibly an indication of a uniformly low content of organic matter
In the epipedons of all soils. It is interesting to note that in these
soils color does not become darker with increasing degree ofI
drainage impedance. This is because in none of these soils is the
epipedon affected by ground water.
The variation of color from surface downwards is very con-
spicuous in all soils, with the exception of HonouIiuIi (Tables· Ia -
If) • In the HonouIiuIi soil there is no color change, either in dry
01" in moist state, throughout the profile. This is, again, an indi-
cation of the absence of any effect of ground water table in this
soil. Profile distribution patterns of color in other five soils are

76
directly related to the presence of ground water table and its
fluctuation.
Hue, value, and chroma, the three elements of color, in
some soils change on drying. An example may be seen in the
Laie soil where the 83g1 horizon has a color notation when moist
of (SY 3/2). This color on drying becomes (10YR 5/1) (Table
Id) • The extreme vertical distribution of color may be seen in the
Kaloko soil~here moist color in the A p 1 horizon is (5YR 3/3)
which changes to (lOG 5/1) in the III C2G horizon (Table Ie).
The vertical change of hues is intense in the soils where drainage
impedance is intense also, and the change becomes milder in the
soils of less impeded drainage.
In the subsoil horizons of Kaloko and Nohili soils, values
change in some cases by 3 units. This is due to the presence of
secondary soft lime in these horizons. The values become unusually
high on drying.
Causes of morphological differences:
The main reason for morphological differences among the
present soils is the difference in environmental conditions. All the
soils are located on flat lands, and, therefore, the influence of slope
is absent. But the drainage condition is different in different soils.
On the basis of expression of hydromorphic features in the profile,
the present series of soils may be arranged according to a
decreasing degree as follows: Nohili > Kaloko > Laie > Kalihi >

77
Pearl Harbor > Honouliuli.
This gradation was made on the basis of the location of gley
and mottled horizons in the profiles • For this, Longhry's (1960)
formula of mottling factor was used.
Honouliuli soil is morphologically different from the other soils
because there is no other sign of hydromorphic characteristics
except its darker color. It, therefore, can hardly be included In
the gley hydromorphic great soil group.
In all the soils except Honouliuli the influence of poor drainage
is con~picuous. All the soils have been brought under cultivation,
and all of them had been artificially drained for sugarcane production.
Physical Properties
Soil moisture retention:
Soil moisture retentions at saturation, moisture equivalent, 0.33
bar, and 15 bar pressures are shown in Tables II and III.
Maximum moisture holding capacity:
In the investigated soils the maximum moisture holding capacities
at saturation ranged from 50 to 154 percent. by weight. This mois
ture reflects the types and amounts of clay minerals and their degree
of dispersion in different soils.
According to the decreasing capacity of moisture retention at
saturation, the soils may be arranged as follows: Kalihi > Laie >
Nohili > Kaloko > Pearl Harbor > Honouliuli.

78
The more or less uniform content of moisture throughout the
profiles in the Honouliuli and Laie soils IS an indication of uniform
types of clay minerals throughout the profiles.
In the Pearl Harbor and Kalihi soils there IS a gradual
increase of moisture retention with depth except the II Cl horizon of
Pearl Harbor. This possibly suggests that the relative proportion
of types of clays in these two soils changes with depth.
The erratic vertical distribution pattern of maximum moisture
retentions of Kaloko and Nohili soils is due to the presence of
coraline lime and gypsum in the lower horizons of these two
profiles.
The unusually high moisture retention of Kalihi soils is pOSSI
bly due to its high fine clay content and high saturation with Mg++
and Na+ in the exchange complex. In the Honouliuli soil the low
moisture holding capacity (Table II) is due possibly to the type of
clay minerals present.
Moisture eQuivalent and 0,33 bar moisture:
The moisture retention capacity of soils at moisture equivalent
and 0.33 bar pressure is important for the agricultural use of
moisture. The percent moisture at moisture equivalent in the
present ·soils ranges from 30.7 to 118.5 percent; while moisture
retention at 0.33 bar pressure ranges from 32.6 to 71.2 percent
( Tables II and III).

79
Table II. Moisture Retention of Gray Hydromorphic Soils atSaturation, lS-Bar Pressure, and %Clay/1S-Bar Moisture Ratios
Honouliuli Pearl HarborHori- Sat. lS-bar Clay/ Hori- Sat. lS-bar Clay/
zon (%) (%) lS-bar zon (%) (%) lS-barAp 53.4 22.2 2.75 Al 61.9 28.1 2.48B21 53.8 21.7 2.82 B22g1 62.4 28.4 2.52B22 50.1 21.1 3.05 B22g2 67.7 31.1 2.51Cl 50.2 21.3 2.95 IIClg 62.2 28.4 2.33C2 50.5 21.3 3.14 IIC2g 77.2 34.6 2.20
Items Means S.D. Means S.D.Sat. 51.6 1.8 66.3 6.6lS-bar 21.5 0.5 30.1 2.8Clay/1S-bar 2.94 0.16 2.41 0.14
Kalihi LaieHori- Sat. IS-bar Clay/ Hori- Sat. lS-bar Clay/
zon (%) (%) lS-bar zon (%) (%) lS-barApl 73.5 33.0 2.46 Apl 81.2 31.1 2.25Ap2 74.7 33.8 2.49 Ap2 83.2 30.2 2.23B22g1 79.8 36.8 2.43 B22g1 85.1 33.0 1.95B22g2 80.3 35.6 2.44 B22g2 81.7 29.1 2.06Gl 82.6 36.7 2.46 B2g1 78.4 29.0 2.20G2 100.6 38.9 2.39 B3g2 80.1 29.7 2.09IICG 154.5 40.3 2.32 B3g3 82.2 32.1 2.12
Items Means S.D. Means S.D.Sat. 92.4 28.4 81.7 2.2lS-bar 36.4 2.6 30.6 0.6Clay/1S-bar 2.43 0.08 2.13 0.10
Kaloko NohiliHori- Sat. lS-bar Clay/ Hori- Sat. lS-bar Clay/
zon (%) (%) lS-bar zon (%) (%) lS-barApl 79.5 32.3 2.56 Apl 82.0 32.4 2.01A~2 80.0 35.0 2.38 Ap2 74.8 29.5 1.99B 2 79.0 35.2 2.38 B22 94.4 37.6 2.21IICcag 86.3 25.8 3.20 IICI 94.9 34.8 2.55
IIICIG 63.8 26.4 3.19 IIC2 70.9 24.6 3.61IIIC2G 81.9 29.7 2.99 IIICca 60.8 24.6 3.36IIIC3G 72.7 26.4 3.06 IVC 82.9 35.2 2.41
Items Means S.D. Means S.D.Sat. 77.6 7.3 80.1 12.4lS-bar 20.1 4.1 31.2 5.1Clay/1S-bar 2.85 0.40 2.59 0.65

80
Near the lowest limit the difference between these two
moisture types (boHOH) is 1.9 percent but near the highest limit
it is 47.3 percent.
With the exception of Kalihi soil and the IIIC1G, IIIC2G, and
III C3 G horizons of Kaloko soil, in the other soils the amount of
moisture at moisture equivalent is lower than that at 0.33 bar
pressure. Richards and Weaver (1944) found that in fine-textured
soils the percent moisture at moisture equivalent is always smaller
than that at 0.33 bar; and the reverse is the case in coarse-
textured soils. According to the textural classification all the soils
under study are clays, and, therefore, the results of moisture
equivalent and 0.33 bar pressure are in conformity with the find-
mg of Richards et ale (1944).
The IIIC1G, IIIC2G, and IIIC3G horizons of the Kaloko soils,
perhaps due to the presence of gypsum, behave as coarse-
textured soils, and, therefore, the moisture equivalent values are
higher than those at 0.33 bar pressure •
. Richards and Weaver (1944) have further shown that the
amount of moisture at moisture equivalent represents the moisture
content when the soil is subjected to a pressure of about 0.33 bar
on a porous plate. Fig. 3 shows the relationship between these
two moisture constants in the soils investigated except Kalihi.
) ........Correlation analysis gives a correlation coefficient (y of 0.97""".

70 ..
60
.W.~ 5E-«W~:JE- 40tI)
5~
~
30
'( = 0.97*~~
Y = 0.91 X + 1
<:>
<:>
~.
30 40 50 60% MOISTURE AT 0.33 BAR
Figul"e 3. COl"l"elation BetweenPel"cent Moistul"e at 0.33 Bal"and at Moistul"e Equivalent.
(Kalihi soil is excludedfr~om this figul"e.)
70ex>.....

82
Table III. Moisture Retention at Moisture Equivalent and 0.33 bar,6HOH (0.33 bar - M.E.) and 0.33 bar/M.E. Ratios
Honouliuli Pearl HarborHori- M.E. 0.33 6HOH 0.33 Hori- M.E. 0.33 6HOH 0.33
zon (%) bar barf zon (%) bar barf(%) M.E, (%) M,E,
Ap 33.9 36.3 2.4 1.07 A1 40.9 42.0 1.0 1.03821 32.1 34.2 2.1 1.07 82291 40.2 41.9 1.7 1.04822 30.7 32.6 1.9 1.06 82292 45.6 48.6 3.0 1.06C1 30.9 33.1 2.2 1.07 IIC19 42.0 45.2 3.2 1.08C2 30.9 33.3 2.4 1.08 IIC29 54.6 57.0 2.4 1.04
Items Means S.D. Means S.D.M.E. 31.7 1.3 44.7 5.50,33 bar 33,9 1,5 46.9 5.8
Kalihi LaieHori- M.E. 0.33 6HOH 0.33 Hori- M.E. 0.33 6HOH 0.33
zon (%) bar barf zon (%) bar barf(%) M,E. (%) M.E.
Ap1 54.2 54.0 - 0.2 0.99 Ap1 52.4 54.9 2.5 1,05Ap2 59.2 57.8 - 1.4 0.97 Ap2 52.9 55.4 2.5 1.0582291 70,2 61.9 - 8,3 0.88 82291 56.3 58.3 2.0 1.0482292 72.4 58.2 -14.2 0.80 82292 51.1 55.6 4.5 1.08G1 78.8 61.7 -17.1 0.78 8391 50.8 55.1 4.3 1.08G2 86.2 66.5 -19.7 0.77 8392 50.4 54.5 4.1 1.08nCG 118,5 71.2 -47.3 0.60 8393 52.9 57.1 4.2 1.08
Items Means S.D. Means S.D.M.E. 77.1 21.3 52.4 2.00,33 bar 61.6 5,8 55,8 1,4
Kaloko NohiliHori- M,E. 0.33 6HOH 0.33 Hori- M.E. 0.33 6HOH 0.33
zon (%) bar barf zon (%) bar barf(%) M,Et (%) M.E,
Ap1 52.6 55.6 3.0 1,06 Ap1 51.0 56.3 5.3 1.10Ap2 57.8 59.6 1.8 1,03 Ap2 45.8 50,2 4.4 1.09822 58.2 59.8 1.6 1.03 822 63.2 68.3 5.1 1.08IICca9 55.8 58.2 2.4 1,04 IIC1 58.1 62.5 4.4 1.08·IIlC1G 40.6 37,6 - 3.0 0.93 IIC2 42.1 45.2 3.1 1.07IIlC2G 59.3 56.9 - 2.4 0.96 II1Cca 40.5 42.3 1.8 1,04II1C3G 50.9 47.0 - 3.9 0.92 IVC 60.7 66.7 6.0 1.09
Items Means S.D. Means S.D.M.E. 53.6 6,5 51.6 9.20.33 bar 54.0 6,0 55.8 10,6

83
In Fig. 4 the relationship between moisture equivalent and
0.33 bar moisture of Kalihi soils alone is shown. It gives a
correlation coefficient of 0.95**.
Although the Kalihi soil is very fine textured and well dis
persed , the moisture equivalent values are higher than those at
0.33 bar (Table III). In this soil possibly some factor other than
texture is responsible for this behavior.
The b.HOH (the difference between the water content at
moisture equivalent and at 0.33 bar) was plotted against depth In
individual soils (Fig. 5). In Kaloko and Nohili soils the distribu
tion may be explained by the presence of some heterQgeneous
layers within their profiles. In Kalihi soil the b.HOH values
increase with depth (Fig. 5). A graph was drawn with b.HOH
as dependent variable and percent montmorillonite as an. indepen
dent variable in the Kalihi soil ( Fig. 6). It shows a relation that
b.HOH increases with increase in montmorillonite content in this
soil (y = 0.97**).
Referring to the mo~sture retention capacity of Lualualei
soil, Ahmed (1965) noted that all soils having Na+ as one of the
exchangeable cations had their moisture retention increased signif
icantly. Since the lower horizons of Kalihi soil have high
exchangeable sodium percentage compared to calcium and mag-
nesium saturation, the percent moisture at moisture equivalent is
high (118 percent).

(i)~
70
a:~CO
I (i)C"")C"")
65· -.0
I-~
WI (i)
a::J 60I- I / (i)
y = 0.947**U).....0~
I- SSZW I 00a:wf1
SOL.-..... I I • ---.-....1 L I.~...:t. I
50 60 70 80 90 100 110 120PERCENT MOISTURE AT M.E.
Figure 4. Correlation Between Percent Moisture at 0.33 Barand at Moisture Equivalent in Kalihi Soils 00
~
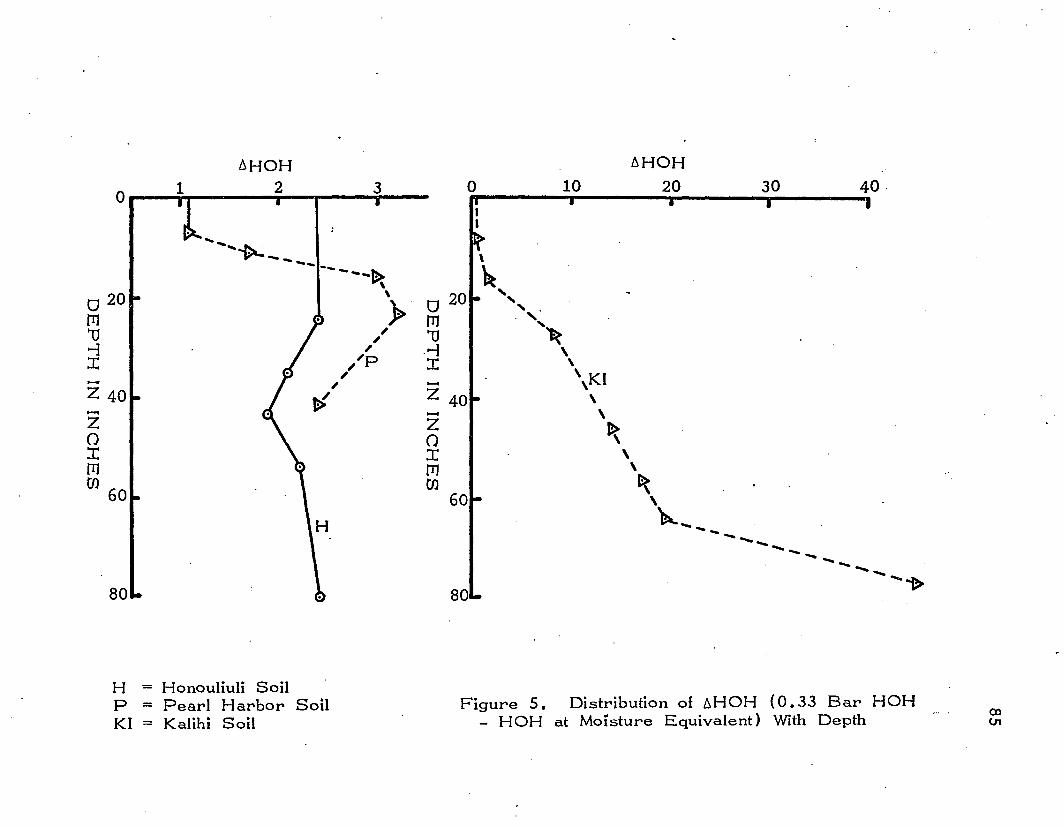
~HOH ~HOH
o .&.2 3 0 10 20 30 40
I[" " ....~-- I \-- --- ~ ~--.
\
0 20 } g20 """lTJ .,"lJ ~~ lJ ~.., ~ .'" \:c /~p :c \
- / \ KI~ -Z 40 Z 40
\
tf \- \Z -Z
~0 0:c :c \lTJ lTJ \
til til ~60 60 \
H ~- -------- ----801- /;) 80· -~
H = Honouliuli SoilP = Pearl Harbor SoilKI = Kalihi Soil
Figure 5. Distribution of ~HOH (0.33 Bar HOH- HOH at MOisture Equivalent) With Depth
00(J1

50
70
·0
Figure 6. Correlation Between 6HOHand Percent Montmorillonite
in the Kalihi Soils
y=0.97**
o' C eel' , , , ,
20 30 40 50 60
MONTMORILLONITE IN SOIL
40
30
20
10
:co:c<l
<Xl0'\

87
--.. ~.-- L:.I
\... . . -- :l.:J-'~ - - -
\\\\\\
\\\\
\
//
I,,I
/!.l.J.,.,
:</I
I/
II
l
A.,,' ...... ./oS
.-' '. 6~.-' ...... J"o
." ....-.A _ • _.-4.~ ~._._._.~.....-. . .
~.
~.
~.
~.,.Il!'
70
60
20H P KI L KO N
H = Honouliuli SoilP = Peal"l Hal"bol" SoilKI = Kalihi SoilL = Laie SoilKO = Kaloko SoilN = Nohili Soil
Figul"e 7. Distl"ibution of Mean Pel"cent Moistul"esat Moistul"e Equivalent, 0.33 Bal" and is-Bal''
of Some Gl"ay Hydl"omol"phic Soils
.'

88
1S-bar moisture:
1S-bar moisture In the soils studied ranged from 21 to 40
percent. The mean values of the profiles may be arranged
according to the decreasing order of 1S-bar moisture retention as
follows: Kalihi > Nohili > Laie ;> Kaloko > Pearl Harbor >
Honouliuli.
In the Honouliuli soil the moisture contents are uniform
throughout the profile while in the Pearl Harbor soil the moisture
percentages follow the pattern of soil texture. The coarse
textured soil retains less moisture at 1S-bar pressure as IS the
case of the II C1 horizon of Pearl Harbor soil.
Ekern (1966)2 found the average moisture contents at 1S
bar pressure to range from 18. S to 23.3 percent for the Molokai
soil. The average moisture content of 21. S percent for Honouliuli
soil fall within this category (Table II). It may be stated that in
physical properties Honouliuli soil behaves more like Molokai soils.
Ahmed (196S) also reported the average moisture content of
Molokai soils at 1S-bar to be 21.0 percent.
In Kalihi soils the type of clay minerals and· their distributions
are probably the main cause for the increase of moisture percen
tages at 1S bar with depth.
In Laie soil the 1S-bar moisture percent increases some
what with depth. Ahmed ( 1965) pointed out that the effects of
2Personal communication.

89
cations in moisture retention at 1S-bar pressure is not at all
prominent as that at moisture equivalent and 0.33 bar pressure.
The reason for this anomaly is possibly due to the presence of
abundant mottles in some horizons of this soil. In the soils where
fine mottles are abundant the moisture retention at 1S-bar seems
to be high.
In Kaloko and Nohili soils the amount of moisture at 1S-bar
depends on the presence of calcareous horizons. In the horizons
where secondary lime and gypsum is high the moisture content IS
lower than those horizons where there are no calcareous
materials.
In Fig. 7 the distribution of moisture at 1S-bar, 0.33 bar,
and M. E. in different soils are shown.
Since the moisture retention at 1S-bar IS directly related to
the amount and type of clay minerals (Ahmed, 196S) in soils, the
clay/1S-bar moisture ratio in the present soils was determined.
The average ratio of the soils is 2. S6 • There is a highly signifi
cant correlation between amount of clay an,,; 1S-bar moisture
(y = o. S6~c~c) in the present soils.
Clay/1S-bar moisture ratio is highest m Honouliuli and the
soils may be arranged according to the following decreasing order
of this ratio: Honouliuli > Kaloko > Nohili> Kalihi > Pearl
Harbor > Laie.

90
From these results it appears that the clay/15-bar moisture
ratio (Table II) tends to be higher in kaolinite type of minerals
and lower in case of montmorillonite. An average ratio of 2 0 50
is, therefore, suggested as appropriate for most soils.
Particle size distribution:
Gray hydromorphic soils are notorious for their bad physical
properties from the point of view of cultivation and tillage. All
these soils are very sticky and plastic. To explain some of these
properties the particle size distribution of these soils was
determined. Results of the particle size distribution are shown In
Table IV.
Clay fraction:
An examination of Table IV indicates that the total clay
content ranges from 60 to 93 percent in the present soils. This
means that all the soils under the present study can be grouped
as clays in the textural classification.
In the Honouliuli soil there is no sign of any vertical move-
ment of clay. The slightly lower content of clay near the surface
is possibly due to the effect of ploughing •.In the Pearl Harbor soil there is a clay bulge in the third
horizon from the surface. This bulge is probably due to deposi-
tional effects. The IIClg horizon is due to lithologic discontinuity
which is a common phenomenon in all alluvial deposits.

91
Table IV • Particle Size Distribution Analysis..for the Gray Hydromorphic Soils
Total Total Coarse Fine TotalHori- Sand Silt Clay Clay Clay
Soils zon >50\-l 50-51J, 5-21J, 50-2\-l 2-0.21J, <0. 2\-l <2\-lHonouliuli Ap 3.9 20.8 5.6 26.5 11.0 50.1 61.1Clay 821 4.1 20.1 5.9 26.0 10.4 50.9 61.4
822 4.2 17.8 5.0 22.9 11.0 53.1 64.1Cl 3.8 19.7 4.7 24.5 11.3 51.5 62.9C2 3.1 15.6 3.8 19.4 11.3 55.6 66.9
Pearl Al 1.4 16.1 3.5 ,19.7 10.1 59.5 69.6Harbor 8g1 0.8 15.7 3.8 19.5 8.8 62.7 71.6Clay 8g2 1.3 10.7 3.8 14.5 16.3 61.6 77.9
I1Clg 3.1 17.8 5.7 23.5 12.5 53.7 66.3I1C2g 0.8 10.5 6.1 16.6 20.8 55.2 76.1
Kalihi Apl 1.5 5.4 1.8 7.3 4.4 76.9 81.4Clay Ap2 1.0 4.8 1.5 6.4 4.8 79.5 84.3
822g1 0.9 4.5 2.1 6.7 4.9 84.7 89.6822g2 1.0 4.6 2.1 6.7 5.0 81. 7 86.8Gl 0.8 3.6 1.3 5.0 5.1 . 85.2 90.3G2 0.7 2.0 1.4 3.4 4.8 88.1 92.9IICG 0.7 2.2 1.6 3.8 7.3 86.1 93.4
Laie Apl 4.8 13.9 5.3 19.3 12.5 57.4 70.0Clay A 2 5.6 16.1 5.3 21.4 13.0 54.3 67.4
8~2g1 8.1 15.9 6.2 22.2 16.2 48.2 64.4822g2 7.1 21.2 8.3 29.6 12.6- 47.3 59.983g1 4.9 20.4 9.0 29.5 12.9 50.9 63.883g2 6.7 20.7 9.0 29.8 14.4 47.6 62.083g3 3.4 17.6 9.4 27.0 16.5 51.4 68.0
Kaloko Apl 0.8 6.3 4.4 10.7 14.8 67.7 82.6Clay A~2 0.6 5.9 4.2 10.1 17.0 66.4 83.5
8 2 0.6 6.1 4.2 10.4 18.0 -65.7 83.8I1Ccag 1.0 4.2 3.2 7.5 9.8 72.9 82.7IIIC1G 1.2 6.6 3.8 10.4 9.8 -74.5 84.4IIIC2G 0.7 4.5 3.8 8.3 12.7 76.3 89.0IIIC3G 0.8 7.0 4.5 11.5 17.1 69.0 86.2
Nohili Apl 5.8 15.1 4.0 19.2 11.6 53.6 65.3Clay A
22 7.7 16.6 6.5 23.1 14.0 44.7 58.5
8 2 0.5 6.3 4.7 11.0 17.6 65.3 83.0IIel 0.6 5.9 2.3 8.3 9.1 79.6 88.8I1C2 0.8 6.4 2.2 8.7 12.9 75.9 88.9IIICca 2.3 10.1 2.7 12.8 20.3 62.3 82.6IVC 1.0 9.3 2.0 11.4 22.6 62.4 85.0

92
Kalihi soil has the highest amount of clay (81 to 93%) among
the present, soils. Most of the clay again fall in the fine clay
fraction « 0 0 2\-1) 0 The percent clay increases gradually with
depth, and it seems that this is possibly due to the preferential
movement of clay downward. The extreme sticky and plastic
properties cf this -soil may be partly attributed to the presence of
this large amount of fine clays.
A large amount of clay in the epipedon of Laie soil indicates
that there is no vertical movement of clays in this soil.
In the Kaloko soil there is a uniform distribution of clay
throughout the profile. There is no appreciable movement of
clays in this soil. The absolute amount of clays near the surface
is much higher than that at the lower horizons if the determination
takes into account the secondary lime present in the soils below.
The above contention is true for Nohili soils also. There IS
a mechanical mixture of clay and secondary lime in the lower
horizons. When the percentage of clays are determined after
removing the calcareous materials the figures for clays become
higher.
Although there is some sporadic movement of clays In the
present soils, none of the soils have any argillic horizon as defined
in the 7th Approximation (U. S.D.A. Staff, 1960).
Silt fraction:
The amount of silt In the Kalihi soil is very small compared

93
to the other soils. This is due to the nature of its parent
materials. There is a gradual decrease of silt fraction in this
soil with depth.
Next in increasing order of silt content is Kaloko soil where
the silt fraction ranges from 7.6 to 11.6 percent. The difference
in silt content in the lower horizons of this soil is due to the
presence of calcar~ous materials and also gypsum.
In the case of Nohili soil the ApLand A p 2 horizons have a
very high content of silt than the horizons below. This may sug
gest that parent material of these two horizons is different from
those below.
In the other soils silt content is quite high. Special mention
may be made of Honouliuli and Laie soils where the amount of silt
fraction is uniform throughout the profile. This is an indication of
genetic homogeneity of soil materials from which these soils have
developed.
In the Pearl Harbor soil the silt content is high in the neg1
horizon. This horizon has developed from different materials than
those that the other horizons have developed from.
From the amount of silt fraction it appears that the parent
materials of gray hydromorphic soils are heterogeneous in
composition.
Sand fraction:
There is a very small amount of sand SIze materials 10 the

94
present soils. Only in Honouliuli and Laie soils are there
appreciable amounts of sand present. The more or less uniform
vertical distribution of sand fraction in these two soils is an indi
cation of their homogeneity of parent materials in the profile.
In Kalihi, Pearl Harbor and Kaloko soils, sand fraction IS
near 1 percent. In Pearl Harbor soil there is 3.1 percent sand
in the IIC1g horizon. This is much higher than that in the hori
zons above and below. It is clear, therefore, that there is a
lithologic discont,inuity in this profile along this horizon.
In Nohili soil an unusually high amount of sand is present In
the A p 1 and A p2 horizons. There is a break in the continuity of
parent material along the bottom of the A p 2 horizon.
The low content of sand-size fractions in the hydromorphic
soils is due to the alluvial nature of the parent materials. When
the materials from upland areas are carried by agencies of trans
port such as running water, it is the small size fractions that are
preferentially carried depending on the intensity of their carrying
capacity.
Chemical Properties
Soil pH:
The pH of soils determined from soil: water and soil: N KcI
solution at 1: 2.5 ratio is shown In Table V. The pH values
vary considerably from one soil to the other. Another interesting

95
point to note is that the pH values of soils In water are always
higher than those in N Kcl solution.
pH values with water:
The pH values in water range from 4.9 to 8.2. This is a
wide range of pH for one group of soils. In Honouliuli soil the
reaction is neutral and the pH values are more or less uniform
throughout. In Pearl Harbor soil the pH values are to the alkaline
side of. neutrality. The low pH at the bottom of the profile is
possibly due to the presence of reduced organic matter there.
Kalihisoil is acidic; the pH values range from 4.9 to 6.8. Such
a big difference in pH among different horizons of this soil is pos-
sibly due to the low permeability of this soil. Due to high dis-
persion of soil materials, there is restriction in downward move-
ment of soil solution.
The immobility and precipitation of highly reduced iron and
organic matter may cause this reduction in pH. Jeffery (1960) In
his study in some British soils related reduction potential (Eh) with
pH, when reduced organic matter is in solution. His equation is
as follows:
RTEh = (1.28 + 0.03) - 3 x 2.303 ~ pH
where, Eh = reduction potential, R = gas constant, F = faraday
and T = absolute temperature. Thus he showed that as pH in a
soil increases its Eh decreases.

96
The Laie soil is mildly acidic and the pH is lower near the
surface and increases gradually with depth. In this particular soil
the pH near the surface may be affected by the usage of fertilizer
like ammonium sulfate. In KaIoko and Nohili soils there are
secondary calcareous materials in their profiles, and the pH values
are very high. In Kaloko soil the range in pH is from 7.5 to 7.8
and in Nohili soil the pH is from 7. 7 to 8.2.
pH in the present soils is guided mainly by the nature of the, .
parent material. The soils may be arran,ged in order of
decreasing pH as follows: Nohili > Kaloko > Pearl Harbor >
HonouliuIi > Laie > Kalihi
pH values using N K CI solution:
The pH values in N K CI s.olution range from 4.2 to 7.5.
These pH values show the same vertical distribution pattern in the
profile as those with water. In soils where there are no calcareous
materials in the profile, pH values with N K CI solution are acidic
in all cases. The extreme is found in Kalihi soil where the B~2g2
horizon has a pH of 4.2. In Laie soil the pH values are all
below 6.0.
In Kaloko and Nohili soils where there are calcareous
materials in the profile, the pH values with N K CI are near 7.0.
In both these soils there is a trend of increasing pH with depth.
This is due to the higher content of CaC03 in the lower horizons.

97
Table V. pH in Water, in N KCI Solution at1: 2. 5 Soil to Water Ratio and b.pH Values of
Different Horizons of Gray Hydromorphici SoilsHonouIiuIi Pearl Harbor
Hori- H2O KCI spH Hori- H2O KCI b.pH, zon pH pH zon pH pHA 6.80 6.05 -0.75 A1 7.25 6.50 -0.758~1 7.10 6.20 -0.90 822g1 7.30 6.70 -0.60822 7.20 6.35 -0.85 822g2 7.35 6.65 -0.70C1 7.15 6.40 -0.75 IIC1g 7.55 6.70 -0.85C2 7.15 6.45 -0.70 nC2g 7.10 6.25 -0.85
Items Means S.D. Means S.D.N20 7.08 0.16 7.31 0.16KCI 6.29 0.16 6.56 0.20OpH 0.79 0.09 0.75 0.11
Kalihi LaieHori- H2O KCI b.pH Hori- H2O KCI b.pH
zon pH pH zon pH pHApl 5.90 5.10 -0.80 Ap1 5.70 4.65 -1.05A 2 6.35 5.65 -0.70 A 2 6.35 5.20 -1.158~2g1 5.90 5.20 -0.70 8~2g1 6.55 5.55 -1.00822g2 4.90 4.20 -0.70 822g2 6.75 5.50 -1.25G1 5.80 5.00 -0.80 83g1 6.80 5.55 -1.25G2 6.50 5.80 -0.70 83g2 6.60 5.40 -1.20nCG 6.85 5.80 -1.05 83g3 6.40 5.35 -1.05
Items Means S.D. Means S.D.H6
0 6.02 0.62 6.45 0.37K I 5.25 0.57 5.31 0.33b.pH 0.78 0.13 1.14 0.10
Kaloko NohiliHori- H2O KCI b.pH Hor'i- H2O KCI b.pH
zon pH pH zon pH pH'Apl 7.55 7.00 -0.55 Ap1 7.70 6.85 -0.85Ap2 7.85 7.00 -0.85 Ap2 7.75 6.80 -0.95822 7~85 7.10 -0.75 822 8.05 6.90 -1.15IICcag 7.90 7.35 -0.55 IICl 8.00 6.95 -1.05IIIC1G 7.85 7.45 -0.40 nC2 8.15 7.10 -1.05IIIC2G 7.60 7.30 -0.30 IIICca 8.25 7.20 -1.05IIIC3G 7.85 7.55 -0.30 IVC 7.95 7.00 -0.95
Items Means S.D. Means S.D.H2O 7.78 0.14 7.98 0.20KCI 7.25 0.22 6.97 0.14b.pH 0.53 0.21 1.01 0.09

98
b,pH values:
The b,pH values (difference in pH values between N KCI
solution and water) ranged from 0.3 to 1.3 in the soils under
study (Table V). The mean values of b,pH was highest in the
Laie soil. The soils may be arranged according to the decreas-
ing order of b,pH as follows: Laie > Nohili > Honouliuli >
Kalihi > Pearl Harbor > Kaloko.
The b,pH values are more or less constant throughout the
profiles in all soils except Kaloko where the values are decreasing
with depth. The lowest values are found in horizons where there
IS gypsum in this soil.
-In view of the high base status of these soils it IS difficult to
explain such a big drop in pH in gray hydromorphic soils when
N KCI solution is added to them. Coleman et al. (1959) have--indicated that montmorillonite clays have very small amounts of
pH-dependent charge on their surface. Nye et al. (1961) in their
study of ion-e~change reactions reported that high concentrations
of K-solution released high amounts of aluminum from montmoril
lonite clay. The AI+++ was ~eplaced by K+ in the internal
exchange sites of clays. In the soils studied, especially those con-
taining higher amounts of montmorillonite, some mechanism like this
may be operative when treated with N K CI.
Wiklander et al. (1950) studied the b,pH of some gyttja soils
In Sweden. His results showed that as the absolute pH values of

99
the soils increased, the ~pH values also increased and vICe versa.
He did not indicate any reason for this. In the present study the
~pH values are lowest in the Kaloko soil where the absolute pH
is high. This result does not, therefore, conform with the
findings of 'Wiklander et aI. (1950).
Raymundo (1965) in his work on Black Earths of Hawaii
also reported very high ~pH values. His values ranged from 0.3
to 2.3 pH units. It may be mentioned that Black Earths have
very high base saturation and high cation exchange capacity. He
explained the high ~pH values by stating th~t concentrated K CI
solution may replace some aluminum from the montmorillonite type'
of clay. He further stated that there are possibly some H + in the
interlayer space ,of montmorillonite. The H+ is replaceable only
by high concentrations of K+.
From the present study it appears that there is a gap In our
present knowledge of exchangeable cations with respect to soil
acidity,.
Organic matter:
Organic matter in the soils investigated is very low compared
to the similar soils elsewhere (Anderson, 1955). The low
organic matter content is due to their location in the tropical climatic
condition where decomposition of organic matter is rapid. Ray-
mundo (1965) in his study of the properties of Tropical Black
Earths reported very low values for organic matter.

100
Table VI. Percent Organic Matter, Total Nitrogen, C/ N Ratios,and Cation Exchange Capacity in me. per 100 grams
of Soils in Gray Hydromorphic Soils
Horizon
A8~1822ClC2
Itemsa.M.C/N RatioC,E.C.
a.M.(%)2.01,51,21,11.0
HonouliuliNitrogen
(%)0.090.080.06
·0.040.05
Means1.4
12.125,2
Pearl Harbor
C/NRatio12.511.011.214.611.4
S.D.0.331.55,4
C.E.C.me. %34.325.721.421.023.6
Horizon
Al822g1822g2nClgIIC2g
Itemsa.M.C/N RatioC.E.C.
O.M.(%)
2.91,81,60.92.6
Nitrogen C/N(%) Ratio
0.13 12.40.11 9.30.10 9.50.06 9.60.14 10.6
MeansS .0.2.0 0.78
10.2 ~1.3
46.6 8,1
C.E.C.me. %49.554.748.633.047.4
. Horizon
Ap lAp 2822g1822g2GlG2nCG
Itemsa.M.C/N RatioC,E.C.
a.M.(%)
2.22,02.10.90.70.60.5
KalihiNitrogen
(%)
0.160.140.070.040.030.030.02
Means1.3
10.271,0
C/NRatio
7.68.18.7
11,411.010.613.8
S.D.0.762.29,9
C.E.C.me, %69.762.669.568.882.885.458.3

101
Table VI. Percent Organic Matter, Total Nitrogen, C/N Ratios,and Cation Exchange Capacity in me. per 100 grams
of Soils in Gray Hydromorphic Soils (Continued)Laie
Horizon O.M. Nitrogen C/N C.E.C.(%) (%) Ratio me. %
Ap l 4.9 0.18 15.6 54.9Ap2 3.4 0.14 13.9 55.3B22g1 2.0 0.09 13.3 51.9B22g2 2.2 0.12 10.2 48.1B3g1 2.5 0.13 11.2 49.2B3g2 1.8 0.07 13.5 48.9B3g3 1.8 0.07 14.8 52.7
Items Means S.D.O.M. 2.6 1.11C/N Ratio 13.2 1.9C.E.C. 51.6 2.9
KalokoHorizon O.M. Nitrogen C/N C.E.C.
(%) (%) Ratio me. %Ap l 3.3 0.13 14.7 55.8Ap2 2.7 0.12 13.1 46.3B22 1.8 0.07 13.9 58.3IICcag 2.2 0.08 15.6 23.9IIIC1G 3.2 0.09 18.8 17.6IIIC2G 8.7 0.15 33.1 32.6I1IC3G 5.0 0.06 47.0 22.5
Items Means S.D.O.M. 3.8 2.35C/N Ratio 22.3 12.9C.E.C. 36.7 16.7
NohiliHorizon O.M. Nitrogen C/N C.E.C.
(%) (%) Ratio me. %Ap l 2.7 0.13 12.0 58.7Ap2 2.0 0.10 11.1 48.5B22 2.6 0.12 12.1 80.5IIC! 1.5 0.07 11.4 48.5I1C2 1.2 0.04 15.4 45.3I1ICca 1.2 0.04 16.7 31.7IVC 1.1 0.03 18.3 48.5
Items Means S.D.O.M. 1.7 0.. 67C/N Ratio 13.8 2.9C.E.C. 51. 7 15~0

102
Percent organic matter ranges from 0.6 to 8. 7 (Table VI).
In all soils the amount of organic matter is high near the surface.
In Honouliuli, Kalihi,. and Nohili. soils there is a gradual decrease
of organic matter with depth. But in the case of Pearl Harbor
and Kaloko soils the organic matter decreases from the surface up
to the edge of the ground water table and from there it again
increases with depth. Initially, there was a high concentration of
organic matter at the bottom of these two profiles. Organic matter
decomposition may have been hindered due to the prevalence of an
anaerobic condition and high pH.
Anderson et ale (1955) has reported this kind of increase of
organic matter with depth in some gytija soils of Sweden. He
discovered two types of organic matter in gytij a soil. In the top\
layers an accumulation of plant residues occurs where humification
takes place under aerobic condition. Part of the organic matter
here will be bound by the soil minerals and part lost in the
mineralization process and subsequent leaching. In the reduced
zone, a spe'cific kind of organic matter called gytija was found. It
consisted of heterogeneous plant and animal residues, deposited In
a lake or in the sea and decayed under anaerobic condition.
The vertical distribution of organic matter in the present soils
IS shown in Fig. 8. The high content of organic matter (5%) neal'"
the surface of the Laie soil is possibly due to the grass vegetation
there.

PERCENT ORGANIC MATTERo 123
, , iii• . I
.j> ...... ,.f;>~.......
."0-._._. _. KO
-._.-.-.-.~---~7>
/../
/./
PERCENT ORGANIC MATTER246 8
8
00
020(1l
'U-1:r:-Z 40-Zo:r:(T]
CIl 60
I,J..!._.-.-1;>t:L. I
.......~
,,,,H,,EI80
o 20(1l
'U-1:r:-Z_ 40
Zo:r:(1lCJl
60
H =P =KI =LKO =N =
Honouliuli SoilPearl Harbor SoilKalihi SoilLaie SoilKaloko SoilNohili Soil
Figure 8. Distribution of Organic Matter With Depthin Six Gray Hydromorphic Soils
....ow

\
104
Gill and Sherman (1952) studied the organic !J1atter content
of Gray Hydromorphic soils of Hawaii. They reported an increase
of organic matter content at the bottom of the profiles in. some
soils. The organic matter distribution In Pearl Harbor and Kaloko
soils appears to be in conformity with the findings of Gill and
Sherman (1952).
A correlation analysis was made between organic matter in
soil and ferrous iron in soil as determined by the U. S • G. S. rapid
method to see if .there was any effect of organic matter in this
determination (Walker and Sherman, 1962). The results show
that there is a significant effect of organic matter on the determi
nation of ferrous iron by this method (y = 0.57**).
Carbon/nitrogen (C/N) ratios:
The C/N ratio in the soils ranges from 8 to 47 with most of
the values faIling between 10 and 20. The mean C/N ratios of
individual profiles range from 10 to 22. McLean (1930) reported
that in soils of well-decomposed organic matter the normal C/ N
ratio varies from 10 to 12. With the exception of Kaloko soil,
where the C/ N ratio is high, the C/N ratios of the present soils
conform well with the observation of McLean (1930).
Dean (1930) determined the C/N ratio of some pineapple
soils In Hawaii and indicated that for most Hawaiian soils the C/ N
ratio IS below 10 and more nearly 8. He obviously was working
with soils of freely-drained areas. Dean (1938) in another study

105
on the effect of rainfall on C/N ratio in the soils of Hawaii,
observed that with increase of rainfall the C/N ratio also increased.
Ayres (1943) also studied the C/N ratio in some Hawaiian soils,
m relation to rainfall. He showed that for the rainfall range of 25
to 180 inches, the C/ N ratio varied from 9 to 20.
In Kaloko and Nohili soils there is a gradual i~crease of
C/N ratio with depth (Table VI). In Kalihi and Laie soils there
is also a slight increase in the C/N ratio in the subsoil horizons.
The horizon where the increase in C/N ratio starts more 01" less
coincides with the location of the ground water table in all the
profiles, with the possible exception of the Honouliuli.
In Kalihi and Laie soils the high C/N ratio in the subsoil
horizons is due to the effect of a reduced condition below the level
of the ground water table, where aerobic bacteria cannot subsist.
But in Kaloko and Nohili soils, due to the presence of lime, the
pH in the subsoil horizons goes to around 8.0. At such high pH
the normal functioning of microorganisms may be hindered. The
effect of an anaerobic condition due to a reducing condition may be
additive to high pH effect, thus causing the increase of C/ N ratios.
Blomberg and Holmes (1959) determined the C/N ratio of
Honouliuli soil. They reported a C/ N ratio of 6.9 for this soil.
In the same paper they noted that in the Hawaiian Islands the amount
of nitrogen is higher In the freely-drained soils than in the poorly-
drained ones.

106
The distribution pattern of nitrogen in the soil profiles are
shown in Fig. 9. The distribution of nitrogen in the Gray Hydro
morphic soils of Hawaii shows a similar pattern as that of organic
matter. With the exception of the Pearl Harbor and Kaloko soils,
there is a drop· in nitrogen content with soil depth.
Cation exchange capacity:
·With the exception of Honouliuli all the soils have high cation
exchange capacity. The CEC values range from 21.0 to 85.4
me. per 100 grams of soil, and the range for the mean of the
profiles is from 25.2 to 71.0 me. per 100 grams of soil (Table
VI) •
The highest cation exchange capacity is found in the Kalihi
soil where the average value is 71.0 mel100 grams. It is dif
ficult to explain why a soil with predominantly kaolinite· mineral has
such a::high CEC. The higher percentage of clay (81 to 92%) in
this soil is an important factor. There possibly are some other
unknown factors involved in this CEC, like particle size and the
presence of amorphous materials. The nature of the X-ray peaks
indicate that the metahalloysite in the Kalihi soil.s is poorly crystal
line. Chemical analysis of clays of this soil shows that there is
some isomorphous substitution of iron and magnesium in the clay
lattice. It is possible that the presence of this poorly-ordered
metahalloysite is the reason for the high cation exchange capacity In
the Kalihi soils (Worall and Cooper, 1966). On the basis of the

:.J '......t:> ............. _I'
....... ,G.,.,roo'.......
:~, o~
' ..~. --~.~
N ,I:)_-~ •.t;>/.( ~ .............. o
./ .rp °
I IP iL
, °I
80
-2o:r:ITJ00 60
20o(TJ
11....:j:c-240
' ..... P' ........... ""Q
o,,°H,,,~
PERCENT TOTAL. NITROGEN PERCENT00 .05 .10 .15 .20
00 .05 .10 ,15 .~O
I iii iii I·' • 'i.' iI
° ...8I .....r:r.... ......l...e......
...... ...... IE( r:.....
60
-240
-2o:r:(TJ
00 60
020
(TJ
. ~:r:
H = Honouliuli SoilP = Pearl Harbor SoilKI .. Kalihi SoilL = Laie Soil·KO = Kaloko SoilN = Nohili Soil
Figure 9. Distribution Pattern of Nitrogen with Depthin Six Gray Hydromorphic Soils
....o-.J

108
cation exchange capacity the present soils may be arranged in
decreasing order as follows: Kalihi > Nohili > Laie > Pearl
Harbor > Kaloko > Honouliuli.
In the Kaloko soil there is a great drop in cation exchange
capacity with depth. This decrease in CEC is due ,to the pres
ence of calcareous materials and gypsum in the lower horizons.
The cation exchange capacity of Nohili soil also has been affected
by calcareous materials and marls.
Gill and Sherman (1952) reported the cation exchange
capacity of Gray Hydromorphic soils of Hawaii. Their CEC
values are lower than the present values in all soils. Kanehiro
,and Chang (1956) studied the cation exchange properties of
Hawaiian soils. TheirresuIts, more or less, coincide with the
present results in the lower limits of cation exchange capacity.
Their CEC values ranged from 25. a to 54.4 mell00 grams of
soil.
Raymundo (1965) studied the cation exchange capacity of
Dark Magnesium Clays of Hawaii. His results indicate that for
these soils the CEC ranges from 35.1 to 91.4 me/laO grams of
soil. It may be mentioned at this point that the average CEC
values of Dark Magnesium Clays of Hawaii is 62.4 mell00 grams
of soil (Raymundo, 1965) whereas the average CEC values of
Gray Hydromorphic soils are 47.1 mell00 grams of soil. It is
clear, therefore, that the Dark Magnesium Clays have a higher

109
CE C than the Gray Hydromorphic soils. The possible reasons
for this are the higher contents of kaolinite clay in some hydro
morphic soils and the presence of calcareous materials in others.
The big range in the cation exchange capacity of Gray
Hydromorphic soils is possibly a reflection of the heterogeneity of
their composition, both mineralogical and chemical.
Exchangeable bases:
Under the gleization process' of soil formation, exchangeable
Mg++ is the dominant cation in the exchange complex (Saunders,
1959) • Joffe (1949) also reported that in hydromorphic soils Ca++
is of secondary importance in the presence of Mg++. But in the
Gray Hydromorphic soils of Hawaii this is possibly not the case.
In all soils except Kalihi the Ca++/Mg++ ratio is above 1.0. In
Laie soil this ratio is near 1.0 but in K alihi soil Mg++ is the
dominant cation in the exchange complex (Table VIII).
It is generally believed that as the gleization process pro
gresses the Ca++/ Mg++ ratio tends to be unity (Kanehiro et al.,
1956; Miller, 1959). Does this mean that Kalihi and Laie soils
are more mature than other soils? This is possibly not- true as
their mineralogy indicates. The low concentration of Ca++ is due
to the nature of their parent material.
Gill and Sherman (1952) made an attempt to explain the
extreme sticky and plastic properties of Gray Hydromorphic soils
on the basis of high magnesium saturation of their colloid complex
and low Ca++/Mg++ ratio. Subsequent work by Ahmed (1965)
showed that a Mg++-saturated soil behaves as a Ca++-saturated
soil, and, therefore, Mg++ does not cause dispersion of soils.

110
Table VII .. Exchangeable C ++ M ++ K+ and Na+ ina , 9 ,me. pel'" 100 grams of Soil in Gray Hydromorphic Soils
Honouliuli Pearl HarborHori- Ca++ Mg++ K+ Na+ Hori- Ca++ Mg++ K+ Na+
zon me.% me.% me.% me.% zon me.% me.% me.% me.%A 12.3 11.7 0.2 1.5 Al 17.7 12.8 0.2 3.68~1 11.4 7.9 0.1 1.4 822g1 14.3 10.9 0.2 3.8822 10.9 8.7 0.1 2.5 822g2 16.6 12.9 0.1 4.8Cl 11.3 9.8 0.1 3.0 nClg 14.0 10.4 0.1 3.9C2 12.9 8.1 0.1 2.9 nC2g 19.6 12.9 0.2 3.6Items Means S.D. Means S.D.Exch. Ca++ 11.8 0.8 16.4 2.4Exch. Mg++ 9.2 1.5 11.9 1.2Exch. Na+ 2.3 0.7 3.9 0.5
Kalihi LaieHori- Ca++ Mg++ K+ Na+ Hori- Ca++ Mg++ K+ Na+
zon me.% me.% me.% me.% zon me.% me.% me.% me.%Apl 9.7 21.8 1.1 1.1 Apl 15.9 16.1 0.2 1.4A 2 10.2 18.1 0.1 3.1 Ap2 19.8 20.7 0.2 1.98~2g1 6.8 17.3 0.1 . 5.3 822g1 19.1 19.6 0.2 3.5822g2 6.2 16.1 0.1 5.8 822g2 18.9 20.1 0.1 4.4Gl . 5.8 29.1 0.1 6.4 83g1 18.1 19.6 0.1 4.5G2 6.5 18.9 0.1 6.9 83g2 18.5 19.2 0.1 4.5nCG 12.6 21.6 0.1 8.0 83g3 18.7 19.6 0.1 4.5
Items Means S.D. Means S.D.Exch. Ca++ 8'.3 2.6 18.4 1.2Exch. Mg++ 20.4 4.4 19.3 1.5Exch. Na+ 5.2 2.3 3.5 1.3
Kaloko NohiliHori- Ca++ Mg++ K+ Na+ Hori- Ca++ Mg++ K+ Na+
zon me.% me.% me.% me.% zon me.% me.% me.% me.%Apl 42.2 18.2 0.6 3.7 Apl 32.4 23.4 0.3 2.1Ap2 45.4 24.9 0.4 3.7 A 2 29.4 16.3 0.1 2.4822 39.5 22.4 0.3 3.4 8~2 35.0 12.6 0.6 3.4IICcag 32.5 15.7 0.1 3.5 IICl 42.8 13.7 0.4 3.1IIIC1G 214.0 56.3 0.4 4 .. 5 IIC2 24.7 18.5 0.1 1.8IIIC2G 49.4 21.2 2.3 7.4 II1Cca 28.7 15.3 0.1: 1.7IIIC3G 163.6 32.6 2.6 8.8 IVC 42.5 12.7 1.1 3.3
Items Means S.D. Means S.D.Exch. Ca++ 83.7 o:-!--r- 33.7 6.9Exch. Mg++ 27.4 13.8 16.1 3.8Exch. Na+ 5.0 2.2 2.5 0.7

111
Exchangeable Ca++ :
Exchangeable Ca++ content ranges from 5 0 8 to 214 0 0 me. /
100 grams of soil. The high concentration of calcareous
materials in Kaloko and Nohili soils are responsible for these
extremely high values of Ca++• Leaving aside Kaloko and Nohili
soils the exchangeable Ca++ for the present soils ranges from
5.8 to 19.1 me/l00 grams of soil.
The vertical distributio·n pattern of Ca++ in all the soils·
appears to be guided by the nature of the soil materials and not
by the soil-forming process. Below the epipedon the distribution
of exchangeable Ca++ is uniform in the Honouliuli and Laie soils.
This may be an indication that the process of gleization has no
++influence on the distribution of exchangeable Ca as was sug-
gested by Saunders (1959).
Exchangeable Mg++ :
In Gray Hydromorphic soils magnesium is important in two
respects. Firstly, its role in the genesis of secondalY minerals
and secondly, its importance in the cation exchange complex of
these soils. Table VII shows the exchangeable Mg++ in Gray
Hydromorphic soils.
Exchangeable Mg++ in the Honouliuli,· Pearl Harbor, .Kalihi,
and Laie soils range from 7.9 to 29.0 me/l00 grams of soil.
Profile distribution of this element is more or less uniform in
these four soils. This is not in conformity with the general view

Figure 10. Profile Distribution of Exchangeable Na+in Some Gray Hydromorphic Soils
80
H = Honouliuli Soilp = Pearl H arbor SoilKI = Kalihi SoilL = Laie SoilKO = Kaloko SoilN = Nohili Soil
..........tv
'.KO\
"
G
..... .......... £1>
'G.. \0 ....... \
, ......... 0
\ ........~ "'"q,,~
\
~\
\\
t>
EXCHANGEABLE Na+ (me. %)
0, . ~ Ii ~ q ~
80
I
I" ."~ I0.__ L 20E( --- 1""1
. ---~ Vo ...... ..... [11
"" . '..."." II~.,.~ ~ ~''p ~ :c
.,.d0 if> Z 40,., -
"':J'-:' I ~...... I :cP I [I]6..._._._._._.[;] II> 00
60
H
+EXCHANGEABLE Na (me. %)2 . 3 41
020
[1111-):c-Z40
-Zo:c[11
en 60

113
that in the exchange complex' of the gleyed horizon there is an
increase of Mg++ than in an ungleyed horizon (Mohr et al., 1959).
Gill and Sherman (1952) reported the exchangeable Mg++
content of Gray Hydromorphic soils. Their regylts, in all the
soils, are somewhat lower than the present results.
+Exchangeable N a :
There is an increase 10 exchangeable Na+ with depth in the
Honouliuli, Kalihi, Laie, and Kaloko soils (Table VII). Fig. 10
shows the vertical distribution pattern of exchangeable Na+. In
Kalihi, Laie, and Kaloko soils there is a positive correlation
+between total Na20 and exchangeable Na. The sodium in the
above soils are being leached out gradually and the degree of
leaching is maximum near the surface"
On the basis of exchangeable Na+ values the present soils
may be arranged in the decreasing order as follows: Kalihi >
Kaloko > Pearl Harbor > Laie > Nohili > Honouliuli.
The reason for the high content of exchangeable Na+ is that
10 all the soils parent materials were deposited in a marine
environment during the Pleistocene Epoch.
Although the exchangeable Na+ is considerably high, none of
the soils fulfill the requirement to be called Natric horizon as has
been defined in the 7th Approximation (U.S"D.A. Staff, 1960).
It may be mentioned, however, that the 822, C1, and C2 horizons
of the Honouliuli soil show percent saturation of sodium as high as

114
Table VIII. Percent Calcium Carbonate, Loss on Ignition,Base 8 aturation, and Exchangeable Ca++/ Mg++ Ratios
of Gray Hydromorphic Soils
HonouliuliHorizon CaC03 LOI B.S. Ca++/
(% ) (%) (%) M ++9
A 0.7 12.6 75.1 l.lB~l 1.0 12.3 81.6 1.4B22 1.0 12.7 100 1.3Cl 0.7 12.0 100 1.2C2 1.0 14.3 100 1.6
Items Means S.D.CaC03 0.9 0.2B.8.Ca++/Mg++ 1.3 0.2
Pearl HarborHorizon CaC03 LOI B.S. Ca++/
(%) (%) (%) Mg++Al 2.0 16.8 69.3 1.4B22g1 2.0 16.8 53.4 1.3B22g2 2.3 16.3 70.9 1.3nClg 2.3 15.4 85.9 1.4IIC2g 2.0 14.9 76.8 1.5
Items Means S.D.CaC03 2.1 0.2B.S. 71.3 12.3Ca++/Mg++ 1.4 0.1
KalihiCa++/Horizon CaC03 LOI B.S.
(%) (%) (%) Mg++Apl 1.0 18.8 48.4 0.4A 2 1.3 ,19.6 50.4 0.6 ..B~2g1 1.0 18.1 42.6 0.4B22g2 0.7 16.7 40.9 0.4Gl 0.7 13.5 50.1 0.2G2 1.0 15.8 37.9 0.4nCG 1.3 15.1 72.6 0.6
Items Means S.D.CaC03 1.0B.S. 48.9 11.4Ca++/Mg++ 0.4 0.1

115
Table VIII. Percent Calcium Carbonate, Loss on Ignition,Base Saturation, and Exchangeable Ca++/Mg++ Ratios
of Gray Hydromorphic Soils (Continued)Laie
Horizon CaC03 LOI B.S. Ca++/. ++
(%) (%) (%) MgApl 2.0 16.2 61.4 1.0Ap2 2.2 15.9 77.1 1.0B22g1 2.4 11.0 81.8 1.0B22g2 3.0 11.6 90.6 0.9B391 3.0 11.1 86.1 0.9B392 2.5 10.6 86.5 1.0B393 3.0 10.8 81.3 1.0
Items Means S.D.CaC03 2.6 0;4B.S. 80.7 9.5Ca++/Mg++ 1.0
KalokoHorizon CaC03 LOI B.S. Ca++/
(%) (%) (%) Mg++Apl 16.0 20.1 100 2.2A~2 12.3 18.6 100 1.8B 2 21.5 21.9 100 1.8IICcag 54.5 34.2 100 2.1I1IC1G 21.5 38.6 100 3.8IIIC2G 35.5 32.9 100 2.3IIIC3G 14.5 33.5 100 5.0
Items Means S.D.CaC03 25.1 15.0B.S.Ca++/Mg++ 2.7 1.2
NohiliHorizon CaC03 LOI B.S. Ca++/
(%) (%) (%) Mg++Apl 3.5 15.4 99.4 1.4A 2 3.5 14.2 99.6 1.8B~2 10.5 19.7 64.3 2.8IICl 31.5 28.6 100 3.1IIC2 ; 48.5 32.9 99.7 1.3IIICca 48.5 30.4 100 1.9IVC 32.5 24.0 100 3.3
Items Means S.D.CaC03 25.5 19.7B.S.Ca++/Mg++ 2.2 0.8

116
12.0, 14.5, and 12.5 percent, respectively. The C1 horizon of
the Honouliuli soil may be taken as a close approximation of a
Natric horizon.
In some lower horizons of the Kaloko soil there is an
enrichment of exchangeable Na+. On calculation the percentage of
sodium saturation may be quite high, but the high content of cal
careous materials have subdued the effect of sodium there.
Exchangeable N a + is, therefore, ineffective as a potential danger
In causing alkali effect both in Kaloko and Nohili soils.
With the exception of Kalihi soil, the percent base saturation
In ~II soils is high, quite often exceeding 100 percent (Table VIII).
The low percent base saturation in the K alihi soil was apparent
from its low pH values.
Calcium carbonate:
The HonouIiuIi, Pearl Harbor, Kalihi, and Laie soils do not
have an appreciable amount of calcium carbonate in their profiles.
The CaC03 in these soils ranges from 0.7 to 3.0 percent. Since
the experimental errol'" in the procedure is +1%, these soils may
be considered as practically devoid of any carbonate of pedogenic
significance.
Two soils In which calcium carbonate plays a mClJor role in
their morphology and genesis are Kaloko and Nohili. The calcium
carbonate content in these two soils ranges from 3.5 to 54.5 per
cent ( T able VIII). The calcium carbonate is lowest neal'" the

25,- 4.0 40
30 E-ZLI1....J
~5
20 (JllJ
t"')
ooItSo
10 E--zllJoa:llJ0..
N
\~.p~....8... fA.r"::O~ ,/;1" - / .........~';I' , •." ,."
,....8.... ,...8----...~
H
B- - - --8';-
./
I
A-CaC03 ..A51 p---_.-_. --.-.-A----- ...J
, I ' , ,
P KI L' KO
. rt)
oC'iI
~.......
C'iI
201- 3.0QU)
10t-l.0
rt)
oC'iI
Q)
LL.
E-oz 151- 2.0llJ .o~llJ0..
H = Honouliuli SoilP = Pearl H arbor SoilKI = Kalihi SoilL = Laie SoilKG = Kaloko SoilN = Nohili Soil
Figure 11. Distrib!ltion of Percent Fe203'Percent CaC03, and Si02/R203 Ratios of
Some Gray Hydromorphic SoilsWith Increasing Degree of Hydromorphism
........-J

118
surface and gradually increases with depth. As has been
mentioned before, these calcareous materials are petrogenic and
not pedogenic, but they may influence the post-depositional pedo
genic processes by changing the soil environment.
The calcium carbonate content is higher in the Kaloko than
m Nohili soil. Fig~ 11 shows the CaC03 content of Gray
Hydromorphic soils.
Free iron oxide:
The values of free iron oxides in the soils are presented m ..
Table IX. Free iron oxides m the Gray Hydromorphic soils
range from 0.64 to 10.42%. In the Honouliuli, Pearl Harbor, and
Kalihi soils free Fe203 content is comparatively high. It may be
mentioned that these three soils are weaker members of the Gray
Hydromorphic group.
In the Honouliuli soil the free iron oxide content does not
change throughout the profile. This bears testimony to the fact that
in this soil there is no visible effect of impeded drain~ge in the
morphology. It also indicates that this soil is comparatively young
and the translocation of iron oxide is, therefore, absent.
In the Pearl Harbor soil a higher amount of free iron oxide
1S concentrated neal" the surface. The iron oxides in the sub
surface horizons are mainly from mottles. In the Kalihi soil, c.\gain,
a higher concentration of iron oxide is present neal" the surface,
which decreases with depth and again increases (Fig. 12).

119
Table IX. Percent Total Fe203' Free Fe203' FeO, andA1203/Fe203 Ratios of Gray Hydromorphic Soils
HonouliuliHorizon Fe203 FeO Free Al203
(%) (%) Fe203% Fe203A 16.7 3.4· 9.1 1.68B~l 16.6 3.2 8.9 1.67B22 19.1 1.8 9.6 1.70Cl 18.8 1.4 9.4 1.76C2 19.1 0.9 10.4 1.71
Items Means S.D.Fe203 . 18.1 1.06Free Fe2Od' 9.5 0.56A120 3/ Fe2 3 1.70 0.07
Pearl HarborHorizon Fe203 FeO Free Al203
(%) (%) Fe203 % Fe2°.3Al 18.2 0.8 7.3 1.87B22g1 17.3 1.4 7.4 1.97B22g2 18.0 1.0 5.6 1.93nClg 18.1 0.5 6.0 2.07IIC2g 18.5 0.3 5.3 1.84
Items Means S.D.Fe203 18.0 0.43Free Fe203 6.3 0.98A1203/Fe203 1.94 0.08
KalihiHorizon Fe203 FeO Free Al203
(%) (%) Fe203 % Fe203A p l 12.6 2.9 9.6 2.29A 2 11.8 3.5 8.9 2.36B~2g1 10.1 1.8 2.8 3.36B22g2 14.3 0.4 6.0 2.55G1 12.0 0.4 4.1 3.15G2 11~0 0.3 3.0 3.36nCG 15.0 0.3 7.3 2.11
Items Means S.D.Fe203 12.4 1.75Free Fe203 6.0 2.75A1203/Fe203 2.74 0.53
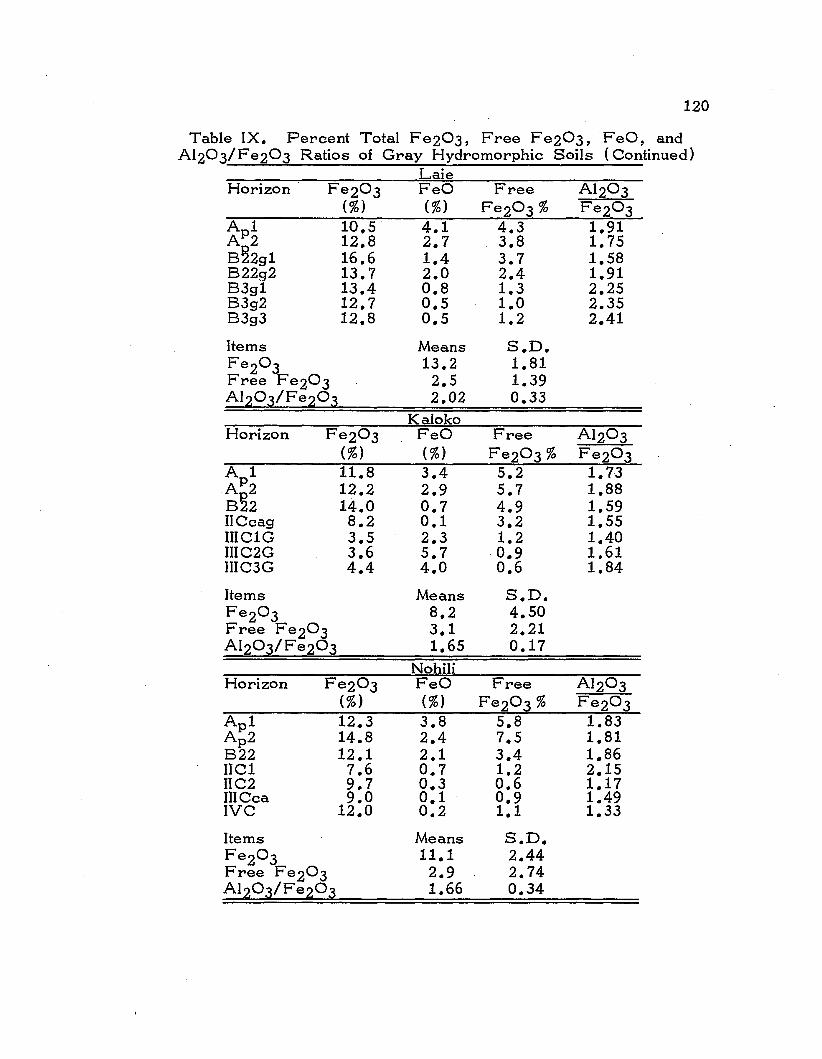
120
Table IX. Percent Total Fe203, Free Fe203, FeO, andA1203/Fe203 Ratios of Gray Hydromorphic Soils (Continued)
LaieHorizon Fe203 FeO Free Al203
(%) (%) Fe203 % Fe203A p l 10.5 4.1 4.3 1.91A 2 12.8 2.7 3.8 1.758~2g1 16.6 1.4 3.7 1.588229 2 13.7 2.0 2.4 1.9183g1 13.4 0.8 1.3 2.2583g2 12.7 0.5 1.0 2.3583g3 12.8 0.5 1.2 2.41
Items Means S.D.Fe203 13.2 1.81Free Fe203 2.5 1.39AIz03/FeZ03 2.02 0.33
KalokoHorizon Fe203 FeO Free Al203
(%) (%) Fe203 % Fe203A p l 11.8 3.4 5.2 1.73A
22 12.2 2.9 5.7 1.88
8 2 14.0 0.7 4.9 1.59IICcag 8.2 0.1 3.2 1.55IIIC1G 3.5 2.3 1.2 1.40IIIC2G 3.6 5.7 0.9 1.61IIIC3G 4.4 4.0 0.6 1.84
Items Means S.D.Fe203 8.2 4.50Free Fe203 3.1 2.21A1203/Fe203 1.65 0.17
NohiliHorizon Fe203 FeO Free Al203
(%) (%) Fe203 % Fe203A p l 12.3 3.8 5.8 1.83A p2 14.8 2.4 7.5 1.81822 12.1 2.1 3.4 1.86IICl 7.6 0.7 1.2 2.15IIC2 9.7 0.3 0.6 1.17I1ICca 9.0 0.1 0.9 1.49IVC 12.0 0.2 1.1 1.33
Items Means S.D.Fe203 11.1 2.44Free Fe203 2.9 2.74AIZ03/FeZ03 1.66 0.34

8PERCENT FREE2 4o
PERCENT42
20 I fT - - .....0
rJ>...... "':B>
£I1 ----'U , --~.,~
.,.:c :c- \ -240
'Ti>240- -2 Z
0 I 0:c I} .:C£I1 £I1en 60 \ en 60\
\H\\
801- ~ b> 80
H = Honouliuli SoilP = Pearl Harbor SoilKI = Kalihi SoilL = Laie SoilKO = Kaloko Soil FigureN = Nohili Soil
12. Vertical Distribution Pattern of Free IronOxide in Six Gray Hydromorphic Soils
....t-.)....

122
The reason for the zIgzag distribution pattern of free iron
oxides in the Pearl Harber and Kalihi soils lies in the nature of
their parent material as McKeague ("1965) has suggested in his
study of gleization.
In the Laie, Kaloko, and Nohili soils higher concentrations
of free iron oxides are found neal'" the surface and decreases
gradually with depth. The free iron oxides range from 0.6 to 7 J::I .,J
percent. This low concentration of free iron oxide in the lower
horizons is due to the effect of the ground water table and the
prevalence of highly reduced conditions. Daniels et ale (1962)
determined the free iron oxides of a number of poorly-drained
soils, and their results ranged from 0.50 to 1.40 percent. The
free iron oxide content obtained by them is comparable with the
iron oxides of the subsoil horizons of the Laie, Kaloko, and
Nohili soils.
From Fig. 12 it appears that with the exception of the
Honouliuli, there is a drop in the free iron oxides in all the soils
at a depth of about twenty inches. This brings out the important
question of iron oxide mobilization in thegleization process. There
is a movement of readily-reducible iron oxides, either vertical or
lateral depending on the conditions. The reduced form of iron
moves upward with the rising water table and when this iron-'"
comes in contact with ail'" it gets oxidized and deposited.
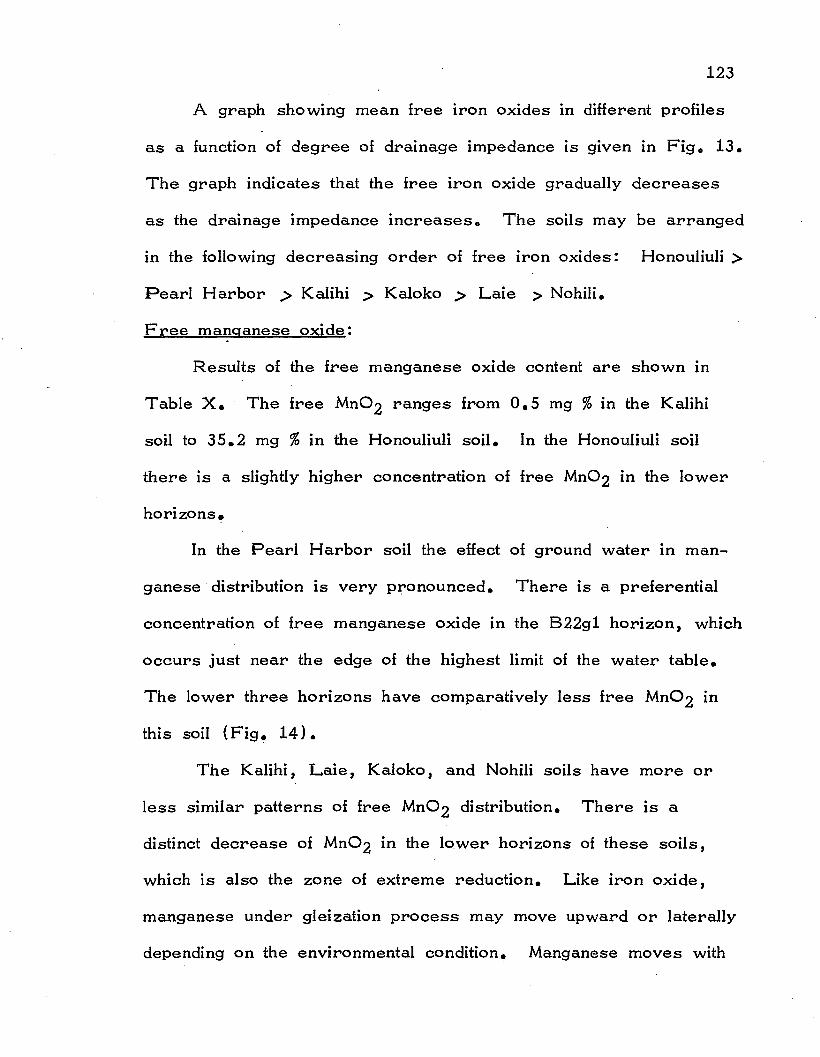
123
A graph showing mean free iron oxides in different profiles
as a function of degree of drainage impedance is given in Fig. 13.
The graph indicates that the free iron oxide gradually decreases
as the drainage impedance Increases 0 The soils may be arranged
in the following decreasing order of free iron oxides: Honouliuli >
Pearl Harbor > Kalihi > Kaloko > Laie > Nohili.
Free manganese oxide:
Results of the free manganese oxide content are shown in
Table X. The free Mn02 ranges from 0.5 mg %in the Kalihi
soil to 35.2 mg % in the Honouliuli soil. In the Honouliuli soil
there is a slightly higher concentration of free Mn02 in the lower
horizons~
In the Pearl Harbor soil the effect of ground water in man
ganese .distribution is very pronounced. There is a preferential
concentration of free manganese oxide in the 822g1 horizon, which
occurs just near the edge of the highest limit of the water table.
The lower three horizons have comparatively less free Mn02 in
this soil (Fig ~ 14).
The Kalihi, Laie, Kaloko, and Nohili soils have more or
less similar patterns of free Mn02 distribution. There is a
distinct decrease of Mn02 in the lo.wer horizons of these soils,
which is also the zone of extreme reduction. Like iron oxide,
manganese under gleization process may move upward or laterally
depending on the environmental condition. Manganese moves with
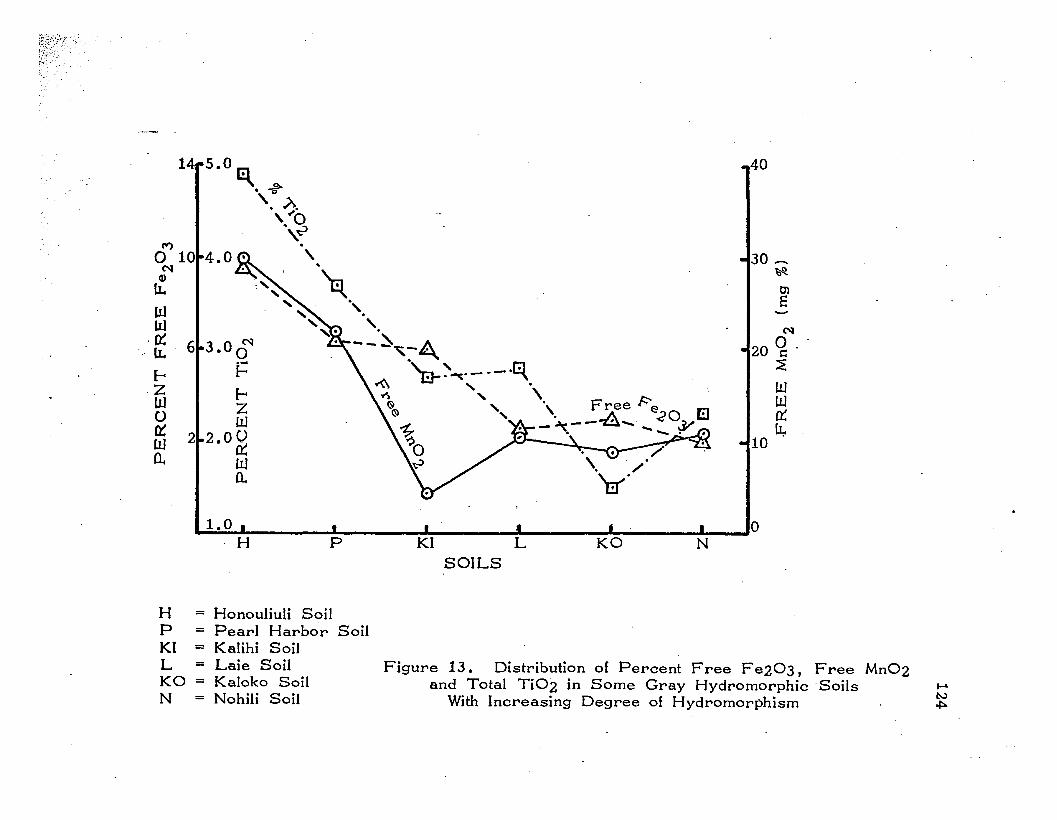
3.00~
E=IZ[.rJ
2.0 ()0::W0..
30 _~
OlE
40
~
20 ~ .~
WLIJ0::
10 LI:.
~.,.'.--~,-~ .1':1
''8-' ---,~.. ~.-<\ .."'"' '\ Free "20 El" "' '. --8 ~ .~ '-"",,-~ .~ 1oJ- ;--~ •?O~
14,.5.0 r:1
'.~, )-..• "'0'. ~\;.,P')
o 101-4.0'·~
Q)
lL
tIltIl.~ 6' .. lL .
I-ZtIlo~ 2W0..
I 1. 0 I , , f , I '0. H P KI L KO N
SOILS
H = Honouliuli SoilP = Pearl Harbor SoilKI = Kalihi SoilL = Laie SoilKO = Kaloko SoilN = Nohili Soil
Figure 13. Distribution of Percent Free F e203, Free Mn02'and Total Ti02 in Some Gray Hydromorphic .Soils
With Increasing Degree of Hydromorphism.....tv~
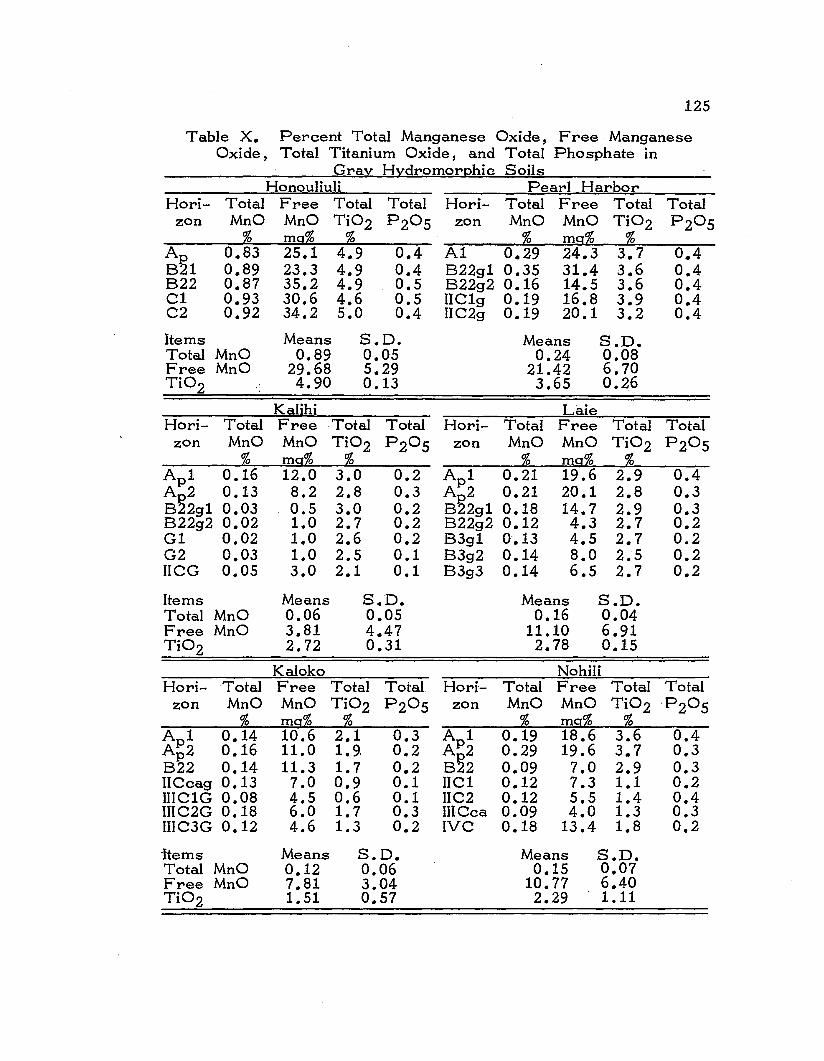
125
Table X. Percent Total Manganese Oxide, Free· ManganeseOxide, Total Titanium Oxide, and Total Phosphate in
Gray Hydromorphic SoilsHonouliuli Pearl Harbor
Hori- Total Free Total Total Hori- Total Free Total Totalzon MnO MnO Ti02 P205 zon MnO MnO Ti02 P205
% mg% % % mg% %A 0.83 25.1 4.9 0.4 Al 0.29 24.3 3.7 0.48~1 0.89 23.3 4.9 0.4 822g1 0.35 31.4 3.6 0.4822 0.87 35.2 4.9 0.5 822g2 0.16 14.5 3.6 0.4Cl 0.93 30.6 4.6 0.5 IIClg 0.19 16.8 3.9 0.4C2 0.92 34.2 5.0 0.4 IIC2g 0.19 20.1 3.2 0.4
Items Means S.D. Means S.D.Total MnO 0.89 0.05 0.24 0.08Free MnO 29.68 5.29 21.42 6.70Ti02 4.90 0.13 3.65 0.26
Kalihi LaieHori- Total Free .Total Total Hori- Total Free Total Total
zon MnO MnO Ti02 P205 zon MnO MnO Ti02 P205% mg% % % mg% %
Ap l 0.16 12.0 3.0 0.2 Apl 0.21 19.6 2.9 0.4A 2 0.13 8.2 2.8 0.3 A 2 0.21 20.1 2.8 0.38~2g1 0.03 0.5 3.0 0.2 8~2g1 0.18 14.7 2.9 0.3822g2 0.02 1.0 2.7 0.2 822g2 0.12 4.3 2.7 0.2Gl 0.02 1.0 2.6 0.2 83g1 0·.13 4.5 2.7 0.2G2 0.03 1.0 2.5 0.1 83g2 0.14 8.0 2.5 0.2IICG 0.05 3.0 2.1 0.1 83g3 0.14 6.5 2.7 0.2
Items Means S.D. Means S.D.Total MnO 0.06 0.05 0.16 0.04Free MnO 3.81 4.47 11.10 6.91Ti02 2.72 0.31 2.78 0.15
Kaloko NohiliHori- Total Free Total Total Hori- Total Free Total Total
zon MnO MnO Ti02 P205 zon MnO MnO Ti02 ·P205% mg% % % mg% %
Ap l 0.14 10.6 2.1 0.3 Apl 0.19 18.6 3.6 0.4Ap2 0.16 11.0 1.9. 0.2 A~2 0.29 19.6 3.7 0.3822 0.14 11.3 1.7 0.2 8 2 0.09 7.0 2.9 0.3I1Ccag 0.13 7.0 0.9 0.1 IICl 0.12 7.3 1.1 0.2IIICIG 0.08 4.5 0.6 0.1 IIC2 0.12 5.5 1.4 0.4IIIC2G 0.18 6.0 1.7 0.3 IIlCca 0.09 4.0 1.3 0.3IIIC3G 0.12 4.6 1.3 0.2 IVC 0.18 13.4 1.8 0.2
-Items Means S.D. Means S.D.Total MnO 0.12 0.06 0.15 0.07Free MnO 7.81 3.04 10.77 6.40Ti02 1.51 0.57 2.29 1.11

FREE MnO (mgm %) FREE MnO (mgm %)
0110 20 30 O· 5 10 15 20
i Ii Ii i I 0i I I~". I"0-::f;>
:.J • _ •,- •-' • I........,if
.~I20 20 ~~-.-.- "
0 ~. 0 - N __ -'t>(11 (11" ." - ---'U \ I 'U --
.--i p. I --i ~----:c \ r!l..... :c rl>2 40 ~ "" 2 40. ..... ,
• .....-;El ,- -Z I / Z lfl0i r:f" 0:c :c I
(11 (11 rpUl 60 \ Ul 60\ I\ ~\ .\H \\ \
80&' b 80 £:1
H = Honouliuli BoilP = Pear'l Har'bor' SoilL = Laie SoilKI = Kalihi SoilKO = Kaloko Soil Figur'e 14. Pr'ofile Distr'ibution of Fr'ee Manganese Oxide ~
N = Nohili Soil in Some Gr'ay Hydr'omor'phic Soilst-,)0"1

127
the fluctuation of the water table and is deposited when it comes in
contact with the atmosphere and is oxidized.
Daniels (1962) studied the movement of manganese oxide 10
poorly-drained soils. He stated that poor drainage favors the
movement of manganese oxide from the A horizon. The pH (6.6)
apparently was not a factor although it might be responsible in the
immobilization of manganese in the B horizon.
Anderson et ale (1955) studied the distribution of exchange
able manganese in some gytfja soils and reported that there was a
distinct concentration of manganese in the B horizon.
The present study indicates that sodium thiosulfate-reducible
manganese oxide is concentrated above the fluctuating zone of the
ground. water table (Fig. 14). Effect of pH and base saturation
appear to influence the movement of manganese oxides 10 soils.
This is particularly true in the Kalihi soil ~ where due to a low
base saturation and low pH, the free manganese oxides in the
reduced zone is almost nil.
The Gl'ary..r.Iydromorphic. soils 10 their decreasing order of
free manganese oxide content (Fig. 13) may be arranged as
follows: Honouliuli > Pearl Harbor > Laie > Nohili > Kaloko >
Kalihi.
Total phosphate:
Results of total phosphorus are presented in Table X. In the
Honouliuli, Pearl Harbor, and Nohili soils the amount of total

128
Table Xl. Percent Total CaO, MgO, K20 , and Na20of Gray Hydromorphic Soils
Honouliuli Pearl HarborHori- CaO MgO K20 Na20 Hori- 'CaO MgO K20 Na20
zon (%) (%) (%) (%) zon (%) (%) (%) (%)A 0.99 2.13 0.43 0.42 Al 2.11 1.01 0.32 0.31821 0.84 1.93 0.41 0.48 822g1 1.65 0.76 0.34 0.31822 0.84 2.21 0.47 0.46 822g2 1.17 0.76 0.31 0.31C1 0.94 2.64 0.35 0.43 IIClg 1.36 0.54 0.31 0.39C2 0.97 2.83 0.34 0.41 IIC2g 1.69 0.47 0.31 0.36
Items Means S.D. Means S.D.Total CaO 0.91 0.08 1.59 0.29Total MgO 2.35 0.38 0.71 0.21Total Na20 0.44 0.02 0.34 0.05
Kalihi LaieHori- CaO MgO K20 Na20 Hori- CaO MgO K20 Na20
zon (%) (%) (%) (%) zon (%) (%) (%) (%)
ApI 0.48 0.90 0.30 0.19 ApI 2.64 1.34 0.26 0.39A 2 0.41 0.65 0.21 0.27 Ap2 2.06 1. 75 0.26 0.41822g1 0.41 0.79 0.25 0.41 822g1 2.41 1.95 0.27 0.60822g2 0.41 0.65 0.22 0.46 822g2 2.46 2.33 0.14 0.85G1 0.29 1.27 0,.25 0.52 83g1 2.64 1. 70 0.22 0.99G2 0.29 441 0.25 0.57 83g2 3.05 1.52 0.31 1.11IICG 0.24 1.66 0.20 0~69 83g3 2.65 1.62 0.22 0.96
Items Means S.D. Means S.D.Total CaO 0.36 0.09 2.56 0.30Total MgO 1.05 0.40 1.74 0.32Total Na20 0.44 0.17 0.76 0.29
Kaloko NohiliHori- CaO MgO K20 Na20 Hori- CaO MgO K20 Na20
zon (%) (%) (%) (%) zon '(%) (%) (%) (%)
ApI 5.71 3.33 0.25 0.31 ApI 2.95 2.70 0.22 0.35Ap2 4.17 3.84 0.23 0.31 Ap2 3.51 2.79 0.20 0.38822 7.57 3.61 0.24 0.30 822 3.52 2.78 0.37 0.31II Ccag 22.65 4.90 0.17 0.31 IIC1 18.23 3.78 0.20 0.19IIIC1G 32.16 5.28 0.13 0.31 IIC2 22.04 4,'.42 0.26 0.19IIIC2G 17.58 4.40 0.52 0.66 IIICca 22.35 4.81 0.36 0.20IIIC3G 21. 64 5.02 0.52 0.81 IVC 14.69· 4.43 0.54 0.29
Items Means S.D. Means S.D.Total CaO 15.92 10.44 12.46 8.93Total MgO 4.34 0.76 3.67 0.90Total Na20 0.43 0.21 0.27 0.07

129
phosphorus is uniform throughout the profiles. On the other
hand, in the Kalihi and Laie soils phosphorus content gradually
decreases with depth. It may be noted that both the Kalihi and
Laie soils have low pH. This is an indication that distribution of
phosphorus is guided mostly by pH and not by oxidation-reduction
reactions.
Bloomfield (1959) indicated that phosphorus will be in solution
in a reduced zone of gley soils especially when the pH is low. In
the Nohili and Kaloko soils, the high reducing zones seem to have
a higher phosphorus content. The high pH (7.8) in the reduced
zone of these two soils are more important il1. mobilizing phosphorus
than a reducing condition.
Titanium oxide:
Many investigations have been reported on the profile distribu
tion of titanium oxide in podzolic and lateritic soils (Joffe and Pugh,
1934; Karim, 1953). All these studies deal with freely-drained
soils. Literature dealing with distribution of titanium oxide In
poorly-drained soil is rare.
Results of titanium oxides m Gray Hydromorphic soils are
presented in Table X. The titanium oxide content ranges from 0.6
to 5.0 percent, and the profiles with decreasing order of Ti02
content may be arranged as follows: Honouliuli > Pearl Harbor>
Laie > Kalihi > Nohili > Kaloko.

130
This sequence indicates that the titanium oxide content
decreases with increasing degree of hydromorphism (Fig. 13).
The Honouliuli soil has the highest amount of Ti02 which is equal
to the Ti02 content of the Molokai series.
In the Kaloko and Nohili soils the Ti02 content in the lower
horizons is affected by the nature of the parent material.
The uniform distribution of Ti02 throughout the profiles in
the Honouliuli, Pearl Harbor, Kalihi, and Laie soils lend support
to the fact that Ti02 does not move upward from the gley horizon.
Sherman (1952) stated that titanium in Hawaiian soils plays
an active role in soil formation. This is especially true where
there are definite wet and dry seasons and acid leaching. Since
there is very little leaching in Gray Hydromorphic soils the role
of titanium in the formation of these soils is insignificant. Titanium
oxide possibly behaves like inert heavy minerals in the coarser
fractions of alluvium.
Silica and sesQuioxides:
The percent silica content in the soils studied ranges from
11. 7 to 47.4 (Table XII). The low content of Si02 in Kaloko
and Nohili soils is due to their higher content of calcareous
materials. The soils may be arranged according to their
decreasing content of SiOZ as follows: Laie > Kalihi > Pearl
Harbor > Honouliuli > Nohili > Kaloko.

131 .
Table XII. Percent Total Silica, Alumina, Silica-SesquioxideRatios, and Silica-Alumina Ratios of Gray Hydromorphic Soils
HonouliuliHorizon
A8~1822ClC2
34.133.i32.833.133.1
21.722.222.922.721.9
1.671.591.531.581.62
2.672.542.442.482.58
Items Means S.D.Si02 33.3 0.50Al20 3 22.3 0.53Si021R203 1.59 0.05Si02/A1203 2.54 0.08
Pearl HarborHorizon Si02 Al20 3 Si02
(%) (%) R203Al 33.7 22.7 1.64822g1 33.7 23.7 1.60822g2 34.4 23.5 1.64I1Clg 34.8 24.7 1.62nC2g 37.1 22.2 1.84
Items Means S.D.Si02 34.7 1.39Al ° 23.3 0.96si62)R20 3 1.67 0.10Si02/A1203 2.53 0.16
KalihiHorizon Si02 Al203 Si02
(%) (%) R203Ap l 37.5 22.7 1.95Ap 2 37.5 23.1 1.95822g1 40.5 25.7 2.06822g2 40.8 24.0 2.07Gl 43.8 25.1 2.23G2 43.8 24.4 2.35nCG 43.3 20.6 2.42
Items Means S.D.Si02 41.0 2.78Al ° 23.7 1.70si62)R20 3 2.15 0.19Si02/A1203 2.96 0.29
2.522.422.492.402.84
2.802.762.682.882.973.043.57

132
Table XII. Percent Total Silica, Alumina, Silica-S esquioxide. Ratios, and Silica-Alumina Ratios
of Gray Hydl"'omorphic Soils (Continued)Laie
Horizon Si02 Al203 Si02 Si02(%) (%) R203 Al203
Apl 45.3 17.9 2.81 4.29A 2 44.8 17.4 2.77 4.358~2g1 44.7 18.2 2.55 4.17822g2 45.7 19.2 2.65 4.0483g1 46.0 20.6 2.63 3.7983g2 47.0 20.1 2.79 3.9883g3 47.3 20.6 2.75 3.90Items Means S.D.SiCa 45.8 1.02Al 19.1 1.71si627R20 3 2.71 0.03Si02/Al203 4.07 0.21
KalokoHorizon Si02 Al203 Si02 Si02
(%) (%) R203 Al203Apl 35.2 16.9 2.24 3.54Ap2 36.9 18.2 2.25 3.45822 34.1 14~9 2.39 3.87IICcag 19.0 8.2 2.38 3.90IIIC1G 11.7 5.2 2.21 3.79IIIC2G 21.6 9.6 2.35 3.80IIIC3G 18.7 9.9 2.07 3.20Items Means S.D.Si02 25.3 9.90Al20 3 11.8 4.83Si021R203 2.27 0.12Si02/Al203 3.65 0.26
NohiliHorizon Si02 Al203 Si02 Si02
(%) (%) R203 Al203Apl 38~5 19.0 2.23 3.44Ap2 37.7 19.8 2.08 3.23822 38.8 16.9 2.53 3.89IICl 26.7 11.4 2.70 3.95IIC2 19.1 7.5 2.33 4.31I1ICca 21.7 8.7 '2.52 4.20IVC 31.1 10.4 2.88 5.05
Items Means S.D.Si02 30.5 8.25Al ° 13.4 5.05si627R203 2.47 0.28SiOzlAIZ03 4.01 0.60

I60.. 25 5.0
of")
C'1
15 ;C.~
4.00f=«~
f")
o3.0 C'1-«"C'1o.-ro
2.0
1':"1_ ._. 8-._-~.- _._~
"." "." h.~,/ ""E{ ........ Si02/ A\2°3-- A
/~.~. ""' "./~ \'- --k.... -
\~·fo.
.v>\
\ ");y._,_._oGA-----·- -301- 10
50" 20C'1o.-
[f)
b·z 40Wo~W0..
H p KI LSOILS
KO N
H = Honouliuli SoilP = Pearl Harbor SoilKI = Kalihi SoilL = Laie SoilKO = Kaloko SoilN = Nohili Soil
Figure 15. Distribution of Percent Si02, AI203,'and Si02/Al203 Ratios of Gray Hydromorphic Soils
With Increasing Degree of Hydrbmorphism....,.ww

50 .. 5.0 ,3.5
C'f) \~'f):l0N ~...O~",-
40 4.0 ~ . ", A 3.0C'f)
~;:-_---EY .<>~ 00 .... / ~ .~'P f=N U) / /. '-._'-&0~'})- «« / .
~f-< / ./
/ / C'f)Z "30 3 ..0 . - - - -E1'./. 2.5 0'00 N0 a:~ "-N00 00..
2.0 U)20 2.0
PH10 I I , , I , "
KI L KO NSOILS
H = Honouliuli SoilP = Pearl Harbor SoilKI = Kalihi Soil .L = Laie SoilKO = Kaloko SoilN = Nohili Soil
Figure 16. Distribution of Percent A1203, Si02/R203and Si02/Al203 Ratios of Fine Clay Fractions
of Gray Hydromorphic Soils....w.p.

135
From Laie to HonouIiuIi the sequence of decreasing Si02
coincides well with the drainage impedance of the soils and their
consequent mineralogy. Due to contamination with calcareous
materials the Nohili and Kaloko soils give very low Si02 recovery
which again differs among the different horizons.
In Kalihi and Laie soils quartz was identified In the coarser
fractions by X-ray analysis. The presence of high silica in
these soils may be due to the presence of quartz. The Honouliuli
soil has a silica content (33 .. 3%) which is equivalent to that of the
Molokai series of the Low Humic Latosol.
Si02/R203 ratios of the soils range from 1.5 to 2.9. In
general, there is a relationship between drainage impedance and
Si02/R203 ratio. The ratio increases as the drainage impedance
Increases (Fig. 11). This is very important because drainage
impedance controls the formation of secondary minerals in soils.
The Si02/R20 3 ratio of 2.5 may be taken as the dividing
line of fine clay fractions among the following Gray Hydromorphic
soils of Hawaii (Fig. 16): (1) HonouliuIi, Pearl Harbor and
Kalihi where Si02/R203 ratio <.2.5, and (2) Laie, Kaloko and
Nohili where Si02/R203 is > 2.5.
These divisions indicate the dominant clay minerals in the soils
and their relative proportions. In the first division the dominant
mineral is kaolinite and in the second division it is montmorillonite.

\.
136
Percent Fe203 and Al203 in these soils show an opposite
distribution pattern of that of Si02/R203. As the degree of
drainage impedance increases, the amount of Al20 3 and Fe203
decreases (Figs. 11 and 15). This is an indication of the
sensitivity of these two elements towards drainage impedance.
Clay Mineralogy
Honouliuli soil:
The experimental data obtained for the minerals are presented
in Table XIII. In the coarse clay (2-0.2 microns) fraction
metahalloysite is the dominant mineral. Montmorillonite comes next
in order of abundance. Small amounts of gibbsite, mica and
halloysite are also present. The amounts of metahalloysite and
montmorillonite vary in relative proportions in different horizons of
this soil.
In the fine clay fractions « 0.2 microns) there are only two
minerals present - metahalloysite and montmorillonite. Metahalloy
site is by far the dominant mineral in this soil (Figs. 17 and 18) •
. Differential thermal analysis indicates that the kaolinite type mineral
is halloysitic in nature (Figs. 30 and 31), possibly dehydrated or
metahalloysite.
Another important feature of this fraction is that metahalloysite
content decreases and montmorillonite content increases with depth.
This can be explained in two ways: ( 1) The difference in

HONOULIULI: Ap
< <.'.2 p.
3.56A
7.19 A
137
Mg- SAT.
K- SAT.2S"C
K- SAT.1I0"C
K- SA T.3S0"C
K - SA T. _.JV"...........__.....,...,-At-I",..,.~""""--...-. ---'SSO"C
I
40 30 20
DEGREE S 28
10 5
Figure 17. X-ray Diffraction Patterns of Fine Claysin the Surface Horizon (Ap ) of Honouliuli Soil
Using Preferentially OrIented Specimensof Mg-Saturated, Glycolated, K-Saturatedand Heated at 25°,110°,350° and 550°C

HONOULIULI: C2<0.21'
3.56A
7.19A
138
Mg-SAT.
K-SAT.2S·C
K-SAT.1I0·C
K-SAT.3S0·C
K-SAT.550·C
I
40 30 20
DEGREES 26
\0 5
Figure 18. X-ray Diffraction Patterns of Fine Claysof Bottom Horizon (C2) of Honouliuli Soil
Using Preferentially Oriented Specimensof Mg-Saturated, Glycolated, K-Saturatedand Heated at 25°, 110°, 350° and 550°C

139
Table XIII. Mineralogical Composition of the Coarse Silt,Fine Silt, Coarse Clay, and Fine Clay Fraction of
Honouliuli Soil
Horizon \l KI Mt HI II Gb Rt Mg Ht Ant PI Total
A p 50-5 10 14 24 27 23 985-2 20 4 12 20 8 21 12 97
2-.2 80 11 4 5 100~0.2 86 14 100
821 50-5 10 9 22 29 28 1 995-2 17 5 4 6 29 3 34 98
2-.2 59 21 7 4 8 99<0.2 84 15 1 100
822 50-5 10 12 24 28 23 3 1005-2 23 3 7 17 19 30 99
2-.2 58 24 4 5 8 99<0.2 81 19 100
Cl 50-5 13 12 23 27 21 965-2 29 7 11 14 12 28 101
2-.2 75 18· 7 100<0.2 78 22 100
C2 50-5 9 6 13 34 27 10 995-2 14 5 7 7 33 12 21 99
2-.2 81 10 6 4 101<0.2 78 22 100
Kl = Metahalloysite; Mt = Montmorillonite; HI = Halloysite;II = Illite; Gb = Gibbsite; Rt = Rutile; Mg = Magnetite;Ht = Hematite; Ant = Anatase; PI = Plagioclase

{f)
>«....loLIJz·-[r..z
('W')
aNQ)
[r..
~.
1
oo 0
'Y = o. 96}:~~~
~
"~
1. • • I 1 B.o 20 40 60 80 100
% MONTMORILLONITE IN FINE CLAYB
Figure 19. Correlation Between Percent Fe203 and Percent Montmorillonitein Deferrated Fine Clays of Some Gray Hydromorphic Soils
.....
.po.o

141
mineral composition of clays with depth may be due to the nature
of the alluvium, or ( 2) this may be due to the higher intensity of
weathering near the surface and-as a result the metahalloysite 1S
being formed and montmorillonite is destroyed.
Total chemical analysis of the fine clay fraction shows a
slight increase of MgO with depth. This may also show higher
concentration of montmorillonite in the lower horizons. The clay
fraction has 5.8% iron oxide. This amount of iron is higher than
that can be allocated to the comparatively small amount of mont
morillonite present in this soil (Fig. 19). The question naturally
arises as to where this excess iron oxide comes from. Is it due
to the presence of some fine-grained iron oxide mineral in this
fraction or is the iron present in metahalloysite? X-ray pattern
does not, however, show any evidence of the presence of any iron
oxide mineral in this fraction. It is suspected, therefore, that
metahalloysite may contain iron in the octahedral layer. However,
no one has yet reported any iron-bearing kaolinite type clays in
Hawaiian soils.
A small amount of mica scattered throughout the profile, in
a random manner, indicates that the parent material of this soil
was alluvium.
Pearl Harbor soil:
The clay fractions contain very small amounts of gibbsite, but
the dominant minerals are metahalloysite and montmorillonite.

142
Data concerning the distribution of minerals in the Pearl Harbor
soil are presented in Table XIV. X-ray patterns for the fine clay
fractions are shown in Figs. 20 and 21.
The dominant minerals in the coarse clays (2-0 .. 2 microns)
are metahalloysite, montmorillonite, hydrated halloysite, mica, and
gibbsite. The amount of montmorillonite increases with depth
while the amount of metahalloysite decreases. The random distri-
bution of mica, as in the Honouliuli soil, indicates the alluvial
nature of the parent material of this soil. Gibbsite IS slightly higher
near the surface and decreases with depth.
In the fine clay fraction metahalloysite is the dominant
mineral. Such a high amourlt of metahalloysite in the fine clay
fraction is an indication that probably the crystal size of the 1: 1
type minerals in these Hawaiian soils is smaller than their usual
size in temperate climate. It may be noted here that in the fine
silt (5- 2 microns) fraction· also, there is a 1: 1 type mineral, but
its amount is small. The general conclusion may be drawn by
saying that all sizes of 1: 1 type clays are present in Hawaiian
soils, but the bulk of them falls below the 0.2 micron size limit.
There is a decrease of metahalloysite content with depth in-the fine clay fraction and a consequent increase of montmorillonite
(Figs. 30 and 31).
Kalihi soil:
Clay fraction of this soil constitutes more than 80% of the total

K - SAT.25·C
K- SAT.1I0·C
K- SAT.350·C
K-SAT.550·C
40 30
PEARL HARBOR: AI
< 0.21'
3.S7A
20
DEGREES 26
7.19A
10 5
I
- ",1
143
Figure 20. X-ray Diffraction Patterns of Fine Claysof Surface Horizon (A1) of Pearl Harbor Soil
Using Oriented Specimenof Mg-Saturated, Glycolated and K-Saturated
and Heated at 25°, 110°, 350° and 550°C
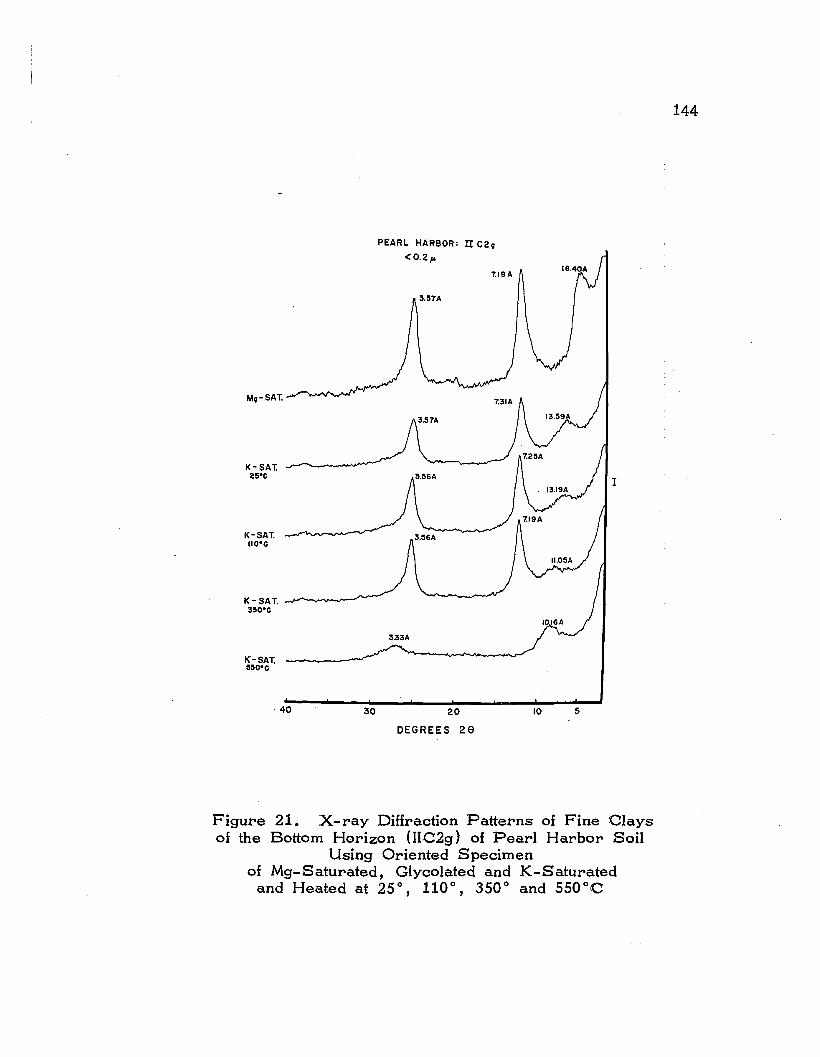
PEARL HARBOR: n C20
<0.2}'
Mo-SAT.
K-SAT.25·C
K-SAT.1I0·C
K- SAT. --.........-.,.-.....---'350·C
K-SAT.550·C
I
144
40 30 20
DEGREES 2e
10 5
Figure 21. X-ray Diffraction Patterns of Fine 'Claysof the Bottom Horizon (IIC2g) of Pearl Harbor Soil
Using Oriented Specimenof Mg-Saturated, Glycolated and K-Saturated
and Heated at 25°, 110°, 350° and 550°C

Table XIV. Mineralogical Composition of the Coarse Silt, Fine Silt,Coarse Clay, and Fine Clay Fractions of Pearl Harbor Soil
Horizon u KI Mt __HI _IL __Gb _Mg Ht Gt 11m Sd An Rt Total
Al 50-5 7 20 9 14 28 20 985-2 37 4 7 8 23 19 98
2...'.2 47 11 8 11 14 9 100<0.2 83 17 100
822g1 50-5 6 31 19 28 14 985-2 36 6 8 14 19 13 96
2-.2 60 18 9 4 8 99<::0.2 81 19 100
822g2 50-5 4 5 41 8 29 4 7 985-2 28 12 5 7 19 18 8 97
2-.2 58 21 11 2 7 99<::0.2 80 20 100
IIClg 50-5 4 28 37 21 9 995-2 37 9 2 8 18 12 11 97
2-.2 64 21 9 4 4 102<0.2 72 27 99
IIC2g . 50-5 34 21 10 21 14 1005-2 31 15 2 3 7 16 11 7 5 97
2-.2 46 43 3 2 4 98<0.2 61 39 100
KI = Metahalloysite; Mt = Montmorillonite; HI = H alloysite ; II = Illite; Gb = Gibbsite;Mg = Magnetite; Ht = Hematite; Gt = Goethite; 11m = Ilmenite; Sd = Siderite; An = Anatase;
I-"Rt = Rutile ~c.n

146
soil material.
In the coarse clay (2-0.3 microns) fraction metahalloysite
and montmorillonite are the two major minerals. In this fraction
the amount of montmorillonite is higher than that of halloysite.
During separation of fine clay from coarse clay, after 7 washings
with dispersing solution a white-colored mineral appeared. This
white mineral i's a 2: 1 type clay, mostly, and the particle size is
larger than 0.2 micron.
It is difficult to explain why the percentage of montmorillonite
IS higher than metahalloysite in the coarse clay fraction. Two
explanations may be suggested for this: ( 1) Montmorillonite in the
fine clay fraction may be higher, but its response to X-ray dif-
fraction may be diminished due to small particle size as the
intensity of X-ray peaks varies with particle size. (2) Secondly,
particle size of montmorillonite clay in the present soil may be
larger than the conventional size of montmorillonite found In temper-
ate climates. The size of clay crystals is influenced by the
chemical environment of the place of formation and the rate of
growth. Again, rate of crystal growth is related to the thermo-
dynamic concentration or activity of the constituents, or, in other
words, the chemical potential of the system.
Of the total clay fraction, fine clay « 0.2 micron) constitutes
the bulk (more than 80%). In fine clay, metahalloysite is the
dominant mineral except in the II CG horizon where montmorillonite

KAI.IHII ApI
<0.2",
"'v-SAT.
K- SAT.---"""'--25·C
K-SAT.·----""""~
1I0·C
K-SAT.350·C
10.IISA
147
K-SAT.lSlSO·C
30 20
DEGREES 2 e10
Figure 22. X-ray Diffraction Patterns of Fine Claysof Surface Horizon (Ap l) of Kalihi Soil
Using Oriented Specimenof Mg-Saturated, Glycolated and K-Saturated
and Heated at 25°, 110°, 350° and 550°C

KALIHI: II CG
<0.2~
Mg-SAT.
K-SAT.2S·C
K-SAT.1I0·C
K- SAT. _--,,<,-.,r'
51S0·C
K-SAT.1S1S0·C
I
148
30 20
DEGREES 28
10 5
Figure 23.. X-ray Diffraction Patterns of Fine 'Claysof the Bottom Horizon (IIeG) of Kalihi Soil
Using Oriented Specimenof Mg-Saturated, Glycolated and K-Saturated
and Heated at 25°, 110°, 350° and 550°C

149
Table xv. Mineralogical Composition of Coarse Silt,Fine Silt, Coarse Clay, and Fine Clay Fractions of
Kalihi Soil
Horizon \.l KI Mt HI II Gb PI Qr Mg 11m Crist Total
Apl 50-5 ·65 21 14 100. 5-2 19 24 27 31 1012-.2 32 50 7 10 99<.0.2 70 30 2 102
Ap2 50-5 8 19 26 19 26 985-2 26 19 17 31 5 98
2-.2 37 45 4 12 2 100~0.2 68 31 3 102
B22g1 50-5 10 18 35 ·18 20 1015-2 20 25 14 29 11 99
2-.2 50 29 3 14 .2 98<:0.2 65 34 2 101
B22g2 50-5 18 43 17 22 1005-2 27 27 7 30 9 100
2-.2 29 47 3 20 99<0.2 53 41 5 99
Gl 50-5 27 28 18 26 995-2 26 25 14 31 5 101
2-.2 23 51 7 19 2 102<0.2 56 41 3 100
G2 50-5 10 17 29 43 995-2 30 10 15 36 6 97
2-.2 26 47 5 20 3 101<0.2 54 43 3 100
nCG 50-5 47 25 11 17 1005-2 10 18 41 30 99
2-.2 8 80 12 100~0.2 24 71 5 100
KI = Metahalloysite; Mt = Montmorillonite; HI = Halloysite; II = Illite;GB == Gibbsite; PI = Plagioclase; Qr = Quartz; Mg = Magnetite;11m = Ilmenite; Crist = Cristabolite

150
IS the dominant mineral (Table XV). A small amount of hydrated
halloysite is also present. The amount of montmorillonite gradually
increases with depth in this fraction while metahalloyside decreases
in that direction (Figs. 22 and 23). But there is a lithologic dis
continuity between the nCG horizon and the horizons above this.
Chemical analysis of fine clays shows a high amount of iron
oxide (Table XXII). Most of the iron oxide is considered to be
in the crystal lattice of montmorillonite clay, and the mineral is
named as iron-rich montmorillonite.
Laie soil:
T~e particle size distribution (Table IV) of Laie soil shows
that the percentage of clay ranges from 60 to 70.
The mineralogical composition of coarse clay (2-0.2 micron)
of the top three hor'izons are similar where the amount of meta
halloysite is quite high when compared to the lower horizons.
Montmorillonite content gradually increases with depth (Table XVI).
A small amount of mica is also present in the coarse clay,
the concentration being higher near the surface and very low in the
subsoils. The occurrence ot-mica in the coarse clay is an indi
cation of its larger size of particles than usual. From the sharp
peaks for mica in the X-ray patterns it appears that this is possibly
not pedogenic mica as has been reported by Juang (1965) where
all the mica was concentrated in the < 0.2 micron fraction. The
mica in the present soil was obtained from hydrothermally-altered

151
17.67A
3.53A
K- SAT. -----25-0
K- SAT.110-0
LAIE: ApI
<0.2~
K-SAT• .----350-0
MI/-SAT----
K-SAT.----~5WO
40 30 20 10 5
DEGREES 2 e
Figure 24, X-ray Diffraction Patterns of Fine Claysof the Surface (Apl) Horizon of Laie Soil
Using Oriented Specimenof Mg-Saturated, Glycolated and K-Saturated
and Heated at 25°, 110°, 350° and 550°C

LAIE: BSga
<0.21'
Mg-SAT -v--
K-SAT.2S'C
K~SAT.
1I0'C
K-SAT.SIlO'C
K-SAT.IlIlO'C
40 20
11.72A
10
I
152
DEGREES 29
Figure 25. X-ray Diffraction Patterns of Fine Claysof the Bottom Horizon (B3g3) of Laie Soil
Using Oriented Specimenof Mg-Saturated, Glycolated and K-Saturated
and Heated at 25°, 110°, 350° and 550°C
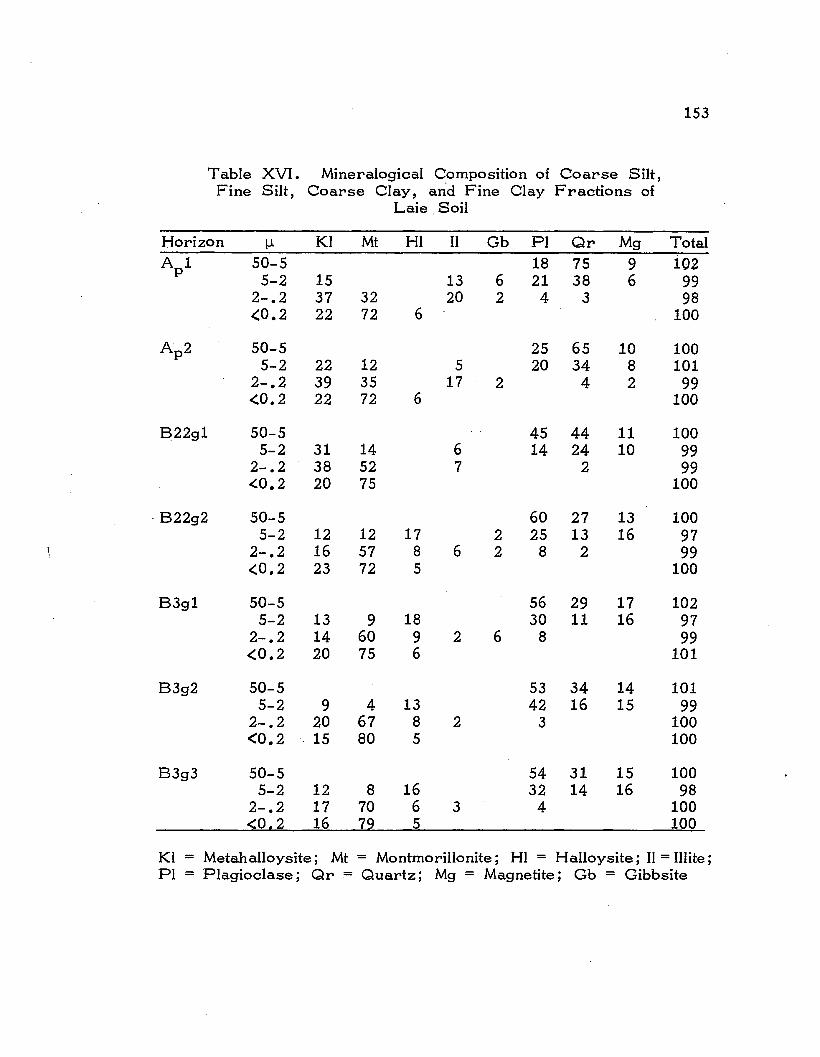
153
Table XVI. Mineralogical Composition of Coarse Silt,Fine Silt, Coarse Clay, and Fine Clay Fractions of
Laie. Soil
Horizon \.l KI Mt HI II Gb PI Or Mg TotalAp1 50-5 18 75 9 102
5-2 15 13 6 21 38 6 992-.2 37 32 20 2 4 3 98<:0.2 22 72 6 100
Ap2 50-5 25 65 10 1005-2 22 12 5 20 34 8 101
2-.2 39 35 17 2 4 2 99<0.2 22 72 6 100
822g1 50-5 45 44 11 1005-2 31 14 6 14 24 10 99
2-.2 38 52 7 2 99<0.2 20 75 100
. 822g2 50-5 60 27 13 1005-2 12 12 17 2 25 13 16 97
2-.2 16 57 8 6 2 8 2 99<0.2 23 72 5 100
83g1 50-5 56 29 17 1025-2 13 9 18 30 11 16 97
2-.2 14 60 9 2 6 8 99<0.2 20 75 6 101
83g2 50-5 53 34 14 1015-2 9 4 13 42 16 15 99
2-.2 20 67 8 2 3 100<0.2 . 15 80 5 100
83g3 50-5 54 31 15 1005-2 12 8 16 32 14 16 98
2-.2 17 70 6 3 4 100<0.2 16 79 5 100
KI = MetahaIIoysite; Mt = Montmorillonite; HI = Halloysite; II = Illite;PI = Plagioclase; Or = Quartz; Mg = Magnetite; Gb = Gibbsite

154
rocks in the alluvium.
Among other mineral present in the coarse clay fraction are
gibbsite, plagioclase, and small amounts of quartz.
In the. fine clay « 0.2 micron) fraction montmorillonite IS the
dominant mineral. Its distribution is uniform throughout the .profile,
although there is a slight increase with depth (Figs. 24 and 25).
Chemical analysis of fine clay indicates that a higher amount
of iron (11.4%) is present. This mineral, therefore, has been
called iron-rich montmorillonite.
Other minerals present in this fraction are metahalloysite and
hydrated halloysite. Metahalloysite is high near the surface and
g~adually decreases down the'the profile. Hydrated halloysite IS
not detectable near the surface but in the subsoil it is present In
appreciable amounts.,
K aloko soil:
The coarse clay (2-0.2 microns) contains only three minerals
- metahalloysite, halloysite, and montmorillonite ( Table XVII). It
is surprising that montmorillonite constitutes the bulk of this
fraction. The amount of montmorillonite is similar throughout the
profile. Metahalloysite, on the other hand, decreases with depth,
and hydrated halloysite increases in that direction.
As has been mentioned before, the higher amouht of montmoril
lonite compared to metahalloysite in the coarse clay suggests that
montmorillonite in some Hawaiian soils are coarser grained than
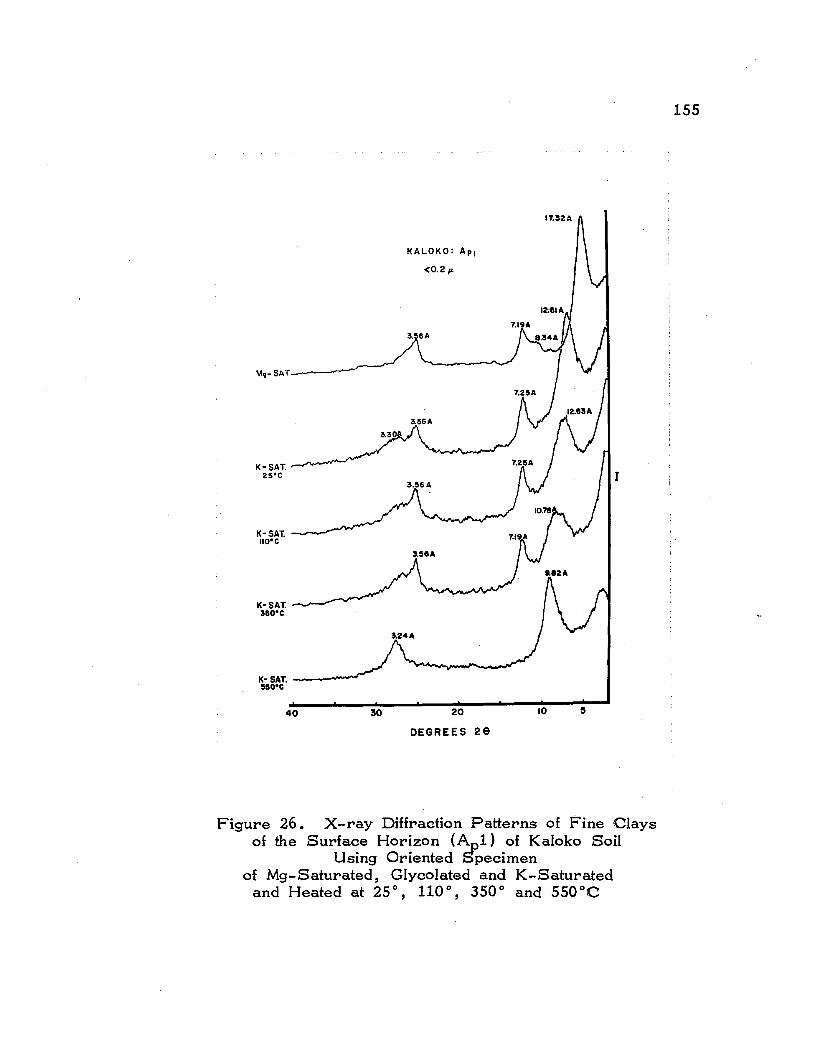
KALOKO: ApI
<0.2,.
\1;-SAT-~---~
K- SAT.2S·C
K-SAT. ~-~1I0·C
K-SAT.350·C
3,24 A
K-SAT. ---550·C
I
155
40 30 20
DEGREES 29
10
Figure 26. X-ray Diffraction Patterns of Fine Claysof the Surface Horizon (~1) of Kaloko Soil
Using Oriented Specimenof Mg-Saturated, Glycolated and K-Saturated
and Heated at 25°, 110°, 350° and 550°C
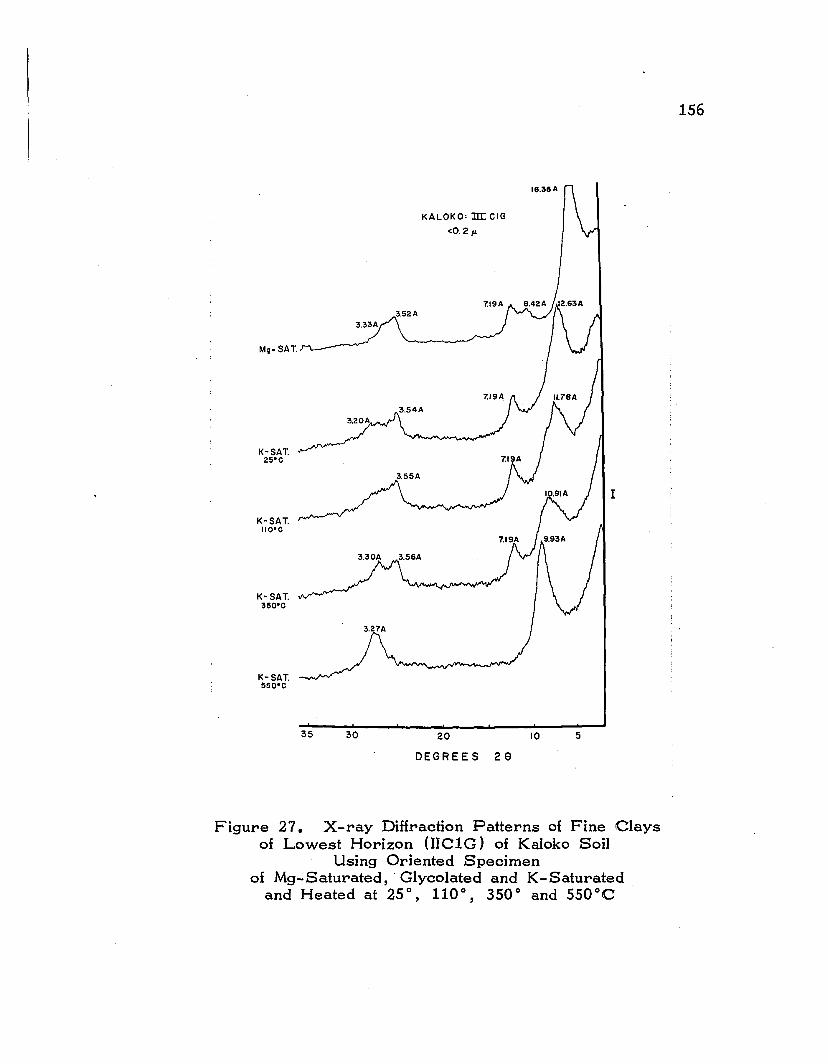
156
16.36A
KALOKO: JII: CIG
<0.2~
3.27A
I
Mg-SAT.
3.55A
K-SAT.25'C
K-SAT.550'C
K-SAT.350'C
K-SAT.1I0'C
35 30 20 10 5
DEGREES 28
Figure 27. X-ray Diffraction Patterns of Fine Claysof Lowest Horizon (IIC1G) of Kaloko Soil
Using Oriented Specimenof Mg-Saturated, . Glycolated and K-Saturated
and Heated at 25°, 110°, 350° and 550°C


158
usual.
In the fine clay « 0.2 micron) fraction montmorillonite is the
dominant mineral (Figs. 26 and 27). Since fine clay in this soil
makes up about 70 percent of the soil material, this fraction was
studied m detail. The mineralogical data are presented in Table
XVII. The amount of montmorillonite is about 73 percent in the
A p 1 horizon and increases to about 82 percent in the IIICG3
horizon. The amount of metahalloysite decreases gradually with
depth but the hydrated halloysite content is constant throughout the
profile.
Chemical analysis shows that the clay is very high in iron
(Table XXII) and is, therefore,· named an iron-rich montmorillonite.
Nohili soil:
The dominant mineral in the clay fraction of Nohili soil is
montmorillonite. The amount of metahalloysite is quite small.
The amount of montmorillonite in the coarse clays (2-0.2
microns) remains constant throughout the profile, but there is a
slight decrease of metahalloysite and an increase of hydrated hal
loysite with depth. Other minerals in this fraction include gibbsite,
rutile, and a small amount of mica.
The mineralogical composition of fine clays « 0.2 micron)· is
presented in Table XVIII. Montmorillonite is the dominant mineral
(80%) in this fraction. MetahallOysite and hydrated halloysite are
also present in small amounts (Figs. 28 and 29). Montmorillonite

159
Table XVIII. Mineralogical Composition of Coarse Silt,Fine Silt, Coarse Clay, and Fine Clay Fractions of
Nohili Soil
Hori- \..l Bm KI Mt HI Gb PI Qr Mg Ht Bo Pt An Totalzon
A p1 50-5 36 20 21 11 10 985-2 11 3 6 31 17 8 7 6 5 7 101
2-.2 20 76 3 99<0.2 19 75 5 99
A p2 50-5 28 19 12 10 15 15 995-2 15 7 5 32 5 5 8 10 10 97
2-.2 21 76 3 100<:0.2 18 75 6 99
B22 50-5 26 33 10 7 ·10 11 975-2 12 4 8 29 7 13 15 5 5 98
2-.2 10 84 3 2 1 100<:0.2 10 83 7 100
IIC1 50-.5 25 9 24 23 9 7 975-2 9 4 19 29 9 11 9 10 100
2-.2 9 81 3 2 2 3 100<0.2 8 85 7 100
IIC2 50-5 5 32 10 18 10 15 8 985-·2 10 4 26 25 3 16 9 5 98
2-.2 6 81 6 5 2 100<0.2 7 86 7 100
IIICca 50-5 7 4 28 5 30 15 10 995-2 10 13 17 29 8 8 10 4 99
2-.2 8 85 5 2 100<.0.2 .7 87 7 101
IVC 50-5 9 4 27 4 20 16 10 8 985-2 14 12 3 21 23 11 8 2 5 99
2-.2 10 80 5 2 2 990<0.2 8 84 8 100
KI = Metahalloysite; Mt = Montmorillonite; Bm = Ilmenite;HI = H alloysite ; Gb = Gibbsite; PI = Plagioclase; Qr = Quartz;Mg= Magnetite; Ht = Hematite; Bo = Boehmite; Pt = Pyrite;An = Anatase

MII- SAT. .--........................---
NOH ILl : ApI
<0.2p.
K-SAT.25·0
K-SAT.110·0
K-SAT.350·0
K-SAT.11110·0
I
160
40 30 20
DEGREES 29
10 5
Figure 28. X-ray Diffraction Patterns of Fine Claysof Surface Horizon (ApI) of Nohili Soil
Using Oriented Specimenof Mg-Saturated, Glycolated and K-Saturated
and Heated at 25 0, 110 0
, 350 0 and 550°C

Mg· SAT. -------
NOHILI: Ill: C
<0.21'-
K-SAT.25·0
K-SAT.110·0
K-SAT.350·0
K-SAT.550·0
161
40 30 20
DEGREES 2 e10 5
Figure 29. X-ray Diffraction Patterns of Fine Claysof the Bottom Horizon (IVC) of Nohili Soil
Using Oriented Specimenof Mg-Saturated, Glycolated and K-Saturated
and Heated at 25 0, 110 0
, 350 0 and 550°C

162
in the A 1 and A 2 horizons IS slightly lower than that In thep p
underlying horizons.
The chemical analysis of this fraction reveals that there is a
considerably high percentage of iron (14%) in this clay (Table
XXII) •
A structural formula for montmorillonite IS calculated from
the chemical analysis of the fine clay of the III Cca horizon of the
Nohili soil (Tables XIX, XX, XXI and XXII). The formula is as
follows:
(XO• 74KO.11) (Si7 • 52AIO.48 )IV (Al1 •85Fe3+1.66M90. 35TiO• 10 )VI
°20(OH)4
The net charge deficit per unit cell In this montmorillonite is
0.85 and more than half of the exchange charge X originated in
the tetrahedral sheet.
In their study of montmorillonite-like minerals Sherman, Ikawa,
Uehara, and Okazaki (1962) suggested a 50 percent or more
substitution of iron in the octahedral layer as being sufficient in
order to be called the mineral nontronite. Sawhney and Jackson
(1958) also obtained a formula for an iron-rich montmorillonite
mineral in Hawaii.
Swindale (1956) in his study of one-dimensional Fourier
investigation of a 2: 1 lattice type mineral obtained a structural
formula as: -[

163
Table XIX. Loss on Ignition of Fine Clays (<0.21-1)of Gray Hydromorphic Soils
Honouliuli Pearl HarborHori- 110- 350- 560- Hori- . 110- 350- 560-
zon 350°C 560°C 1000°C zon 350°C 560°C 1000°C(%) (%) (%) (%) (%) (%)
A 2.56 11.38 5.09 A1 3.22 11.76 4.258~1 2.22 11.70 4.80 822g1 2.88 11.43 5.00822 1.93 11.55 5.24 822g2 3.33 11.25 5.74C1 1.93 11.25 4.22 IIClg 2.86 10.97 6.29C2 2.36 10.75 4.25 nC2g 2.90 8.61 7.91
Items Means S.D. Means S.D.110-350° C 2.20 0.27 3.04 0.22350-560°C 11.33 0.37 10.80 1.24560-1000°C 4,72 0,47 5,83 1,40
Kalihi LaieHori- 110- 350- 560- Hori- 110- 350- 560-
zon 350°C 560°C 1000°C zon 350°C 560°C 1000°C(%) (%) (%) (%) (%) (%)
ApI 4.69 10.08 4.67 ApI 4.02 7.13 7.18A 2 3.51 10.44 4.87 A 2 3.65 6.56 8.11822g1 3.27 10.24 5.13 822g1 3.31 6.72 9.06822g2 3.16 10.27 4.22 822g2 3.92 7.25 9.41G1 2.80 10.85 4.38 83g1 3.95 7.68 9.63G2 2.66 10.44 4.94 83g2 3.15 6.36 10.94nCG 3.83 8.56 4.22 83g3 3.53 7.22 10.07
Items Means S.D. Means S.D.110-350°C 3.41 0.68 3.65 0.33350-560°C 10.12 0.73 6.98 0.46_560-1000°C 4.63 0.39 9,20 1,24
Kaloko NohiliHori- 110- 350- 560- Hori- 110- 350- 560-
zon 350°C 560°C 1000°C zon 350°C 560°C 1000°C(%) (%) (%) (%) (%) (%)
ApI 4.23 8.16 4.84 Apl 3.53 9.99 5.49Ap2 5.52 8.38 3.88 Ap2 3.02 9.47 6.39822 5.58 8.40 3.61 822 3.68 8.96 5.79nCcag 4.95 6.50 3.96 IICl 5.53 9.01 6.59IIIC1G 4.94 6.45 3.73 nC2 4.21 9.62 6.39IIIC2G 6.63 8.12 2.33 IIICca 3.79 8.62 6.51IIIC3G 5.48 8.92 2.63 IVC 4.80 8.54 6.23
:J Items Means S.D. Means S.D.110-350°C 5.33 1.10 4.08 0.84350-560°C 7.85 0.97 9.17 0.56560-1000°C 3.57 0.84 6.20 0,40

164
Table XX. Percent Total P 2OS, MnO, MgO, and K20 inFine Clays of Gray Hydromol"phic Soils
Honouliuli Pearl HarborHori- P20S MnO MgO K20 Hori- P20S MnO MgO K20
zon (%) (%) (%) (%) zon (%) (%) (%) (%)A 0.13 1.29 0.32 A1 0.08 1.53 0.31B~l 0.12 1.84 0.33 B22g1 0.10 1.67 0.35B22 0.12 1.83 0.31 B22g2 0.07 1.11 0.31C1 0.10, 2.04 0.31 nC1g 0.10 1.54 0.27C2 0.10 2.37 0.32 IIC2g 0.08 1. 71 0.25
Items Means S.D. Means S.D.P 20 S 0.11 0.08MgO 1.87 0.39 1.51 0.24K 20 0.32 0.30 0.04
Kalihi LaieHOl"i- P20S MnO MgO K20 Hori- P20S MnO MgO K20
zon (%) (%) (%) (%) , zen (%) (%) (%) (%)A p 1 0.08 1.52 0.19 A p 1 0.05 0.03 2.53 0.19A 2 0.07 1.63 0.19 A 2 0.05 2.36 0.21B~2g1 0.07 1.79 0.23 B~2g1 0.08 2.76 0.19B22g2 0.05 2.74 0.23 B22g2 0.07 2.47 0.12G1 0.05 2.84 0.29 B3g1 0.07 2.54 0.13G2 0.04 2.68 0.35 B3g2 0.08 3.48 0.12nCG 0.08 1.34 0.33 B3g3 0.08 3.64 0.12
Items Means S.D. Means S.D.P20S 0;06 0.07MgO 2.08 0.65 2.82 0.51K20 0.25 0.07 0.15
Kaloko NehiliHori- P20S MnO MgO K20 Hori- P205 MnO MgO K20
zon (%) (%) (%) (%) zon (%) (%) (%) (%)A p1 0.04 3.43 0.33 A p 1 0.08 1.89 0.27A2
2 0.08 3.76 0.32 A~2 0.10 2.03 0.27B 2 0.08 0.04 2.95 0.34 B 2 0.13 0.02 2.58 0.37nCcag 0.07 '0.04 3.70 0.59 IIC1 0.08 0.04 1.39 0.37IIIC1G 0.08 3.31 0.60 IIC2 0.07 0.08 1.78 0.41IIIC2G 0.26 0.04 3.68 0.62 IIICca 0.08 0.05 1.30 0.46IIIC3G 0.12 0.03 4.02 0.54 IVC 0.23 0.07 2.08 0.75
Items Means S.D. Means S.D.P 20 S 0.10 0.11MgO 3.55 0.35 1.86 0.43K20 0.48 0.14 0.41 0.16

165
Table XXI. Percent Silica, Alumina, Silica- Sesquioxide Ratios,and Silica-Alumina Ratios. of Fine Clay Fractions
of Gray Hydromorphic SoilsHonouliuli
Horizon Si02 Al203 Si02 Si02(%) (%) R203 Al203
A 43.8 28.6 2.31 2.608~1 42.5 28.9 2.22 2.49822 42.5 29.3 2.20 2.46Cl 45.1 29.8 2.31 2.57C2 44.3 29.4 2.28 2.5·7
Items Means S.D.Si02 43.6 1.12Al ° 29.2 0.45Sit;27R 20 3 2.26 0.05Si02/A1203 2.54 0.07
Pearl HarborHorizon Si02 Al203 Si02 Si02
(%) (%) R203 Al203Al 44.4 28.0 2.36 2.69822g1 44.0 27.9 2.33 2.67822g2 44.7 26.8 2.42 2.83nClg 43.6 26.5 2.40 2.79nC2g 44.6 25.8 2.44 2.94
Items Means S.D.Si02 44.2 0.45Al20 3 27.0 0.95Si02/R203 2.3·9 0.05SiOZ/AIZ03 2.78 0.11
KalihiHorizon Si02 Al203 Si02 Si02
(%) (%) R203 Al203Apl 41.4 26.0 2.21 2.71A 2 42.1 25.7 2.28 2.788~2g1 42.2 26.7 2.23 2.68822g2 42.7 26.4 2.26 2.75Gl 43.4 26.1 2.34 2.83G2 42.6 26.0 2.30 2.79nCG 43.4 23.0 2.34 3.21
Items Means S.D.Si02 42.6 0.73Al20 7 25.7 1.24Si0 2 R20 3 2.28 0.06Si02/A1203 2.82 0.18

166
Table XXI. Pel"'cent Silica, Alumina, Silica-Sesquioxide Ratios,and Silica-Alumina· Ratios of Fine Clay Fractions
of Gl"'ay Hydl"'omol"'phic Soils (Continued)Laie
HOl"'izon Si02 Al203 Si02 Si02(%) (%) R203 Al203
Ap1 45.8 19.6 2.83 3.98A 2 46.0 20.0 2.83 3.908~2g1 45.8 19.5 2.83 3.98822g2 44.4 19.6 2.82 3.8683g1 44.8 20.7 2.79 3.6883g2 43.9 19.7 2.77 3.7883g3 43.8 19.7 2.83 3.77
Items Means S.D.Si02 44.9 0.95Al203 19.8 0.42Si02!R203 2.81SiOz/AIZ0 3 3.85 ·0.12
KalokoHOl"'izon Si02 Al203 Si02 Si02
(%) (%) R203 Al203Ap1 44.0 20.0 2.63 3.73A~2 44.1 19.6 2.67 3.828 2 44.4 19.6 2.68 3.85IICcaC 43.9 18.5 2.75 4.11mC1 45.8 18.9 2.80 4.11mC2G 43.9 19.3 2.68 3.85mC3G 44.0 18.6 2.75 4.02
Items Means S.D.Si02 44.3 0.70Al60 7 19.1 0.66Si 2 R20 3 2.71 0.08SiOz/A1203 3.93 0.14
NohiliHor-izon Si02 Al203 Si02 Si02
(%) (%) R203 Al203Ap1 47.3 18.7 2.95 4.28A~2 47.6 19.6 2.91 4.128 2 45.6 18.6 2.81 4.16IIC1 47.3 17.6 2.99 4.56IIC2 47.0 16.6 3.04 4.81IIICca 48.0 16.3 3.13 4.99IVC 48.0 16.1 3.16 5.07Items Means S.D.SiOd . 47.28 0.80
~~62jR20317.69 1.392.99 0.12
SiOZ/AI20 3 4.57 0.40

167
Table XXII. Percent Total Fe203' Ti02, and A1203/Fe203. Ratios of Fine Clay Fractions of Gray Hydromorphic Soils .
Honouliuli Pearl HarborHori- Fe203 Ti02 Al203 Hori- Fe203 Ti02 Al203
zon (%) (%) Fe203 zon (%) (%) Fe203A 5.63 1.06 7.97 Al 6.17 0.82 7.138~1 5.63 0.97 8.06 822g1 6.44 0.88 6.81822 5.49 1.06 8.37 822g2 6.98 0.88 6.02Cl 5.36 1.01 8.67 IIClg 6.84 0.88 6.08C2 5.76 1.10 7.98 IIC2g 8.11 0.97 5.05
Items Means S.D. Means S.D.Fe203 5.57 0.14 6.90 0.74Ti02 1.04 0.07 0.89 0.07A1203/Fez03 8.21 0.30 6.22 0.81
Kalihi LaieHori- Fe203 Ti02 AIZ03 Hori- Fe203 Ti02 Al203
zon (%) (%) Fe203 zon (%) (%) Fe203Apl 9.12 1.21 4.47 A pl 12.43 1.06 2.47Ap2 8.84 1.14 4.55 A 2 11.89 0.97 2.64822g1 8.44 1.26 4.97 8~2g1 12.07 0.95 2.54822g2 8.98 1.29 4.61 822g2 11.35 1.48 2.71Gl 8.58 1.45 4.77 83g1 10.32 1.54 3.14G2 8.58 1.26 4.74 83g2 11.17 1.35 2.77IICG 13.53 1.35 2.66 83g3 10.31 1.39 3.00
Items Means S.D. Means S.D.Fe203 9.44 1.82 11.36 0.83Ti02 1.28 0.10 1.24 0.21AIz03/Fe203 4.39 0.78 2.75 0.24
Kaloko NohiliHori- Fe203 Ti02 Al203 Hori- Fe203 Ti02 Al203
zon (%) (%) Fe203 zon (%) (%) Fe203Apl 13.17 0.81 2.38 Apl 13.17 0.88 2.23Ap2 13.35 0.88 2.30 A p2 12.81 0.97 2.40822 13.35 0.97 2.30 822 14.07 0.88 2.08IICcag 14.07 0.97 2.02 IICl 14.43 0.74 1.91II1CIG 13.89 1.06 2.13 IIC2 14.07 0.82 1.85II1C2G 13.35 0.88 2.27 IIICca 14.25 0.78 1.80II1C3G 13.49 0.88 2.16 IVC 14.25 0.88 1.80
Items Means S.D. Means S.D.Fe203 13.52 0.33 13.86 0.62Ti02 0.92 0.08 0.85 0.07A1203/Fez03 2.22 0.13 2.01 0.23

168
Fe2+0.08M90.48TiO.08) VI018 • 36 (OH) 5.64
He call this mineral montmorillonite.
Sudo (1952) in Japan reported a chemical formula for a
montmorillonite mineral as follows:
On the basis of these reported formulae for montmorillonite
clays the name iron-rich montmorillonite or nontronite is suggested
for the type of montmorillonite in Nohili soil. This nontronite has
a unit cell weight of 788.6.
An attempt was made to calculate the surface area of the
above iron-rich montmorillonite in the Nohili soil from its chemical
formula and unit cell weight. It gives a surface area of 720
m2/gm of clay. The calculated cation exchange capacity of this
sample comes to 94 me/l00 grams of clay. This mineral has a
surface charge density of 13.0 x 10⁻⁶ coulomb/cm2 •
169
PROPERTIES AND FORMATION OF INDIVIDUAL SOIL
Honouliuli Soil
The Honouliuli clay is a deep alluvial soil. The pedological
organization of the soil materials in the profile is weak.. The
main distinctions in the profile are the higher amounts of organic
matter and higher cation exchange capacities in the epipedon than
in the subsoil horizons. Because of the organic matter and
minerals the epipedon has a chroma of 1 and the subsoil 3.
As can be seen from the particle size distribution analysis
In T able IV, there is no significant accumulation of sand and silt
fractions in any horizon of this soil.· This is an indication that
this soil has developed on a homogeneous parent material. The
amount of clay is also the same throughout the profile.
In line with this, free iron oxide is 9.1% in the A p horizon
and 10.4% in the C2 horizon. Free manganese oxide shows a
slight increase with depth. pH. is slightly lower (pH 6.8) near
the surface than in the subsurface (pH 7.2). All the above facts
demonstrate that there is little profile development in this soil.
The cation exchange capacity shows that the A p horizon has
a CEC of 34.3 me/100 grams of soil and the B22 horizon 21.4
mel100 grams of soil. This difference is due to the higher amount
of organic matter in the surface horizon.
There is an increase in percent base saturation and sodium

170
saturation of this soil with depth. This is an evidence of leaching
effect although it is very weak. The amounts of exchangeable
Ca++ and Mg++ are unaffected by leaching.
Magnetite, hematite, rutile, and ilmenite make up the sand
fraction of all the horizons. The minerals do not vary throughout
the profile.
The coarse and fine silt fractions (50-5 microns and 5-2
microns) contain rutile, magnetite, hematite, anatase, plagioclase,
and a small amount of metahalloysite. In addition, in the fine silt
fractions small amounts of halloysite, mica, and montmorillonite
minerals are present. The presence of these clay minerals in the
fine silt fraction may mean that a small proportion of Hawaiian
kaolinites are of larger particle size than usual.
In the clay fraction of this soil about 80% is metahalloysite and
the rest is montmorillonite. A small amount of hydrated halloysite,
mica, and gibbsite is also present (Table XXIII). The amount of
metahalloysite decreases from 85% i'n the A p horizon to 77% in the
C1 horizon. On the other hand, the amount of montmorillonite 1S
13% in the A p horizon and increases to 21% in the C1 horizon.
Soil formation and weathering:
Honouliuli clay exhibits little evidence of soil formation with
respect to morphology, the degree of leaching being the limiting
factor. The soil material is fine-textured and it exerts a consider
able influence in causing temporary drainage impedance and a low

171
level of leaching.
The parent material of the Honouliuli soil was derived from
an area where kaolinite, halloysite, and oxides of iron and alu
minum are the dominant minerals. It is assumed here, therefore,
that the alluvium had very small amounts of montmorillonite mineral
at soil formation time zero. The materials were deposited along
the edge of the Waianae Mountains in a marine environment and
is called the EwaClay Plain by Ruhe et ale (1965). He has
determined the age of this geomorphic unit to be of Yarmouth
Interglacial period. In terms of absolute age this material is
greater than 38,000 years old according to Ruhe et ale (1965).·
The hydromorphic characteristic is weak in this soil as is
demonstrated by the lack of pattern in the distribution of free iron
and manganese oxides and also by the absence of mottles.
There is not enough profile differentiation on the basis of
color or texture but a small ch'::i.nge in the relative proportion of
montmorillonite and metahalloysite is apparent.
The minerals in the coarser fractions were part of the
deposited alluvium and their distribution in the different horizons
does not seem to be affected by the present cycle of weathering.
The 16% of montmorillonite in the soil may be considered to be the
product of the present cycle of weathering and soil formation in
this soil. Taking... the age of this soil as 38,000 years, as given
by Ruhe et ale (1965), the rate of montmorillonite formation is

172
calculated to be 0.0004 grams/l00 grams of soil material per
year. This figure is much smaller than the 0.002 grams/l00
grams of soil material/annum as calculated by Barshad (1964) out
of total clay formation in soil. This very sluggish rate of change
may be regarded as an example of "pedogenic hysteresis" (Milne,
1936) •
The amount of metahalloysite is high near the surface and
decreases downward while the amount of montmorillonite increases
with depth. This represents the relative stabilities of these two
minerals. There is a transformation of minerals:
metahalloysite~ montmorillonite
Due to the high pH and high base saturation In the sub
surface zone the co.nditions there are more suitable for the syn
thesis and stability of montmorillonite than near the surface.
Pearl Harbor Soil
Pearl Harbor soil has developed in the nearby ~rea with
similar climatic condition as the HonouIiuIi. The parent material of
this soil was derived from the surfaces of soils at higher elevations
which are very high in kaolinite type of minerals and iron and
aluminum oxides. The parent material of this soil, therefore, IS
similar to that of the Honouliuli soil but was deposited at a later
time. The parent material of Pearl Harbor soil was derived
from the Honouliuli and other surrounding soils of the Low Humic
Latosol group.

173
In .the Pearl Harbor soil, profile development is more
apparent than in the Honouliuli soil, although morphological changes
are gradual in the profile with depth.
P article size distribution analysis (Table IV) of this soil
shows that at a depth of 16 inches there is a lithologic disconti
nuity where both sand and silt are higher than the horizons
either above and below.
Percent free iron and manganese oxides show a high con
centration near the surface. This implies that the distribution of
these two oxides are guided by the ground water table and not
by the differences in soil material. The nClg horizon has a
higher pH (pH 7.5) than the horizon immediately below (pH 7.1).
This is because the n Clg horizon has a small amount of lime in
the soil which effervesces with dilute hydrochloric acid.
The cation exchange capacity in nelg is quite low (33.0 mel
100 grams of soil) but in the other horizons the cation exchange
capacity is high (49.0 mell00 grams of soil). These properties
show that the parent material of this soil is not uniform throughout
the profile.
The percent base saturation is high (85.9%) in the I1C1G
horizon which is due to the presence of small amounts of lime.
The lowest base saturation is found in the 822g1 horizon (53.4%).
The reason for this is not known.
The pearl Harbor soil is formed on comparatively young
174
alluvium. There is not much difference in the Si02/R20 3 ratios
(Table XII) in different horizons of this soil. The total analysis
of the whole soil shows uniform distribution of Si02 , A120 3 , and
. Ti02 in the profile (Tables X and XII) •
. The minerals in the sand fraction include magnetite, hema
tite, anatase, goethite, and rutile. There appears to be small
amounts of siderite in the lower horizon. The anatase content IS
high near the surface.
Magnetite is the dominant mineral in the coarse silt 'fraction
( Table XIV). Other minerals In this fraction are ilmenite,
anatase, rutile, gibbsite, goethite, and siderite. There is little
fine silt in this soil but it is comparatively higher in the lower
two horizons. Among the minerals present in this fraction are
magnetite, quartz, ilmenite, siderite, and gibbsite. X-ray pat
terns also indicate the presence of a considerable amount of
kaolinite and a small amount of mica and montmorillonite. The
layer silicates are possibly present in the form of aggregates
which did not break down during the pretreatment of the soils and
subsequent dispersion.
In the clay fraction the montmorillonite content increases with
depth while the metahalloysite decreases in that direction (Table
XXIII) although the absolute amount of metahalloysite is much
higher than that of montmorillonite. In the A1 horizon the amount
of montmorillonite is 16% in the clay but in the IIC2g horizon the
175
amount of this mineral is as high as 40%-~ This is an indication
that the environment of clay formation changes within a short
depth in this soil.
Soil formation and weathering:
Hydromorphism has influenced the distribution of free' iron
oxide and free manganese oxide and is apparent from the distri
bution of mottles. Mottles are present up to the lower level of
the A horizon. The horizons can be differentiated easily on the
basis of abundance of mottles.
The influence of parent material on the soil is shown by the
presence of a large amount of metahalloysite. The soil material,
as far as geological evidence shows, at soil formation time zero
was mostly haUoysite which is gradually changing to montmoril
lonite under the present cycle of soil formation. The alkaline
reaction (pH 7.5), high base saturation (71.3%), and the pres
ence of high amounts of Ca++ and Mg++ in the exchange complex
have created an environment favorable for the ·formation and
stability of montmorillonite. Impeded drainage has accentuated this
situation by preventing leaching of the materials in the soil
solution.
In other words, the same equilibrium between metahalloysite
and montmorillonite exists in the Pearl Harbor soil as in the
Honouliuli soil, but the equilibrium is shifted further to the right in
the lower horizons of the former. However, the change in

176
mineralogical properties is not as great as in the better-developed
hydromorphic soils such as Laie and Nohili.
Ruhe et ale (1965) have given the age of Pearl Harbor
soil as about 670+100 years. In terms of a pedogenic time-scale
such a period is comparatively short for the large-scale changes
which have occurred in the mineralogy of this soil. An attempt
was made here to calculate the rate of montmorillonite formation
in the present soil. The amount of montmorillonite present in this
soil at soil formation time zero was taken to be about 10%, which
is also the amount of montmorillonite in the surface of the Honou-
liuli soil. The rate of montmorillonite formation is 0.0328 grams/I
100 grams of soil material!annum. '"this figure IS much higher
than the rate of clay formation calculated by Barshad (1964). It
may be noted, however, that he was working with soils in the
temperate region where the rate of reaction is· much slower than
in the tropics.
It may be interesting here agaIn to note that Honouliuli soil
shows the rate of formation of montmorillonite clays to be 0.0004
grams/100 grams of soil/annum. When this figure is compared
with that of Pearl Harbor soil it is found that the rate of synthesis
of montmorillonite in Pearl Harbor soil is around 80 times faster
than that in the Honouliuli • What is the reason for this high
reaction rate in Pearl Harbor soil? It possibly can be attributed
to a higher degree of hydromorphism in the Pearl Harbor soil
177
than In the Honouliuli soil.
The "pedogenic convergence" (Kimura, 1966) in the Pearl
Harbor soil is much more rapid than that in the Honouliuli 0
Kalihi Soil
Kalihi soil is a deep soil formed on massive alluvium.
Neal'" the surface the structure is subangular blocky but below
that it is massive. 'Water movement in the profile is restricted
and drainage is poor. Mottles extend up to the bottom of the A
horizon. With depth the mottles ultimately grade to gley horizons.
There are about 40 inches of rainfall annually on this soil,
and the annual average temperature is about 70 0 F • The soil is
now planted to sugarcane which is regularly. irrigated.
The particle size distribution for this soil has been presented
in Table IV. There is an increase of clay content with depth.
This increase is probably related to the present cycle of soil
formation. More than 80 percent of the soil material is clay.
The percentage of clay and the high exchangeable Mg++ and Na+
contents are considered to be the cause for the extreme sticky
and plastic properties of this soil (Gill and Sherman, 1952;'
Ahmed, 1965).
The pH of this soil is low, but it varies considerably from
one horizon to the other. The pH of the 822g1 horizon is higher
than that of the 822g2 horizon by one pH unit, although they are

178
adjacent horizons. The pH is high near the surface and agam
higher at the bottom with a dip in the middle of the"" profile. The
base saturation of this soii is also low. The high cation exchange
capacity of Kalihi soil is due to its high clay content. X-ray
analysis indicates a dominance of metahalloysite (70%). But it IS
not clear why this soil should have such a high CE C as 80 mel
100 grams of soil. The weak crystallinity of metahalloysite clay
of this soil along wi th very small particle· size may be the reason
(Worrall and Cooper, 1966). The presence of a small amount
of chlorite and amorphous material may be a factor also for the
higher CE C •
Free iron oxide and free manganese oxide decreases down
the profile. In this particular soil distribution of free iron and
free manganese oxides are controlled both by parent material and
ground water table.
There is about 1% of sand in this particular soil. The
minerals present in the sand fraction are plagioclase, quartz, and
magnetite. The quartz is high in the G2 and JICG horizons,
while in the upper horizons, plagioclase is the dominant mineral.
The reasons for the high quartz content will be discussed toward
the end of this chapter.
Quartz and ilmenite are the dominant minerals in the coarse
silt (50-5 microns) fraction. The ilmenite and quartz distributions
are more or less uniform throughout the profile. Other minerals

179
in this fraction include plagioclase and magnetite. Variations In
the amounts of coarse silt in different horizons provide evidence
that the soil did not develop from uniform parent material 0
The mineralogical composition of the fine silt (5-2 microns)
fraction is presented in Table XV • This fraction constitutes a
very small portion of the total soil. The dominant minerals here
include gibbsite, plagioclase, quartz, and magnetite. The mica
ceous minerals and the quartz are more or less uniformly dis
tributed throughout the profile. This uniform dh:;tribution of mIcas
in the profile indicates the alluvial nature of parent material
(Kimura, 1966).
There is a gradual decrease in the metahalloysite content
of the clay fraction with depth down to the G2 horizon. Below
that the decrease is very sharp, indicating the presence of
lithologic discontinuity as has been mentioned before. The
montmorillonite shows a gradual increase with depth down to the
G2 horizon (Table XXIII), below which the increase is very
sharp. The hydrated halloysite and the mica is present through
out the profile. The halloysiteshows an increasing trend with
depth in this profile, but the distribution of mica is uniform.
Soil formation and weathering:
The Kalihi soil seems to have undergone a considerable
amount of weathering in its present environment. From the
morphological and chemical point of view this is not so apparent,

180
but mineralogical study reveals that near the surface there is
about 30% montmorillonite. It is assumed for this soil as for the
others being studied that at the soil formation time zero there
was very little montmorillonite clay in the soil materials. This
montmorillonite then must have formed by alteration from meta
halloysite and synthesis of montmorillonite in soil.
It is interesting to note that although the percentage of
montmorillonite is smaller than that of metahalloysite the physical
properties of this soil are dominated by the montmorillonite clay.
This is evident from the high moisture retentions at 15 bar and
at 0.33 bar pressure.
The high tel N ratios In the subsoil horizons add evidence to
the morphological findings that highly-reduced conditions prevail in
the lower three horizons of this soil. The presence of a uniform
blue color in this zone indicates that these are gley horizons.
The neG horizon was formed from weathered basalts over
which new alluvium has been deposited. Since in the neG hori
zon clay formation from basalts took place under impeded drainage
condition with very little leaching, montmorillonite clay has formed.
Thus, in chemical and mineralogical properties the nCG horizon
stands as a separate formation from the upper six horizons. The
extremely high moisture holding capacity of the neG horizon
helped in the formation of a perched water table which in turn
paved the way for the development of this immature gley soil.

181
An examination of X-ray diffraction patterns reveal that both
metahalloysite and montmorillonite show a poor order of crystal-
linity than montmorillonite except in the neG horizon where
montmorillonite shows very sharp peaks. It appears, therefore,
that regional weathering conditions are suitable for the stability of
metahalloysite but at least in some horizons o.f the soil the micro-
environment is suitable for the formation of montmorillonite.
Since there is no lithologic discontinuity in the upper SIX
horizons of Kalihi soil the decrease of metahalloysite and the
increase of montmorillonite with depth may be regarded as closely
related to the present cycle of soil formation. The question
arIses as to which one of these two minerals are in equilibrium
with the environment. The low pH (6.0) and low base saturation
in this soil gives the impression that the soil environment is suit-
able for stability of halloysite in the metahalloysite ~ - montmorillonite
system.
However, it is not necessary to have an alkaline environment
for the formation and stability of montmorillonite as has been sug
gested by Weaver (1956). Moreover, the 10wCa++/ Mg++ ratio
and moderately high N a+ saturation may create an environment
for the formation of montmorillonite in this soil. Due to the
f h ' h d' d't' th t' 't of Fe++ bpresence 0 Ig re ucmg con I Ions e ac IVI y may e
additive to the other factors in favor of montmorillonite.

182
Laie Soil
The Laie soil is located at the bottom of a closed valley.
The parent material came from the surrounding uplands which
were hydrothermally altered. The average annual rainfall of this
soil is 4"0 inches and the mean annual temperature is about 73 0 F •
Because this soil is located on the windward side of Oahu the
distribution of rainfall is somewhat better than on the leeward side.
This soil appears more mature than the Kalihi soil from the
point of view of morphology. Cline et ale (1955) put both K alihi
and Laie· soils in the same family. There is some similarities
between the Kalihi and the Laie soils in that the parent materials
.< of both soils were derived from hydrothermally-altered rocks as
was discussed earlier. Neither of the soils have calcareous
materials in their profiles. Both have high cation exchange
capacity and low pH. The soil materials in the Kalihi soil seem
to be more massive than in the Laie.
The particle size distribution is presented in Table IV.
From the table it appears that this soil has higher amounts of
sand and silt fractions than any other soil of Gray Hydromorphic
group. Silt content is higher in the lower horizons than near the
surface. This increase of silt from the surface downward may
be related to the activity of the present cycle of weathering.
The increase of silt content with depth is so gradual that there
does not seem to be any discontinuity in the lithology of the

183
alluvium. The more or less uniform distribution of sand fraction
throughout the profile also indicates the absence of any lithologic
discontinuity •
The free iron and manganese oxides decreases with depth
(Tables IX and X), indicating that these elements are very
sensitive to the oxidation-reduction reactions in the soil.
The cation exchange capacity is high in this soil, ranging
from 48.1 to 55.3 mell00 grams of soil. The exchangeable N a+
concentration gradually increases with depth and may be related
to the high pH values in the lower horizons. The amount of
both Ca++ and Mg++ in the exchange complex is high and the base
saturation ranges from 61.4 to 86.5 percent.
The reaction of Laie soil is slightly acidic (average pH of
the profile is 6.4). The pH values gradually increase with
depth. There is a distinct color difference among horizons which
is mainly due to the presence of mottles. . The structure is sub
angular blocky near the surface and changes to columnar with
depth. These are all i'ndications of a considerable degree of soil
development.
Mineralogical composition of this soil is presented in Table
XVI. The mineralogy of the sand and silt fractions in this soil IS
very different from other soils except Kalihi. Two minerals
occur in the sand fraction - quartz and feldspar. Feldspar is
very low near the surface and gradually increases with depth

184
while the quartz is highest near the surface and gradually
decreases with depth. A reason for this is possibly the higher
intensity of weathering near the surface. Quartz is more resis-
tant to weathering than feldspar, and, therefore, has accumulated
near the surface where feldspar is being decomposed.
In the coarse silt fraction (50-5 microns) feldspar IS the
dominant mineral in the subsoil horizon. Very small amounts of
feldspar are present near the surface. Quartz content again is
high near the surface and decreases with depth. Thus there is
a similarity in mineral distribution pattern between both the sand
and silt fractions.
Fine silts (5-2 microns) contain plagioclase, quartz, and
magnetite (Table XVI). Moreover, there are small amounts of
layer silicates. Among them may be metahalloysite, montmoril-
lonite, and mica. The amount of mica is high near the surface
horizons and gradually decreases with depth. The amount of
metahalloysite also is high near the surface and gradually
decreases down the profile.-.
The amount of prImary minerals are higher In the coarse
fractions and decrease as the particle size becomes smaller.
The· origin of quartz and mica in this soil will be discussed in a
later section. It has been presumed that the parent material of
this soil was derived from hydrothermally-altered rocks in which
quartz and mica are present.

185
In the clay fraction of this soil montmorillonite is the domi-
nant mineral. It increases gradually with depth 0 The amount of
montmorillonite in the clay is about 60% near the surface and
gradually increases to about 77% in the 83g3 horizon. The next
important mineral present in this soil is metahalloysite which
gradually decreases with depth. Near the surface metahalloysite
IS about 29% while in the 83g3 horizon it is about 16%.
A small amount of halloysite is present in the lower hori-
zons of this soil. The amount of mica gradually decreases with
depth. In the A 1 horizon-mica is about 4% but in the 83g3p
horizon mica is about 1%. A small amount of gibbsite, quartz,
and feldspar is also present in clays.
Soil formation and weathering:
As has been discussed previously, the presence of a higher
amount of quartz near the surface and a higher amount of feldspar
in the lower horizons are indications of the maturity of this soil
with respect to soil formation.
The morphological features, distribution of free iron and
manganese oxides all indicate that gleization is the major soil-
forming process in Laie soil. The presence of distinct colored
horizons along with structure development may be an indication of
the maturity of this soil. Particle size distribution shows that
there is no lithologic discontinuity among the different horizons In
this soil. The distinct colored horizons must therefore have been
186
Kaloko Soil
This is a shallow soil developed on calcareous materials.
In the horizons where secondary lime is found, lime and clay are
intimately mixed to form marls as was discussed in the section on
parent material. Gypsum is found in the lower horizons of this
profile.
Kaloko is a mature soil In the sense that the mineralogy of
this soil has come to dynamic equilibrium with the environment.

187
Ground water table at the present time reaches up to the lower
level of the A horizon. Rainfall is low, about 20 inches annually,
and is not evenly distributed through the year. Mean annual
temperature is about 75 of ..
Particle size analysis data for this soil are presented in
T able IV. The most important aspect of this analysis is the high
percentage of clay. On the average, this soil has 83% clay when
determined after removing organic matter and carbonates. The
sand fraction is comparatively small (about ,1%) and is more or
less uniformly distributed throughout the profile. The percent
coarse silt varies from horizon to horizon but the variation is
small.
Two pedogenic factors that are important in the formation of
this soil are ground water table and parent material. Ground
'water table is fed by irrigation water. The coraline limestone
has given rise to an environment with exceedingly high pH and
high saturation of the soil complex with Ca++ and Mg++ ions. The
high pH may be a limiting factor for microbial activity and as a
result organic matter decomposition in the lower horizons are
reduced with subsequent increases in rei N ratios (Table VI).
The soil has not developed on uniform parent material and
all properties - morphological, physical and chemical - are
influenced by this heterogeneity of alluvium. The moisture retentions
at moisture equivalent and at 0.33 bar of the IIIC1G horizon are

188
40.6 and 37.6 percent, respectively. But the moisture retentions
for IIeg horizon at moisture equivalent and at 0.33 bar are 55.8
and 58.2 percent, respectively. These big differences In moisture
values for two adjacent horizons are due to the change in nature
of the alluvium.
The minerals present in different fractions of the Kaloko soil
are presented in Table X·VII. Plagioclase, magnetite, and
ilmenite are the three minerals present in the sand fraction. The
amount of ilmenite is extremely small in the subsoil horizons.
In the coarse silt (50-5 microns) fraction the major
minerals are magnetite, ilmenite, quartz, plagioclase, and mICa.
The amount of coarse silt in this soil is small (Table IV).
Plagioclase is higher In the subsoil horizons than in the surface.
A very small amount of mica also is present neal" the surface.
Like the coarse silt, the amount of fine silt is also. very
small. The important minerals include plagioclase, gibbsite,
magnetite, pyrite, and anatase. Plagioclase content increases
with depth. This fraction also contains a small amount of layer
~ilicates.
Only three minerals are present in the clay fractions of
Kaloko soil. Montmorillonite is by far the dominant mineral which
gradually increases with depth. The amount of montmorillonite
neal" the surface is 72% and it is about 81% in the mCaG horizon.
Metahalloysite content decreases with depth. The amount of

189
metahalloysite is about 18% in the A p 1 horizon but in the III C3G
horizon it is 9%. There is no variation in the profile distribution
of hydrated halloysite in clay. The amount of hydrated halloysite
In this soil is highest among the Gray Hydromorphic soils (Table
XXIII) •
Soil formation and weathering:
From a morphological· standpoint the Kaloko is a moderately
well-developed soil formed by the process of gleization on marly
parent material of heterogeneous composition. Three distinct sets
of horizons, of a typical hydromorphic soil, have developed in
this soil. Firstly, the epipedon consists of the A p 1 and A p 2 hori
zons which is out of reach of the ground water table. Secondly,
the B22 and 11 Ccag horizons represent the cambic horizons which
are mottled and demonstrate the effect of fluctuations of the water
table. Thirdly, the II1C1G, I1IC2G, and I1IC3G horizons have
developed below the permanent level of the water table. In the
last three horizons a bluish color has developed which is an
important characteristic of gleization.
The distributions of free iron and manganese oxides are
spectacular. Both of them are concentrated near the surface and
decrease sharply in the gley horizons.
High concentrations of organic matter are found in the gley
horizons due possibly to the absence of microbial activity.

190
The soil materials In the Kaloko soil were brought by the
agencies of transport from the hilly regions around the Mana
Plain.. In that region of red soils kaolin is the dominant secondary
clay mineral. The kaolinite minerals were deposited in the Mana
Plain and it IS assumed that the amount of montmorillinite in this
soil, at soil formation time zero, was very small. The more
than 100% base saturation and an alkaline reaction (pH 8.0)
created an environment where kaolinite was transformed to mont-
morillonite (Kerr, 1955). This has taken place under the
present cycle of soil formation. If the geological age as given by
Ruhe et ale ( 1965) is applied to this soil, it will not be moroe than
Late Pleistocene to Recent in age. It is surprising that the
transformation has taken place at such a high rate that 80% of the
total clay has been altered to montmorillonite.
In the lower horizons of this soil there is an accumulation of
gypsum. This gypsum -Was not formed by the process of pedo-
genesis and is not important in the present study.
Nohili Soil
Nohili is a deep and very poorly-drained soil formed on
marls. Previously the ground water table was above the surface
but at the present time, by draining, the water table has been
brought down several feet below the surface. The soil is still
poorly-drained as is evident by the presence of mottles.

191
Rainfall in this soil is low, about 20 inches annually. There
IS seasonal variability of rainfall. Mean annual temperature IS
around 75 0 F • Soil formation here is mostly controlled by the
ground water table and not by rainfall. The marl deposits in
this soil are finer textured than those in the Kaloko soil. Unlike
the Kaloko soil, there is no gypsum in the Nohili. Subangular
blocky structure is present up to the IIC2 horizon below which
there is no appreciable structure. Texture and structure in this
soil are determined by the amount of lime present.
TheB22 horizon is a zone of clay accumulation where the
color is darker than other horizons in the profile (Table If) •.
This horizon has a much higher clay content than the upper
horizons but the clay does not seem to be illuviated from above.
It is possibly due to the nature of the alluvium. The cation
exchange capacity of this horizon is much higher (80 mell00
grams of soil) than other horizons in this soil.
The particle size distribution data has been recorded in
Table IV. The most interesting aspect of this analysis is the
amount of sand present in different horizons. The upper two
horizons have about 6% sand while in the lower 5 horizons the
amount of sand is comparatively small. This indicates that the
A p l and A p2 horizons have formed from different materials than
the ,lower five horizons. The coarse and fine silt fractions also
show similar tre'nds. The percentages of clay in the upper two

192
horizons are much smaller than the horizons below.
Total F e203, A1203, and Si02 content in soils of different
horizons indicate sharp variation from one horizon to the other.
This variation is due mainly to the relative proportion of calcareous
materials and clays in different horizons.
Another interesting distribution pattern IS shown by the Ti02
content in Nohili soil. There is a sharp decrease of Ti02 with
depth and it is not known if this decrease is due to the effect of
poor drainage 01'" if it is merely due to the variation of parent
material. A similar distribution pattern for Ti02 is observed In
Kaloko soil. Since no such decrease of Ti02 was observed In
the gley horizons of Kalihi and Laie soils, the decrease in
Kaloko and Noh iIi soil is attributed to the variation in parent
material rather· than to the soil-forming process. But it may be
noted that both the Kalihi and Laie soils have low pH (6.0),
whereas in the Kaloko and Nohili soils the pH is about 8.0. At
such a high pH, Ti02 may be mobile from the reduced zones.
The cation exchange capacity in the Nohili soil varies in
different horizons, thus reflecting the effect of parent material
(Table VI). ++ ++ .Exchangeable Ca and Mg are the two dommant
cations in this soil and the base saturation is very high except in
the B22 horizon.
In the sand fraction the important minerals are magnetite,
hematite, anatase, and plagioclase. The amount of plagioclase IS
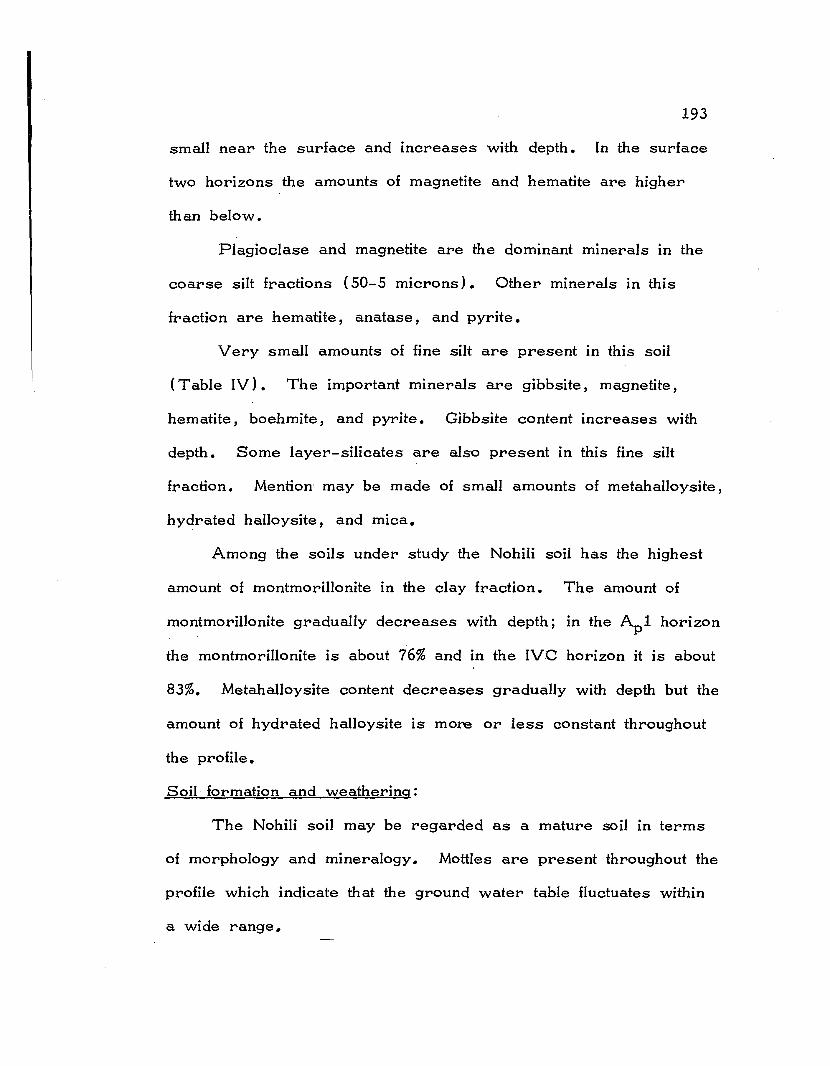
193
small near the surface and increases with depth. In the surface
two horizons the amounts of magnetite and hematite are higher
than below.
Plagioclase and magnetite are the dominant minerals in the
coarse silt fractions (50-5 microns). Other minerals in this
fraction are hematite, anatase, and pyrite.
Very small amounts of fine silt are present in this soil
(Table IV). The important minerals are gibbsite, magnetite,
hematite, boehmite, and pyrite. Gibbsite content increases with
depth. Some layer-silicates are also present in this fine silt
fraction. Mention may be made of small amounts of metahalloysite,
hydrated halloysite, and mica.
Among the soils under study the Nohili soil has the highest
amount of montmorillonite in the clay fraction. The amount of
montmorillonite gradually decreases with depth; in the ~1 horizon
the montmorillonite is about 76% and in the IVC horizon it is about
83%. Metahalloysite content decreases gradually with depth but the
amount of hydrated halloysite is more or less constant throughout
the profile.
Soil formation and weathering:
The Nohili soil may be regarded as a mature soil in terms
of morphology and mineralogy. Mottles are present throughout the
profile which indicate that the ground water table fluctuates within
a wide range.

194
In Nohili soil, also like the Kaloko, gleization is the major
soil-forming process. This process has affected the distribution
of free· iron and manganese oxides as is evident from their sharp
decrease with depth.
On a total clay basis the Nohili soil has 80% or more
montmorillonite. In an alluvial soil like this, most of He clay was
assumed to be kaolinite at soil formation time zero, because the
area that surround the Mana Plain has soils with highly kaolinitic
clay. The transformation from halloysite to montmorillonite,
therefore, must have been rapid.
The decrease of metahalloysite and the increase of montmoril-
lonite with depth (Table XXIII) indicates that the latter mineral is
more stable in the environment cif' the lower horizons of this soil
than at the surface. The high pH (8.2) and the extremely high
base saturation (100%) are responsible for this. Shirazi (1965)
has shown that these soils have solutions which are very rich in
M ++g • This high influx of Mg++ and very little remov~l of them
from soil are possibly responsible for creating the environment
suitable for sustenance of montmorillonite. The equilibrium, there-
fore, shifts in favor of montmorillonite.
Origin of Quartz and Mica in Kalihi and Laie Soils
Quartz is one of the most common silica minerals in soils.
But In Hawaiian rocks and soils this mineral is very uncommon.

195
Hawaiian lavas being mostly of the tholeiitic type are unsaturated
with silica and under normal magmatic differentiation there remains
no excess silica to crystallize as quartz (Macdonald and Katsura,
1964).
Different authors tried to explain the presence of quartz
grains in soils along the eastern coast of Oahu in different ways.
Two important theories are prevalent:
( 1) The first explan'ati9n is that the quartz along the eastern
coast of Oahu was carried by the tradewind from the North
American continent and. was deposited along the eastern coast of
Oahu when the wind was obstructed by the Koolau range (Rex
and Goldberg, 1958).
( 2) A second explanation is that the quartz was formed in
the l"'ock"iS of the Kailua Volcanic Series when it was subject to
hydrothermal alteration during the subsequent eruptions of the
Koolau Volcanic Series (Stearns and Vaksvik, 1935). Along
with quartz other minerals like opal, zeolites, talc, and mICa were
also formed.
There seem to be' a difference of VIews about the mechanism
of hydrothermal, alteration in the rocks of the Kailua Volcanic
Series. According to Dunham (1933) the alteration was caused
by the magmatic water concurrent with cooling of the Kailua flows.
Stearns and Vaksvik (1935) seemed to dispute the above explana
tion. According to them the Kailua flows were directly under 01"
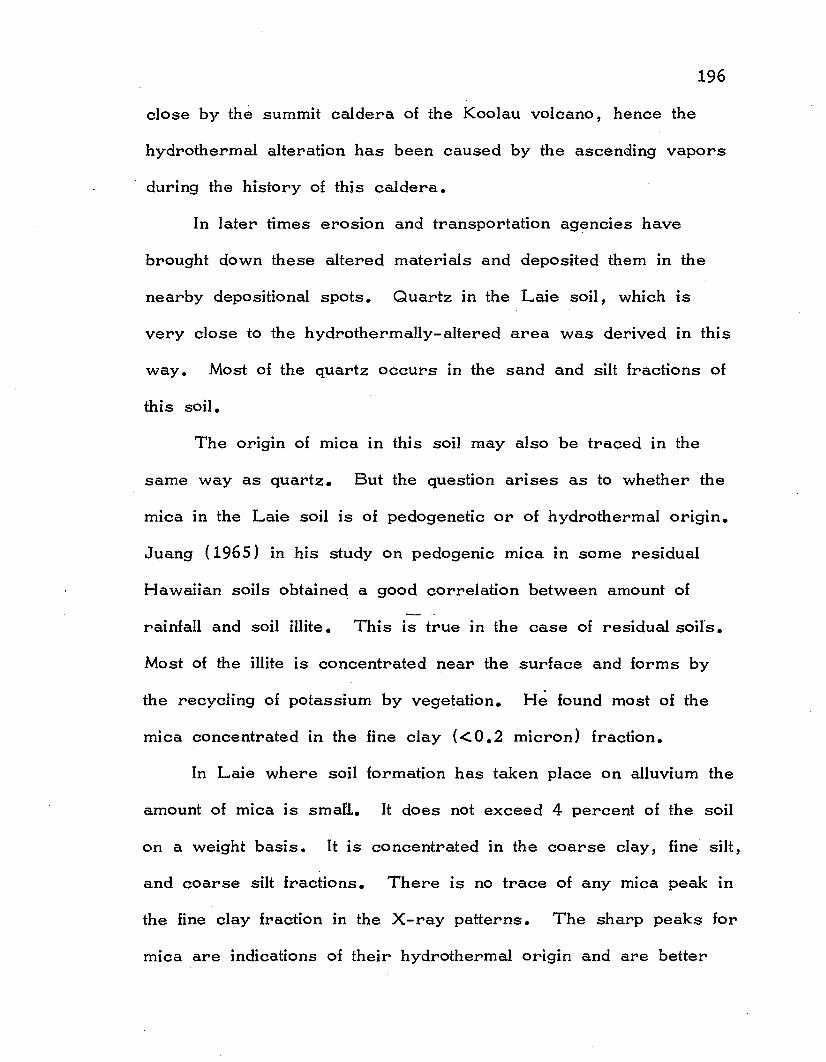
196
close by the summit caldera of the Koolau volcano, hence the
hydrothermal alteration has been caused by the ascending vapors
during the history of this caldera.
In later times erosion and transportation agencIes have
brought down these altered materials and deposited them in the
nearby depositional spots. Quartz in the Laie soil, which IS
very close to the hydrothermally-altered area was derived In this
way. Most of the quartz occurs in the sand and silt fractions of
this soil.
The orlgm of mica In this soil may also be traced in the
same way as quartz. But the question arises as to whether the
mica in the Laie soil is of pedogenetic or of hydrothermal origin.
Juang (1965) in his study on pedogenic mica in some residual
Hawaiian soils obtained a good correlation between amount of
rainfall and soil illite. This is true in the case of residual soils.
Most of the illite is concentrated neal" the surface and forms by
the recycling of potassium by vegetation. H~ found most of the
mIca concentrated in the fine clay «0.2 micron) fraction.
In Laie where soil formation has taken place on alluvium the
amount of mica is smaIl. It does not exceed 4 percent of the soil
on a weight basis. It is concentrated in the coarse clay, fine' silt,
and coarse silt fractions. There is no trace of any mica peak in
the fine clay fraction in the X-ray patterns. The sharp peaks for
mica are indications of their hydrothermal origin and are better

197
crystallized than the pedogenic mICa. Their occurrence m the
coarse fractions also lends support to the fact that this mica was
brought from the hydrothermally-altered areas by the agencies of
transport •
In the Kalihi soil, collected from the Mahaulepu Valley in
southeastern Kauai a small amount of quartz and mica is found m
the coarse fractions 0 In the fine clay « 0.2 micron) fr'action
X-ray diffraction patterns do not show any peak for mica. The
occurrence of mica in the coarser fractions along with the pres
ence of quartz gives rise to the idea that these minerals have
some sort of similarity of origin with those of the Laie soil in
Oahu. The soil materials in the Mahaulepu valley must have been
carried down by the agencies of erosion and transportation from
the nearby uplands. Mahaulepu valley is surrounded on three
sides by hills. On the eastern and western sides it is surrounded
by outflanks of the Napali formation of the Waimea Canyon Volcanic
Series' and consists mainly of olivine basalt and picrite basalt. On
the northern side it is bordered by the Haupu Caldera. Along the
edges of this caldera there possibly occur masses of breccias and
hydrothermally-altered rocks (Macdonald et aI., 1960). It is
possible that quartz and mica that is found' in the coarse fractions
of Kalihi soil came from this hydrothermally-altered rocks located
along the northern edge of this valley.

198
GENESIS OF GRAY HYDROMORPHIC SOILS
The mineralogical compositions pf the clay fractions (less
than 2 micron fraction) of the six Gray Hydromorphic soils have
been compiled in Table XXIII. Any theory that may be put for
ward to explain the course of soil development must explain the
distribution and extent of clays in the soils, because the clay
fraction is sensitive to these processes. The important points of
T able XXIII may be summarized as follows: (a) In all soils
there is a decrease of metahalloysite content down the profile and
a consequent increase of montmorillonite; (b) Hydrated halloysite
content increases with depth; and (c) The amount of montmorillonite
Increases in soils with increasing degree of hydromorphism.
The Honouliuli soil, which· is the least hydromorphic of the
group, has the highest amount of metahalloysite. The amount of
metahalloysite decreases gradually towards the Nohili soil, which
is highly hydromorphic, in the order: Honouliuli > Pearl Harbor>
Kalihi > Laie > Kaloko > Nohili.
The distribution of montmorillonite obviously follows a trend
which is reverse of metahalloysite (Figs. 30 and 31). The
Honouliuli and Nohili soils may be regarded as end-members of
Gray Hydromorphic soils of Hawaii and the others are intermediate
in characteristics (Fig. 32).

199
T able XXIII. Mineralogical Composition of the Clay Fractions(Less than 2 microns) of Gray Hydromorphic Soils
Soils Horizon KI Mt HI II Gb Mg 01" PI TotalHonouliuli A p 85 13 '1 1 100Clay 821 80 16 1 1 1 99
822 77 20 1 1 2 101-el 77 21 1 99C2 79 20 1 100
Pearl A1 78 16 1 1 2 1 99Harbor 822g1 77 19 1 1 1 99Clay 822g2 75 20 2 1 2 100
IIC1g 70 26 2 1 1 100nC2g 56 40 1 1 1 99
Kalihi . A p1 68 31 2 1 1 102Clay A p2 66 32 3 1 102
822g1 64 34 2 1 101822g2 52 42 5 1 100Gl 54 42 3 1 100G2 52 43 3 1 99nCG 23 71 6 100
Laie A p1 29 66 4 1 102Clay A p2 29 66 3 1 1 1 101
822g1 28 69 2 1 100822g2 24 69 4 1 1 2 10283g1 19 72 7 1 1 2 10183g2 17 77 6 1 10183g3 16 77 6 1 1 101
Kaloko A p1 18 72 8 98Clay A p2 17 75 8 100
822 16 74 9 99nCcag 13 76 11 100IIIC1G 11 80 10 101IIIC2G 11 80 10 101I1IC3G 9 81 9 99
Nohili A p1 20 76 5 101Clay A p2 19 75 6 100
822 10 84 6 1 101IIC1 8 84 6 98IIC2 7 85 7 1 100IIICca 7 86 5 1 100IVC 9 83 7 1 1 101·
KI = Metahalloysite; Mt = M.ontmorillonite; HI = Halloysite;II = Illite; Gb = Gibbsite; Mg = Magnetite; 01" = Quartz;PI = Plagioclase

200
FIG.30 DI FFERENTIAL THERMAL ANALYSI SPATTERNS OF FINE CLAYS OF SURFACE
HORIZONS OF GRAY HYDROMORPHIC SOILS
HONOULlULla
a PEARL HARBOR~
<I+1
W KALIHI0:: a::Jl-e::{0::Wa.. a LAIE~WI-
-I KALOKOe::{ aI-zW0::Wl.L NOHILIl.L aCi
200 400 600 800 1000
TEMPERATURE °c

201
FIG. 31 DIFFERENTIAL THERMAL ANALYSI SPATTERNS OF FINE CLAYS OF BOTTOM
HORIZONS OF GRAY HYDROMORPHIC SOILS
HONOULIULI
:;J<I 0 PEARL HARBOR+1
W0::::>
KALIHII- 0<{0::Wa..:2w
LAIEI- 0
..J<{
I-Z
~KALOKOW 00::W ./lL.lL.0
NOHILI
200 400 600 800 1000
TEMPERATU RE °C

202
Although the differentiat~on in mineralogical characteristics is
great, the question as to whether the soils so distinguished are
end-members of a single population 01" whether they represent
more than one distinct population is diffieult to determine. The
main difficulty IS the slow gradation of properties from the weakly
hydromorphic to intensely hydromorphic soils.
Explanation of Formation of Minerals from Alluvium
Theories on the genesis of secondary minerals may be
conveniently presented in three parts: (a) the source area of
parent material, (b) the nature of depositional sites, and (c) the
nature of post':-depositional changes.
The source area:
A full discussion on the source area has already been
presented in the section on parent material.
The nature of depositional sites :
The depositional sites in the soils studied differ very much
from one anothe~. The parent materials of the Honouliuli, Pearl
Harbor, Kaloko, and Nohili soils were derived from highly
weathered basaltic rocks, but due to differences in depositional
sites, the Kaloko and Nohili soils have calcareous materials in their
profiles while in the Honouliuli and Pearl H arbor soils the profiles
are devoid of any calcareous material. In the Kalihi and Laie soils
also there is no calcareous materials in the profiles.

203
Hinkley (1965) studied the differences of alluvium deposited
in fresh water and in saline water. He reported that kaolinite
clay deposited in an environment where there is no salt effect will
have isotropic characteristics which he explained as due to lack
of parallel particle orientation. The kaolinite deposited in saline
water environment develops anisotropic patches indicating a face-
to face type of flocculation.
Referring to the dispersion of clays affected by ocean water
Whitehouse and Jeffrey (1958) stated:
Clay materials that have been exposed to oceanwater exhibit a dispersal resistance to ultimate deflocculation that is distinctly different from the resistancedisplayed by similar materials not so exposed.
Post-depositional changes:
The post-depositional changes include the soil-forming pro-
cesses and the transformation of minerals present in the soil
materials at soil formation time zero.
Influx of colloids and dissolved materials like Si4+, Fe3+,'
AI3+, Mg 2+, Ca2+, Na+, and K+ into lowland areas is continually
taking place. But due to restricted drainage the rate of influx in
most cases is greater than the outflux. As a result, the Gray
Hydromorphic soils have sufficient base always present in the soil
solution.
The secondary minerals that form in the base-poor, well-
drained environment when transported into the poorly-drained soils

204
of high base status become unstable. The instability of meta
halloysite clays is accentuated by the presence of high amounts of
ferrous ions in the system. In soils where reduction is intense,
iron, manganese and sulfur are reduced to their lowest valency
states. In the presence of the' reduced form of these elements
in a system, metahalloysite IS rendered unstable and transforma
tion of this mineral may start. In places where concentration of
silica is high this transformation may take the path of resilication
as follows (Jackson et al., 1965):
resilication resilication1. gibbsite )i kaolinite )i montmorillonite.
at low. pH at Hi.gh pH
2. gibbsiteresilication at
high pH + high base status " montmorillonite.
If the activity of iron in the system is high a lot more iron
may enter in the crystal lattice forming an iron-rich montmorillonite.
In their paper· on nontronite and nontronite-like minerals,
Sherman et ,aI. (1962) discussed the stability of 2: 1 type minerals
in soils. Referring to the Nuuanu Pali nontronite, they stated that
leachates which contain sufficient iron and silicon flow through the
clays and cause the increased stability. In the Wailua (Kauai)
nontronite which occurs in association with gibbsite, these authors
suggested that the clays are possibly much more resistant to
decomposition than had been previously suggested.

80p ~ _-A ... 80A---A- --~---/ oW
/ ~-/ zW EO 60 0~ / -1Z / -1-- a:.:..l0 / 0
:E« d ~o~ -40 40~~~ Z
~O~/ 0Z
\yY/ :EWME:.TAH0 ~O~ / ~a: ~~ lJ:( • ALLOy z. SITE:.W o ..-
20 W20 ~--- I 0D... ~ a:W0.
01 I • • , _ot..", t 10H P KI L KG N
SOILSI
H = Honouliuli SoilP = Pearl Harbor SoilKI = K€l1ihi SoilL = Laie Soil Figure 32. Distribution of Percent KaoliniteKO = Kaloko Soil and Montmorillonite of Clay FractionsN = Nohili Soil of Gray Hydromorphic Soils N
0<.n

206
The high content of montmorillonite m some Gray Hydro
morphic soils of Hawaii is due to their high stability and an
environment favorable for their synthesis in the soil. The supply
of necessary constituents like high iron, silica, and bases are
afforded by the weathering of base-rich basalts in the upland
areas. The dissolved salts come both as surface flow and m
seepage water.
The presence of quartz and mICa m the Laie soil indicates
that the sediments in this soil reflect the residual effect of their
source region (Weaver, 1956). Moberly (1963) in his study of
the sediments of Kailua Bay reported the presence of quartz and
c.hlorite. He ascribed the origin of these minerals to be from the
nearby hydrothermally-altered rocks of Kailua Volcanic Series.
This residual effect may also be observed in the materials of the
K alihi soil where a small amount of mica and quartz are present 0
In both the Honouliuli and Pearl Harbor soils the alluvial
parent materials were predominantly kaolinitic. The minerals in
these soils clearly reflect the mineralogy of their source regIon,
although as has already been pointed out, there is some conversion
to montmorillonite.
Processes of Soil Formation
.The essential prerequisite for the formation of the Gray_
Hydromorphic soils is the presence of excess moisture in the soil

207
profile. The excess moisture in the profile creates a reducing
condition, and due to the vertical fluctuation of the water table
with seasons, the zone of reduction also fluctuates.
The major process of soil formation under reducing condi
tions is gleization. In the gleization process, two individual
processes are involved and they occur in two stages: ( 1) The
reduction of iron, manganese, and sulfur to their lowest valency
states where they form complexes· with organic chelates. This
chelated form of reduced substances gives a bluish tint to the
system. (2) The removal of organo-metallic chelates from the
reduced zone. Since in the Gray Hydromorphic soils the internal
drainage is poor, the rate of removal of materials is also very
slow.
The' process of gleization is similar to that of cheluviation
(Swindale and Jackson, 1956) in its basic aspects. In cheluvia
tion the reaction occurs in two stages such as complex formation
of iron and aluminum with organic chelates and then their subse
quent removal. The only difference between cheluviation and
gleization is that In the cheluviation process iron and aluminum are
not reduced before formatio~ of complexes with chelates; but in
the gleization process the elements are reduced first, which
increases their solubility, and then form complexes with organic
chelates. Another major difference between these two processes
is that the cheluviation process occurs in a very strongly acid

208
system, while the gleization process usually occurs under a
neutral to basic environment e
In the gleization process when the reduced elements come
In contact with the oxidized zone near the surface of the soil they
tend to oxidize and deposit as mottles. In addition, there is the
change from kaolinite to montmorillonite in the gleization process
due to the influence of high pH and high cation concentration in
the soil solution.
Explanation of the formation of the Gray Hydromorphic Soils of
Hawaii in terms of the process of gleization:
The effect of gleization in the present soils IS evidenced by
the presence of gley horizons in some of the profiles. An
examination of the morphological properties of these soil~ reveals
that the hue of the Honouliuli soil is SYR and the hues become
more and more yellowish-blue as one moves from Honouliuli
towards Nohili. This is an indication of an increasing degree of
wetness from Honouliuli to Nohili in the following order:
Honouliuli~Pearl Harbo~Kalihi~Laie~K aloke>+Nohili
~ ~Less Reduced More Reduced
The Honouliuli soil belongs to the Gray Hydromorphic group
because of its darker color. The hue and value of its color do
not change throughout the profile. This soil shows sticky and
plastic properties in the field. Thus, in physical properties it IS
more closely related to the hydromorphic soils but in mineralogical

209
properties it is closer to the Low Humic Latosols. The effect
of the process of gleization is very weakly expressed in this soil D
This is due to the fact that the free iron and manganese oxide
contents do not change with depth. This is because the drainage
impedance, in this soil, is not due to a regional permanent water
table but to the presence of a temporary perched water table.
In the Pearl Harbor, Kalihi, Laie, Kaloko, 'and Nohili
soils the features of the process of gleization are very clearly
expressed. In all these soils there is a distinct zone of reduction
in the subsoil horizons. The upward limit of this permanently
reduced zone varies from soil to soil and depends on other factors
such as texture and structure. The amount of free iron and
manganese oxides in the reduced zone is low. The concentration
of these oxides increase near the surface. This shows that in
the gleization process iron and manganese are leached out of the
profile.
Gley horizons are found in the Kalihi, Kaloko, and Nohili
soils only. The color of these horizons is bluish green. The
hues are from 2.5Y to lOG. Most of them are reversible gleys.
Only two horizons (IIIC1G and IIIC2G of the Kaloko soil) show
some signs of partial irreversibility of color.
Above the gley hOi"izons are mottled horizons. These
mottles are an indication of a fluctuating water table. Free iron
oxide is higher in the mottled zone than in the gley horizon.
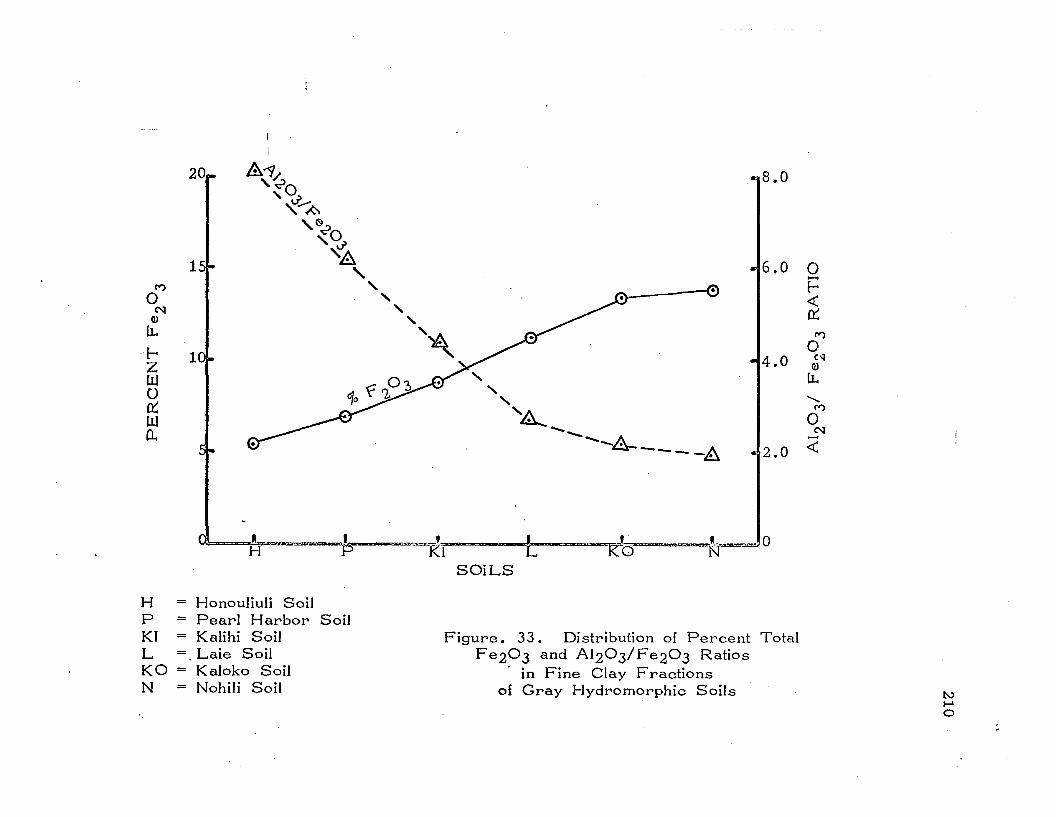
-.8.020_ A"1/.':';;>0'~.-~
6.0 0-
'~-2
f--
,~
• «
~
~
,t"')
1 ,
0
,
C\I
.,
4.0 Q)
t"')
,
lL.
0
'"C"I
........
Q)
t"')
lL
"0
,C"I
.f-- 1
",---
Z
~
2.0 «
LI.l
...... -- ......-8------8
0~LI.l0..
lI' ,...... = ~ =-_'. I IH KI L Kb N=a=-..=J 0
SOILS
H = Honouliuli SoilP = Pearl Harbor SoilKI = Kalihi SoilL = Laie SoilK° = K aloko SoilN· = Nohili Soil
Figure. 33. Distribution of Percent TotalFe203 and A1203/Fe203 Ratios
in Fine Clay Fractionsof Gray Hydromorphic Soils N
......o

211
The mottles ultimately disappear as the epipedons are approached.
From the field report it appears that all the gley horizons
In the soils investigated had a ma~sive structure at the time of
sampling. This is in conformity with the observation by
Zavalishin (1928) and Rode (1962) that the absence of any struc
ture 1S an important characteristic of giey soils.
Another interesting fact of hydromorphic soils is that the
amount of iron in the clays increases with increasing degree of
hydromorphism (Fig. 33). This is an indication that iron is
more active under reducing conditions than under oxidizing condi
tions. The gradual lowering of the A1203/Fe203 ratio in fine
clays indicate that the relative activity of iron compared to alumi
num, in the poorly-drained soils, is high and participates more
frequently in the formation of secondary clays, particularly iron
rich montmorillonites.

212
CLASSIFICATION OF THE SOILS
The best way of establishing an interrel~tionship between
one soil "group and another and among the members of the same
group is to place them in a classification system. With this end
in view the present soils were classified according to the U. S •D.A •
Comprehensive Soil Classification System (7th Approximation,
1960), as amended in May, 1965, and April, 1966.
Classification According to the Present System
The Honouliuli and Pearl Harbor soils are closely related in
their nature of parent materials. Both of them have metahalloysite
as the dominant clay mineral, but in the Pearl Harbor soil the
montmorillonite content is higher than that of the Honouliuli (Table
XXIII) • Cation exchange capacity is higher in the Pearl Harbor
soil than In the Honouliuli (Table VI). From the mineralogical
composition it appears that the Honouliuli soil grades toward a Low
Humic Latosol while the Pearl Harbor soil tends to be more
hydromorphic in character.
The Kalihi soil may be regarded as a transitipn between
Pearl Harbor on one side and Laie on the other. Both the Kalihi
and Laie soils have similarities in morphological properties. In
both soils a part of the parent material was derived £rom.
hydrothermally-altered rocks. Both soils are devoid of any
calcareous material in the profile and the pH is below 7.0 (Table

213
V} • The Laie soil has a higher amount of montmorillonite than
the Kalihi soil but the cation exchange capacity of the latter IS
higher than that of the former. The base saturation in the Laie
soil IS much higher than that in the Kalihi soil (Table VIII). On
this basis the Laie soil may be thought to have a mollie epipedon
while the Kalihi soil has an umbric epipedon.
Both Kaloko and Nohili soils have calcareous materials in
their profiles. This may amount to about 40% or more CaC03
equivalent in some lower horizons of these two soils. The Kaloko
soil is shallower than the Nohili soil. Both of these soils have
high pH. The cation exchange capacity of the Kaloko soil is
lower than that of the Nohili soil because of the presence of the
higher amount of calcareous material. The base saturation in
both soBs is very high. Both these soils have gleyed horizons In
their profiles. In both Kaloko and Nohili soils montmorillonite is
the dominant mineral.
Among the soils included in this study there is a gradation
of properties from weakly hydromorphic ( Honouliuli) to very
strongly hydromorphic (Nohili). The soils may be arranged on
th~ basis of increasing degree of hydromorphism as follows:
Honouliuli < Pearl Harbor < Kalihi <. Laie <. Kaloko < Nohili.
All the soils studied in this project fall into two orders of
the 7th Approximation. They are Inceptisol and Mollisol. Table
XXIV shows the classification of the present soils according to

Table XXIV. The Classifibation of the Six Gray Hydromorphic SoilsAccording to the U. S .0.A. Comprehensive Soil Classification System
SOILSCategories Honouliuli Pearl Harbor Kalihi Laie. Kaloko Nohili
Order Inceptisol Inceptisol Inceptisol Inceptisol Mollisol Mollisol
Suborder Tropept Aquept Aquept Aquept Rendoll Rendoll
Great Group Ustropepts Tropaquept Tropaquept Tropaquept To be To beestablished established
Subgroup
Family
Series
Typic Typic Typic TypicUstropepts Tropaquept Tropaquept Tropaquept
Very fine Fine, mixed Very fine -- Fine, Fine,mixed isothermic mixed carbonatic, carbonatic,isothermic isothermic isothermic isothermic
Honouliuli Pearl Harbor Kalihi Laie Kaloko' Nohili(Poorlydrained)
I:oV.....~
215
the categories of the Inceptisol and MoIlisol. It was found that
the classification system is insufficient to classify all the soils up
to the series level.
On the basis of chroma of the cambic horizon, the Pearl
Harbor soil. very narrowly comes under the Aquept suborder.
Its position borders between the Aquept and Tropept suborders.
But the typical profile (poorly drained) of the Pearl Harbor
series agrees well with the definition of an Aquept and hence it
was put in this suborder.
Proposed Modification
To fit the present soils- into the 7th. Approximation a modifi
cation of the classification scheme was proposed. The modifica
tions in the categories are given below.
The Pearl Harbor, Kalihi and Laie series, according to
their morphological properties, are all Typic Tropaquept. But
these three soils differ in their base saturation and mineralogical
composition quite sharply from one another. Base saturation in
the Kalihi soil is less than SO percent, while in the Pearl Harbor
and Laie soils base saturation is much higher. On the basis. of
the base saturation of their epipedon and cracking properties the
above three soils may be divided into three suborders. The
Kalihi soil which has an umbric epipedon has been regarded as
the Typic subgroup. In the Laie soil the epipedon shows the

216
characteristics of cracking during the dry season but not to the
extent to put it into the Vertisol Order. This soil is, therefore,
named as Ver~ic Tropaquept in the subgroup level. The Pearl
Harbor soil has been i"ncorporated into the Mollic Tropaquept
subgroup because of its high base saturation in the epipedon.
Great Group: Tropaquept. As defined in the Comprehensive
Soil Classification System.
Subgroups: Three subgroups are proposed under this great
group; namely, Typic, Mollic, and Vertic. They
are differentiated according to their base saturation
and cracking properties of the epipedon.
TypicTropaquept: Other Tropaquept with properties of the great
group and possesses the following:
( 1) an Umbric epipedon.
( 2 ) no epipedon which has any cracking properties
during the dry season if not irrigated ..
MollicTropaquept: Same as Typic except for (1).
VerticTropaquept: Same as Typic except for (2).
Again, the Pearl Harbor, Kalihi, and Laie soils differ in
their mineralogical composition. The dominant mineral In the
Pearl Harbor soil is metahalloysite, while montmorillonite IS the
dominant mineral in the Laie soil. The Kalihi soil occupies an

217
intermediate position between the above two soils. These soils
are, therefore, classified on the basis of dominant clay mineral
In the family level.
According to the present definition in the Comprehensive
Soil Classification System, both the Kaloko and Nohili soils fall
in the Mollisol Order.
Order: Mollisol. Same as in the Comprehensive Soil
Classification System.
Suborder: Randoll characterized by the following:
( 1) Lack an argillic horizon.
( 2 ) Lack a calcic horizon.
( 3 ) Lack a lithic contact immediately below the mollie
epipedon.
(4) Have a mollie epipedon not more than 20 inches
thick.
(5) Have a zone of CaC03 enrichment of 40 percent
or more in the cambic horizon.
The name Rendoll was derived from the soil name Rendzina,
which usually develops in temperate humid areas on calcareous
parent materials. For Rendolls in Hawaii, the name Troporendoll
on the great group level is proposed here.
Troporendoll: Other Rendolls that have less than a 9 0 F difference
between the mean summer and mean winter soil
temperatures at 20 inches depth, or at a contact

218
with an R horizon that may be shallower thari- 20
inches.
TypicTroporendoll: Other Troporendolls that,
( 1) Lack a lithic contact within 60 cms. of the
soil surface.
(2) Have less than 15 percent sodium saturation
in the upper 50 cms.
LithicTroporendoll : Same as Typic except for (1).
The classification of the present soils according to the
above modifications is presented in Table XXV.
Conclusion of the Study
Any soil may be. regarded as an open system; that is, it
may either lose or gain constituents. In the poorly-drained soils,
loss is minimal and gain is maximal.
Soil loses material by "erosion and leaching and gams
material by surface deposition, capillary action, and seepage.
Continuous enrichment in materials by the poorly-drained lowland
soils changes the concentration of different constituents in the sys-
tern. As a result the entire dynamics of the soil system changes
with time.
The increase in concentration of iron-rich montmorillonite
m the Gray Hydromorphic soils with increasing intensity of poor

Table XXV. Classification of Gray Hydromorphic SoilsAccording to the Proposed Modification
SOILSCateqories Honouliuli Pearl Harbor Kalihi
Order Inceptisol Inceptisol Inceptisol
Suborder Tropept Aquept Aquept
Laie
Inceptisol
Aquept
Kaloko
MolIisol
Rendoll
Nohili
MolIisol
Rendoll
GreatGroup Ustropepts Tropaquept Tropaquept Tropaquept Troporendoll Troporendoll
Subgroup TypicUstropepts
MollieTropaq~ept
Typic VerticTropaquept Tropaquept
LithicTroporendoll
TypicTroporendoll
Family I Very fine,mixedhalloysitic
Fine, mixedhalloysitic
Very fine,mixedisothermic
Fine, mixedmontmorillonitic
Fine, mixedcarbonatic
Very fine,mixedcarbonatic
Series Honouliuli Pearl Harbor Kalihi( Poorlydrained)
Laie Kaloko Nohili
tv~
\0

220
drainage suggests that post-depositional changes in these soils
are responsible for shaping the direction of miner'al equilibria.
In a residual soil, where there is no contamination of
secondary minerals from outside sources, the concentration of a
particular secondary mineral may indicate its formation in place.
But in soils developed from alluvium the problem is complicated
because there is no way of knowing the mineralogical composition
of soil materials at soil formation time zero. Over and above
this, there are the annual increments of mineral constituents from
all sides. This introduces another facto!' into the problem.
Kimura (1966) in his work on Lahaina soils in Hawaii
introduced the concept of "pedogenic convergence" for those
highly weathered soils. In essence, pedogenic convergence means
that under intense weathering conditions, the soils from different
parent materials may converge into similar soils at the end.
Among the Gray Hydromorphic soils of Hawaii, the Nohili soil
seems to be the most mature and stable. In order of decreasing
degree of maturity the present soils may be arranged as follows:
Nohili > Kaloko > Laie > Kalihi > Pearl Harbor. All these
soils are gradually changing towards the point where they will
ultimately· converge with the Nohili soil. Time was not sufficiently
long for the formation and convergence of these soiis.
The Honouliuli soil, on the contrary, does not show any
tendency of converging towards the direction of the Nohili soil. It

221
IS surprIsmg that the Honouliuli soil has preserved the original
chemical and mineralogical properties of its parent material for a
period of more than 38, 000 years. This lack of desire of
changing the properties of this soil has been explained on the basis
of the concept of "pedogenic hysteresis" (Milne, 1936).
In an attempt to throw light-on the relative stabilities of
secondary mica in some soils of Hawaii,. Juang (1964) mentioned
about "new concepts" on clay mineral formation. He was
obviously referring to the application of thermodynamical principles
to determine the .stabilities of minerals and the direction of reactions
m the soil system. Composition of secondary minerals IS guided
by the chemical potentials of all components in the system at the
time of mineral formation. Chemical potential is l"elated to the
effective concentration or activity of relevant components.
Montmorillonite forms in a complex environment where the activities
of silicon, aluminum, magnesium, and ferrous and ferric iron are
all important because all these elements may have a part in the
crystal lattice. Chemical analysis of clay minerals may, therefore,
give some clues as to the relative activities of different elements at
the time of formation.
The high content of iron in the montmorillonite of the present
solis, therefore, indicates the relative dominance or high chemical
potential of iron in the system during the formative time of this
mineral.
222
The same principle holds for the relative stabilities of
minerals present in the soil. The question arises as to whether
the montmorillonite in the Gray Hydromorphic. soils is stable e
The high base saturation and the presence of higher concentration
of Mg++ and Ca++ ions and the consequent high pH in the soil
solution is an indication of the stability of montmorillonite in these
soils.

223
SUMMARY
A study of soil formation from alluvium was undertaken to
shed some light on the genesis and characteristics of the Gray
Hydromorphic soils of- Hawaii with respect to change of drainage
conditions. Six Gray Hydromorphic soils which showed an
increasing degree of poor drainage were selected for this study.
The soils were:
Honouliuli Clay (moderately poorly drained)
Pearl Harbor Clay
Kalihi Clay
Laie Clay
Kaloko Clay
Nohili Clay (very poorly drained)
Soil samples; were collected from all the distinguishable
horizons of the above profiles and the mineralogical compositions
of the sand, silt, and clay fractions of individual horizons were
determined. A combination of methods was used for the purpose
of determining the percentages of minerals. The methods include
X- ray diffraction, differential thermal analysis, heating weight
loss studies, chemical analysis, and petrographic analysis.
The sand and silt fractions were composed mostly_ of
magnetite, rutile, hematite, anatase, plagioclase, and pyrite. In
general, the percentages of sand in these soils were comparatively

224
small. The particle size distribution data indicate that all the
soils are "Clay" in the textural classification. The amount 'of
clay ranged from 59 to 93 percent.
In the moderately-drained soils metahalloysite was the
dominant material while in the very poorly-drained ones mont
morillonite was the dominant mineral. Other soils showed a
gradation of mineral properties.
In all the soils, metahalloysite decreased with depth while
montmoroillonite showed an increasing trend. This suggested that
the clays in different horizons of these soils were genetically
related to the present cycle of pedogenesis.
Small amounts of mica and quartz were found in the coarse
fraCtions of the Laie and Kalihi soils. The presence of these
minerals was explained by the fact that these two soils are located
near areas that were hydrothermally altered and it is suggested
that the quartz and mica in these two soils were brought from the
hydrothermally-altered rocks by the agencies of transport.
All the Gray Hydromorphic soils have high cation exchange
capacities except the Honouliuli where the eEoC is comparatively
small. The Kalihi soil has the highest eEoC values among the
soils which is due to the poor order of crystallization of meta
halloysite clays. The bas~ saturation in all the Gray Hydromorphic
soils are high (above 50%). Only the Kalihi soil has a base
saturation lower than 50% in some horizons.

225
The reaction in the Gray Hydromorphic soils is alkaline.
The only soil which has an acidic reaction is the Kalihi soil.
pH values obtained with N KCI solution were consider-ably below
those obtained with water. It was not clear why bpH (pH in N
K CI- pH in H 20) was high in cases where the base saturation
was 100 percent~.
Organic matter In the Gray Hydromorphic soils are
generally high in other parts of the world but in the soil:; studied
the organic matter does not exceed more than 5 percent near the
surface. The average organic matter content of Gray Hydro
morphic soils are higher than that in Dark Magnesium Clays.
Free iron and manganese oxides tend to leach out of the
gley horizons In the intensely hydromorphic soils, but in the less
hydromorphic soils there was no profile differentiation of these
oxides in the profile. The amount of free iron oxide decreased
from least to most hydromorphic members of this hydrologic
sequence.
Total aluminum and iron oxides in the deferrated fine clay
fraction showed a reverse relationship. In the least hydromorphic
soils aluminum oxide in the fine clay fraction was high and
decreased as the soils became more hydromorphic. Iron oxide
in the clay fraction showed an opposite trend to that of aluminum
oxide.
On the basis of the Si02/R203 ratios of the clay fractions,

226
the soils investigated were divided into two groups:· (a) Honouliuli,
Pearl Harbor, and Kalihi soils, where the ratio was less than
2.50; and (b) the Laie, Kaloko, and Nohili soils, where the
Si02/R203 ratio was above 2.50.
Gleization was considered to be the major soil-forming
process in the Gray Hydromorphic soils. Gleization consists of
two steps: ( a) The reduction of inorganic substances which is
accentuated by the presence of organic matter and (b) the forma
tion of complexes between the reduced inorganic and organic
substances and their subsequent movement. There is some pre
cipitation of iron and mangan~se when these are oxidized by
diffusion of oxygen from the surface horizons.
The diagnostic feature of gleization process is the develop
ment of a gley horizon in the subsoil zone. Among the present
soils the gley horizons were found to be present in the highly
hydromorphic soils only. Both reversible and irreversible types
of gleying were observed. It was concluded that the Gray
Hydromorphic soils under study ranged from young to mature In
their profile development.
The absence of change In the properties of the Honouliuli
soil was considered to be an example of "pedogenic hysteresis".
All other soils of this group showed signs of "pedogenic conver
gence" in their morphological and mineralogical properties.
The formation of secondary minerals in the present soils

227
was discussed under three headings: ( a) synthesis of
montmorillonite clays in the soils; (b) transformation of kaolinite
and ha1l6ysite to montmorillonite by resilication and vice versa;
and (c) the stability of minerals in the present soils.
A structural formula of the montmorillonite clay present in
the IIICca horizon of the Nohili soil was calculated on the basis
of chemical analysis. The following formula was obtained:
(XO. 74KO.11) (Si7 • S2AIO.48 )IV (All. 8SFe1.66M90. 3STiO.10) VI
°20(OH)4
This mineral is an iron-rich .montmorillonite or nontronite.
The surface area of this montmorillonite was calculated to be 720
m 2/gram of clay. The cation exchange capacity of this clay was
calculated to be 94 me/100 grams.
The present study revealed that the Gray Hydromorphic
group of soils is not homogeneous. The soils were, therefore,
reclassified according to the New System of Classification. The
classification may be given as follows:
Soil Names Soil Subgroups
1- HonouIiuIi Clay Typic Ustropept
2. Pearl Harbor Clay Mollie Tropaquept
3. Kalihi Clay Typic Tropaquept
4. Laie Clay Vertic Tropaquept
S. Kaloko Clay Lithic Troporendoll
6. Nohili Clay Typic Troporendoll

228
LITERATURE CITED
Abbott, A. T. 1958. Occurrence of gibbsite on the island ofKauai, Hawaiian islands. Econ. Geol. 53:842-853.
Aguilera, N. H. and Jackson, M. L. 1953. Iron oxideremoval from soils and clays. Soil Sci. Soc. Amer.Proc. 17:359-364; 18:223 and 350 (1954); as modified byMehra and Jackson (1956).
Ahmed, S •. 1965. Effects of Adsorbed Cations .Q.!1 the PhysicalProperties of Soils Under Arid Conditions. Ph. D. Thesis,Univ. of Hawaii, Hono.lulu.
Alexander, L. T., Hendricks, S. B. and Faust, G. T. 1941.Occurrence of gibbsite in some soil forming materials.Soil Sci. Soc. Amer. Proc. 6:52-57.
Anderson, E. K., Tomlinson, T. E., Vahtras, K., and"Wiklander, L. 1955. Studies on Gytija soils: Descriptionof a hydrologic profile serIes. Kungl. Lantbrukshogs KolansAnnaler. 22:279-295.
Arneman, H. F. and McMiller, P. R. 1955. The physicaland mineralogical properties of related Minnesota prairiesoils. Soil Sci. Soc. Amer. Proc. 19:348-351.
Ayres, A. S. 1943.Hawaiian islands.No.1. pp 41.
Soils of the high rainfall areas in theHawaii Agric. Expt. Sta. Tech. Bull.
Barshad, I. 1964. Chemistry of soil development. Chemistrvof the Soil. F. E. Bear (ed.). Reinhold PublishingCorporation, New York.
Bates, T. F.Hawaii.
1960. Rock weathering and clay formation In
Mineral Ind. 29:1-6.
Bates, T. F. 1962. Halloysite and gibbsite formation in Hawaii.Clays and Clay Minerals. Proc. Ninth NatI • Conf. Claysand Clay Minerals 9: 315-327.
Bidwell, O. W. and Page, J. B. 1951. The effect ofweathering on the clay mineral composition of soils in theMiami catena. Soil Sci. Soc. Amer. Proc. 15: 314-318.
229
Blomberg, N. and Holmes, W. E. 1959. The carbon-nitrogenratios in some Hawaiian soils. Hawaii Agric. fum. StaGTech. Prog. Rept. 122. pp 7.
Bloomfield, C. 1949. Gleying. Soils and Ferts. 12: 319-321.
Bloomfield, C.formation.
1951. Experiments on the mechanism of gleyA. Soil Sci. 2:196-211.
Bloomfield, C. 1952. The distribution of iron and aluminumoxides in gley soils. J. Soil Sci. 3:167-171.
Bloomfield, C. 1954. A study of podzolization; HI. The mobilization of iron and aluminum by rimu. A. Soil Sci. 5: 3945.
Bloomfield, C. 1955. Le deplacement des sesquioxides et del'argile dans Ie sol - gleyfication. Sols Africains. 3 :488-506.
Bloomfield, C. 1959. Experiments on gleying. New ZealandSoil News 2: 39-42.
Brewer, R. 1964. Fabric and Mineral Analysis of Soils.John Wiley and Sons, Inc., New York.
Bromfield, S. M. 1954. The reduction of iron oxide bybacteria. A. Soil Sci. 5:129-139.
Bunting, W. E. 1944. The determination of soluble silica invery low concentration. Ind. Eng. Chern. Anal. Ed.16:612-615.
Cady, J. G.. 1960. Mineral occurrence in relation to soilprofile differentiation. Trans. 7th Inti. Congr. Soil Sci.IV: 418-424, Madison, Wisconsin.
Cline, M. G. etal. 1955. Soil Survey, Territory of Hawaii.u. S. Dept. Agric., Soil Survey Series 1939, issued1955.
Coleman, N. T. ,Weed, S. B., and McCraken, R. J. 1959.Cation exchange capacities and' exchangeable cations in thepiedmont soils of North Carolina. Soil.§.ci. Soc. Amer ..Proc. 23:146-149.
230
Correns, C. W. 1962. Formation and transformation of clayminerals during the decomposition of basalts. Colloq. IntI.Centre AatI. Res. Sci. (Paris). No. 105:109-120.
Crompton, E. 1952. Some morphological features associatedwith poor soil drainage. 1.. Scil Sci. 3:277-289.
Crompton, E. 1960. The significance of weathering/leachingratio in the differentiation of major soil groups, with particular reference to some very strongly leached brown earthson'the hills of Britain. Trans. 7th IntI. Congr. Soil Sci.IV: 406-412, Madison, Wisconsin.
Daniels, R. B., Brasfield, J. F., and Riecken, F. F. 1962.Distribution of sodium hydrosulfite extractable manganese In
some .Iowa soil profiles. Soil Sci. Soc. Amer. Proc.26:75-78.
Dean, L. A. 1930.pineapple soils.
Nitrogen and organic matter in HawaiianSoil Sci. 30:439-442.
Dean, L. A. 1938. The effect of rainfall on carbon andnitrogen contents and carbon: nitrogen ratios of Hawaiiansoils. Soil Sci. Soc. Amer. Proc. 2:455-459.
De Vore, G. W. 1959. The surface chemistry of feldspar asan influence on their decompositi'on products. Proc. 6thN atI. Conf. Clays and Clay Minerals. pp 26-41. Berkeley,Cal~fornia.
Dion, H. G. and Mann, P. J. G. 1946. Three valent manganese in soils. J. Agric. Sci. 36:239-245.
Dokuchaev, V. V. 1898. Akademia Nauk. Moscow 6: 381(1951). (As reported by Jenny, 1961).
Dunham, K. C. 1933.Hawaiian islands.
Crystal cavities in lavas from theAmer. Mineral. 18:369-385.
Ewart, G. 1960. Reclamation and soil improvement at KekahaSugar Co., Ltd. Unpublished Report.
Fieldes, M. and S windale , L. D.of silicates in soil formation.36B: 140-154.
1954. Chemical weatheringN. Z. 1.. Sci. and Tech.

231
Fieldes, M. 1959. Gley soils. N. z. Soil News. 2:47-48.
Fujimoto, C. K. and Sherman, G. D. 1948. Behavior ofmanganese in the soil and the manganese cycle. Soil Sci.66:131-145.
Gill, W. R. and Sherman, G. D. 1952. Properties of theGray Hydromorphic soils of the Hawaiian islands. PacificSci. 6: 137-144.
Glentworth, R. and Dion, H. G. 1949. The association orhydrologic sequence in certain soils of the podzolic zone ofnortheast Scotland. J.Soil Sci. 1:35-49.
Glinka, K. D. 1932. Pochvovedenie (Pedology). Edition 5.Moscow.
Halvorson, H. O. and Starkey, R. L. 1927. Studies on thetransformation of iron in nature. 1.. Phys. Sci. 31 :626-631.
Halvorson, H. O. 1931. Studies on the transformation of ironin nature: The effect of C02 on the equilibrium in ironsolutions. Soil Sci. 32: 141-165.
Hardon, H. J. 1950. The bases in the clay fraction of Indonesiansoils. Trans. Fourth Inti. Congr. Soil Sci. 1:310-312.
Harrison, J. B. 1933. Katamorphism of Igneous Rocks UnderHumid Tropical Conditions. Imp. Bur~ Soil Sci., Harpenden,England.
Hinkley, D. N. 1965. Mineralogical and chemical variation inthe kaolin deposits of the coastal plain of Georgia and SouthCarolina. Amer. Mineral. 50:1865-1883.
Holowaychuk, N. 1953. Clay Mineral Studies of the Miami,Hermon, and Worthington Catenas. Ph.D. Thesis, OhioState .Univ., Columbus.
Hurwitz, C. 1948. The effect of temperature of incubation ofamended soil on exchangeable manganese. Soil Sci. 66: 267272.
l:wasa, Y. 1959. On the siderite concentration In paddy soils.Pedologist. 3: 53-58.

232
JaCkson, M. L. et al. 1948. Weathering sequence of clay-sizeminerals in soils and sediments: Fundamental generalizations • .J. Phys. and Colloid Chern. 48:1237-1260.
Jackson, MoL 0 19560 Soil Chemical Analvsis: AdvancedCourse. Univ. of Wisconsin, Madison.
Jackson, M. L. 1960. Soil Chemical Analysis. Prentice Hall,Inc., Englewood Cliffs, N. J. pp 82-110.
Jackson, M. L. 1965. Clay transformation In soil genesIs duringthe quaternary. Soil Sci. 99: 15-22.
Jeffery, J. W.O. 1960.. Iron and the Eh of waterlogged soilswith particular reference to paddy. J. Soil Sci. 11: 140-148.
Jenny, H. 1941. Factors of. Soil Formation. McGraw HillBook Co., New York.
Jenny, H. 1961. Derivation of state-factor equations of soils and·ecosystems'•. Soil Sci. Soc. Amer. Proc. 25:385-388.
Joffe, J. S. 1935. Soil profile studies: VII. The glei process.Soil Sci. 39: 391-401.~·---- .
Joffe, J. S. and Pugh, A. J. 1934. Soil profile studies: VI.Distribution of titanium in soils with special refer-ence topodzols. Soil Sci. 38:245-257.
Joffe, J. S. 1949. Pedology. Pedology Publications, NewBrunswick, N. J •
Juang, T. C. 1965. Genesis of Secondarv Micas from Basaltsand Related Rocks in the Hawaiian Islands. Masters Thesis,University of Hawaii, Honolulu.
Kalakutskii, L. V. and Duda, V. I. 1961. Role of microorganisms in iron reduction in the soil. Nauch. DokladyVysshii Shkoly. BioI. Nauki. 1: 172-176. (Chern. Abst.55 (7) ).
Kamoshita, Y. and Iwasa, Y. 1959. Rusty mottles In paddy fieldsoils. Nippon Dojo Hir. Zasshi. 30: 185-188.

233
Kanehiro, Y. and Chang, A. T. 1956. Cation exchangeproperties of the Hawaiian great soil groups. Hawaii Agric.Em. Stat Tech. Bull. No. 31.
Karim, A 0 19530 The pedological significance of titanium 0 J 0
Soil Sci. 4:56-58.
Kelley, W. P. 1945. Calculating formulas ~or fine-grainedminerals on the basis of chemical analysis. ArneI'. Mineral.30:1-26.
Kerr, P. F. 1955. Formation and occurrence of clay minerals.In Clays and Clay Technology. Proc. First Natl. Conf.Cla...~§. and Clay Tech. J. A. Park et ale (ed), Dept.Nat. Res. pp 19-32.
Kilmer, V. J. 1960. Estimation of free iron.oxide In soils.Soil Sci. Soc. Amer. Proc. 24:420-421.
Kimura, H. S. 1966. A Study of Lahaina~ Clay SoilsForming From Different Parent Materials. Masters Thesis,Univ. of Hawaii, Honolulu. '
Longhry, F. G. 1960. Quantitative relationship of soil mottlingto natural soil drainage profiles. Diss. Abstr. 21: 2429.
Macdonald, G. A., Davis, D. A., and Cox, D. C. 1960.Geology and ground water resources of the island of Kauai.Bull. 13. Hawaii Div. Hydrology.
Macdonald, G. A. and Katsura, T. 1964. Chemical composition of Hawaiian lavas. 1. Petrol. 5 :82-133.
Mann, P. J. G. and Quastel, J. H. 1946. Manganese metabolism in soils. Nature. 158: 154-156.
Masui, J. 1959. Clay minerals in paddy soils from tertiarypumicious tuff. at Matsushina District, Miyagi. Nippon DojoHirogaku Zasshi. 30: 443-448.
McKeague, J. A. 1965. A laboratory study of gleying. Can.1. Soil Sci. 45:199-206.
McLean, W.matter.
1960. The carbon-nitrogen ratio ot soil orgamc1. Agr. Sci. 20:348-354.

234
Miller, R. B. 1959. Some reflections on gleying. N. z.Soil News. 2: 56-58.
Milne, G. 1936. A provisional soil map of East Africa.. EastAfrica Agr. Res. Sta. Amani Memoirs. pp 34.
Moberly, R. i963. Amorphous marine muds from tropicallyweathered basalt. Amer. 1.. Sci. 261:767-772.
Mohr, E. C. J., and Van Baren, F. A. 1959.N. V .. Uitgeverij W. Van Hoeve, The Hague.
Tropical Soils.pp 179-211.
Mollot, G. 1953. Heritage et neoformation dans la sedimentationargileuse. Congres Geol. Int. Fascicule 18: 163-175.
Mortimer, C. H. 1941. The exchange of dissolved substancesbetween mud and water in lakes. 1,. Ecol. 29 :280-329.
Neustreuev, S. S. 1927" The Classification Problem in SoilScience by J. N. Afanasiev. Russ. Ped.· Invest., Academy of Sciences, Leningrad.
Nye , P .. , Craig, D., Coleman, N. T., and Ragland, J. L.1961. Ion exchange equilibrium involving aluminum. SoilSci. Sod. Amer. Froc. 25: 14-17 •
Ponnamperuma, F. N. 1955. The Chemistry of SubmergedSoils in Relation to the Growth and Yield of Rice. Ph. D.Thesis, Cornell University.
Piper, C. S. 1950. Soil and Plant Analysis. InterseiencePublications Inc., N. Y •
Polynov, B. B. 1937. The Cycle of Weathering. ThomasMurby and Co., London.
Quispel, A. 1947. Measurement of oxidation-reduction potential ofnormal and inundated soils. Soil Sci •. 63-265-283.
Raymundo, M. E. 1965. The Properties of the Black Earthsof Hawaii.. Ph. D. Thesis, Univ. of Hawaii, Honolulu. .
Rex, R. W. and Goldberg, E. D. 1958. Quartz contents ofpelagic sediments of the Pacific Ocean. Tellus 10: 153-157.
Richards, L. A. and ·Weaver, L. R. 1944. Moisture retentionby some irrigated soils as related to soil moisture tension.
1. Agr. Res. 69:215-235.
235
Roberts, J. L. 1947. Reduction of ferric hydroxide by strainsof ,bacillus polymyxa. Soil Sci. 63: 135-140.
Robinson, G. W.Classification.Co., London.
1951. Soils - Their Origin, Constitution andpp 351-378, 431-463. Thomas Murby and
Robinson, W. O. 1930. Some chem'ical phases ofc~ submergedsoil conditions. Soil Sci. 30:197-217.
Rode, A. A. 1962. Soil Science {Pochvovedenie}. Translated from Russian. National Science Foundation,Washington, D. C.
Ruhe, R. V. 1960. Elements of the soil landscape. Trans.7th IntI. Congr. Soil Sci. IV:165-170. Madison, Wisconsin.
Ruhe, R. V., Williams, J. M., Shuman, R. C., and Hill,E. L. 1965. Nature of soil parent materials in EwaWaipahu area, Oahu, 'Hawaii. Soil Sci. Soc. Amer.Proc. 29:282-287.
Sarver, L. A. 1927. The determination of ferrous iron In
silicates. . J ~ Amer. Chern. Soc. 49: 1472-1477.
Saunders, w. M~ H. 1959. On gleying. N. Z. Soil News2:58-60.
Sa,whney, B. L. and Jackson, M. L. 1958. Soil montmorillonite formulas. Soil Sci. Soc. Amer. Proc. 22: 115-118.
Schafer, G. M. and Holowaychuk, N. 1958. Characteristicsof medium and fine-textured humic-gley 'soils of Ohio. Soil.Q.ci.. Soc. Amer. Proc. 22: 262-267.
Schuylenborgh, J. V. 1965. The formation of sesquioxides insoils. In Experimental Pedology. E. G. Hallsworth and
~ D. V. Crawford (Ed.), London. pp 113-125.
Shapiro, L. and Brannock, W. W. 1956. Rapid analysis ofsilicate rocks. u. S. Geol. Surv. Bull. 1036-C.
Shapiro, L. and 'Brannock, W. W. 1962. Rapid analysis ofsilicate, carbonate and phosphate rocks. u. -S.. Geol.Surv. Bull. 1144-A.

Sherman, G. D. 1952.and its significance.18.
236
The titanium content of Hawaiian soilsSoil Sci. Soc. ArneI'. Proc. 16: 15-
Sherman, G. D. and Uehara, G. 1956. The weathering ofolivine basalt in Hawaii and its pedogenic ,significance.Soil Sci. Soc. ArneI'. Proc. 20:337-340.
Sherman, G. D., Ikawa, H., Uehara, G", and Okazaki, E.1962. Types of occurrence of nontronite and nontronite-likeminerals in soils. Pacific Sci. 16:57-62.
Shirazi, G. A. 1965. Salinitv Status of Some SelectedHawaiian Soils. Masters Thesis, Univ. of Hawaii, Honolulu.
Sibirtzev, N. M. 1914. From Die Typen Del' BodenbildungK. D. Glinka, Berlin. pp 27-28.
Sinta, J. 1960. Preliminary investigations of the gleying process in the alluvial soils zulaury. Chern. Abst. 24: 1898.
Smith, W. M. 1958. Ph.D. Thesis, Univ. Aberdeen, England.
Soil Survey Staff.Handbook 18.
1951. Soil survey manual. U.S.D.A.U. S. Govt. Printing Office.
Soil Survey Staff. 1960. son Classification: A ComprehensiveSystem, 7th Approximation. U. S. Govt. Printing Office,Washington, D. C.
Starkey, R. L. and Wight, K. M. 1945. Anaerobic Corrosionof Iron in Soil. ArneI'. Gas Assoc., New York.
Stearns, H. T. and Vaksvik, K. N. 1935. Geology andground water resources of the island of Oahu. U. S. Geol.Sury. Bull. No.1. Honolulu, Hawaii. -.
Stout, J. D. 1959. Gleying - a microbial viewpoint. N. z.Soil News 2: 50-52.
Sudo, T. and Ota, S. 1952. Iron-rich montmorillonite fromOya-Ishi. .J. Geol. Soc. (Japan) 58:487-490.
Swindale, L. D. and Jackson, M. L. 1956. Genetic processesin some residual podzolised soils of New Zealand. Proc.6th Inti. Cong. Soil Sci. 5: 233-239.
237
Swindale, L. D. 1956. A report on a one-dimensional fourierinvestigation of a soil montmorillonite 0 Unpublished Report.
Swindale, L. D. 1959. On gleys and gleying. No Zo SoilNews 2:53-54.
Taylor, N. H. 1959. Some points for discussion. N. Z.Soil News 2: 43-45.
Thorp, J. and Smith, G. D. 1949. Higher categories of soilclassification: Order, suborder and great soil groups.Soil Sci. 67:117-126.
Uehara, G., Ikawa, H., and Sherman, G. D. 1966. Desilication of halloy~ite and its relation to gibbsite formation.Pacific Sci. 20: 119-124.
Vilensky, D. G. 1927. Concerning the principles of a geneticsoil classification. Contributions te' the study of the soils ofUkrainia. 6: 129-151.
Vysotskii, G. N. 1950.Influence of Forests.and Paper Industry.
Hydro-Geologiqal and MeteorologicalU •S . S •R. Publ. House • Forestry
Walker, J. L. and Sherman, G. D. 1962. Determination oftotal ferrous iron in soils. Soil Sci. 93: 325-328.
'Walkley, A. and Black, I. A. 1934. An examination of theDegijareff method for determining soil organic matter, and aproposed modification of the chromic acid titration method.Soil Sci. 37:29-38.
Weaver, C. E. 1956. A discussion on the origin of clayminerals in sedimentary rocks. In Clays and Clay MineralsFifth NatI. Conf. on Clays and Clay Minerals. No. 566 :156-173.
Wentworth, C. K. 1951. Geoloav and Groundwater Resourcesof the Honouliuli - Pearl Harbor A.rea, Oahu, Hawaii.Board of Water Supply, Honolulu.
'White, J. L., Baily, G. W. and Anderson, J. U. 1960. Theinfluence of parent material and topography on soil genesisin the midwest. Purdue &x.. Em. Sta. Res. Bull. ~.

238
Whitehous~, .U. G. and Jeffrey, L. M. 1955. Peptizationresistan~e of selected samples of kaolinitic, montmorillonitic,and illitic clay minerals. Clays and Clay Minerals. Natl.Acad. Sci. Publ. 395:260-281
Wiklander, L. et ale 1950. Studies on gyttja soils: Somecharacteristics of two profiles from northern Sweden.Annal. Roy. Agr o Coll. Sweden 17: 24-36.
\J\Torrall, W. E. and Cooper, A. E.sition of a disordered kaolinite.pp 1.
1966. The ionic compoMineral. Soc. Cir. 80.-- -- --
Yamasaki, T. and Yoshizawa, T. 1961. Ferrous carbonateconcretions in paddy soils in Japan: I. Occurrence, constituents of ferrous carbonate, deposition and me~hanism oftheir formation. Ho Kuriku Nogyo Shikenjo Hokoku. 2: 1-6.
Yarkov, S. P. et ale 1950. The formation of ferrous ironand the peculiarities of the phosphate regime in sodpodzolized soils. Pochvovedenie 466-475.
Zavalishin, A. A. 1928. Several observations on soils with aclose glei horizon. From K. D. Glinka. Leningrad Inst.Agr. pp 45-90

239
APPENDIX
MORPHOLOGICAL DESCRIPTION OF SOILS
Horizon
821
DepthInches
0-24
24-35
MorphologyHonouliuli Clay
Dark reddish-brown (5YR 3/1) clay, dark
reddish brown (5YR 3/2) when moist,
moderate fine and medium granular structure;
hard, firm, very sticky, very plastic; many
fine and medium roots, common fine inter-
stitial pores; also some mixing by deep culti-
vation of horizon below; moderate fine and
medium subangular blocky structure - may
be nearly massive due to mechanical compac-
tion when wet; hard fine tubular pores; few
black carbon specks; few light-colored sand
grains; few shiny specks (magnetite); few
manganese concretions; moderate reaction with
hydrogen peroxide, clear smooth boundary.
Dark reddish brown (5YR 3/3) clay, dark
reddish brown (5YR 3/3) when moist;
moderate medium subangular blocky structure;
hard friable, sticky, very plastic; many fine
and medium roots; few fine tubular pores;
few light-colored sand grains; few shiny

Horizon
822
Cl
DepthInches
35-43
43-53
240
Morphology
specks (magnetite); common manganese con-
cretions; few block stains in root channels
(manganese and organic) few rounded gravels
1/8 to 1/4 inch in diameter; moderate
-reaction with hydrogen peroxide; clear
smooth boundary.
This horizon was separated for sampling;
however, no significant physical difference
could he determined in the field.
Dark reddish-brown (5YR 3/3) clay, dark
reddish brown (5YR 3/3) when moist;
moderate medium subangular blocky breaking
to fine subangular blocky structure; h'ard,
friable, very sticky, very plastic; many fine
and medium tubular pores; many moderate
deeply-grooved slickensides oriented at about
20-30 degrees with the surface; few light
colored sand grains; few shiny specks
(magnetite); few rounded gravel 1/8 to 1 inch
in diameter; common manganese concretions;
strong reaction with hydrogen peroxide; clear
smooth boundary.

Horizon
C2
A1
822g1
DepthInches
53-80+
0-6
6-11
241
Morphology
Dark reddish brown (5YR 3/3) clay, dark
reddish brown (5YR 3/3) when moist;
moderate fine and medium subangular blocky
structure; hard, friable, very sticky, very
plastic; few fine matted roots; few fine
tubular pores; many strong deeply-grooved
slickensides oriented· at 20 to 35 degrees
from the surface; few light-colored sand
grains; few shiny specks (magnetite); com-
mon manganese concretions; few rounded
gravel 1/8 to 1/4 inch in diameter; strong
reaction with hydrogen peroxide.
Pearl Harbor Clay
Dark reddish brown (5YR 3/3) clay, dark
brown (7. 5YR 3/2) when moist; strong fine
and medium subangular blocky to granular
structure; hard, firm, sticky and plastic;
many fine and medium roots; many worn-cast
roots; common manganese concretions;
reaction with hydrogen peroxide; mottling not
detectable with unaided eye; abrupt boundary.
Dark reddish gray (SYR 4/2) clay, dark

Horizon
822g2
IIClg
DepthInches
11-16
16-23
242
Morphology
reddish brown (5YR 3.5/3) to reddish brown
when moist; moderate to strong medium sub-
angular blocky structure; hard, firm, sticky
and plastic; very few roots; common large
pores; many medium distinct mottles of
yellowish red, (5YR 5/6) color; few manga-
nese concretions; moderate reaction with
hydrogen peroxide; clear boundary.
Dark reddish brown (5YR 3/3) clay, dark
brown (7. 5YR 4/3) when moist; moderate
coarse blocky structure breaking to fine
blocky structure; hard, firm, sticky and
plastic ; many fine black concretions; many
medium, distinct mottles of yellowish red
color; gradual boundary.
Dark yellowish brown (10YR 4/4) silt, dark
brown (10YR 4/3) when wet; structureless
to weak angular blocky structure to prismatic
structure; slightly hard, friable, sticky and
plastic; common, medium, faint mottles of
yellowish red color; slight reaction with hydro-
chloric acid; gradual boundary.

Horizon
IIC2g
DepthInches
23+
0-8
8-16
243
Morphology
Dark gray (10YR 4/1) silty clay; very dark
gray (10YR 3/1) when wet; weak fine prlS-
matic structui:'e; hard, firm, sticky and
plastic; slight reaction with hydrochloric acid;
common, medium faint mottles of brownish
yellow (10YR 6/6) color.
Kalihi Clay
Dark gray brown (10YR 4/2) clay; very
dark gray brown (10YR 3/2) when moist;
strong medium granular structure; very hard,
firm, sticky and plastic; many fine and medium
roots, common fine .and medium tubular pores;
few, fine faint mottles, slight reaction with
hydrogen peroxide; no reaction with hydro-
chloric -acid; gradual and wavy boundary.
Dark gray brown (10YR 4/2) clay; very
dark brown (10YR 2/3) when moist; strong
coarse subangular blocky structure; very
hard, firm, sticky and plastic; many very fine
interstitial pores; many fine and very fine
roots; common fine faint mottles; moderate
reaction with hydrogen peroxide; abrupt and

Horizon
822g1
822g2
G1
.Depth_Inches
16-27
27-40
40-54
244
Morphology
smooth boundary.
Gray (2.5Y 5/0) clay, dark gray (2.5YR
4/0) when moist; moderat~.coarse blocky
structure; very har:d, firm, very sticky and
plastic; very few roots; very heavy and
compact horizon; common, medium prominent
mottles of yellowish brown (10YR 5/4) color;
no reaction with hydrogen peroxide; gradual
and smooth boundary.
Reddish gray (5YR 5/2) clay, reddish
brown (5YR 4/4) when moist; weak coarse
blocky-massive structure; hard, firm, very
sticky and very plastic; zone of low permeabi-
lity; brown specks along root channels; many
medium and prominent mottles of light red
(2. 5YR 6/8) color; about 50% of the whole
mass of soil are mottles; gradual wavy
boundary.
Gray (2.5YR 6/0) clay, gray (2.5YR 5/0)
when moist; structureless; very fine and
massive structure; hard, firm, very sticky
and very plastic, very compact and impervious

Horizon
G2
neG
DepthInches
54-60
60+
n )Jv-"'!'
4-12
245
Morphology
horizon; typical gley horizon; gradual and
wavy boundary.
Gray f2.5Y 5/0) clay, gray (2.5YR 6/0)
when moist; structureless, very fine massive
structure; hard, firm, very sticky and very
plastic; gley horizon; very compact and
heavy; gradual wavy boundary.
Light yellowish brown (10YR 6/4) clay,
yellowish br~wn (10YR 5/8) when moist;
massive structure; hard, friable, very sticky
and very plastic; oxidized zone; gradual
boundary.
Laie Soil-
Very darI<: gray brown (10YR 3/2) clay,
very dark gray (10YR 3/1) when moist;
strong fine subangular blocky structure; very
hard, very firm, v~ry sticky and very plastic;
abundant fine roots; many tubular pores;
clear boundary.
Very darl<: gray (10YR 3/1) clay, very dark
gray (10YR 3/1) when moist; stro~g, very
fine subangular blocky structure; very hard,

-Horizon
822g1
822g2
83g1
DepthInches
12-20
20-27
27-35
246
Morphology
very firm, very sticky and very plastic;
many fine roots; few fine tubular pores; few
fine distinct mottles of reddish (2. 5YR 4/6)
color; smooth boundary.
Gray (5Y 5/1) clay, dark gray (5Y 4/1)
color when moist; weak medium prismatic
to subangular blocky structure;·· hard, firm,
very sticky and very plastic; many fine and
very fine roots; many fine po!,es; - zone of
alternate oxidation and reduction; many
coarse prominent mottles, more than 20% of
total mass are mottles of dark reddish brown
(5YR 3/4) color; gradual boundary.
Gray (5Y 5/1) clay, dark olive gray (5Y
4/1) when moist; weak prism-like structure;
hard, firm, very sticky and very plastic;
many fine interstitial pores; common, medium
prominent mottles, mottles are mainly along
root channels; gradual boundary.
Gray (10YR 5/1) clay, dark olive gray
(5Y 312) when. moist; weak fine prismatic
structure; hard, friable, very sticky; few
medium and prominent mottles; diffused boundary.

Horizon
B3g2
B3g3
DepthInches
35-41
41-48+
0-6
6';:'12
247
Morphology
Gray (5Y 5/1) clay, gray (5GY 5/1) when
moist; weak medium granular structure; hard,
friable, sticky and plastic; very fine pores;...
few, medium distinct mottles; diffused
boundary.
Dark gray (5Y 4/1) clay, gray (5Y 5/1)
when moist; strong medium granular structure;
hard, firm, sticky and plastic; many fine
tubular pores; few medium faint mottles;
diffused boundary.
Kaloko Clay
Reddish brown (5YR 4/3) clay, dark reddish
brown when moist; moderate, medium granular
structure; hard, firm, sticky and plastic; many
fine and medium roots; many white specks of
coral sand; very porous horizon; few, fine
and faint mottles; reacts with hydrochloric
acid; gradual boundary.
Brown (7. 5YR 5/2) clay, re.2c.ish brown
(5YR 4/3) when moist; strong medium sub-
angular blocky structu"re; very hard, friable,
sticky and plastic; roots common; many clay

Horizon
822
IIICcag
IIIC1G
DepthInches
12-20
20-29
29-33
248
MOl"phology
films on the sUl"face of the peds; few, fine
and faint motiIes; slight reaction with hydro-
chloric acid; gl"adual wavy boundary.
Pinkish white (7. 5YR 8/2) clay, brown
( 7. 5YR 5/2) when wet; strong coarse sub-
angular blocky structure; hard, firm, sticky
and plastic; few roots; slight reaction with
hydrochloric acid; common, medium, distinct
mottles; many white specks of cOl"al sand;
abrupt wavy boundary.
White (2. 5Y 8/2) silty clay; pink (7. 5YR
8/4) when moist; weak coarse granular
structure; soft, very friable, nonsticky and
nonplastic; indurated calcium cal"bonate; no
roots; no reaction to hydrogen peroxide,
stl"ong reaction to hydrochloric acid; many
coarse and pl"ominent mottles; abl"upt smooth
boundary.
Light gray (2.5Y 7/0) sandy loam; many
cl"ystals of gypsum present; blue (lOG 6/1)
when moist; blue color like typical gley hori-
zon; weak single gram structure; loose,· very

Horizon
IIIC2G
IIIC3G
DepthInches
33-43
43+
0-14
249
Morphology
friable, nonsticky and nonplastic; brisk
reaction with hydrogen peroxide; slight
reaction with hydrochloric acid; abrupt and
smooth boundary.
Light gray (2.5Y 7/0) clay, blue (lOG 5/1)
when moist; example of typical gley horizon;
structureless to massive structure; soft,
friable, slightly sticky and nonplastic; slight
reaction with hydrogen peroxide; vigorous
reaction with hydrochloric acid; gradual,
smooth boundary •.
Gray (7. 5YR 5/0) sandy clay, many crys-
tals of gypsum present, blue (lOG 6/1) when
moist; structureless, single grain structure;
loose, very friable, nonsticky and nonplastic;
slight reaction with hydrogen peroxide; slight
reactio"n with hydrochloric acid.
Nohili Clay
Dark reddish brown (5YR 3/3) clay, same
color rubbed, brown to dark brown (7. 5YR
4/2) when oven dry, many light red, bla.ck,
yellowish and whitish specks; weak, coa_rse

Horizon
822
DepthInches
14-22
22-31
250
Morphology
subangular blocky structure; firm, very
sticky and very plastic; abundant fine, very
fine and micro roots; common medium, fine
and very fint) tubular pores; many fine
interstitial pores; small (sand to fine gravel
size) pieces of 10YR 4/1 clay mixed with the
soil; moderate reaction to hydrochloric acid;
gradual smooth boundary.
Dark reddish brown (5YR 3/3) clay, same
color rubbed, reddish brown (5YR 4/3)
when oven dried, numerous light red, black
and whitish specks that look like very fine
sand; massive, firm, sticky and plastic;
common medium, many fine, very fine and
micro roots; moderate reaction· to hydrogen
peroxide; very slight reaction to hydrochloric
acid; may be recent alluvium that was plowed
under; abrupt broken boundary.
Very dark brown .( 7 .5 YR 2/2) clay, same
color rubbed, very dade gray (10YR 3/1)
when oven dried, white fine specks; weak
fine subangular blocky structure; firm, very

Horizon
IICl
IIC2
DepthInches
31-37
37-46
251
Morphology
sticky and very plastic; plentiful micro, very
fine and fine roots; many medium tubular,
interstitial pores; thin nearly continuous clay
film; slight reaction to hydrogen peroxide;
moderate reaction to hydrochloric acid; abrupt
wavy boundary.
Gray (5Y 5/1) and light gray (5Y 6/1) clay,
iight gray (2.5Y 7/0) when oven dried,
same (lOY 7/0) coatings and same sugar
like yellowish granules; weak very fine sub-
angular blocky struct~re; firm, very sticky
and very plastic; few very fine roots; com-
mon micro and very fine tubular pores, many
very fine interstitial pores; thin discontinuous
clay films in some pores; slight reaction to
hydrogen peroxide; strong reaction to hydro-
chloric acid; gradual wavy boundary.
Grayish brown (2.5Y 5/2) and dark gray
(10YR 4/1) clay, white (2.5Y 8/2) when
oven dried, (10YR 3/4) coatings in some
pores; weak fine and very fine subangular
blocky structure; firm, very sticky and very

Horizon
IIICca
IVC
DepthInches
46-55
55-60+
252'
Morphology
plastic; plentiful micro, few very fine roots;
many micro and very fine tubular pores; thin
discontinuous clay films in some pores; no
reaction to hydrogen peroxide; moderate to
strang reaction to hydrochloric acid; abrupt
smooth boundary.
Grayish brown (2.5Y 5/2) indurated calcium
carbonate layer, white (2. 5Y 8/0) when
oven dri7d, some (7. 5YR 3/2) and some
( 7. 5YR 4/4) coatings; very few very fine
roots; few fine, very fine'" and medium tubular
pores; thin discontinuous clay films in pores
and on fractures; no reaction to hydrogen
peroxide; strong reaction to hydrochloric
acid; abrupt smooth boundary.
Dark gray (5Y 4/1) and light gray (10YR
7/1) clay, light gray (2. 5Y 7/0) when oven
dried; massive; firm, very sticky and very
plastic; no roots; no reaction to hydrogen
peroxide; moderate to strong reaction to hydro-
chloric acid.


![[XLS] · Web viewMohammad amir Khan Chowk Munda tehsile Kot Addu,TDA Chowk Munda The Kot Addu Mehboob Hussain Layyah,Layyah Sajid Hussain P/O Wisande Wali,Sultan P/o Wisandewali New](https://img.dokumen.tips/doc/110x75/5ab112077f8b9a284c8c01a1/xls-viewmohammad-amir-khan-chowk-munda-tehsile-kot-addutda-chowk-munda-the-kot.jpg)


![Kashf-ul-Asrar ( Uploaded on ) · Title: Kashf-ul-Asrar ( Uploaded on ) Author: Hazrat Sultan Bahu (R.A) [Translated by Hazrat Faqeer Altaf Hussain Sarwari Qadri (R.A) ]](https://img.dokumen.tips/doc/110x75/5fe8b4795fb61b53fb3d1cb0/kashf-ul-asrar-uploaded-on-title-kashf-ul-asrar-uploaded-on-author-hazrat.jpg)