Embed Size (px)
Citation preview

Hurstville Civic Precinct
Planning Proposal
Transport Impact Assessment
Client // Hurstville City Council
Office // NSW
Reference // 16S1325000
Date // 10/06/16
© GTA Consultants (GTA Consultants (NSW) Pty Ltd) 2016
The information contained in this document is confidential and
intended solely for the use of the client for the purpose for which it has
been prepared and no representation is made or is to be implied as
being made to any third party. Use or copying of this document in
whole or in part without the written permission of GTA Consultants
constitutes an infringement of copyright. The intellectual property
contained in this document remains the property of GTA Consultants. TIA
Re
po
rt -
NSW
(1
50
630
v1
.9)
Melbourne | Sydney | Brisbane
Canberra | Adelaide | Perth
Gold Coast | Townsville
Hurstville Civic Precinct
Planning Proposal
Transport Impact Assessment
Issue: A 10/06/16
Client: Hurstville City Council
Reference: 16S1325000
GTA Consultants Office: NSW
Quality Record
Issue Date Description Prepared By Checked By Approved By Signed
A 10/06/16 Final Andrian Juric
Ashish Modessa Tim De Young Tim De Young
16S1325000 // 10/06/16
Transport Impact Assessment // Issue: A
Hurstville Civic Precinct, Planning Proposal
Table of Contents
1. Introduction 1
1.1 Background 1
1.2 Purpose of this Report 1
1.3 References 1
2. Existing Conditions 2
2.1 Site Context 2
2.2 Road Network 3
2.3 Car Parking 8
2.4 Public Transport 9
2.5 Pedestrian Infrastructure 10
2.6 Cycle Infrastructure 11
2.7 Existing Travel Behaviour 12
3. Planning Proposal 15
3.1 Land Uses 15
3.2 Car Parking 16
3.3 Vehicle Access 16
4. Car Parking Provisions 18
4.1 DCP Parking Requirements 18
4.2 Empirical Assessment of Car Parking Demand 18
4.3 Adequacy of Parking Supply 20
5. Traffic Impact Assessment 21
5.1 Overview 21
5.2 Traffic Generation 21
5.3 Traffic Impact 24
6. Other Considerations 26
6.1 Loading and Waste Collection Requirements 26
6.2 Bicycle End of Trip Facilities 26
6.3 Travel Plan 27
7. Conclusion 28

16S1325000 // 10/06/16
Transport Impact Assessment // Issue: A
Hurstville Civic Precinct, Planning Proposal
Appendices
A: Hurstville City Centre TMAP 2013 Summary
B: Traffic Survey Results
C: SIDRA INTERSECTION Results
Figures
Figure 2.1: Subject Site and Its Environs 2
Figure 2.2: Land Zoning 3
Figure 2.3: Queens Road looking east 4
Figure 2.4: Park Road looking north 4
Figure 2.5: Dora Street looking north 4
Figure 2.6: MacMahon Street looking east 4
Figure 2.7: Surrounding Intersections and Existing Site Access Locations 5
Figure 2.8: Hurstville City Centre TMAP – Existing Conditions Operation (2012) 7
Figure 2.9: Local Area Car Share Locations 9
Figure 2.10: Hurstville Bus Network Map 10
Figure 2.11: Hurstville Accessibility Map 11
Figure 2.12: Bicycle Network 11
Figure 2.13: Travel Zone (TZ 2606) 12
Figure 2.14: Place of Work (Statistical Area 3) for Employed Residents in Travel Zone 2606,
2011 13
Figure 2.15: Place of Residence (Statistical Area 3) for Workers in Travel Zone 2606, 2011 14
Figure 3.1: Indicative Set Out Plan 16
Figure 3.2: Indicative Vehicle Access Locations 17
Figure 5.1: 2021 Traffic Conditions – Hurstville City Centre TMAP 25
Figure 5.2: 2036 Traffic Conditions – Hurstville City Centre TMAP 25
Tables
Table 2.1: Existing Land Uses 2
Table 2.2: SIDRA INTERSECTION Level of Service Criteria 6
Table 2.3: Existing Operating Conditions 7
Table 3.1: Planning Proposal & TMAP Land Use Schedules 15
Table 4.1: DCP Car Parking Requirements 18
Table 4.2: Residential Parking Demands 19
Table 4.3: Empirical Car Parking Requirements 20
Table 5.1: Traffic Generation Estimates 22
Table 5.2: Comparison of Existing and Proposed Site Traffic Generation 23
Table 5.3: Traffic Generation Rate Comparison (TMAP vs Planning Proposal) 23
16S1325000 // 10/06/16
Transport Impact Assessment // Issue: A
Hurstville Civic Precinct, Planning Proposal
Table 5.4: TMAP Land Uses/ TMAP Traffic Generation Rates 24

16S1325000 // 10/06/16
Transport Impact Assessment // Issue: A
Hurstville Civic Precinct, Planning Proposal 1
1. Introduction
1.1 Background
It is understood that a Stage 1 Planning Proposal is to be lodged with Hurstville City Council for a
potential development scheme on land known as the ‘Hurstville Civic Precinct’ on the corner of
Queens Road, Park Road, MacMahon Street and Dora Street in the Hurstville CBD.
The approximate land uses anticipated to form the Planning Proposal include:
450 residential units
4,000m2 of retail area
9,660m2 of commercial floor space area
8,470m2 of community use area (function centre, library, museum and gallery)
Three levels of basement car parking with a capacity for 1,050 to 1,200 spaces.
Hurstville City Council (Council) commissioned GTA to undertake a transport impact assessment
of the Planning Proposal.
1.2 Purpose of this Report
This report sets out an assessment of the anticipated transport implications of the Planning
Proposal, including consideration of the:
i existing traffic and parking conditions surrounding the site
ii suitability of the proposed access arrangements for the site
iii suitability of the indicative parking in terms of supply (quantum)
iv the traffic generating characteristics of the Planning Proposal
v service vehicle requirements
vi pedestrian and bicycle requirements
vii the transport impact of the Planning Proposal on the surrounding road network.
1.3 References
In preparing this report, reference has been made to the following:
site visit undertaken on the morning of Friday 12 February 2016
Hurstville City Council Development Control Plan (DCP) No.2 – Hurstville City Centre
Hurstville City Council Local Environmental Plan (LEP)
Various Australian Standard/ New Zealand Standard, Parking Facilities
GHD Hurstville City Centre Transport Management and Accessibility Plan (TMAP) 2013
traffic surveys undertaken by Matrix Traffic and Transport Data as referenced in the
context of this report
other documents and data as referenced in this report.
It is noted that one of the most critical documents referred to in preparation of this report is the
Hurstville City Centre TMAP 2013; which has been summarised in Appendix A of this report.
1

16S1325000 // 10/06/16
Transport Impact Assessment // Issue: A
Hurstville Civic Precinct, Planning Proposal 2
2. Existing Conditions
2.1 Site Context
The Hurstville Civic Precinct (the site) is located on the northern edge of the Hurstville CBD.
The site of approximately 14,000m2 has frontages of 210m to Queens Road, 45m to Park Road,
215m to MacMahon Street and 85m to Dora Street.
The majority of the site is currently subject to land use classification changes with the zoning a
deferred matter. However, the site is presently occupied by the Hurstville Civic Precinct, which
consists of the land uses presented in Table 2.1.
Table 2.1: Existing Land Uses
Land Uses Size
Council – Commercial 1,200m2 GFA
Entertainment Centre 4,291m2 GFA
Youth Centre 500m2 GFA
Seniors Centre 507m2 GFA
Museum and Galley 615m2 GFA
Church 500m2 GFA
Council Car Park 157 spaces
The surrounding properties are predominantly classified as either B4 – Mixed Use or R3 – Medium
Density Residential. They consist primarily of mixed use commercial and residential properties, as
well as medium density residential dwellings. Hurstville Council’s library is located on the northeast
corner of the Queens Road / Dora Street intersection with a floor area of 3,440m2 GFA.
The location of the site and its surrounding environs is shown in Figure 2.1, and the land zoning is
shown in Figure 2.2.
Figure 2.1: Subject Site and Its Environs
Basemap source: Sydway Publishing Pty Ltd
Subject Site
2
16S1325000 // 10/06/16
Transport Impact Assessment // Issue: A
Hurstville Civic Precinct, Planning Proposal 3
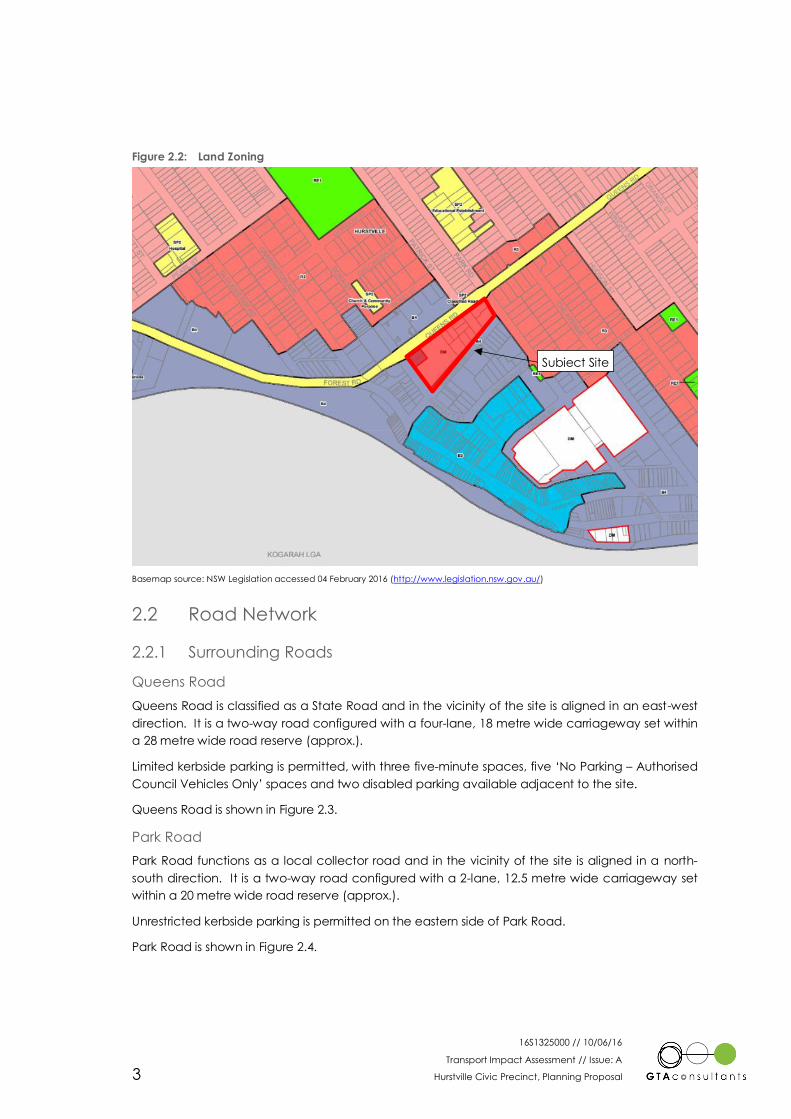
Figure 2.2: Land Zoning
Basemap source: NSW Legislation accessed 04 February 2016 (http://www.legislation.nsw.gov.au/)
2.2 Road Network
2.2.1 Surrounding Roads
Queens Road
Queens Road is classified as a State Road and in the vicinity of the site is aligned in an east-west
direction. It is a two-way road configured with a four-lane, 18 metre wide carriageway set within
a 28 metre wide road reserve (approx.).
Limited kerbside parking is permitted, with three five-minute spaces, five ‘No Parking – Authorised
Council Vehicles Only’ spaces and two disabled parking available adjacent to the site.
Queens Road is shown in Figure 2.3.
Park Road
Park Road functions as a local collector road and in the vicinity of the site is aligned in a north-
south direction. It is a two-way road configured with a 2-lane, 12.5 metre wide carriageway set
within a 20 metre wide road reserve (approx.).
Unrestricted kerbside parking is permitted on the eastern side of Park Road.
Park Road is shown in Figure 2.4.
Subject Site
16S1325000 // 10/06/16
Transport Impact Assessment // Issue: A
Hurstville Civic Precinct, Planning Proposal 4
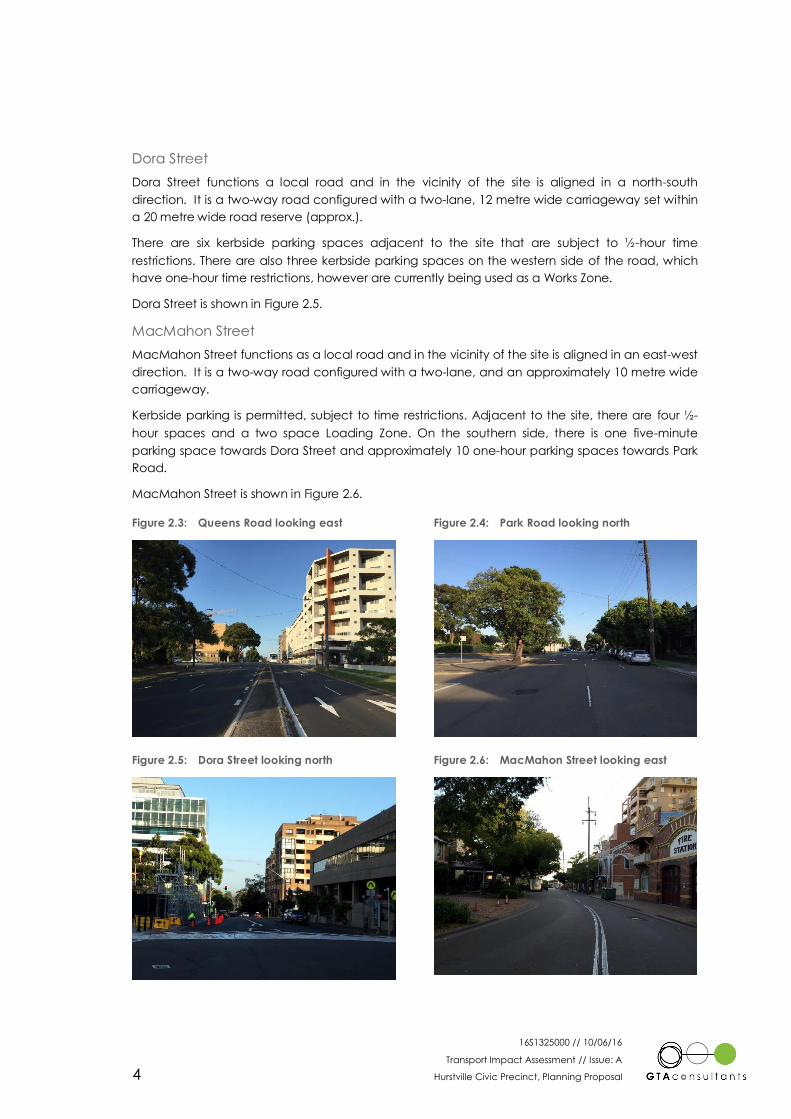
Dora Street
Dora Street functions a local road and in the vicinity of the site is aligned in a north-south
direction. It is a two-way road configured with a two-lane, 12 metre wide carriageway set within
a 20 metre wide road reserve (approx.).
There are six kerbside parking spaces adjacent to the site that are subject to ½-hour time
restrictions. There are also three kerbside parking spaces on the western side of the road, which
have one-hour time restrictions, however are currently being used as a Works Zone.
Dora Street is shown in Figure 2.5.
MacMahon Street
MacMahon Street functions as a local road and in the vicinity of the site is aligned in an east-west
direction. It is a two-way road configured with a two-lane, and an approximately 10 metre wide
carriageway.
Kerbside parking is permitted, subject to time restrictions. Adjacent to the site, there are four ½-
hour spaces and a two space Loading Zone. On the southern side, there is one five-minute
parking space towards Dora Street and approximately 10 one-hour parking spaces towards Park
Road.
MacMahon Street is shown in Figure 2.6.
Figure 2.3: Queens Road looking east Figure 2.4: Park Road looking north
Figure 2.5: Dora Street looking north Figure 2.6: MacMahon Street looking east
16S1325000 // 10/06/16
Transport Impact Assessment // Issue: A
Hurstville Civic Precinct, Planning Proposal 5
2.2.2 Surrounding Intersections
The following intersections currently exist in the vicinity of the site:
Queens Road/ Dora Street (Signalised)
Queens Road/ Park Road (Signalised)
Park Road/ MacMahon Street (Priority-Controlled)
Dora Road/ MacMahon Street (Priority-Controlled).
2.2.3 Traffic Volumes
Surrounding Network
GTA commissioned traffic movement counts on key roads in the vicinity of the site on Thursday 11
and Saturday 13 February 2016 during the following peak periods:
Thursday AM peak: 6:00am and 9:00am
Thursday PM peak: 4:00pm and 7:00pm
Saturday Midday peak: 11:00am and 2:00pm.
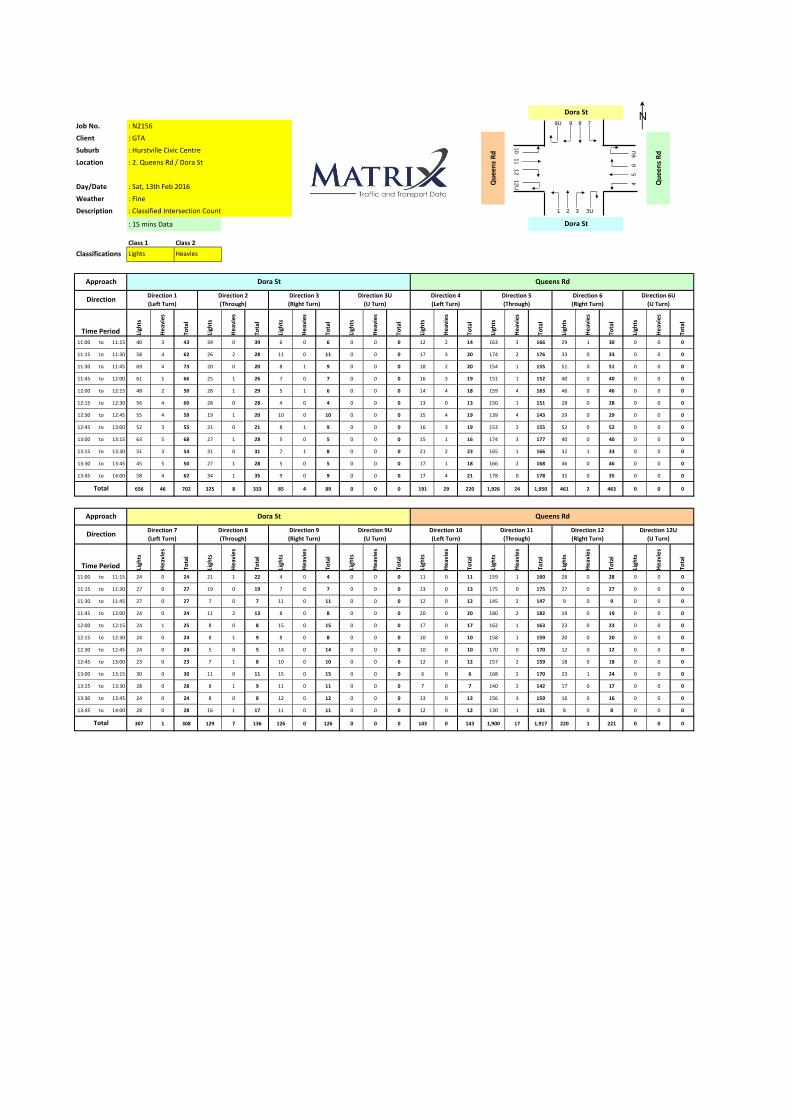
The full results of the traffic surveys are provided in Appendix B of this report.
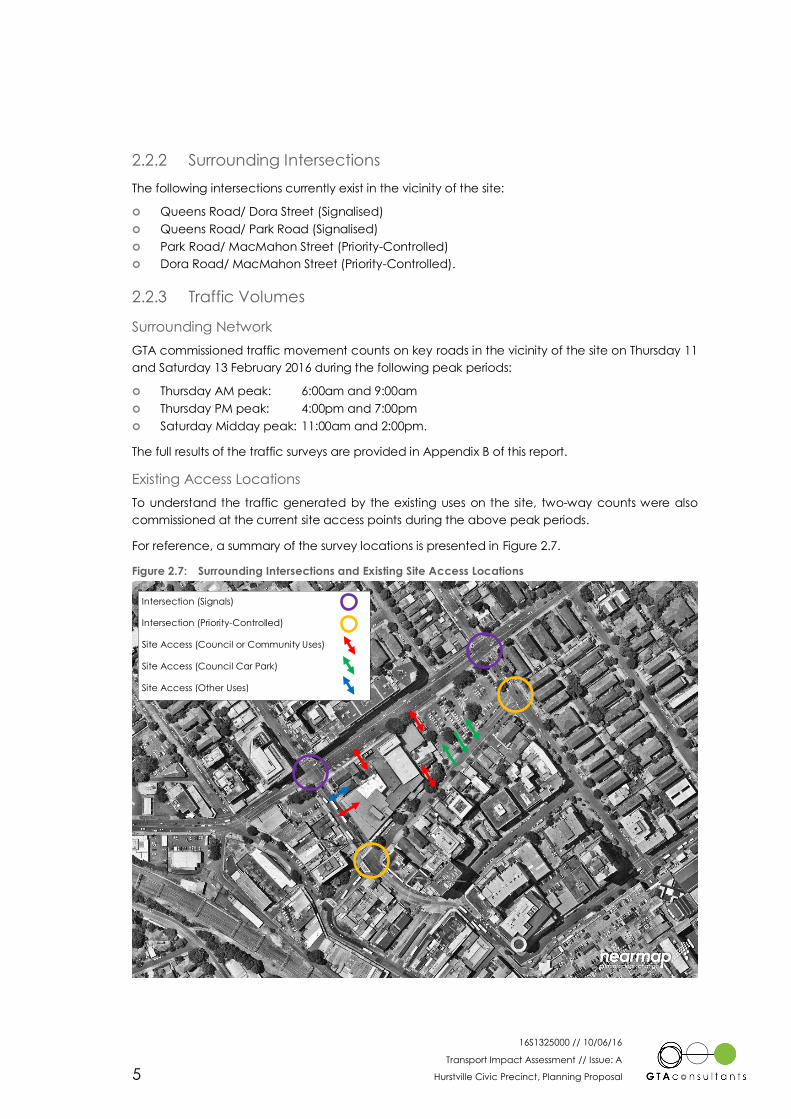
Existing Access Locations
To understand the traffic generated by the existing uses on the site, two-way counts were also
commissioned at the current site access points during the above peak periods.
For reference, a summary of the survey locations is presented in Figure 2.7.
Figure 2.7: Surrounding Intersections and Existing Site Access Locations
Intersection (Signals)
Intersection (Priority-Controlled)
Site Access (Council or Community Uses)
Site Access (Council Car Park)
Site Access (Other Uses)

16S1325000 // 10/06/16
Transport Impact Assessment // Issue: A
Hurstville Civic Precinct, Planning Proposal 6
The counts indicate the following vehicle movements during the site peak hours, which all occur
at a similar time of the external road network peak hours:
Weekday AM: 188 vehicle movements (150 in/ 38 out)
Weekday PM: 191 vehicle movements (71 in/ 120 out)
Saturday Midday: 359 vehicle movements (181 in/ 178 out).
2.2.4 Intersection Operation
The operation of the key proximate intersections used to access the site have been assessed
using SIDRA INTERSECTION1, a computer based modelling package which calculates intersection
performance.
The commonly used measure of intersection performance, as defined by the RMS, is vehicle
delay. SIDRA INTERSECTION determines the average delay that vehicles encounter and provides
a measure of the level of service.
Table 2.2 shows the criteria that SIDRA INTERSECTION adopts in assessing the level of service.
Table 2.2: SIDRA INTERSECTION Level of Service Criteria
Level of Service
(LOS)
Average Delay per
vehicle (secs/veh) Traffic Signals, Roundabout Give Way & Stop Sign
A Less than 14 Good operation Good operation
B 15 to 28 Good with acceptable delays
and spare capacity
Acceptable delays and spare
capacity
C 29 to 42 Satisfactory Satisfactory, but accident study
required
D 43 to 56 Near capacity Near capacity, accident study
required
E 57 to 70 At capacity, at signals incidents
will cause excessive delays
At capacity, requires other control
mode
F Greater than 70 Extra capacity required Extreme delay, major treatment
required
Table 2.3 presents a summary of the existing operation of the proximate intersections, with full
results presented in Appendix C of this report.
1 Program used under license from Akcelik & Associates Pty Ltd.

16S1325000 // 10/06/16
Transport Impact Assessment // Issue: A
Hurstville Civic Precinct, Planning Proposal 7
Table 2.3: Existing Operating Conditions
Intersection Peak Degree of
Saturation (DOS)
Average Delay
(sec)
95th Percentile
Queue (m)
Level of
Service (LOS)
Queens Road/
Dora Street
Thurs AM 0.62 11 47 A
Thurs PM 0.50 16 72 B
Sat Midday 0.47 16 75 B
Queens Road/
Park Road
Thurs AM 0.71 16 108 B
Thurs PM 0.67 22 131 B
Sat Midday 0.64 24 118 B
Park Road/
MacMahon Street
Thurs AM 0.16 5 0 A
Thurs PM 0.27 5 0 A
Sat Midday 0.28 5 0 A
Dora Road/
MacMahon Street
Thurs AM 0.25 9 10 A
Thurs PM 0.28 10 12 A
Sat Midday 0.32 9 14 A
Table 2.3 illustrates that all the key proximate intersections used to access the site currently
operate well with good levels of service and minimal delays on all approaches.
It is noted that the findings of this analysis are generally consistent with our observations of the
site, with the only exception being that the Queen Road/Dora Road and Queen Road/Park Road
signalised intersections experience longer queueing that estimated by SIDRA (although they are
considered to be acceptable and generally clear each signal phase).
Moreover, it is also noted that these findings are consistent with the existing operations of the
adjacent intersections modelled as part of the Hurstville City Centre TMAP. The results are
graphically summarised in Figure 37 of the TMAP, which has been reproduced in Figure 2.8.
Figure 2.8: Hurstville City Centre TMAP – Existing Conditions Operation (2012)
Base source: Hurstville City Centre TMAP, GHD 2013
Subject Site

16S1325000 // 10/06/16
Transport Impact Assessment // Issue: A
Hurstville Civic Precinct, Planning Proposal 8
2.3 Car Parking
2.3.1 On-Street Parking
A review of publicly available car parking in the vicinity of the site indicates that all on-street car
parking is time-restricted, except for the unrestricted spaces on the eastern side of Park Road. The
car parking was largely occupied during our site visit.
2.3.2 Council Car Park (on site)
The site accommodates a 157 space Council operates parking facility that includes four disabled
car spaces, 13 reserved spaces and the remaining subject to a three-hour time restriction.
Spot count surveys were completed on Thursday 11 February 2016, which indicated that the car
park is 6%, 65%, 84% and 45% occupied at 6:00am, 9:00am, 4:00pm and 7:00pm respectively. On
Saturday 13 February 2016, the car park was above 90% occupied at 11:00am and 2:00pm, with
all three-hour time restricted parking spaces occupied.
It is noted that it is not clear whether all of the car parking demands accommodated within the
on-site car park relate to the Hurstville Civic Precinct land uses, at least on the Saturday when
demands in the broader area are typically higher. For the purposes of the assessment within this
report, however, it has been conservatively assumed that the car parking demands are related
to the Hurstville Civic Precinct land uses.
2.3.3 Local Car Sharing Initiatives
Car share facilities are available within a short walking distance from the site, with three GoGet
vehicles located at the Westfield Shopping Centre, as shown in Figure 2.9.
The car share service aims to reduce the reliance on the use of private motor vehicles.
Memberships for the car share service are available for both personal and business use.

16S1325000 // 10/06/16
Transport Impact Assessment // Issue: A
Hurstville Civic Precinct, Planning Proposal 9
Figure 2.9: Local Area Car Share Locations
Basemap source: http://www.goget.com.au/find-cars/?address_target=hurstville, accessed 04/02/16
2.4 Public Transport
The site is well serviced by public transport, namely with the Hurstville Railway Station and the
Hurstville bus interchange located 300 metres and 150 metres to the south respectively (approx.).
2.4.1 Rail Services
The Hurstville Railway Station is located is serviced by the T4 Eastern Suburbs and Illawarra line and
South Coast Line that provided direct access to the Sydney CBD, and on to Bondi Junction via
the eastern suburbs. Services on weekdays and weekends are every 5 to 15 minutes for the
majority of the day.
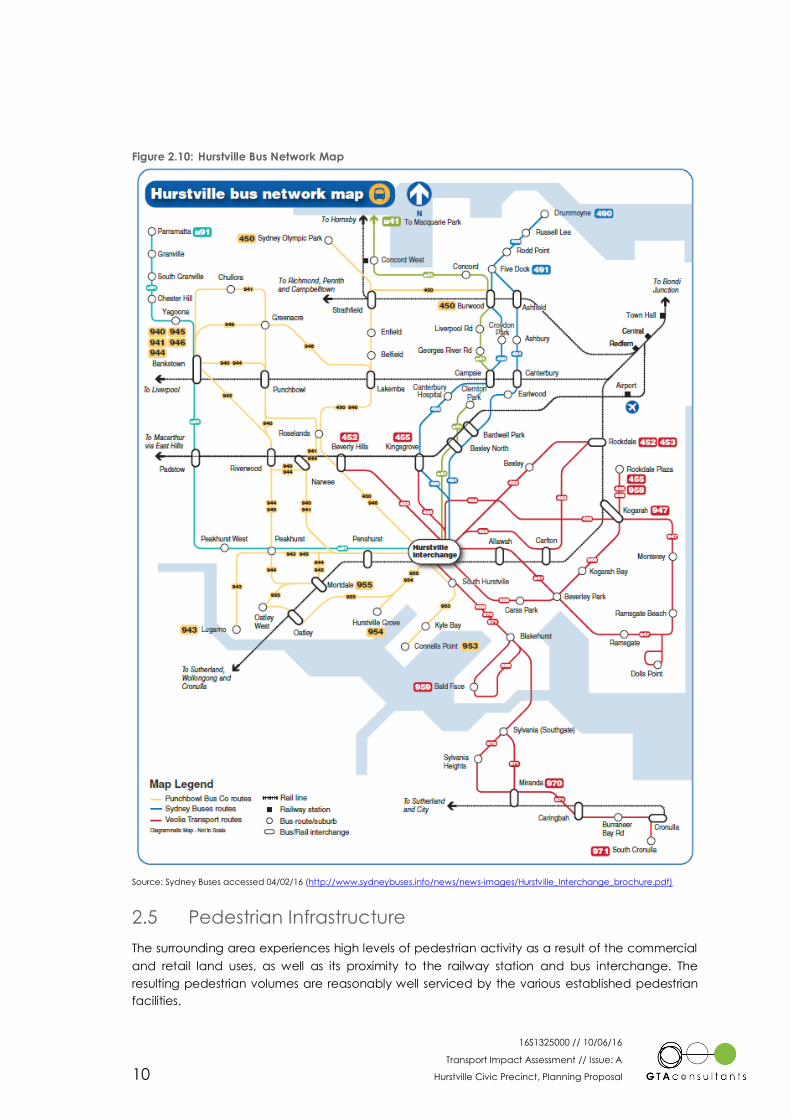
2.4.2 Bus Services
The Hurstville bus interchange is serviced by up to 20 bus routes operated by the Punchbowl Bus
Company, Sydney Buses and Veolia Transport. A review of the public transport available in the
vicinity of the site is summarised in Figure 2.10.
Subject Site
16S1325000 // 10/06/16
Transport Impact Assessment // Issue: A
Hurstville Civic Precinct, Planning Proposal 10
Figure 2.10: Hurstville Bus Network Map
Source: Sydney Buses accessed 04/02/16 (http://www.sydneybuses.info/news/news-images/Hurstville_Interchange_brochure.pdf)
2.5 Pedestrian Infrastructure
The surrounding area experiences high levels of pedestrian activity as a result of the commercial
and retail land uses, as well as its proximity to the railway station and bus interchange. The
resulting pedestrian volumes are reasonably well serviced by the various established pedestrian
facilities.
16S1325000 // 10/06/16
Transport Impact Assessment // Issue: A
Hurstville Civic Precinct, Planning Proposal 11
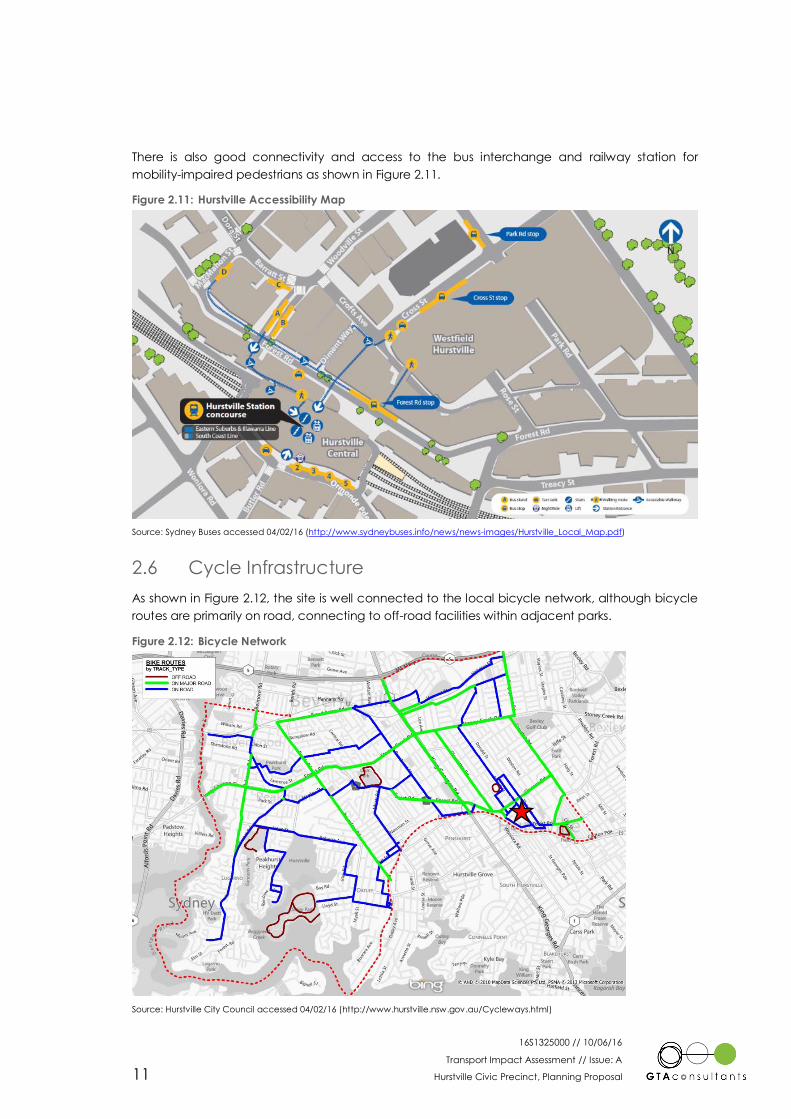
There is also good connectivity and access to the bus interchange and railway station for
mobility-impaired pedestrians as shown in Figure 2.11.
Figure 2.11: Hurstville Accessibility Map
Source: Sydney Buses accessed 04/02/16 (http://www.sydneybuses.info/news/news-images/Hurstville_Local_Map.pdf)
2.6 Cycle Infrastructure
As shown in Figure 2.12, the site is well connected to the local bicycle network, although bicycle
routes are primarily on road, connecting to off-road facilities within adjacent parks.
Figure 2.12: Bicycle Network
Source: Hurstville City Council accessed 04/02/16 (http://www.hurstville.nsw.gov.au/Cycleways.html)
16S1325000 // 10/06/16
Transport Impact Assessment // Issue: A
Hurstville Civic Precinct, Planning Proposal 12
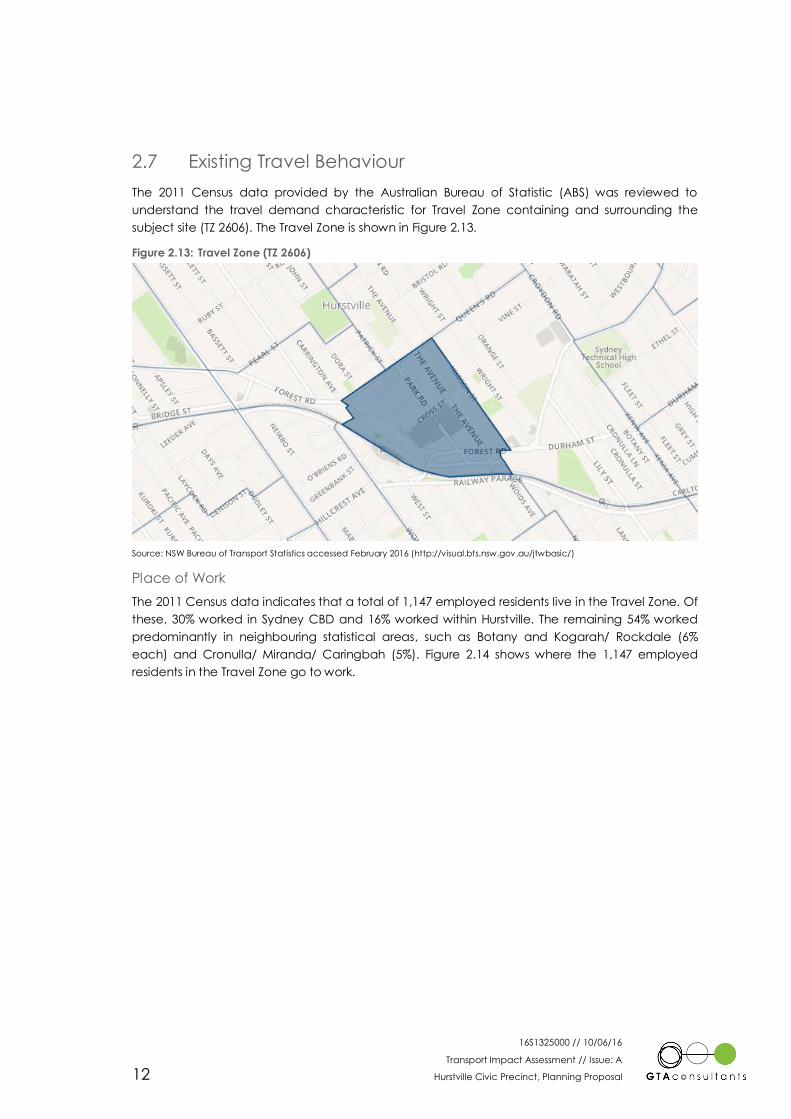
2.7 Existing Travel Behaviour
The 2011 Census data provided by the Australian Bureau of Statistic (ABS) was reviewed to
understand the travel demand characteristic for Travel Zone containing and surrounding the
subject site (TZ 2606). The Travel Zone is shown in Figure 2.13.
Figure 2.13: Travel Zone (TZ 2606)
Source: NSW Bureau of Transport Statistics accessed February 2016 (http://visual.bts.nsw.gov.au/jtwbasic/)
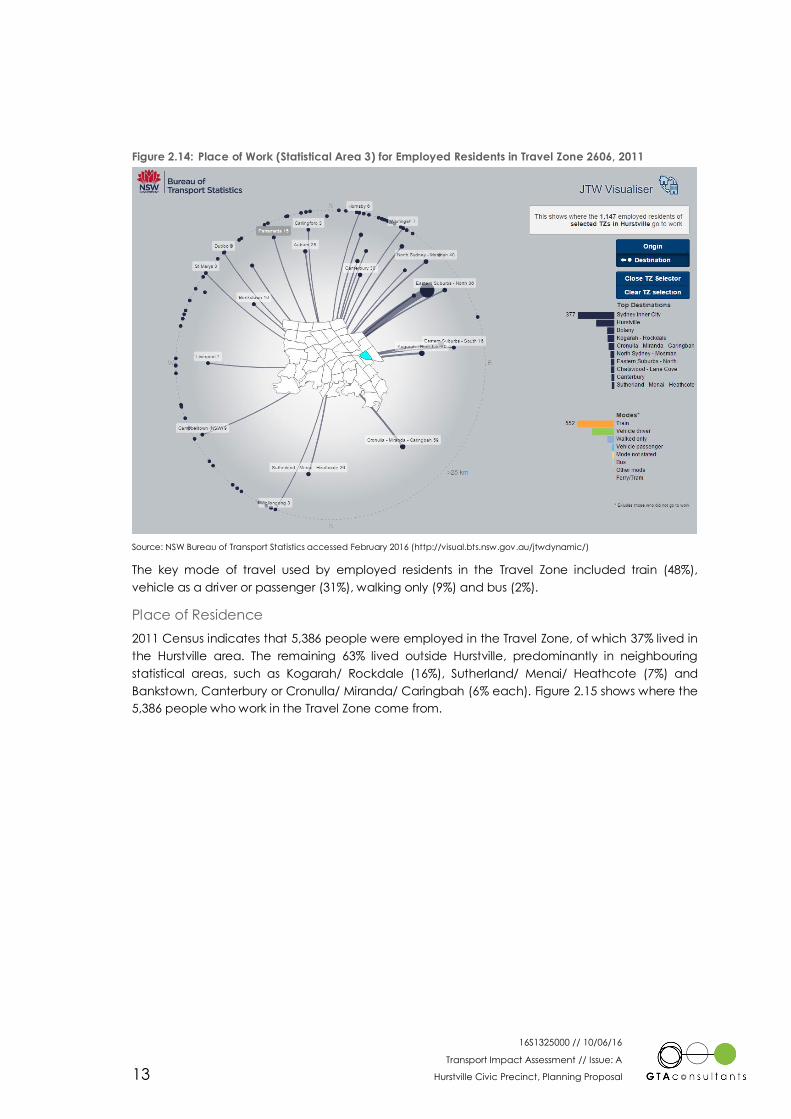
Place of Work
The 2011 Census data indicates that a total of 1,147 employed residents live in the Travel Zone. Of
these, 30% worked in Sydney CBD and 16% worked within Hurstville. The remaining 54% worked
predominantly in neighbouring statistical areas, such as Botany and Kogarah/ Rockdale (6%
each) and Cronulla/ Miranda/ Caringbah (5%). Figure 2.14 shows where the 1,147 employed
residents in the Travel Zone go to work.
16S1325000 // 10/06/16
Transport Impact Assessment // Issue: A
Hurstville Civic Precinct, Planning Proposal 13
Figure 2.14: Place of Work (Statistical Area 3) for Employed Residents in Travel Zone 2606, 2011
Source: NSW Bureau of Transport Statistics accessed February 2016 (http://visual.bts.nsw.gov.au/jtwdynamic/)
The key mode of travel used by employed residents in the Travel Zone included train (48%),
vehicle as a driver or passenger (31%), walking only (9%) and bus (2%).
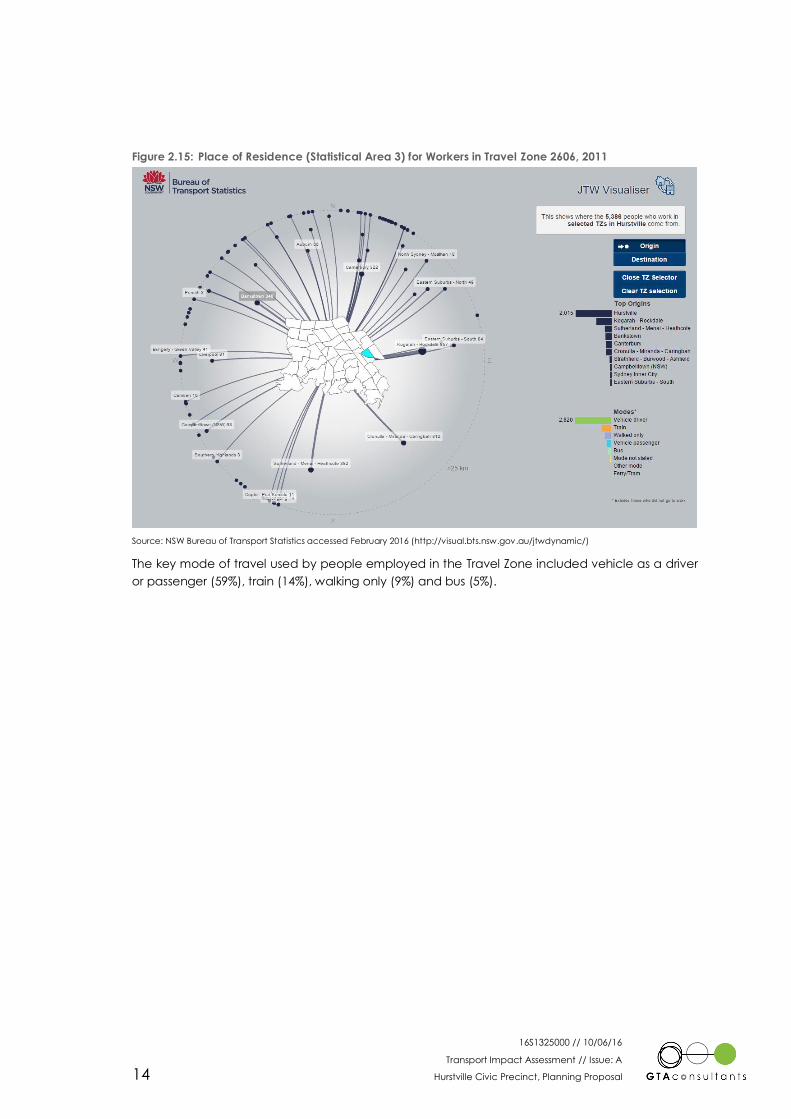
Place of Residence
2011 Census indicates that 5,386 people were employed in the Travel Zone, of which 37% lived in
the Hurstville area. The remaining 63% lived outside Hurstville, predominantly in neighbouring
statistical areas, such as Kogarah/ Rockdale (16%), Sutherland/ Menai/ Heathcote (7%) and
Bankstown, Canterbury or Cronulla/ Miranda/ Caringbah (6% each). Figure 2.15 shows where the
5,386 people who work in the Travel Zone come from.
16S1325000 // 10/06/16
Transport Impact Assessment // Issue: A
Hurstville Civic Precinct, Planning Proposal 14
Figure 2.15: Place of Residence (Statistical Area 3) for Workers in Travel Zone 2606, 2011
Source: NSW Bureau of Transport Statistics accessed February 2016 (http://visual.bts.nsw.gov.au/jtwdynamic/)
The key mode of travel used by people employed in the Travel Zone included vehicle as a driver
or passenger (59%), train (14%), walking only (9%) and bus (5%).

16S1325000 // 10/06/16
Transport Impact Assessment // Issue: A
Hurstville Civic Precinct, Planning Proposal 15
3. Planning Proposal
3.1 Land Uses
The Planning Proposal includes the construction of multiple buildings with residential, commercial,
retail and community land uses.
Table 3.1 summarises the existing land uses, as well as those considered with the Hurstville City
Centre TMAP and proposed as part of the Planning Proposal for the site.
Table 3.1: Planning Proposal & TMAP Land Use Schedules
Use Existing TMAP Planning Proposal
Residential – Studio - - 84 apartments
Residential – 1 bedroom - - 85 apartments
Residential – 2 bedroom - - 232 apartments
Residential – 3 bedroom - - 46 apartments
Residential – Total - - 447 apartments
Retail - - 3,961m2 GFA
Commercial 1,200m2 GFA 32,000m2 GFA 9,655m2 GFA
Community Facilities 9,355m2 GFA 12,652m2 GFA 8,470m2 GFA
Table 3.1 indicates the following:
There is currently approximately 10,500m2 of commercial and community floor area on
the site.
The Hurstville City Centre TMAP assumed a significant uplift of the existing land uses on
the site, with a total of over 44,000m2 of floor area (including 32,000m2 of commercial
floor area) assumed and modelled.
The currently proposed Planning Proposal only has a comparatively marginal increase
in the existing land uses, with about 10,000m2 of commercial floor area, with the main
difference being the 4,000m2 of retail floor area and 447 apartments.
For reference, Figure 3.1 illustrates the indicative massing of the multiple buildings making up the
Planning Proposal.
3

16S1325000 // 10/06/16
Transport Impact Assessment // Issue: A
Hurstville Civic Precinct, Planning Proposal 16
Figure 3.1: Indicative Set Out Plan
Source: Hurstville Civic Centre Master Plan Concept Design Report dated 19/02/16 Issue B
3.2 Car Parking
It is understood that the Planning Proposal includes a three level basement car parking facility
able to accommodate in the order of 1,050 to 1,200 spaces.
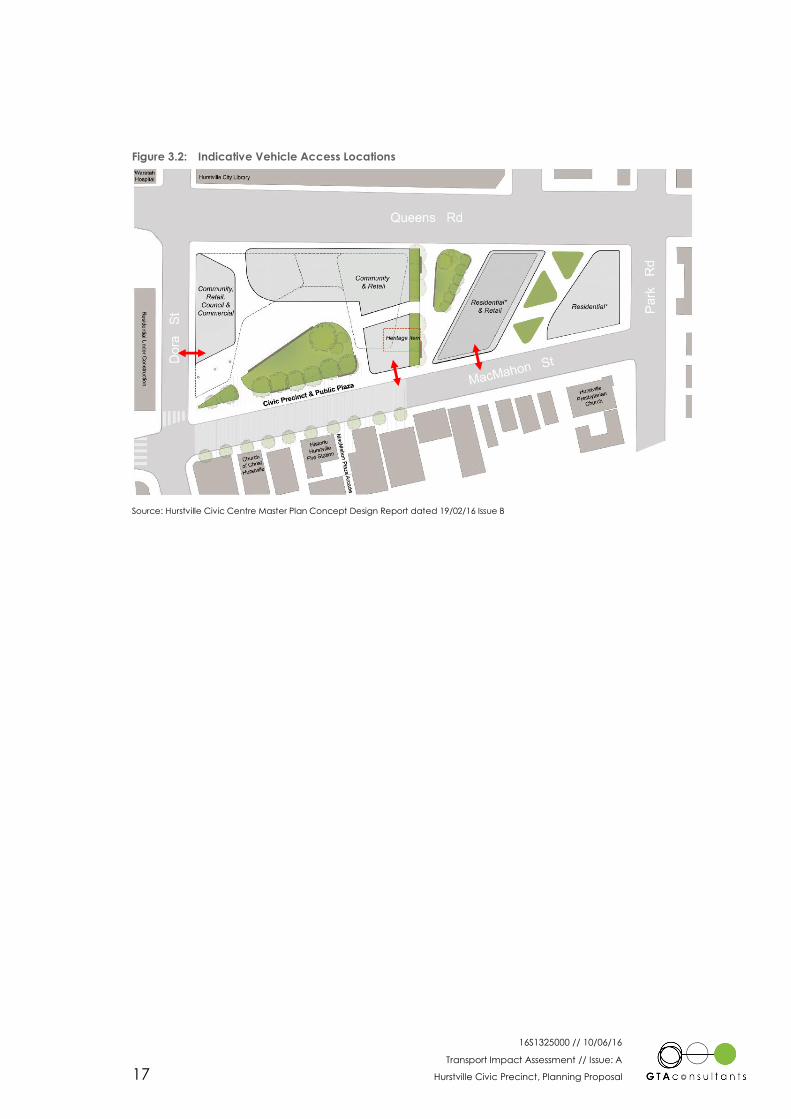
3.3 Vehicle Access
Vehicular access to the site has yet to be confirmed.
Notwithstanding this, it is expected that in the order of three to four main access points to the
basement car parking facility would be provided to service the anticipated number of spaces
and different land uses that make up the Planning Proposal.
In terms where the access points for each of the above land uses would likely be located, the
following guidance is provided:
Lowest street classification
Away from active land use frontages and/ or parks
Away from intersections
Separated by land use type and/ or building.
On the above basis, Figure 3.2 indicatively shows potential access point locations to suitably
service the proposed development forming the Planning Proposal. It is emphasised that these
locations would be further assessed as part of subsequent planning approval processes.
16S1325000 // 10/06/16
Transport Impact Assessment // Issue: A
Hurstville Civic Precinct, Planning Proposal 17
Figure 3.2: Indicative Vehicle Access Locations
Source: Hurstville Civic Centre Master Plan Concept Design Report dated 19/02/16 Issue B
16S1325000 // 10/06/16
Transport Impact Assessment // Issue: A
Hurstville Civic Precinct, Planning Proposal 18
4. Car Parking Provisions
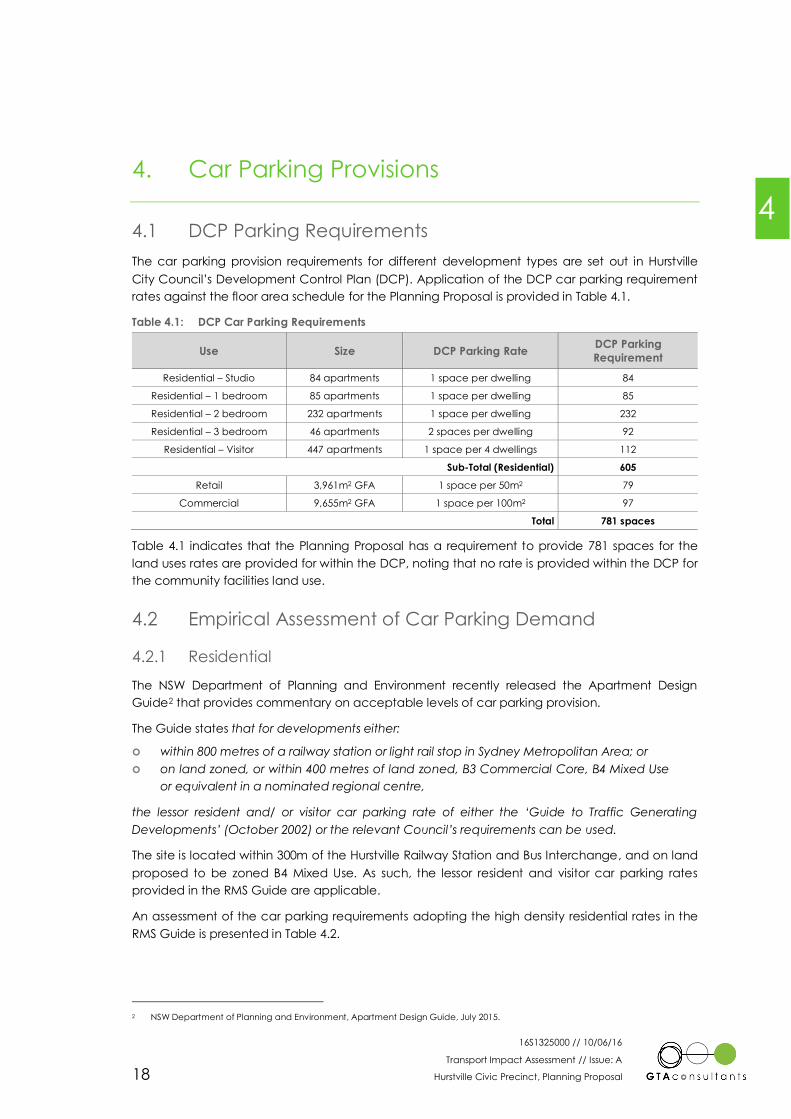
4.1 DCP Parking Requirements
The car parking provision requirements for different development types are set out in Hurstville
City Council’s Development Control Plan (DCP). Application of the DCP car parking requirement
rates against the floor area schedule for the Planning Proposal is provided in Table 4.1.
Table 4.1: DCP Car Parking Requirements
Use Size DCP Parking Rate DCP Parking
Requirement
Residential – Studio 84 apartments 1 space per dwelling 84
Residential – 1 bedroom 85 apartments 1 space per dwelling 85
Residential – 2 bedroom 232 apartments 1 space per dwelling 232
Residential – 3 bedroom 46 apartments 2 spaces per dwelling 92
Residential – Visitor 447 apartments 1 space per 4 dwellings 112
Sub-Total (Residential) 605
Retail 3,961m2 GFA 1 space per 50m2 79
Commercial 9,655m2 GFA 1 space per 100m2 97
Total 781 spaces
Table 4.1 indicates that the Planning Proposal has a requirement to provide 781 spaces for the
land uses rates are provided for within the DCP, noting that no rate is provided within the DCP for
the community facilities land use.
4.2 Empirical Assessment of Car Parking Demand
4.2.1 Residential
The NSW Department of Planning and Environment recently released the Apartment Design
Guide3F
2 that provides commentary on acceptable levels of car parking provision.
The Guide states that for developments either:
within 800 metres of a railway station or light rail stop in Sydney Metropolitan Area; or
on land zoned, or within 400 metres of land zoned, B3 Commercial Core, B4 Mixed Use
or equivalent in a nominated regional centre,
the lessor resident and/ or visitor car parking rate of either the ‘Guide to Traffic Generating
Developments’ (October 2002) or the relevant Council’s requirements can be used.
The site is located within 300m of the Hurstville Railway Station and Bus Interchange, and on land
proposed to be zoned B4 Mixed Use. As such, the lessor resident and visitor car parking rates
provided in the RMS Guide are applicable.
An assessment of the car parking requirements adopting the high density residential rates in the
RMS Guide is presented in Table 4.2.
2 NSW Department of Planning and Environment, Apartment Design Guide, July 2015.
4
16S1325000 // 10/06/16
Transport Impact Assessment // Issue: A
Hurstville Civic Precinct, Planning Proposal 19
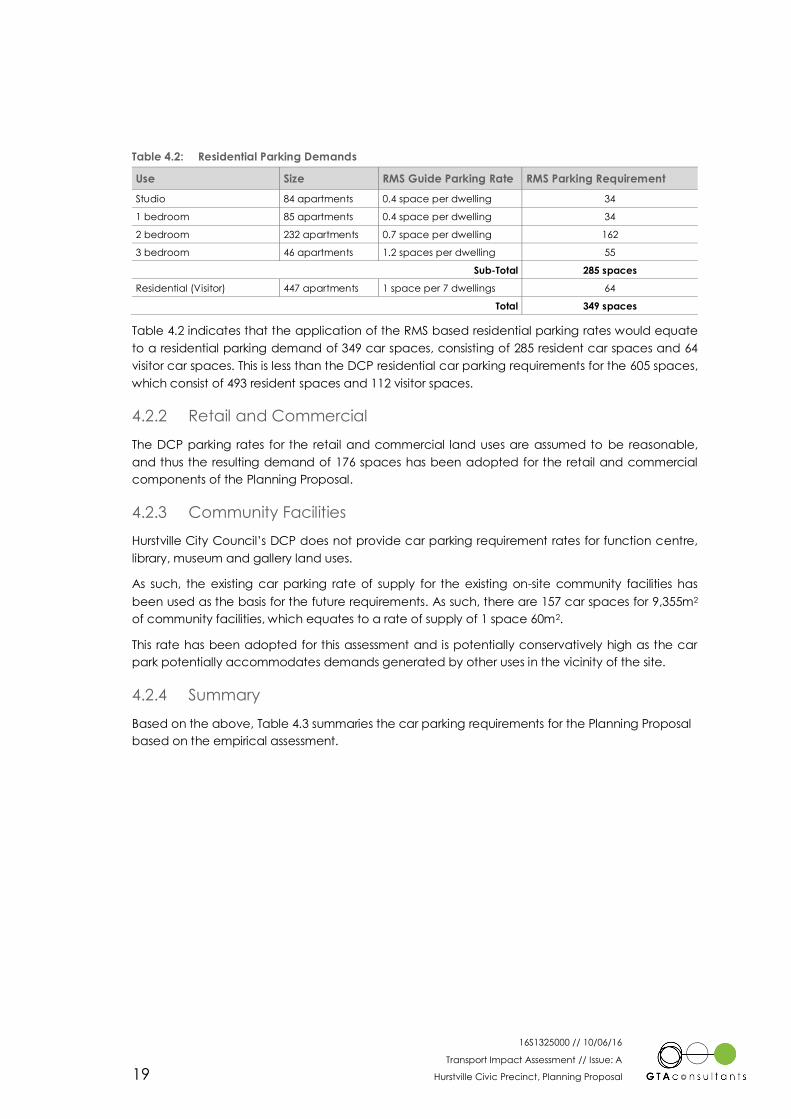
Table 4.2: Residential Parking Demands
Use Size RMS Guide Parking Rate RMS Parking Requirement
Studio 84 apartments 0.4 space per dwelling 34
1 bedroom 85 apartments 0.4 space per dwelling 34
2 bedroom 232 apartments 0.7 space per dwelling 162
3 bedroom 46 apartments 1.2 spaces per dwelling 55
Sub-Total 285 spaces
Residential (Visitor) 447 apartments 1 space per 7 dwellings 64
Total 349 spaces
Table 4.2 indicates that the application of the RMS based residential parking rates would equate
to a residential parking demand of 349 car spaces, consisting of 285 resident car spaces and 64
visitor car spaces. This is less than the DCP residential car parking requirements for the 605 spaces,
which consist of 493 resident spaces and 112 visitor spaces.
4.2.2 Retail and Commercial
The DCP parking rates for the retail and commercial land uses are assumed to be reasonable,
and thus the resulting demand of 176 spaces has been adopted for the retail and commercial
components of the Planning Proposal.
4.2.3 Community Facilities
Hurstville City Council’s DCP does not provide car parking requirement rates for function centre,
library, museum and gallery land uses.
As such, the existing car parking rate of supply for the existing on-site community facilities has
been used as the basis for the future requirements. As such, there are 157 car spaces for 9,355m2
of community facilities, which equates to a rate of supply of 1 space 60m2.
This rate has been adopted for this assessment and is potentially conservatively high as the car
park potentially accommodates demands generated by other uses in the vicinity of the site.
4.2.4 Summary
Based on the above, Table 4.3 summaries the car parking requirements for the Planning Proposal
based on the empirical assessment.

16S1325000 // 10/06/16
Transport Impact Assessment // Issue: A
Hurstville Civic Precinct, Planning Proposal 20
Table 4.3: Empirical Car Parking Requirements
Use Size DCP Parking Rate DCP Parking
Requirement
Residential – Studio 84 apartments 0.4 space per dwelling 34
Residential – 1 bedroom 85 apartments 0.4 space per dwelling 34
Residential – 2 bedroom 232 apartments 0.7 space per dwelling 162
Residential – 3 bedroom 46 apartments 1.2 spaces per dwelling 55
Residential – Visitor 447 apartments 1 space per 7 dwellings 64
Sub-Total (Residential) 349
Retail 3,961m2 GFA 1 space per 50m2 79
Commercial 9,655m2 GFA 1 space per 100m2 97
Community Facilities 8,470m2 GFA 1 space per 60m2 141
Total 666 spaces
Table 4.3 indicates that a car parking demand of approximately 670 car spaces (including 350
residential and 320 commercial / community facilities car spaces) would typically be for the
Planning Proposal based on the empirical assessment.
4.3 Adequacy of Parking Supply
The Planning Proposal proposes 1,050 to 1,200 off-street car parking spaces, which exceeds both
the car parking requirements identified through the Hurstville City Council’s DCP of 922 spaces
(including 141 community facility spaces) and the empirical assessment of 666 spaces. On the
above basis, it is evident that there is clear opportunity to reduce the proposed car parking
supply as part of the Planning Proposal. Alternatively, there is potential scope to accommodate
broader car parking demands within the site (e.g. for surrounding uses).
16S1325000 // 10/06/16
Transport Impact Assessment // Issue: A
Hurstville Civic Precinct, Planning Proposal 21
5. Traffic Impact Assessment
5.1 Overview
The traffic impact assessment for the Planning Proposal has been undertaken in the following
manner:
Identification of the traffic generation characteristics of the land uses that form the
Planning Proposal
Off-setting the existing traffic volumes being generated by the subject site
Comparing what traffic allowance was made for the subject site as part of the
transport modelling undertaken as part of the Hurstville City Centre TMAP.
5.2 Traffic Generation
5.2.1 Development Generated Traffic
Traffic generation estimates for the land uses that form the Planning Proposal have been sourced
from the RMS Guide to Traffic Generating Developments 2002 and RMS Technical Direction
2013/04a (TDT 2013/4a), as follows.
Residential Uses
TDT 2013/ 04 provides updated rates for high density residential flat dwellings (2012 surveys) that
are close to public transport services, greater than six storeys and almost exclusively residential in
nature.
TDT 2013/ 04 indicates an average AM peak hour trip generation for Sydney of 0.19 trips/ hour per
apartment, with PM peak hour rates slightly lower at 0.15 trips/ hour and Saturday midday peak
hour rates higher at 0.25 trips/ hour.
These rates have been adopted for the residential component of this assessment3.
Retail Uses
The proposal includes ground level retail space and is expected to comprise of specialty retail
stores, thus excluding major department stores and/or supermarkets.
As such, the Thursday evening rate applicable to Speciality Stores of 4.6 vehicle movements per
1,00m2 GLFA as detailed in the RMS Guide (2002) has been adopted for the retail space. It has
also been assumed that retail activity would be lower during the AM peak hour than the PM peak
hour. As such, the traffic generated by the retail component for the AM has been assessed
based on a rate 50% that of the PM peak hour.
The RMS Guide’s Saturday rate for Speciality Stores of 10.7 vehicle movements per 1,00m2 GLFA
has also been adopted for the retail spaces.
It is also considered that the retail uses will largely operate as complementary to not only the
proposed residential and commercial uses, but all surrounding existing land uses given the site’s
proximity to the City Centre and a variety of users in a highly densely populated area. Retail
analysis suggests that approximately 40% of retail activity within mixed use developments is
3 Rates per car space have not been adopted given that the residential car parking provisions has not yet been finalised.
5
16S1325000 // 10/06/16
Transport Impact Assessment // Issue: A
Hurstville Civic Precinct, Planning Proposal 22
generated by the residential component of the same site. That said, a conservative reduction of
25% has been applied to reflect this characteristic; suggesting that up to 75% of traffic
movements could be generated externally.
Commercial Uses
TDT 2013/4a provides the following peak hour traffic generation rates for commercial uses, which
have been adopted for the purposes of this assessment:
weekday AM peak hour – 1.6 vehicle movements per 100m2 GFA
weekday PM peak hour – 1.2 vehicle movements per 100m2 GFA.
The commercial uses are not expected to generate traffic on Saturdays, given they will largely be
closed.
Community Facilities
The proposed community facilities include function centre, library, museum and gallery uses. The
RMS Guide (2002) and TDT 2013/4a do not provide traffic generation rates for such community
facilities. As such, for the purposes of this assessment, the RMS (2002) rate for commercial use has
been adopted for the facilities that operate during the surveyed peak periods, which is 2.0
vehicle movements per 100m2 GFA.
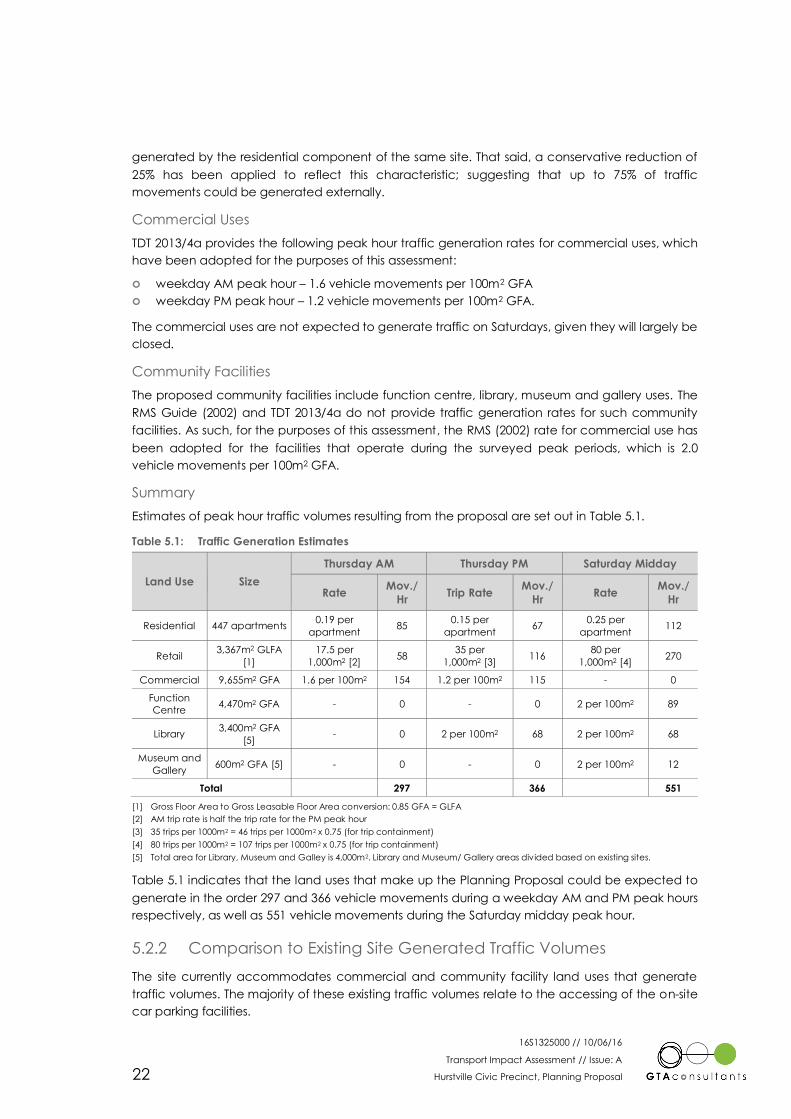
Summary
Estimates of peak hour traffic volumes resulting from the proposal are set out in Table 5.1.
Table 5.1: Traffic Generation Estimates
Land Use Size
Thursday AM Thursday PM Saturday Midday
Rate Mov./
Hr Trip Rate
Mov./
Hr Rate
Mov./
Hr
Residential 447 apartments 0.19 per
apartment 85
0.15 per
apartment 67
0.25 per
apartment 112
Retail 3,367m2 GLFA
[1]
17.5 per
1,000m2 [2] 58
35 per
1,000m2 [3] 116
80 per
1,000m2 [4] 270
Commercial 9,655m2 GFA 1.6 per 100m2 154 1.2 per 100m2 115 - 0
Function
Centre 4,470m2 GFA - 0 - 0 2 per 100m2 89
Library 3,400m2 GFA
[5] - 0 2 per 100m2 68 2 per 100m2 68
Museum and
Gallery 600m2 GFA [5] - 0 - 0 2 per 100m2 12
Total 297 366 551
[1] Gross Floor Area to Gross Leasable Floor Area conversion: 0.85 GFA = GLFA
[2] AM trip rate is half the trip rate for the PM peak hour
[3] 35 trips per 1000m2 = 46 trips per 1000m2 x 0.75 (for trip containment)
[4] 80 trips per 1000m2 = 107 trips per 1000m2 x 0.75 (for trip containment)
[5] Total area for Library, Museum and Galley is 4,000m2. Library and Museum/ Gallery areas divided based on existing sites.
Table 5.1 indicates that the land uses that make up the Planning Proposal could be expected to
generate in the order 297 and 366 vehicle movements during a weekday AM and PM peak hours
respectively, as well as 551 vehicle movements during the Saturday midday peak hour.
5.2.2 Comparison to Existing Site Generated Traffic Volumes
The site currently accommodates commercial and community facility land uses that generate
traffic volumes. The majority of these existing traffic volumes relate to the accessing of the on-site
car parking facilities.
16S1325000 // 10/06/16
Transport Impact Assessment // Issue: A
Hurstville Civic Precinct, Planning Proposal 23
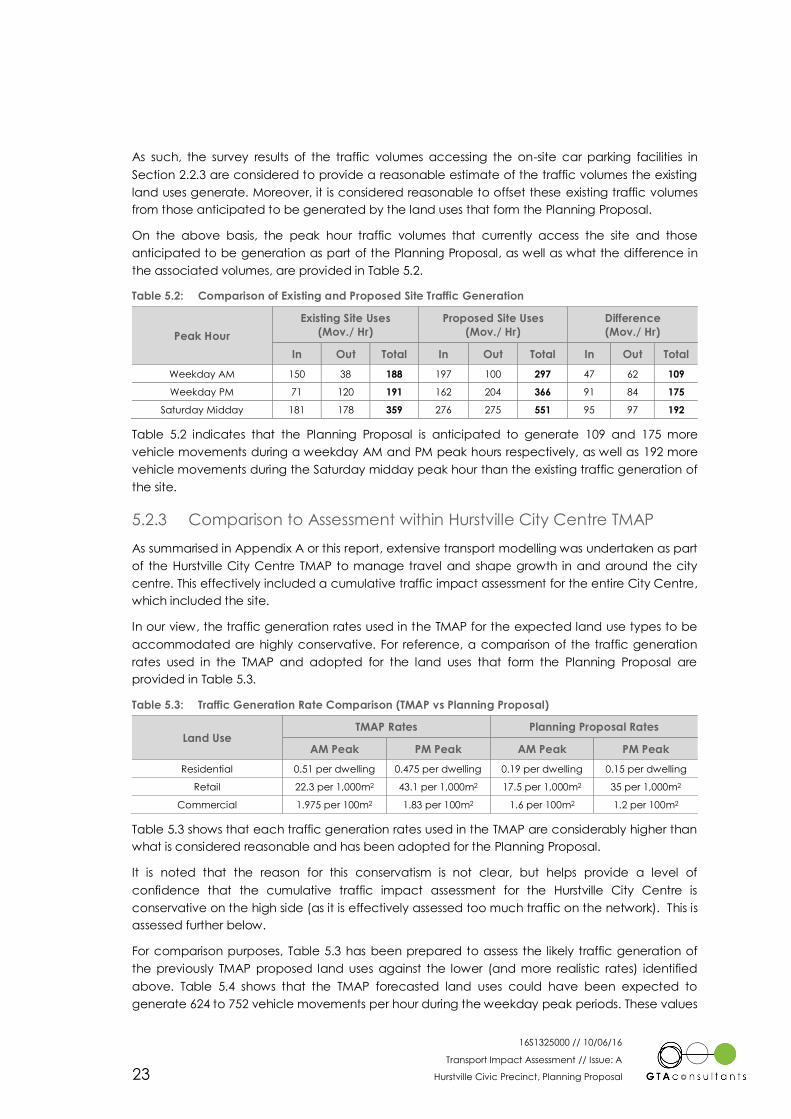
As such, the survey results of the traffic volumes accessing the on-site car parking facilities in
Section 2.2.3 are considered to provide a reasonable estimate of the traffic volumes the existing
land uses generate. Moreover, it is considered reasonable to offset these existing traffic volumes
from those anticipated to be generated by the land uses that form the Planning Proposal.
On the above basis, the peak hour traffic volumes that currently access the site and those
anticipated to be generation as part of the Planning Proposal, as well as what the difference in
the associated volumes, are provided in Table 5.2.
Table 5.2: Comparison of Existing and Proposed Site Traffic Generation
Peak Hour
Existing Site Uses
(Mov./ Hr)
Proposed Site Uses
(Mov./ Hr)
Difference
(Mov./ Hr)
In Out Total In Out Total In Out Total
Weekday AM 150 38 188 197 100 297 47 62 109
Weekday PM 71 120 191 162 204 366 91 84 175
Saturday Midday 181 178 359 276 275 551 95 97 192
Table 5.2 indicates that the Planning Proposal is anticipated to generate 109 and 175 more
vehicle movements during a weekday AM and PM peak hours respectively, as well as 192 more
vehicle movements during the Saturday midday peak hour than the existing traffic generation of
the site.
5.2.3 Comparison to Assessment within Hurstville City Centre TMAP
As summarised in Appendix A or this report, extensive transport modelling was undertaken as part
of the Hurstville City Centre TMAP to manage travel and shape growth in and around the city
centre. This effectively included a cumulative traffic impact assessment for the entire City Centre,
which included the site.
In our view, the traffic generation rates used in the TMAP for the expected land use types to be
accommodated are highly conservative. For reference, a comparison of the traffic generation
rates used in the TMAP and adopted for the land uses that form the Planning Proposal are
provided in Table 5.3.
Table 5.3: Traffic Generation Rate Comparison (TMAP vs Planning Proposal)
Land Use TMAP Rates Planning Proposal Rates
AM Peak PM Peak AM Peak PM Peak
Residential 0.51 per dwelling 0.475 per dwelling 0.19 per dwelling 0.15 per dwelling
Retail 22.3 per 1,000m2 43.1 per 1,000m2 17.5 per 1,000m2 35 per 1,000m2
Commercial 1.975 per 100m2 1.83 per 100m2 1.6 per 100m2 1.2 per 100m2
Table 5.3 shows that each traffic generation rates used in the TMAP are considerably higher than
what is considered reasonable and has been adopted for the Planning Proposal.
It is noted that the reason for this conservatism is not clear, but helps provide a level of
confidence that the cumulative traffic impact assessment for the Hurstville City Centre is
conservative on the high side (as it is effectively assessed too much traffic on the network). This is
assessed further below.
For comparison purposes, Table 5.3 has been prepared to assess the likely traffic generation of
the previously TMAP proposed land uses against the lower (and more realistic rates) identified
above. Table 5.4 shows that the TMAP forecasted land uses could have been expected to
generate 624 to 752 vehicle movements per hour during the weekday peak periods. These values
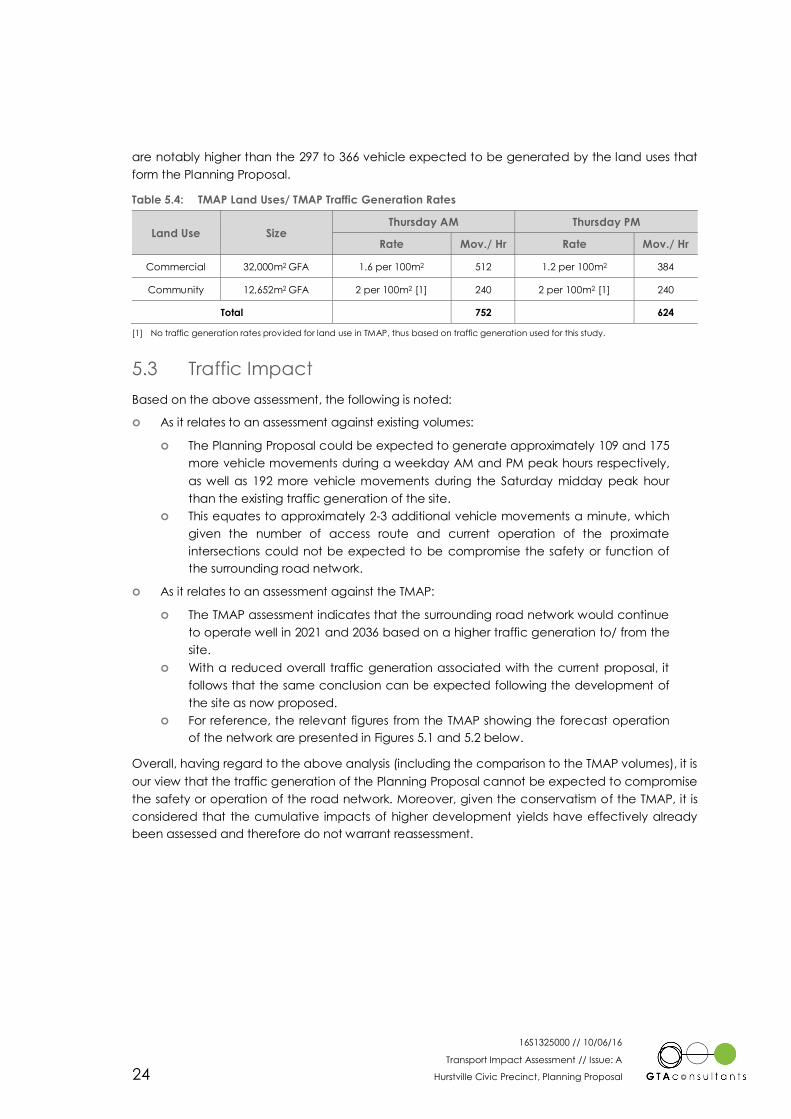
16S1325000 // 10/06/16
Transport Impact Assessment // Issue: A
Hurstville Civic Precinct, Planning Proposal 24
are notably higher than the 297 to 366 vehicle expected to be generated by the land uses that
form the Planning Proposal.
Table 5.4: TMAP Land Uses/ TMAP Traffic Generation Rates
Land Use Size Thursday AM Thursday PM
Rate Mov./ Hr Rate Mov./ Hr
Commercial 32,000m2 GFA 1.6 per 100m2 512 1.2 per 100m2 384
Community 12,652m2 GFA 2 per 100m2 [1] 240 2 per 100m2 [1] 240
Total 752 624
[1] No traffic generation rates provided for land use in TMAP, thus based on traffic generation used for this study.
5.3 Traffic Impact
Based on the above assessment, the following is noted:
As it relates to an assessment against existing volumes:
The Planning Proposal could be expected to generate approximately 109 and 175
more vehicle movements during a weekday AM and PM peak hours respectively,
as well as 192 more vehicle movements during the Saturday midday peak hour
than the existing traffic generation of the site.
This equates to approximately 2-3 additional vehicle movements a minute, which
given the number of access route and current operation of the proximate
intersections could not be expected to be compromise the safety or function of
the surrounding road network.
As it relates to an assessment against the TMAP:
The TMAP assessment indicates that the surrounding road network would continue
to operate well in 2021 and 2036 based on a higher traffic generation to/ from the
site.
With a reduced overall traffic generation associated with the current proposal, it
follows that the same conclusion can be expected following the development of
the site as now proposed.
For reference, the relevant figures from the TMAP showing the forecast operation
of the network are presented in Figures 5.1 and 5.2 below.
Overall, having regard to the above analysis (including the comparison to the TMAP volumes), it is
our view that the traffic generation of the Planning Proposal cannot be expected to compromise
the safety or operation of the road network. Moreover, given the conservatism of the TMAP, it is
considered that the cumulative impacts of higher development yields have effectively already
been assessed and therefore do not warrant reassessment.

16S1325000 // 10/06/16
Transport Impact Assessment // Issue: A
Hurstville Civic Precinct, Planning Proposal 25
Figure 5.1: 2021 Traffic Conditions – Hurstville City Centre TMAP
Base source: Hurstville City Centre TMAP, GHD 2013
Figure 5.2: 2036 Traffic Conditions – Hurstville City Centre TMAP
Base source: Hurstville City Centre TMAP, GHD 2013
Subject Site
Subject Site
16S1325000 // 10/06/16
Transport Impact Assessment // Issue: A
Hurstville Civic Precinct, Planning Proposal 26
6. Other Considerations
6.1 Loading and Waste Collection Requirements
Hurstville City Council’s DCP outlines the following:
“For commercial and light industrial developments, the requirements for the unloading and
loading of vehicles must be considered. For larger residential developments, access
consideration must be given to furniture vans, emergency vehicles and garbage trucks.”
The DCP also states that adequate space for loading, unloading, parking and manoeuvring of
delivery and service vehicles must be provided on-site, with all loading and unloading activities
undertaken within allocated loading bays. The DCP also states that all delivery vehicles must
enter and leave the site in a forward direction.
In relation to waste collection, the DCP states that convenient access is required on-site to ensure
collection vehicles can also enter, manoeuvre within and exit the site in a forward direction.
Access and collection areas must be designed to accommodate the largest collection vehicle
to service the site, noting Council does not provide collection from within private properties or
roads.
On the basis of the above and having consideration of the Planning Proposal, it is recommended
that at least five loading areas are provided, with the breakdown as follows:
One space for residential
Two spaces for retail and commercial
Two spaces for community facilities.
A delivery management plan should be adopted for the retail, commercial and community
facility components to ensure access the loading areas is available to reduce disruption within
the car park or on the surrounding road network.
6.2 Bicycle End of Trip Facilities
Hurstville City Council’s DCP provides the following minimum bicycle storage rack requirements:
Office – 1 bicycle space for every 200m2
Retail – 1 bicycle space for every 300m2
Residential – 1 bicycle space for every 3 units.
Based on the above, the Planning Proposal requires the following bicycle provisions to meet the
DCP requirements:
Office – 48 spaces
Retail – 13 spaces
Residential – 149 spaces.
The Planning Proposal is required to provide up to 210 bicycle parking spaces including a
balance for staff/ residents and visitors.
Visitor spaces should be easily accessible from public domain and areas that we well-lit with
adequate levels of natural surveillance. For staff and residents, spaces should be secured.
Communal shower, changing facilities and lockers should be provided for commercial and retail
staff.
6
16S1325000 // 10/06/16
Transport Impact Assessment // Issue: A
Hurstville Civic Precinct, Planning Proposal 27
6.3 Travel Plan
It is recommended that various user specific Travel Plans are prepared for the development
including:
a Workplace Travel Plan
a Residential Traffic Plan
a Visitor Traffic Plan.
Travel Plans are designed to reduce the reliance on private car travel, car ownership, or at least
single occupant vehicles to destinations by boosting and encouraging the use of active and
sustainable transport modes.
Organisations use travel planning as an effective tool to meet a range of different travel-related
goals. Examples include initiatives to reduce traffic congestion and/ or parking demand (both on
and off-street), reduce absenteeism, improve staff retention, increase physical activity, improve
air quality and to improve morale.
Each site has unique characteristics so the objectives, programs, initiatives and measures
contained in the travel plan must be tailored and site specific. Successful travel plans are iterative
processes supported by development management and generally delivered by a full-time staff
member (or team).
The travel plans would include:
a ‘reach’ transport goal/ target to reduce single occupant vehicle travel demand
infrastructure to support walking, cycling, motorcycling and public transport access to
the site
programs to reduce drive-alone travel behaviour by staff, visitors and customers
programs to reduce residential car ownership, such as provision of car share services
tenant policies to reduce drive-alone travel demand at the subject site
staff travel coordinator responsibilities
monitoring tools and an evaluation program to document performance.
16S1325000 // 10/06/16
Transport Impact Assessment // Issue: A
Hurstville Civic Precinct, Planning Proposal 28
7. Conclusion
Based on the analysis and discussions presented within this report, the following conclusions are
made:
i The Planning Proposal generates a DCP parking requirement of 781 spaces, for those
uses with nominated rates.
ii For the community uses, it is assumed that 141 would be sufficient to cater for the
expected demands based on the rate of current provisions.
iii As such, the proposed supply of 1,050 to 1,200 spaces is adequate. Indeed, based on
an empirical assessment of car parking demand, there is opportunity to reduce the car
parking supply for the Planning Proposal.
iv The site is expected to generate between 300 and 550 vehicle movements in any peak
hour, or 109 to 195 additional vehicle movements over the existing traffic generation of
the site.
v The results of existing conditions intersection modelling undertaken has part of this study
are consistent with the existing conditions modelling undertaken for the Hurstville TMAP
of adjacent intersections.
vi Having regard to the relatively small increase in site traffic generation, it is our view that
the traffic generation of the Planning Proposal cannot be expected to compromise the
safety or operation of the road network.
7
16S1325000 // 10/06/16
Transport Impact Assessment // Issue: A
Hurstville Civic Precinct, Planning Proposal
Appendix A
Hurstville City Centre TMAP 2013 Summary
Ap
pe
nd
ix A

16S1325000 // 10/06/16
Transport Impact Assessment // Issue: A
Hurstville Civic Precinct, Planning Proposal
The Hurstville City Centre Transport Management and Accessibility Plan (TMAP) was prepared by
GHD in June 2013 for Hurstville City Council. The TMAP was prepared to inform the Hurstville Local
Environmental Plan (LEP) and other planning controls to ensure “a coordinated and efficient
approach is taken in the planning of land use, managing the environment and investing in
transport infrastructure” (GHD, 2013).
Action Plans were established in the TMAP to manage travel and shape growth in and around
the city centre. Land use scenarios were tested as part of the study including additional
development ranging from 0m2-655,000m2 Gross Floor Area; for between 7,000 and 17,000 new
jobs and between 4,500 and 14,000 new residents.
Extensive transport modelling was undertaken using the following tools to test and gain
understanding of the relationship between land use and transport network performance:
A spreadsheet-based land use model
Multi-modal bespoke model and strategic highway (EMME) model
Paramics micro simulation model
SIDRA Intersection model.
The TMAP acknowledged that the assessment could not focus on improving capacity on the
regional road network, given it is a regional issue that will exist with or without any development
within Hurstville. Instead the study looked at the potential to influence and change how people
currently travel to and from the Hurstville City Centre, and in the future.
A summary of the key findings from TMAP are provided below:
Preferred land use arrangement is to provide 363,000m2 of additional GFA for 11,000-
14,000 new jobs (55% growth) and 9,500 new residents (104% growth).
City Centre North (area containing the Council site), along with Eastern and Western
City Centre gateways were identified to accommodate a high proportion of the
growth.
King Georges Road and the intersections along the road where identified as being
capacity deficient and required upgrades by 2021 with or without development of
Hurstville City Centre.
A designated bus corridor is required by 2021 to the west of the city centre to ensure
reliability of bus operations along the western strategic bus corridor (Forest Road and
Bridge Street) are not impacted by predicted congestion during the commuter peak
periods.
Capacity deficiencies identified along the regional road network support:
developing a transport network around major centre capacity
encouraging travel by active and public transport
managing growth by integrating land use and transport planning principles.
Potential to improve collective mode share of public and active transport from 33%
and 34% now in the AM and PM peaks to 41% and 49% by 2036 (above the 40% mode
share targets).
Additional capacity is required on future train and bus networks to cater for an
additional 3,100 to 3,500 train passengers and 1,800 to 1,900 bus passengers under
conservative transport testing scenarios.
Potential to further improve mode share by adopting further reduced parking provision
rates for new development, as well as implementing area-wide parking management
practices (time-restrictions, parking costs and enforcement).
16S1325000 // 10/06/16
Transport Impact Assessment // Issue: A
Hurstville Civic Precinct, Planning Proposal
Appendix B
Traffic Survey Results
Ap
pe
nd
ix B
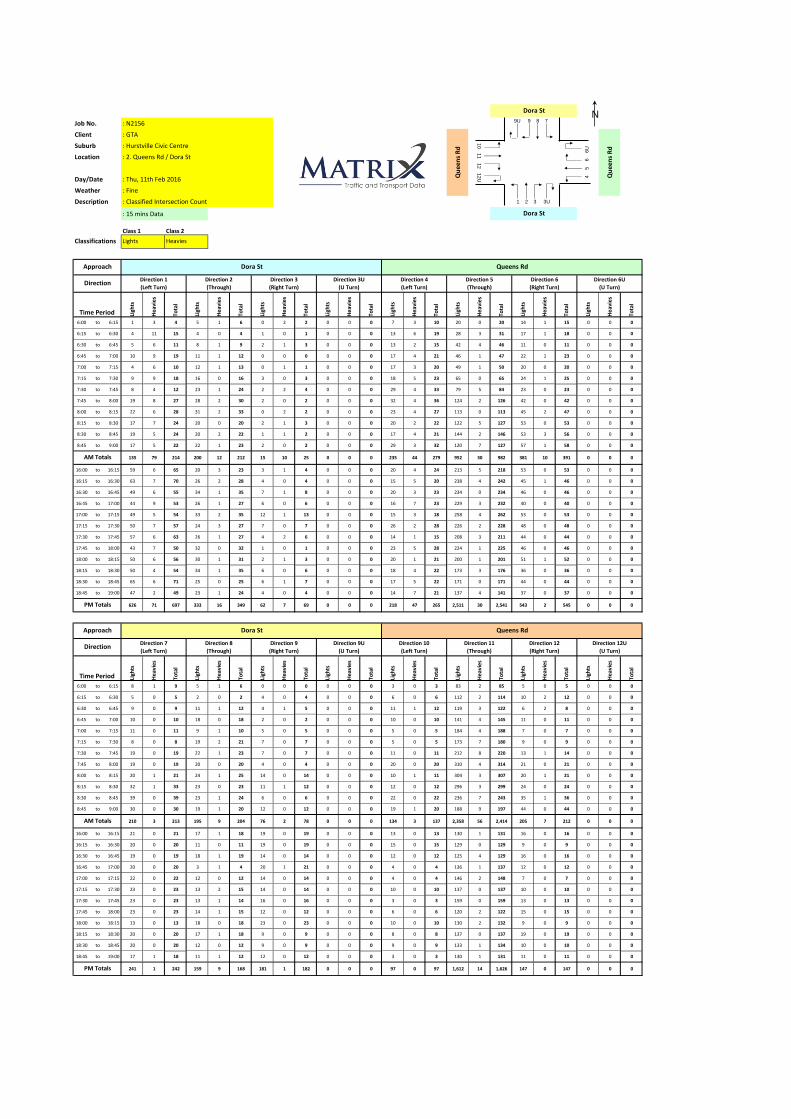
Job No. : N2156
Client : GTA
Suburb : Hurstville Civic Centre
Location : 2. Queens Rd / Dora St
Day/Date : Thu, 11th Feb 2016
Weather : Fine
Description : Classified Intersection Count
: 15 mins Data
Ligh
ts
He
avie
s
Tota
l
Ligh
ts
He
avie
s
Tota
l
Ligh
ts
He
avie
s
Tota
l
Ligh
ts
He
avie
s
Tota
l
Ligh
ts
He
avie
s
Tota
l
Ligh
ts
He
avie
s
Tota
l
Ligh
ts
He
avie
s
Tota
l
Ligh
ts
He
avie
s
Tota
l
6:00 to 6:15 1 3 4 5 1 6 0 2 2 0 0 0 7 3 10 20 0 20 14 1 15 0 0 0
6:15 to 6:30 4 11 15 4 0 4 1 0 1 0 0 0 13 6 19 28 3 31 17 1 18 0 0 0
6:30 to 6:45 5 6 11 8 1 9 2 1 3 0 0 0 13 2 15 42 4 46 11 0 11 0 0 0
6:45 to 7:00 10 9 19 11 1 12 0 0 0 0 0 0 17 4 21 46 1 47 22 1 23 0 0 0
7:00 to 7:15 4 6 10 12 1 13 0 1 1 0 0 0 17 3 20 49 1 50 20 0 20 0 0 0
7:15 to 7:30 9 9 18 16 0 16 3 0 3 0 0 0 18 5 23 65 0 65 24 1 25 0 0 0
7:30 to 7:45 8 4 12 23 1 24 2 2 4 0 0 0 29 4 33 79 5 84 23 0 23 0 0 0
7:45 to 8:00 19 8 27 28 2 30 2 0 2 0 0 0 32 4 36 124 2 126 42 0 42 0 0 0
8:00 to 8:15 22 6 28 31 2 33 0 2 2 0 0 0 23 4 27 113 0 113 45 2 47 0 0 0
8:15 to 8:30 17 7 24 20 0 20 2 1 3 0 0 0 20 2 22 122 5 127 53 0 53 0 0 0
8:30 to 8:45 19 5 24 20 2 22 1 1 2 0 0 0 17 4 21 144 2 146 53 3 56 0 0 0
8:45 to 9:00 17 5 22 22 1 23 2 0 2 0 0 0 29 3 32 120 7 127 57 1 58 0 0 0
135 79 214 200 12 212 15 10 25 0 0 0 235 44 279 952 30 982 381 10 391 0 0 0
16:00 to 16:15 59 6 65 20 3 23 3 1 4 0 0 0 20 4 24 213 5 218 53 0 53 0 0 0
16:15 to 16:30 63 7 70 26 2 28 4 0 4 0 0 0 15 5 20 238 4 242 45 1 46 0 0 0
16:30 to 16:45 49 6 55 34 1 35 7 1 8 0 0 0 20 3 23 234 0 234 46 0 46 0 0 0
16:45 to 17:00 44 9 53 26 1 27 6 0 6 0 0 0 16 7 23 229 3 232 40 0 40 0 0 0
17:00 to 17:15 49 5 54 33 2 35 12 1 13 0 0 0 15 3 18 258 4 262 53 0 53 0 0 0
17:15 to 17:30 50 7 57 24 3 27 7 0 7 0 0 0 26 2 28 226 2 228 48 0 48 0 0 0
17:30 to 17:45 57 6 63 26 1 27 4 2 6 0 0 0 14 1 15 208 3 211 44 0 44 0 0 0
17:45 to 18:00 43 7 50 32 0 32 1 0 1 0 0 0 23 5 28 224 1 225 46 0 46 0 0 0
18:00 to 18:15 50 6 56 30 1 31 2 1 3 0 0 0 20 1 21 200 1 201 51 1 52 0 0 0
18:15 to 18:30 50 4 54 34 1 35 6 0 6 0 0 0 18 4 22 173 3 176 36 0 36 0 0 0
18:30 to 18:45 65 6 71 25 0 25 6 1 7 0 0 0 17 5 22 171 0 171 44 0 44 0 0 0
18:45 to 19:00 47 2 49 23 1 24 4 0 4 0 0 0 14 7 21 137 4 141 37 0 37 0 0 0
626 71 697 333 16 349 62 7 69 0 0 0 218 47 265 2,511 30 2,541 543 2 545 0 0 0
Ligh
ts
He
avie
s
Tota
l
Ligh
ts
He
avie
s
Tota
l
Ligh
ts
He
avie
s
Tota
l
Ligh
ts
He
avie
s
Tota
l
Ligh
ts
He
avie
s
Tota
l
Ligh
ts
He
avie
s
Tota
l
Ligh
ts
He
avie
s
Tota
l
Ligh
ts
He
avie
s
Tota
l
6:00 to 6:15 8 1 9 5 1 6 0 0 0 0 0 0 3 0 3 83 2 85 5 0 5 0 0 0
6:15 to 6:30 5 0 5 2 0 2 4 0 4 0 0 0 6 0 6 112 2 114 10 2 12 0 0 0
6:30 to 6:45 9 0 9 11 1 12 4 1 5 0 0 0 11 1 12 119 3 122 6 2 8 0 0 0
6:45 to 7:00 10 0 10 18 0 18 2 0 2 0 0 0 10 0 10 141 4 145 11 0 11 0 0 0
7:00 to 7:15 11 0 11 9 1 10 5 0 5 0 0 0 5 0 5 184 4 188 7 0 7 0 0 0
7:15 to 7:30 8 0 8 19 2 21 7 0 7 0 0 0 5 0 5 173 7 180 9 0 9 0 0 0
7:30 to 7:45 19 0 19 22 1 23 7 0 7 0 0 0 11 0 11 212 8 220 13 1 14 0 0 0
7:45 to 8:00 19 0 19 20 0 20 4 0 4 0 0 0 20 0 20 310 4 314 21 0 21 0 0 0
8:00 to 8:15 20 1 21 24 1 25 14 0 14 0 0 0 10 1 11 304 3 307 20 1 21 0 0 0
8:15 to 8:30 32 1 33 23 0 23 11 1 12 0 0 0 12 0 12 296 3 299 24 0 24 0 0 0
8:30 to 8:45 39 0 39 23 1 24 6 0 6 0 0 0 22 0 22 236 7 243 35 1 36 0 0 0
8:45 to 9:00 30 0 30 19 1 20 12 0 12 0 0 0 19 1 20 188 9 197 44 0 44 0 0 0
210 3 213 195 9 204 76 2 78 0 0 0 134 3 137 2,358 56 2,414 205 7 212 0 0 0
16:00 to 16:15 21 0 21 17 1 18 19 0 19 0 0 0 13 0 13 130 1 131 16 0 16 0 0 0
16:15 to 16:30 20 0 20 11 0 11 19 0 19 0 0 0 15 0 15 129 0 129 9 0 9 0 0 0
16:30 to 16:45 19 0 19 18 1 19 14 0 14 0 0 0 12 0 12 125 4 129 16 0 16 0 0 0
16:45 to 17:00 20 0 20 3 1 4 20 1 21 0 0 0 4 0 4 136 1 137 12 0 12 0 0 0
17:00 to 17:15 22 0 22 12 0 12 14 0 14 0 0 0 4 0 4 146 2 148 7 0 7 0 0 0
17:15 to 17:30 23 0 23 13 2 15 14 0 14 0 0 0 10 0 10 137 0 137 10 0 10 0 0 0
17:30 to 17:45 23 0 23 13 1 14 16 0 16 0 0 0 3 0 3 159 0 159 13 0 13 0 0 0
17:45 to 18:00 23 0 23 14 1 15 12 0 12 0 0 0 6 0 6 120 2 122 15 0 15 0 0 0
18:00 to 18:15 13 0 13 18 0 18 23 0 23 0 0 0 10 0 10 130 2 132 9 0 9 0 0 0
18:15 to 18:30 20 0 20 17 1 18 9 0 9 0 0 0 8 0 8 137 0 137 19 0 19 0 0 0
18:30 to 18:45 20 0 20 12 0 12 9 0 9 0 0 0 9 0 9 133 1 134 10 0 10 0 0 0
18:45 to 19:00 17 1 18 11 1 12 12 0 12 0 0 0 3 0 3 130 1 131 11 0 11 0 0 0
241 1 242 159 9 168 181 1 182 0 0 0 97 0 97 1,612 14 1,626 147 0 147 0 0 0
Qu
een
s R
d
Lights
Direction 12
(Right Turn)
Direction 12U
(U Turn)
Direction 7
(Left Turn)
Direction 8
(Through)
Direction 9
(Right Turn)
Direction 9U
(U Turn)
Direction 10
(Left Turn)
Direction 11
(Through)
Direction 6
(Right Turn)
Direction 6U
(U Turn)
Direction 3
(Right Turn)
Direction 3U
(U Turn)
Direction 4
(Left Turn)
Direction 5
(Through)
Dora St
Dora St
Class 2Class 1
Qu
een
s R
d
Dora St Queens Rd
Queens Rd
Direction 1
(Left Turn)
Classifications Heavies
AM Totals
Approach
Direction
Time Period
Direction 2
(Through)
Dora St
PM Totals
Approach
Direction
Time Period
AM Totals
PM Totals
10 1
1 1
2 1
2U
4 5
6
6
U
1 2 3 3U
9U 9 8 7N

Job No. : N2156
Client : GTA
Suburb : Hurstville Civic Centre
Location : 2. Queens Rd / Dora St
Day/Date : Thu, 11th Feb 2016
Weather : Fine
Description : Classified Intersection Count
: Hourly Summary
Ligh
ts
He
avie
s
Tota
l
Ligh
ts
He
avie
s
Tota
l
Ligh
ts
He
avie
s
Tota
l
Ligh
ts
He
avie
s
Tota
l
Ligh
ts
He
avie
s
Tota
l
Ligh
ts
He
avie
s
Tota
l
Ligh
ts
He
avie
s
Tota
l
Ligh
ts
He
avie
s
Tota
l
6:00 to 7:00 20 29 49 28 3 31 3 3 6 0 0 0 50 15 65 136 8 144 64 3 67 0 0 0
6:15 to 7:15 23 32 55 35 3 38 3 2 5 0 0 0 60 15 75 165 9 174 70 2 72 0 0 0
6:30 to 7:30 28 30 58 47 3 50 5 2 7 0 0 0 65 14 79 202 6 208 77 2 79 0 0 0
6:45 to 7:45 31 28 59 62 3 65 5 3 8 0 0 0 81 16 97 239 7 246 89 2 91 0 0 0
7:00 to 8:00 40 27 67 79 4 83 7 3 10 0 0 0 96 16 112 317 8 325 109 1 110 0 0 0
7:15 to 8:15 58 27 85 98 5 103 7 4 11 0 0 0 102 17 119 381 7 388 134 3 137 0 0 0
7:30 to 8:30 66 25 91 102 5 107 6 5 11 0 0 0 104 14 118 438 12 450 163 2 165 0 0 0
7:45 to 8:45 77 26 103 99 6 105 5 4 9 0 0 0 92 14 106 503 9 512 193 5 198 0 0 0
8:00 to 9:00 75 23 98 93 5 98 5 4 9 0 0 0 89 13 102 499 14 513 208 6 214 0 0 0
135 79 214 200 12 212 15 10 25 0 0 0 235 44 279 952 30 982 381 10 391 0 0 0
16:00 to 17:00 215 28 243 106 7 113 20 2 22 0 0 0 71 19 90 914 12 926 184 1 185 0 0 0
16:15 to 17:15 205 27 232 119 6 125 29 2 31 0 0 0 66 18 84 959 11 970 184 1 185 0 0 0
16:30 to 17:30 192 27 219 117 7 124 32 2 34 0 0 0 77 15 92 947 9 956 187 0 187 0 0 0
16:45 to 17:45 200 27 227 109 7 116 29 3 32 0 0 0 71 13 84 921 12 933 185 0 185 0 0 0
17:00 to 18:00 199 25 224 115 6 121 24 3 27 0 0 0 78 11 89 916 10 926 191 0 191 0 0 0
17:15 to 18:15 200 26 226 112 5 117 14 3 17 0 0 0 83 9 92 858 7 865 189 1 190 0 0 0
17:30 to 18:30 200 23 223 122 3 125 13 3 16 0 0 0 75 11 86 805 8 813 177 1 178 0 0 0
17:45 to 18:45 208 23 231 121 2 123 15 2 17 0 0 0 78 15 93 768 5 773 177 1 178 0 0 0
18:00 to 19:00 212 18 230 112 3 115 18 2 20 0 0 0 69 17 86 681 8 689 168 1 169 0 0 0
626 71 697 333 16 349 62 7 69 0 0 0 218 47 265 2,511 30 2,541 543 2 545 0 0 0
Ligh
ts
He
avie
s
Tota
l
Ligh
ts
He
avie
s
Tota
l
Ligh
ts
He
avie
s
Tota
l
Ligh
ts
He
avie
s
Tota
l
Ligh
ts
He
avie
s
Tota
l
Ligh
ts
He
avie
s
Tota
l
Ligh
ts
He
avie
s
Tota
l
Ligh
ts
He
avie
s
Tota
l
6:00 to 7:00 32 1 33 36 2 38 10 1 11 0 0 0 30 1 31 455 11 466 32 4 36 0 0 0
6:15 to 7:15 35 0 35 40 2 42 15 1 16 0 0 0 32 1 33 556 13 569 34 4 38 0 0 0
6:30 to 7:30 38 0 38 57 4 61 18 1 19 0 0 0 31 1 32 617 18 635 33 2 35 0 0 0
6:45 to 7:45 48 0 48 68 4 72 21 0 21 0 0 0 31 0 31 710 23 733 40 1 41 0 0 0
7:00 to 8:00 57 0 57 70 4 74 23 0 23 0 0 0 41 0 41 879 23 902 50 1 51 0 0 0
7:15 to 8:15 66 1 67 85 4 89 32 0 32 0 0 0 46 1 47 999 22 1,021 63 2 65 0 0 0
7:30 to 8:30 90 2 92 89 2 91 36 1 37 0 0 0 53 1 54 1,122 18 1,140 78 2 80 0 0 0
7:45 to 8:45 110 2 112 90 2 92 35 1 36 0 0 0 64 1 65 1,146 17 1,163 100 2 102 0 0 0
8:00 to 9:00 121 2 123 89 3 92 43 1 44 0 0 0 63 2 65 1,024 22 1,046 123 2 125 0 0 0
210 3 213 195 9 204 76 2 78 0 0 0 134 3 137 2,358 56 2,414 205 7 212 0 0 0
16:00 to 17:00 80 0 80 49 3 52 72 1 73 0 0 0 44 0 44 520 6 526 53 0 53 0 0 0
16:15 to 17:15 81 0 81 44 2 46 67 1 68 0 0 0 35 0 35 536 7 543 44 0 44 0 0 0
16:30 to 17:30 84 0 84 46 4 50 62 1 63 0 0 0 30 0 30 544 7 551 45 0 45 0 0 0
16:45 to 17:45 88 0 88 41 4 45 64 1 65 0 0 0 21 0 21 578 3 581 42 0 42 0 0 0
17:00 to 18:00 91 0 91 52 4 56 56 0 56 0 0 0 23 0 23 562 4 566 45 0 45 0 0 0
17:15 to 18:15 82 0 82 58 4 62 65 0 65 0 0 0 29 0 29 546 4 550 47 0 47 0 0 0
17:30 to 18:30 79 0 79 62 3 65 60 0 60 0 0 0 27 0 27 546 4 550 56 0 56 0 0 0
17:45 to 18:45 76 0 76 61 2 63 53 0 53 0 0 0 33 0 33 520 5 525 53 0 53 0 0 0
18:00 to 19:00 70 1 71 58 2 60 53 0 53 0 0 0 30 0 30 530 4 534 49 0 49 0 0 0
241 1 242 159 9 168 181 1 182 0 0 0 97 0 97 1,612 14 1,626 147 0 147 0 0 0
Direction 1
(Left Turn)
Queens Rd
Dora St
Dora St
Dora St
Qu
een
s R
d
Qu
een
s R
d
Approach
Time Period
Direction 2
(Through)
AM Totals
PM Totals
Approach
Direction
Time Period
AM Totals
PM Totals
DirectionDirection 7
(Left Turn)
Direction 8
(Through)
Direction 9
(Right Turn)
Direction 9U
(U Turn)
Direction 3
(Right Turn)
Direction 12
(Right Turn)
Direction 12U
(U Turn)
Direction 4
(Left Turn)
Direction 5
(Through)
Queens Rd
Direction 6
(Right Turn)
Direction 6U
(U Turn)
Direction 10
(Left Turn)
Direction 11
(Through)
Direction 3U
(U Turn)
Dora St
10 1
1 1
2 1
2U
4 5
6
6
U
1 2 3 3U
9U 9 8 7N
Job No. : N2156
Client : GTA
Suburb : Hurstville Civic Centre
Location : 2. Queens Rd / Dora St
Day/Date : Sat, 13th Feb 2016
Weather : Fine
Description : Classified Intersection Count
: 15 mins Data
Ligh
ts
He
avie
s
Tota
l
Ligh
ts
He
avie
s
Tota
l
Ligh
ts
He
avie
s
Tota
l
Ligh
ts
He
avie
s
Tota
l
Ligh
ts
He
avie
s
Tota
l
Ligh
ts
He
avie
s
Tota
l
Ligh
ts
He
avie
s
Tota
l
Ligh
ts
He
avie
s
Tota
l
11:00 to 11:15 40 3 43 39 0 39 6 0 6 0 0 0 12 2 14 163 3 166 29 1 30 0 0 0
11:15 to 11:30 58 4 62 26 2 28 11 0 11 0 0 0 17 3 20 174 2 176 33 0 33 0 0 0
11:30 to 11:45 69 4 73 20 0 20 8 1 9 0 0 0 18 2 20 154 1 155 51 0 51 0 0 0
11:45 to 12:00 61 5 66 25 1 26 7 0 7 0 0 0 16 3 19 151 1 152 40 0 40 0 0 0
12:00 to 12:15 48 2 50 28 1 29 5 1 6 0 0 0 14 4 18 159 4 163 46 0 46 0 0 0
12:15 to 12:30 56 4 60 28 0 28 4 0 4 0 0 0 13 0 13 150 1 151 28 0 28 0 0 0
12:30 to 12:45 55 4 59 19 1 20 10 0 10 0 0 0 15 4 19 139 4 143 29 0 29 0 0 0
12:45 to 13:00 52 3 55 21 0 21 8 1 9 0 0 0 16 3 19 153 2 155 52 0 52 0 0 0
13:00 to 13:15 63 5 68 27 1 28 5 0 5 0 0 0 15 1 16 174 3 177 40 0 40 0 0 0
13:15 to 13:30 51 3 54 31 0 31 7 1 8 0 0 0 21 2 23 165 1 166 32 1 33 0 0 0
13:30 to 13:45 45 5 50 27 1 28 5 0 5 0 0 0 17 1 18 166 2 168 46 0 46 0 0 0
13:45 to 14:00 58 4 62 34 1 35 9 0 9 0 0 0 17 4 21 178 0 178 35 0 35 0 0 0
656 46 702 325 8 333 85 4 89 0 0 0 191 29 220 1,926 24 1,950 461 2 463 0 0 0
Ligh
ts
He
avie
s
Tota
l
Ligh
ts
He
avie
s
Tota
l
Ligh
ts
He
avie
s
Tota
l
Ligh
ts
He
avie
s
Tota
l
Ligh
ts
He
avie
s
Tota
l
Ligh
ts
He
avie
s
Tota
l
Ligh
ts
He
avie
s
Tota
l
Ligh
ts
He
avie
s
Tota
l
11:00 to 11:15 24 0 24 21 1 22 4 0 4 0 0 0 11 0 11 159 1 160 28 0 28 0 0 0
11:15 to 11:30 27 0 27 19 0 19 7 0 7 0 0 0 13 0 13 175 0 175 27 0 27 0 0 0
11:30 to 11:45 27 0 27 7 0 7 11 0 11 0 0 0 12 0 12 145 2 147 9 0 9 0 0 0
11:45 to 12:00 24 0 24 11 2 13 8 0 8 0 0 0 20 0 20 180 2 182 19 0 19 0 0 0
12:00 to 12:15 24 1 25 8 0 8 15 0 15 0 0 0 17 0 17 162 1 163 23 0 23 0 0 0
12:15 to 12:30 24 0 24 8 1 9 8 0 8 0 0 0 10 0 10 158 1 159 20 0 20 0 0 0
12:30 to 12:45 24 0 24 5 0 5 14 0 14 0 0 0 10 0 10 170 0 170 12 0 12 0 0 0
12:45 to 13:00 23 0 23 7 1 8 10 0 10 0 0 0 12 0 12 157 2 159 18 0 18 0 0 0
13:00 to 13:15 30 0 30 11 0 11 15 0 15 0 0 0 6 0 6 168 2 170 23 1 24 0 0 0
13:15 to 13:30 28 0 28 8 1 9 11 0 11 0 0 0 7 0 7 140 2 142 17 0 17 0 0 0
13:30 to 13:45 24 0 24 8 0 8 12 0 12 0 0 0 13 0 13 156 3 159 16 0 16 0 0 0
13:45 to 14:00 28 0 28 16 1 17 11 0 11 0 0 0 12 0 12 130 1 131 8 0 8 0 0 0
307 1 308 129 7 136 126 0 126 0 0 0 143 0 143 1,900 17 1,917 220 1 221 0 0 0
Time Period
Total
Classifications Heavies
Total
Approach
Direction
Time Period
Direction 2
(Through)
Dora St
Approach
Direction
Dora St
Dora St
Class 2Class 1
Qu
een
s R
d
Dora St Queens Rd
Queens Rd
Direction 1
(Left Turn)
Direction 6
(Right Turn)
Qu
een
s R
d
Lights
Direction 12
(Right Turn)
Direction 12U
(U Turn)
Direction 7
(Left Turn)
Direction 8
(Through)
Direction 9
(Right Turn)
Direction 9U
(U Turn)
Direction 10
(Left Turn)
Direction 11
(Through)
Direction 6U
(U Turn)
Direction 3
(Right Turn)
Direction 3U
(U Turn)
Direction 4
(Left Turn)
Direction 5
(Through)
10 1
1 1
2 1
2U
4
5
6
6U
1 2 3 3U
9U 9 8 7N
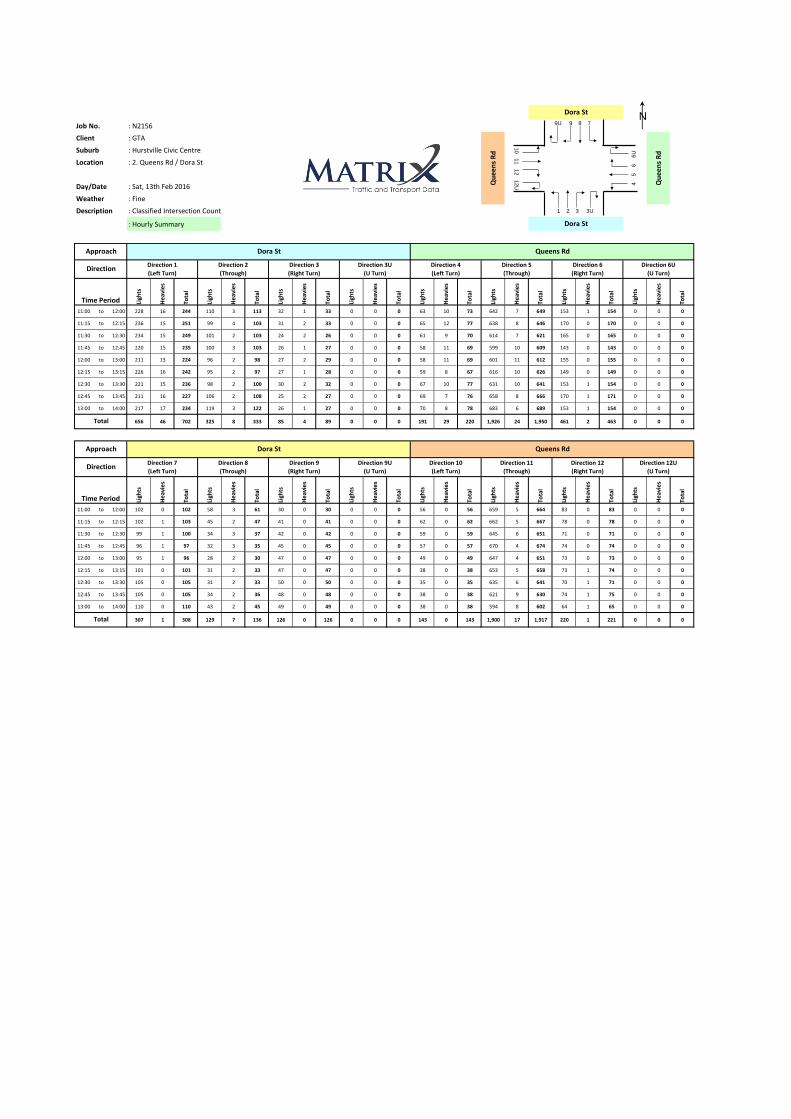
Job No. : N2156
Client : GTA
Suburb : Hurstville Civic Centre
Location : 2. Queens Rd / Dora St
Day/Date : Sat, 13th Feb 2016
Weather : Fine
Description : Classified Intersection Count
: Hourly Summary
Ligh
ts
He
avie
s
Tota
l
Ligh
ts
He
avie
s
Tota
l
Ligh
ts
He
avie
s
Tota
l
Ligh
ts
He
avie
s
Tota
l
Ligh
ts
He
avie
s
Tota
l
Ligh
ts
He
avie
s
Tota
l
Ligh
ts
He
avie
s
Tota
l
Ligh
ts
He
avie
s
Tota
l
11:00 to 12:00 228 16 244 110 3 113 32 1 33 0 0 0 63 10 73 642 7 649 153 1 154 0 0 0
11:15 to 12:15 236 15 251 99 4 103 31 2 33 0 0 0 65 12 77 638 8 646 170 0 170 0 0 0
11:30 to 12:30 234 15 249 101 2 103 24 2 26 0 0 0 61 9 70 614 7 621 165 0 165 0 0 0
11:45 to 12:45 220 15 235 100 3 103 26 1 27 0 0 0 58 11 69 599 10 609 143 0 143 0 0 0
12:00 to 13:00 211 13 224 96 2 98 27 2 29 0 0 0 58 11 69 601 11 612 155 0 155 0 0 0
12:15 to 13:15 226 16 242 95 2 97 27 1 28 0 0 0 59 8 67 616 10 626 149 0 149 0 0 0
12:30 to 13:30 221 15 236 98 2 100 30 2 32 0 0 0 67 10 77 631 10 641 153 1 154 0 0 0
12:45 to 13:45 211 16 227 106 2 108 25 2 27 0 0 0 69 7 76 658 8 666 170 1 171 0 0 0
13:00 to 14:00 217 17 234 119 3 122 26 1 27 0 0 0 70 8 78 683 6 689 153 1 154 0 0 0
656 46 702 325 8 333 85 4 89 0 0 0 191 29 220 1,926 24 1,950 461 2 463 0 0 0
Ligh
ts
He
avie
s
Tota
l
Ligh
ts
He
avie
s
Tota
l
Ligh
ts
He
avie
s
Tota
l
Ligh
ts
He
avie
s
Tota
l
Ligh
ts
He
avie
s
Tota
l
Ligh
ts
He
avie
s
Tota
l
Ligh
ts
He
avie
s
Tota
l
Ligh
ts
He
avie
s
Tota
l
11:00 to 12:00 102 0 102 58 3 61 30 0 30 0 0 0 56 0 56 659 5 664 83 0 83 0 0 0
11:15 to 12:15 102 1 103 45 2 47 41 0 41 0 0 0 62 0 62 662 5 667 78 0 78 0 0 0
11:30 to 12:30 99 1 100 34 3 37 42 0 42 0 0 0 59 0 59 645 6 651 71 0 71 0 0 0
11:45 to 12:45 96 1 97 32 3 35 45 0 45 0 0 0 57 0 57 670 4 674 74 0 74 0 0 0
12:00 to 13:00 95 1 96 28 2 30 47 0 47 0 0 0 49 0 49 647 4 651 73 0 73 0 0 0
12:15 to 13:15 101 0 101 31 2 33 47 0 47 0 0 0 38 0 38 653 5 658 73 1 74 0 0 0
12:30 to 13:30 105 0 105 31 2 33 50 0 50 0 0 0 35 0 35 635 6 641 70 1 71 0 0 0
12:45 to 13:45 105 0 105 34 2 36 48 0 48 0 0 0 38 0 38 621 9 630 74 1 75 0 0 0
13:00 to 14:00 110 0 110 43 2 45 49 0 49 0 0 0 38 0 38 594 8 602 64 1 65 0 0 0
307 1 308 129 7 136 126 0 126 0 0 0 143 0 143 1,900 17 1,917 220 1 221 0 0 0
Direction 8
(Through)
Direction 9
(Right Turn)
Direction 9U
(U Turn)
Direction 3
(Right Turn)
Direction 12
(Right Turn)
Direction 12U
(U Turn)
Direction 4
(Left Turn)
Direction 5
(Through)
Queens Rd
Direction 6
(Right Turn)
Direction 6U
(U Turn)
Direction 10
(Left Turn)
Direction 11
(Through)
Time Period
Total
DirectionDirection 7
(Left Turn)
Approach
DirectionDirection 1
(Left Turn)
Approach
Time Period
Direction 2
(Through)
Total
Direction 3U
(U Turn)
Dora St
Queens Rd
Dora St
Dora St
Dora St
Qu
een
s R
d
Qu
een
s R
d
10 1
1 1
2 1
2U
4
5
6
6U
1 2 3 3U
9U 9 8 7N
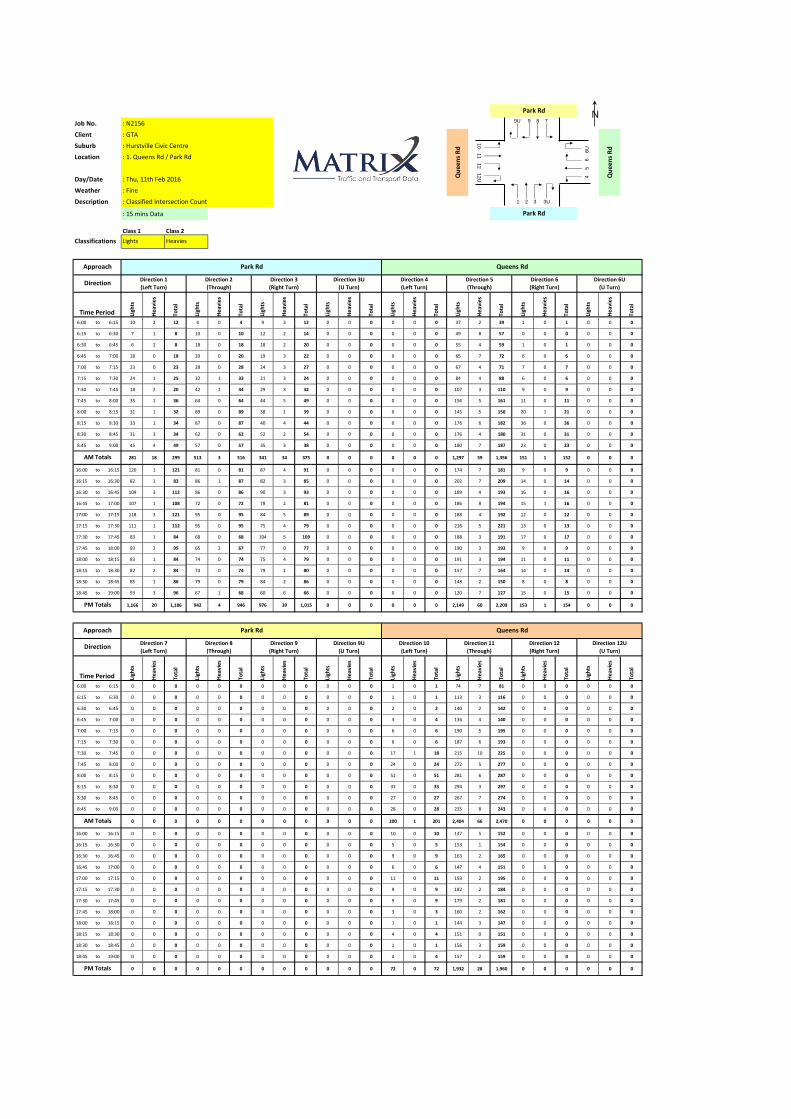
Job No. : N2156
Client : GTA
Suburb : Hurstville Civic Centre
Location : 1. Queens Rd / Park Rd
Day/Date : Thu, 11th Feb 2016
Weather : Fine
Description : Classified Intersection Count
: 15 mins Data
Ligh
ts
He
avie
s
Tota
l
Ligh
ts
He
avie
s
Tota
l
Ligh
ts
He
avie
s
Tota
l
Ligh
ts
He
avie
s
Tota
l
Ligh
ts
He
avie
s
Tota
l
Ligh
ts
He
avie
s
Tota
l
Ligh
ts
He
avie
s
Tota
l
Ligh
ts
He
avie
s
Tota
l
6:00 to 6:15 10 2 12 4 0 4 9 3 12 0 0 0 0 0 0 37 2 39 1 0 1 0 0 0
6:15 to 6:30 7 1 8 10 0 10 12 2 14 0 0 0 0 0 0 49 8 57 0 0 0 0 0 0
6:30 to 6:45 6 2 8 18 0 18 18 2 20 0 0 0 0 0 0 55 4 59 1 0 1 0 0 0
6:45 to 7:00 18 0 18 20 0 20 19 3 22 0 0 0 0 0 0 65 7 72 6 0 6 0 0 0
7:00 to 7:15 23 0 23 28 0 28 24 3 27 0 0 0 0 0 0 67 4 71 7 0 7 0 0 0
7:15 to 7:30 24 1 25 32 1 33 21 3 24 0 0 0 0 0 0 84 4 88 6 0 6 0 0 0
7:30 to 7:45 18 2 20 42 2 44 29 3 32 0 0 0 0 0 0 107 3 110 9 0 9 0 0 0
7:45 to 8:00 35 1 36 64 0 64 44 5 49 0 0 0 0 0 0 156 5 161 11 0 11 0 0 0
8:00 to 8:15 31 1 32 89 0 89 38 1 39 0 0 0 0 0 0 145 5 150 20 1 21 0 0 0
8:15 to 8:30 33 1 34 87 0 87 40 4 44 0 0 0 0 0 0 176 6 182 36 0 36 0 0 0
8:30 to 8:45 31 3 34 62 0 62 52 2 54 0 0 0 0 0 0 176 4 180 31 0 31 0 0 0
8:45 to 9:00 45 4 49 57 0 57 35 3 38 0 0 0 0 0 0 180 7 187 23 0 23 0 0 0
281 18 299 513 3 516 341 34 375 0 0 0 0 0 0 1,297 59 1,356 151 1 152 0 0 0
16:00 to 16:15 120 1 121 81 0 81 87 4 91 0 0 0 0 0 0 174 7 181 9 0 9 0 0 0
16:15 to 16:30 82 1 83 86 1 87 82 3 85 0 0 0 0 0 0 202 7 209 14 0 14 0 0 0
16:30 to 16:45 109 3 112 86 0 86 90 3 93 0 0 0 0 0 0 189 4 193 16 0 16 0 0 0
16:45 to 17:00 107 1 108 72 0 72 79 2 81 0 0 0 0 0 0 186 8 194 15 1 16 0 0 0
17:00 to 17:15 118 3 121 95 0 95 84 5 89 0 0 0 0 0 0 188 4 192 12 0 12 0 0 0
17:15 to 17:30 111 1 112 95 0 95 75 4 79 0 0 0 0 0 0 216 5 221 13 0 13 0 0 0
17:30 to 17:45 83 1 84 68 0 68 104 5 109 0 0 0 0 0 0 188 3 191 17 0 17 0 0 0
17:45 to 18:00 93 2 95 65 2 67 77 0 77 0 0 0 0 0 0 190 3 193 9 0 9 0 0 0
18:00 to 18:15 83 1 84 74 0 74 75 4 79 0 0 0 0 0 0 191 3 194 11 0 11 0 0 0
18:15 to 18:30 82 2 84 74 0 74 79 1 80 0 0 0 0 0 0 157 7 164 14 0 14 0 0 0
18:30 to 18:45 85 1 86 79 0 79 84 2 86 0 0 0 0 0 0 148 2 150 8 0 8 0 0 0
18:45 to 19:00 93 3 96 67 1 68 60 6 66 0 0 0 0 0 0 120 7 127 15 0 15 0 0 0
1,166 20 1,186 942 4 946 976 39 1,015 0 0 0 0 0 0 2,149 60 2,209 153 1 154 0 0 0
Ligh
ts
He
avie
s
Tota
l
Ligh
ts
He
avie
s
Tota
l
Ligh
ts
He
avie
s
Tota
l
Ligh
ts
He
avie
s
Tota
l
Ligh
ts
He
avie
s
Tota
l
Ligh
ts
He
avie
s
Tota
l
Ligh
ts
He
avie
s
Tota
l
Ligh
ts
He
avie
s
Tota
l
6:00 to 6:15 0 0 0 0 0 0 0 0 0 0 0 0 1 0 1 74 7 81 0 0 0 0 0 0
6:15 to 6:30 0 0 0 0 0 0 0 0 0 0 0 0 1 0 1 113 3 116 0 0 0 0 0 0
6:30 to 6:45 0 0 0 0 0 0 0 0 0 0 0 0 2 0 2 140 2 142 0 0 0 0 0 0
6:45 to 7:00 0 0 0 0 0 0 0 0 0 0 0 0 4 0 4 136 4 140 0 0 0 0 0 0
7:00 to 7:15 0 0 0 0 0 0 0 0 0 0 0 0 6 0 6 190 5 195 0 0 0 0 0 0
7:15 to 7:30 0 0 0 0 0 0 0 0 0 0 0 0 6 0 6 187 6 193 0 0 0 0 0 0
7:30 to 7:45 0 0 0 0 0 0 0 0 0 0 0 0 17 1 18 215 10 225 0 0 0 0 0 0
7:45 to 8:00 0 0 0 0 0 0 0 0 0 0 0 0 24 0 24 272 5 277 0 0 0 0 0 0
8:00 to 8:15 0 0 0 0 0 0 0 0 0 0 0 0 51 0 51 281 6 287 0 0 0 0 0 0
8:15 to 8:30 0 0 0 0 0 0 0 0 0 0 0 0 33 0 33 294 3 297 0 0 0 0 0 0
8:30 to 8:45 0 0 0 0 0 0 0 0 0 0 0 0 27 0 27 267 7 274 0 0 0 0 0 0
8:45 to 9:00 0 0 0 0 0 0 0 0 0 0 0 0 28 0 28 235 8 243 0 0 0 0 0 0
0 0 0 0 0 0 0 0 0 0 0 0 200 1 201 2,404 66 2,470 0 0 0 0 0 0
16:00 to 16:15 0 0 0 0 0 0 0 0 0 0 0 0 10 0 10 147 5 152 0 0 0 0 0 0
16:15 to 16:30 0 0 0 0 0 0 0 0 0 0 0 0 5 0 5 153 1 154 0 0 0 0 0 0
16:30 to 16:45 0 0 0 0 0 0 0 0 0 0 0 0 9 0 9 163 2 165 0 0 0 0 0 0
16:45 to 17:00 0 0 0 0 0 0 0 0 0 0 0 0 6 0 6 147 4 151 0 0 0 0 0 0
17:00 to 17:15 0 0 0 0 0 0 0 0 0 0 0 0 11 0 11 193 2 195 0 0 0 0 0 0
17:15 to 17:30 0 0 0 0 0 0 0 0 0 0 0 0 9 0 9 182 2 184 0 0 0 0 0 0
17:30 to 17:45 0 0 0 0 0 0 0 0 0 0 0 0 9 0 9 179 2 181 0 0 0 0 0 0
17:45 to 18:00 0 0 0 0 0 0 0 0 0 0 0 0 3 0 3 160 2 162 0 0 0 0 0 0
18:00 to 18:15 0 0 0 0 0 0 0 0 0 0 0 0 1 0 1 144 3 147 0 0 0 0 0 0
18:15 to 18:30 0 0 0 0 0 0 0 0 0 0 0 0 4 0 4 151 0 151 0 0 0 0 0 0
18:30 to 18:45 0 0 0 0 0 0 0 0 0 0 0 0 1 0 1 156 3 159 0 0 0 0 0 0
18:45 to 19:00 0 0 0 0 0 0 0 0 0 0 0 0 4 0 4 157 2 159 0 0 0 0 0 0
0 0 0 0 0 0 0 0 0 0 0 0 72 0 72 1,932 28 1,960 0 0 0 0 0 0
Direction
Time Period
AM Totals
PM Totals
Direction 1
(Left Turn)
Classifications Heavies
AM Totals
Approach
Direction
Time Period
Direction 2
(Through)
Park Rd
PM Totals
Approach
Direction 5
(Through)
Park Rd
Park Rd
Class 2Class 1
Qu
een
s R
d
Park Rd Queens Rd
Queens Rd
Qu
een
s R
d
Lights
Direction 12
(Right Turn)
Direction 12U
(U Turn)
Direction 7
(Left Turn)
Direction 8
(Through)
Direction 9
(Right Turn)
Direction 9U
(U Turn)
Direction 10
(Left Turn)
Direction 11
(Through)
Direction 6
(Right Turn)
Direction 6U
(U Turn)
Direction 3
(Right Turn)
Direction 3U
(U Turn)
Direction 4
(Left Turn)
10 1
1 1
2 1
2U
4 5
6
6
U
1 2 3 3U
9U 9 8 7N
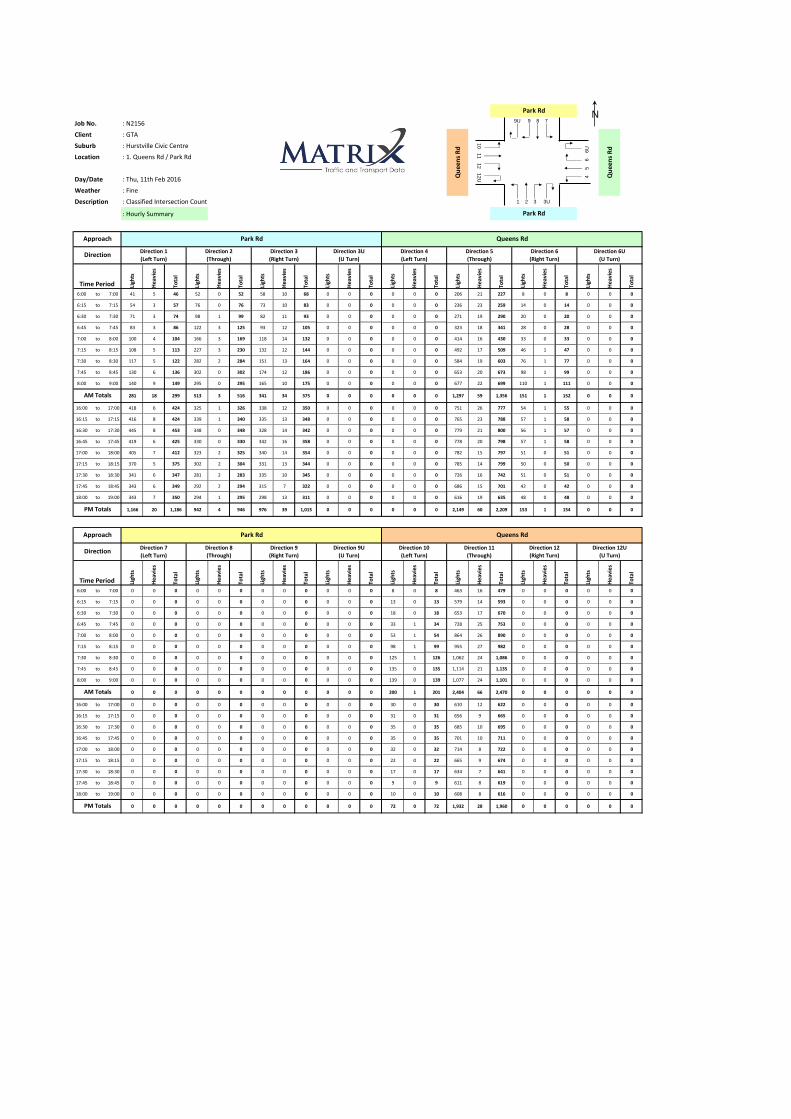
Job No. : N2156
Client : GTA
Suburb : Hurstville Civic Centre
Location : 1. Queens Rd / Park Rd
Day/Date : Thu, 11th Feb 2016
Weather : Fine
Description : Classified Intersection Count
: Hourly Summary
Ligh
ts
He
avie
s
Tota
l
Ligh
ts
He
avie
s
Tota
l
Ligh
ts
He
avie
s
Tota
l
Ligh
ts
He
avie
s
Tota
l
Ligh
ts
He
avie
s
Tota
l
Ligh
ts
He
avie
s
Tota
l
Ligh
ts
He
avie
s
Tota
l
Ligh
ts
He
avie
s
Tota
l
6:00 to 7:00 41 5 46 52 0 52 58 10 68 0 0 0 0 0 0 206 21 227 8 0 8 0 0 0
6:15 to 7:15 54 3 57 76 0 76 73 10 83 0 0 0 0 0 0 236 23 259 14 0 14 0 0 0
6:30 to 7:30 71 3 74 98 1 99 82 11 93 0 0 0 0 0 0 271 19 290 20 0 20 0 0 0
6:45 to 7:45 83 3 86 122 3 125 93 12 105 0 0 0 0 0 0 323 18 341 28 0 28 0 0 0
7:00 to 8:00 100 4 104 166 3 169 118 14 132 0 0 0 0 0 0 414 16 430 33 0 33 0 0 0
7:15 to 8:15 108 5 113 227 3 230 132 12 144 0 0 0 0 0 0 492 17 509 46 1 47 0 0 0
7:30 to 8:30 117 5 122 282 2 284 151 13 164 0 0 0 0 0 0 584 19 603 76 1 77 0 0 0
7:45 to 8:45 130 6 136 302 0 302 174 12 186 0 0 0 0 0 0 653 20 673 98 1 99 0 0 0
8:00 to 9:00 140 9 149 295 0 295 165 10 175 0 0 0 0 0 0 677 22 699 110 1 111 0 0 0
281 18 299 513 3 516 341 34 375 0 0 0 0 0 0 1,297 59 1,356 151 1 152 0 0 0
16:00 to 17:00 418 6 424 325 1 326 338 12 350 0 0 0 0 0 0 751 26 777 54 1 55 0 0 0
16:15 to 17:15 416 8 424 339 1 340 335 13 348 0 0 0 0 0 0 765 23 788 57 1 58 0 0 0
16:30 to 17:30 445 8 453 348 0 348 328 14 342 0 0 0 0 0 0 779 21 800 56 1 57 0 0 0
16:45 to 17:45 419 6 425 330 0 330 342 16 358 0 0 0 0 0 0 778 20 798 57 1 58 0 0 0
17:00 to 18:00 405 7 412 323 2 325 340 14 354 0 0 0 0 0 0 782 15 797 51 0 51 0 0 0
17:15 to 18:15 370 5 375 302 2 304 331 13 344 0 0 0 0 0 0 785 14 799 50 0 50 0 0 0
17:30 to 18:30 341 6 347 281 2 283 335 10 345 0 0 0 0 0 0 726 16 742 51 0 51 0 0 0
17:45 to 18:45 343 6 349 292 2 294 315 7 322 0 0 0 0 0 0 686 15 701 42 0 42 0 0 0
18:00 to 19:00 343 7 350 294 1 295 298 13 311 0 0 0 0 0 0 616 19 635 48 0 48 0 0 0
1,166 20 1,186 942 4 946 976 39 1,015 0 0 0 0 0 0 2,149 60 2,209 153 1 154 0 0 0
Ligh
ts
He
avie
s
Tota
l
Ligh
ts
He
avie
s
Tota
l
Ligh
ts
He
avie
s
Tota
l
Ligh
ts
He
avie
s
Tota
l
Ligh
ts
He
avie
s
Tota
l
Ligh
ts
He
avie
s
Tota
l
Ligh
ts
He
avie
s
Tota
l
Ligh
ts
He
avie
s
Tota
l
6:00 to 7:00 0 0 0 0 0 0 0 0 0 0 0 0 8 0 8 463 16 479 0 0 0 0 0 0
6:15 to 7:15 0 0 0 0 0 0 0 0 0 0 0 0 13 0 13 579 14 593 0 0 0 0 0 0
6:30 to 7:30 0 0 0 0 0 0 0 0 0 0 0 0 18 0 18 653 17 670 0 0 0 0 0 0
6:45 to 7:45 0 0 0 0 0 0 0 0 0 0 0 0 33 1 34 728 25 753 0 0 0 0 0 0
7:00 to 8:00 0 0 0 0 0 0 0 0 0 0 0 0 53 1 54 864 26 890 0 0 0 0 0 0
7:15 to 8:15 0 0 0 0 0 0 0 0 0 0 0 0 98 1 99 955 27 982 0 0 0 0 0 0
7:30 to 8:30 0 0 0 0 0 0 0 0 0 0 0 0 125 1 126 1,062 24 1,086 0 0 0 0 0 0
7:45 to 8:45 0 0 0 0 0 0 0 0 0 0 0 0 135 0 135 1,114 21 1,135 0 0 0 0 0 0
8:00 to 9:00 0 0 0 0 0 0 0 0 0 0 0 0 139 0 139 1,077 24 1,101 0 0 0 0 0 0
0 0 0 0 0 0 0 0 0 0 0 0 200 1 201 2,404 66 2,470 0 0 0 0 0 0
16:00 to 17:00 0 0 0 0 0 0 0 0 0 0 0 0 30 0 30 610 12 622 0 0 0 0 0 0
16:15 to 17:15 0 0 0 0 0 0 0 0 0 0 0 0 31 0 31 656 9 665 0 0 0 0 0 0
16:30 to 17:30 0 0 0 0 0 0 0 0 0 0 0 0 35 0 35 685 10 695 0 0 0 0 0 0
16:45 to 17:45 0 0 0 0 0 0 0 0 0 0 0 0 35 0 35 701 10 711 0 0 0 0 0 0
17:00 to 18:00 0 0 0 0 0 0 0 0 0 0 0 0 32 0 32 714 8 722 0 0 0 0 0 0
17:15 to 18:15 0 0 0 0 0 0 0 0 0 0 0 0 22 0 22 665 9 674 0 0 0 0 0 0
17:30 to 18:30 0 0 0 0 0 0 0 0 0 0 0 0 17 0 17 634 7 641 0 0 0 0 0 0
17:45 to 18:45 0 0 0 0 0 0 0 0 0 0 0 0 9 0 9 611 8 619 0 0 0 0 0 0
18:00 to 19:00 0 0 0 0 0 0 0 0 0 0 0 0 10 0 10 608 8 616 0 0 0 0 0 0
0 0 0 0 0 0 0 0 0 0 0 0 72 0 72 1,932 28 1,960 0 0 0 0 0 0
Direction 8
(Through)
Direction 9
(Right Turn)
Direction 9U
(U Turn)
Direction 3
(Right Turn)
Direction 12
(Right Turn)
Direction 12U
(U Turn)
Direction 4
(Left Turn)
Direction 5
(Through)
Queens Rd
Direction 6
(Right Turn)
Direction 6U
(U Turn)
Direction 10
(Left Turn)
Direction 11
(Through)
Direction 3U
(U Turn)
Park Rd
Time Period
AM Totals
PM Totals
DirectionDirection 7
(Left Turn)
Approach
Direction
Approach
Time Period
Direction 2
(Through)
AM Totals
PM Totals
Direction 1
(Left Turn)
Queens Rd
Park Rd
Park Rd
Park Rd
Qu
een
s R
d
Qu
een
s R
d
10 1
1 1
2 1
2U
4 5
6
6
U
1 2 3 3U
9U 9 8 7N
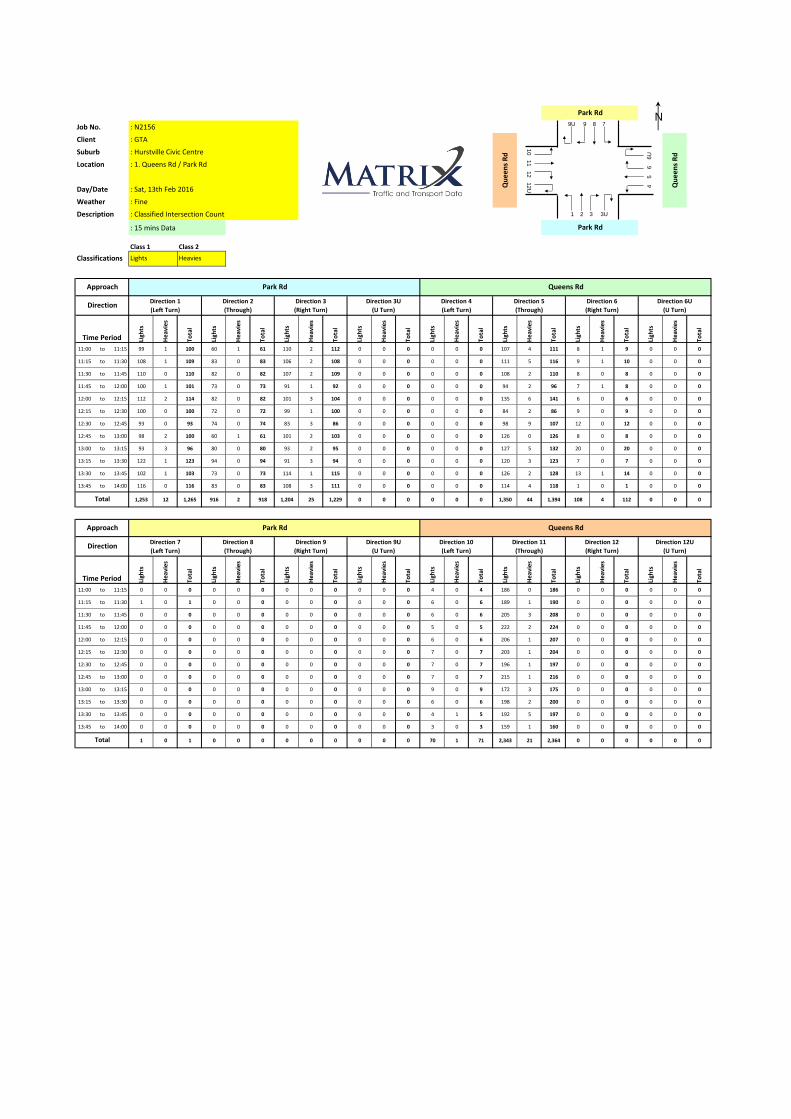
Job No. : N2156
Client : GTA
Suburb : Hurstville Civic Centre
Location : 1. Queens Rd / Park Rd
Day/Date : Sat, 13th Feb 2016
Weather : Fine
Description : Classified Intersection Count
: 15 mins Data
Ligh
ts
Hea
vies
Tota
l
Ligh
ts
Hea
vies
Tota
l
Ligh
ts
Hea
vies
Tota
l
Ligh
ts
Hea
vies
Tota
l
Ligh
ts
Hea
vies
Tota
l
Ligh
ts
Hea
vies
Tota
l
Ligh
ts
Hea
vies
Tota
l
Ligh
ts
Hea
vies
Tota
l
11:00 to 11:15 99 1 100 60 1 61 110 2 112 0 0 0 0 0 0 107 4 111 8 1 9 0 0 0
11:15 to 11:30 108 1 109 83 0 83 106 2 108 0 0 0 0 0 0 111 5 116 9 1 10 0 0 0
11:30 to 11:45 110 0 110 82 0 82 107 2 109 0 0 0 0 0 0 108 2 110 8 0 8 0 0 0
11:45 to 12:00 100 1 101 73 0 73 91 1 92 0 0 0 0 0 0 94 2 96 7 1 8 0 0 0
12:00 to 12:15 112 2 114 82 0 82 101 3 104 0 0 0 0 0 0 135 6 141 6 0 6 0 0 0
12:15 to 12:30 100 0 100 72 0 72 99 1 100 0 0 0 0 0 0 84 2 86 9 0 9 0 0 0
12:30 to 12:45 93 0 93 74 0 74 83 3 86 0 0 0 0 0 0 98 9 107 12 0 12 0 0 0
12:45 to 13:00 98 2 100 60 1 61 101 2 103 0 0 0 0 0 0 126 0 126 8 0 8 0 0 0
13:00 to 13:15 93 3 96 80 0 80 93 2 95 0 0 0 0 0 0 127 5 132 20 0 20 0 0 0
13:15 to 13:30 122 1 123 94 0 94 91 3 94 0 0 0 0 0 0 120 3 123 7 0 7 0 0 0
13:30 to 13:45 102 1 103 73 0 73 114 1 115 0 0 0 0 0 0 126 2 128 13 1 14 0 0 0
13:45 to 14:00 116 0 116 83 0 83 108 3 111 0 0 0 0 0 0 114 4 118 1 0 1 0 0 0
1,253 12 1,265 916 2 918 1,204 25 1,229 0 0 0 0 0 0 1,350 44 1,394 108 4 112 0 0 0
Ligh
ts
He
avie
s
Tota
l
Ligh
ts
He
avie
s
Tota
l
Ligh
ts
He
avie
s
Tota
l
Ligh
ts
He
avie
s
Tota
l
Ligh
ts
He
avie
s
Tota
l
Ligh
ts
He
avie
s
Tota
l
Ligh
ts
He
avie
s
Tota
l
Ligh
ts
He
avie
s
Tota
l
11:00 to 11:15 0 0 0 0 0 0 0 0 0 0 0 0 4 0 4 186 0 186 0 0 0 0 0 0
11:15 to 11:30 1 0 1 0 0 0 0 0 0 0 0 0 6 0 6 189 1 190 0 0 0 0 0 0
11:30 to 11:45 0 0 0 0 0 0 0 0 0 0 0 0 6 0 6 205 3 208 0 0 0 0 0 0
11:45 to 12:00 0 0 0 0 0 0 0 0 0 0 0 0 5 0 5 222 2 224 0 0 0 0 0 0
12:00 to 12:15 0 0 0 0 0 0 0 0 0 0 0 0 6 0 6 206 1 207 0 0 0 0 0 0
12:15 to 12:30 0 0 0 0 0 0 0 0 0 0 0 0 7 0 7 203 1 204 0 0 0 0 0 0
12:30 to 12:45 0 0 0 0 0 0 0 0 0 0 0 0 7 0 7 196 1 197 0 0 0 0 0 0
12:45 to 13:00 0 0 0 0 0 0 0 0 0 0 0 0 7 0 7 215 1 216 0 0 0 0 0 0
13:00 to 13:15 0 0 0 0 0 0 0 0 0 0 0 0 9 0 9 172 3 175 0 0 0 0 0 0
13:15 to 13:30 0 0 0 0 0 0 0 0 0 0 0 0 6 0 6 198 2 200 0 0 0 0 0 0
13:30 to 13:45 0 0 0 0 0 0 0 0 0 0 0 0 4 1 5 192 5 197 0 0 0 0 0 0
13:45 to 14:00 0 0 0 0 0 0 0 0 0 0 0 0 3 0 3 159 1 160 0 0 0 0 0 0
1 0 1 0 0 0 0 0 0 0 0 0 70 1 71 2,343 21 2,364 0 0 0 0 0 0
Qu
ee
ns
Rd
Lights
Direction 12
(Right Turn)
Direction 12U
(U Turn)
Direction 7
(Left Turn)
Direction 8
(Through)
Direction 9
(Right Turn)
Direction 9U
(U Turn)
Direction 10
(Left Turn)
Direction 11
(Through)
Direction 6U
(U Turn)
Direction 3
(Right Turn)
Direction 3U
(U Turn)
Direction 4
(Left Turn)
Direction 5
(Through)
Park Rd
Park Rd
Class 2Class 1
Qu
ee
ns
Rd
Park Rd Queens Rd
Queens Rd
Direction 1
(Left Turn)
Direction 6
(Right Turn)
Classifications Heavies
Total
Approach
Direction
Time Period
Direction 2
(Through)
Park Rd
Approach
Direction
Time Period
Total
10 1
1 1
2 1
2U
4 5 6 6U
1 2 3 3U
9U 9 8 7N
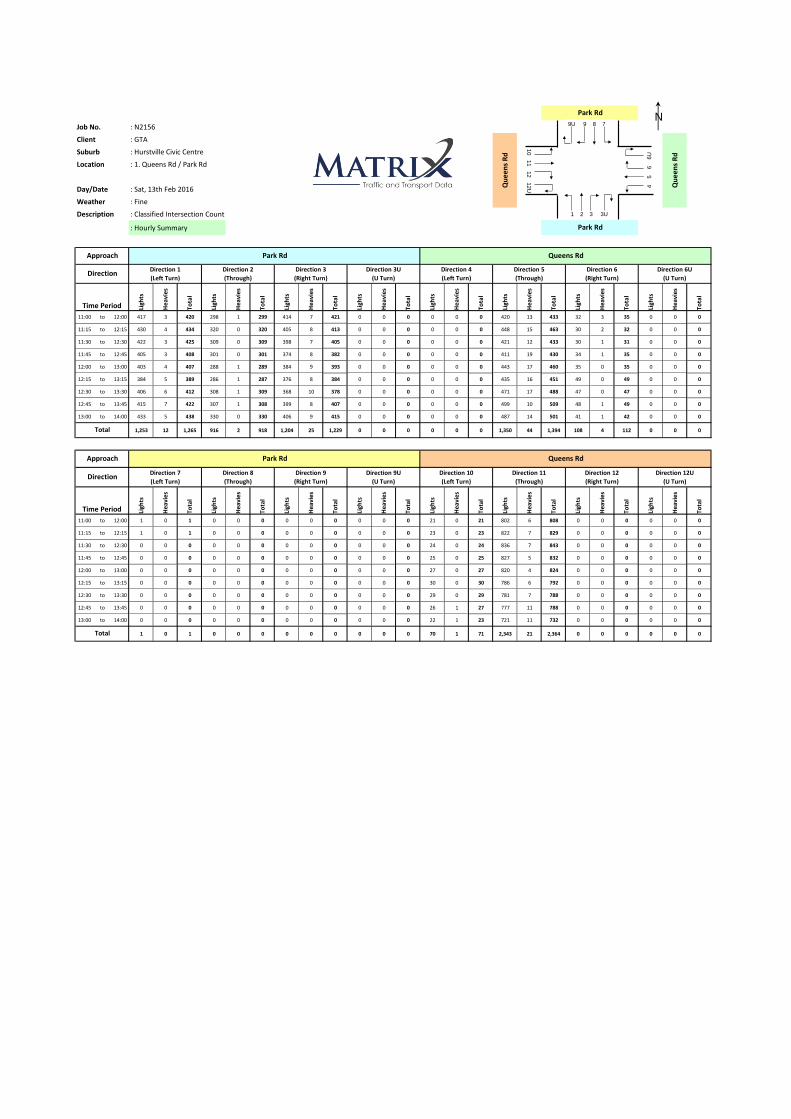
Job No. : N2156
Client : GTA
Suburb : Hurstville Civic Centre
Location : 1. Queens Rd / Park Rd
Day/Date : Sat, 13th Feb 2016
Weather : Fine
Description : Classified Intersection Count
: Hourly Summary
Ligh
ts
Hea
vies
Tota
l
Ligh
ts
Hea
vies
Tota
l
Ligh
ts
Hea
vies
Tota
l
Ligh
ts
Hea
vies
Tota
l
Ligh
ts
Hea
vies
Tota
l
Ligh
ts
Hea
vies
Tota
l
Ligh
ts
Hea
vies
Tota
l
Ligh
ts
Hea
vies
Tota
l
11:00 to 12:00 417 3 420 298 1 299 414 7 421 0 0 0 0 0 0 420 13 433 32 3 35 0 0 0
11:15 to 12:15 430 4 434 320 0 320 405 8 413 0 0 0 0 0 0 448 15 463 30 2 32 0 0 0
11:30 to 12:30 422 3 425 309 0 309 398 7 405 0 0 0 0 0 0 421 12 433 30 1 31 0 0 0
11:45 to 12:45 405 3 408 301 0 301 374 8 382 0 0 0 0 0 0 411 19 430 34 1 35 0 0 0
12:00 to 13:00 403 4 407 288 1 289 384 9 393 0 0 0 0 0 0 443 17 460 35 0 35 0 0 0
12:15 to 13:15 384 5 389 286 1 287 376 8 384 0 0 0 0 0 0 435 16 451 49 0 49 0 0 0
12:30 to 13:30 406 6 412 308 1 309 368 10 378 0 0 0 0 0 0 471 17 488 47 0 47 0 0 0
12:45 to 13:45 415 7 422 307 1 308 399 8 407 0 0 0 0 0 0 499 10 509 48 1 49 0 0 0
13:00 to 14:00 433 5 438 330 0 330 406 9 415 0 0 0 0 0 0 487 14 501 41 1 42 0 0 0
1,253 12 1,265 916 2 918 1,204 25 1,229 0 0 0 0 0 0 1,350 44 1,394 108 4 112 0 0 0
Ligh
ts
He
avie
s
Tota
l
Ligh
ts
He
avie
s
Tota
l
Ligh
ts
He
avie
s
Tota
l
Ligh
ts
He
avie
s
Tota
l
Ligh
ts
He
avie
s
Tota
l
Ligh
ts
He
avie
s
Tota
l
Ligh
ts
He
avie
s
Tota
l
Ligh
ts
He
avie
s
Tota
l
11:00 to 12:00 1 0 1 0 0 0 0 0 0 0 0 0 21 0 21 802 6 808 0 0 0 0 0 0
11:15 to 12:15 1 0 1 0 0 0 0 0 0 0 0 0 23 0 23 822 7 829 0 0 0 0 0 0
11:30 to 12:30 0 0 0 0 0 0 0 0 0 0 0 0 24 0 24 836 7 843 0 0 0 0 0 0
11:45 to 12:45 0 0 0 0 0 0 0 0 0 0 0 0 25 0 25 827 5 832 0 0 0 0 0 0
12:00 to 13:00 0 0 0 0 0 0 0 0 0 0 0 0 27 0 27 820 4 824 0 0 0 0 0 0
12:15 to 13:15 0 0 0 0 0 0 0 0 0 0 0 0 30 0 30 786 6 792 0 0 0 0 0 0
12:30 to 13:30 0 0 0 0 0 0 0 0 0 0 0 0 29 0 29 781 7 788 0 0 0 0 0 0
12:45 to 13:45 0 0 0 0 0 0 0 0 0 0 0 0 26 1 27 777 11 788 0 0 0 0 0 0
13:00 to 14:00 0 0 0 0 0 0 0 0 0 0 0 0 22 1 23 721 11 732 0 0 0 0 0 0
1 0 1 0 0 0 0 0 0 0 0 0 70 1 71 2,343 21 2,364 0 0 0 0 0 0
Queens Rd
Park Rd
Park Rd
Park Rd
Qu
ee
ns
Rd
Qu
ee
ns
Rd
Approach
Time Period
Direction 2
(Through)
Total
Direction 3U
(U Turn)
Park Rd
Time Period
Total
DirectionDirection 7
(Left Turn)
Approach
DirectionDirection 1
(Left Turn)
Direction 8
(Through)
Direction 9
(Right Turn)
Direction 9U
(U Turn)
Direction 3
(Right Turn)
Direction 12
(Right Turn)
Direction 12U
(U Turn)
Direction 4
(Left Turn)
Direction 5
(Through)
Queens Rd
Direction 6
(Right Turn)
Direction 6U
(U Turn)
Direction 10
(Left Turn)
Direction 11
(Through)
10 1
1 1
2 1
2U
4 5 6 6U
1 2 3 3U
9U 9 8 7N
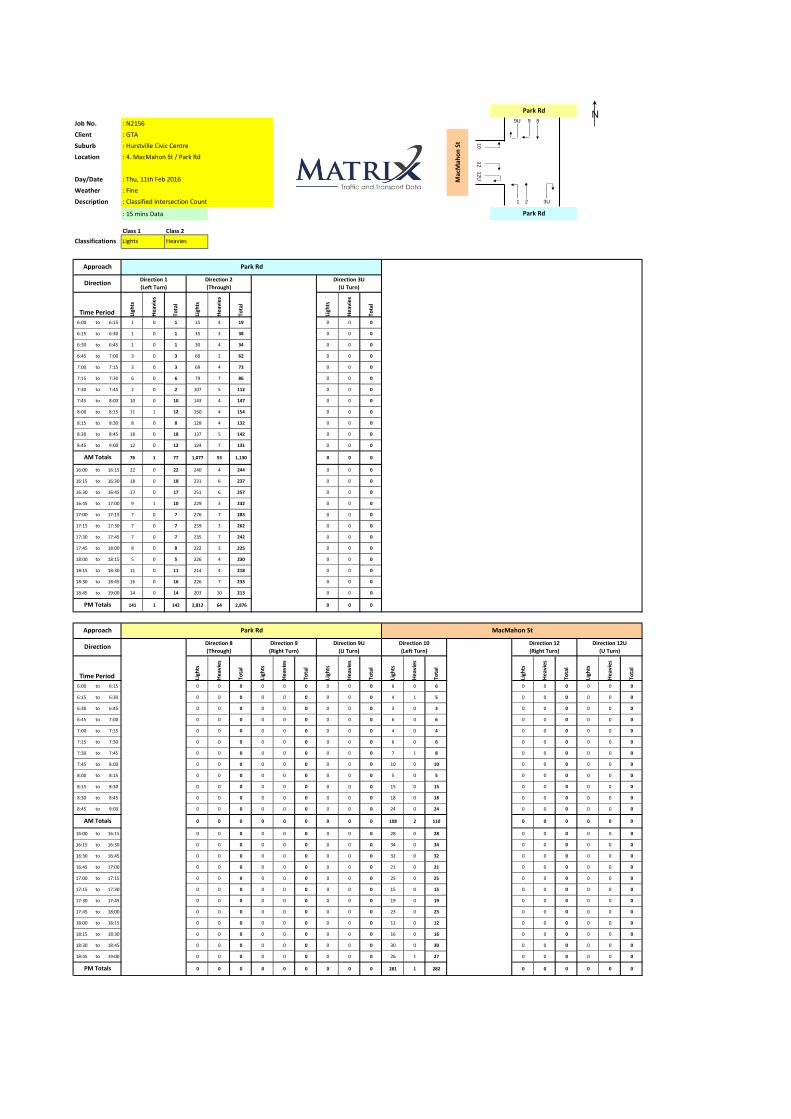
Job No. : N2156
Client : GTA
Suburb : Hurstville Civic Centre
Location : 4. MacMahon St / Park Rd
Day/Date : Thu, 11th Feb 2016
Weather : Fine
Description : Classified Intersection Count
: 15 mins Data
Ligh
ts
He
avie
s
Tota
l
Ligh
ts
He
avie
s
Tota
l
Ligh
ts
He
avie
s
Tota
l
6:00 to 6:15 1 0 1 15 4 19 0 0 0
6:15 to 6:30 1 0 1 35 3 38 0 0 0
6:30 to 6:45 1 0 1 30 4 34 0 0 0
6:45 to 7:00 3 0 3 60 2 62 0 0 0
7:00 to 7:15 3 0 3 69 4 73 0 0 0
7:15 to 7:30 6 0 6 79 7 86 0 0 0
7:30 to 7:45 2 0 2 107 5 112 0 0 0
7:45 to 8:00 10 0 10 143 4 147 0 0 0
8:00 to 8:15 11 1 12 150 4 154 0 0 0
8:15 to 8:30 8 0 8 128 4 132 0 0 0
8:30 to 8:45 18 0 18 137 5 142 0 0 0
8:45 to 9:00 12 0 12 124 7 131 0 0 0
76 1 77 1,077 53 1,130 0 0 0
16:00 to 16:15 22 0 22 240 4 244 0 0 0
16:15 to 16:30 18 0 18 231 6 237 0 0 0
16:30 to 16:45 17 0 17 251 6 257 0 0 0
16:45 to 17:00 9 1 10 229 3 232 0 0 0
17:00 to 17:15 7 0 7 276 7 283 0 0 0
17:15 to 17:30 7 0 7 259 3 262 0 0 0
17:30 to 17:45 7 0 7 235 7 242 0 0 0
17:45 to 18:00 8 0 8 222 3 225 0 0 0
18:00 to 18:15 5 0 5 226 4 230 0 0 0
18:15 to 18:30 11 0 11 214 4 218 0 0 0
18:30 to 18:45 16 0 16 226 7 233 0 0 0
18:45 to 19:00 14 0 14 203 10 213 0 0 0
141 1 142 2,812 64 2,876 0 0 0
Ligh
ts
He
avie
s
Tota
l
Ligh
ts
He
avie
s
Tota
l
Ligh
ts
He
avie
s
Tota
l
Ligh
ts
He
avie
s
Tota
l
Ligh
ts
He
avie
s
Tota
l
Ligh
ts
He
avie
s
Tota
l
6:00 to 6:15 0 0 0 0 0 0 0 0 0 6 0 6 0 0 0 0 0 0
6:15 to 6:30 0 0 0 0 0 0 0 0 0 4 1 5 0 0 0 0 0 0
6:30 to 6:45 0 0 0 0 0 0 0 0 0 3 0 3 0 0 0 0 0 0
6:45 to 7:00 0 0 0 0 0 0 0 0 0 6 0 6 0 0 0 0 0 0
7:00 to 7:15 0 0 0 0 0 0 0 0 0 4 0 4 0 0 0 0 0 0
7:15 to 7:30 0 0 0 0 0 0 0 0 0 6 0 6 0 0 0 0 0 0
7:30 to 7:45 0 0 0 0 0 0 0 0 0 7 1 8 0 0 0 0 0 0
7:45 to 8:00 0 0 0 0 0 0 0 0 0 10 0 10 0 0 0 0 0 0
8:00 to 8:15 0 0 0 0 0 0 0 0 0 5 0 5 0 0 0 0 0 0
8:15 to 8:30 0 0 0 0 0 0 0 0 0 15 0 15 0 0 0 0 0 0
8:30 to 8:45 0 0 0 0 0 0 0 0 0 18 0 18 0 0 0 0 0 0
8:45 to 9:00 0 0 0 0 0 0 0 0 0 24 0 24 0 0 0 0 0 0
0 0 0 0 0 0 0 0 0 108 2 110 0 0 0 0 0 0
16:00 to 16:15 0 0 0 0 0 0 0 0 0 28 0 28 0 0 0 0 0 0
16:15 to 16:30 0 0 0 0 0 0 0 0 0 34 0 34 0 0 0 0 0 0
16:30 to 16:45 0 0 0 0 0 0 0 0 0 32 0 32 0 0 0 0 0 0
16:45 to 17:00 0 0 0 0 0 0 0 0 0 21 0 21 0 0 0 0 0 0
17:00 to 17:15 0 0 0 0 0 0 0 0 0 25 0 25 0 0 0 0 0 0
17:15 to 17:30 0 0 0 0 0 0 0 0 0 15 0 15 0 0 0 0 0 0
17:30 to 17:45 0 0 0 0 0 0 0 0 0 19 0 19 0 0 0 0 0 0
17:45 to 18:00 0 0 0 0 0 0 0 0 0 23 0 23 0 0 0 0 0 0
18:00 to 18:15 0 0 0 0 0 0 0 0 0 12 0 12 0 0 0 0 0 0
18:15 to 18:30 0 0 0 0 0 0 0 0 0 16 0 16 0 0 0 0 0 0
18:30 to 18:45 0 0 0 0 0 0 0 0 0 30 0 30 0 0 0 0 0 0
18:45 to 19:00 0 0 0 0 0 0 0 0 0 26 1 27 0 0 0 0 0 0
0 0 0 0 0 0 0 0 0 281 1 282 0 0 0 0 0 0
Time Period
AM Totals
PM Totals
Classifications Heavies
AM Totals
Approach
Direction
Time Period
Direction 2
(Through)
Park Rd
PM Totals
Approach
Direction
Park Rd
Class 2Class 1
Park Rd MacMahon St
Direction 1
(Left Turn)
Mac
Mah
on
St
Lights
Direction 3U
(U Turn)
Park Rd
Direction 12
(Right Turn)
Direction 12U
(U Turn)
Direction 8
(Through)
Direction 9
(Right Turn)
Direction 9U
(U Turn)
Direction 10
(Left Turn)
10 1
2 1
2U
1 2 3U
9U 9 8 N

Job No. : N2156
Client : GTA
Suburb : Hurstville Civic Centre
Location : 4. MacMahon St / Park Rd
Day/Date : Thu, 11th Feb 2016
Weather : Fine
Description : Classified Intersection Count
: Hourly Summary
Ligh
ts
He
avie
s
Tota
l
Ligh
ts
He
avie
s
Tota
l
Ligh
ts
He
avie
s
Tota
l
6:00 to 7:00 6 0 6 140 13 153 0 0 0
6:15 to 7:15 8 0 8 194 13 207 0 0 0
6:30 to 7:30 13 0 13 238 17 255 0 0 0
6:45 to 7:45 14 0 14 315 18 333 0 0 0
7:00 to 8:00 21 0 21 398 20 418 0 0 0
7:15 to 8:15 29 1 30 479 20 499 0 0 0
7:30 to 8:30 31 1 32 528 17 545 0 0 0
7:45 to 8:45 47 1 48 558 17 575 0 0 0
8:00 to 9:00 49 1 50 539 20 559 0 0 0
76 1 77 1,077 53 1,130 0 0 0
16:00 to 17:00 66 1 67 951 19 970 0 0 0
16:15 to 17:15 51 1 52 987 22 1,009 0 0 0
16:30 to 17:30 40 1 41 1,015 19 1,034 0 0 0
16:45 to 17:45 30 1 31 999 20 1,019 0 0 0
17:00 to 18:00 29 0 29 992 20 1,012 0 0 0
17:15 to 18:15 27 0 27 942 17 959 0 0 0
17:30 to 18:30 31 0 31 897 18 915 0 0 0
17:45 to 18:45 40 0 40 888 18 906 0 0 0
18:00 to 19:00 46 0 46 869 25 894 0 0 0
141 1 142 2,812 64 2,876 0 0 0
Ligh
ts
He
avie
s
Tota
l
Ligh
ts
He
avie
s
Tota
l
Ligh
ts
He
avie
s
Tota
l
Ligh
ts
He
avie
s
Tota
l
Ligh
ts
He
avie
s
Tota
l
Ligh
ts
He
avie
s
Tota
l
6:00 to 7:00 0 0 0 0 0 0 0 0 0 19 1 20 0 0 0 0 0 0
6:15 to 7:15 0 0 0 0 0 0 0 0 0 17 1 18 0 0 0 0 0 0
6:30 to 7:30 0 0 0 0 0 0 0 0 0 19 0 19 0 0 0 0 0 0
6:45 to 7:45 0 0 0 0 0 0 0 0 0 23 1 24 0 0 0 0 0 0
7:00 to 8:00 0 0 0 0 0 0 0 0 0 27 1 28 0 0 0 0 0 0
7:15 to 8:15 0 0 0 0 0 0 0 0 0 28 1 29 0 0 0 0 0 0
7:30 to 8:30 0 0 0 0 0 0 0 0 0 37 1 38 0 0 0 0 0 0
7:45 to 8:45 0 0 0 0 0 0 0 0 0 48 0 48 0 0 0 0 0 0
8:00 to 9:00 0 0 0 0 0 0 0 0 0 62 0 62 0 0 0 0 0 0
0 0 0 0 0 0 0 0 0 108 2 110 0 0 0 0 0 0
16:00 to 17:00 0 0 0 0 0 0 0 0 0 115 0 115 0 0 0 0 0 0
16:15 to 17:15 0 0 0 0 0 0 0 0 0 112 0 112 0 0 0 0 0 0
16:30 to 17:30 0 0 0 0 0 0 0 0 0 93 0 93 0 0 0 0 0 0
16:45 to 17:45 0 0 0 0 0 0 0 0 0 80 0 80 0 0 0 0 0 0
17:00 to 18:00 0 0 0 0 0 0 0 0 0 82 0 82 0 0 0 0 0 0
17:15 to 18:15 0 0 0 0 0 0 0 0 0 69 0 69 0 0 0 0 0 0
17:30 to 18:30 0 0 0 0 0 0 0 0 0 70 0 70 0 0 0 0 0 0
17:45 to 18:45 0 0 0 0 0 0 0 0 0 81 0 81 0 0 0 0 0 0
18:00 to 19:00 0 0 0 0 0 0 0 0 0 84 1 85 0 0 0 0 0 0
0 0 0 0 0 0 0 0 0 281 1 282 0 0 0 0 0 0
Time Period
AM Totals
PM Totals
DirectionDirection 8
(Through)
Approach
Direction
Approach
Time Period
Direction 2
(Through)
AM Totals
PM Totals
Park Rd
Park Rd
Park Rd
Mac
Mah
on
St
Direction 1
(Left Turn)
Direction 9
(Right Turn)
Direction 9U
(U Turn)
Direction 12
(Right Turn)
Direction 12U
(U Turn)
MacMahon St
Direction 10
(Left Turn)
Direction 3U
(U Turn)
Park Rd
10 1
2 1
2U
1 2 3U
9U 9 8 N
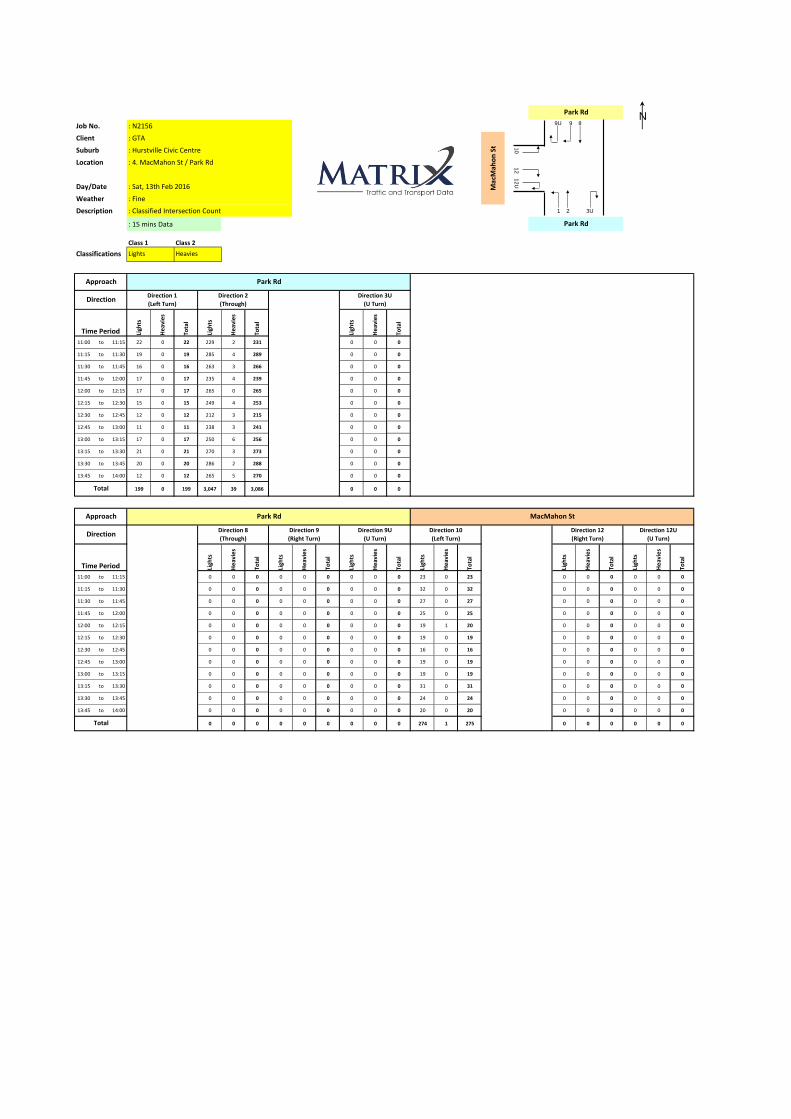
Job No. : N2156
Client : GTA
Suburb : Hurstville Civic Centre
Location : 4. MacMahon St / Park Rd
Day/Date : Sat, 13th Feb 2016
Weather : Fine
Description : Classified Intersection Count
: 15 mins Data
Ligh
ts
He
avie
s
Tota
l
Ligh
ts
He
avie
s
Tota
l
Ligh
ts
He
avie
s
Tota
l
11:00 to 11:15 22 0 22 229 2 231 0 0 0
11:15 to 11:30 19 0 19 285 4 289 0 0 0
11:30 to 11:45 16 0 16 263 3 266 0 0 0
11:45 to 12:00 17 0 17 235 4 239 0 0 0
12:00 to 12:15 17 0 17 265 0 265 0 0 0
12:15 to 12:30 15 0 15 249 4 253 0 0 0
12:30 to 12:45 12 0 12 212 3 215 0 0 0
12:45 to 13:00 11 0 11 238 3 241 0 0 0
13:00 to 13:15 17 0 17 250 6 256 0 0 0
13:15 to 13:30 21 0 21 270 3 273 0 0 0
13:30 to 13:45 20 0 20 286 2 288 0 0 0
13:45 to 14:00 12 0 12 265 5 270 0 0 0
199 0 199 3,047 39 3,086 0 0 0
Ligh
ts
He
avie
s
Tota
l
Ligh
ts
He
avie
s
Tota
l
Ligh
ts
He
avie
s
Tota
l
Ligh
ts
He
avie
s
Tota
l
Ligh
ts
He
avie
s
Tota
l
Ligh
ts
He
avie
s
Tota
l
11:00 to 11:15 0 0 0 0 0 0 0 0 0 23 0 23 0 0 0 0 0 0
11:15 to 11:30 0 0 0 0 0 0 0 0 0 32 0 32 0 0 0 0 0 0
11:30 to 11:45 0 0 0 0 0 0 0 0 0 27 0 27 0 0 0 0 0 0
11:45 to 12:00 0 0 0 0 0 0 0 0 0 25 0 25 0 0 0 0 0 0
12:00 to 12:15 0 0 0 0 0 0 0 0 0 19 1 20 0 0 0 0 0 0
12:15 to 12:30 0 0 0 0 0 0 0 0 0 19 0 19 0 0 0 0 0 0
12:30 to 12:45 0 0 0 0 0 0 0 0 0 16 0 16 0 0 0 0 0 0
12:45 to 13:00 0 0 0 0 0 0 0 0 0 19 0 19 0 0 0 0 0 0
13:00 to 13:15 0 0 0 0 0 0 0 0 0 19 0 19 0 0 0 0 0 0
13:15 to 13:30 0 0 0 0 0 0 0 0 0 31 0 31 0 0 0 0 0 0
13:30 to 13:45 0 0 0 0 0 0 0 0 0 24 0 24 0 0 0 0 0 0
13:45 to 14:00 0 0 0 0 0 0 0 0 0 20 0 20 0 0 0 0 0 0
0 0 0 0 0 0 0 0 0 274 1 275 0 0 0 0 0 0
Class 1
Park Rd MacMahon St
Direction 1
(Left Turn)
Lights
Direction 3U
(U Turn)
Heavies
Direction 12
(Right Turn)
Direction 12U
(U Turn)
Direction 8
(Through)
Direction 9
(Right Turn)
Direction 9U
(U Turn)
Direction 10
(Left Turn)
Time Period
Total
Park Rd
Class 2
Mac
Mah
on
St
Park Rd
Classifications
Total
Approach
Direction
Time Period
Direction 2
(Through)
Park Rd
Approach
Direction
10 1
2 1
2U
1 2 3U
9U 9 8 N
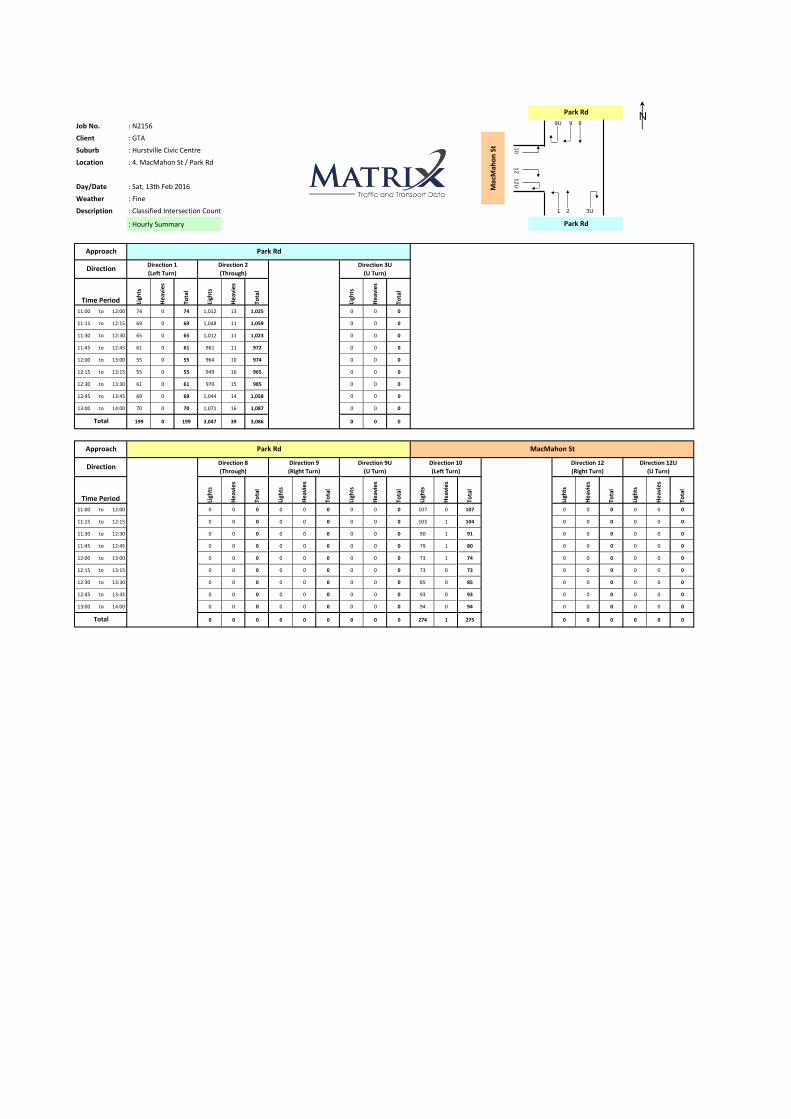
Job No. : N2156
Client : GTA
Suburb : Hurstville Civic Centre
Location : 4. MacMahon St / Park Rd
Day/Date : Sat, 13th Feb 2016
Weather : Fine
Description : Classified Intersection Count
: Hourly Summary
Ligh
ts
He
avie
s
Tota
l
Ligh
ts
He
avie
s
Tota
l
Ligh
ts
He
avie
s
Tota
l
11:00 to 12:00 74 0 74 1,012 13 1,025 0 0 0
11:15 to 12:15 69 0 69 1,048 11 1,059 0 0 0
11:30 to 12:30 65 0 65 1,012 11 1,023 0 0 0
11:45 to 12:45 61 0 61 961 11 972 0 0 0
12:00 to 13:00 55 0 55 964 10 974 0 0 0
12:15 to 13:15 55 0 55 949 16 965 0 0 0
12:30 to 13:30 61 0 61 970 15 985 0 0 0
12:45 to 13:45 69 0 69 1,044 14 1,058 0 0 0
13:00 to 14:00 70 0 70 1,071 16 1,087 0 0 0
199 0 199 3,047 39 3,086 0 0 0
Ligh
ts
He
avie
s
Tota
l
Ligh
ts
He
avie
s
Tota
l
Ligh
ts
He
avie
s
Tota
l
Ligh
ts
He
avie
s
Tota
l
Ligh
ts
He
avie
s
Tota
l
Ligh
ts
He
avie
s
Tota
l
11:00 to 12:00 0 0 0 0 0 0 0 0 0 107 0 107 0 0 0 0 0 0
11:15 to 12:15 0 0 0 0 0 0 0 0 0 103 1 104 0 0 0 0 0 0
11:30 to 12:30 0 0 0 0 0 0 0 0 0 90 1 91 0 0 0 0 0 0
11:45 to 12:45 0 0 0 0 0 0 0 0 0 79 1 80 0 0 0 0 0 0
12:00 to 13:00 0 0 0 0 0 0 0 0 0 73 1 74 0 0 0 0 0 0
12:15 to 13:15 0 0 0 0 0 0 0 0 0 73 0 73 0 0 0 0 0 0
12:30 to 13:30 0 0 0 0 0 0 0 0 0 85 0 85 0 0 0 0 0 0
12:45 to 13:45 0 0 0 0 0 0 0 0 0 93 0 93 0 0 0 0 0 0
13:00 to 14:00 0 0 0 0 0 0 0 0 0 94 0 94 0 0 0 0 0 0
0 0 0 0 0 0 0 0 0 274 1 275 0 0 0 0 0 0
Direction 1
(Left Turn)
Direction 8
(Through)
Direction 9
(Right Turn)
Direction 9U
(U Turn)
Direction 12
(Right Turn)
Direction 12U
(U Turn)
MacMahon St
Park Rd
Park Rd
Mac
Mah
on
St
Park Rd
Direction 10
(Left Turn)
Approach
Time Period
Direction 2
(Through)
Total
Time Period
Total
Direction
Approach
DirectionDirection 3U
(U Turn)
Park Rd
10 1
2 1
2U
1 2 3U
9U 9 8 N

Job No. : N2156
Client : GTA
Suburb : Hurstville Civic Centre
Location : 3. Dora St / MacMahon St / Barratt St
Day/Date : Thu, 11th Feb 2016
Weather : Fine
Description : Classified Intersection Count
: 15 mins Data
Ligh
ts
He
avie
s
Tota
l
Ligh
ts
He
avie
s
Tota
l
Ligh
ts
He
avie
s
Tota
l
Ligh
ts
He
avie
s
Tota
l
Ligh
ts
He
avie
s
Tota
l
Ligh
ts
He
avie
s
Tota
l
Ligh
ts
He
avie
s
Tota
l
Ligh
ts
He
avie
s
Tota
l
6:00 to 6:15 2 0 2 7 2 9 0 1 1 0 0 0 0 0 0 1 1 2 0 0 0 0 0 0
6:15 to 6:30 2 0 2 8 2 10 1 0 1 0 0 0 0 0 0 0 0 0 0 0 0 0 0 0
6:30 to 6:45 2 0 2 12 4 16 1 0 1 0 0 0 0 0 0 1 0 1 0 0 0 0 0 0
6:45 to 7:00 7 0 7 17 3 20 0 0 0 0 0 0 0 0 0 0 0 0 0 0 0 0 0 0
7:00 to 7:15 3 0 3 10 3 13 2 0 2 0 0 0 0 0 0 1 0 1 0 0 0 0 0 0
7:15 to 7:30 1 3 4 26 1 27 1 0 1 0 0 0 3 0 3 3 0 3 1 0 1 0 0 0
7:30 to 7:45 11 1 12 26 3 29 2 0 2 0 0 0 1 0 1 1 0 1 0 0 0 0 0 0
7:45 to 8:00 12 0 12 33 4 37 2 0 2 0 0 0 4 0 4 2 0 2 1 0 1 0 0 0
8:00 to 8:15 12 1 13 39 4 43 2 0 2 0 0 0 3 0 3 1 0 1 1 1 2 0 0 0
8:15 to 8:30 12 3 15 25 0 25 2 0 2 0 0 0 1 0 1 2 0 2 3 1 4 0 0 0
8:30 to 8:45 5 0 5 34 5 39 3 0 3 0 0 0 2 0 2 0 0 0 2 0 2 0 0 0
8:45 to 9:00 9 1 10 29 1 30 5 1 6 0 0 0 0 0 0 3 0 3 6 0 6 0 0 0
78 9 87 266 32 298 21 2 23 0 0 0 14 0 14 15 1 16 14 2 16 0 0 0
16:00 to 16:15 7 0 7 58 5 63 0 0 0 0 0 0 5 0 5 5 0 5 9 0 9 0 0 0
16:15 to 16:30 11 0 11 61 3 64 3 0 3 0 0 0 8 0 8 4 0 4 5 0 5 0 0 0
16:30 to 16:45 12 0 12 66 3 69 2 0 2 0 0 0 4 0 4 3 0 3 5 1 6 0 0 0
16:45 to 17:00 12 0 12 56 3 59 2 0 2 0 0 0 5 0 5 4 0 4 6 0 6 0 0 0
17:00 to 17:15 8 0 8 60 4 64 3 0 3 0 0 0 2 0 2 7 0 7 8 0 8 0 0 0
17:15 to 17:30 11 0 11 62 2 64 1 0 1 0 0 0 2 0 2 5 0 5 3 0 3 0 0 0
17:30 to 17:45 14 0 14 58 4 62 3 0 3 0 0 0 3 0 3 3 0 3 7 0 7 0 0 0
17:45 to 18:00 21 0 21 65 0 65 1 0 1 0 0 0 0 0 0 6 0 6 2 0 2 0 0 0
18:00 to 18:15 16 0 16 68 3 71 3 0 3 0 0 0 2 0 2 3 0 3 2 0 2 0 0 0
18:15 to 18:30 17 0 17 63 1 64 4 1 5 0 0 0 1 0 1 6 0 6 9 0 9 0 0 0
18:30 to 18:45 21 0 21 78 1 79 1 0 1 0 0 0 2 0 2 7 1 8 5 0 5 0 0 0
18:45 to 19:00 18 0 18 53 2 55 1 0 1 0 0 0 2 0 2 2 0 2 9 0 9 0 0 0
168 0 168 748 31 779 24 1 25 0 0 0 36 0 36 55 1 56 70 1 71 0 0 0
Ligh
ts
He
avie
s
Tota
l
Ligh
ts
He
avie
s
Tota
l
Ligh
ts
He
avie
s
Tota
l
Ligh
ts
He
avie
s
Tota
l
Ligh
ts
He
avie
s
Tota
l
Ligh
ts
He
avie
s
Tota
l
Ligh
ts
He
avie
s
Tota
l
Ligh
ts
He
avie
s
Tota
l
6:00 to 6:15 4 0 4 3 3 6 10 1 11 0 0 0 0 3 3 0 0 0 0 0 0 0 0 0
6:15 to 6:30 1 0 1 5 3 8 12 4 16 0 1 1 1 8 9 1 0 1 0 0 0 0 0 0
6:30 to 6:45 2 0 2 5 4 9 14 0 14 1 0 1 3 4 7 0 0 0 0 0 0 0 0 0
6:45 to 7:00 6 1 7 10 2 12 25 2 27 0 0 0 2 7 9 1 0 1 0 0 0 0 0 0
7:00 to 7:15 5 0 5 3 3 6 23 1 24 0 0 0 5 6 11 0 0 0 0 0 0 0 0 0
7:15 to 7:30 6 0 6 8 4 12 29 2 31 0 0 0 6 7 13 3 1 4 1 0 1 0 0 0
7:30 to 7:45 12 0 12 13 5 18 35 1 36 0 0 0 7 4 11 1 0 1 1 0 1 0 0 0
7:45 to 8:00 15 0 15 18 3 21 37 1 38 0 0 0 10 6 16 6 0 6 2 0 2 0 0 0
8:00 to 8:15 14 0 14 20 4 24 32 1 33 0 0 0 12 5 17 1 0 1 3 0 3 0 0 0
8:15 to 8:30 21 0 21 21 1 22 20 1 21 0 0 0 11 8 19 2 0 2 0 0 0 0 0 0
8:30 to 8:45 34 0 34 21 4 25 24 2 26 0 0 0 4 3 7 9 0 9 0 0 0 0 0 0
8:45 to 9:00 44 0 44 27 4 31 14 0 14 0 0 0 4 5 9 2 0 2 0 0 0 0 0 0
164 1 165 154 40 194 275 16 291 1 1 2 65 66 131 26 1 27 7 0 7 0 0 0
16:00 to 16:15 15 0 15 17 4 21 16 0 16 0 0 0 11 5 16 2 0 2 2 0 2 0 0 0
16:15 to 16:30 10 0 10 13 3 16 18 3 21 0 0 0 15 7 22 6 0 6 0 0 0 0 0 0
16:30 to 16:45 14 0 14 14 3 17 18 0 18 0 0 0 12 3 15 4 0 4 0 0 0 0 0 0
16:45 to 17:00 14 0 14 11 5 16 10 3 13 0 0 0 16 7 23 1 0 1 0 0 0 0 0 0
17:00 to 17:15 6 0 6 10 1 11 17 5 22 0 0 0 12 4 16 0 0 0 0 0 0 0 0 0
17:15 to 17:30 9 0 9 21 2 23 16 1 17 0 0 0 13 7 20 4 0 4 2 0 2 0 0 0
17:30 to 17:45 11 0 11 14 2 16 16 0 16 0 0 0 14 5 19 4 0 4 1 0 1 0 0 0
17:45 to 18:00 16 0 16 17 4 21 21 2 23 0 0 0 13 7 20 2 0 2 0 0 0 0 0 0
18:00 to 18:15 12 0 12 10 1 11 23 1 24 0 0 0 10 5 15 4 0 4 1 0 1 0 0 0
18:15 to 18:30 11 0 11 17 4 21 26 0 26 0 0 0 19 4 23 2 0 2 7 0 7 0 0 0
18:30 to 18:45 15 0 15 11 2 13 12 2 14 0 0 0 10 5 15 4 0 4 2 0 2 0 0 0
18:45 to 19:00 10 1 11 7 6 13 21 2 23 1 0 1 16 1 17 5 0 5 3 0 3 0 0 0
143 1 144 162 37 199 214 19 233 1 0 1 161 60 221 38 0 38 18 0 18 0 0 0
Direction
Time Period
AM Totals
PM Totals
Direction 1
(Left Turn)
Classifications Heavies
AM Totals
Approach
Direction
Time Period
Direction 2
(Through)
Barratt St
PM Totals
Approach
Direction 5
(Through)
Barratt St
Dora St
Class 2Class 1
Mac
Mah
on
St
Dora St MacMahon St
MacMahon St
Mac
Mah
on
St
Lights
Direction 12
(Right Turn)
Direction 12U
(U Turn)
Direction 7
(Left Turn)
Direction 8
(Through)
Direction 9
(Right Turn)
Direction 9U
(U Turn)
Direction 10
(Left Turn)
Direction 11
(Through)
Direction 6
(Right Turn)
Direction 6U
(U Turn)
Direction 3
(Right Turn)
Direction 3U
(U Turn)
Direction 4
(Left Turn)
10 1
1 1
2 1
2U
4 5
6
6
U
1 2 3 3U
9U 9 8 7N
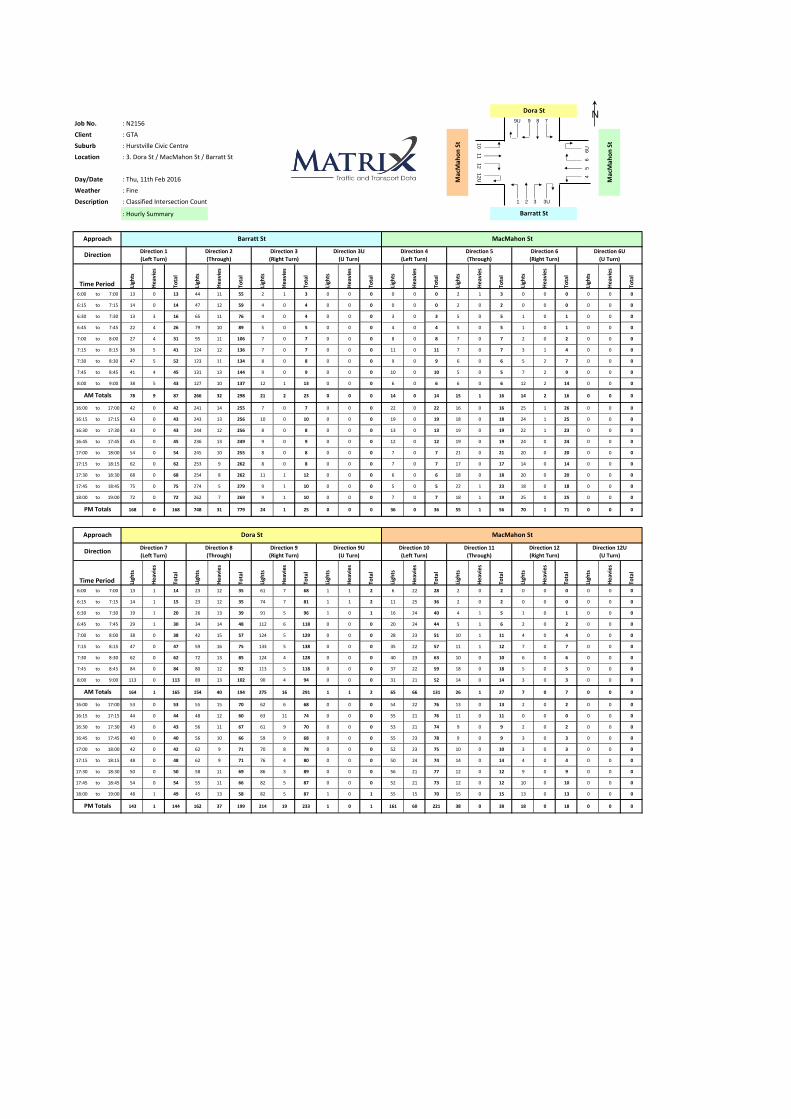
Job No. : N2156
Client : GTA
Suburb : Hurstville Civic Centre
Location : 3. Dora St / MacMahon St / Barratt St
Day/Date : Thu, 11th Feb 2016
Weather : Fine
Description : Classified Intersection Count
: Hourly Summary
Ligh
ts
He
avie
s
Tota
l
Ligh
ts
He
avie
s
Tota
l
Ligh
ts
He
avie
s
Tota
l
Ligh
ts
He
avie
s
Tota
l
Ligh
ts
He
avie
s
Tota
l
Ligh
ts
He
avie
s
Tota
l
Ligh
ts
He
avie
s
Tota
l
Ligh
ts
He
avie
s
Tota
l
6:00 to 7:00 13 0 13 44 11 55 2 1 3 0 0 0 0 0 0 2 1 3 0 0 0 0 0 0
6:15 to 7:15 14 0 14 47 12 59 4 0 4 0 0 0 0 0 0 2 0 2 0 0 0 0 0 0
6:30 to 7:30 13 3 16 65 11 76 4 0 4 0 0 0 3 0 3 5 0 5 1 0 1 0 0 0
6:45 to 7:45 22 4 26 79 10 89 5 0 5 0 0 0 4 0 4 5 0 5 1 0 1 0 0 0
7:00 to 8:00 27 4 31 95 11 106 7 0 7 0 0 0 8 0 8 7 0 7 2 0 2 0 0 0
7:15 to 8:15 36 5 41 124 12 136 7 0 7 0 0 0 11 0 11 7 0 7 3 1 4 0 0 0
7:30 to 8:30 47 5 52 123 11 134 8 0 8 0 0 0 9 0 9 6 0 6 5 2 7 0 0 0
7:45 to 8:45 41 4 45 131 13 144 9 0 9 0 0 0 10 0 10 5 0 5 7 2 9 0 0 0
8:00 to 9:00 38 5 43 127 10 137 12 1 13 0 0 0 6 0 6 6 0 6 12 2 14 0 0 0
78 9 87 266 32 298 21 2 23 0 0 0 14 0 14 15 1 16 14 2 16 0 0 0
16:00 to 17:00 42 0 42 241 14 255 7 0 7 0 0 0 22 0 22 16 0 16 25 1 26 0 0 0
16:15 to 17:15 43 0 43 243 13 256 10 0 10 0 0 0 19 0 19 18 0 18 24 1 25 0 0 0
16:30 to 17:30 43 0 43 244 12 256 8 0 8 0 0 0 13 0 13 19 0 19 22 1 23 0 0 0
16:45 to 17:45 45 0 45 236 13 249 9 0 9 0 0 0 12 0 12 19 0 19 24 0 24 0 0 0
17:00 to 18:00 54 0 54 245 10 255 8 0 8 0 0 0 7 0 7 21 0 21 20 0 20 0 0 0
17:15 to 18:15 62 0 62 253 9 262 8 0 8 0 0 0 7 0 7 17 0 17 14 0 14 0 0 0
17:30 to 18:30 68 0 68 254 8 262 11 1 12 0 0 0 6 0 6 18 0 18 20 0 20 0 0 0
17:45 to 18:45 75 0 75 274 5 279 9 1 10 0 0 0 5 0 5 22 1 23 18 0 18 0 0 0
18:00 to 19:00 72 0 72 262 7 269 9 1 10 0 0 0 7 0 7 18 1 19 25 0 25 0 0 0
168 0 168 748 31 779 24 1 25 0 0 0 36 0 36 55 1 56 70 1 71 0 0 0
Ligh
ts
He
avie
s
Tota
l
Ligh
ts
He
avie
s
Tota
l
Ligh
ts
He
avie
s
Tota
l
Ligh
ts
He
avie
s
Tota
l
Ligh
ts
He
avie
s
Tota
l
Ligh
ts
He
avie
s
Tota
l
Ligh
ts
He
avie
s
Tota
l
Ligh
ts
He
avie
s
Tota
l
6:00 to 7:00 13 1 14 23 12 35 61 7 68 1 1 2 6 22 28 2 0 2 0 0 0 0 0 0
6:15 to 7:15 14 1 15 23 12 35 74 7 81 1 1 2 11 25 36 2 0 2 0 0 0 0 0 0
6:30 to 7:30 19 1 20 26 13 39 91 5 96 1 0 1 16 24 40 4 1 5 1 0 1 0 0 0
6:45 to 7:45 29 1 30 34 14 48 112 6 118 0 0 0 20 24 44 5 1 6 2 0 2 0 0 0
7:00 to 8:00 38 0 38 42 15 57 124 5 129 0 0 0 28 23 51 10 1 11 4 0 4 0 0 0
7:15 to 8:15 47 0 47 59 16 75 133 5 138 0 0 0 35 22 57 11 1 12 7 0 7 0 0 0
7:30 to 8:30 62 0 62 72 13 85 124 4 128 0 0 0 40 23 63 10 0 10 6 0 6 0 0 0
7:45 to 8:45 84 0 84 80 12 92 113 5 118 0 0 0 37 22 59 18 0 18 5 0 5 0 0 0
8:00 to 9:00 113 0 113 89 13 102 90 4 94 0 0 0 31 21 52 14 0 14 3 0 3 0 0 0
164 1 165 154 40 194 275 16 291 1 1 2 65 66 131 26 1 27 7 0 7 0 0 0
16:00 to 17:00 53 0 53 55 15 70 62 6 68 0 0 0 54 22 76 13 0 13 2 0 2 0 0 0
16:15 to 17:15 44 0 44 48 12 60 63 11 74 0 0 0 55 21 76 11 0 11 0 0 0 0 0 0
16:30 to 17:30 43 0 43 56 11 67 61 9 70 0 0 0 53 21 74 9 0 9 2 0 2 0 0 0
16:45 to 17:45 40 0 40 56 10 66 59 9 68 0 0 0 55 23 78 9 0 9 3 0 3 0 0 0
17:00 to 18:00 42 0 42 62 9 71 70 8 78 0 0 0 52 23 75 10 0 10 3 0 3 0 0 0
17:15 to 18:15 48 0 48 62 9 71 76 4 80 0 0 0 50 24 74 14 0 14 4 0 4 0 0 0
17:30 to 18:30 50 0 50 58 11 69 86 3 89 0 0 0 56 21 77 12 0 12 9 0 9 0 0 0
17:45 to 18:45 54 0 54 55 11 66 82 5 87 0 0 0 52 21 73 12 0 12 10 0 10 0 0 0
18:00 to 19:00 48 1 49 45 13 58 82 5 87 1 0 1 55 15 70 15 0 15 13 0 13 0 0 0
143 1 144 162 37 199 214 19 233 1 0 1 161 60 221 38 0 38 18 0 18 0 0 0
Direction 8
(Through)
Direction 9
(Right Turn)
Direction 9U
(U Turn)
Direction 3
(Right Turn)
Direction 12
(Right Turn)
Direction 12U
(U Turn)
Direction 4
(Left Turn)
Direction 5
(Through)
MacMahon St
Direction 6
(Right Turn)
Direction 6U
(U Turn)
Direction 10
(Left Turn)
Direction 11
(Through)
Direction 3U
(U Turn)
Dora St
Time Period
AM Totals
PM Totals
DirectionDirection 7
(Left Turn)
Approach
Direction
Approach
Time Period
Direction 2
(Through)
AM Totals
PM Totals
Direction 1
(Left Turn)
MacMahon St
Dora St
Barratt St
Barratt St
Mac
Mah
on
St
Mac
Mah
on
St 1
0 1
1 1
2 1
2U
4 5
6
6
U
1 2 3 3U
9U 9 8 7N
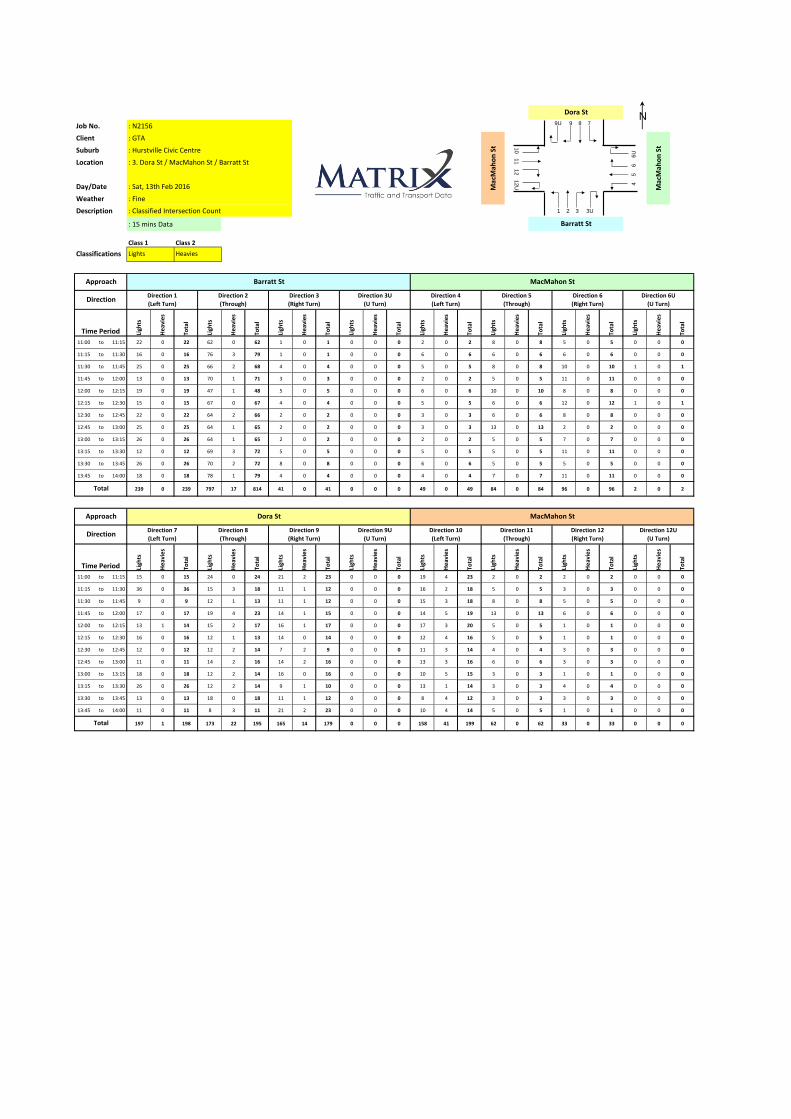
Job No. : N2156
Client : GTA
Suburb : Hurstville Civic Centre
Location : 3. Dora St / MacMahon St / Barratt St
Day/Date : Sat, 13th Feb 2016
Weather : Fine
Description : Classified Intersection Count
: 15 mins Data
Ligh
ts
He
avie
s
Tota
l
Ligh
ts
He
avie
s
Tota
l
Ligh
ts
He
avie
s
Tota
l
Ligh
ts
He
avie
s
Tota
l
Ligh
ts
He
avie
s
Tota
l
Ligh
ts
He
avie
s
Tota
l
Ligh
ts
He
avie
s
Tota
l
Ligh
ts
He
avie
s
Tota
l
11:00 to 11:15 22 0 22 62 0 62 1 0 1 0 0 0 2 0 2 8 0 8 5 0 5 0 0 0
11:15 to 11:30 16 0 16 76 3 79 1 0 1 0 0 0 6 0 6 6 0 6 6 0 6 0 0 0
11:30 to 11:45 25 0 25 66 2 68 4 0 4 0 0 0 5 0 5 8 0 8 10 0 10 1 0 1
11:45 to 12:00 13 0 13 70 1 71 3 0 3 0 0 0 2 0 2 5 0 5 11 0 11 0 0 0
12:00 to 12:15 19 0 19 47 1 48 5 0 5 0 0 0 6 0 6 10 0 10 8 0 8 0 0 0
12:15 to 12:30 15 0 15 67 0 67 4 0 4 0 0 0 5 0 5 6 0 6 12 0 12 1 0 1
12:30 to 12:45 22 0 22 64 2 66 2 0 2 0 0 0 3 0 3 6 0 6 8 0 8 0 0 0
12:45 to 13:00 25 0 25 64 1 65 2 0 2 0 0 0 3 0 3 13 0 13 2 0 2 0 0 0
13:00 to 13:15 26 0 26 64 1 65 2 0 2 0 0 0 2 0 2 5 0 5 7 0 7 0 0 0
13:15 to 13:30 12 0 12 69 3 72 5 0 5 0 0 0 5 0 5 5 0 5 11 0 11 0 0 0
13:30 to 13:45 26 0 26 70 2 72 8 0 8 0 0 0 6 0 6 5 0 5 5 0 5 0 0 0
13:45 to 14:00 18 0 18 78 1 79 4 0 4 0 0 0 4 0 4 7 0 7 11 0 11 0 0 0
239 0 239 797 17 814 41 0 41 0 0 0 49 0 49 84 0 84 96 0 96 2 0 2
Ligh
ts
He
avie
s
Tota
l
Ligh
ts
He
avie
s
Tota
l
Ligh
ts
He
avie
s
Tota
l
Ligh
ts
He
avie
s
Tota
l
Ligh
ts
He
avie
s
Tota
l
Ligh
ts
He
avie
s
Tota
l
Ligh
ts
He
avie
s
Tota
l
Ligh
ts
He
avie
s
Tota
l
11:00 to 11:15 15 0 15 24 0 24 21 2 23 0 0 0 19 4 23 2 0 2 2 0 2 0 0 0
11:15 to 11:30 36 0 36 15 3 18 11 1 12 0 0 0 16 2 18 5 0 5 3 0 3 0 0 0
11:30 to 11:45 9 0 9 12 1 13 11 1 12 0 0 0 15 3 18 8 0 8 5 0 5 0 0 0
11:45 to 12:00 17 0 17 19 4 23 14 1 15 0 0 0 14 5 19 13 0 13 6 0 6 0 0 0
12:00 to 12:15 13 1 14 15 2 17 16 1 17 0 0 0 17 3 20 5 0 5 1 0 1 0 0 0
12:15 to 12:30 16 0 16 12 1 13 14 0 14 0 0 0 12 4 16 5 0 5 1 0 1 0 0 0
12:30 to 12:45 12 0 12 12 2 14 7 2 9 0 0 0 11 3 14 4 0 4 3 0 3 0 0 0
12:45 to 13:00 11 0 11 14 2 16 14 2 16 0 0 0 13 3 16 6 0 6 3 0 3 0 0 0
13:00 to 13:15 18 0 18 12 2 14 16 0 16 0 0 0 10 5 15 3 0 3 1 0 1 0 0 0
13:15 to 13:30 26 0 26 12 2 14 9 1 10 0 0 0 13 1 14 3 0 3 4 0 4 0 0 0
13:30 to 13:45 13 0 13 18 0 18 11 1 12 0 0 0 8 4 12 3 0 3 3 0 3 0 0 0
13:45 to 14:00 11 0 11 8 3 11 21 2 23 0 0 0 10 4 14 5 0 5 1 0 1 0 0 0
197 1 198 173 22 195 165 14 179 0 0 0 158 41 199 62 0 62 33 0 33 0 0 0
Mac
Mah
on
St
Lights
Direction 12
(Right Turn)
Direction 12U
(U Turn)
Direction 7
(Left Turn)
Direction 8
(Through)
Direction 9
(Right Turn)
Direction 9U
(U Turn)
Direction 10
(Left Turn)
Direction 11
(Through)
Direction 6U
(U Turn)
Direction 3
(Right Turn)
Direction 3U
(U Turn)
Direction 4
(Left Turn)
Direction 5
(Through)
Barratt St
Dora St
Class 2Class 1
Mac
Mah
on
St
Dora St MacMahon St
MacMahon St
Direction 1
(Left Turn)
Direction 6
(Right Turn)
Classifications Heavies
Total
Approach
Direction
Time Period
Direction 2
(Through)
Barratt St
Approach
Direction
Time Period
Total
10 1
1 1
2 1
2U
4
5
6
6U
1 2 3 3U
9U 9 8 7N
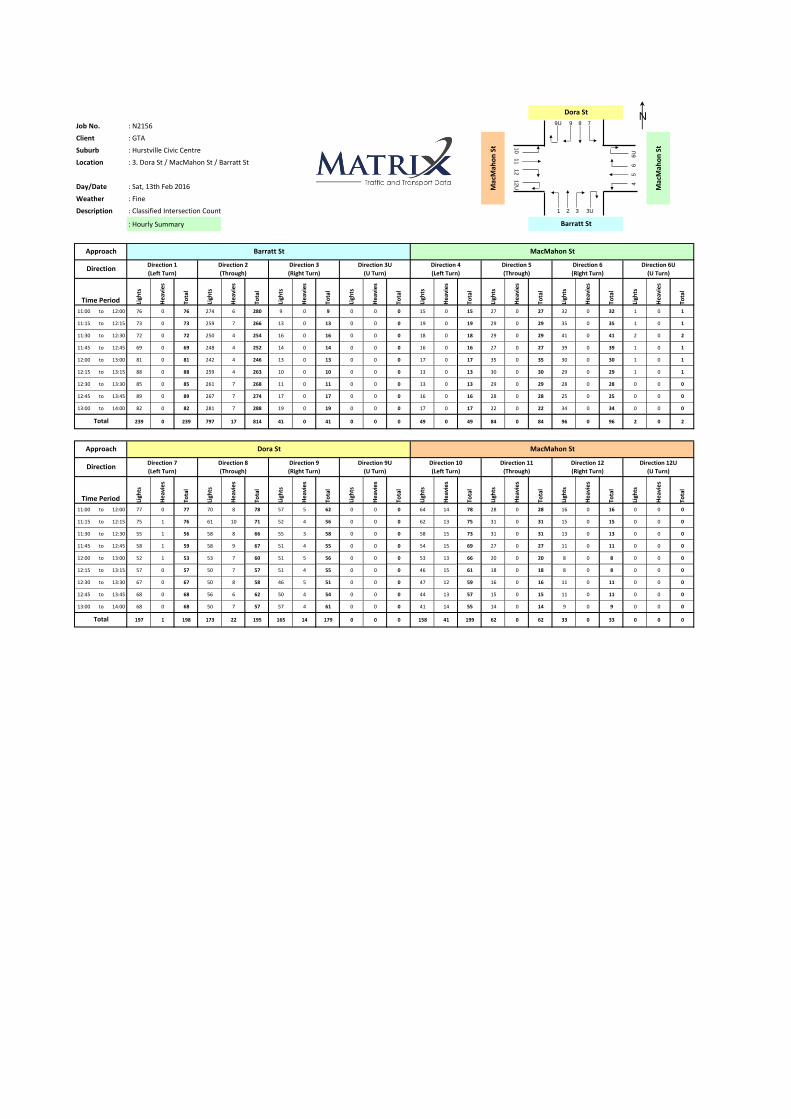
Job No. : N2156
Client : GTA
Suburb : Hurstville Civic Centre
Location : 3. Dora St / MacMahon St / Barratt St
Day/Date : Sat, 13th Feb 2016
Weather : Fine
Description : Classified Intersection Count
: Hourly Summary
Ligh
ts
He
avie
s
Tota
l
Ligh
ts
He
avie
s
Tota
l
Ligh
ts
He
avie
s
Tota
l
Ligh
ts
He
avie
s
Tota
l
Ligh
ts
He
avie
s
Tota
l
Ligh
ts
He
avie
s
Tota
l
Ligh
ts
He
avie
s
Tota
l
Ligh
ts
He
avie
s
Tota
l
11:00 to 12:00 76 0 76 274 6 280 9 0 9 0 0 0 15 0 15 27 0 27 32 0 32 1 0 1
11:15 to 12:15 73 0 73 259 7 266 13 0 13 0 0 0 19 0 19 29 0 29 35 0 35 1 0 1
11:30 to 12:30 72 0 72 250 4 254 16 0 16 0 0 0 18 0 18 29 0 29 41 0 41 2 0 2
11:45 to 12:45 69 0 69 248 4 252 14 0 14 0 0 0 16 0 16 27 0 27 39 0 39 1 0 1
12:00 to 13:00 81 0 81 242 4 246 13 0 13 0 0 0 17 0 17 35 0 35 30 0 30 1 0 1
12:15 to 13:15 88 0 88 259 4 263 10 0 10 0 0 0 13 0 13 30 0 30 29 0 29 1 0 1
12:30 to 13:30 85 0 85 261 7 268 11 0 11 0 0 0 13 0 13 29 0 29 28 0 28 0 0 0
12:45 to 13:45 89 0 89 267 7 274 17 0 17 0 0 0 16 0 16 28 0 28 25 0 25 0 0 0
13:00 to 14:00 82 0 82 281 7 288 19 0 19 0 0 0 17 0 17 22 0 22 34 0 34 0 0 0
239 0 239 797 17 814 41 0 41 0 0 0 49 0 49 84 0 84 96 0 96 2 0 2
Ligh
ts
He
avie
s
Tota
l
Ligh
ts
He
avie
s
Tota
l
Ligh
ts
He
avie
s
Tota
l
Ligh
ts
He
avie
s
Tota
l
Ligh
ts
He
avie
s
Tota
l
Ligh
ts
He
avie
s
Tota
l
Ligh
ts
He
avie
s
Tota
l
Ligh
ts
He
avie
s
Tota
l
11:00 to 12:00 77 0 77 70 8 78 57 5 62 0 0 0 64 14 78 28 0 28 16 0 16 0 0 0
11:15 to 12:15 75 1 76 61 10 71 52 4 56 0 0 0 62 13 75 31 0 31 15 0 15 0 0 0
11:30 to 12:30 55 1 56 58 8 66 55 3 58 0 0 0 58 15 73 31 0 31 13 0 13 0 0 0
11:45 to 12:45 58 1 59 58 9 67 51 4 55 0 0 0 54 15 69 27 0 27 11 0 11 0 0 0
12:00 to 13:00 52 1 53 53 7 60 51 5 56 0 0 0 53 13 66 20 0 20 8 0 8 0 0 0
12:15 to 13:15 57 0 57 50 7 57 51 4 55 0 0 0 46 15 61 18 0 18 8 0 8 0 0 0
12:30 to 13:30 67 0 67 50 8 58 46 5 51 0 0 0 47 12 59 16 0 16 11 0 11 0 0 0
12:45 to 13:45 68 0 68 56 6 62 50 4 54 0 0 0 44 13 57 15 0 15 11 0 11 0 0 0
13:00 to 14:00 68 0 68 50 7 57 57 4 61 0 0 0 41 14 55 14 0 14 9 0 9 0 0 0
197 1 198 173 22 195 165 14 179 0 0 0 158 41 199 62 0 62 33 0 33 0 0 0
MacMahon St
Dora St
Barratt St
Barratt St
Mac
Mah
on
St
Mac
Mah
on
St
Approach
Time Period
Direction 2
(Through)
Total
Direction 3U
(U Turn)
Dora St
Time Period
Total
DirectionDirection 7
(Left Turn)
Approach
DirectionDirection 1
(Left Turn)
Direction 8
(Through)
Direction 9
(Right Turn)
Direction 9U
(U Turn)
Direction 3
(Right Turn)
Direction 12
(Right Turn)
Direction 12U
(U Turn)
Direction 4
(Left Turn)
Direction 5
(Through)
MacMahon St
Direction 6
(Right Turn)
Direction 6U
(U Turn)
Direction 10
(Left Turn)
Direction 11
(Through)
10 1
1 1
2 1
2U
4
5
6
6U
1 2 3 3U
9U 9 8 7N

16S1325000 // 10/06/16
Transport Impact Assessment // Issue: A
Hurstville Civic Precinct, Planning Proposal
Appendix C
SIDRA INTERSECTION Results
Ap
pe
nd
ix C
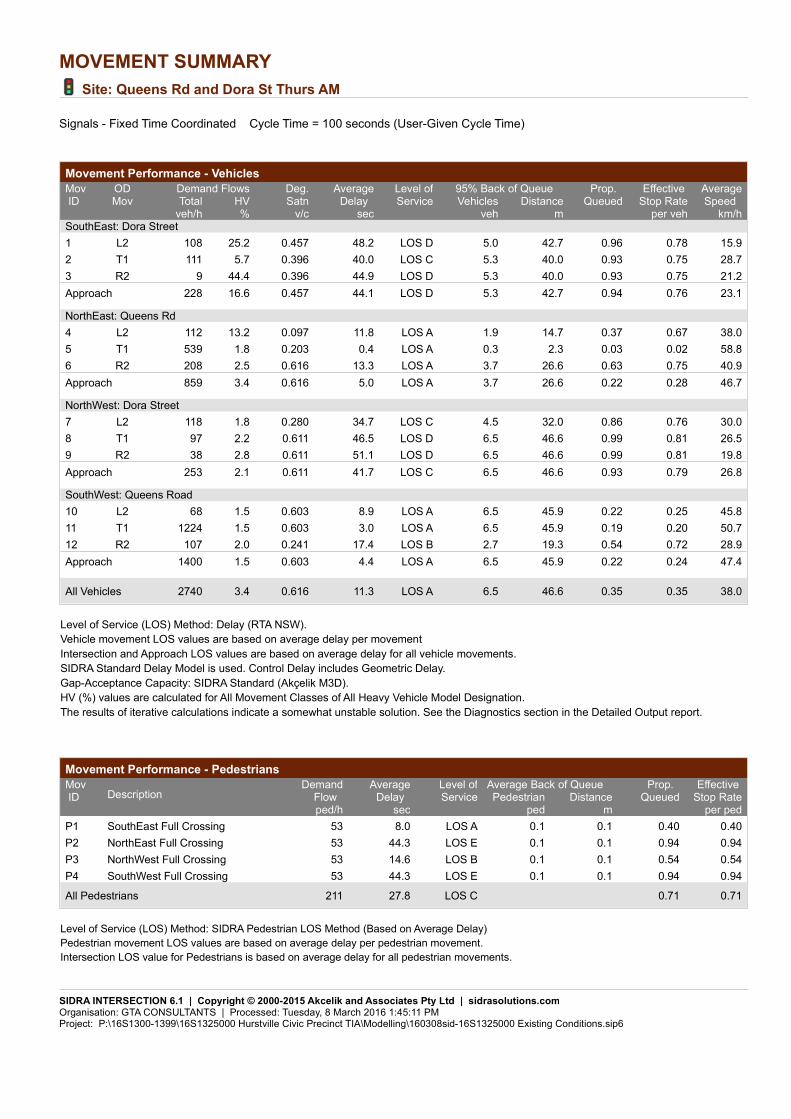
MOVEMENT SUMMARY
Site: Queens Rd and Dora St Thurs AM
Signals - Fixed Time Coordinated Cycle Time = 100 seconds (User-Given Cycle Time)
Movement Performance - Vehicles
Demand Flows 95% Back of QueueMovID
ODMov
Deg.Satn
AverageDelay
Level ofService
Prop. Queued
Effective Stop Rate
AverageSpeed Total HV Vehicles Distance
veh/h % v/c sec veh m per veh km/hSouthEast: Dora Street
1 L2 108 25.2 0.457 48.2 LOS D 5.0 42.7 0.96 0.78 15.9
2 T1 111 5.7 0.396 40.0 LOS C 5.3 40.0 0.93 0.75 28.7
3 R2 9 44.4 0.396 44.9 LOS D 5.3 40.0 0.93 0.75 21.2
Approach 228 16.6 0.457 44.1 LOS D 5.3 42.7 0.94 0.76 23.1
NorthEast: Queens Rd
4 L2 112 13.2 0.097 11.8 LOS A 1.9 14.7 0.37 0.67 38.0
5 T1 539 1.8 0.203 0.4 LOS A 0.3 2.3 0.03 0.02 58.8
6 R2 208 2.5 0.616 13.3 LOS A 3.7 26.6 0.63 0.75 40.9
Approach 859 3.4 0.616 5.0 LOS A 3.7 26.6 0.22 0.28 46.7
NorthWest: Dora Street
7 L2 118 1.8 0.280 34.7 LOS C 4.5 32.0 0.86 0.76 30.0
8 T1 97 2.2 0.611 46.5 LOS D 6.5 46.6 0.99 0.81 26.5
9 R2 38 2.8 0.611 51.1 LOS D 6.5 46.6 0.99 0.81 19.8
Approach 253 2.1 0.611 41.7 LOS C 6.5 46.6 0.93 0.79 26.8
SouthWest: Queens Road
10 L2 68 1.5 0.603 8.9 LOS A 6.5 45.9 0.22 0.25 45.8
11 T1 1224 1.5 0.603 3.0 LOS A 6.5 45.9 0.19 0.20 50.7
12 R2 107 2.0 0.241 17.4 LOS B 2.7 19.3 0.54 0.72 28.9
Approach 1400 1.5 0.603 4.4 LOS A 6.5 45.9 0.22 0.24 47.4
All Vehicles 2740 3.4 0.616 11.3 LOS A 6.5 46.6 0.35 0.35 38.0
Level of Service (LOS) Method: Delay (RTA NSW).
Vehicle movement LOS values are based on average delay per movement
Intersection and Approach LOS values are based on average delay for all vehicle movements.
SIDRA Standard Delay Model is used. Control Delay includes Geometric Delay.
Gap-Acceptance Capacity: SIDRA Standard (Akçelik M3D).
HV (%) values are calculated for All Movement Classes of All Heavy Vehicle Model Designation.
The results of iterative calculations indicate a somewhat unstable solution. See the Diagnostics section in the Detailed Output report.
Movement Performance - Pedestrians
Average Back of QueueMovID Description
DemandFlow
AverageDelay
Level ofService
Prop. Queued
Effective Stop RatePedestrian Distance
ped/h sec ped m per ped
P1 SouthEast Full Crossing 53 8.0 LOS A 0.1 0.1 0.40 0.40
P2 NorthEast Full Crossing 53 44.3 LOS E 0.1 0.1 0.94 0.94
P3 NorthWest Full Crossing 53 14.6 LOS B 0.1 0.1 0.54 0.54
P4 SouthWest Full Crossing 53 44.3 LOS E 0.1 0.1 0.94 0.94
All Pedestrians 211 27.8 LOS C 0.71 0.71
Level of Service (LOS) Method: SIDRA Pedestrian LOS Method (Based on Average Delay)
Pedestrian movement LOS values are based on average delay per pedestrian movement.
Intersection LOS value for Pedestrians is based on average delay for all pedestrian movements.
SIDRA INTERSECTION 6.1 | Copyright © 2000-2015 Akcelik and Associates Pty Ltd | sidrasolutions.comOrganisation: GTA CONSULTANTS | Processed: Tuesday, 8 March 2016 1:45:11 PMProject: P:\16S1300-1399\16S1325000 Hurstville Civic Precinct TIA\Modelling\160308sid-16S1325000 Existing Conditions.sip6
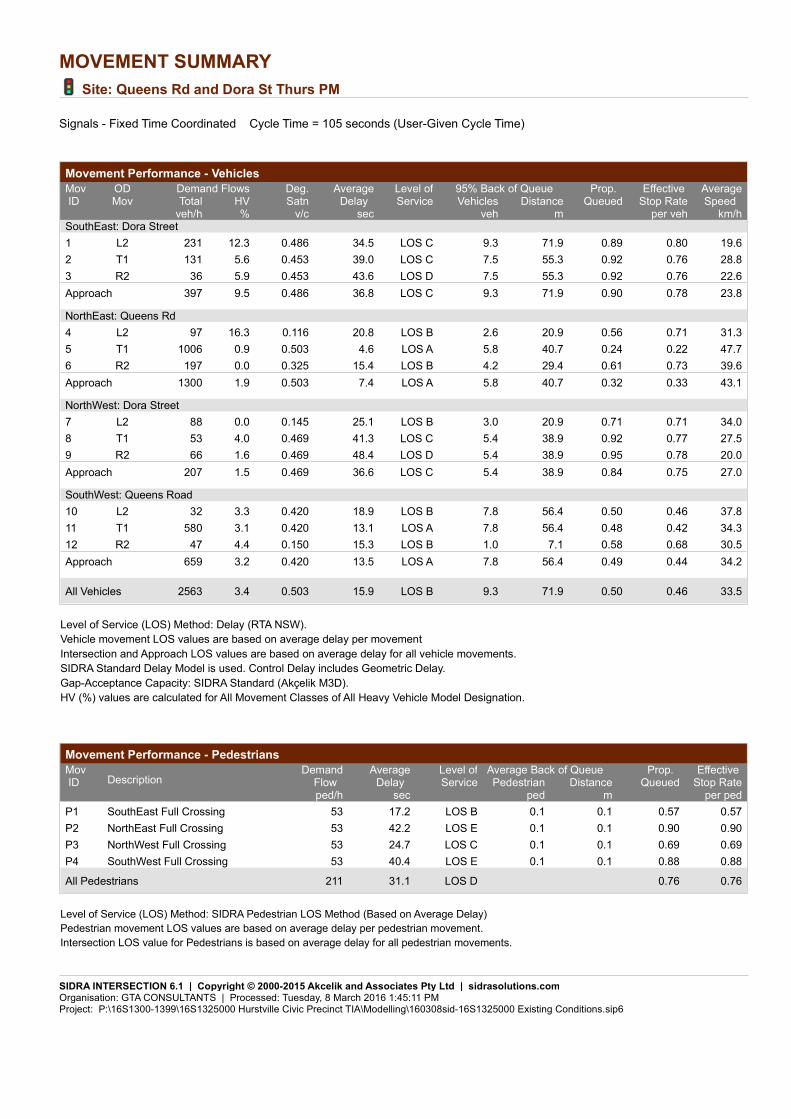
MOVEMENT SUMMARY
Site: Queens Rd and Dora St Thurs PM
Signals - Fixed Time Coordinated Cycle Time = 105 seconds (User-Given Cycle Time)
Movement Performance - Vehicles
Demand Flows 95% Back of QueueMovID
ODMov
Deg.Satn
AverageDelay
Level ofService
Prop. Queued
Effective Stop Rate
AverageSpeed Total HV Vehicles Distance
veh/h % v/c sec veh m per veh km/hSouthEast: Dora Street
1 L2 231 12.3 0.486 34.5 LOS C 9.3 71.9 0.89 0.80 19.6
2 T1 131 5.6 0.453 39.0 LOS C 7.5 55.3 0.92 0.76 28.8
3 R2 36 5.9 0.453 43.6 LOS D 7.5 55.3 0.92 0.76 22.6
Approach 397 9.5 0.486 36.8 LOS C 9.3 71.9 0.90 0.78 23.8
NorthEast: Queens Rd
4 L2 97 16.3 0.116 20.8 LOS B 2.6 20.9 0.56 0.71 31.3
5 T1 1006 0.9 0.503 4.6 LOS A 5.8 40.7 0.24 0.22 47.7
6 R2 197 0.0 0.325 15.4 LOS B 4.2 29.4 0.61 0.73 39.6
Approach 1300 1.9 0.503 7.4 LOS A 5.8 40.7 0.32 0.33 43.1
NorthWest: Dora Street
7 L2 88 0.0 0.145 25.1 LOS B 3.0 20.9 0.71 0.71 34.0
8 T1 53 4.0 0.469 41.3 LOS C 5.4 38.9 0.92 0.77 27.5
9 R2 66 1.6 0.469 48.4 LOS D 5.4 38.9 0.95 0.78 20.0
Approach 207 1.5 0.469 36.6 LOS C 5.4 38.9 0.84 0.75 27.0
SouthWest: Queens Road
10 L2 32 3.3 0.420 18.9 LOS B 7.8 56.4 0.50 0.46 37.8
11 T1 580 3.1 0.420 13.1 LOS A 7.8 56.4 0.48 0.42 34.3
12 R2 47 4.4 0.150 15.3 LOS B 1.0 7.1 0.58 0.68 30.5
Approach 659 3.2 0.420 13.5 LOS A 7.8 56.4 0.49 0.44 34.2
All Vehicles 2563 3.4 0.503 15.9 LOS B 9.3 71.9 0.50 0.46 33.5
Level of Service (LOS) Method: Delay (RTA NSW).
Vehicle movement LOS values are based on average delay per movement
Intersection and Approach LOS values are based on average delay for all vehicle movements.
SIDRA Standard Delay Model is used. Control Delay includes Geometric Delay.
Gap-Acceptance Capacity: SIDRA Standard (Akçelik M3D).
HV (%) values are calculated for All Movement Classes of All Heavy Vehicle Model Designation.
Movement Performance - Pedestrians
Average Back of QueueMovID Description
DemandFlow
AverageDelay
Level ofService
Prop. Queued
Effective Stop RatePedestrian Distance
ped/h sec ped m per ped
P1 SouthEast Full Crossing 53 17.2 LOS B 0.1 0.1 0.57 0.57
P2 NorthEast Full Crossing 53 42.2 LOS E 0.1 0.1 0.90 0.90
P3 NorthWest Full Crossing 53 24.7 LOS C 0.1 0.1 0.69 0.69
P4 SouthWest Full Crossing 53 40.4 LOS E 0.1 0.1 0.88 0.88
All Pedestrians 211 31.1 LOS D 0.76 0.76
Level of Service (LOS) Method: SIDRA Pedestrian LOS Method (Based on Average Delay)
Pedestrian movement LOS values are based on average delay per pedestrian movement.
Intersection LOS value for Pedestrians is based on average delay for all pedestrian movements.
SIDRA INTERSECTION 6.1 | Copyright © 2000-2015 Akcelik and Associates Pty Ltd | sidrasolutions.comOrganisation: GTA CONSULTANTS | Processed: Tuesday, 8 March 2016 1:45:11 PMProject: P:\16S1300-1399\16S1325000 Hurstville Civic Precinct TIA\Modelling\160308sid-16S1325000 Existing Conditions.sip6

MOVEMENT SUMMARY
Site: Queens Rd and Dora St Sat
Signals - Fixed Time Coordinated Cycle Time = 105 seconds (User-Given Cycle Time)
Movement Performance - Vehicles
Demand Flows 95% Back of QueueMovID
ODMov
Deg.Satn
AverageDelay
Level ofService
Prop. Queued
Effective Stop Rate
AverageSpeed Total HV Vehicles Distance
veh/h % v/c sec veh m per veh km/hSouthEast: Dora Street
1 L2 264 6.0 0.470 31.7 LOS C 10.2 75.4 0.85 0.79 20.6
2 T1 108 3.9 0.441 41.4 LOS C 6.6 48.2 0.93 0.76 28.0
3 R2 35 6.1 0.441 46.0 LOS D 6.6 48.2 0.93 0.76 21.9
Approach 407 5.4 0.470 35.5 LOS C 10.2 75.4 0.88 0.78 23.5
NorthEast: Queens Rd
4 L2 81 15.6 0.105 23.0 LOS B 2.3 18.5 0.60 0.71 30.0
5 T1 680 1.2 0.368 6.7 LOS A 4.7 33.0 0.29 0.25 43.6
6 R2 179 0.0 0.337 14.0 LOS A 3.5 24.7 0.56 0.72 40.4
Approach 940 2.2 0.368 9.5 LOS A 4.7 33.0 0.37 0.38 40.7
NorthWest: Dora Street
7 L2 108 1.0 0.187 28.9 LOS C 3.8 26.6 0.76 0.73 32.3
8 T1 49 4.3 0.429 46.0 LOS D 4.5 32.2 0.96 0.77 26.4
9 R2 43 0.0 0.429 50.6 LOS D 4.5 32.2 0.96 0.77 19.7
Approach 201 1.6 0.429 37.8 LOS C 4.5 32.2 0.85 0.75 27.4
SouthWest: Queens Road
10 L2 65 0.0 0.424 14.0 LOS A 7.0 49.3 0.37 0.39 41.1
11 T1 702 0.7 0.424 7.8 LOS A 7.0 49.3 0.34 0.32 41.1
12 R2 82 0.0 0.150 12.7 LOS A 1.5 10.6 0.49 0.68 32.8
Approach 849 0.6 0.424 8.7 LOS A 7.0 49.3 0.35 0.36 40.1
All Vehicles 2398 2.2 0.470 16.0 LOS B 10.2 75.4 0.49 0.47 33.5
Level of Service (LOS) Method: Delay (RTA NSW).
Vehicle movement LOS values are based on average delay per movement
Intersection and Approach LOS values are based on average delay for all vehicle movements.
SIDRA Standard Delay Model is used. Control Delay includes Geometric Delay.
Gap-Acceptance Capacity: SIDRA Standard (Akçelik M3D).
HV (%) values are calculated for All Movement Classes of All Heavy Vehicle Model Designation.
Movement Performance - Pedestrians
Average Back of QueueMovID Description
DemandFlow
AverageDelay
Level ofService
Prop. Queued
Effective Stop RatePedestrian Distance
ped/h sec ped m per ped
P1 SouthEast Full Crossing 53 19.5 LOS B 0.1 0.1 0.61 0.61
P2 NorthEast Full Crossing 53 44.9 LOS E 0.1 0.1 0.93 0.93
P3 NorthWest Full Crossing 53 19.5 LOS B 0.1 0.1 0.61 0.61
P4 SouthWest Full Crossing 53 43.1 LOS E 0.1 0.1 0.91 0.91
All Pedestrians 211 31.8 LOS D 0.76 0.76
Level of Service (LOS) Method: SIDRA Pedestrian LOS Method (Based on Average Delay)
Pedestrian movement LOS values are based on average delay per pedestrian movement.
Intersection LOS value for Pedestrians is based on average delay for all pedestrian movements.
SIDRA INTERSECTION 6.1 | Copyright © 2000-2015 Akcelik and Associates Pty Ltd | sidrasolutions.comOrganisation: GTA CONSULTANTS | Processed: Tuesday, 8 March 2016 1:45:12 PMProject: P:\16S1300-1399\16S1325000 Hurstville Civic Precinct TIA\Modelling\160308sid-16S1325000 Existing Conditions.sip6

MOVEMENT SUMMARY
Site: Queens Rd and Park Rd Thurs AM
Signals - Fixed Time Coordinated Cycle Time = 100 seconds (User-Given Cycle Time)Variable Sequence Analysis applied. The results are given for the selected output sequence.
Movement Performance - Vehicles
Demand Flows 95% Back of QueueMovID
ODMov
Deg.Satn
AverageDelay
Level ofService
Prop. Queued
Effective Stop Rate
AverageSpeed Total HV Vehicles Distance
veh/h % v/c sec veh m per veh km/hSouthEast: Park Road
1 L2 143 4.4 0.241 30.8 LOS C 5.1 36.9 0.77 0.75 27.1
2 T1 318 0.0 0.713 37.2 LOS C 15.3 107.7 0.93 0.82 30.1
3 R2 196 6.5 0.713 51.2 LOS D 15.3 107.7 0.99 0.85 17.0
Approach 657 2.9 0.713 40.0 LOS C 15.3 107.7 0.91 0.81 25.9
NorthEast: Queens Road
5 T1 708 3.0 0.693 6.4 LOS A 11.0 78.7 0.38 0.35 44.6
6 R2 104 1.0 0.693 35.7 LOS C 6.0 42.2 0.84 0.86 27.8
Approach 813 2.7 0.693 10.2 LOS A 11.0 78.7 0.44 0.41 39.4
SouthWest: Queens Road
10 L2 142 0.0 0.686 13.8 LOS A 13.4 94.9 0.45 0.48 43.7
11 T1 1195 1.9 0.686 6.6 LOS A 13.4 94.9 0.40 0.39 43.6
Approach 1337 1.7 0.686 7.4 LOS A 13.4 94.9 0.40 0.40 43.7
All Vehicles 2806 2.3 0.713 15.8 LOS B 15.3 107.7 0.53 0.50 34.6
Level of Service (LOS) Method: Delay (RTA NSW).
Vehicle movement LOS values are based on average delay per movement
Intersection and Approach LOS values are based on average delay for all vehicle movements.
SIDRA Standard Delay Model is used. Control Delay includes Geometric Delay.
Gap-Acceptance Capacity: SIDRA Standard (Akçelik M3D).
HV (%) values are calculated for All Movement Classes of All Heavy Vehicle Model Designation.
Movement Performance - Pedestrians
Average Back of QueueMovID Description
DemandFlow
AverageDelay
Level ofService
Prop. Queued
Effective Stop RatePedestrian Distance
ped/h sec ped m per ped
P1 SouthEast Full Crossing 53 15.2 LOS B 0.1 0.1 0.55 0.55
P2 NorthEast Full Crossing 53 28.2 LOS C 0.1 0.1 0.75 0.75
P3 NorthWest Full Crossing 53 16.9 LOS B 0.1 0.1 0.58 0.58
P4 SouthWest Full Crossing 53 28.2 LOS C 0.1 0.1 0.75 0.75
All Pedestrians 211 22.1 LOS C 0.66 0.66
Level of Service (LOS) Method: SIDRA Pedestrian LOS Method (Based on Average Delay)
Pedestrian movement LOS values are based on average delay per pedestrian movement.
Intersection LOS value for Pedestrians is based on average delay for all pedestrian movements.
SIDRA INTERSECTION 6.1 | Copyright © 2000-2015 Akcelik and Associates Pty Ltd | sidrasolutions.comOrganisation: GTA CONSULTANTS | Processed: Tuesday, 8 March 2016 2:18:33 PMProject: P:\16S1300-1399\16S1325000 Hurstville Civic Precinct TIA\Modelling\160308sid-16S1325000 Existing Conditions.sip6

MOVEMENT SUMMARY
Site: Queens Rd and Park Rd Thurs PM
Signals - Fixed Time Coordinated Cycle Time = 105 seconds (User-Given Cycle Time)
Movement Performance - Vehicles
Demand Flows 95% Back of QueueMovID
ODMov
Deg.Satn
AverageDelay
Level ofService
Prop. Queued
Effective Stop Rate
AverageSpeed Total HV Vehicles Distance
veh/h % v/c sec veh m per veh km/hSouthEast: Park Road
1 L2 477 1.8 0.593 28.6 LOS C 18.5 131.3 0.81 0.82 28.1
2 T1 366 0.0 0.669 30.4 LOS C 17.5 123.4 0.85 0.75 32.3
3 R2 360 4.1 0.669 42.1 LOS C 17.5 123.4 0.94 0.82 19.2
Approach 1203 1.9 0.669 33.2 LOS C 18.5 131.3 0.86 0.80 27.1
NorthEast: Queens Road
5 T1 842 2.6 0.660 15.4 LOS B 14.9 106.8 0.64 0.57 32.8
6 R2 60 1.8 0.660 23.7 LOS B 12.7 90.5 0.69 0.64 34.6
Approach 902 2.6 0.660 15.9 LOS B 14.9 106.8 0.64 0.58 33.0
SouthWest: Queens Road
10 L2 37 0.0 0.485 19.0 LOS B 9.4 66.5 0.52 0.48 40.7
11 T1 732 1.4 0.485 12.9 LOS A 9.4 66.5 0.50 0.45 35.5
Approach 768 1.4 0.485 13.2 LOS A 9.4 66.5 0.50 0.45 36.0
All Vehicles 2874 2.0 0.669 22.4 LOS B 18.5 131.3 0.70 0.64 30.0
Level of Service (LOS) Method: Delay (RTA NSW).
Vehicle movement LOS values are based on average delay per movement
Intersection and Approach LOS values are based on average delay for all vehicle movements.
SIDRA Standard Delay Model is used. Control Delay includes Geometric Delay.
Gap-Acceptance Capacity: SIDRA Standard (Akçelik M3D).
HV (%) values are calculated for All Movement Classes of All Heavy Vehicle Model Designation.
Movement Performance - Pedestrians
Average Back of QueueMovID Description
DemandFlow
AverageDelay
Level ofService
Prop. Queued
Effective Stop RatePedestrian Distance
ped/h sec ped m per ped
P1 SouthEast Full Crossing 53 22.1 LOS C 0.1 0.1 0.65 0.65
P2 NorthEast Full Crossing 53 21.4 LOS C 0.1 0.1 0.64 0.64
P3 NorthWest Full Crossing 53 24.1 LOS C 0.1 0.1 0.68 0.68
P4 SouthWest Full Crossing 53 21.4 LOS C 0.1 0.1 0.64 0.64
All Pedestrians 211 22.2 LOS C 0.65 0.65
Level of Service (LOS) Method: SIDRA Pedestrian LOS Method (Based on Average Delay)
Pedestrian movement LOS values are based on average delay per pedestrian movement.
Intersection LOS value for Pedestrians is based on average delay for all pedestrian movements.
SIDRA INTERSECTION 6.1 | Copyright © 2000-2015 Akcelik and Associates Pty Ltd | sidrasolutions.comOrganisation: GTA CONSULTANTS | Processed: Tuesday, 8 March 2016 1:45:13 PMProject: P:\16S1300-1399\16S1325000 Hurstville Civic Precinct TIA\Modelling\160308sid-16S1325000 Existing Conditions.sip6
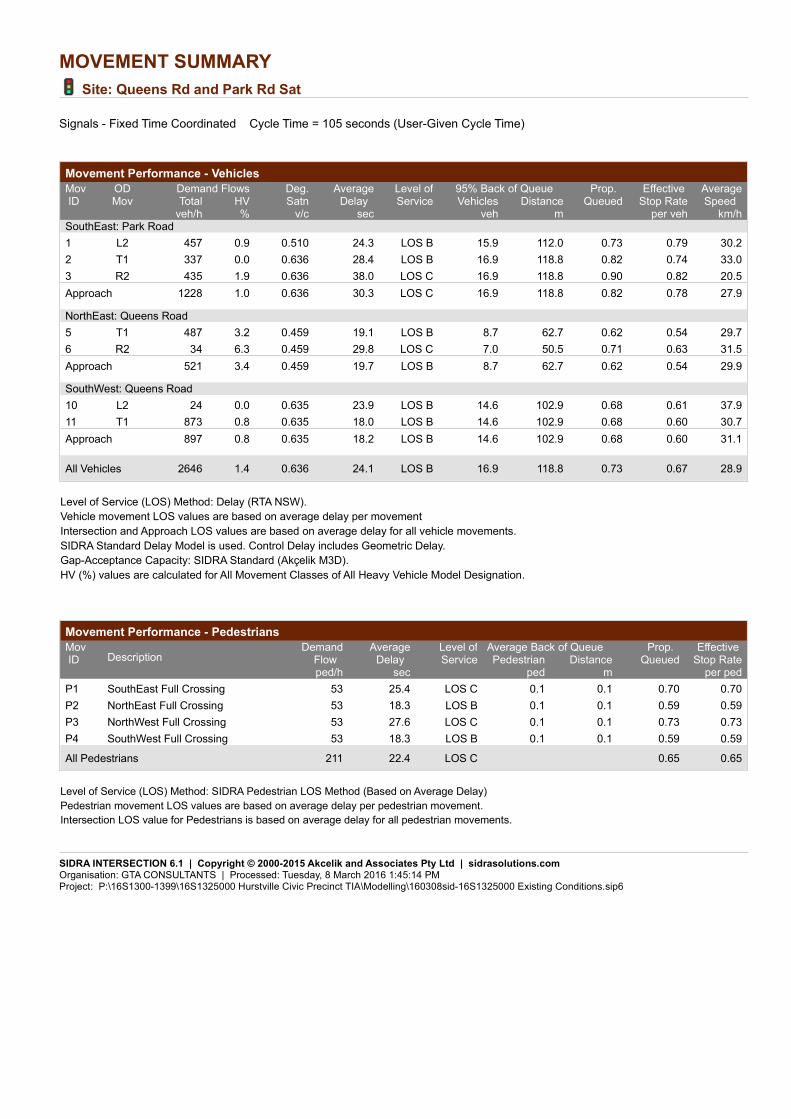
MOVEMENT SUMMARY
Site: Queens Rd and Park Rd Sat
Signals - Fixed Time Coordinated Cycle Time = 105 seconds (User-Given Cycle Time)
Movement Performance - Vehicles
Demand Flows 95% Back of QueueMovID
ODMov
Deg.Satn
AverageDelay
Level ofService
Prop. Queued
Effective Stop Rate
AverageSpeed Total HV Vehicles Distance
veh/h % v/c sec veh m per veh km/hSouthEast: Park Road
1 L2 457 0.9 0.510 24.3 LOS B 15.9 112.0 0.73 0.79 30.2
2 T1 337 0.0 0.636 28.4 LOS B 16.9 118.8 0.82 0.74 33.0
3 R2 435 1.9 0.636 38.0 LOS C 16.9 118.8 0.90 0.82 20.5
Approach 1228 1.0 0.636 30.3 LOS C 16.9 118.8 0.82 0.78 27.9
NorthEast: Queens Road
5 T1 487 3.2 0.459 19.1 LOS B 8.7 62.7 0.62 0.54 29.7
6 R2 34 6.3 0.459 29.8 LOS C 7.0 50.5 0.71 0.63 31.5
Approach 521 3.4 0.459 19.7 LOS B 8.7 62.7 0.62 0.54 29.9
SouthWest: Queens Road
10 L2 24 0.0 0.635 23.9 LOS B 14.6 102.9 0.68 0.61 37.9
11 T1 873 0.8 0.635 18.0 LOS B 14.6 102.9 0.68 0.60 30.7
Approach 897 0.8 0.635 18.2 LOS B 14.6 102.9 0.68 0.60 31.1
All Vehicles 2646 1.4 0.636 24.1 LOS B 16.9 118.8 0.73 0.67 28.9
Level of Service (LOS) Method: Delay (RTA NSW).
Vehicle movement LOS values are based on average delay per movement
Intersection and Approach LOS values are based on average delay for all vehicle movements.
SIDRA Standard Delay Model is used. Control Delay includes Geometric Delay.
Gap-Acceptance Capacity: SIDRA Standard (Akçelik M3D).
HV (%) values are calculated for All Movement Classes of All Heavy Vehicle Model Designation.
Movement Performance - Pedestrians
Average Back of QueueMovID Description
DemandFlow
AverageDelay
Level ofService
Prop. Queued
Effective Stop RatePedestrian Distance
ped/h sec ped m per ped
P1 SouthEast Full Crossing 53 25.4 LOS C 0.1 0.1 0.70 0.70
P2 NorthEast Full Crossing 53 18.3 LOS B 0.1 0.1 0.59 0.59
P3 NorthWest Full Crossing 53 27.6 LOS C 0.1 0.1 0.73 0.73
P4 SouthWest Full Crossing 53 18.3 LOS B 0.1 0.1 0.59 0.59
All Pedestrians 211 22.4 LOS C 0.65 0.65
Level of Service (LOS) Method: SIDRA Pedestrian LOS Method (Based on Average Delay)
Pedestrian movement LOS values are based on average delay per pedestrian movement.
Intersection LOS value for Pedestrians is based on average delay for all pedestrian movements.
SIDRA INTERSECTION 6.1 | Copyright © 2000-2015 Akcelik and Associates Pty Ltd | sidrasolutions.comOrganisation: GTA CONSULTANTS | Processed: Tuesday, 8 March 2016 1:45:14 PMProject: P:\16S1300-1399\16S1325000 Hurstville Civic Precinct TIA\Modelling\160308sid-16S1325000 Existing Conditions.sip6

MOVEMENT SUMMARY
Site: Park Rd and MacMahon St Thurs AM
Giveway / Yield (Two-Way)
Movement Performance - Vehicles
Demand Flows 95% Back of QueueMovID
ODMov
Deg.Satn
AverageDelay
Level ofService
Prop. Queued
Effective Stop Rate
AverageSpeed Total HV Vehicles Distance
veh/h % v/c sec veh m per veh km/hSouthEast: Park Road
1 L2 51 2.1 0.158 4.6 LOS A 0.0 0.0 0.00 0.08 47.9
2 T1 605 3.0 0.158 0.0 LOS A 0.0 0.0 0.00 0.04 49.2
Approach 656 2.9 0.158 0.4 NA 0.0 0.0 0.00 0.04 49.1
SouthWest: MacMahon Street
10 L2 51 0.0 0.042 4.6 LOS A 0.0 0.0 0.00 0.53 38.1
Approach 51 0.0 0.042 4.6 LOS A 0.0 0.0 0.00 0.53 38.1
All Vehicles 706 2.7 0.158 0.7 NA 0.0 0.0 0.00 0.08 48.2
Level of Service (LOS) Method: Delay (RTA NSW).
Vehicle movement LOS values are based on average delay per movement
Minor Road Approach LOS values are based on average delay for all vehicle movements.
NA: Intersection LOS and Major Road Approach LOS values are Not Applicable for two-way sign control since the average delay is not a good LOS measure due to zero delays associated with major road movements.
SIDRA Standard Delay Model is used. Control Delay includes Geometric Delay.
Gap-Acceptance Capacity: SIDRA Standard (Akçelik M3D).
HV (%) values are calculated for All Movement Classes of All Heavy Vehicle Model Designation.
SIDRA INTERSECTION 6.1 | Copyright © 2000-2015 Akcelik and Associates Pty Ltd | sidrasolutions.comOrganisation: GTA CONSULTANTS | Processed: Tuesday, 8 March 2016 1:45:14 PMProject: P:\16S1300-1399\16S1325000 Hurstville Civic Precinct TIA\Modelling\160308sid-16S1325000 Existing Conditions.sip6
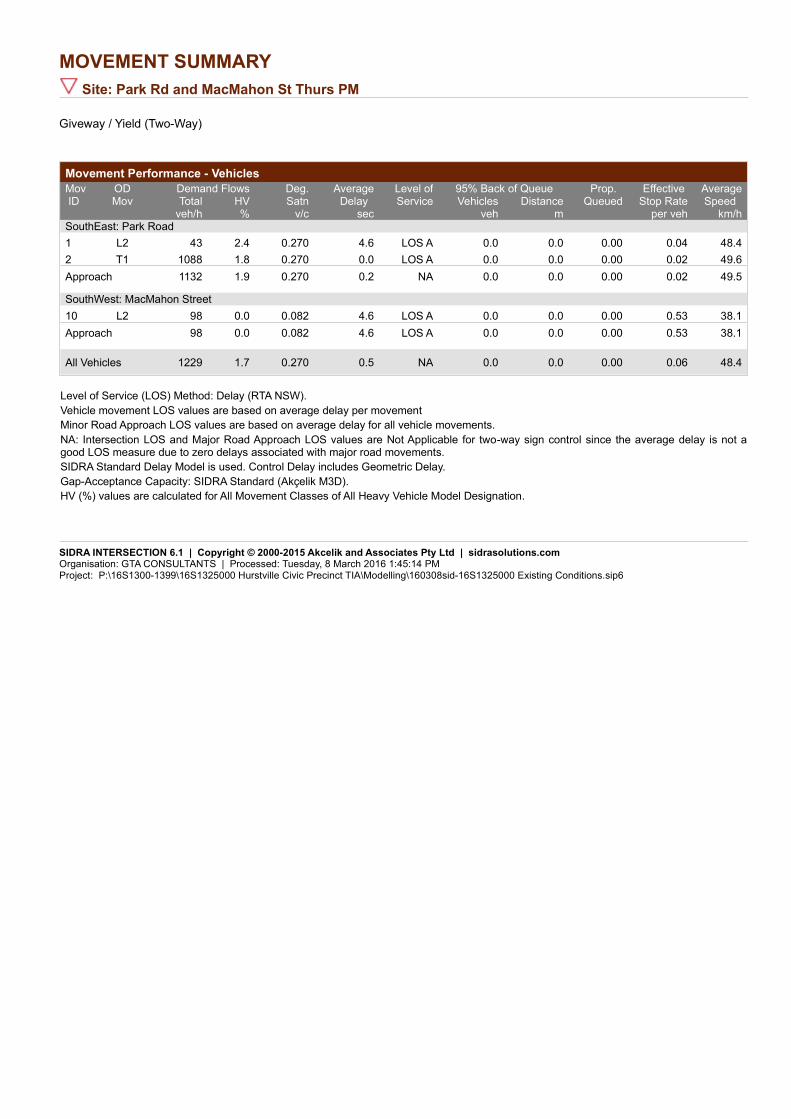
MOVEMENT SUMMARY
Site: Park Rd and MacMahon St Thurs PM
Giveway / Yield (Two-Way)
Movement Performance - Vehicles
Demand Flows 95% Back of QueueMovID
ODMov
Deg.Satn
AverageDelay
Level ofService
Prop. Queued
Effective Stop Rate
AverageSpeed Total HV Vehicles Distance
veh/h % v/c sec veh m per veh km/hSouthEast: Park Road
1 L2 43 2.4 0.270 4.6 LOS A 0.0 0.0 0.00 0.04 48.4
2 T1 1088 1.8 0.270 0.0 LOS A 0.0 0.0 0.00 0.02 49.6
Approach 1132 1.9 0.270 0.2 NA 0.0 0.0 0.00 0.02 49.5
SouthWest: MacMahon Street
10 L2 98 0.0 0.082 4.6 LOS A 0.0 0.0 0.00 0.53 38.1
Approach 98 0.0 0.082 4.6 LOS A 0.0 0.0 0.00 0.53 38.1
All Vehicles 1229 1.7 0.270 0.5 NA 0.0 0.0 0.00 0.06 48.4
Level of Service (LOS) Method: Delay (RTA NSW).
Vehicle movement LOS values are based on average delay per movement
Minor Road Approach LOS values are based on average delay for all vehicle movements.
NA: Intersection LOS and Major Road Approach LOS values are Not Applicable for two-way sign control since the average delay is not a good LOS measure due to zero delays associated with major road movements.
SIDRA Standard Delay Model is used. Control Delay includes Geometric Delay.
Gap-Acceptance Capacity: SIDRA Standard (Akçelik M3D).
HV (%) values are calculated for All Movement Classes of All Heavy Vehicle Model Designation.
SIDRA INTERSECTION 6.1 | Copyright © 2000-2015 Akcelik and Associates Pty Ltd | sidrasolutions.comOrganisation: GTA CONSULTANTS | Processed: Tuesday, 8 March 2016 1:45:14 PMProject: P:\16S1300-1399\16S1325000 Hurstville Civic Precinct TIA\Modelling\160308sid-16S1325000 Existing Conditions.sip6
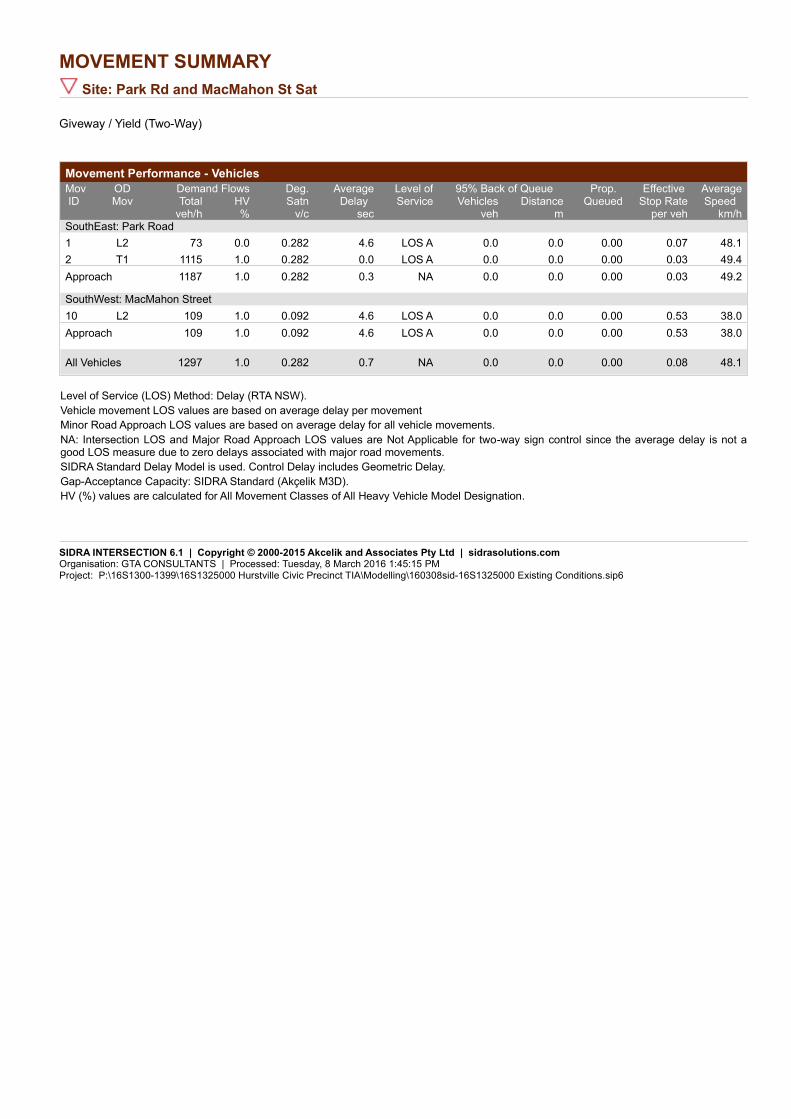
MOVEMENT SUMMARY
Site: Park Rd and MacMahon St Sat
Giveway / Yield (Two-Way)
Movement Performance - Vehicles
Demand Flows 95% Back of QueueMovID
ODMov
Deg.Satn
AverageDelay
Level ofService
Prop. Queued
Effective Stop Rate
AverageSpeed Total HV Vehicles Distance
veh/h % v/c sec veh m per veh km/hSouthEast: Park Road
1 L2 73 0.0 0.282 4.6 LOS A 0.0 0.0 0.00 0.07 48.1
2 T1 1115 1.0 0.282 0.0 LOS A 0.0 0.0 0.00 0.03 49.4
Approach 1187 1.0 0.282 0.3 NA 0.0 0.0 0.00 0.03 49.2
SouthWest: MacMahon Street
10 L2 109 1.0 0.092 4.6 LOS A 0.0 0.0 0.00 0.53 38.0
Approach 109 1.0 0.092 4.6 LOS A 0.0 0.0 0.00 0.53 38.0
All Vehicles 1297 1.0 0.282 0.7 NA 0.0 0.0 0.00 0.08 48.1
Level of Service (LOS) Method: Delay (RTA NSW).
Vehicle movement LOS values are based on average delay per movement
Minor Road Approach LOS values are based on average delay for all vehicle movements.
NA: Intersection LOS and Major Road Approach LOS values are Not Applicable for two-way sign control since the average delay is not a good LOS measure due to zero delays associated with major road movements.
SIDRA Standard Delay Model is used. Control Delay includes Geometric Delay.
Gap-Acceptance Capacity: SIDRA Standard (Akçelik M3D).
HV (%) values are calculated for All Movement Classes of All Heavy Vehicle Model Designation.
SIDRA INTERSECTION 6.1 | Copyright © 2000-2015 Akcelik and Associates Pty Ltd | sidrasolutions.comOrganisation: GTA CONSULTANTS | Processed: Tuesday, 8 March 2016 1:45:15 PMProject: P:\16S1300-1399\16S1325000 Hurstville Civic Precinct TIA\Modelling\160308sid-16S1325000 Existing Conditions.sip6

MOVEMENT SUMMARY
Site: Dora St and MacMahon St Thurs AM
Giveway / Yield (Two-Way)
Movement Performance - Vehicles
Demand Flows 95% Back of QueueMovID
ODMov
Deg.Satn
AverageDelay
Level ofService
Prop. Queued
Effective Stop Rate
AverageSpeed Total HV Vehicles Distance
veh/h % v/c sec veh m per veh km/hSouthEast: Barratt Street
1 L2 47 8.9 0.184 4.9 LOS A 0.9 7.1 0.19 0.20 41.1
2 T1 152 9.0 0.184 0.4 LOS A 0.9 7.1 0.19 0.20 43.2
3 R2 9 0.0 0.184 5.3 LOS A 0.9 7.1 0.19 0.20 45.5
Approach 208 8.6 0.184 1.7 NA 0.9 7.1 0.19 0.20 42.9
NorthEast: MacMahon Street
4 L2 11 0.0 0.033 4.8 LOS A 0.1 0.8 0.28 0.54 38.8
5 T1 5 0.0 0.033 6.1 LOS A 0.1 0.8 0.28 0.54 37.5
6 R2 9 22.2 0.033 9.3 LOS A 0.1 0.8 0.28 0.54 31.8
Approach 25 8.3 0.033 6.8 LOS A 0.1 0.8 0.28 0.54 35.9
NorthWest: Dora Street
7 L2 88 0.0 0.252 4.1 LOS A 1.3 9.7 0.19 0.39 41.4
8 T1 97 13.0 0.252 0.5 LOS A 1.3 9.7 0.19 0.39 39.5
9 R2 124 4.2 0.252 5.3 LOS A 1.3 9.7 0.19 0.39 33.6
Approach 309 5.8 0.252 3.4 NA 1.3 9.7 0.19 0.39 38.5
SouthWest: MacMahon Street
10 L2 62 37.3 0.093 4.9 LOS A 0.4 3.1 0.40 0.56 15.6
11 T1 19 0.0 0.093 5.3 LOS A 0.4 3.1 0.40 0.56 38.4
12 R2 5 0.0 0.093 6.4 LOS A 0.4 3.1 0.40 0.56 33.6
Approach 86 26.8 0.093 5.1 LOS A 0.4 3.1 0.40 0.56 21.4
All Vehicles 629 9.7 0.252 3.2 NA 1.3 9.7 0.22 0.36 36.2
Level of Service (LOS) Method: Delay (RTA NSW).
Vehicle movement LOS values are based on average delay per movement
Minor Road Approach LOS values are based on average delay for all vehicle movements.
NA: Intersection LOS and Major Road Approach LOS values are Not Applicable for two-way sign control since the average delay is not a good LOS measure due to zero delays associated with major road movements.
SIDRA Standard Delay Model is used. Control Delay includes Geometric Delay.
Gap-Acceptance Capacity: SIDRA Standard (Akçelik M3D).
HV (%) values are calculated for All Movement Classes of All Heavy Vehicle Model Designation.
SIDRA INTERSECTION 6.1 | Copyright © 2000-2015 Akcelik and Associates Pty Ltd | sidrasolutions.comOrganisation: GTA CONSULTANTS | Processed: Tuesday, 8 March 2016 1:45:15 PMProject: P:\16S1300-1399\16S1325000 Hurstville Civic Precinct TIA\Modelling\160308sid-16S1325000 Existing Conditions.sip6

MOVEMENT SUMMARY
Site: Dora St and MacMahon St Thurs PM
Giveway / Yield (Two-Way)
Movement Performance - Vehicles
Demand Flows 95% Back of QueueMovID
ODMov
Deg.Satn
AverageDelay
Level ofService
Prop. Queued
Effective Stop Rate
AverageSpeed Total HV Vehicles Distance
veh/h % v/c sec veh m per veh km/hSouthEast: Barratt Street
1 L2 45 0.0 0.284 4.8 LOS A 1.6 11.9 0.22 0.16 42.6
2 T1 269 4.7 0.284 0.5 LOS A 1.6 11.9 0.22 0.16 44.2
3 R2 8 0.0 0.284 5.0 LOS A 1.6 11.9 0.22 0.16 46.1
Approach 323 3.9 0.284 1.2 NA 1.6 11.9 0.22 0.16 44.1
NorthEast: MacMahon Street
4 L2 11 0.0 0.034 4.8 LOS A 0.1 0.9 0.23 0.53 38.6
5 T1 5 0.0 0.034 6.3 LOS A 0.1 0.9 0.23 0.53 37.4
6 R2 9 22.2 0.034 9.6 LOS A 0.1 0.9 0.23 0.53 31.7
Approach 25 8.3 0.034 6.9 LOS A 0.1 0.9 0.23 0.53 35.7
NorthWest: Dora Street
7 L2 45 0.0 0.170 4.1 LOS A 0.8 6.2 0.17 0.37 41.4
8 T1 71 16.4 0.170 0.4 LOS A 0.8 6.2 0.17 0.37 39.5
9 R2 74 12.9 0.170 5.9 LOS A 0.8 6.2 0.17 0.37 33.0
Approach 189 11.1 0.170 3.4 NA 0.8 6.2 0.17 0.37 38.3
SouthWest: MacMahon Street
10 L2 78 28.4 0.098 5.4 LOS A 0.4 3.2 0.46 0.60 15.4
11 T1 9 0.0 0.098 5.3 LOS A 0.4 3.2 0.46 0.60 37.7
12 R2 2 0.0 0.098 6.8 LOS A 0.4 3.2 0.46 0.60 32.9
Approach 89 24.7 0.098 5.4 LOS A 0.4 3.2 0.46 0.60 18.1
All Vehicles 627 9.2 0.284 2.7 NA 1.6 11.9 0.24 0.30 36.2
Level of Service (LOS) Method: Delay (RTA NSW).
Vehicle movement LOS values are based on average delay per movement
Minor Road Approach LOS values are based on average delay for all vehicle movements.
NA: Intersection LOS and Major Road Approach LOS values are Not Applicable for two-way sign control since the average delay is not a good LOS measure due to zero delays associated with major road movements.
SIDRA Standard Delay Model is used. Control Delay includes Geometric Delay.
Gap-Acceptance Capacity: SIDRA Standard (Akçelik M3D).
HV (%) values are calculated for All Movement Classes of All Heavy Vehicle Model Designation.
SIDRA INTERSECTION 6.1 | Copyright © 2000-2015 Akcelik and Associates Pty Ltd | sidrasolutions.comOrganisation: GTA CONSULTANTS | Processed: Tuesday, 8 March 2016 1:45:15 PMProject: P:\16S1300-1399\16S1325000 Hurstville Civic Precinct TIA\Modelling\160308sid-16S1325000 Existing Conditions.sip6
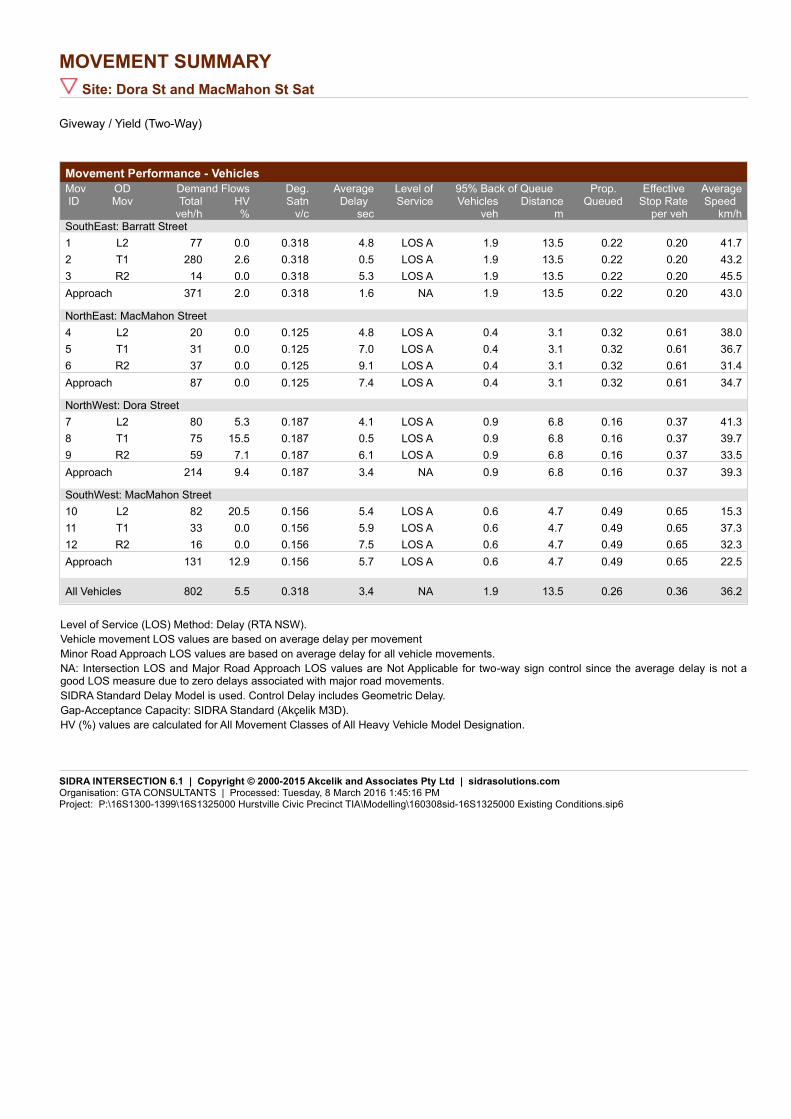
MOVEMENT SUMMARY
Site: Dora St and MacMahon St Sat
Giveway / Yield (Two-Way)
Movement Performance - Vehicles
Demand Flows 95% Back of QueueMovID
ODMov
Deg.Satn
AverageDelay
Level ofService
Prop. Queued
Effective Stop Rate
AverageSpeed Total HV Vehicles Distance
veh/h % v/c sec veh m per veh km/hSouthEast: Barratt Street
1 L2 77 0.0 0.318 4.8 LOS A 1.9 13.5 0.22 0.20 41.7
2 T1 280 2.6 0.318 0.5 LOS A 1.9 13.5 0.22 0.20 43.2
3 R2 14 0.0 0.318 5.3 LOS A 1.9 13.5 0.22 0.20 45.5
Approach 371 2.0 0.318 1.6 NA 1.9 13.5 0.22 0.20 43.0
NorthEast: MacMahon Street
4 L2 20 0.0 0.125 4.8 LOS A 0.4 3.1 0.32 0.61 38.0
5 T1 31 0.0 0.125 7.0 LOS A 0.4 3.1 0.32 0.61 36.7
6 R2 37 0.0 0.125 9.1 LOS A 0.4 3.1 0.32 0.61 31.4
Approach 87 0.0 0.125 7.4 LOS A 0.4 3.1 0.32 0.61 34.7
NorthWest: Dora Street
7 L2 80 5.3 0.187 4.1 LOS A 0.9 6.8 0.16 0.37 41.3
8 T1 75 15.5 0.187 0.5 LOS A 0.9 6.8 0.16 0.37 39.7
9 R2 59 7.1 0.187 6.1 LOS A 0.9 6.8 0.16 0.37 33.5
Approach 214 9.4 0.187 3.4 NA 0.9 6.8 0.16 0.37 39.3
SouthWest: MacMahon Street
10 L2 82 20.5 0.156 5.4 LOS A 0.6 4.7 0.49 0.65 15.3
11 T1 33 0.0 0.156 5.9 LOS A 0.6 4.7 0.49 0.65 37.3
12 R2 16 0.0 0.156 7.5 LOS A 0.6 4.7 0.49 0.65 32.3
Approach 131 12.9 0.156 5.7 LOS A 0.6 4.7 0.49 0.65 22.5
All Vehicles 802 5.5 0.318 3.4 NA 1.9 13.5 0.26 0.36 36.2
Level of Service (LOS) Method: Delay (RTA NSW).
Vehicle movement LOS values are based on average delay per movement
Minor Road Approach LOS values are based on average delay for all vehicle movements.
NA: Intersection LOS and Major Road Approach LOS values are Not Applicable for two-way sign control since the average delay is not a good LOS measure due to zero delays associated with major road movements.
SIDRA Standard Delay Model is used. Control Delay includes Geometric Delay.
Gap-Acceptance Capacity: SIDRA Standard (Akçelik M3D).
HV (%) values are calculated for All Movement Classes of All Heavy Vehicle Model Designation.
SIDRA INTERSECTION 6.1 | Copyright © 2000-2015 Akcelik and Associates Pty Ltd | sidrasolutions.comOrganisation: GTA CONSULTANTS | Processed: Tuesday, 8 March 2016 1:45:16 PMProject: P:\16S1300-1399\16S1325000 Hurstville Civic Precinct TIA\Modelling\160308sid-16S1325000 Existing Conditions.sip6
Melbourne
A Level 25, 55 Collins Street
PO Box 24055
MELBOURNE VIC 3000
P +613 9851 9600
Brisbane
A Level 4, 283 Elizabeth Street
BRISBANE QLD 4000
GPO Box 115
BRISBANE QLD 4001
P +617 3113 5000
Adelaide
A Suite 4, Level 1, 136 The Parade
PO Box 3421
NORWOOD SA 5067
P +618 8334 3600
Townsville
A Level 1, 25 Sturt Street
PO Box 1064
TOWNSVILLE QLD 4810
P +617 4722 2765
Sydney
A Level 6, 15 Help Street
CHATSWOOD NSW 2067
PO Box 5254
WEST CHATSWOOD NSW 1515
P +612 8448 1800
Canberra
A Tower A, Level 5,
7 London Circuit
Canberra ACT 2600
P +612 6243 4826
Gold Coast
A Level 9, Corporate Centre 2
Box 37, 1 Corporate Court
BUNDALL QLD 4217
P +617 5510 4800
F +617 5510 4814
Perth
A Level 27, 44 St Georges Terrace
PERTH WA 6000
P +618 6361 4634
www.gta.com.au www.gta.com.au