Embed Size (px)
Citation preview


Hunger in America 2014
National Report Prepared for Feeding America
Authors
Nancy S. Weinfield, PhD, Westat
Gregory Mills, PhD, Urban Institute
Christine Borger, PhD, Westat
Maeve Gearing, PhD, Urban Institute
Theodore Macaluso, PhD, consultant
Jill Montaquila, PhD, Westat
Sheila Zedlewski, Urban Institute
August 2014
Prepared for:
Feeding America
35 East Wacker Drive, Suite 2000
Chicago, IL 60601
Prepared by:
Westat and the Urban Institute
Westat
An Employee-Owned Research Corporation®
1600 Research Boulevard
Rockville, Maryland 20850-3129
(301) 251-1500
Urban Institute
2100 M Street NW
Washington, DC 20037

Hunger in America 2014 National Report iii
Table of Contents
Chapter Page
Acknowledgments .............................................................................................. xiv 1 Introduction and Background .......................................................................... 1
1.1 The Charitable Food Assistance Network Serves a Critical Need ........................................................................................................ 1
1.2 The Weak Economy Has Increased Demand for Food Assistance ............................................................................................... 4
1.3 How the Feeding America Network Delivers Food Assistance ............................................................................................... 5
1.4 The Hunger in America 2014 Study Updates the Public on the Use of Charitable Food Assistance ........................................ 8
2 Meeting the Challenge of Collecting Data about Food Programs
and Clients ........................................................................................................... 10 Key Findings ....................................................................................................... 10
2.1 Study and Sample Design .................................................................... 11
2.1.1 Instrument Development .................................................... 11 2.1.2 Study Design ......................................................................... 14 2.1.3 Program Type Definitions ................................................... 17
2.2 Agency Survey Implementation .......................................................... 20
2.2.1 Collecting Data from Partner Agencies............................. 20 2.2.2 Agency Survey Data Collection .......................................... 21 2.2.3 Agency Survey Resource Materials .................................... 22 2.2.4 Agency Survey Field Period ................................................ 22 2.2.5 Agency Survey Monitoring .................................................. 23
2.3 Training of Food Bank Hunger Study Coordinators and Volunteer Data Collectors ................................................................... 23
2.4 Client Survey Implementation ............................................................ 24
2.4.1 Client Survey Translation .................................................... 24 2.4.2 Client Data Collection Procedures ..................................... 25 2.4.3 Client Survey Field Period ................................................... 26 2.4.4 Client Survey Resources ...................................................... 27

Hunger in America 2014 National Report iv
Contents (continued)
Chapter Page
2.5 Response Rates ...................................................................................... 28
2.5.1 Characteristics of Client Survey Respondents .................. 31
2.6 Methodological Considerations in Understanding and Interpreting Findings ............................................................................ 33
2.6.1 Changes in Program Types between HIA 2010
and HIA 2014 ........................................................................ 33 2.6.2 Underrepresentation of Children Served by the
Feeding America Network .................................................. 33 2.6.3 Survey Respondents, Their Households, and
Food Program Clients .......................................................... 34 2.6.4 Agency List Challenges ........................................................ 34 2.6.5 Volunteer Data Collection Efforts ..................................... 35 2.6.6 Natural Disasters .................................................................. 35 2.6.7 Changes from Past Hunger in America Studies
to Hunger in America 2014 ................................................. 36
2.7 Summary of Analytical Approach....................................................... 37
2.7.1 Weighting Survey Data ........................................................ 38 2.7.2 Valid Survey Responses ....................................................... 39 2.7.3 Tabular Presentation ............................................................ 39 2.7.4 Client Counts ......................................................................... 40 2.7.5 Sampling Challenges and Practical Constraints
Affecting Precision of Estimates ........................................ 41
3 Describing the Feeding America National Network ..................................... 44 Key Findings ....................................................................................................... 44
3.1 Feeding America’s Network Is Large and Multifaceted .................. 44
3.1.1 Organization of the Network ............................................. 44 3.1.2 Number and Types of Partner Agencies ........................... 45 3.1.3 Types of Programs Operated by the Agencies ................. 48

Hunger in America 2014 National Report v
Contents (continued)
Chapter Page
3.2 The Agencies’ Programs Provide Hunger-Relief Services to Clients ................................................................................................ 53
3.2.1 Agency Oversight and Paid Staff ....................................... 54 3.2.2 Program Volunteers ............................................................. 55 3.2.3 Sources of Food—Food Bank, Donations,
Purchasing .............................................................................. 58 3.2.4 Language Diversity of Food Program Clients .................. 61 3.2.5 Restrictions on Service Receipt .......................................... 62 3.2.6 Programs’ Ability to Serve Clients ..................................... 62
3.3 Partner Agencies Provide Other Food-Related and Non-Food Services......................................................................................... 65
3.3.1 Services Related to Government Programs ...................... 65 3.3.2 Agency Funding .................................................................... 72
4 Characteristics of Feeding America Clients and Their Households ........... 78 Key Findings ....................................................................................................... 78
4.1 Estimating Clients Served by Feeding America................................ 80
4.1.1 Method for Computing Client Count Estimates ............. 81 4.1.2 Estimates of Clients in the Feeding America
Network ................................................................................. 84 4.1.3 Selected Demographic Characteristics of
Feeding America Clients ...................................................... 86 4.1.4 Interpreting Changes in Client Estimates from
2010 to 2014 .......................................................................... 88
4.2 Feeding America Clients Come from a Diverse Set of Households ............................................................................................ 89
4.2.1 Household Size of Clients ................................................... 90 4.2.2 Ages of Household Members ............................................. 92 4.2.3 Single and Multiple Race/Ethnicity Client
Households ............................................................................ 93 4.2.4 Educational Attainment in Client Households ................ 95

Hunger in America 2014 National Report vi
Contents (continued)
Chapter Page
4.2.5 Households with Military Service Members ..................... 96 4.2.6 Languages Spoken at Home ................................................ 98 4.2.7 Housing Characteristics ....................................................... 99
4.3 Work, School, and Barriers and Bridges to Work ............................ 106
4.3.1 Household Employment ..................................................... 107 4.3.2 Full-Time and Part-Time Work .......................................... 108 4.3.3 Being Unemployed or Out of the Workforce .................. 109 4.3.4 Potential Barriers and Bridges to Employment ............... 113
4.4 Health, Income, and Poverty .............................................................. 116
4.4.1 Health Status and Health Conditions ................................ 117 4.4.2 Health Insurance and Unpaid Medical Bills ..................... 120 4.4.3 Income and Poverty ............................................................. 121
5 Clients Households’ Use of Food Assistance ................................................. 131 Key Findings ....................................................................................................... 131
5.1 Securing Enough Food for the Household ....................................... 132
5.1.1 Household Food Security Status ........................................ 132 5.1.2 Making Difficult Decisions about Buying Food
vs. Paying for Other Necessities ......................................... 134 5.1.3 Needing to Plan for Food Assistance to Meet a
Monthly Budget .................................................................... 136
5.2 Client Households’ Use of Other Food Assistance ......................... 137
5.2.1 Client Households’ Use of SNAP ...................................... 139
5.2.1.1 Exhaustion of SNAP Benefits ............................ 141 5.2.1.2 Reasons Why Clients Do Not Receive
SNAP ..................................................................... 143
5.2.2 Receipt of Nutrition Assistance Focused on Children .................................................................................. 147

Hunger in America 2014 National Report vii
Contents (continued)
Chapter Page
5.3 Households’ Engagement in Coping Strategies ............................... 149
5.3.1 Coping Strategies to Get Enough Food ............................ 150
6 Summary of Findings ......................................................................................... 154
6.1 Completing a National Profile of the Feeding America Network and Its Clients ....................................................................... 155
6.1.1 Innovations in Hunger in America 2014 ........................... 155 6.1.2 Select Challenges in Hunger in America 2014 .................. 155
6.2 The Feeding America Network of Services ...................................... 157
6.2.1 Range of Partner Agencies and Programs ........................ 157 6.2.2 Partner Agency and Program Resources ........................... 157
6.3 Food Assistance Clients and Their Households Are Diverse .................................................................................................... 158
6.3.1 Client and Household Demographic
Characteristics ....................................................................... 158 6.3.2 Challenges Client Households Face ................................... 159 6.3.3 Client Households’ Food Security, Use of Food
Assistance, and Other Coping Strategies .......................... 160
Tables
2-1 Client surveys administered by language ......................................................... 24 2-2 Completed client surveys by month ................................................................ 27 2-3 Unweighted distribution of program visits by program category ................ 30 2-4 Survey respondents by age group ..................................................................... 31 2-5 Survey respondents by gender .......................................................................... 32 2-6 Survey respondents by race and ethnicity ....................................................... 32

Hunger in America 2014 National Report viii
Contents (continued)
Tables (continued) Page
3-1 Distribution of agencies by subtype ................................................................. 47 3-2 Distribution of agencies by food or non-food programs ............................. 48 3-3 Distribution of agencies by meal or grocery programs, among
agencies with food programs ............................................................................ 49 3-4 Distribution of programs by type of food or non-food program ............... 49 3-5 Distribution of meal programs by subtype, categorized by
program target age group .................................................................................. 51 3-6 Distribution of grocery programs by subtype, categorized by
program target age group .................................................................................. 52 3-7 Agencies employing paid staff and the median number of full-
time equivalent paid staff, by type of agency .................................................. 55 3-8 Total number of volunteers and total hours volunteered per
month, among programs with volunteers ....................................................... 56 3-9 Median number of volunteers and median number of hours
volunteered per program in an average month, among programs with volunteers .................................................................................................... 56
3-10 Age range of volunteers, among programs with volunteers during
the past 12 months ............................................................................................. 57 3-11 Programs reporting difficulty obtaining and retaining volunteers
by degree of difficulty, among programs with volunteers during the past 12 months ............................................................................................. 58
3-12 Average percentage of total food distributed during the past 12
months, by source............................................................................................... 59 3-13 Frequently purchased items in the past 12 months, by source .................... 60 3-14 Programs reporting food donations during the past 12 months,
by source .............................................................................................................. 61

Hunger in America 2014 National Report ix
Contents (continued)
Tables (continued) Page
3-15 Programs indicating a change in limitations on clients’ frequency of use during the past 12 months ..................................................................... 62
3-16 Programs reporting changes in the number of clients compared
to the prior year................................................................................................... 63 3-17 Programs reporting the degree to which they had food available
to meet needs of clients during the past 12 months ...................................... 64 3-18 Programs turning clients away for any reason during the past 12
months.................................................................................................................. 64 3-19 Agencies providing services related to the Supplemental
Nutrition Assistance Program (SNAP) and subtypes of services offered .................................................................................................................. 66
3-20 Agencies reporting level of funding, by source of funds .............................. 73 3-21 Agencies reporting select reductions during the past 12 months ................ 74 3-22 Agencies reporting select reasons for making reductions, among
agencies that reported reductions during the past 12 months ..................... 75 3-23 Agencies reporting challenges associated with continuing to
provide services, among agencies that reported reductions during the past 12 months ............................................................................................. 77
4-1 Estimates of the number of clients served by program type ....................... 85 4-2 Selected demographic characteristics of Feeding America clients .............. 87 4-3 Client household composition .......................................................................... 90 4-4 Client households by size .................................................................................. 91 4-5 Client households containing members in select age ranges ........................ 92 4-6 Single and multiple race/ethnicity households ............................................... 94

Hunger in America 2014 National Report x
Contents (continued)
Tables (continued) Page
4-7 Client households by highest educational attainment, among adult household members ........................................................................................... 95
4-8 Client household military service ..................................................................... 97 4-9 Client households by primary language(s) spoken in household
among adults ....................................................................................................... 98 4-10 Client households by type of nontemporary housing ................................... 100 4-11 Client households by type of temporary housing .......................................... 101 4-12 Client households with various housing payment arrangements,
among clients residing in nontemporary housing .......................................... 103 4-13 Respondents by recent housing transitions .................................................... 104 4-14 Client households by cooking or cold storage capacity at home ................. 105 4-15 Client households by most employed person in the past
12 months ............................................................................................................ 108 4-16 Client households by typical hours worked per week, among
households with employment in the past 12 months.................................... 109 4-17 Client households by duration without employment, among client
households where most employed person is currently not working ................................................................................................................. 111
4-18 Client households’ work status in the past four weeks; and
reasons for not looking for work, among client households where formerly most employed person is now out of the workforce .................... 112
4-19 Respondents responsible for grandchildren in the household .................... 114 4-20 Client households with household member(s) released from
prison in the past 12 months ............................................................................ 114 4-21 Client households by adult student status ....................................................... 116

Hunger in America 2014 National Report xi
Contents (continued)
Tables (continued) Page
4-22 Client households by health status of respondent and presence of another household member in poor health .................................................... 118
4-23 Client households with member(s) having select health conditions ........... 119 4-24 Client households in which no one has health insurance, and
client households with unpaid medical bills ................................................... 121 4-25 All client households by reported monthly income ranges, and
monthly household income as a percentage of the poverty level ................ 123 4-26 Households with at least one child by reported monthly income
ranges, and monthly household income as a percentage of the poverty level ........................................................................................................ 124
4-27 Households with at least one senior by reported monthly income
ranges, and monthly household income as a percentage of the poverty level ........................................................................................................ 125
4-28 All client households by reported annual income ranges, and
annual household income as a percentage of the poverty level ................... 127 4-29 Client households with at least one child by reported annual
income ranges, and annual household income as a percentage of the poverty level .................................................................................................. 128
4-30 Client households with at least one senior by reported annual
income ranges, and annual household income as a percentage of the poverty level .................................................................................................. 129
5-1 Client households by level of food security .................................................... 133 5-2 Client households reporting frequency of choosing between food
and other necessities in the past 12 months ................................................... 135 5-3 Client households reporting different strategies for food
assistance .............................................................................................................. 137

Hunger in America 2014 National Report xii
Contents (continued)
Tables (continued) Page
5-4 Client households by reported current receipt of SNAP benefits, and among those not currently receiving benefits, whether or not they have applied ................................................................................................ 140
5-5 Client households by reported usual time to exhaustion of SNAP
benefits, among households receiving SNAP benefits ................................. 142 5-6 Client households reporting select reasons for not applying for
SNAP benefits, among households that have never applied ....................... 144 5-7 Client households reporting not having qualified for SNAP
benefits at some point, among households that have ever applied, and main reason for not qualifying .................................................................. 145
5-8 Client households by potential income eligibility for SNAP
benefits, among households not receiving SNAP benefits .......................... 146 5-9 Client households reporting SNAP benefits stopping, among
households that have ever applied, and main reason for benefits stopping ................................................................................................................ 147
5-10 Client households by reported current receipt of WIC benefits ................. 148 5-11 Client household participation in programs targeted at children
other than WIC, among households with school-aged children ................. 149 5-12 Client households by coping strategies used to get enough food
in the past 12 months ......................................................................................... 151 5-13 Client households reporting number of coping strategies used to
get enough food in the past 12 months........................................................... 153
Figures
1-1 Sources of food and channels of food distribution in the Feeding America network................................................................................................. 7
2-1 Tablet computers ready for data collection at a food program site ............ 13

Hunger in America 2014 National Report xiii
Contents (continued)
Figures (continued) Page
2-2 Multistage design of Hunger in America 2014 ............................................... 16 2-3 Participation of the Feeding America network in Hunger in
America 2014....................................................................................................... 18 2-4 Program type categorizations used in Hunger in America 2014 ................. 20 3-1 Hunger in America 2014 food bank service areas ......................................... 46 3-2 Distribution of meal and grocery programs, among food
programs .............................................................................................................. 50 3-3 Outreach approach among agencies offering SNAP-related
services ................................................................................................................. 67 3-4 Reasons for not offering SNAP-related services, among agencies
reporting not offering them .............................................................................. 68 3-5 Agencies providing assistance with specific government programs
other than SNAP ................................................................................................ 69 3-6 Agencies providing assistance with government programs other
than SNAP ........................................................................................................... 70 3-7 Agencies providing information about services in more than one
language, by type of agency ............................................................................... 72 3-8 Agencies reporting level of anxiety associated with continuing to
provide services, among agencies that reported reductions during the past 12 months ............................................................................................. 76
4-1 Client households in temporary versus nontemporary housing .................. 99 4-2 Employment status in the past four weeks of the most employed
person ................................................................................................................... 110
Hunger in America 2014 National Report xiv
Acknowledgments
We would like to acknowledge the strong support and vision of the core Hunger in America 2014
team at Feeding America: Maura Daly, Elaine Waxman, PhD, Emily Engelhard, Theresa DelVecchio
Dys, Monica Hake, Amaris Kinne, Brittany Morgan, Meghan O’Leary, and David Watsula. The
quality of the product was also much improved through sound advice from the Technical Advisory
Group (TAG) of Feeding America as well as through review of the report by outside experts.
Technical Advisory Group of Feeding America
Craig Gundersen, PhD, Endowed Professor, University of Illinois at Urbana-Champaign Alison Jacknowitz, PhD, Associate Professor, American University Robert Santos, Chief Methodologist, Urban Institute
Expert Reviewers
John Cook, PhD, Associate Professor, Boston University Colleen Heflin, PhD, Associate Professor, University of Missouri Dean Jolliffe, PhD, Senior Economist, The World Bank Development Research Group Rich Lucas, Acting Associate Administrator, USDA Food and Nutrition Service Nancy Mathiowetz, PhD, Professor, University of Wisconsin Milwaukee Molly Scott, Senior Research Associate, Urban Institute Hilary Seligman, MD, Assistant Professor, University of California San Francisco Anita Singh, PhD, Branch Chief, USDA Food and Nutrition Service SNAP Evaluation Branch Laura Tiehen, PhD, Economist, USDA Economic Research Service
At Westat, several staff made critical contributions throughout the course of the study, especially
Nancy Weinfield, PhD, Jill Montaquila, PhD, and Christine Borger, PhD. During data collection,
Julie Bollmer, PhD and Roline Milfort, PhD spent long hours obtaining necessary information from
the food banks and providing feedback to them throughout the sampling process. Additional
support came from Susan Acker, Bryan Davis, Matthew English, Lauren Faulkner,
William Frey, PhD, Beth Hintz, Jennifer Kawata, Laurie May, PhD, Martha Palan, Jarnee Riley, Beth
Slotman, and many others.
At the Urban Institute, Maeve Gearing, PhD, Gregory Mills, PhD, Tracy Vericker, PhD, and Sheila
Zedlewski all contributed to the final report products, providing their expertise, writing, and analysis.
Programming support was provided by Sybil Mendonca.
The members of the Feeding America Report Review Committee, representing both Feeding
America National Office Staff, network staff, and the TAG, provided valuable feedback and

Hunger in America 2014 National Report xv
Acknowledgements
revisions during the review phase of the study. We also acknowledge the contributions of the
Feeding America Member Advisory Committee (MAC) who provided support throughout the
entirety of the study.
Report Review Committee
Joanne Batson, Foodbank of Southeastern Virginia Katie Carver, Akron-Canton Regional Foodbank Helen Costello, New Hampshire Food Bank Angela DePaul, Feeding America Jessica Hager, Feeding America Sophie Milam, Feeding America Ami McReynolds, Feeding America Carol Tienken, The Greater Boston Food Bank Eleni Towns, Feeding America
Feeding America Member Advisory Committee
Joanne Batson, Foodbank of Southeastern Virginia Jeff Dronkers, Los Angeles Regional Food Bank JC Dwyer, Texas Food Bank Network Dan Flowers, Akron-Canton Regional Foodbank Melanie Gosselin, New Hampshire Food Bank Estella Mayhue-Greer, Mid-South Food Bank Carol Tienken, The Greater Boston Food Bank Jodi Tyson, Three Square Food Bank David Weaver, South Plains Food Bank
Additional support came from other members of the Feeding America national office, including
Emily Basten, Lisa Davis, Adam Dewey, Michael Kato, Elizabeth Rowan-Chandler, and Amy Satoh.
We would also like to acknowledge and extend our sincere gratitude to the staff and volunteers at
each of the participating food banks, agencies, and programs, who dedicated their time and efforts
to the Hunger in America study and were integral to the implementation of the study in the field.
Finally, we acknowledge each of the clients who graciously agreed to share their stories with us
through participation in the Client Survey. Their contributions made this study possible.

Hunger in America 2014 National Report 1
Feeding America, the nation’s leading domestic hunger-relief organization, has conducted the most
comprehensive study of hunger in America every four years since 1993. Like the prior studies,
Hunger in America 2014 (HIA 2014), the latest iteration, documents the critical role that the
charitable food assistance network plays in supporting struggling families in the United States. Study
results are based on surveys of food programs in the charitable food assistance network supported
by Feeding America, and clients that access services through that network in 2012-2013.1 In addition
to this report on the Feeding America national network, this study has resulted in 42 state reports
and 196 food bank reports detailing network activities on local levels.
The current assessment occurs in a period with historically high demand for food assistance.
Unemployment and poverty rates have remained high since the Great Recession of 2008,2 and the
number of households receiving nutrition assistance from the federal government’s Supplemental
Nutrition Assistance Program has increased by approximately 50 percent between 2009 and 2013.3
Demand for charitable food assistance has also expanded. HIA 2014 finds an increased number of
individuals relying on charitable assistance to access nutritious foods for themselves and their
families.
1.1 The Charitable Food Assistance Network Serves a Critical
Need
The federal government annually measures household food security – defined as all people in a
household having enough food for an active healthy life at all times – and distinguishes four levels of
1 All identified programs were invited to participate in the Hunger in America 2014 (HIA 2014) Agency Survey. For the Client Survey, data collection visits were not conducted at programs that exclusively serve adults with severe cognitive or mental health disabilities, children, or other confidential populations such as victims of domestic violence.
2 Officially the recession lasted from December 2007 through June 2009. See http://www.nber.org/cycles/cyclesmain.html.
3 SNAP caseload statistics are from www.fns.usda.gov/pd/16SNAPpartHH.htm.
Introduction and Background 1

Hunger in America 2014 National Report 2
Introduction and Background 1
food security from high to very low.4 Households classified as having low or very low food security
are combined into the category of food insecure. In 2012, more than one in seven (17.6 million) U.S.
households experienced food insecurity at some time during the year.5 All of these households
experienced limited or uncertain access to adequate food including reports of reduced quality,
variety, or desirability of diet. About 7 million of these households had members who went hungry
or skipped meals, an indication of very low food security. Rates of food insecurity are particularly
high in households with incomes near or below the federal poverty level and in single-parent
households with children. Although about half of those who are food insecure live in White,
non-Hispanic households, the rate of food insecurity is about twice as high among Black and
Hispanic households.6
Federal food assistance programs help to alleviate hunger and poor nutrition for millions of food-
insecure individuals. These programs are targeted at low-income households, with specific programs
targeting vulnerable populations like children, seniors, and pregnant or post-partum women. About
six in 10 food-insecure households participate in one or more of the three largest federal food and
nutrition assistance programs: the Supplemental Nutrition Assistance Program (SNAP); the Special
Supplemental Nutrition Program for Women, Infants, and Children (WIC); and the National School
Lunch Program (NSLP).7
SNAP, formerly known as the Food Stamp Program, is the largest nutrition assistance program.
Participating low-income households receive monthly SNAP benefit allotments in the form of
electronic debit cards (also known as EBT, or electronic benefit transfer). While SNAP is intended
for low-income households, it is not targeted for any specific subgroup within that population.
SNAP benefits can be redeemed only at authorized retailers and are limited to the purchase of food
4 The U.S. Department of Agriculture defines four levels of food security. High food security indicates no reported food-access problems. Marginal food security indicates one or two reported problems that are typically anxiety over food sufficiency or shortage of food in the house, but with little or no indication of changes in diets or food intake. Low food security indicates reports of reduced quality, variety, or desirability of diet and indicates little or no reduced food intake. Very low food security indicates reports of multiple disrupted eating patterns and reduced food intake. The food security measure used in HIA 2014 combines high and marginal food security into a single category. Definitions are from http://www.ers.usda.gov/topics/food-nutrition-assistance/food-security-in-the-us/definitions-of-food-security.aspx#.U76oj_ldW-g
5 Alicia Coleman-Jensen, Mark Nord, and Anita Singh. (2013). Household Food Security in the United States in 2012, ERR-155 (Washington, DC: U.S. Department of Agriculture, Economic Research Service), http://www.ers.usda.gov/publications/err-economic-research-report/err155.aspx. Earlier years are available at the same web site.
6 Ibid., Table 2, p. 13.
7 Ibid., Table 2, p. 13.

Hunger in America 2014 National Report 3
Introduction and Background 1
items for use at home as well as seeds and plants to produce food. The WIC program offers
nutrition education and supplemental foods to low-income pregnant and post-partum women, and
children up to age five who are at nutritional risk. NSLP is a federal meal program that provides a
nutritionally balanced free or reduced-price lunch to eligible children at school.8 These programs,
along with other aspects of the federal nutrition safety net, not only alleviate hunger, they also
improve nutrition and health outcomes. For individuals and families who receive federal nutrition
assistance, charitable food assistance may serve as a complement to federal assistance in alleviating
hunger. Nonetheless, despite providing critical assistance, federal nutrition assistance programs do
not reach everyone at risk of hunger in the United States.9 For example, an estimated 27 percent of
the food-insecure population in 2012 had household incomes above the standard eligibility
thresholds for federal nutrition assistance programs. For these individuals and families, charitable
food assistance may be the only available source of support.
Feeding America supports a nationwide network of food banks that help to combat hunger through
coordinated efforts with affiliated agencies in all 50 states, Washington DC, and Puerto Rico. At the
national level, Feeding America secures food from corporate manufacturers, retailers, and produce
suppliers, and facilitates the acquisition of government food supplies by the food banks, distributing
a total of more than three billion pounds of food and grocery products annually. Additionally,
Feeding America provides more than $30 million worth of grants to support local anti-hunger
initiatives in communities nationwide. Feeding America also provides member food banks with
technical assistance, including support to maximize participation in SNAP and other previously
mentioned federal nutrition assistance programs. Individual food banks also independently solicit
food and financial donations from regional manufacturers, retailers, and businesses. The food banks
work with a network of agencies to support local hunger-relief programs by distributing food and by
raising awareness about the scope of hunger within their service areas.
8 Program descriptions from www.fns.usda.gov.
9 Numerous recent studies show how federal food assistance programs reduce food insecurity. For example, a 2013 study finds that participation in the Supplemental Nutrition Assistance Program (SNAP) for about six months is associated with a 4.6 percent decrease in the number of food-insecure households; longer participation further reduces food insecurity. See James Mabli, Jim Ohls, Lisa Dragoset, Laura Castner, and Betsy Santos. (2013). Measuring the Effect of Supplemental Nutrition Assistance Program (SNAP) Participation on Food Security (Washington, DC: U.S. Department of Agriculture, Food and Nutrition Service). Brent Kreider, John V. Pepper, Craig Gundersen, and Dean Jolliffe. (2012). “Identifying the Effects of SNAP (Food Stamps) on Child Health Outcomes When Participation is Endogenous and Misreported.” Journal of the American Statistical Association, 107 (499): 958-975. Published studies by Caroline Ratcliffe, Signe-Mary McKernan, and Sisi Zhang. (2011). “How Much Does the Supplemental Nutrition Assistance Program Reduce Food Insecurity?” American Journal of Agricultural Economics, 93 (4): 1082-1098; and by Elton Mykerezi and Bradford F. Mills. (2010). “The Impact of Food Stamp Program Participation on Household Food Insecurity,” American Journal of Agricultural Economics, 92 (5): 1379-1391 show that SNAP participation substantially decreases the risk of household food insecurity.

Hunger in America 2014 National Report 4
Introduction and Background 1
1.2 The Weak Economy Has Increased Demand for Food
Assistance
The economy has experienced an unusually slow recovery since the deep recession in 2008 and
2009. The nation’s poverty rate reached 15.1 percent in 2010, the highest rate since 1993. The
poverty rate remained at 15 percent in 2012 with 46.5 million people living in poverty. This is the
largest number living in poverty since statistics were first published more than 50 years ago.10
Sustained high poverty rates arise in part from high unemployment and falling household incomes.
The U.S. unemployment rate exceeded 7.0 percent for five years between late 2008 and late 2013
(about 11 million people in any given month), the longest period of high unemployment in
70 years.11 While the unemployment rate indicates that a large number of people cannot find jobs,
many others are employed part time because they cannot find full-time work. The government’s
measure of underemployment that includes all of these groups averaged 14 percent in fiscal year
2013, compared to a prerecession rate of 8.4 percent in 2007.12 On average, about 24 million people
were underemployed in 2013. Additionally, others may work full time but due to low wages their
earnings do not lift them above the poverty line. Perhaps not surprisingly, real household income
dropped 8.3 percent between 2007 and 2012.13 Poverty, unemployment, and income, along with
other demographic characteristics, are key drivers of individual and household food insecurity across
the country.14
These economic trends have contributed to rapid growth in the numbers of households seeking and
receiving food assistance. The number of people participating in SNAP, the largest federal food
10 Statistics for 2012 (the latest data available) are from Carmen DeNavas-Walt, Bernadette D. Proctor, and Jessica Smith. (2013). “Income, Poverty, and Health Insurance Coverage in the United States: 2012.” Current Population Survey, 60-245 (Washington, DC: U.S. Census Bureau). Poverty statistics for additional years are from the same source and found at www.census.gov/hhes/www/poverty/data.
11 Congressional Budget Office, “What Accounts for the Slow Growth of the Economy After the Recession?” (Washington, DC: Author, November 14, 2012), and data from the U.S. Bureau of Labor Statistics, http://data.bls.gov/timeseries/LNS14000000.
12 The measure of labor underutilization includes the total unemployed, plus all persons marginally attached to the labor force, plus total employed part time for economic reasons as a percent of the civilian labor force plus all persons marginally attached to the labor force, found at http://www.bls.gov/CPS/.
13 DeNavas-Walt et al., “Income, Poverty, and Health Insurance Coverage in the United States: 2012.”
14 Craig Gundersen, Emily Engelhard, Amy Satoh, and Elaine Waxman. (2014). Map the Meal Gap 2014: Food Insecurity and Child Food Insecurity Estimates at the County Level. Feeding America, 2014. See www.feedingamerica.org/mapthegap.

Hunger in America 2014 National Report 5
Introduction and Background 1
assistance program, rose to a new high of 47.6 million in 2013, up from 33.5 million in 2009.15 While
some of this growth can be attributed to changes in SNAP rules, recent studies conclude that the
weak economy explains most of the increase.16 Other government programs that provided nutrition
assistance in 2013 also saw high levels of enrollment. About 9 million people received WIC benefits
in 2013. In the same year, 21.5 million children received free or reduced-price school lunches, and
11.2 million children received school breakfasts.17
The increased need for food assistance observed within federal nutrition programs is mirrored in the
number of clients seeking help from the charitable food assistance network. Despite known
undercounts of those seeking charitable help, government studies have documented increases in the
number of individuals getting help from food pantries and emergency meal programs in 2012
compared with 2010.18 Feeding America, as the nation’s largest charitable food assistance
organization, plays a critical role in helping those in need access nutritious food for themselves and
their families.
1.3 How the Feeding America Network Delivers Food
Assistance
The Feeding America network secures and provides food to families struggling with hunger,
educates the public about the issue of hunger, and advocates for policies that protects people from
going hungry.
The Feeding America network provides food to people facing hunger through a multilevel
approach. Through the Feeding America national office in Chicago, food, grocery items, and funds
are secured for the network through national relationships with corporate manufacturers and
retailers, produce suppliers, individuals, foundations, government entities, and other partners. The
Feeding America national office also supports the safe delivery and distribution of food throughout
their network with a robust logistics and transportation system.
15 Participation data from http://www.fns.usda.gov/pd/supplemental-nutrition-assistance-program-snap
16 See, for example, Peter Ganong and Jeffrey B. Liebman. (2013). “Explaining Trends in SNAP Enrollment.” (Cambridge, MA: Harvard University and NBER).
17 Participation data from: WIC - http://www.fns.usda.gov/sites/default/files//pd/wisummary.pdf; National School Lunch Program - http://www.fns.usda.gov/sites/default/files/pd/slsummar.pdf; and School Breakfast Program - http://www.fns.usda.gov/sites/default/files/pd/sbsummar.pdf
18 Coleman-Jensen et al., Household Food Security in the United States in 2012.

Hunger in America 2014 National Report 6
Introduction and Background 1
National programs are an important part of local hunger-relief efforts. Using best practices, the
Feeding America network establishes and replicates several hunger-relief programs. One example of
a national program is the Mobile Pantry Program, through which food banks utilize dry/refrigerated
vehicles to provide food to clients in areas where traditional pantries may not be accessible or where
certain foods, such as produce, are difficult to distribute. The Mobile Pantry Program extends food
banks’ reach, ensuring that more clients across diverse geographies are served.
Feeding America member food banks are on the front lines of hunger-relief.19 In addition to
securing food and funds through the Feeding America national office, food banks secure local
resources as well. While Feeding America’s national office does not receive any federal funds, many
food banks receive federal hunger-relief funding in the form of commodities, meal reimbursements,
or grants. Food banks may also receive state and local funding to support their work. Food banks
distribute food through a network of nonprofit partner agencies to support the programs they
operate such as food pantries, kitchens, and shelters in their service area. Each food bank may work
with hundreds of partner agencies to get food to people facing hunger. Some food banks also
collaborate with Partner Distribution Organizations (PDOs). While PDOs are not direct members
of the Feeding America network, they are independent nonprofit organizations contracted to fulfill
certain food banking responsibilities, such as product distribution management and food solicitation
within a portion of a member’s service area.
Partner agencies vary in size; some operate a single program, such as a food pantry in one room,
while others are large community organizations that distribute food through various programs at
multiple locations.20 Partner agencies can provide either emergency or nonemergency food assistance
to clients, or in the case of large multiservice agencies, both. Emergency food programs include
pantries that distribute unprepared grocery products and kitchens that provide prepared meals on
site. Nonemergency programs have a primary purpose other than food distribution—for example a
rehabilitation, youth, or senior program that also provides the people it serves with food.
Additionally, food banks and partner agencies provide clients with outreach, education, referral,
and/or application assistance with federal nutrition programs.
19 Feeding America member food banks have entered into a formal contract that outlines the standards that must be adhered to by all member food banks. Other nonmember food banks in the nation may provide similar services as Feeding America member food banks, but this study only addresses the services provided and clients served by member food banks.
20 Partner agencies are charitable organizations that have typically entered into a contract with a Feeding America member food bank that outlines the standards that must be adhered to by all of the respective food bank’s partner agencies. Other charitable agencies in the nation may provide similar services as partner agencies in the Feeding America network, but this study only addresses the services provided by those in the Feeding America network.

Hunger in America 2014 National Report 7
Introduction and Background 1
In all, the Feeding America network distributes over 3.3 billion pounds of food and grocery items
through 202 food banks in all 50 states, Puerto Rico, and Washington, DC each year. The pathways
through which the Feeding America network receives and distributes food are shown in Figure 1-1.
Figure 1-1. Sources of food and channels of food distribution in the Feeding America network
Hunger in America 2014 National Report 8
Introduction and Background 1
1.4 The Hunger in America 2014 Study Updates the Public on
the Use of Charitable Food Assistance
Given the important role that this network plays in reducing hunger across the United States,
Feeding America supports quadrennial surveys to document these programs and the clients they
serve. The HIA 2014 study includes an Agency Survey and a Client Survey. The Agency Survey
details how charitable agencies and their food distribution programs operate, including the sources
of food available to them, their use of volunteers, and the challenges they see today and in the
future. The Client Survey documents the number and characteristics of the people that use
charitable food assistance, including what other sources of food assistance they have available and
utilize.
The objectives of the HIA 2014 national study are:
To create national-, state-, and food bank-level estimates of the number of unduplicated
clients served annually, monthly, and weekly through a methodologically sound approach.
To understand the full scope and role of services in the Feeding America network by broadening the scope of the study from that of the previous study, Hunger in America 2010.
To provide for appropriate cultural and language competence in the Client Survey, in order to best capture the diversity of the Feeding America network.
To broaden our understanding of issues relating to:
– Client health, vulnerability, nutrition choices, and financial hardship;
– The role of food banks in clients’ formal and informal coping strategies;
– Clients’ participation in federal nutrition programs, especially SNAP; and
– The relation between these clients’ coping strategies, food security, federal program participation, and the frequency of food bank usage.
The study’s findings will enhance understanding of food assistance needs in America. Considerable
data are available to understand use of federal nutrition programs, but little research is available to
describe the use of charitable food assistance programs. This gap in knowledge is concerning
because the need for food assistance goes beyond federal programs. Many people in need of food
assistance are not eligible or do not participate in federal nutrition programs, and often federal

Hunger in America 2014 National Report 9
Introduction and Background 1
programs do not fully meet the food assistance needs of participants; the charitable food assistance
network strives to meet this unmet need.
Using the information in this national report, food bank staff and volunteers will have the data they
need to document their role in reducing hunger across the country and communicate this
information clearly with donors. This report will also help to inform government officials and the
public about food insecurity and the needs of America’s low income citizens. Ultimately, the results
will help to guide actions to reduce the prevalence and severity of hunger in America. Subsequent
reports will describe the survey results for many individual states and local food banks.
The following is a summary of Chapters 2 through 6:
Chapter 2 describes the study’s data collection methods and challenges.
Chapter 3 describes the Feeding America national network, highlighting the results of the Agency Survey. The numbers and locations of food banks participating in the survey, their partners, services provided, and funding are emphasized.
Chapter 4 includes estimates of the number of clients using food assistance through the Feeding America network weekly, monthly, and annually, and their demographic characteristics. It also describes the households of clients of the Feeding America network, including languages spoken, their housing characteristics, employment status, and health status.
Chapter 5 describes clients’ food security, use of both charitable and government food assistance, and coping strategies used to prevent hunger.
Chapter 6 provides a summary of the findings.

Hunger in America 2014 National Report 10
Key Findings
Hunger in America 2014 (HIA 2014) employed a multistage design to facilitate the selection of a probability sample and produce the best estimates possible.
The study differed in many ways from past Hunger in America (HIA) studies, introducing innovations that move the study forward but also limit direct comparisons that can be made between the studies.
More than 32,000 partner agencies participated in the Agency Survey, and more than 60,000 clients completed Client Surveys.
Ninety-two percent of member food banks participated in some portion of the study. Data in the report are weighted to allow national estimates that account for nonparticipating food banks.
HIA 2014 followed the pattern of past HIA studies by implementing two surveys—an Agency
Survey and a Client Survey—through a collaborative effort of an extended research team. For the
current study, the main collaborators were the Feeding America national office research team and
their Technical Advisory Group, the research teams at Westat and the Urban Institute, and the
network of local Feeding America food banks. Each local food bank identified a study coordinator,
or Hunger Study Coordinator (HSC). Each HSC was responsible for coordinating and facilitating
local data collection efforts. One hundred eighty-six food banks and 10 Partner Distribution
Organizations (PDOs) participated in at least one portion of HIA 2014. Further details of food bank
response rates appear in Section 2.5.
The Agency Survey, conducted from October 2012 to January 2013, surveyed the partner agencies
of all participating food banks. It gathered information about the agencies’ hunger-relief efforts, and
the specific programs the agencies operate. Only agencies that responded to the Agency Survey and
listed at least one eligible food program could potentially be selected for the Client Survey, which
was a survey of the food program clients who receive services from the Feeding America network.
Visits to food programs to conduct Client Surveys were carried out by food bank staff and
volunteers from April through August 2013. These surveys sought information from clients about
their personal circumstances, household demographics, needs and challenges, and use of both
government and charitable hunger-relief services.
Meeting the Challenge of Collecting Data about
Food Programs and Clients 2

Hunger in America 2014 National Report 11
Meeting the Challenge of Collecting Data about Food Programs and Clients 2
The remainder of this chapter provides an overview of the scientific efforts that resulted in the HIA
2014 study, including: the development of the two survey instruments; study and sample design;
training of the data collection teams; implementation of the surveys; response rates; methodological
issues to consider when interpreting the findings of the study; and an overview of the approach to
analyses in this report.
2.1 Study and Sample Design
2.1.1 Instrument Development
Agency Survey
The Agency Survey sought information on partner agencies’ organization and services and the
programs the agencies operate. This included agency funding sources, staffing, and challenges they
face; food, non-food, and food-related benefit programs they operate; and food program details,
including operations, services, and client details.
Once a final draft of the Agency Survey had been developed, a cognitive interview pretest was
conducted to identify items that were misunderstood or difficult for respondents to answer. Feeding
America provided Westat with a list of agencies from which to recruit for the Agency Survey pretest.
Cognitive interviews were completed with six agencies. Pretest agencies were selected to vary in size,
agency type, and number and type of programs and services provided.
Pretesting was conducted through a combination of paper and telephone activities. Agencies
selected for the pretest were sent a hardcopy of the survey by mail. They were contacted via email
and subsequently contacted by telephone to confirm they received the survey and to schedule a time
for the telephone-based cognitive interview in September or October of 2012. The survey was
revised based on pretest findings, and the final web-based version was programmed. The Westat
Institutional Review Board (IRB) reviewed the Agency Survey and exempted the survey from
further review.
Agencies without Internet access that operated only one program were permitted to submit
responses to the survey to Westat by telephone.21 For agencies with only Spanish-speaking staff, a
21 Forty-six agencies submitted survey responses through the paper/telephone option.

Hunger in America 2014 National Report 12
Meeting the Challenge of Collecting Data about Food Programs and Clients 2
translated version of the Agency Survey was available to assist respondents. A slightly different
version of the survey was available depending on the type of program operated by the agency, so
that skip patterns were simplified.
Client Survey
The Client Survey sought information from those served by partner agencies and the programs they
operate, including individual and household demographics and circumstances; health status, food
insecurity and coping strategies; and participation in government and charitable food assistance
programs.
The research team conducted cognitive interview pretesting of the Client Survey items in December
2012 with 20 food bank clients representing four service areas. Service areas were selected to include
urban, urban/suburban mix, suburban, and rural clients for a variety of different types of food
programs. Thirteen of the interviews were conducted in-person, and the remaining seven were
conducted by telephone. Clients’ understanding of and comfort with the interview questions was
probed. Based on the clients’ feedback, the survey was then revised and finalized. The Client Survey
was then programmed into a computerized version of the survey to be implemented using a
touchscreen tablet device (Figure 2-1) and Audio Computer-Assisted Self-Interview (ACASI)
technology. The ACASI technology allows respondents to hold the tablet, listen through
headphones to an audio recording of each question and its response options as they are displayed on
the tablet, and select their responses using a stylus. ACASI provides increased privacy for
respondents compared to face-to-face interviews, allowing for more accurate and honest responses
to potentially sensitive survey questions such as those related to food insecurity or participation in
federal programs. The use of ACASI also ensures that appropriate skip patterns are followed
automatically, reducing human error that may occur during volunteer-administered client interviews,
and allowing volunteers to focus their attention on the successful implementation of the sampling
methodology rather than administration of the survey questions. In comparison to self-administered
paper surveys, ACASI is more appropriate for populations containing individuals with lower literacy
levels.22 This is the first time that the Client Survey was conducted electronically and through
ACASI. Previously, the survey was administered verbally by an interviewer following skip patterns
and answers were recorded on paper.
22 Sid J. Schneider and Brad Edwards. (2000). “Developing Usability Guidelines for AudioCASI Respondents with Limited Literacy Skills.” Journal of Official Statistics, 16: 255-271.

Hunger in America 2014 National Report 13
Meeting the Challenge of Collecting Data about Food Programs and Clients 2
Figure 2-1. Tablet computers ready for data collection at a food program site
For HIA 2014, the ACASI text and audio were translated and programmed in English, Spanish,
Mandarin Chinese, Russian, and Vietnamese, which were languages identified by food banks as
priorities among the target population. Translation was carried out by professional, certified
language translators, and reviewed for accuracy by editors who were native speakers. Audio versions
of the survey questions were recorded by native speakers, and reviewed by editors for accuracy and
compliance with the written questions.
In March 2013, Feeding America and five participating food banks conducted a second round of
pretesting to ensure that the tablets and survey technology were user-friendly for the various client
populations. Fifty clients, including both English- and Spanish-speakers, were randomly sampled
across 10 charitable food program sites chosen to pretest the Client Survey using the tablet and
ACASI technology. These were selected to ensure both geographic and program diversity. After
completing the pretest survey, clients responded to evaluations in order to provide feedback about
data collection. In these evaluations, 98 percent of the clients reported that the tablet was easy to
use, despite nearly half of the clients indicating that they had no prior experience using tablets or
laptops. The clients’ feedback was used to make additional improvements to the digital surveys,
including substantially increasing the audio volume and improving the legibility of the survey
questions. The Westat IRB reviewed the Client Survey and all associated procedures and materials,
and approved the activities under expedited authority.

Hunger in America 2014 National Report 14
Meeting the Challenge of Collecting Data about Food Programs and Clients 2
New Survey Questions since Hunger in America 2010 (HIA 2010)
The Agency and Client Survey instruments included questions from the HIA 2010 surveys, other
validated survey instruments, such as the U.S. Census Bureau’s Current Population Survey (CPS)
and the U.S. Department of Agriculture Core Food Security Module (CFSM), as well as
contributions and revisions from the collaborative 2014 research team. Revisions included the
addition of questions to each survey, which were incorporated following feedback that Feeding
America received from the network of food banks after HIA 2010.
The Agency Survey featured new questions on nutrition services offered by agencies, agency
governance, program sources of funding, as well as the opportunity to provide detail about all of the
agencies’ programs, not solely emergency food programs as in 2010. The Client Survey incorporated
new questions about client health, coping strategies, student status or military service, and languages
spoken in the household, to name a few. Copies of the Agency Survey and Client Survey questions
appear in Appendix A.
2.1.2 Study Design
A primary goal for HIA 2014 was to design a study that allowed for selection of a probability sample
of clients and for collection of data to support national- and food bank-level estimates of the total
number of clients served. Below we describe the fundamental design used to achieve these goals.
Greater detail on study design, sampling, and weighting is available in the HIA 2014 Technical
Volume, available upon request from Feeding America.
HIA 2014 aimed to collect information directly from Feeding America clients, and to describe the
number and characteristics of the clients who use the network for charitable food assistance.
Because conducting interviews with every client served by every program over an extended period of
time was not feasible, probability sampling was used to select a subset of programs at which data
collection should occur, the days on which data collection should occur at those programs, and the
clients who should be asked to complete the survey. As it applies to HIA 2014, probability sampling
is an approach in which each client has a known, positive chance of being selected to complete the
survey. With probability samples, it is possible to use the sample to estimate population-level
information. The full population of Feeding America clients in the nation is unknown, so it was not
possible to select from a known list of clients, as is sometimes possible in probability sampling.

Hunger in America 2014 National Report 15
Meeting the Challenge of Collecting Data about Food Programs and Clients 2
Consequently, the study was designed with a multistage design to facilitate selection of the
probability sample.
The first step of the study design was conducting the Agency Survey, which included all partner
agencies identified by participating food banks on agency lists they compiled and provided to
Feeding America. The Agency Survey was used to obtain an enumeration of eligible food programs
in the Feeding America network and basic information about those programs. The differentiation
between agencies and their programs proved somewhat challenging, as the line between them in the
field is not always clear. The research team worked with food banks and partner agencies to ensure
that agencies and their programs were clearly delineated, but ultimately the distinction may not
always be precise (see Section 2.6.4). Following the Agency Survey, the sample of clients was
obtained using a multistage design. A graphic depiction of the multistage design appears in
Figure 2-2. Details of the multistage design appear in the Technical Volume, but the four basic
stages were as follows:
Stage 1 involved selecting agencies from the set of respondents to the Agency Survey.
Agencies that distributed more food per year, measured by pounds as an indication of size, had a greater chance of being selected.
Stage 2 involved selecting a sample of programs within sampled agencies.23 Again, larger programs, based on reports from the Agency Survey of numbers of duplicated clients served,24 had a higher chance of being selected.
Stage 3 involved assigning a sampled program to a “survey day/hours” (a span of hours within a day during the survey data collection period). This was done in a manner that aimed to distribute data collection over the entire survey period and capture the ebbs and flows in the way that clients are served with respect to hours of the day, days of the week, and weeks of the month.
Stage 4 involved sending trained data collectors to the sampled program on the assigned survey day. The data collectors maintained a complete tally of all clients served during the survey hours and were provided with the protocol for selecting a random sample of clients to complete the Client Survey (a systematic sample that was based on a random start and a sampling interval provided to the data collectors).
23 To ensure that food banks could feasibly carry out the data collection as designed, allocations were made with input from Feeding America to balance food bank size with operational capacities. Some allocations were reduced or supplemented after the initial sample was drawn if food banks found that they had greater or fewer resources available.
24 If a program did not report on the duplicated number of clients served, this was imputed to allow for inclusion of the program in Client Survey sampling.

Hunger in America 2014 National Report 16
Meeting the Challenge of Collecting Data about Food Programs and Clients 2
Figure 2-2. Multistage design of Hunger in America 2014
Hunger in America 2014 National Report 17
Meeting the Challenge of Collecting Data about Food Programs and Clients 2
The Client Survey excluded programs that serve only children or persons with severe cognitive or
mental health disabilities, home delivery programs, and confidential locations such as domestic
violence shelters where data collection would violate privacy. Within eligible programs, children and
clients with severe cognitive or mental health disabilities were deemed ineligible for the survey.
Although children were not eligible to participate as respondents, they are included in the client
counts and other data when they are members of entire households served by food programs, as is
the case with programs that provide groceries.
Following the selection of the sample of programs for the Client Survey, Feeding America identified
79 very large programs that had not been included in the sample, either because the size measures
provided for their agencies or the program themselves were missing or inaccurate, or because the
agency or program was not listed. Large programs were identified by looking at the proportion of
the food bank’s total pounds distributed to the partner agency. In such situations, these very large
programs or additional program sites were added to the sample with certainty, and the weighting
approach was later modified to account for these new additions. A common example included food
banks that distribute food directly to clients through food bank-operated programs, rather than
programs at partner agencies. These food bank-operated programs represented a large percentage of
the food bank’s total pounds and may have operated through multiple distribution sites per
program.
An overview of the study design appears in Figure 2-3, showing participation of the network in the
two surveys, and the participation numbers at each phase of the study.
2.1.3 Program Type Definitions
As mentioned in Section 1.3, Feeding America food banks collaborate with partner agencies that
operate programs to support their communities. Four major program categories were used in HIA
2014 to classify services provided by the agencies. Food programs fell into one of two broad
categories: meal or grocery. These categories were established because clients are conceptualized
differently under each category (see further explanation in this Chapter, Section 2.6.3). Additionally,
we expected patterns to emerge among clients utilizing each of the two distinct categories; we
discuss these patterns amidst the findings in the coming chapters.

Hunger in America 2014 National Report 18
Meeting the Challenge of Collecting Data about Food Programs and Clients 2
Figure 2-3. Participation of the Feeding America network in Hunger in America 2014

Hunger in America 2014 National Report 19
Meeting the Challenge of Collecting Data about Food Programs and Clients 2
Food programs were probed on the Agency Survey and potentially eligible for inclusion in the Client
Survey. Two other categories of non-food programs were identified and probed on the Agency
Survey but were not eligible for the Client Survey because they do not distribute food. Non-food
programs include both food-related benefits programs, and other non-food programs. Details of the
program categories appear below, and the types of the programs in each category are listed in
Figure 2-4. Descriptions of the types of programs in each category appear in Appendix B.
MEAL PROGRAMS provide prepared meals or snacks on site or in the client’s home to clients in
need who may or may not reside on the agency’s premises. This category includes all congregate
feeding programs along with all other kitchens and shelter programs.
GROCERY PROGRAMS distribute nonprepared foods, groceries, and other household supplies
for off-site use, usually for preparation in the client’s home. This includes all types of pantries,
home-delivered groceries, mobile grocery programs, Commodity Supplemental Food Programs
(CSFP), BackPack programs, and Community Gardens.
FOOD-RELATED BENEFIT PROGRAMS provide resources that enable individuals in need to
procure meals, groceries, or nongrocery products. These programs typically involve outreach,
information and referrals, and/or application assistance to obtain state or federal food assistance
benefits such as the Supplemental Nutrition Assistance Program (SNAP) or the Special
Supplemental Nutrition Program for Women, Infants, and Children (WIC), or nutrition education.
OTHER NON-FOOD PROGRAMS have a primary purpose other than meal programs, grocery
programs or food-related benefit programs, such as clothing/furniture assistance or legal assistance.
Although non-food programs are not directly related to the issue of hunger, they are included to
show the diverse array of services provided through the Feeding America network.
Figure 2-4 highlights the mutually exclusive and exhaustive nature of the meal/grocery distinction
across program types included in our sample. It also indicates how the pantries, kitchens, and
shelters approach of the HIA 2010 report fits within our broader schema. Senior programs and
mobile programs are a subset of special focus and are discussed separately at times in the report.

Hunger in America 2014 National Report 20
Meeting the Challenge of Collecting Data about Food Programs and Clients 2
Figure 2-4. Program type categorizations used in Hunger in America 2014
2.2 Agency Survey Implementation
2.2.1 Collecting Data from Partner Agencies
The sample for the Agency Survey was comprised of food bank partner agencies. The process of
identifying organizations to be surveyed for the Agency Survey began with a listing of the partner
agencies of each participating food bank. Each food bank provided the research teams with a list of
their active agencies. The Agency Survey was intended to be a census of the agencies of all
participating food banks thus, each active agency received an invitation to complete the survey. The

Hunger in America 2014 National Report 21
Meeting the Challenge of Collecting Data about Food Programs and Clients 2
list was updated as needed during the survey period to reflect recognized omissions, identified
inaccuracies, or agencies that became inactive.25
2.2.2 Agency Survey Data Collection
One major innovation for HIA 2014 was web-based data collection for the Agency Survey. This
mode of data collection was intended to (1) reduce burden on agency staff by automatically applying
skip patterns and (2) increase the quality and efficiency of data collected. Beginning on
October 19, 2012, Westat sent Agency Survey invitation emails to all the food banks’ agencies.26 The
email included instructions for accessing and completing the survey, and for accessing additional
resource documents.
The Agency Survey included two components: agency questions and program questions. As part of
the agency questions, agencies enumerated the food and non-food programs they operate, including
grocery programs such as pantries; meal programs such as kitchens, shelters, or congregate meals;
food-related benefits programs such as SNAP outreach and application assistance and nutrition
education; and other non-food programs such as legal or clothing assistance. Subsequently, agencies
were asked a series of in-depth questions about each food program, for up to 15 of their largest food
programs.
For special circumstances when agencies could not complete the Agency Survey online, a
paper/telephone version was made available upon request. The paper/telephone version was only
available to agencies operating a single program.27 The paper/telephone version asked the
respondent to complete a hardcopy worksheet version of the survey, and to follow up by calling the
Westat research team to complete a telephone interview component with an interviewer who read
the web survey questions to the respondent and entered responses directly in the respondent’s
specific web survey. Forty-six agencies completed the paper/telephone version of the survey.
25 It is possible that food banks may not ultimately have listed all the agencies they serve for the purposes of this study. Additionally, some agencies may not have reported on all of their programs within the Agency Survey. The information in this report is based solely on the agencies and programs that participated in this study.
26 Additional survey invitations were sent in later batches as the agency list was updated by the food banks.
27 This was because there was a set of program-level survey questions for each program based on program type. Multiple programs would make the paper version too onerous.

Hunger in America 2014 National Report 22
Meeting the Challenge of Collecting Data about Food Programs and Clients 2
2.2.3 Agency Survey Resource Materials
Agencies had access to numerous resources and training materials to help them complete their
Agency Survey. The Feeding America and Westat research teams developed tools in a range of
media to help facilitate successful completion of the survey by agencies, as well as to equip food
banks with sufficient information to similarly support their agencies. These resources included
webinars emphasizing the survey’s purpose and procedures, and reference guides to assist survey
respondents in navigating the study web site and gathering the information and records needed to
complete the survey. In addition, the research team created English and Spanish versions of the
question-by-question instructions with screenshots of the web survey as a resource for agency staff.
Both Feeding America and Westat allocated staff whose principal role was to provide technical
assistance to the food banks and agencies. Westat staffed two helpdesks, which fielded technical and
survey content-related questions over email and phone. Feeding America staff supported food bank
staff and agency representatives who wanted to discuss strategies for increasing agency response
rates, needed additional help reaching out to agencies or had difficulty answering particular
questions. Additionally, each food bank’s HSC was substantially involved in the Agency Survey data
collection process to ensure that agencies could access the web-based survey and to promote a high
completion rate of surveys among their agencies. To this end, many food banks offered incentives to
agencies completing the survey, such as raffles for donated kitchen equipment, or credits to use
towards procuring food from the food bank.
2.2.4 Agency Survey Field Period
The Agency Survey field period was from October 19, 2012 to January 7, 2013. Survey invitations
were sent beginning October 19 and continued as the agency list was updated with newly identified
agencies eligible for the survey.
The original Agency Survey field period was scheduled to end December 14, 2012, but was extended
by three weeks to January 7, 2013 in an effort to allow agencies more time to complete the survey
and therefore be eligible for the Client Survey. In addition, several agencies were affected by
Superstorm Sandy during October 2012, which influenced their ability to complete the Agency
Survey within the original field period.

Hunger in America 2014 National Report 23
Meeting the Challenge of Collecting Data about Food Programs and Clients 2
2.2.5 Agency Survey Monitoring
A web-based study management system (SMS) was developed to allow the HSCs to track their
agencies’ survey completion progress in real time. HSCs were food bank staff charged with
coordinating, implementing, and monitoring all HIA 2014 study operations for their respective food
banks. HSCs could view the survey status (not yet started, in progress, or complete) for each of their
own agencies, as well as the date of the most recent activity. The SMS also included filtering options
and summary reports. HSCs used the SMS to guide their follow-up efforts as needed. Additionally,
Feeding America and Westat used the SMS to monitor progress across all food banks.
2.3 Training of Food Bank Hunger Study Coordinators and
Volunteer Data Collectors
HSCs were also responsible for all aspects of Client Survey study execution on the local level. They
coordinated with sampled agencies and their sampled food programs, and oversaw implementation
of the data collection visits. HSCs were expected to recruit and train data collectors who would
assist their food bank with the Client Survey data collection. Data collectors, who included both
food bank staff members and volunteers from the community, were trained to go to the sampled
food programs; conduct client sampling at the programs; gain cooperation and consent to
participate from the sampled clients; and aid in the administration of the computerized survey.
To ensure that the HSCs were appropriately prepared to train their data collectors, all HSCs
participated in an in-person training conducted by Westat and Feeding America staff. In addition to
providing the HSCs with a full understanding of the requirements of the Client Survey data
collection and the HSC responsibilities, the training comprehensively reviewed the topics and
associated materials that the HSCs would use to train their own data collectors. Topics covered
included the processes for sampling, recruiting, and consenting clients; setting up and using the
equipment (e.g., tablets, keyboards, headphones); navigating the survey and being able to respond to
client questions; handling any problems that might occur in field; and submitting all of the necessary
data and information at the end of the program visit.
Westat conducted three two-day in-person trainings in different regions of the country. Every HSC
was expected to attend one of these trainings. In the few cases in which an HSC did not attend one
of the scheduled in-person trainings, or a different HSC was newly assigned at a food bank, a

Hunger in America 2014 National Report 24
Meeting the Challenge of Collecting Data about Food Programs and Clients 2
follow-up training was conducted. After the trainings, Westat provided HSCs with all of the
materials and resources they would need to train their data collectors and to help ensure these
trainings were conducted consistently across the food banks, including webinars, manuals, and study
data collection forms, as well as resource documents with recommended guidance for recruiting,
training, and overseeing volunteer data collectors.
2.4 Client Survey Implementation
As described in Section 2.1 and depicted in Figure 2-2, the sample for the Client Survey was selected
using a four-stage sampling approach with the stages of selection being (1) agency, (2) program,
(3) survey day/hours, and (4) clients. The following sections describe the details of how the client
survey was implemented.
2.4.1 Client Survey Translation
The Client Survey was administered in five languages that were identified with input from
participating food banks, with the intent to reach the largest number of clients. Prior to HIA 2014,
the Client Survey was only offered in English and Spanish. Most of the 60,122 completed surveys
were administered in English, with other language translations utilized as shown in Table 2-1.
Although the survey was offered in multiple languages, a client’s ability to take the survey in a
particular language was dependent on the recruitment and availability of bilingual data collectors.
Data collectors were responsible for inviting sampled clients to take the survey and collecting verbal
consent; consequently, limited bilingual data collector availability may have precluded some clients
from taking the survey.
Table 2-1. Client surveys administered by language
Language administered Count Percentage
English 55,818 92.8%
Mandarin Chinese 101 0.2%
Russian 70 0.1%
Spanish 4,027 6.7%
Vietnamese 106 0.2%
Unweighted total 60,122 100%

Hunger in America 2014 National Report 25
Meeting the Challenge of Collecting Data about Food Programs and Clients 2
2.4.2 Client Data Collection Procedures
In early April 2013, Westat released the food bank sampling plans to the HSCs so they could
prepare for data collection beginning in mid-April. HSCs called program staff to discuss visit
logistics and formed data collection teams for each visit, with a lead data collector overseeing the
equipment and data collection forms. The HSCs were instructed to make these preparations about
two weeks before the program visit. For the sampled programs, the assignment of survey day/hours
was randomized based on information about the program’s days and hours of operation provided in
the Agency Survey. Because of incomplete or inaccurate responses to these items, in many cases, the
program was not in operation during the assigned survey day/hours. Additionally, in some cases, it
was not feasible for the food bank to arrange for data collection to occur during the assigned survey
day/hours (e.g., due to resource limitations or weather-related issues). If the HSC discovered that a
visit could not be conducted during the assigned day/time, a prespecified procedure was used to
assign a replacement survey day/hours.28 Up to two replacements were permitted before a visit was
finalized as “nonresponse,” and the data collection did not take place.29
Sampling of clients at the programs was carefully specified to achieve seven to eight sampled clients
at each program visit. The overall target number of sampled clients was designed to yield a
prespecified target number of 70,000 completed Client Surveys, with the assumption that five
percent of clients would be ineligible and 75.0 percent of eligible clients would complete the Client
Survey. On the day of a program visit, data collectors sampled clients waiting for services and
invited those who were sampled to participate in the survey.
For those clients who agreed to participate, data collectors described all survey activities, informed
clients that risks were minimal and the study voluntary, and obtained verbal consent from clients to
participate. Data collectors instructed the clients in the use of the tablet and the ACASI instrument
before allowing the clients to complete the survey. Some food banks provided modest incentives for
participation, such as cash or gift cards worth $10 or less, but not all food banks were able to offer
28 Procedures were designed to be compatible with the initial sampling protocol, such as going on the same day of the week during the following week (for example replacing a Monday with the following Monday), or the same day and week of the following month (for example the first Monday of the month during the following month). The Westat Helpdesk was available to assist with complex rescheduling needs.
29 Final nonresponse was assigned as a status to any program that was eligible for sampling at the time of the Agency Survey and was sampled, but a program visit did not occur. Reasons for nonresponse included: no longer partnering with the food bank; not open during the data collection period; refusal to participate; visit was rescheduled twice and did not occur; program operates only on an on-call basis; or any other reason an eligible sampled program would not be visited.
Hunger in America 2014 National Report 26
Meeting the Challenge of Collecting Data about Food Programs and Clients 2
incentives to clients. Incentives, when provided, were distributed after participation, but were not
dependent on full survey completion.
After the close of each program visit, the lead data collector was required to complete a Site Survey
for the program. The Site Survey provided a summary of the results of each data collection visit,
documenting key variables related to sampling including data collection start and end times, and
adjustments to sampling procedures required by logistics of the visit or program operations.30
Additionally, the Site Survey included questions on the total client flow during the visit, participation
status of each sampled client, and reasons for client ineligibility or nonresponse. Reasons for
ineligibility included being a minor, or having cognitive impairment or mental health disability that
interfered with the ability to consent to participation. Nonresponse included any reason for
nonparticipation by an eligible sampled client. These data were compiled in report format and were
made available to HSCs and research team staff. HSCs could also review this information for local
monitoring of their data collectors’ efforts. A copy of the Site Survey appears in Appendix A.
2.4.3 Client Survey Field Period
Client Survey data collection began on April 17, 2013 and continued through August 30, 2013. As
designed, a slow rollout of the Client Survey was implemented in April to allow food banks time to
adjust to the data collection effort. Food banks were given fewer assignments from April 17 through
April 30, which resulted in smaller numbers of completed Client Surveys at the beginning of data
collection (see Table 2-2 for unweighted Client Survey completion information).31 Due to either
available program operation days or the need to reschedule visits, some food banks had no data
collection visits during these first two weeks. From May through August 2013 assignments were
steady, but rescheduling needs resulted in some scheduled visits being shifted to later in the data
collection period.
30 Adjustments were typically required for nontraditional operational circumstances such as programs that opened before the scheduled time, or programs that split clients into multiple lines to wait for services.
31 A survey needed to have responses to at least 50 percent of the core survey items to be considered complete. Core survey items were those that involved no possibility of valid skips due to survey skip logic. Because the survey had extensive skip logic, 50 percent of core items was deemed the minimum necessary for a survey to yield enough valid data for inclusion in analyses.

Hunger in America 2014 National Report 27
Meeting the Challenge of Collecting Data about Food Programs and Clients 2
Table 2-2. Completed client surveys by month
2013 Month Count Percentage
April 17 through April 30 1,395 2.3%
May 1 through May 31 11,766 19.6%
June 1 through June 30 13,966 23.2%
July 1 through July 31 15,739 26.2%
August 1 through August 30* 17,256 28.7%
Unweighted total 60,122 100%
*Although the official data collection period ended in August, six of these surveys were actually collected in September.
2.4.4 Client Survey Resources
As with the Agency Survey, food bank staff and data collectors had access to various resources and
support throughout client data collection. Westat’s telephone and email helpdesk was operational all
hours during which data collection took place. Feeding America staff were on-call during business
hours to take any overflow calls that could not be answered immediately by the Westat team.
Common questions the helpdesk addressed included how to reschedule an assigned data collection
window and how to count and sample clients in nontraditional circumstances, e.g., at a food
program with multiple client lines. Feeding America staff also supported food banks with volunteer
recruitment, pre- and post-data collection documentation, and bolstering food banks’ internal
capacities for staff time dedicated to HIA 2014.
In addition to remote support, Feeding America and Westat staff provided on-the-ground technical
assistance to various food banks to help ensure the success and integrity of client data collection.
The Westat team, which designed the data collector training as well as sampling implementation,
observed food bank operations and data collection at 10 food bank locations of varying food bank
size and capacity. Following the visits, Westat provided feedback to the food banks to help them
improve their methods. Feeding America staff also traveled to 45 food banks and visited more than
100 programs on an as-needed basis to provide supplemental trainings of HSCs and data collectors,
to serve as additional data collectors when the food banks were in need, and to help troubleshoot
study implementation challenges.

Hunger in America 2014 National Report 28
Meeting the Challenge of Collecting Data about Food Programs and Clients 2
2.5 Response Rates
The response rate is the ratio of the number of units with completed surveys to the number of units
sampled and eligible for the survey. For example, the units could be agencies, programs, households,
or persons. Response rates can be either unweighted or weighted. The unweighted rate, computed
using the raw number of cases, provides a useful description of the success of the operational
aspects of the survey. The weighted rate32 gives a better description of the success of the survey with
respect to the population sampled, since the weights allow for inference of the sample data
(including response status) to the population level. Both rates are usually similar.33 All of the unit
response rates discussed in this section are unweighted; weighted response rates are given in the
Technical Volume.
At the food-bank level, participation in the study was high, with 196 member food banks and PDOs
participating in the Agency Survey and 187 participating in the Client Survey. Study participation was
offered to each Feeding America food bank, and if the food bank’s network included PDOs the
member could then elect to extend the offer of participation to their PDOs. PDOs are not members
of the Feeding America network directly, but are instead independent nonprofit organizations that
are contracted to fulfill all primary food banking responsibilities34 on behalf of the network member
in a defined portion of a member’s service area.
For HIA 2014, food bank members were given the option of either participating in the study on
behalf of their PDO, in which case the agencies of the PDO were included on the member agency
list, or choosing to have the PDOs participate independently. Ten PDOs participated independently
and were treated identically to all other participating food banks.35 For the Agency Survey, 186 of the
202 member food banks,36 or 92.0 percent participated, in addition to 10 PDOs participating
independently. For the Client Survey, 178 of the 202 member food banks participated, or
88.1 percent, as well as nine PDOs. For the remainder of this section, all references to “food bank”
include both Feeding America member food banks and PDOs that participated on their own.
32 Weighted rates are computed by summing the weights (usually the reciprocals of the probability of selecting the units) for both the numerator and denominator.
33 Unless the probabilities of selection and the unit response rates in the categories with different selection probabilities vary considerably.
34 Food banking responsibilities of PDOs include: Product distribution management; agency relations management; food solicitation; fundraising for hunger-related activities; and media and community relations for hunger-related activities.
35 PDOs were given separate food bank IDs for the study, and they appear separately in the data files and reports.
36 At the time of the study, the Feeding America network comprised 202 member food banks.

Hunger in America 2014 National Report 29
Meeting the Challenge of Collecting Data about Food Programs and Clients 2
At the agency level, of the 44,659 eligible agencies listed by participating food banks, 32,677
responded to enough questions on the Agency Survey to be included in the analysis dataset for the
Agency Survey data. A case was included in the analysis dataset if at least 50 percent of the core
survey items that all respondents were eligible to answer were in fact answered. Fewer than
50 percent of these responses provided too little data for the case to be validly included in analyses.
Thus, under this definition, 73.2 percent of agencies had analytically complete Agency Surveys.
Standards for including agencies and their programs in the sampling frame for the Client Survey were
less stringent than the standard for inclusion in the analysis dataset described above (i.e., analytically
complete Agency Surveys). Agencies were included in the Client Survey sampling frame if their
Agency Survey was deemed sufficient for use in sampling, meaning that the agency listed and
provided basic information on the survey about at least one eligible food program. At the time of
agency and program sampling for the Client Survey, there were 42,878 agencies potentially eligible
for sampling, and 35,690 of these (83.2 percent) provided basic information about at least one
eligible food program and thus were included in the sampling frame for the Client Survey. We sampled
a subset of these agencies, resulting in a sample of 15,972 agencies, and then sampled one or more
eligible food programs from each sampled agency, resulting in a program-level sample of 16,654
food programs,37 either meal or grocery, selected for participation in the Client Survey data
collection (See Section 2.1.2 for a summary of the stages of sample selection).
In addition to programs identified as ineligible and removed from the sampling frame earlier, a total
of 1,419 of the 16,654 sampled programs (8.5 percent) were deemed ineligible for the Client Survey
by their food banks because upon further inspection it was determined that they, too, only served
ineligible clients (children or persons with severe mental or cognitive disabilities), were domestic
violence shelters, or their program logistics precluded data collection from occurring (e.g., home
delivery such as “Meals on Wheels”). Of the 15,235 program visits assigned to eligible programs,
12,475 visits (81.9 percent) were completed. The distribution of visits to the two broad types of food
programs – meal and grocery – appears in Table 2-3.
37 These 16,654 sampled programs were associated with 16,556 distinct programs, as some large programs had multiple distribution sites included in the sample at the request of Feeding America or the food banks.

Hunger in America 2014 National Report 30
Meeting the Challenge of Collecting Data about Food Programs and Clients 2
Table 2-3. Unweighted distribution of program visits by program category
Type of program Count Percentage
Meal 1,732 13.9%
Grocery 10,743 86.1%
Unweighted total 12,475 100%
Data Source: Hunger in America 2014 Agency Survey.
An estimated 97,133 eligible clients were sampled during those program visits, and 60,122 clients
completed the Client Survey,38 for a client response rate of 61.9 percent.
During the process of sampling clients at the data collection visits, an estimated39 1.6 percent of
sampled clients were found to be ineligible. Sampled individuals were deemed ineligible for the
Client Survey if they were minors initially misidentified as adult clients, and therefore could not
consent to participation, or if the data collector determined that the sampled individual was
cognitively impaired in ways that precluded understanding and consenting to participation.
Clients could also be deemed eligible but nonresponse if they refused the survey or wished to take
the survey but another factor prevented them from doing so. Tracked reasons for refusal or
nonresponse included: the program was closing for the day; the sampled individual was picking up
food as a proxy for a client, such as a home health aide, and therefore no client was available to
complete the survey; concerns about using the computer technology; having a physical impairment
that made completion of the survey too challenging; needing to complete the survey in a language
not offered; or other reasons not specified. Other reasons for client refusal were observed by data
collectors and noted anecdotally but not tracked. Some clients were unable to complete the survey
because they were dependent on another individual for a ride, while others reported needing to leave
in order to go to a job, school, or appointment. Still other clients declined, reporting feeling ill or
unable to leave their children unsupervised at the time that the survey was offered. These reasons
for refusal, as well as other unrecorded reasons, may have introduced some bias into the survey
results that is difficult to quantify. Considering responses among all 97,133 eligible sampled clients
who were invited to take the survey, females participated at a higher rate than males (65.1 percent vs.
38 Client Surveys were submitted for another 5,088 clients that did not meet the completion criterion of having responses to at least 50 percent of the core survey items that all respondents were eligible to answer. Fewer than 50 percent of these responses provided too little data for the case to be validly included in analyses.
39 The mechanism used for data collectors to report on the sampling of clients was the Site Survey—a form completed by the data collectors following the program visit. Among the 12,475 completed program visits, site surveys were not completed for 56 of these program visits; thus, for these 56 visits, information about the number of sampled clients and the number of eligible clients among those sampled is missing and must be estimated.

Hunger in America 2014 National Report 31
Meeting the Challenge of Collecting Data about Food Programs and Clients 2
58.6 percent), and nonseniors participated at a higher rate than seniors (69.1 percent vs.
49.7 percent).
2.5.1 Characteristics of Client Survey Respondents
All data presented in Chapters 4 and 5 of this report utilize weighted data, representing and
describing the clients in the Feeding America network and their households. From an operational
perspective it is informative to know some unweighted characteristics of the actual survey
respondents. Survey respondents themselves were not necessarily representative of the full network
of clients, but their demographic characteristics can provide insight into the perspective they
brought to the survey activity.
Survey respondents were most often adult nonseniors, with the highest percentage of respondents
falling into the 30-49 year old age range (Table 2-4). Across both meal and grocery programs,
respondents did not tend to be in the youngest age group, 18-29.
Table 2-4. Survey respondents by age group
Age of respondent
Type of program All food
programs Meal Grocery
18-29 15.5% 10.7% 11.3%
30-49 36.2% 37.6% 37.4%
50-59 22.7% 24.3% 24.1%
60 and over 25.5% 27.4% 27.1%
Total 100% 100% 100%
Unweighted nonreporting respondents 397 2,774 3,171
Total unweighted N 8,070 52,052 60,122
Data Source: Hunger in America 2014 Client Survey, Q3.
Numbers listed under nonreporting respondents include missing data due to item nonresponse.
Across all programs respondents were more likely to be female than male, but a closer look at the
program-specific data shows that this trend is reversed for meal programs (Table 2-5).

Hunger in America 2014 National Report 32
Meeting the Challenge of Collecting Data about Food Programs and Clients 2
Table 2-5. Survey respondents by gender
Gender
Type of program All food
programs Meal Grocery
Female 42.5% 70.4% 66.7%
Male 57.5% 29.6% 33.3%
Total 100% 100% 100%
Unweighted nonreporting respondents 181 1,091 1,272
Total unweighted N 8,070 52,052 60,122
Data Source: Hunger in America 2014 Client Survey, Q2.
Numbers listed under nonreporting respondents include missing data due to item nonresponse.
Finally, the survey respondents were racially and ethnically diverse (Table 2-6). Although
57.7 percent of respondents were White, the overall group of respondents brings together the
perspectives of many different races and countries of origin. Variability in survey respondent race
and ethnicity may have been limited by the fact that surveys were offered in only five languages
(as described in Section 2.4.1), and even administration in those languages was limited by the
availability of data collectors who could recruit participants in their preferred language.
Table 2-6. Survey respondents by race and ethnicity
Race/ethnicity
Type of program All food
programs Meal Grocery
American Indian or Alaska Native 5.4% 3.8% 4.0%
Asian 1.0% 1.2% 1.2%
Chinese 27.1% 20.9% 21.5%
Filipino 22.9% 36.2% 34.8%
Other Asian 46.7% 55.7% 47.7%
Black or African American 24.2% 25.6% 25.4%
Hispanic 10.7% 14.4% 13.9%
Mexican 60.8% 67.2% 66.5%
Puerto Rican 19.9% 11.9% 12.7%
Other Latino/Hispanic 26.6% 24.9% 25.1%
Native Hawaiian or Other Pacific Islander 1.0% 0.7% 0.8%
White 61.3% 57.1% 57.7%
Some other race 2.3% 1.5% 1.6%
Multiple race or ethnicity 4.6% 3.7% 3.9%
Unweighted nonreporting respondents 196 1,154 1,350 Total unweighted N 8,070 52,052 60,122
Data Source: Hunger in America 2014 Client Survey, Q4, Q4A, and Q4B.
Respondents could mark more than one race/ethnicity subcategory so percentages may not sum to 100%.Respondents who endorsed
multiple races or ethnicities were counted under each race/ethnicity endorsed and under multiple race or ethnicity.
Numbers listed under nonreporting respondents include missing data due to item nonresponse.
Other Asian includes Bangladeshi, Burmese, Cambodian, Hmong, Indian (India), Indonesian, Japanese, Korean, Laotian, Malaysian,
Pakistani, Sri Lankan, Taiwanese, Thai, Vietnamese, and Other Asian (unspecified).
Other Latino/Hispanic includes Salvadoran, Guatemalan, Costa Rican, Honduran, Nicaraguan, Panamanian, Cuban, Spanish American
and Other Latino (unspecified).

Hunger in America 2014 National Report 33
Meeting the Challenge of Collecting Data about Food Programs and Clients 2
2.6 Methodological Considerations in Understanding and
Interpreting Findings
2.6.1 Changes in Program Types between HIA 2010 and HIA 2014
HIA 2010 focused on pantries, kitchens, and shelters, often known as emergency food programs.
HIA 2014 includes numerous other program types, thus broadening the spectrum of programs
described and included in data collection. As a result, the program type categorizations have changed
in HIA 2014. Food programs, which are included in both the Agency and Client Surveys, are now
divided more broadly into those that provide meals and those that provide groceries.
See Section 2.1.3 for details of program types. Specific subtypes of programs are described in
Appendix B.
2.6.2 Underrepresentation of Children Served by the Feeding America
Network
One important focus of the Feeding America network is to address the issue of hunger among
children. Consequently, the network provides food to many programs that uniquely serve children,
including BackPack Programs, Kids Cafe, Afterschool Snack, daycare, child congregate feeding
programs, and others. Although information on these programs for children was included in the
Agency Survey, the programs were not eligible for participation in the Client Survey. Children could
not consent to participate or provide the type of information sought on the surveys, nor were
parents present at the programs to consent or answer on their behalf. Similarly, children present
during client data collection at eligible meal programs were not eligible to be sampled or invited to
respond to the Client Survey. The study does report on households with children who receive
grocery program services, thus including children in the client estimates for grocery programs, but
overall the study will underestimate Feeding America’s services provided to children.

Hunger in America 2014 National Report 34
Meeting the Challenge of Collecting Data about Food Programs and Clients 2
2.6.3 Survey Respondents, Their Households, and Food Program Clients
In understanding the terminology and units of analysis for the Client Survey, it is necessary to
consider the concept of the “client,” as the definition varied slightly by program type.
For meal programs, the client is the individual who receives the actual prepared meal
or snack on site at the program. For example, an individual attending a senior congregate meal program receives services, but no one else at that individual’s home may be a food program client. Consequently, when data collectors counted and sampled clients in meal programs, each eligible individual on site was counted and sampled separately. Sampled individuals served as the respondents.
For grocery programs, every member of the household receiving the groceries may benefit from the grocery products brought home; thus, the entire household, or conceptualized differently each individual within the household, is a client. When counting and sampling clients in grocery programs, sampling was done by counting each household group as one client. If the household was sampled, one adult household member volunteered to serve as the respondent on behalf of the household.
Clients who responded to the survey answered questions about themselves and their households.
We report data in Chapter 4 on characteristics of both individual clients and the clients’ households,
to allow an understanding of both the clients who receive food program services (individual food
recipients for meal programs, but all individuals in the household for grocery programs), as well as
the background and home circumstances of all clients, regardless of whether the entire household
receives services. We continue to report data on clients’ households in Chapter 5, encompassing
both direct recipients of food program services and members of their households, for meal and
grocery programs.
2.6.4 Agency List Challenges
At the beginning of the study, food banks provided information to Feeding America about all their
partner agencies (the organizations that operate the food distribution programs). This list was used
as the foundation for the frame of agencies to which the Agency Survey was distributed.
Respondents to the Agency Survey were then used as the frame for the Client Survey sample.
During the course of the Agency Survey data collection, however, the research team discovered that
the agency list contained some errors and inconsistencies. In some cases, agencies had been
inadvertently omitted from the list. In other cases, the programs that the agencies operated were also
listed as agencies themselves, particularly if the food banks distributed food directly to the individual

Hunger in America 2014 National Report 35
Meeting the Challenge of Collecting Data about Food Programs and Clients 2
programs. Although the research teams worked with the food banks to clarify terminology, correct
errors, and ensure that data were received on all identified agencies and their programs, it is possible
that some food banks may not have listed all the agencies they serve for the purposes of this study.
The information in this report is based solely on the agencies and programs that participated in this
study.
2.6.5 Volunteer Data Collection Efforts
HIA 2014 is the largest data collection we are aware of in the country carried out by volunteer data
collectors. Each food bank’s data collector pool varied substantially; whereas some food banks used
only food bank staff for data collection activities, other food banks may have relied exclusively on
external volunteers, interns, or paid data collectors. Although many data collectors were food bank
staff engaged with study activities, the added generous efforts of volunteers made the study possible.
Nonetheless, relying on a volunteer workforce to help implement a complex and lengthy data
collection presents inevitable challenges. Unlike full-time professional data collectors who are
committed only to that task for months on end, volunteers are often able to give only a limited
amount of time scheduled around employment, school, and other commitments. This more limited
availability may have resulted in some volunteers not having the opportunity to accrue enough
experience to master the data collection activities. Limited volunteer availability also presented a
challenge for HSCs who needed to staff program visits to be carried out during preassigned days and
times to comply with the sample design. Limited volunteer availability sometimes resulted in
rescheduled and missed program visits or in too few data collectors at a visit to implement the
procedures as intended, introducing some statistical error into the study data. Thus, while the
volunteer workforce made the study possible, the limitations of this approach may also affect the
precision of some of the estimates.
2.6.6 Natural Disasters
Natural disasters affected both food distribution operations and survey implementation over the
course of the study. Agency Survey data collection was disrupted by Superstorm Sandy, which made

Hunger in America 2014 National Report 36
Meeting the Challenge of Collecting Data about Food Programs and Clients 2
landfall on October 29, 2012. Agencies across several food banks were affected.40 Some agencies
were unable to complete the Agency Survey as they turned their attention to an increased level of
emergency food distribution and recovery. Additionally, because some agencies closed permanently
or discontinued their services in the wake of the storm, this affected the subsequent Client Survey
data collection.
In other areas, individual food banks also had data collection disrupted during the Client Survey field
period. A tornado struck Moore, Oklahoma, and the adjacent areas on May 20, 2013. Due to the
tornado, that local food bank had to cease client data collection for two weeks. Several wildfires also
spread through Colorado in June and July of 2013, resulting in that local food bank needing to cease
client data collection for two weeks. In each case, the food banks attempted to reschedule visits
when possible. When it was not possible, statistical corrections were implemented to compensate for
the missed visits.41
2.6.7 Changes from Past Hunger in America Studies to Hunger in America
2014
HIA 2014 marks a departure from past HIA studies in several ways. Each of these departures is
important for considering HIA 2014 in context and attempting to compare it to past results. Many
of these changes were the result of feedback from previous studies. Readers are encouraged to
exercise caution and fully understand the limitations of comparing the two studies before drawing
conclusions about the differences between them. The novel features of HIA 2014 include:
Inclusion of Additional Program Types. Whereas previous HIA studies focused
solely on emergency food programs, specifically pantries, kitchens, and shelters, HIA 2014 expanded the scope of the study to include both emergency and nonemergency programs. For the first time, agencies were asked to provide detailed information about all of their programs on the Agency Survey, allowing for the inclusion of mobile pantry programs, senior programs, rehabilitation programs, and more in the Client Survey. Although the increase in scope of HIA 2014 required additional commitment from participating food bank and agency staff, it has provided a more representative picture of the services provided in the network and the clients who use those services.
40 Food banks and their agencies in Connecticut, Delaware, the District of Columbia, Maryland, New Jersey, New York, Pennsylvania, Rhode Island, Virginia, and West Virginia were affected by Superstorm Sandy.
41 Because agencies provide disaster relief whenever their region requires it, these events were treated as random events in estimates and no adjustments were made to account for increased client flow that may result from natural disasters.

Hunger in America 2014 National Report 37
Meeting the Challenge of Collecting Data about Food Programs and Clients 2
Meal/Grocery Classification. The shift to including nonemergency food programs created the need to broaden the category of programs. As described in Section 2.6.1, study findings for HIA 2014 are presented for meal programs and for grocery programs, instead of the former pantry, kitchen, and shelter categories. Although we present some key estimates for clients of pantries, kitchens, and shelters, the shift in design means that even those estimates are not fully comparable with previous years’ estimates.
Digital Data Collection. One of the most important changes from past HIA studies was the introduction of digital data collection. As described earlier in Section 2.1.1, both the Agency Survey and the Client Survey were moved to a computer-based administration to allow for greater ease for respondents completing the surveys. The use of skip logic offered only the relevant survey questions to each respondent and a more secure and timely submission of survey responses. Data collectors were available onsite to provide assistance to clients who struggled with the technological component. Other challenges inherent to the use of technology, such as temporary loss of Internet connection, may have affected some surveys, however, the potential for human error was minimized by the change from in-person client interviews to electronic surveys.
Additional Survey Language Options. Given the diversity of languages spoken by Feeding America clients, HIA 2014 offered both the Agency and Client Surveys in additional languages. For the first time, the Agency Survey was translated into Spanish to accommodate any Spanish-speaking agency staff. The electronic Client Survey was offered in five languages: English, Spanish, Mandarin Chinese, Russian, and Vietnamese. Previously, the Client Survey was only offered in English and Spanish. The three additional languages were selected based on feedback from food bank staff and recommendations from research experts.
Timing Adjustment to Allow for Better Client Sample Selection. In past HIA studies the Agency and Client surveys were conducted at the same time. For HIA 2014, the Agency Survey was conducted before the Client Survey, allowing agency data to be incorporated into the selection criteria for sampling. Due to this shift client data collection was conducted over spring and summer months, whereas in HIA 2010 the data collection was conducted in the spring.
2.7 Summary of Analytical Approach
The analytical approach in this report makes use of all usable responses from the two surveys. In
this section, we review the methodology underlying the descriptive tabulations of the weighted
survey data we present.

Hunger in America 2014 National Report 38
Meeting the Challenge of Collecting Data about Food Programs and Clients 2
2.7.1 Weighting Survey Data
At the agency level, 32,677 agencies responded to enough questions on the Agency Survey to be
included in the analysis sample for the Agency Survey data. At the client level, 60,122 clients
provided enough information on the survey to be retained in the analysis sample.42 All usable
responses to the Agency Survey and Client Survey have been weighted. Survey weights are the
mechanism used to inflate the sample to the level of the population. A survey weight is a number
that may be viewed as the number of “similar” units in the population that the given sampled unit
represents. For HIA 2014, the unit could be an agency, a program, a household, or an individual
client depending on the data being addressed. Using clients as an example, a client’s survey weight is
the number of “similar” clients in the population that the given sampled client represents. As such,
survey weights account for the sampling of clients. For example, within a given program visit, if one
client out of 20 is sampled, a weight of 20 is used to account for each of the sampled clients
representing 20 clients in the population).
Survey weights also account for sample losses (i.e., nonresponse) throughout the stages of sampling
and data collection. Across the various sources of data for HIA 2014, those sample losses were in
the form of food banks declining to participate in the study; agencies from participating food banks
failing to complete the Agency Survey; program visits that did not occur; and clients who did not
complete the Client Survey. The total weighted N that appears in each data table in this report
therefore is the sum of the weighted number of cases used in that analysis, incorporating both the
weighted number of responses and adjustments for sample losses. Further detail on the computation
of the survey weights appears in Section 4.1.1, and in the Technical Volume.
Programs covered by these surveys include both emergency and nonemergency food programs. As
described previously, the Westat team worked with Feeding America to identify two broad food
program type groupings: meal programs and grocery programs (see Section 2.6.1 for descriptions of
the program types). Westat developed weights that may be used to produce client count estimates by
meal or grocery program type, as well as other characteristics of clients. These weights account for
the approach that was used for the Client Survey in sampling meal and grocery programs separately,
for seasonal patterns in program utilization, and for client duplication (i.e., multiple visits to
programs by the same client).
42 A case was included in the analysis sample if at least 50 percent of the core survey items that all respondents were eligible to answer were in fact answered. Fewer than 50 percent of these responses provided too little data for the case to be validly included in analyses.

Hunger in America 2014 National Report 39
Meeting the Challenge of Collecting Data about Food Programs and Clients 2
2.7.2 Valid Survey Responses
The tables in this report commonly display percentage distributions of valid survey responses. These
percentages rely on valid responses, total weighted N, and weighted nonresponse. Valid responses
occur when a survey respondent is eligible to answer a question and chooses an answer that is one
of the presented response options. Total weighted N is the weighted number of units (agencies,
programs, households, or individual clients) who were eligible to respond to a particular survey item,
regardless of whether the respondent actually provided a valid response. Consequently, total
weighted N includes both answers provided to a question and nonresponse. Weighted nonresponse
for the Agency Survey and Client Survey accounts for cases that have missing data due to a
participating respondent not answering a question. In the few questions where “don’t know” or “I’d
prefer not to answer” were presented as response options, endorsement of that option is treated as
nonresponse. The percentages in the tables reflect the total weighted number of valid responses in
the numerator and total weighted N minus weighted nonresponse in the denominator. In addition to
reporting the total weighted N in each table, we report the aggregate of all sources of weighted
nonresponse, labeled as “weighted nonreporting” in the tables. In Chapters 4 and 5 total weighted N
and weighted nonreporting are only listed for “all households,” not for any household subtypes that
appear in the tables. These additional household type statistics are available from Feeding America
upon request.
Due to skip patterns within the survey, some respondents were not eligible to answer some
questions based on their previous answers, and the computerized survey skipped those questions. In
such cases the skipped questions are called valid skips. Valid skips are not included in the total
weighted N since the respondent was not eligible to answer the question.
2.7.3 Tabular Presentation
In Chapter 3 of this report there are two types of tables presented: agency level and program level.
Each table type is specified in the table title. Agency-level tables present weighted percentage
distributions by type of agency. Program-level tables present weighted percentage distributions by
type of program operated by the agencies. Percentages in the agency-level tables are percentages of
the total weighted number of agencies reporting, and those in the program-level tables are
percentages of the total weighted number of programs operated by the agencies. Many of the
program-level tables address only food programs operated by the agencies.

Hunger in America 2014 National Report 40
Meeting the Challenge of Collecting Data about Food Programs and Clients 2
In Chapters 4 and 5 of this report, we present data on clients’ households and on individual clients.
Table titles indicate whether the table is at the level of clients’ households or individual clients.
Household data include the weighted number of households receiving grocery services (since the
whole household receives food), plus the weighted number of households of the individual clients
receiving meal services (representing the broader household of a single client).43 Individual client
data include weighted percentages of individual food recipients, multiplying each grocery household
by the number of household members, and including the single food recipients at meal programs.
In some tables we present a measure of central tendency. Given the distribution among responses,
the mean—the weighted sum of all particular responses divided by the weighted number of total
valid responses—can be skewed by a small subset of extremely large or small values. We therefore
rely also on the median and mode as measures of central tendency. The median is the value that
divides the ordered distribution in half: 50 percent of the weighted responses have smaller values
than the median and 50 percent have higher values. The mode is the value most frequently cited
among the valid responses.
All the data in the report are estimates based on survey responses that are weighted to reflect the
entire Feeding America network. As an estimate, each percentage has a margin of error such that the
true value in the population may be slightly higher or slightly lower than that shown. A 90 percent
confidence interval indicates a range of values that contains the true value with 90 percent
probability. Appendix C includes the tables from the main text, indicating for each percentage
estimate the lower and upper end of the 90 percent confidence interval. For each estimate, there is a
90 percent probability that the true value in the population falls within the displayed interval. All
statistical significance indicated in the report is based on the 90 percent confidence interval.
2.7.4 Client Counts
We present estimates for both duplicated and unduplicated client counts. Duplicated counts
effectively count the number of times clients are reached through food distributions during a given
time period (week, month, or year). These estimates count clients each time they receive food: for
43 In all tables in Chapters 4 and 5, the weight used is a monthly weight reflecting the number of unduplicated individual clients served by the Feeding America network in a typical month, or reflecting the number of unduplicated households of clients served by the Feeding America network in a typical month.

Hunger in America 2014 National Report 41
Meeting the Challenge of Collecting Data about Food Programs and Clients 2
meal programs, that is each time an individual receives a meal; and for grocery programs, each time
an individual and their household members receive groceries. The counts include each member of a
household for each grocery distribution. Unduplicated counts focus on the number of unique
individuals served. Unduplicated counts recognize that any client may visit programs repeatedly, and
these counts adjust for repetition. In the unduplicated count, the household that comes every month
to get groceries from a grocery program will be counted only once in annual counts. We present
weekly, monthly, and annual duplicated and unduplicated count estimates in tables. This information
is displayed by program type and by client demographics.44
2.7.5 Sampling Challenges and Practical Constraints Affecting Precision
of Estimates
There are several additional challenges and constraints on sampling and implementation that
occurred during the study. HIA operates as an attempt to balance well-established research
methodology with the realities of the logistics of a field data collection in a varied and sometimes
unpredictable environment. Consequently, several elements of the study design and implementation
must be considered as context in interpreting study findings as they have the potential to affect the
nature of the probability sample and the precision of the estimates. Although the study’s statistical
experts implemented corrections for these sources of bias whenever possible, such corrections
cannot completely erase the potential for bias. Thus, while we believe the estimates to be as accurate
as possible, they should be interpreted in the context of field data that are rarely as precise as highly
controlled, statistically ideal probability samples.
The Client Survey sample design was a probability sample with an allocation of the number of
program visits for the Client Survey determined individually for each food bank. The selection of
agencies and programs was then done with probability proportionate to size and was designed to
ensure that agencies and programs that served the most clients and distributed the most food had
the highest probability of inclusion in the sample.
Visit allocation numbers that would be optimal for highly precise national estimates were not
practical for implementation by food banks with limited resources for data collection. To ensure that
44 The unique set of weights used to produce client count estimates reflects the dual-frame sampling approach that we employed for Client Survey data collection. This approach permitted independent samples from separate sampling frames for clients serviced by meal programs and clients served by grocery programs. Details on the dual-frame approach and estimator appear in the Technical Volume.

Hunger in America 2014 National Report 42
Meeting the Challenge of Collecting Data about Food Programs and Clients 2
food banks could carry out the data collection as designed allocations were made with input from
Feeding America to balance food bank size with operational capacities. Some allocations were
reduced or supplemented after the initial sample was drawn if food banks found that they had fewer
or greater resources available. This approach ensured that assigned program visits would be more
likely to be implemented, which is preferable to missed visits due to operational limitations.
Other practical constraints stem from the challenge of implementing Client Survey data collection
during the assigned days and times. Although food banks were urged to avoid rescheduling days and
times of visits specified during Stage 3 of the sampling process (see Section 2.1.2), it was necessary at
times due to misreported hours of operation on the Agency Survey, changes in program food
distribution schedules, and challenges related to staffing, equipment resources, and weather. These
changes from the randomly assigned windows may introduce some bias in estimates because they
are departures from the probability sample design that could not be corrected through weighting.
In the sample design process allocations were further limited to a maximum of one meal program
and one grocery program per sampled agency, and one distribution site for multisite programs, to
maximize the number of agencies included in data collection.45 This approach to allocation, while
necessary, resulted in varying probabilities of selection of programs and program clients across food
banks, potentially affecting the precision of national estimates.
Additionally, some agencies may not have reported on all of their large programs within the Agency
Survey. Because the frame of programs eligible for the Client Survey was drawn from those reported
in the Agency Survey, agencies and programs not listed were omitted from the sampling frame. In
other cases, agencies and programs were listed on the agency list or the Agency Surveys, but the
indicators of agency or program size (pounds distributed to the agency by the food bank, or number
of clients the programs reported serving) were either missing or inaccurate. At times, this resulted in
agencies or programs that were very large yet not sampled. In cases where it was discovered that
very large agencies or programs had not been listed or sampled, they were added to the Client
Survey sample post-hoc rather than as a part of the overall probability-based sampling selection
scheme. At times additional distribution sites were also added to the sample within large programs.
In some cases, these additions created exceptions to the rule described above of not more than one
meal and one grocery program per agency.
45 Following the HIA 2010 study, an analysis determined that variation between agencies was greater than variation within agencies. Thus, including a larger sample of agencies (rather than a larger sample of clients) would lead to better precision in the survey estimates. Consequently, the decision for HIA 2014 was to include as large a sample of agencies as possible.

Hunger in America 2014 National Report 43
Meeting the Challenge of Collecting Data about Food Programs and Clients 2
Experts at Westat and on the Feeding America Technical Advisory Group worked together to
develop procedures to account for these challenges. Further details of the challenges and the
solutions implemented appear in the Technical Volume.

Hunger in America 2014 National Report 44
Key Findings
Feeding America member food banks partner with more than 46,000 charitable agencies. These partner agencies operate more than 58,000 food programs, including nearly 19,000 programs that provide meals for onsite consumption, and more than 39,000 programs that provide groceries for use at home.
Agencies also provide many other services, including outreach and application assistance to help clients access food-related benefits programs such as the federal Supplemental Nutrition Assistance Program (SNAP), nutrition education, and non-food assistance with clothing, job training, or legal issues.
Programs rely heavily on volunteers. In a typical month, nearly 2 million volunteers dedicate more than 8.4 million hours of their time to hunger relief.
Approximately 62 percent of the food distributed by the programs comes from Feeding America member food banks, but almost 28 percent of programs reported having less food available than required to meet client needs.
3.1 Feeding America’s Network Is Large and Multifaceted
Feeding America food banks and their partner agencies provide food and services to people in all
50 states, Washington, DC, and Puerto Rico. We estimate that the Feeding America network is
currently serving 46.5 million unique individuals in 15.5 million households annually across the
United States. The number of clients served and other findings from the Client Survey are further
discussed in Chapters 4 and 5. Feeding America carries out this work through the coordinated
efforts of its food banks, their partner agencies, and the food programs operated by those agencies.
This chapter describes the structure of the network, characteristics of partner agencies in the
network, the services the partner agencies provide, and the challenges they face in delivering
charitable food assistance, as reported on the Agency Survey.
3.1.1 Organization of the Network
As described in Chapter 1, the Feeding America national office solicits donations of food, grocery
items, and funds for network food banks. Food banks are charitable, nonprofit organizations that
Describing the Feeding America National
Network 3

Hunger in America 2014 National Report 45
Describing the Feeding America National Network 3
solicit and store donated food until it is distributed to charitable agencies that serve people in need
in their service areas. Together, Feeding America and member food banks raise awareness about the
issue of hunger; advocate on behalf of food insecure people; and support programs and services that
help people access the food they need.
Like the structure of the Feeding America network, food banks each have a network of partner
agencies to which they distribute food. Agencies are typically nonprofit or religious organizations
that vary substantially in size and scope and operate one or more emergency or nonemergency food
programs. These programs are the mechanism for distribution of food directly to individuals in
need. In addition to distributing food through their partner agencies, some food banks also
distribute food directly to people through their own programs. For the purposes of Hunger in
America 2014 (HIA 2014), food programs are categorized into meal programs, which provide
prepared meals or snacks on site or in the client’s home; and grocery programs, which distribute
nonprepared foods, groceries, and other household supplies for off-site use such as for preparation
in the client’s home.
As of October 2012, the Feeding America network had 202 member food banks. Of these, 186
participated in the HIA 2014 Agency Survey data collection, and 178 continued participation
through the Client Survey data collection. An additional 10 PDOs participated independently of
their network member food bank partners during the Agency Survey data collection, and nine of
those PDOs continued on through the Client Survey data collection. A map of the service areas of
all Feeding America food banks appears in Figure 3-1, highlighting the food banks that participated
in HIA 2014.
3.1.2 Number and Types of Partner Agencies
At the time of the Agency Survey, the Feeding America network of food banks report partnering
with more than 46,000 agencies to help distribute food to clients through their programs. As noted
in Chapter 2, Section 2.7.1, all data reported in Chapters 3 through 5 are weighted data. Thus, the
data presented in these chapters are based on weights applied to the study sample’s data that allow
us to estimate the characteristics of the entire network, including both food banks and agencies that
participated in HIA 2014, and those that did not.

De
scrib
ing
the
Fe
ed
ing
Am
eric
a N
atio
na
l Ne
two
rk
3
Hu
ng
er in
Am
eric
a 2
01
4 N
atio
na
l Re
po
rt
4
6
Figure 3-1. Hunger in America 2014 food bank service areas

Hunger in America 2014 National Report 47
Describing the Feeding America National Network 3
A majority of the agencies are faith based or located in a religious institution.46 As shown in
Table 3-1, religious organizations make up 62.4 percent of the food banks’ agencies. The next largest
group, at 28.4 percent, is other nonprofit or private organizations that are not faith based. Only 2.7
percent of the agencies are governmental agencies, 3.1 percent are Community Action Programs
(CAPs), and 3.3 percent are another type of agency that does not fit into any of the other categories.
CAPs provide services, assistance, and other activities aimed at reducing poverty in the community.
Governmental agencies include state and/or local government agencies that are not a CAP. More
than 90 percent of food banks’ agencies are nonprofit and private organizations, either faith based
or other nonprofit.
Table 3-1. Distribution of agencies by subtype
Type of agency Percentage
Community Action Program (CAP) 3.1%
Faith based or located in a religious institution 62.4%
Governmental agency 2.7%
Some other nonprofit or private organization 28.4%
Other 3.3%
Total 100%
Weighted nonreporting agencies 223
All agencies weighted N 46,117
Data Source: Hunger in America 2014 Agency Survey, Q1. Numbers may not sum due to rounding.
Some other nonprofit or private organization may include food banks, social service agencies, or other nonprofits unaffiliated with
religious or governmental entities. “Other” was a separate response option on the survey.
NOTE: All data were weighted as described in Chapter 2. Percentages reported in tables are calculated from valid responses which
exclude nonresponse and valid skips due to survey item skip patterns. Numbers listed under nonreporting agencies or programs
include missing data due to item nonresponse from participating agencies or their programs. All estimates are weighted to account for
survey nonresponse from nonparticipating food banks and agencies. Total weighted N reflects the weighted number of respondents
eligible to answer the question. It includes missing data but excludes valid skips. Total weighted N can vary across tables because of
valid skips.
46 As part of their contract with Feeding America, member food banks agree to prohibit discrimination in the provision of services by their member agencies.

Hunger in America 2014 National Report 48
3.1.3 Types of Programs Operated by the Agencies
Agencies serve clients through a variety of food and non-food programs. Table 3-2 shows the
percentage of agencies operating different types of programs. As described in Chapter 2, agencies
could operate food or non-food programs. Food programs can be divided more broadly into those
that provide meals and those that provide groceries. Non-food programs include food-related
benefits programs and other non-food programs. Food-related benefits typically involve outreach,
education, information and referrals, and/or application assistance to obtain federal or state food
assistance benefits; they also encompass nutrition education programs, such as workshops on
healthy eating. Other non-food programs have a primary purpose other than meal programs, grocery
programs, or food-related benefit programs such as clothing/furniture assistance; legal assistance;
job training; or financial assistance, such as assistance with taxes or budgeting education.
Most agencies (64.9 percent) report having food programs only, 3.5 percent of agencies report non-
food programs only, and 31.6 percent of agencies report having both food and non-food programs
(Table 3-2). Among agencies with food programs, 24.9 percent of agencies operate only meal
programs, 65.5 percent operate only grocery programs, and 9.5 percent of agencies operate both
meal and grocery programs (Table 3-3).
Table 3-2. Distribution of agencies by food or non-food programs
Type of agency Count Percentage
Agencies with food programs only 29,454 64.9%
Agencies with both food programs and non-food programs 14,354 31.6%
Agencies with non-food programs only 1,566 3.5%
Total 45,374 100%
Weighted nonreporting agencies 744
All agencies weighted N 46,117
Data Source: Hunger in America 2014 Agency Survey. Numbers may not sum due to rounding.
The category “non-food programs” comprises “food-related benefits” as well as other non-food programs. Food-related benefits programs
provide resources that enable individuals in need to procure meals, groceries, or nongrocery products. Other non-food programs have a
primary purpose other than assistance with food/benefit procurement, e.g., assistance with clothing.
NOTE: All data were weighted as described in Chapter 2. Percentages reported in tables are calculated from valid responses which
exclude nonresponse and valid skips due to survey item skip patterns. Numbers listed under nonreporting agencies or programs
include missing data due to item nonresponse from participating agencies or their programs. All estimates are weighted to account for
survey nonresponse from nonparticipating food banks and agencies. Total weighted N reflects the weighted number of respondents
eligible to answer the question. It includes missing data but excludes valid skips. Total weighted N can vary across tables because of
valid skips.

Hunger in America 2014 National Report 49
Describing the Feeding America National Network 3
Table 3-3. Distribution of agencies by meal or grocery programs, among agencies with food
programs
Type of agency Count Percentage
Meal programs only 10,925 24.9%
Grocery programs only 28,709 65.5%
Both meal and grocery programs 4,173 9.5%
Total 43,808 100%
All agencies weighted N 43,808
Data Source: Hunger in America 2014 Agency Survey. Numbers may not sum due to rounding.
NOTE: All data were weighted as described in Chapter 2. Percentages reported in tables are calculated from valid responses which
exclude valid skips due to survey item skip patterns. Estimates are based on participating agencies’ listings of the type of program for
each program they operate, weighted to account for survey nonresponse from nonparticipating agencies and food banks. Because only
listed programs were available, no count or estimate of programs not reported by participating agencies is possible. All estimates are
weighted to account for survey nonresponse from nonparticipating food banks and agencies. Total weighted N reflects the weighted
number of respondents eligible to answer the question. It excludes valid skips. Total weighted N can vary across tables because of valid
skips.
Looking more closely at the distribution of programs across the entire network (Table 3-4), grocery
programs comprise 41.1 percent of total programs, followed by other non-food programs
(37.0 percent), meal programs (19.9 percent), and food-related benefits programs (2.0 percent).
Grocery programs are more than twice as common as meal programs within the network
(Figure 3-2). In total, an estimated 58,093 food programs are operating within the Feeding America
network. This number, however, does not reflect the number of distribution sites the programs
operate. These distribution sites range from single sites to hundreds of sites.
Table 3-4. Distribution of programs by type of food or non-food program
Type of program Percentage
Food programs
Meal 19.9%
Grocery 41.1%
Non-food programs
Food-related benefits 2.0%
Other non-food 37.0%
Total 100%
All programs weighted N 95,150
Data Source: Hunger in America 2014 Agency Survey.
The category “non-food programs” comprises “food-related benefits” as well as other non-food programs. Food-related benefits programs
provide resources that enable individuals in need to procure meals, groceries, or nongrocery products. Other non-food programs have a
primary purpose other than assistance with food/benefit procurement, e.g., assistance with clothing. See Section 2.1.3 for definitions
of program types.
NOTE: All data were weighted as described in Chapter 2. Percentages reported in tables are calculated from valid responses which
exclude valid skips due to survey item skip patterns. Estimates are based on participating agencies’ listings of the type of program for
each program they operate, weighted to account for survey nonresponse from nonparticipating agencies and food banks. Because only
listed programs were available, no count or estimate of programs not reported by participating agencies is possible. All estimates are
weighted to account for survey nonresponse from nonparticipating food banks and agencies. Total weighted N reflects the weighted
number of respondents eligible to answer the question. It excludes valid skips. Total weighted N can vary across tables because of valid
skips.

Hunger in America 2014 National Report 50
Describing the Feeding America National Network 3
Figure 3-2. Distribution of meal and grocery programs, among food programs
Data Source: Hunger in America 2014 Agency Survey.
Total weighted N = 58,093.
Numbers may not sum due to rounding.
The low percentage of programs offering food-related benefits assistance is striking; however,
agencies may be wrapping that type of assistance into the activities at meal or grocery programs, or
referring clients to other food-related benefits programs as needed rather than operating programs
dedicated to food-related benefits assistance. The large percentage of non-food programs reflects
the diversity of ways in which the agencies seek to serve their clients’ needs, providing multiservice
environments that reach beyond hunger relief.
Agencies provide services to clients through numerous types of meal, grocery, and food-related
benefits programs and through non-food programs. Tables 3-5 and 3-6 show the types of meal and
grocery programs, respectively, which are offered by agencies in the network. Appendix B provides
descriptions of each program type. There are 15 types of meal programs reported (Table 3-5). The
most frequently reported meal programs include kitchens (19.8 percent), residential programs
(11.5 percent), and Afterschool Snack programs (11.2 percent). Nearly one third of the meal
programs serve children (29.8 percent), and 11.6 percent of meal programs serve seniors. Home-
delivered meal programs such as Meals on Wheels (5.2 percent) serve a large base of seniors, but
other nonseniors such as individuals with disabilities are also eligible for this type of program.
N = 39,127
67%
N = 18,967
33%
Grocery Programs
Meal Programs

Hunger in America 2014 National Report 51
Describing the Feeding America National Network 3
Table 3-5. Distribution of meal programs by subtype, categorized by program target age group
Meal programs Percentage
Mixed age group
Community kitchens 3.4%
Food bank-operated meal program 1.8%
Group home 7.8%
Kitchen 19.8%
Rehabilitation program 3.8%
Residential program 11.5%
Shelter 8.4%
Transitional housing 2.1%
Subtotal 58.6%
Children
Afterschool snack 11.2%
Child congregate feeding programs (non-Kids Cafe) 3.0%
Day care 7.3%
Kids Cafe programs 3.7%
Summer Food Service Program (SFSP) 4.6%
Subtotal 29.8%
Seniors
Home-delivered meal (or Meals on Wheels) 5.2%
Senior congregate meal 6.4%
Subtotal 11.6%
Total 100%
All meal programs weighted N 18,967
Data Source: Hunger in America 2014 Agency Survey. Numbers may not sum due to rounding.
Programs serving seniors may in some cases serve nonseniors as well.
NOTE: All data were weighted as described in Chapter 2. Percentages reported in tables are calculated from valid responses which
exclude valid skips due to survey item skip patterns. Estimates are based on participating agencies’ listings of the type of program for
each program they operate, weighted to account for survey nonresponse from nonparticipating agencies and food banks. Because only
listed programs were available, no count or estimate of programs not reported by participating agencies is possible. All estimates are
weighted to account for survey nonresponse from nonparticipating food banks and agencies. Total weighted N reflects the weighted
number of respondents eligible to answer the question. It excludes valid skips. Total weighted N can vary across tables because of valid
skips.

Hunger in America 2014 National Report 52
Describing the Feeding America National Network 3
Table 3-6. Distribution of grocery programs by subtype, categorized by program target age
group
Grocery programs Percentage
Mixed age group
Community gardens 1.1%
Food pantries 80.9%
Home-delivered grocery program 2.3%
Mobile pantries/mobile markets 3.7%
School pantry programs 0.5%
Subtotal 88.5%
Children
BackPack Programs 4.2%
Subtotal 4.2%
Seniors
Commodity Supplemental Food Program (CSFP) 4.5%
Senior brown bag/food box distribution 1.2%
Senior grocery program 1.4%
Senior mobile pantry/just-in-time delivery 0.2%
Subtotal 7.3%
Total 100%
All grocery programs weighted N 39,127
Data Source: Hunger in America 2014 Agency Survey. Numbers may not sum due to rounding.
The Agency Survey listed three types of pantries noted here under food pantries: Food bank operated pantries, food pantries, and other
pantries.
Programs serving seniors may in some cases serve non-seniors as well.
CSFP is administered by states. Not every state is authorized to operate CSFP. Currently CSFP is authorized to operate in 39 states, the
District of Columbia, and two Indian Tribal Organizations.
NOTE: All data were weighted as described in Chapter 2. Percentages reported in tables are calculated from valid responses which
exclude valid skips due to survey item skip patterns. Estimates are based on participating agencies’ listings of the type of program for
each program they operate, weighted to account for survey nonresponse from nonparticipating agencies and food banks. Because only
listed programs were available, no count or estimate of programs not reported by participating agencies is possible. All estimates are
weighted to account for survey nonresponse from nonparticipating food banks and agencies. Total weighted N reflects the weighted
number of respondents eligible to answer the question. It excludes valid skips. Total weighted N can vary across tables because of valid
skips.
There are 10 types of grocery programs reported. The most commonly reported grocery programs
serve a span of age groups, with food pantries being the most frequently reported grocery program
(80.9 percent). In contrast to the 29.8 percent of meal programs that serve children and 11.6 percent
of meal programs that serve seniors, only 4.2 percent of grocery programs serve children (BackPack
Programs 4.2 percent) and 7.3 percent of grocery programs serve seniors (CSFP 4.5 percent; Senior
brown bag/food box distribution 1.2 percent; Senior grocery program 1.4 percent; Senior mobile
pantry/just-in-time delivery 0.2 percent), although children and seniors could certainly be served by
mixed-age programs as well.
Federal or local programs that fund meals or groceries, such as the National School Lunch Program
(NSLP), the School Breakfast Program (SBP), the Child and Adult Care Food Program (CACFP), or
the Food Distribution Program on Indian Reservations (FDPIR) are not listed under meal or

Hunger in America 2014 National Report 53
Describing the Feeding America National Network 3
grocery programs because these program types represent specific funding sources rather than food
program types. Although agencies may operate such programs, they would do so by listing the type
of program through which they distribute the actual food, such as listing a daycare as type of meal
program operated under the funding mechanism of CACFP. Agencies may also provide assistance
to clients in applying for benefits from some of these programs through a food-related benefits
program.
Food-related benefits programs provide services such as outreach, education, referral, and/or
application assistance. Four out of five food related-benefits programs are federal assistance
programs (i.e., SBP, NSLP, SNAP, and Special Supplemental Nutrition Program for Women,
Infants, and Children [WIC]). Two are aimed solely at assistance with benefits for children (SBP and
NSLP outreach), and one is aimed at assistance with benefits for pregnant and postpartum women
in addition to children up to age five (WIC outreach). The child-focused programs make up 18.4
percent of the food-related benefits programs; none of the food-related benefits programs are aimed
specifically at seniors. The most commonly reported food-related benefits program is SNAP—
assistance/outreach (42.1 percent). In addition, 34.1 percent of food-related benefits programs in
the network are nutrition education programs aimed at utilizing program groceries and meals and/or
improving health.
Agencies also offer a wide variety of services to their clients through non-food programs. The most
frequently reported non-food program is clothing/furniture assistance (17.5 percent of other non-
food programs); but other non-food programs include general information and referrals, housing
assistance, utility and heat assistance (LIHEAP), health clinics, and many other types of non-food
assistance. For example, 44.2 percent of the other non-food programs agencies report operating fall
under other types of programs beyond those listed on the survey, reflecting the diversity in scope of
programs offered, customized to meet the needs of each local population.
3.2 The Agencies’ Programs Provide Hunger-Relief Services to
Clients
Feeding America’s partner agencies and their programs are on the forefront of service delivery. As
noted in Section 3.1, they comprise a diverse group of organizations offering a broad array of
services. They are organized and staffed in ways that allow them to carry out their mission while
remaining focused and operating within what is typically a limited budget. They obtain the food they

Hunger in America 2014 National Report 54
Describing the Feeding America National Network 3
distribute from various sources including their Feeding America food bank partners, and they
distribute these meals and groceries to a diverse client base. Although the agencies and their
programs employ creative strategies to manage their clients’ needs, many perceive an increasing need
for services in their service areas and some report struggling to accommodate client demand.
3.2.1 Agency Oversight and Paid Staff
Agencies are often governed by an oversight body such as a board of directors to ensure that they
are meeting their mission effectively. Within the Feeding America network of partner agencies this is
particularly true, as nearly 82 percent of agencies report being governed by a board of directors or
another formal group that provides advice and guidance on their operations. Thus, most partner
agencies are benefitting from organized oversight.
In contrast to the high percentage of agencies with board oversight, only 49.0 percent of partner
agencies report having paid staff working for them to implement their mission (Table 3-7). Agencies
were asked to report staffing in full-time equivalents on the survey (assuming a 40-hour work week),
in which multiple part-time individuals could be recorded as equivalent to a full-time employee to
allow for comparability across agencies despite different staffing models. The median number of
paid full-time equivalent staff is five, or the equivalent of 200 staff hours per week. These paid staff,
however, may or may not have been engaged consistently in food program activities, since many
agencies reported providing diverse services. The overall pattern of support for agency missions,
therefore, is that most agencies are operating with the advice and oversight of a board of directors or
similar committee, but only half have paid staff working on their behalf. Agencies and their
programs consequently rely heavily on volunteer efforts.

Hunger in America 2014 National Report 55
Describing the Feeding America National Network 3
Table 3-7. Agencies employing paid staff and the median number of full-time equivalent paid
staff, by type of agency
Type of agency Employs paid staff Median number of FTEs
Community Action Program (CAP) 65.5% 3.0
Faith based or located in a religious institution 31.7% 3.0
Governmental agency 83.3% 5.0
Some other nonprofit or private organization 80.3% 8.0
Other 64.0% 5.0
All agencies 49.0% 5.0
Weighted nonreporting agencies 135
All agencies weighted N 46,117
Data Source: Hunger in America 2014 Agency Survey, Q3 and Q3A.
Some other nonprofit or private organization may include food banks, social service agencies, or other nonprofits unaffiliated with
religious or governmental entities. “Other” was a separate response option on the survey.
NOTE: All data were weighted as described in Chapter 2. Percentages reported in tables are calculated from valid responses which
exclude nonresponse and valid skips due to survey item skip patterns. Numbers listed under nonreporting agencies or programs
include missing data due to item nonresponse from participating agencies or their programs. All estimates are weighted to account for
survey nonresponse from nonparticipating food banks and agencies. Total weighted N reflects the weighted number of respondents
eligible to answer the question. It includes missing data but excludes valid skips. Total weighted N can vary across tables because of
valid skips.
3.2.2 Program Volunteers
On the program level, food programs rely on a large volunteer workforce to ensure that they can
serve their clients. On the Agency Survey, respondents were asked to provide information on the
number of volunteers in an average month for each program described, and the number of hours
total worked by volunteers in an average month for each program. Agency Survey respondents were
only asked to report about their program volunteers, so data shown do not include other volunteer
activities within the Feeding America network at the agency or food bank level such as agency office
staff volunteers or food bank warehouse volunteers. In an average month there are 618,000
volunteers who give time to meal programs, and 1,338,000 volunteers who give time to grocery
programs across the entire Feeding America network of food programs, for a total of nearly
2 million volunteers across the entire network in an average month (Table 3-8). In total, these
volunteers contribute more than 8.4 million hours of their time in a typical month. Breaking this
down to the level of individual programs (Table 3-9), the median number of volunteers at a single
program in a typical month is slightly higher for grocery programs than meal programs: 18
volunteers per month at an average grocery program compared to 12 volunteers per month at an
average meal program. Conversely, the median number of hours worked by all volunteers at a typical
program per month is slightly higher for meal programs than grocery programs: 80 hours of total
volunteer time per month for an average meal program compared to 60 hours of total volunteer

Hunger in America 2014 National Report 56
Describing the Feeding America National Network 3
time per month for an average grocery program, with a median of 60 hours per month per program
across all food programs that use volunteers.
Table 3-8. Total number of volunteers and total hours volunteered per month, among
programs with volunteers
Total number of volunteers and
total hours volunteered
Type of program
All food
programs
Meal
programs
Grocery
programs
Total number of volunteers per month 618,000 1,338,000 1,956,000
Weighted nonreporting programs 0 0 0
All programs weighted N 13,838 35,901 49,740
Total hours volunteered per month 2,772,000 5,634,000 8,406,000
Weighted nonreporting programs 148 331 479
All programs weighted N 13,838 35,901 49,740
Data Source: Hunger in America 2014 Agency Survey, Q23 and Q23A.
Total weighted N differs across items because valid skips are not included. Numbers may not sum due to rounding.
NOTE: All data were weighted as described in Chapter 2. Percentages reported in tables are calculated from valid responses which
exclude nonresponse and valid skips due to survey item skip patterns. Numbers listed under nonreporting agencies or programs
include missing data due to item nonresponse from participating agencies or their programs. All estimates are weighted to account for
survey nonresponse from nonparticipating food banks and agencies. Total weighted N reflects the weighted number of respondents
eligible to answer the question. It includes missing data but excludes valid skips. Total weighted N can vary across tables because of
valid skips.
Table 3-9. Median number of volunteers and median number of hours volunteered per
program in an average month, among programs with volunteers
Median number of volunteers and
median total hours volunteered
Type of program
All food
programs
Meal
programs
Grocery
programs
Median number of volunteers per program 12 18 16
Weighted nonreporting programs 0 0 0
All programs weighted N 13,838 35,901 49,740
Median total hours volunteered per program 80 60 60
Weighted nonreporting programs 148 331 479
All programs weighted N 13,838 35,901 49,740
Data Source: Hunger in America 2014 Agency Survey, Q23 and Q23A.
Total weighted N differs across items because valid skips are not included. Numbers may not sum due to rounding.
NOTE: All data were weighted as described in Chapter 2. Percentages reported in tables are calculated from valid responses which
exclude nonresponse and valid skips due to survey item skip patterns. Numbers listed under nonreporting agencies or programs
include missing data due to item nonresponse from participating agencies or their programs. All estimates are weighted to account for
survey nonresponse from nonparticipating food banks and agencies. Total weighted N reflects the weighted number of respondents
eligible to answer the question. It includes missing data but excludes valid skips. Total weighted N can vary across tables because of
valid skips.
Programs report that their volunteers are drawn from all age groups – youth, adult nonseniors, and
seniors (Table 3-10). Across all food programs, 54.4 percent of the volunteers are adults between the
ages of 19 and 59 (60.5 percent and 52.0 percent for meal and grocery programs, respectively).

Hunger in America 2014 National Report 57
Describing the Feeding America National Network 3
Overall, 38.2 percent of the volunteers are seniors aged 60 or older (29.8 percent for meal programs
and 41.4 percent for grocery programs). A smaller but nonnegligible 7.4 percent of the volunteers
are age 18 or younger (9.7 percent for meal programs and 6.6 percent for grocery programs).
Table 3-10. Age range of volunteers, among programs with volunteers during the past
12 months
Age ranges of volunteers
Type of program
All food
programs
Meal
programs
Grocery
programs
18 years of age and younger 9.7% 6.6% 7.4%
19 to 59 years of age 60.5% 52.0% 54.4%
60 years of age and older 29.8% 41.4% 38.2%
All ages 100% 100% 100%
Weighted nonreporting programs 167 280 447
All programs weighted N 13,838 35,901 49,740
Data Source: Hunger in America 2014 Agency Survey, Q23C.
Total weighted N differs across items because valid skips are not included. Numbers may not sum due to rounding.
NOTE: All data were weighted as described in Chapter 2. Percentages reported in tables are calculated from valid responses which
exclude nonresponse and valid skips due to survey item skip patterns. Numbers listed under nonreporting agencies or programs
include missing data due to item nonresponse from participating agencies or their programs. All estimates are weighted to account for
survey nonresponse from nonparticipating food banks and agencies. Total weighted N reflects the weighted number of respondents
eligible to answer the question. It includes missing data but excludes valid skips. Total weighted N can vary across tables because of
valid skips.
Programs are often able to obtain the volunteers they need and once volunteers are engaged with a
program they tend to stay engaged. More than 50 percent of both meal and grocery programs report
no difficulty in obtaining volunteers (Table 3-11). Obtaining them does, however, pose a substantial
challenge for a small percentage of programs, as 8.1 percent of meal programs and 6.7 percent of
grocery programs indicate having a lot of difficulty.
While there is some level of difficulty in obtaining volunteers, the level of difficulty involved in
retaining them is lower. More than 60 percent of programs report no difficulty in retaining the
volunteers they have, and few programs report a lot of difficulty in retention. Overall, the volunteer
workforce supporting the Feeding America network is a large group eager to offer assistance and
committed to the work they are doing.

Hunger in America 2014 National Report 58
Describing the Feeding America National Network 3
Table 3-11. Programs reporting difficulty obtaining and retaining volunteers by degree of
difficulty, among programs with volunteers during the past 12 months
Degree of difficulty
Type of program
All food
programs
Meal
programs
Grocery
programs
Obtaining volunteers
No difficulty 51.9% 58.0% 56.3%
Some difficulty 40.0% 35.3% 36.6%
A lot of difficulty 8.1% 6.7% 7.1%
Total 100% 100% 100%
Weighted nonreporting programs 182 434 617
All programs weighted N 13,838 35,901 49,740
Retaining volunteers
No difficulty 61.3% 70.3% 67.8%
Some difficulty 33.9% 26.9% 28.9%
A lot of difficulty 4.8% 2.8% 3.4%
Total 100% 100% 100%
Weighted nonreporting programs 265 697 962
All programs weighted N 13,838 35,901 49,740
Data Source: Hunger in America 2014 Agency Survey, Q23D.
Total weighted N differs across items because valid skips are not included. Numbers may not sum due to rounding.
NOTE: All data were weighted as described in Chapter 2. Percentages reported in tables are calculated from valid responses which
exclude nonresponse and valid skips due to survey item skip patterns. Numbers listed under nonreporting agencies or programs
include missing data due to item nonresponse from participating agencies or their programs. All estimates are weighted to account for
survey nonresponse from nonparticipating food banks and agencies. Total weighted N reflects the weighted number of respondents
eligible to answer the question. It includes missing data but excludes valid skips. Total weighted N can vary across tables because of
valid skips.
3.2.3 Sources of Food—Food Bank, Donations, Purchasing
The 58,093 food programs within the national Feeding America network acquire the food they
distribute from various sources, including Feeding America member food banks, other food banks,
donations, and purchasing to cover gaps. Looking at the sources of the food distributed by food
programs (Table 3-12), the majority of the pounds of food come from Feeding America member
food banks (61.8 percent of total poundage). Other sources include food that was purchased
(21.6 percent of total poundage), donations (12.8 percent of total poundage), and food from other
food banks (3.9 percent of total poundage). There are differences, however, between grocery
programs and meal programs. For grocery programs, the vast majority of the pounds of food
distributed come from a Feeding America member food bank (70.0 percent), whereas for meal
programs, less than half of the total pounds of food served come from that source (44.5 percent). A
substantial percentage of the food served by meal programs also comes from food that was
purchased (42.5 percent). The difference in the percentage of food poundage that is purchased may

Hunger in America 2014 National Report 59
Describing the Feeding America National Network 3
stem at least in part from the distribution model of grocery versus meal programs. Grocery program
distributions may contain whatever items are currently available from food banks and donations,
thus purchasing can be minimized. Meal programs, in contrast, may need to purchase specific
supplemental items to prepare complete meals, necessitating more purchasing.
Table 3-12. Average percentage of total food distributed during the past 12 months, by source
Source of food
Type of program
All food
programs
Meal
programs
Grocery
programs
Donations 10.2% 14.0% 12.8%
Feeding America food bank(s) 44.5% 70.0% 61.8%
Other food bank 2.8% 4.4% 3.9%
Purchased 42.5% 11.6% 21.6%
Total 100% 100% 100%
Weighted nonreporting programs 650 805 1,455
All programs weighted N 18,967 39,127 58,093
Data Source: Hunger in America 2014 Agency Survey, Q26. Numbers may not sum due to rounding.
Some responses from the survey were collapsed into broader categories for analysis.
NOTE: All data were weighted as described in Chapter 2. Percentages reported in tables are calculated from valid responses which
exclude nonresponse and valid skips due to survey item skip patterns. Numbers listed under nonreporting agencies or programs
include missing data due to item nonresponse from participating agencies or their programs. All estimates are weighted to account for
survey nonresponse from nonparticipating food banks and agencies. Total weighted N reflects the weighted number of respondents
eligible to answer the question. It includes missing data but excludes valid skips. Total weighted N can vary across tables because of
valid skips.
The items that are purchased vary by program type (see Table 3-13). For meal programs, the items
purchased by the largest percentages of programs include primarily perishables, paper goods, and
utensils: milk, yogurt, and cheese (47.9 percent); paper plates, napkins, and plastic silverware
(46.3 percent); meat, poultry, and fish (43.9 percent); and fresh fruits and vegetables (43.7 percent).
For grocery programs, even the items purchased most often are purchased by a smaller percentage
of programs and include bread, rice, cereals, and pasta (21.4 percent); canned or frozen fruits and
vegetables (18.0 percent); nonmeat proteins such as beans, eggs, peanut butter, and nuts
(16.9 percent); and meat, poultry, and fish (15.8 percent).

Hunger in America 2014 National Report 60
Describing the Feeding America National Network 3
Table 3-13. Frequently purchased items in the past 12 months, by source
Type of item frequently purchased
Type of program
All food
programs
Meal
programs
Grocery
programs
Food
Bread, rice, cereals, and pasta 41.0% 21.4% 27.7%
Canned or frozen fruits and vegetables 34.3% 18.0% 23.2%
Fats, oils, condiments, and sweets 28.3% 6.0% 13.2%
Fresh fruits and vegetables 43.7% 10.5% 21.2%
Meat, poultry, and fish 43.9% 15.8% 24.8%
Milk, yogurt, and cheese 47.9% 10.0% 22.2%
Nonmeat proteins – beans, eggs, peanut
butter, and nuts
33.6% 16.9% 22.3%
Non-food
Baby products (e.g., diapers, wipes, diaper
rash cream)
9.6% 5.0% 6.5%
Household products (e.g., laundry detergent) 33.7% 8.5% 16.6%
Paper plates, napkins, plastic silverware 46.3% 8.0% 20.4%
Personal care products (e.g., soap, toothpaste,
deodorant)
20.0% 8.5% 12.2%
Weighted nonreporting programs 857 1,206 2,063
All programs weighted N 18,967 39,127 58,093
Data Source: Hunger in America 2014 Agency Survey, Q25.
Other response options were occasionally, rarely, and never.
Survey items in this table allow respondents to mark more than one response, thus percentages may add to more than 100%.
Numbers may not sum due to rounding.
NOTE: All data were weighted as described in Chapter 2. Percentages reported in tables are calculated from valid responses which
exclude nonresponse and valid skips due to survey item skip patterns. Numbers listed under nonreporting agencies or programs
include missing data due to item nonresponse from participating agencies or their programs. All estimates are weighted to account for
survey nonresponse from nonparticipating food banks and agencies. Total weighted N reflects the weighted number of respondents
eligible to answer the question. It includes missing data but excludes valid skips. Total weighted N can vary across tables because of
valid skips.
As noted in Table 3-12, food programs also receive food and grocery products via local donations.
Common sources of these donations include churches and religious congregations, local merchants
and farmers, local food drives, and government programs (Table 3-14). For each donation source
listed, more than half of the grocery programs indicate receiving donations from that source. For
meal programs, approximately half of the programs report receiving donations from government
programs, local merchants and farmers, and churches and religious congregations. In addition, more
than one-quarter of meal programs report receiving donations from local food drives.

Hunger in America 2014 National Report 61
Describing the Feeding America National Network 3
Table 3-14. Programs reporting food donations during the past 12 months, by source
Source of donation
Type of program
All food
programs
Meal
programs
Grocery
programs
Churches and religious congregations 48.5% 66.4% 60.7%
Government programs 55.4% 65.3% 62.1%
Local food drives 26.3% 51.7% 43.6%
Local merchants and farmers 54.4% 56.1% 55.6%
Weighted nonreporting programs 781 1,002 1,783
All programs weighted N 18,967 39,127 58,093
Data Source: Hunger in America 2014 Agency Survey, Q24.
Some responses from the survey were collapsed into broader categories for analysis.
Survey items in this table allow respondents to mark more than one response, thus percentages may add to more than 100 percent.
NOTE: All data were weighted as described in Chapter 2. Percentages reported in tables are calculated from valid responses which
exclude nonresponse and valid skips due to survey item skip patterns. Numbers listed under nonreporting agencies or programs
include missing data due to item nonresponse from participating agencies or their programs. All estimates are weighted to account for
survey nonresponse from nonparticipating food banks and agencies. Total weighted N reflects the weighted number of respondents
eligible to answer the question. It includes missing data but excludes valid skips. Total weighted N can vary across tables because of
valid skips.
In summary, Feeding America food banks are the largest source of food for programs on average,
but programs do still rely on other sources, particularly donations and purchases. Meal programs, in
particular, purchase a substantial percentage of the food they distribute.
3.2.4 Language Diversity of Food Program Clients
On the Agency Survey food programs were asked to indicate the language diversity of the clients
they serve by specifying the languages their clients speak at home. Although most programs serve
English-speaking clients, the majority of food programs report also serving clients who speak
languages other than English at home. Programs report that Spanish is the predominant non-
English language that clients speak in their homes. Of all programs reported, 99.0 percent serve
English-speaking clients, while 61.7 percent serve clients who speak Spanish in their homes.
Programs report that other languages commonly spoken at home by clients include Italian, Chinese,
and Vietnamese, but many other languages are also indicated, suggesting the cultural and linguistic
breadth of the client base. The variability across clients in the network is vast and demonstrates that
the need for food assistance crosses many language and cultural groups across the country. For
more information on languages that clients report speaking at home, see Chapter 4.

Hunger in America 2014 National Report 62
Describing the Feeding America National Network 3
3.2.5 Restrictions on Service Receipt
The Agency Survey asked respondents about any changes in the limitations on the frequency with
which clients can receive food. Findings suggest the programs perceive no significant change in the
limitations (Table 3-15). More than 8 percent of the food programs indicate that clients can get food
more frequently than they could a year ago (5.3 percent of meal programs, 9.9 percent of the grocery
programs, and 8.5 percent of all food programs). Approximately 4 percent of the food programs
report that clients can get food less frequently than they could a year ago (2.3 percent of the meal
programs, 5.0 percent of the grocery programs, and 4.1 percent of all food programs). Overall
findings suggest that, for the majority of the food programs, they do not see restrictions on service
receipt as having changed.
Table 3-15. Programs indicating a change in limitations on clients’ frequency of use during the
past 12 months
Change in limitations
Type of program
All food
programs
Meal
programs
Grocery
programs
Clients can get food more frequently 5.3% 9.9% 8.5%
Clients can get food less frequently 2.3% 5.0% 4.1%
No change in frequency 93.3% 86.3% 88.5%
Weighted nonreporting programs 2,296 2,701 4,997
All programs weighted N 18,967 39,127 58,093
Data Source: Hunger in America 2014 Agency Survey, Q37.
Some responses from the survey were collapsed into broader categories for analysis.
Respondents were asked to indicate yes/no to each type of change, thus percentages may sum to more than 100 percent.
NOTE: All data were weighted as described in Chapter 2. Percentages reported in tables are calculated from valid responses which
exclude nonresponse and valid skips due to survey item skip patterns. Numbers listed under nonreporting agencies or programs
include missing data due to item nonresponse from participating agencies or their programs. All estimates are weighted to account for
survey nonresponse from nonparticipating food banks and agencies. Total weighted N reflects the weighted number of respondents
eligible to answer the question. It includes missing data but excludes valid skips. Total weighted N can vary across tables because of
valid skips.
3.2.6 Programs’ Ability to Serve Clients
The Agency Survey collected data about the food programs’ ability to serve clients, specifically
whether the programs perceive the number of clients served this year as compared to the prior year
to have changed, whether the programs have enough food to meet client needs, and whether
programs are having to turn away clients for any reason. Overall, programs report that they perceive
demand for food programs to have increased or stayed the same in the 12 months prior to the

Hunger in America 2014 National Report 63
Describing the Feeding America National Network 3
survey. Most of the food programs report having enough food to meet client needs, and the
majority did not have to turn away clients in the prior year.
In terms of the number of clients served in the last year, more than half of the food programs report
perceiving an increase in the number of clients in the past year (Table 3-16). In looking at meal
programs versus grocery programs, findings suggest that the increase in demand has been perceived
more by the grocery programs than the meal programs, as 65.5 percent of grocery programs report
an increase in clients compared to the 44.7 percent of meal programs that report an increase.
Table 3-16. Programs reporting changes in the number of clients compared to the prior year
Volume of clients compared to prior year
Type of program
All food
programs
Meal
programs
Grocery
programs
Saw any increase 44.7% 65.5% 58.9%
About the same 48.6% 27.6% 34.3%
Saw any decrease 6.6% 6.9% 6.8%
Total 100% 100% 100%
Weighted nonreporting programs 1,911 2,770 4,680
All programs weighted N 18,967 39,127 58,093
Data Source: Hunger in America 2014 Agency Survey, Q38.
Some responses from the survey were collapsed into broader categories for analysis.
Numbers may not sum due to rounding.
NOTE: All data were weighted as described in Chapter 2. Percentages reported in tables are calculated from valid responses which
exclude nonresponse and valid skips due to survey item skip patterns. Numbers listed under nonreporting agencies or programs
include missing data due to item nonresponse from participating agencies or their programs. All estimates are weighted to account for
survey nonresponse from nonparticipating food banks and agencies. Total weighted N reflects the weighted number of respondents
eligible to answer the question. It includes missing data but excludes valid skips. Total weighted N can vary across tables because of
valid skips.
When asked whether programs had enough food to meet client needs in the last year, the majority of
programs indicate that they had at least enough food (85.1 percent of meal programs, 66.3 percent
of grocery programs, and 72.4 percent of all food programs; see Table 3-17). Nonetheless, almost
28 percent of the food programs report that they had less food than needed in the past year,
indicating that, for some food programs, there is still a shortage of food creating a situation where
they are not able to meet the needs of all clients.

Hunger in America 2014 National Report 64
Describing the Feeding America National Network 3
Table 3-17. Programs reporting the degree to which they had food available to meet needs of
clients during the past 12 months
Food available to meet needs of clients
Type of program
All food
programs
Meal
programs
Grocery
programs
More food than needed 14.4% 14.3% 14.4%
Enough food to meet needs 70.7% 52.0% 58.0%
Less food than needed 14.8% 33.7% 27.7%
Total 100% 100% 100%
Weighted nonreporting programs 1,818 2,571 4,390
All programs weighted N 18,967 39,127 58,093
Data Source: Hunger in America 2014 Agency Survey, Q39.
Some responses from the survey were collapsed into broader categories for analysis.
NOTE: All data were weighted as described in Chapter 2. Percentages reported in tables are calculated from valid responses which
exclude nonresponse and valid skips due to survey item skip patterns. Numbers listed under nonreporting agencies or programs
include missing data due to item nonresponse from participating agencies or their programs. All estimates are weighted to account for
survey nonresponse from nonparticipating food banks and agencies. Total weighted N reflects the weighted number of respondents
eligible to answer the question. It includes missing data but excludes valid skips. Total weighted N can vary across tables because of
valid skips.
The Agency Survey also asked programs whether clients were turned away from services in the last
year. Of all the food programs, 72.7 percent indicate that no clients had been turned away in the last
year (Table 3-18). Among programs that did turn away clients, 32.8 percent report that they
frequently or occasionally turned clients away because clients came more often than the program
allowed, 30.3 percent frequently or occasionally turned clients away because the clients live outside
the program’s service area, and 28.7 percent frequently or occasionally turned clients away because
they ran out of food or other things the clients needed. A total of 20.6 percent of meal programs
and 30.4 percent of grocery programs report needing to turn away clients.
Table 3-18. Programs turning clients away for any reason during the past 12 months
Program turned clients away
Type of program
All food
programs
Meal
programs
Grocery
programs
Yes 20.6% 30.4% 27.3%
No 79.4% 69.6% 72.7%
Total 100% 100% 100%
Weighted nonreporting programs 1,682 2,307 3,988
All programs weighted N 18,967 39,127 58,093
Data Source: Hunger in America 2014 Agency Survey, Q40.
NOTE: All data were weighted as described in Chapter 2. Percentages reported in tables are calculated from valid responses which
exclude nonresponse and valid skips due to survey item skip patterns. Numbers listed under nonreporting agencies or programs
include missing data due to item nonresponse from participating agencies or their programs. All estimates are weighted to account for
survey nonresponse from nonparticipating food banks and agencies. Total weighted N reflects the weighted number of respondents
eligible to answer the question. It includes missing data but excludes valid skips. Total weighted N can vary across tables because of
valid skips.

Hunger in America 2014 National Report 65
Describing the Feeding America National Network 3
3.3 Partner Agencies Provide Other Food-Related and Non-Food
Services
The Feeding America network’s mission to relieve hunger is accomplished not only through food
provision but also through the provision of services. Agencies and programs are vital parts of the
social safety net in many communities; as such, they connect clients to information about other
social services and help them navigate the often confusing process of accessing benefits. These roles
have become particularly important during the recent recession, when so many households have
struggled with new and deepening poverty. In addition to delving in depth into the food programs
operated by the agencies, HIA 2014 probed agencies and programs about their provision of food-
related benefits and non-food services.
As noted in Section 3.1.3, partner agencies provide many different types of food-related benefits
programs and non-food services. Food-related benefits include outreach, education, referral, and/or
application assistance with federal programs such as SBP, NSLP, SNAP, and WIC, as well as many
different types of nutrition education programs for clients. Non-food services include assistance
with clothing, furniture, health, housing, legal issues, taxes, and more, both in the form of helping
clients find needed resources, and helping them navigate government applications and requirements.
3.3.1 Services Related to Government Programs
Many food program clients also qualify for or are already receiving government aid (see Chapter 5
for more detail). One nutrition program serving many of the Feeding America network clients is
SNAP. SNAP is a federal program administered by the U.S. Department of Agriculture (USDA),
but each state is responsible for distributing the SNAP benefits used to buy food. As of May 2013,
more than 15 percent of the U.S. population was receiving SNAP benefits.47
The process of applying for SNAP and maintaining benefits can be confusing for many. Eligibility is
determined by income and—in some states—assets; and there are additional requirements for
employment and citizenship for certain categories of recipients.48 Further, regulations governing
47 U.S. Department of Agriculture, Food and Nutrition Service. “Program Data: Supplemental Nutrition Assistance Program.” See http://www.fns.usda.gov/PD/SNAPmain.htm.
48 Esa Eslami, Kai Filion, and Mark Strayer. (2011). “Characteristics of Supplemental Nutrition Assistance Program Households: Fiscal Year 2010,” Supplemental Nutrition Assistance Program, Nutrition Assistance Program Report Series. Report No. SNAP-11-CHAR.

Hunger in America 2014 National Report 66
Describing the Feeding America National Network 3
eligibility, the process of applying, and the requirements for recertification vary across states.49
Although some states are moving toward an easier application process, applications are still lengthy
and confusing for many individuals and families.50 Maintaining benefit receipt is also challenging, as
beneficiaries must recertify their eligibility at regular intervals.51
Many Feeding America agencies help clients navigate these procedures (Table 3-19). In HIA 2014,
22.7 percent of agencies report offering help to clients in screening for SNAP eligibility; 25.0 percent
report offering aid for the application itself. Education about SNAP is even more common, with
35.6 percent providing information. Finally, 17.6 percent of agencies report providing help in
recertification for SNAP.
Table 3-19. Agencies providing services related to the Supplemental Nutrition Assistance
Program (SNAP) and subtypes of services offered
Type of SNAP service Percentage
Agencies that provided any SNAP-related services 39.7%
Application assistancea 25.0%
Education about the programa 35.6%
Recertification for the programa 17.6%
Screening for eligibilitya 22.7%
Agencies that did not provide any SNAP-related services 60.3%
Weighted nonreporting agencies 222
All agencies weighted N 46,117
Data Source: Hunger in America 2014 Agency Survey, Q10.
aPercentages are of those agencies offering SNAP-related services. The survey allowed respondents to mark all SNAP services that they
provide, thus percentages do not sum to the total percentage that provide any SNAP services.
NOTE: All data were weighted as described in Chapter 2. Percentages reported in tables are calculated from valid responses which
exclude nonresponse and valid skips due to survey item skip patterns. Numbers listed under nonreporting agencies or programs
include missing data due to item nonresponse from participating agencies or their programs. All estimates are weighted to account for
survey nonresponse from nonparticipating food banks and agencies. Total weighted N reflects the weighted number of respondents
eligible to answer the question. It includes missing data but excludes valid skips. Total weighted N can vary across tables because of
valid skips.
In general, agencies provide help as needed to clients, rather than offering SNAP-related services to
all clients at intake (Figure 3-3). Across all types of agencies, 34.2 percent offer SNAP-related
services to all clients, and 65.8 percent offer services only to selected clients.
49 For more information, please see the USDA’s SNAP Policy Database: http://www.ers.usda.gov/data-products/snap-policy-database.aspx#.U5WxifldXLA.
50 Center on Budget and Policy Priorities. (2014). “SNAP: Online: A Review of State Government SNAP Websites.” See http://www.cbpp.org/files/8-23-05fa.pdf.
51 Gretchen Rowe, Sam Hall, Carolyn T. O’Brien, Nancy M. Pindus, and Robin Koralek. (2010). “Enhancing Supplemental Nutrition Assistance Program (SNAP) Recertification: SNAP Modernization Efforts.” Nutrition Assistance Program Report Series.

Hunger in America 2014 National Report 67
Describing the Feeding America National Network 3
Figure 3-3. Outreach approach among agencies offering SNAP-related services
Data Source: Hunger in America 2014 Agency Survey, Q10A.
Weighted nonreporting agencies 853; total weighted N = 18,198.
Of course, not all agencies provide SNAP-related services, as these services require a significant
investment of agency resources (Figure 3-4). Those who do not offer the services most commonly
cite a more narrow mission as their reason; 78.6 percent of agencies not providing services report
that SNAP is not a part of what their agency does. Of those reporting other impediments,
65.3 percent of agencies say that staff-related issues prevent them from providing SNAP services,
while 61.0 percent lack physical space or electronic equipment. Finally, 43.4 percent identify lack of
time as a reason.52
52 Although 60.3 percent of agencies reported not providing SNAP-related services, agencies that do not provide such services directly may refer clients for assistance from agencies that do provide these services.
34%
66%
All clients receive SNAP-related
services on intake
Only clients who express interest
receive SNAP-related services

Hunger in America 2014 National Report 68
Describing the Feeding America National Network 3
Figure 3-4. Reasons for not offering SNAP-related services, among agencies reporting not
offering them
Data Source: Hunger in America 2014 Agency Survey, Q10C.
Weighted nonreporting agencies 155; total weighted N = 27,295.
Agencies were asked to mark all reasons that apply. Staff-related issues include not enough staff, lack of staff awareness of SNAP, staff
needing more training on SNAP; lacking physical space or equipment includes not enough space for private counseling, and not having
the right electronic equipment.
In addition to help with SNAP, agencies may provide information or aid related to other
government programs (Figure 3-5). These services related to government programs other than
SNAP are less common, but are an important part of the mission of several agencies. After SNAP,
Medicaid-related services are the most common, with 29.7 percent of agencies reporting providing
some sort of assistance with the federal health care program. Next, 25.5 percent of agencies provide
aid with WIC, a federal program which provides pregnant and postpartum women and young
children ages 0-5 with nutrition education and vouchers to purchase healthy foods. Some agencies
(23.1 percent) also provide help with the Temporary Aid for Needy Families (TANF) program,
more commonly known as welfare, while 22.5 percent offer help with housing, such as Section 8
vouchers and other subsidies. Overall, 40.0 percent of agencies report providing assistance with
government programs other than SNAP, with 25.0 percent of all agencies reporting that they
provide assistance with three or more programs (Figure 3-6).53
53 Provision of assistance with these government programs may be underreported if the survey respondents are not familiar with the official names or operation of these programs.
65.2%
43.4%
61.0%
78.6%
21.5%
Staff-related issues Not enough time Lacking physical
space or equipment
SNAP is not part of
what this agency
does
Other reason

Hunger in America 2014 National Report 69
Describing the Feeding America National Network 3
Figure 3-5. Agencies providing assistance with specific government programs other than SNAP
Data Source: Hunger in America 2014 Agency Survey, Q12.
Agencies were asked to mark all programs for which they provide services.
Weighted nonreporting agencies 203; total weighted N = 46,117.
EITC – Earned Income Tax Credit.
SSI – Supplemental Security Income
TANF – Temporary Assistance for Needy Families.
WIC – Special Supplemental Nutrition Program for Women, Infants, and Children.
17.5%
22.5%
29.7%
22.2% 23.1%25.5%
EITC Housing Medicaid SSI TANF WIC

Hunger in America 2014 National Report 70
Describing the Feeding America National Network 3
Figure 3-6. Agencies providing assistance with government programs other than SNAP
Data Source: Hunger in America 2014 Agency Survey, Q12.
Non-SNAP programs include WIC, TANF, EITC, housing, SSI, and Medicaid.
Weighted nonreporting agencies 203; total weighted N = 46,117.
Finally, several agencies also work directly with other federal programs, for example by distributing
USDA commodities or operating a child nutrition program. USDA’s Food and Nutrition Service
operates two commodity programs frequently utilized by hunger-relief agencies, the Commodity
Supplemental Food Program (CSFP), and The Emergency Food Assistance Program (TEFAP). In
the Feeding America network, 17.7 percent of agencies distribute commodities through the CSFP,
which provides a monthly box of nutritious foods. At the time of this study, most (over 97.0
percent) CSFP participants were seniors age 60 and older living in or near poverty; the program also
served a small number of low-income women, infants, and children up to age six.54 Also, 35.7
percent of agencies report distributing commodities through TEFAP, which provides commodities
for low-income or homeless individuals through emergency food programs such as pantries,
kitchens, or shelters. Finally, 0.9 percent of responding agencies report participating in the Food
54 Since the time of the study CSFP has been changed through Agricultural Act of 2014 (P.L. 11 3-79) known as the Farm Bill, to serve only seniors. See http://www.fns.usda.gov/sites/default/files/CSFP_Farm_Bill_ Implementation_Memo.pdf.
Agencies that do not
provide assistance with
government programs
other than SNAP
60%
One program
9%
Two programs
6%
Three or more
programs
25%
Agencies that provide
assistance with
government programs
other than SNAP
40%

Hunger in America 2014 National Report 71
Describing the Feeding America National Network 3
Distribution Program on Indian Reservations (FDPIR), providing food to Native American families
on reservations or other designated areas.
Federal child nutrition programs provide reimbursements for meals served to qualifying individuals
rather than directly supplying food for distribution. Feeding America agencies administer two such
programs: 5.6 percent of agencies provide a CACFP, and 9.5 percent provide a Summer Food
Service Program (SFSP). CACFP provides nutritious meals and snacks to low-income children in a
variety of settings: daycare centers and child care homes, emergency shelters, and afterschool
enrichment programs. CACFP also serves some low-income seniors and disabled adults in adult
daycare. SFSP provides meals and snacks to low-income children during the summer when school is
not in session.
As part of providing information about available services, many agencies go further by providing
information in multiple languages in an effort to reach the local communities. In particular, many
agencies have worked to identify and overcome barriers to service receipt in their areas, most
commonly in the form of language difficulties (Figure 3-7). Many agencies serve clients who do not
speak English or may speak English as a second language (see Chapter 4 for more information on
client languages). Previous research has identified lack of English competency as an important factor
limiting enrollment in programs like SNAP or other food supports.55 Among all agencies,
40.3 percent report that they help overcome such barriers by providing information about services
in more than one language. Use of multiple languages is particularly common among governmental
agencies (58.1 percent) and CAPs (54.5 percent), and slightly less common among other nonprofit
or private organizations (48.6 percent) and faith-based agencies (35.0 percent).
55 Gandhi Raj Bhattarai, Patricia A. Duffy, and Jennie Raymond. (2006). “Use of Food Pantries and Food Stamps in Low-Income Households in the United States.” Journal of Consumer Affairs, 39(2): 276-298; and Susan J. Algert, Michael Reibel, and Marian J. Renvall. (2006). “Barriers to Participation in the Food Stamp Program Among Food Pantry Clients in Los Angeles.” American Journal of Public Health, 96(5): 807-809.

Hunger in America 2014 National Report 72
Describing the Feeding America National Network 3
Figure 3-7. Agencies providing information about services in more than one language, by type
of agency
Data Source: Hunger in America 2014 Agency Survey, Q18.
Weighted nonreporting agencies 438; total weighted N = 46,117.
In summary, agencies provide a range of services related to other aid programs, showing both the
important role that agencies take on in communities and the depth of need of agency clients. This
need involves not only poverty and hunger but also concrete barriers to obtaining help, such as
language difficulties.
3.3.2 Agency Funding
All of these food, food-related, and non-food programs operated by agencies require significant
resources. Agencies in the Feeding America network receive funding from a number of sources,
including local, state, and federal governments; individual contributions; corporate support;
foundation support; donations from religious institutions; client service fees; and other sources
(Table 3-20). On the survey, agencies were asked to detail their sources of support.56 Results show
that most agencies rely on a diversified stream of funding sources. Least common as a funding
56 These sources of support are those that are direct and visible to the agencies, which may differ from sources of support from the food bank.
54.5%
35.0%
58.1%
48.6%
42.4%40.3%
Community
Action Program
(CAP)
Faith based or
located in a
religious
institution
Governmental
agency
Some other
nonprofit or
private
organization
Other All agencies

Hunger in America 2014 National Report 73
Describing the Feeding America National Network 3
source are client service fees;57 83.0 percent of reporting agencies receive no funding from this
source. Similarly, 58.3 percent of agencies receive no government funding, 62.5 percent receive no
corporate support, 62.4 percent receive no foundation support, and 40.7 percent receive no funding
from religious institutions.
Table 3-20. Agencies reporting level of funding, by source of funds
Source of funding
Level of agency funding from the sources
Total
No
funding
Half of total
funding or less
More than half
of total funding
Client service fees 83.0% 14.2% 2.8% 100%
Corporate support 62.5% 35.9% 1.6% 100%
Foundation support 62.4% 34.8% 2.8% 100%
Government funding 58.3% 23.7% 18.0% 100%
Individual contributions 14.7% 57.6% 27.7% 100%
Religious institutions 40.7% 43.7% 15.7% 100%
Other 68.1% 27.2% 4.7% 100%
Weighted nonreporting agencies 657
All agencies weighted N 46,117
Data Source: Hunger in America 2014 Agency Survey, Q15.
Numbers may not sum due to rounding.
NOTE: All data were weighted as described in Chapter 2. Percentages reported in tables are calculated from valid responses which
exclude nonresponse and valid skips due to survey item skip patterns. Numbers listed under nonreporting agencies or programs
include missing data due to item nonresponse from participating agencies or their programs. All estimates are weighted to account for
survey nonresponse from nonparticipating food banks and agencies. Total weighted N reflects the weighted number of respondents
eligible to answer the question. It includes missing data but excludes valid skips. Total weighted N can vary across tables because of
valid skips.
In contrast, individual contributions are the most common source of support; 27.7 percent of
agencies receive more than half of their funding from these contributions. Second is government
funding, with 18.0 percent of agencies receiving more than half of their funding from this source.
Religious institutions are third, with 15.7 percent of agencies receiving more than half of their
funding from religious organizations. In general, there is a wide variety of different funding
combinations, highlighting the different circumstances in which agencies seek and find support.
These funding sources have multiple implications for agencies. First, economic conditions and other
circumstances can have a significant impact on the ability of agencies to provide food and services.
Although agencies have chosen to maintain their programs’ level of food distribution,
(see Section 3.2.6) a substantial number of agencies report having to make reductions in other areas
such as hours of operation and staffing within the last 12 months (Table 3-21). Staffing reductions
57 Agencies in the Feeding America network are not permitted to charge clients for food. Some agencies, however, may have fees related to other services provided to clients, such as trainings, social activities, or professional services.

Hunger in America 2014 National Report 74
Describing the Feeding America National Network 3
are particularly notable since only 51.0 percent of agencies report having paid staff
(see Section 3.2.1), and those that do have relatively few full time equivalent staff. CAPs appear to
have been the hardest hit: 16.6 percent of CAPs have cut hours of operation, 20.1 percent have laid
off staff, and 14.9 percent have limited their service area. Other types of agencies have also faced
reductions. For example, 12.3 percent of faith-based institutions have cut hours of operations
(4.2 percent have laid off staff and 11.1 percent have limited the service area), while 16.9 percent of
other nonprofits or private organizations have laid off staff. No type of agency was immune to
reductions.
Table 3-21. Agencies reporting select reductions during the past 12 months
Type of agency
Type of reduction
Cut hours of
operation
Lay off
staff
Limit service
area
Community Action Program (CAP) 16.6% 20.1% 14.9%
Faith based or located in a religious institution 12.3% 4.2% 11.1%
Governmental agency 10.4% 13.5% 10.0%
Some other nonprofit or private organization 11.6% 16.9% 10.7%
Other 9.1% 10.3% 9.3%
All agencies 12.1% 8.7% 11.0%
Weighted nonreporting agencies 542 586 700
All agencies weighted N 46,117 46,117 46,117
Data Source: Hunger in America 2014 Agency Survey, Q16.
Numbers may not sum due to rounding.
The survey allowed respondents to mark all that apply, thus percentages do not sum to 100%.
NOTE: All data were weighted as described in Chapter 2. Percentages reported in tables are calculated from valid responses which
exclude nonresponse and valid skips due to survey item skip patterns. Numbers listed under nonreporting agencies or programs
include missing data due to item nonresponse from participating agencies or their programs. All estimates are weighted to account for
survey nonresponse from nonparticipating food banks and agencies. Total weighted N reflects the weighted number of respondents
eligible to answer the question. It includes missing data but excludes valid skips. Total weighted N can vary across tables because of
valid skips.
These reductions are attributed to several different circumstances across different types of agencies
(Table 3-22). Among agencies reporting reductions, 61.3 to 74.3 percent of agencies attribute them
to less money or food available. Between 29.8 and 43.5 percent of agencies also report needing to
serve more clients as a reason for making reductions. Only 18.9 to 23.6 percent of agencies cite a
change in what the agency does as resulting in the reductions. Overall, 23.6 percent of agencies
report making at least one type of reduction.

Hunger in America 2014 National Report 75
Describing the Feeding America National Network 3
Table 3-22. Agencies reporting select reasons for making reductions, among agencies that
reported reductions during the past 12 months
Type of agency
Type of reason
Less money or
food available
Need to serve more
clients or give out
more food
Change in what
the agency does
Community Action Program (CAP) 74.0% 38.6% 23.6%
Faith based or located in a religious institution 74.3% 43.5% 19.9%
Governmental agency 63.7% 31.8% 23.2%
Some other nonprofit or private organization 73.3% 29.8% 18.9%
Other 61.3% 32.0% 20.2%
All agencies 73.3% 38.2% 19.9%
Weighted nonreporting agencies 242 525 623
All agencies weighted N 10,884 10,884 10,884
Data Source: Hunger in America 2014 Agency Survey, Q16A.
Total weighted N differs across items because valid skips are not included.
The survey allowed respondents to mark all that apply, thus percentages do not sum to 100%.
NOTE: All data were weighted as described in Chapter 2. Percentages reported in tables are calculated from valid responses which
exclude nonresponse and valid skips due to survey item skip patterns. Numbers listed under nonreporting agencies or programs
include missing data due to item nonresponse from participating agencies or their programs. All estimates are weighted to account for
survey nonresponse from nonparticipating food banks and agencies. Total weighted N reflects the weighted number of respondents
eligible to answer the question. It includes missing data but excludes valid skips. Total weighted N can vary across tables because of
valid skips.
Among agencies that have needed to make reductions in the past 12 months, there is some concern
on their part about their ability to continue to provide services (Figure 3-8). Over half of agencies
that made reductions report being “somewhat” or “very worried” about being able to continue to
provide services. Level of worry is highest among CAPs (where 52.5 percent are somewhat worried
and 25.3 percent are very worried), and it is also the group with the highest level of service
reductions. Faith-based institutions express the least concern, but even here, 21.4 percent are very
worried and 43.5 percent are somewhat worried.

Hunger in America 2014 National Report 76
Describing the Feeding America National Network 3
Figure 3-8. Agencies reporting level of anxiety associated with continuing to provide services,
among agencies that reported reductions during the past 12 months
Data Source: Hunger in America 2014 Agency Survey, Q16B.
Weighted nonreporting agencies 120; total weighted N = 10,884.
Numbers may not sum due to rounding.
When these worries are broken down more specifically, several themes emerge (Table 3-23). Among
those agencies with reductions that also report being somewhat or very worried about being able to
continue to provide services, 55.7 percent of agencies report that not having enough money is a
major threat to continuing to provide services. It is, in fact, the most common “major threat”
identified. Not having enough food supplies is another problem, identified by 27.8 percent of
agencies as a major threat. Less pressing is leadership and board support, and community needs and
support. Only 3.4 percent of agencies say that lack of community need is a major threat, while
89.1 percent say it is no threat at all. Other problems identified as somewhat of a threat or a major
threat by at least a quarter of agencies include not enough volunteers, not enough money for
transportation or other transportation problems, and building or location problems.
25.30% 21.40% 18.60% 22.40% 24.30% 21.90%
52.50%
43.50% 50.90% 46.30% 39.80% 44.90%
22.20%35.10% 30.50% 31.30% 35.80% 33.20%
Community
Action Program
(CAP)
(N = 363)
Faith based or
located in a
religious
institution
(N = 4275)
Governmental
agency
(N = 212)
Some other
nonprofit or
private
organization
(N = 2444)
Other
(N = 221)
All agencies
(N = 7515)
very worried somewhat worried not worried

Hunger in America 2014 National Report 77
Describing the Feeding America National Network 3
Table 3-23. Agencies reporting challenges associated with continuing to provide services,
among agencies that reported reductions during the past 12 months
Type of threat
Level of threat
Total
Major
threat
Somewhat of
a threat
Minor
threat
Not at all
a threat
Not enough money 55.7% 33.1% 8.8% 2.3% 100%
Not enough food supplies 27.8% 36.9% 22.3% 13.1% 100%
Not enough paid staff or personnel 17.1% 22.2% 19.5% 41.1% 100%
Not enough volunteers 14.6% 23.5% 27.2% 34.7% 100%
Not enough money for transportation
or no good vehicle to pick up
products at the food bank
17.9% 22.3% 21.7% 38.1% 100%
Building or location problems 11.0% 16.7% 22.7% 49.6% 100%
Not enough leadership/board support 3.9% 10.2% 19.0% 66.9% 100%
Not enough community support 6.1% 18.3% 28.8% 46.8% 100%
Community doesn't need this
program
3.4% 2.4% 5.0% 89.1% 100%
Weighted nonreporting agencies 19
All agencies weighted N 7,223
Data Source: Hunger in America 2014 Agency Survey, Q16C.
Total weighted N differs slightly across items.
Numbers may not sum due to rounding.
NOTE: All data were weighted as described in Chapter 2. Percentages reported in tables are calculated from valid responses which
exclude nonresponse and valid skips due to survey item skip patterns. Numbers listed under nonreporting agencies or programs
include missing data due to item nonresponse from participating agencies or their programs. All estimates are weighted to account for
survey nonresponse from nonparticipating food banks and agencies. Total weighted N reflects the weighted number of respondents
eligible to answer the question. It includes missing data but excludes valid skips. Total weighted N can vary across tables because of
valid skips.
Overall, these concerns and the number of reductions in service faced by agencies highlight the
challenging position in which many organizations find themselves. As many have seen the volume of
clients seeking food and services increase, the availability of funding and resources has in many cases
decreased. In the next sections, we discuss this tension in greater detail as we report on the complex
needs of Feeding America clients and their households, as reported on the HIA 2014 Client Survey.

Hunger in America 2014 National Report 78
Key Findings
The Feeding America network provides food assistance to an estimated 46.5 million unique clients in 15.5 million households annually. Many of these clients seek services repeatedly throughout the year.
Clients and their households are diverse, including many different racial and ethnic groups and education levels, and ranging in age from infants to seniors. Thirty-nine percent of households contain at least one child, and 33 percent contain at least one senior.
The Feeding America network serves client households with military service members. Twenty percent of households include at least one member who has ever served in the U.S. military.
The majority (93 percent) of client households reside in nontemporary housing, such as houses or apartments. One in 15 households lives in temporary housing, such as a shelter, mission, or on the street. Many respondents have experienced recent housing transitions, with 27 percent having lived in two or more places in the past year, and 16 percent having experienced foreclosure or eviction in the past five years.
In 23 percent of households, the person employed the most in the past 12 months is currently unemployed. In an additional 42 percent of households, the most employed person of the past 12 months is now out of the workforce and not looking for work, often due to age, poor health, or disability. Among households with employment in the past 12 months, more than half (57 percent) are employed only part-time.
Many households report health concerns. In 33 percent of households, a member has been diagnosed with diabetes, and in 58 percent of households a member has high blood pressure. In 23 percent of households, no one has health insurance coverage, and 60 percent of households have unpaid medical bills.
Most households are subsisting on very little income. Seventy-two percent of client households fall at or below 100 percent of the poverty level.
In this chapter we present background information on Feeding America clients and their households
through an exploration of their characteristics and circumstances. We illuminate both the diversity of
clients’ households, and the challenges and barriers they face to ensuring they have sufficient food to
meet their needs and those of their household members. We begin by presenting estimates of the
number of clients using the Feeding America network in a typical week, month, and year. We
Characteristics of Feeding America Clients and
Their Households 4

Hunger in America 2014 National Report 79
Characteristics of Feeding America Clients and Their Households 4
estimate both duplicated counts, representing the total number of times clients are reached through
food distributions in a given period of time, and unduplicated counts, representing the total number
of unique individuals served in that period. We then discuss demographic characteristics of the
unduplicated (unique) individuals served annually. Next we move to characteristics of the
households of Feeding America clients, to describe the home circumstances of all clients who use
the Feeding America network, regardless of whether others who share the household also receive
Feeding America services. We address household demographics and housing characteristics,
employment, potential barriers to employment, and student status of adult household members. We
explore health status and medical expenses faced by the households, and conclude with an
examination of income and poverty. These results demonstrate the diversity of the population that
the Feeding America network serves, as well as differences between those who participate in the two
main types of food programs, meal and grocery. As mentioned in Section 2.1.3, results are presented
for meal and grocery programs separately because we expect different patterns may emerge between
clients of meal programs and clients of grocery programs.
Data from this chapter are drawn from the Client Survey. The initial sections of this chapter
describe Feeding America clients, and those data are weighted to provide national estimates of the
number of clients who receive services through the Feeding America network weekly, monthly, and
annually. Individual client demographic characteristics are weighted based on the number of
unduplicated clients served in a year, and are shown separately for clients of meal programs, grocery
programs, and all food programs, both meal and grocery.
Unless otherwise indicated, subsequent data in this chapter are weighted to provide national
estimates of clients’ households. The weighted household estimates are based on the number of
unduplicated households, in a typical month, in which someone from the household is served by a
Feeding America food program. The percentages presented in the tables are percentages of client
households. As with the individual client data, results are shown for client households of meal
programs, grocery programs, and all food programs, both meal and grocery. Because the
unduplicated count that forms the basis for the weight for all food programs removes double-
counting of clients served by both types of programs, meal program numbers and grocery program
numbers in tables do not sum to all food program numbers.
We present the data for all households that include at least one Feeding America client and, as
appropriate, for additional household compositions of interest: households with at least one child,
households with at least one senior, households with at least one child and one senior, and

Hunger in America 2014 National Report 80
Characteristics of Feeding America Clients and Their Households 4
households with no children or seniors. Children are defined as those under 18 years old, and
seniors are defined as those 60 years old and older.
We explore statistically significant differences between meal and grocery client households where
applicable to illuminate the ways in which clients who are reached through these types of food
programs may differ in their backgrounds and needs. Similarly, we explore statistically significant
differences between the household compositions of interest to highlight the ways in which different
types of households, and particularly those containing children or seniors, have different needs and
resources. Appendix C of this report contains the 90 percent confidence intervals for data in the
report tables. Where statistically significant differences are reported between subgroups of clients or
client households, the determination of statistical significance is based on the 90 percent confidence
intervals. Where possible, we also present information in the text from relevant national surveys
sponsored by the federal government, to place the Hunger in America 2014 (HIA 2014) findings in
context.
4.1 Estimating Clients Served by Feeding America
Estimating the duplicated and unduplicated counts of clients served by Feeding America is an
important way of quantifying the reach of the Feeding America network:
Duplicated counts are estimates of the number of times clients are reached through
Feeding America network food distributions during a given time period. These estimates count clients each time they receive food: for meal programs, that is each time an individual receives a meal and for grocery programs, each time an individual and his or her household members receive groceries. The grocery program counts include each member of a household for each grocery distribution. For example, a client visiting a grocery program twice a month, picking up food for his or her household of five people, would be counted as 10 duplicated clients for the month. Similarly, if the same client instead visited a meal program four times in one month, he or she would be counted each time, resulting in four duplicated clients.
Unduplicated counts are estimates of the total number of unique clients served by the Feeding America network during a week, month, or year. Clients who report returning repeatedly for service are counted only once in this statistic, providing an estimate of the number of unique individuals helped by the network.
Because grocery programs distribute food to an entire household, but meal programs distribute food
to each person present to consume a meal or snack, the unit in which clients may be conceptualized

Hunger in America 2014 National Report 81
Characteristics of Feeding America Clients and Their Households 4
differs. Entire households are clients for grocery programs, whereas individuals receiving a meal are
clients for meal programs. Combining data on household clients for grocery programs and individual
clients for meal programs can therefore be confusing. To avoid potential misunderstanding of the
client count estimates, we present the information on duplicated and unduplicated clients in two
ways: by individuals served and by households served.
When calculating estimates of individuals served, we multiply the number of client households
receiving groceries by the number of people in each household,58 expanding the estimate of grocery
clients to represent the number of individuals who benefit from the groceries. We leave meal clients
at the individual level. This allows meal and grocery clients to be described in the same unit—the
number of individuals receiving food.
When calculating estimates of client households served, we adjust the estimate of individual meal
clients to account for individuals from the same household who receive meal services, ultimately
arriving at an estimate of the number of households in which at least one person is served by a
Feeding America meal program. We leave grocery clients at the household level. This allows both
meal and grocery clients to be described in the same unit – the number of households receiving
food.
In the following sections we describe the statistical procedures used in estimating client counts.
More detailed information on the estimation procedures appears in the Technical Volume.
4.1.1 Method for Computing Client Count Estimates
Duplicated Client Count Estimates
Duplicated client count estimates—the number of times clients are reached through food
distributions in a given period of time—are computed by combining data from all stages of sampling
(see Figure 2-2 for details) with a series of adjustments to account for the timing of data collection.
These adjustments include calculations that take into consideration whether the data collection
occurred at an ebb or flow in the annual cycle of services available, and correct for that. As
described in the preceding section, an additional adjustment is then applied to allow all the data to
58 Respondents were asked to report their household size in Question 1 of the Client Survey.

Hunger in America 2014 National Report 82
Characteristics of Feeding America Clients and Their Households 4
be transformed to either individual or household units. This process is expanded upon in the
following paragraphs.
For the HIA 2014 estimates initial base weights were first computed. A base weight is a multiplier
that, in this case, accounts for the different likelihoods of being selected at each of the stages of
sampling (see Chapter 2, Section 2.1.2, for details of the stages of sampling). At each stage, a sample
was drawn from the population, so the effect of the corresponding weights at each stage is to
account for the members of the population that were not selected in the sample. When calculating
the weights, both sampling of the place and time of the program visit itself,59 and sampling of clients
during the program visit were accounted for. The base weights were also adjusted to account for
nonresponse at each stage of sampling. The final base weight for each client respondent corresponds
to the number of food distributions the particular respondent represents. Thus, the sum of these
weights is an estimate of the total number of times all clients are reached through food distributions
at programs in the Feeding America network during the HIA 2014 data collection period. These
weights were then adjusted further, using the following factors:
A time adjustment factor to convert the data from the data collection period to the
appropriate reference period (week, month, or year).
A seasonal adjustment factor, which was the ratio of the average number of days the program was open in a month to the number of days the program was open in the month during which the program visit occurred, to account for whether the data collection month was an ebb or flow in seasonal service.
The number of household members for grocery clients, to convert number of grocery client households into individuals to allow for estimates of duplicated individuals served; or
The adjustment to account for individual clients from the same household who receive meal services, to convert the number of meal client individuals into households to allow for estimates of duplicated households served.
The sum of these adjusted weights is the duplicated count, an estimate of the total number of either
individual or household food distributions at programs in the Feeding America network during a
week, month, or year.
59 Sampling of the place and time of the visit included sampling of the agency, program, and day/time. If a program included multiple sites or vehicles operating during the sampled day/time, sampling at this stage also included sampling a site or vehicle at which to conduct data collection.

Hunger in America 2014 National Report 83
Characteristics of Feeding America Clients and Their Households 4
Unduplicated Client Count Estimates
Unduplicated client count estimates use the duplicated client count estimates described in the last
section as their basis. For weekly and monthly estimates, two additional adjustment factors were
applied:
An unduplication factor that accounts for the number of times the client received
services from the same type of program (meal or grocery) in the week/month to remove repeated uses.
A compositing or overlap factor used only when computing estimates for all program types together that removes the double-counting of clients served by both meal and grocery programs during the specified timeframe.
The sum of these adjusted weights is the weekly or monthly unduplicated client count, an estimate
of the total number of either individuals or households served by programs in the Feeding America
network during a week or month.
Because it is difficult for people to report accurately on intermittent activities taking place during the
previous 12 months, we used a different approach in estimating annual unduplicated client counts
that paralleled that used in the Hunger in America 2010 (HIA 2010) report. A “newcomer rate” was
estimated separately for meal and grocery programs. The newcomer rate was defined as the
proportion of clients who indicated on the survey that they were receiving services from that type of
program (meal or grocery) for the first time in the past 12 months. This newcomer rate factor was
applied to the weight used to compute the monthly unduplicated client count estimates, to estimate
the unduplicated number of monthly clients who are newcomers. The annual unduplicated client
count estimate was then obtained by summing:
One month’s unduplicated client count; plus
11 times the estimated unduplicated number of monthly clients who are newcomers.
This calculation takes a month of unduplicated clients and adds the estimated number of new clients
who would receive services each month through the rest of the year, resulting in an estimate of the
total number of unique (unduplicated) clients in a year.

Hunger in America 2014 National Report 84
Characteristics of Feeding America Clients and Their Households 4
4.1.2 Estimates of Clients in the Feeding America Network
In this section we present the duplicated and unduplicated client count estimates for the Feeding
America network (Table 4-1). The table includes individual clients and households served for all
programs and individual clients for meal and grocery programs,60 for a typical week, month, and the
full year. Because the numbers of clients served are estimates based on a sample, they have an
associated margin of error that includes sampling error. Each of these estimates of the number of
clients has a margin of error displayed underneath. The 90 percent confidence interval is the
estimate plus or minus the margin of error. Although we believe the client count estimates best
represent the data, the margins of error and confidence intervals are the range of numbers in which
we can say, with 90 percent confidence, that the true client counts fall.
Using the duplicated client count estimation techniques described previously, we estimate that
clients in the Feeding America network are reached through food distributions 7.5 million times in a
typical week, 32.4 million times in a typical month, and 389.2 million times annually. Looking at the
duplicated number of households in which at least one member is served by Feeding America, we
find that households are reached through food distributions 2.9 million times in a typical week,
12.6 million times in a typical month, and 151.6 million times annually.
Grocery programs distribute food to duplicated clients 6.0 million times in a typical week,
26.3 million times in a typical month, and 315.3 million times annually. Meal programs, which are
much less numerous within the network, distribute food to duplicated clients 1.4 million times in a
typical week, 6.2 million times in a typical month, and 73.9 million times annually.
Because these numbers are duplicated numbers, they represent the number of times clients are
reached through food distribution, not the unique number of individuals or households served.
Using the unduplicated client count techniques we described previously, we estimate the number of
unique individuals served by Feeding America across all food program types to be 5.4 million
weekly, 17.1 million monthly, and 46.5 million annually. Looking at unique households served, we
estimate the numbers at 1.8 million households weekly, 5.8 million households monthly, and
15.5 million households annually.
60 Because the count of all program clients removes double counting of clients who reported using both meal and
grocery programs, the counts for meal and grocery do not sum to the total number of clients for all programs.

Ch
ara
cte
ristic
s o
f Fe
ed
ing
Am
eric
a C
lien
ts a
nd
Th
eir H
ou
se
ho
lds
4
Hu
ng
er in
Am
eric
a 2
01
4 N
atio
na
l Re
po
rt
8
5
Table 4-1. Estimates of the number of clients served by program type
Weekly Monthly Annually
Duplicated
counts
Unduplicated
counts
Duplicated
counts
Unduplicated
counts
Duplicated
counts
Unduplicated
counts
Total number of individual clients
All programs
Margin of error
7,465,000
±318,000 5,356,000
±245,000 32,437,000
±1,382,000 17,069,000
±724,000 389,242,000
±16,589,000 46,516,000
±1,998,000 Total number of individual clients by meal and grocery programs
Meal programs 1,418,000 656,000 6,162,000 1,772,000 73,938,000 3,298,000
Margin of error ±123,000 ±58,000 ±536,000 ±178,000 ±6,432,000 ±334,000
Grocery programs 6,047,000 5,084,000 26,275,000 16,621,000 315,304,000 45,938,000
Margin of error ±299,000 ±249,000 ±1,299,000 ±726,000 ±15,586,000 ±2,015,000
Subtypes of programsa
Pantries 5,895,000 4,890,000 25,615,000 15,900,000 307,376,000 43,950,000
Kitchens 871,000 196,000 3,785,000 382,000 45,425,000 711,000
Shelters 155,000 34,000 672,000 88,000 8,062,000 164,000
Senior 341,000 220,000 1,483,000 680,000 17,799,000 1,805,000
Mobile 335,000 284,000 1,457,000 847,000 17,487,000 2,339,000
Total number of client households
All programs 2,908,000 1,834,000 12,637,000 5,760,000 151,645,000 15,498,000
Margin of error ±131,000 ±71,000 ±569,000 ±208,000 ±6,832,000 ±567,000
aSubtypes of programs are not exhaustive nor are they mutually exclusive; thus, they do not sum to the total client counts. Confidence intervals for program subtypes can be found in
Appendix C.
NOTE: All data were weighted as described in Chapter 2. All estimates are weighted to account for program and client sampling as well as survey nonresponse from nonparticipating food
banks, agencies, programs, and clients.

Hunger in America 2014 National Report 86
Characteristics of Feeding America Clients and Their Households 4
We also present the client counts broken down to estimate service within some program subtypes of
interest—pantries, kitchens, and shelters as in HIA 2010, programs for seniors, and mobile
programs (Table 4-1).61 As in HIA 2010, the unduplicated annual count of clients utilizing grocery
programs (45.9 million) statistically significantly outnumbers that of clients utilizing meal programs
(3.3 million). New to this year’s study, we also analyzed the unduplicated annual count of clients
utilizing senior programs (1.8 million) and mobile programs (2.3 million). The wide use of senior
programs demonstrates the high quantity of need among seniors, particularly those who may be
subsisting on a fixed income. The large constituency of mobile pantry clients represents an
expanding initiative within the Feeding America network to reach people in need who may have
difficulty receiving assistance through brick-and-mortar food programs. While looking at Table 4-1,
it is important to note that the client counts at program subtypes are not exhaustive (there are more
program subtypes than the five included in the table), nor are they mutually exclusive (a single
mobile pantry program may be included both under pantries and under mobile programs, for
example).
4.1.3 Selected Demographic Characteristics of Feeding America Clients
In this section we examine the demographic characteristics of all unduplicated (unique) individuals
served directly by Feeding America annually, including age, race/ethnicity, and education level and
student status of adult clients (Table 4-2). In Section 4.2 we will present demographic characteristics
of the households of Feeding America clients, looking instead at client households served in a
typical month. Those data describe the household circumstances of unduplicated clients served in a
typical month, regardless of whether other household members themselves are also clients, to
provide context for the life circumstances of clients in a typical month.
The age breakdown of individual clients served annually is notable in several ways. Across all food
programs the most common listed age range is 30-49 years, including 26.0 percent of clients.
Combining relevant categories, however, a full 28.5 percent of clients are children under age 18. This
figure, encompassing 12 million children, is one we know to be an underestimate as programs that
only serve children were excluded from eligibility for the Client Survey, and children at multiage
meal programs were not eligible to be sampled for the survey and are thus not represented. The
61 Because of the dual-frame design of HIA 2014, the study was not designed to support these program subtype
estimates reliably, and therefore they should be interpreted cautiously. Confidence intervals for these estimates appear in Appendix C.

Hunger in America 2014 National Report 87
Characteristics of Feeding America Clients and Their Households 4
Table 4-2. Selected demographic characteristics of Feeding America clients
Demographic characteristics
Type of program All food programs Meal Grocery
Count Percentage Count Percentage Count Percentage
Age 0-5 yearsa -- -- 3.5M 8.5% 3.5M 8.2% 6-17 yearsa -- -- 8.5M 20.9% 8.5M 20.3% 18-29 years 0.4M 15.0% 5.8M 14.2% 6.0M 14.3% 30-49 years 1.1M 38.6% 10.4M 25.5% 10.9M 26.0% 50-59 years 0.8M 26.0% 5.9M 14.4% 6.1M 14.6% 60-64 years 0.2M 7.4% 2.2M 5.4% 2.3M 5.4% 65 years or older 0.4M 13.1% 4.6M 11.2% 4.7M 11.2% Total 2.9M 100% 40.8M 100% 42.0M 100%
Weighted nonreporting clients 0.4M 4.4M 4.5M Total weighted N 3.3M 45.2M 46.5M
Race/ethnicity Single race or ethnicity 3.1M 95.0% 39.7M 95.2% 40.9M 95.2%
American Indian or Alaska Native 0.1M 2.3% 1.0M 2.2% 1.0M 2.2% Asian 0.0M 1.1% 0.6M 1.4% 0.6M 1.4% Black or African American 1.0M 30.2% 11.6M 26.0% 12.0M 26.1% Hispanic, Latino 0.3M 10.4% 8.9M 20.0% 9.0M 19.7% Native Hawaiian or Other Pacific Islander 0.0M 0.3% 0.2M 0.5% 0.2M 0.5% White 1.6M 49.5% 19.3M 43.2% 19.9M 43.4% Some other race 0.0M 1.3% 0.9M 2.1% 0.9M 2.0%
Multiple races or ethnicities 0.2M 5.0% 2.1M 4.7% 2.2M 4.7% Total 3.2M 100% 44.6M 100% 45.9M 100%
Weighted nonreporting clients 0.1M 0.6M 0.6M Total weighted N 3.3M 45.2M 46.5M
Education level of adult clients Less than high school (HS) 0.6M 18.7% 8.0M 26.5% 8.2M 26.1% HS diploma 1.1M 32.8% 11.1M 36.6% 11.5M 36.4% General equivalency diploma or GED 0.5M 14.7% 2.9M 9.6% 3.1M 10.0% License, certificate, or degree beyond HS 0.2M 7.2% 2.1M 7.1% 2.2M 7.1% Some college or 2-year college degree 0.6M 19.0% 4.4M 14.7% 4.7M 14.8% 4-year college degree or higher 0.2M 7.7% 1.7M 5.5% 1.8M 5.7% Total 3.2M 100% 30.2M 100% 31.6M 100%
Weighted nonreporting clients 0.1M 2.1M 2.2M Total weighted N 3.3M 32.4M 33.7M
Student status of adult clients Full-time student 0.1M 4.0% 2.0M 6.9% 2.1M 6.7% Part-time student 0.1M 4.0% 1.0M 3.5% 1.1M 3.5% Not a student 3.0M 92.0% 26.6M 89.7% 27.8M 89.8% Total 3.2M 100% 29.7M 100% 31.0M 100%
Weighted nonreporting clients 0.1M 2.7M 2.7M Total weighted N 3.3M 32.4M 33.7M
Data Source: Hunger in America 2014 Client Survey, Q3, Q4, Q5, Q6, and Q6a.
Numbers may not sum to 100% due to rounding. Data are weighted to represent annual unduplicated numbers of clients.
License, certificate, or degree beyond HS includes business, trade, or technical licenses. aChild clients are underestimated due to the exclusion of programs from the Client Survey that serve only children.
NOTE: All data were weighted as described in Chapter 2. Percentages reported in tables are calculated from valid responses which
exclude nonresponse and valid skips due to survey item skip patterns. Numbers listed under nonreporting clients include missing data
due to item nonresponse from participating clients. All estimates are weighted to account for program and client sampling as well as
survey nonresponse from nonparticipating food banks, agencies, programs, and clients. Total weighted N reflects the weighted number
of respondents eligible to answer the question. It includes missing data but excludes valid skips. Total weighted N can vary across
tables because of valid skips. Meal program numbers and grocery program numbers do not sum to all food program numbers because
the unduplicated count that forms the basis for the weight for all food programs removes double-counting of clients served by both
types of programs.

Hunger in America 2014 National Report 88
Characteristics of Feeding America Clients and Their Households 4
estimated 12 million children does account for grocery program household members under the age
of 18; the actual number of children served by the Feeding America network, however, is likely
much greater. Seniors are an important but slightly less prevalent group, with 5.4 percent of all
clients between 60-64 years old, and 11.2 percent of all clients 65 years old or older.
Clients are racially and ethnically diverse, with 43.4 percent identifying themselves as White,
26.1 percent as Black or African American, 19.7 percent as Hispanic or Latino, 6.1 percent as
another single race, and 4.7 percent as multirace or multiethnic.
The most common level of educational attainment among adult clients is a high school degree or
general equivalency diploma (GED), with 46.4 percent of all adult clients reporting either a high
school diploma or GED. More than a quarter (26.1 percent) of adult clients have not completed
high school. In the higher ranges of educational attainment, 14.8 percent of adult clients have
completed some college or a two-year college degree, and 5.7 percent have completed a four-year
college degree or higher level of education. Ten percent of adult clients are seeking to increase their
levels of education, with 6.7 percent in school full-time and 3.5 percent in school part-time.
4.1.4 Interpreting Changes in Client Estimates from 2010 to 2014
Based solely on the unduplicated client counts, it appears that the Feeding America network has
seen an increase over the past four years in the number of clients served annually. Estimates from
the HIA 2010 study placed the annual unduplicated client count at that time at 37 million
individuals. This apparent growth in unduplicated clients served by the network is likely the
combination of changes in the scope and interpretation of the HIA study between 2010 and 2014,
and actual growth in the network during that time. Some increase in the number of annual
unduplicated clients is expected due to inclusion of additional programs not previously represented
in the data.
As outlined in Section 2.6.7, however, HIA 2014 differs substantially in design from HIA 2010. A
number of improvements were made, including implementing a more representative program
classification system (meal/grocery), employing digital data collection, increasing the number of
Client Survey languages, conducting the Agency Survey in advance of the Client Survey, and most
importantly, including additional program types in the study.

Hunger in America 2014 National Report 89
Characteristics of Feeding America Clients and Their Households 4
Over the past four years the nature and structure of food programs in the Feeding America network
have grown more diverse. As more is learned about clients, new programmatic strategies are being
implemented to ensure that clients can access food in the manner most convenient to their
circumstance. Improvements to HIA 2014 have tried to capture this evolution. For this reason, and
the others described here, we caution against making any direct comparisons between the two
studies.
4.2 Feeding America Clients Come from a Diverse Set of
Households
An overview of the generational composition of the clients’ household members provides context
for the remainder of this chapter, focusing specifically on whether the households contain children
under age 18 or seniors age 60 or over.62 Across all food programs, both meal and grocery,
38.6 percent of client households include at least one child, 33.1 percent of households include at
least one senior, 6.4 percent of households contain at least one child and at least one senior, and
34.8 percent of households contain neither children nor seniors (Table 4-3). Data from the 2013
Current Population Survey (CPS) estimate that nationally only 32 percent of U.S. households
contain a child under age 18, suggesting that households with children may be disproportionately
represented in the Feeding America network.63
Looking at specific types of food programs,64 we see that the overall pattern described for all food
programs holds true for grocery programs, with both households with at least one child
(40.7 percent) and households with at least one senior (33.7 percent) being strongly represented. A
different pattern emerges, however, for meal programs, as only 9.9 percent of clients at meal
programs are from households with at least one child, 25.6 percent are from households with at least
one senior, and 65.4 percent are from households containing neither children nor seniors.
Households with at least one child, with or without a senior also present in the home, are statistically
significantly more likely to use grocery programs as compared to meal programs (using the
90 percent confidence intervals as the standard). Among meal programs that were eligible to be
62 The number of client households containing children is underestimated due to the exclusion from the Client Survey of programs serving only children. See Chapter 2, Section 2.6.2, for further details.
63 2013 Current Population Survey, America’s Families and Living Arrangements: 2013: Households (H table series) Table H-2.
64 Meal clients and grocery clients do not sum to all food program clients, as the unduplicated count that forms the basis for all food program clients removes double-counting of clients served by both types of programs.

Hunger in America 2014 National Report 90
Characteristics of Feeding America Clients and Their Households 4
visited for Client Survey data collection, particularly shelters and residential programs, many are only
available to adults which may help explain this pattern. Because programs that only serve children
were excluded from the Client Survey, this is likely an underestimate of the households with children
that use meal programs.
Table 4-3. Client household composition
Composition of household
Type of program All food
programs Meal Grocery
Mutually exclusive household compositions
Households with at least one child (no seniors) 9.1% 33.8% 32.1%
Households with at least one senior (no children) 24.8% 26.8% 26.7%
Households with at least one child and one senior 0.8% 6.9% 6.4%
Households with no children or seniors 65.4% 32.5% 34.8%
All households 100% 100% 100%
Potentially overlapping household compositions
Households with at least one child 9.9% 40.7% 38.6%
Households with at least one senior 25.6% 33.7% 33.1%
Weighted nonreporting client households 0.1M 0.5M 0.5M
Total weighted N 1.1M 5.4M 5.8M
Data Source: Hunger in America 2014 Client Survey, Q3.
Children are less than 18 years of age; seniors are 60 years or older.
Household subtypes are not mutually exclusive, thus percentages do not sum to 100%.
NOTE: All data were weighted as described in Chapter 2. Percentages reported in tables are calculated from valid responses which
exclude nonresponse and valid skips due to survey item skip patterns. Numbers listed under nonreporting clients include missing data
due to item nonresponse from participating clients. All estimates are weighted to account for program and client sampling as well as
survey nonresponse from nonparticipating food banks, agencies, programs, and clients. Total weighted N reflects the weighted number
of respondents eligible to answer the question. It includes missing data but excludes valid skips. Total weighted N can vary across
tables because of valid skips. Meal program percentages and grocery program percentages do not sum to all food program
percentages because the unduplicated count that forms the basis for all food programs removes double-counting of clients served by
both types of programs.
4.2.1 Household Size of Clients
Household size is an important indicator of the level of resources needed for the number of
individuals in need of food. This is particularly relevant for grocery programs since the distributed
products may be intended for or used by the client's entire household. Table 4-4 presents the
percentage of households for each size category. Across all food programs, we found that
28.4 percent of client households include only the client (i.e., they were single member households),
37.3 percent include two to three members, and 29.2 percent include four to six members. Only
5.1 percent of the households include more than six members. The households that use grocery
programs follow this pattern, with most client households being multiperson households. In

Hunger in America 2014 National Report 91
Characteristics of Feeding America Clients and Their Households 4
contrast, meal programs follow a statistically significantly different pattern, as the vast majority of
meal client households (70.1 percent) are single-member households.
Table 4-4. Client households by size
Household size
Type of program All food
programs Meal Grocery
All households
1 member 70.1% 24.6% 28.4%
2-3 members 22.9% 38.6% 37.3%
4-6 members 5.9% 31.3% 29.2%
More than 6 members 1.0% 5.5% 5.1%
Total 100% 100% 100%
Weighted nonreporting client households 0.2M 0.7M 0.7M
Total weighted N 1.1M 5.4M 5.8M
Households with at least one child
1 member 0.0% 0.0% 0.0%
2-3 members 57.9% 29.6% 30.5%
4-6 members 38.2% 59.2% 58.4%
More than 6 members 3.8% 11.2% 11.0%
Households with at least one senior
1 member 62.5% 32.6% 34.5%
2-3 members 31.9% 43.0% 42.2%
4-6 members 4.7% 20.3% 19.4%
More than 6 members 0.9% 4.1% 3.9%
Households with at least one child and one senior
1 member 0.0% 0.0% 0.0%
2-3 members 50.2% 24.7% 24.8%
4-6 members 40.1% 60.9% 60.9%
More than 6 members 9.7% 14.3% 14.3%
Households with no children or seniors
1 member 80.4% 42.4% 48.0%
2-3 members 16.4% 42.6% 38.7%
4-6 members 2.4% 13.5% 11.9%
More than 6 members 0.8% 1.5% 1.4%
Data Source: Hunger in America 2014 Client Survey, Q1 and Q3.
Children are less than 18 years of age; seniors are 60 years or older.
Numbers may not sum to 100% due to rounding.
NOTE: All data were weighted as described in Chapter 2. Percentages reported in tables are calculated from valid responses which
exclude nonresponse and valid skips due to survey item skip patterns. Numbers listed under nonreporting clients include missing data
due to item nonresponse from participating clients. All estimates are weighted to account for program and client sampling as well as
survey nonresponse from nonparticipating food banks, agencies, programs, and clients. Total weighted N reflects the weighted number
of respondents eligible to answer the question. It includes missing data but excludes valid skips. Total weighted N can vary across
tables because of valid skips. Meal program numbers and grocery program numbers do not sum to all food program numbers because
the unduplicated count that forms the basis for the weight for all food programs removes double-counting of clients served by both
types of programs.

Hunger in America 2014 National Report 92
Characteristics of Feeding America Clients and Their Households 4
4.2.2 Ages of Household Members
Previously we described the unweighted age ranges of survey respondents (Section 2.5.1) to describe
the characteristics of survey participants, and we provided the distribution of ages of individual
clients (Section 4.1.3) to characterize those whom Feeding America reaches through food
distribution. But here we describe the age ranges of all the Feeding America client household
members, from infants to seniors (Table 4-5), to demonstrate the household characteristics of
Feeding America clients. The age groups displayed are not mutually exclusive, as households can
have members from multiple age groups. The most common age group across all programs is the
30-49 year old group, with 47.9 percent of households containing a member of that age range. Over
16 percent of households contain at least one child age five or younger. Almost a quarter
(23.4 percent) of client households contain a senior 65 years or older.
Table 4-5. Client households containing members in select age ranges
Age groups in household, in years
Type of program All food
programs Meal Grocery
All households
0-5 3.8% 17.4% 16.3%
6-17 7.5% 33.7% 31.9%
18-29 15.1% 27.9% 27.1%
30-49 37.7% 48.7% 47.9%
50-59 34.8% 31.1% 31.2%
60-64 10.6% 12.3% 12.1%
65 and over 15.8% 23.9% 23.4%
Weighted nonreporting client households 0.1M 0.5M 0.5M
Total weighted N 1.1M 5.4M 5.8M
Data Source: Hunger in America 2014 Client Survey, Q3.
Households can have individuals in many age groups, so percentages do not sum to 100%.
NOTE: All data were weighted as described in Chapter 2. Percentages reported in tables are calculated from valid responses which
exclude nonresponse and valid skips due to survey item skip patterns. Numbers listed under nonreporting clients include missing data
due to item nonresponse from participating clients. All estimates are weighted to account for program and client sampling as well as
survey nonresponse from nonparticipating food banks, agencies, programs, and clients. Total weighted N reflects the weighted number
of respondents eligible to answer the question. It includes missing data but excludes valid skips. Total weighted N can vary across
tables because of valid skips. Meal program numbers and grocery program numbers do not sum to all food program numbers because
the unduplicated count that forms the basis for the weight for all food programs removes double-counting of clients served by both
types of programs.

Hunger in America 2014 National Report 93
Characteristics of Feeding America Clients and Their Households 4
4.2.3 Single and Multiple Race/Ethnicity Client Households
Previously we described the unweighted racial and ethnic characteristics of survey respondents
(Section 2.5.1), and we provided the distribution of race and ethnicity of individual clients
(Section 4.1.3) to characterize the clients of Feeding America food programs. In our examination of
household demographic characteristics, we explore the racial and ethnic diversity within clients’
households by examining whether all members of the clients’ household are of a single race or
ethnicity, or of multiple races and ethnicities (Table 4-6). Single-person households are categorized
based on the individual’s reported status as single or multiple race or ethnicity. This exploration is
relevant when considering recent literature that documents the distinct cultural experiences of
multiracial individuals and households as compared to those who are of a single race.65 Across all
programs, 14.7 percent of client households include household members who are of different
racial/ethnic groups. Households of meal and grocery clients follow very similar patterns.
65 Kelly Faye Jackson. (2012). “Living the multiracial experience: shifting racial expressions, resisting race, and seeking community.” Qualitative Social Work, 11(1): 42-60.

Hunger in America 2014 National Report 94
Characteristics of Feeding America Clients and Their Households 4
Table 4-6. Single and multiple race/ethnicity households
Race/ethnicity
Type of program All food
programs Meal Grocery
All households
Single race or ethnicity 88.9% 84.7% 85.3%
Multiple race or ethnicity 11.1% 15.3% 14.7%
Total 100% 100% 100%
Weighted nonreporting client households 0.0M 0.1M 0.1M
Total weighted N 1.1M 5.4M 5.8M
Households with at least one child
Single race or ethnicity 72.4% 76.6% 76.5%
Multiple race or ethnicity 27.6% 23.4% 23.5%
Households with at least one senior
Single race or ethnicity 84.8% 88.5% 88.6%
Multiple race or ethnicity 15.2% 11.5% 11.4%
Households with at least one child and one senior
Single race or ethnicity 73.8% 78.3% 78.1%
Multiple race or ethnicity 26.2% 21.7% 21.9%
Households with no children or seniors
Single race or ethnicity 92.2% 88.4% 89.2%
Multiple race or ethnicity 7.8% 11.6% 10.8%
Data Source: Hunger in America 2014 Client Survey, Q4, Q4A, and Q4B.
Numbers may not sum to 100% due to rounding.
One person households were counted as single or multiple race or ethnicity based on the individual’s reported status as single or
multiple race or ethnicity.
NOTE: All data were weighted as described in Chapter 2. Percentages reported in tables are calculated from valid responses which
exclude nonresponse and valid skips due to survey item skip patterns. Numbers listed under nonreporting clients include missing data
due to item nonresponse from participating clients. All estimates are weighted to account for program and client sampling as well as
survey nonresponse from nonparticipating food banks, agencies, programs, and clients. Total weighted N reflects the weighted number
of respondents eligible to answer the question. It includes missing data but excludes valid skips. Total weighted N can vary across
tables because of valid skips. Meal program numbers and grocery program numbers do not sum to all food program numbers because
the unduplicated count that forms the basis for the weight for all food programs removes double-counting of clients served by both
types of programs.
When comparing different types of households, those containing children are statistically
significantly more likely to contain multiple races or ethnicities than those without children. Across
all programs, nearly one in four (23.5 percent) households with at least one child contain household
members who are from more than one racial/ethnic group. Although the difference may in part be
due to households without children more often being single person and therefore single
race/ethnicity households, the findings may also be a reflection of the current changing
demographics of the nation, as shown in the 2010 Census report that indicates increases since 2000
in the percentages of people of different races and ethnicities who are married or live together.66
66 U.S. Census Bureau, Households and Families 2010, 2010 Census Briefs, C2010BR-14.

Hunger in America 2014 National Report 95
Characteristics of Feeding America Clients and Their Households 4
4.2.4 Educational Attainment in Client Households
Educational qualifications often drive employment opportunities and, in turn, income. Education
also provides benefits beyond the individual; better education produces positive spillovers to society
as a whole through greater productivity, higher earnings, greater civic engagement, and more
innovation.67 Because of these spillovers, we are interested not only in individual educational
attainment but also educational attainment at the household level. Consequently, in addition to
reporting the educational attainment of all adult clients (Section 4.1.3), we use reporting of the
educational attainment of all adult members of client households to calculate the highest educational
level among the adults within each client household (Table 4-7).
Table 4-7. Client households by highest educational attainment, among adult household
members
Education level
Type of program All food
programs Meal Grocery
All households
Less than high school (HS) 15.0% 13.9% 14.3%
HS diploma 26.9% 32.2% 31.9%
General equivalency diploma or GED 20.1% 12.4% 13.0%
License, certificate, or degree beyond HS 7.0% 9.2% 9.0%
Some college or 2-year college degree 19.2% 22.7% 22.3%
4-year college degree or higher 11.7% 9.5% 9.5%
Total 100% 100% 100%
Weighted nonreporting client households 0.2M 0.5M 0.6M
Total weighted N 1.1M 5.4M 5.8M
Data Source: Hunger in America 2014 Client Survey, Q5.
Numbers may not sum to 100% due to rounding.
License, certificate, or degree beyond HS includes business, trade, or technical licenses.
NOTE: All data were weighted as described in Chapter 2. Percentages reported in tables are calculated from valid responses which
exclude nonresponse and valid skips due to survey item skip patterns. Numbers listed under nonreporting clients include missing data
due to item nonresponse from participating clients. All estimates are weighted to account for program and client sampling as well as
survey nonresponse from nonparticipating food banks, agencies, programs, and clients. Total weighted N reflects the weighted number
of respondents eligible to answer the question. It includes missing data but excludes valid skips. Total weighted N can vary across
tables because of valid skips. Meal program numbers and grocery program numbers do not sum to all food program numbers because
the unduplicated count that forms the basis for the weight for all food programs removes double-counting of clients served by both
types of programs.
Across all programs, in 31.9 percent of households the highest level of education among adult
members is a high school diploma; an additional 13.0 percent have a General Equivalency Diploma
(GED). For nearly 15 percent of households the highest educational attainment is less than a high
67 Walter W. McMahon. (2007). “An Analysis of Education Externalities with Applications to Development in the Deep South.” Contemporary Economic Policy, 25(3): 459-482.

Hunger in America 2014 National Report 96
Characteristics of Feeding America Clients and Their Households 4
school diploma. For these households the lack of higher education may limit employment
opportunities, which may render them more susceptible to economic fluctuations. Although client
households with high levels of educational attainment are less prevalent, nearly 10 percent of
households report the highest education level at a four-year college degree or higher, and collectively
40.8 percent of households contain a member with education beyond high school, demonstrating
the range of household circumstances among those seeking charitable food assistance.
4.2.5 Households with Military Service Members
The Client Survey included a question regarding military service to ascertain whether anyone in the
client’s household has ever served in the U.S. military.68,69 Looking at program type, we see a similar
pattern of military service across household arrangements for grocery programs. The pattern for
meal programs, however, is somewhat different as a statistically significantly higher 29.5 percent of
client households include a past or present military service member.
68 The Client Survey also included a question about current military service, the results of which were originally included
here. See erratum related to current military service data at: http://www.feedingamerica.org/hunger-in-america/our-
research/hunger-in-america/errata.html. 69 Footnote intentionally left blank.

Hunger in America 2014 National Report 97
Characteristics of Feeding America Clients and Their Households 4
Table 4-8. Client household military service
Military service
Type of program All food
programs Meal Grocery
All households
No household member has ever served 67.4% 78.3% 77.7%
At least one household member has served 29.5% 19.6% 20.3%
Other 3.1% 2.1% 2.1%
Total 100% 100% 100%
Weighted non-reporting client households 0.2M 0.5M 0.6M
Total weighted N 1.1M 5.4M 5.8M
Households with at least one child
No household member has ever served 90.8% 86.1% 86.2%
At least one household member has served 8.9% 12.9% 12.9%
Other 0.3% 1.0% 1.0%
Households with at least one senior
No household member has ever served 63.0% 67.9% 67.1%
At least one household member has served 34.1% 29.5% 30.4%
Other 2.9% 2.6% 2.6%
Households with at least one child and one senior
No household member has ever served 69.1% 75.5% 75.3%
At least one household member has served 30.3% 23.4% 23.5%
Other 0.6% 1.1% 1.2%
Households with no children or seniors
No household member has ever served 67.0% 80.0% 78.7%
At least one household member has served 29.1% 17.8% 19.2%
Other 3.9% 2.2% 2.1%
Data Source: Hunger in America 2014 Client Survey, Q10.
*In this table the category ‘Other’ encompasses clients who did not indicate whether anyone in their household ever served in the
military.
NOTE: All data were weighted as described in Chapter 2. Percentages reported in tables are calculated from valid responses which
exclude nonresponse and valid skips due to survey item skip patterns. Numbers listed under nonreporting clients include missing data
due to item nonresponse from participating clients. All estimates are weighted to account for program and client sampling as well as
survey nonresponse from nonparticipating food banks, agencies, programs, and clients. Total weighted N reflects the weighted number
of respondents eligible to answer the question. It includes missing data but excludes valid skips. Total weighted N can vary across
tables because of valid skips. Meal program numbers and grocery program numbers do not sum to all food program numbers because
the unduplicated count that forms the basis for the weight for all food programs removes double-counting of clients served by both
types of programs.

Hunger in America 2014 National Report 98
Characteristics of Feeding America Clients and Their Households 4
4.2.6 Languages Spoken at Home
Across all programs, 90.7 percent of households speak English as one of the primary languages of
the adults at home (Table 4-9). Only 13.1 percent of households speak Spanish as one of the
primary languages of adults at home, and 4.1 percent indicate other languages as one of the primary
languages. These numbers may be underestimates of the circumstances of the full network because
households served by nonparticipating food banks in Puerto Rico and California may be more likely
to speak languages other than English as a primary language at home. Also, although surveys were
offered in five languages, data collectors were not always available to recruit in all languages and this
may have limited variability in respondent languages.
Table 4-9. Client households by primary language(s) spoken in household among adults
Languages
Type of program All food
programs Meal Grocery
All households
English 95.7% 90.2% 90.7%
Spanish 6.9% 13.7% 13.1%
Other Indo-European languages 1.5% 1.1% 1.2%
Asian and Pacific Island languages 0.4% 1.7% 1.6%
Arabic 0.2% 0.3% 0.3%
Other languages not specified 0.8% 1.0% 1.0%
Weighted nonreporting client households 0.2M 0.6M 0.6M
Total weighted N 1.1M 5.4M 5.8M
Data Source: Hunger in America 2014 Client Survey, Q9.
Respondents could mark more than one language so percentages may not sum to 100%.
Other Indo-European languages include French, Russian, Haitian Creole, and German; Asian and Pacific Island languages include
Chinese, Tagalog, Vietnamese, Korean, and Hmong.
NOTE: All data were weighted as described in Chapter 2. Percentages reported in tables are calculated from valid responses which
exclude nonresponse and valid skips due to survey item skip patterns. Numbers listed under nonreporting clients include missing data
due to item nonresponse from participating clients. All estimates are weighted to account for program and client sampling as well as
survey nonresponse from nonparticipating food banks, agencies, programs, and clients. Total weighted N reflects the weighted number
of respondents eligible to answer the question. It includes missing data but excludes valid skips. Total weighted N can vary across
tables because of valid skips. Meal program numbers and grocery program numbers do not sum to all food program numbers because
the unduplicated count that forms the basis for the weight for all food programs removes double-counting of clients served by both
types of programs.
Some differences emerge between meal and grocery client households, as statistically significantly
more meal clients than grocery clients report speaking English as a primary language at home.
Grocery client households are statistically significantly more likely than meal client households to
speak Spanish or Asian and Pacific Island languages as a primary language at home.

Hunger in America 2014 National Report 99
Characteristics of Feeding America Clients and Their Households 4
4.2.7 Housing Characteristics
Housing circumstances can be an important indicator of stability in the lives of Feeding America
clients, including type of housing, payment arrangements, ability to store and cook food, and recent
transitions in housing circumstances.
The Client Survey differentiated between temporary and nontemporary housing. Nontemporary
arrangements are defined as those that have the potential to be long-term residences, such as
apartments and houses, and temporary arrangements are those that, although they could be long-
term situations, are not typically intended to house people long term, such as shelters or motels.
Across all food programs, 93.2 percent of client households are residing in nontemporary housing,
and 6.9 percent are residing in temporary housing (Figure 4-1).
Figure 4-1. Client households in temporary versus nontemporary housing
Data Source: Hunger in America 2014 Client Survey, Q18.
Weighted nonreporting client households 0.6M; total weighted N 5.8M.
Among the 93.2 percent of client households residing in nontemporary housing (Table 4-10), the
most common types of nontemporary housing are houses or townhouses (42.9 percent), apartments
(33.7 percent), and mobile homes or house trailers (12.5 percent). Households with at least one child
and households with at least one senior are both statistically significantly more likely than all
households to be living in houses or townhouses, and statistically significantly less likely to be living
in apartments.
7%
93%
Client households in
temporary housing
Client households in
nontemporary housing

Hunger in America 2014 National Report 100
Characteristics of Feeding America Clients and Their Households 4
Table 4-10. Client households by type of nontemporary housing
Type of nontemporary housing
Type of program All food
programs Meal Grocery
All households
Nontemporary housing 66.4% 95.5% 93.2%
Apartment 30.2% 34.3% 33.7%
House or townhouse 20.2% 44.6% 42.9%
Military housing 0.3% 0.2% 0.2%
Mobile home or house trailer 3.9% 13.3% 12.5%
Rented room in a rooming or boarding house 11.8% 3.1% 3.9%
Temporary housing 33.6% 4.5% 6.9%
Total 100% 100% 100%
Weighted nonreporting client households 0.2M 0.6M 0.6M
Total weighted N 1.1M 5.4M 5.8M
Households with at least one child
Nontemporary housing 72.3% 96.9% 96.3%
Apartment 30.6% 31.1% 30.8%
House or townhouse 24.8% 50.8% 50.2%
Military housing 0.0% 0.2% 0.2%
Mobile home or house trailer 4.1% 13.3% 13.1%
Rented room in a rooming or boarding house 12.8% 1.5% 2.0%
Temporary housing 27.7% 3.1% 3.7%
Total 100% 100% 100%
Households with at least one senior
Nontemporary housing 88.6% 97.9% 97.5%
Apartment 36.0% 30.7% 30.8%
House or townhouse 37.4% 51.0% 50.6%
Military housing 0.1% 0.1% 0.1%
Mobile home or house trailer 8.3% 13.6% 13.1%
Rented room in a rooming or boarding house 6.8% 2.5% 2.9%
Temporary housing 11.4% 2.1% 2.5%
Total 100% 100% 100%
Data Source: Hunger in America 2014 Client Survey, Q18.
Italicized lines sum to the percentage of client households in nontemporary housing. Numbers may not sum exactly due to rounding.
NOTE: All data were weighted as described in Chapter 2. Percentages reported in tables are calculated from valid responses which
exclude nonresponse and valid skips due to survey item skip patterns. Numbers listed under nonreporting clients include missing data
due to item nonresponse from participating clients. All estimates are weighted to account for program and client sampling as well as
survey nonresponse from nonparticipating food banks, agencies, programs, and clients. Total weighted N reflects the weighted number
of respondents eligible to answer the question. It includes missing data but excludes valid skips. Total weighted N can vary across
tables because of valid skips. Meal program numbers and grocery program numbers do not sum to all food program numbers because
the unduplicated count that forms the basis for the weight for all food programs removes double-counting of clients served by both
types of programs.
Overall, a small but notable percentage (6.9 percent) of Feeding America client households report
living in temporary housing (Table 4-11). The most commonly reported types of temporary housing
are shelters, missions, or transitional living situations (2.6 percent of all households), and living on
the street (1.5 percent of all households). Meal program client households are statistically
significantly more likely than grocery program client households (33.6 percent of meal program

Hunger in America 2014 National Report 101
Characteristics of Feeding America Clients and Their Households 4
Table 4-11. Client households by type of temporary housing
Type of temporary housing
Type of program All food
programs Meal Grocery
All households
Temporary housing 33.6% 4.5% 6.9%
Abandoned building, bus or train station, park,
campground, or airport 0.9% 0.3% 0.4%
Car, van, boat, or recreational vehicle (RV) 1.1% 0.3% 0.4%
Living on the street 7.3% 1.0% 1.5%
Motel or hotel temporarily 1.3% 0.4% 0.4%
Rented room in a rooming or boarding house 0.9% 0.7% 0.8%
Residential treatment facility or supervised housing 3.3% 0.1% 0.5%
Shelter, mission, or transitional living situation 17.8% 1.3% 2.6%
Unknown 0.8% 0.3% 0.3%
Nontemporary housing 66.4% 95.5% 93.2%
Total 100% 100% 100%
Weighted nonreporting client households 0.2M 0.6M 0.6M
Total weighted N 1.1M 5.4M 5.8M
Households with at least one child
Temporary housing 27.7% 3.1% 3.7%
Abandoned building, bus or train station, park,
campground, or airport 0.1% 0.1% 0.1%
Car, van, boat, or recreational vehicle (RV) 0.1% 0.2% 0.2%
Living on the street 1.4% 0.3% 0.4%
Motel or hotel temporarily 3.2% 0.7% 0.8%
Rented room in a rooming or boarding house 0.1% 0.9% 0.8%
Residential treatment facility or supervised housing 0.9% 0.1% 0.1%
Shelter, mission, or transitional living situation 20.7% 0.8% 1.3%
Unknown 1.1% 0.1% 0.2%
Nontemporary housing 72.3% 96.9% 96.3%
Total 100% 100% 100%
Households with at least one senior
Temporary housing 11.4% 2.1% 2.5%
Abandoned building, bus or train station, park,
campground, or airport 0.2% 0.1% 0.1%
Car, van, boat, or recreational vehicle (RV) 2.3% 0.2% 0.2%
Living on the street 4.5% 0.4% 0.6%
Motel or hotel temporarily 0.0% 0.1% 0.1%
Rented room in a rooming or boarding house 0.2% 0.6% 0.5%
Residential treatment facility or supervised housing 1.0% 0.1% 0.2%
Shelter, mission, or transitional living situation 2.5% 0.3% 0.4%
Unknown 0.8% 0.3% 0.3%
Nontemporary housing 88.6% 97.9% 97.5%
Total 100% 100% 100%
Data Source: Hunger in America 2014 Client Survey, Q18A.
Italicized lines sum to the percentage of client households in temporary housing. Numbers may not sum exactly due to rounding.
NOTE: All data were weighted as described in Chapter 2. Percentages reported in tables are calculated from valid responses which
exclude nonresponse and valid skips due to survey item skip patterns. Numbers listed under nonreporting clients include missing data
due to item nonresponse from participating clients. All estimates are weighted to account for program and client sampling as well as
survey nonresponse from nonparticipating food banks, agencies, programs, and clients. Total weighted N reflects the weighted number
of respondents eligible to answer the question. It includes missing data but excludes valid skips. Total weighted N can vary across
tables because of valid skips. Meal program numbers and grocery program numbers do not sum to all food program numbers because

Hunger in America 2014 National Report 102
Characteristics of Feeding America Clients and Their Households 4
the unduplicated count that forms the basis for the weight for all food programs removes double-counting of clients served by both
types of programs.
client households compared to 4.5 percent of grocery program client households) to report residing
in temporary housing, a finding likely attributable to many meal programs being designed to serve
shelter residents and others in temporary housing. Relatively fewer households with at least one
child or at least one senior report temporary housing. Some of the client households residing in
temporary housing are considered “homeless” as defined by the U.S. Department of Housing and
Urban Development (HUD); others may not be if they are living in temporary housing situations
that do not meet this definition.70 At least 4.9 percent of client households from all food programs
may meet HUD’s definition of “homeless.”71 This percentage is greater among client households at
meal programs, with 27.1 percent that may meet the HUD definition of “homeless.” The remaining
2.0 percent of all food program households and 6.5 percent of meal program households in
temporary housing may or may not be considered homeless, depending on their resources and
circumstances.
Among those households in nontemporary housing, clients report how their household pays for the
place where they currently live (Table 4-12). Across all food programs, 63.7 percent of households
rent or lease their home. Just 15.4 percent of households have a mortgage and 11.5 percent own
their housing free and clear.
70 The McKinney-Vento Homeless Assistance Act, as amended by S. 896. The Homeless Emergency Assistance and Rapid Transition to Housing (HEARTH) Act of 2009SEC. 103. [42 USC 11302] GENERAL DEFINITION OF HOMELESS INDIVIDUAL.
71 This percentage includes client households reporting residing in abandoned buildings, bus or train stations, parks, campgrounds, or airports; residing in cars, vans, boats, or recreational vehicles; living on the street; and residing in shelters, missions, or transitional living situations.

Hunger in America 2014 National Report 103
Characteristics of Feeding America Clients and Their Households 4
Table 4-12. Client households with various housing payment arrangements, among clients
residing in nontemporary housing
Payment for housing
Type of program All food
programs Meal Grocery
All households
Do not have to pay rent 14.5% 8.8% 9.3%
Own free and clear 8.8% 11.5% 11.5%
Own with mortgage 6.7% 15.8% 15.4%
Rent or lease 70.1% 63.9% 63.7%
Total 100% 100% 100%
Weighted nonreporting client households 0.2M 0.6M 0.7M
Total weighted N 0.7M 5.1M 5.3M
Households with at least one child
Do not have to pay rent 8.6% 8.4% 8.4%
Own free and clear 3.2% 8.3% 8.2%
Own with mortgage 12.2% 16.4% 16.4%
Rent or lease 76.0% 66.9% 67.0%
Households with at least one senior
Do not have to pay rent 7.0% 7.6% 7.7%
Own free and clear 20.9% 20.2% 20.7%
Own with mortgage 11.6% 20.6% 20.2%
Rent or lease 60.6% 51.6% 51.4%
Households with at least one child and one senior
Do not have to pay rent 31.8% 7.5% 7.6%
Own free and clear 13.0% 16.7% 16.8%
Own with mortgage 29.4% 25.6% 25.7%
Rent or lease 25.8% 50.2% 50.0%
Households with no children or seniors
Do not have to pay rent 18.8% 10.8% 12.2%
Own free and clear 3.7% 7.6% 7.4%
Own with mortgage 3.6% 12.2% 11.7%
Rent or lease 74.0% 69.3% 68.7%
Data Source: Hunger in America 2014 Client Survey, Q19.
Numbers may not sum to 100% due to rounding.
NOTE: All data were weighted as described in Chapter 2. Percentages reported in tables are calculated from valid responses which
exclude nonresponse and valid skips due to survey item skip patterns. Numbers listed under nonreporting clients include missing data
due to item nonresponse from participating clients. All estimates are weighted to account for program and client sampling as well as
survey nonresponse from nonparticipating food banks, agencies, programs, and clients. Total weighted N reflects the weighted number
of respondents eligible to answer the question. It includes missing data but excludes valid skips. Total weighted N can vary across
tables because of valid skips. Meal program numbers and grocery program numbers do not sum to all food program numbers because
the unduplicated count that forms the basis for the weight for all food programs removes double-counting of clients served by both
types of programs.
Comparing households across the two programs types, grocery program client households are
statistically significantly more likely than meal program client households to own a home with a
mortgage. Looking across household compositions, households that include seniors are statistically
significantly more likely than other household types to own a home with either a mortgage or free
and clear.

Hunger in America 2014 National Report 104
Characteristics of Feeding America Clients and Their Households 4
Another housing-related characteristic we examine is recent housing transitions experienced by
survey respondents (Table 4-13). Because respondents could have experienced housing transitions
that did not involve their entire household, this analysis is done at the respondent level, as opposed
to the household level. Therefore, we explore the weighted percentage of respondents experiencing
transitions rather than households. More than one-quarter (26.9 percent) of respondents report
living in two or more places in the past 12 months. Clients at meal programs report the highest
number of moves: 48.2 percent report living in two or more places over the past 12 months.
A smaller but substantial number of respondents report other housing transitions. Across all
programs, 22.3 percent of respondents report they started living with another person or family in the
past 12 months, and 15.5 percent report having experienced foreclosure or eviction in the past five
years. More meal than grocery program respondents report these types of transitions.
Table 4-13. Respondents by recent housing transitions
Transition
Type of program All food
programs Meal Grocery
Number of places respondent lived within the last 12 months
1 51.8% 76.0% 73.1%
2 24.1% 14.8% 15.7%
3 or more 24.1% 9.2% 11.2%
Total 100% 100% 100%
Weighted nonreporting respondents 0.2M 0.6M 0.7M
Total weighted N 1.8M 5.4M 6.0M
Respondent started living with another person or family within the past 12 months
Yes 31.0% 21.4% 22.3%
No 69.0% 78.6% 77.7%
Total 100% 100% 100%
Weighted nonreporting respondents 0.1M 0.2M 0.2M
Total weighted N 1.8M 5.4M 6.0M
Respondent experienced a foreclosure or eviction during the past 5 years
Yes 19.3% 15.0% 15.5%
No 80.7% 85.0% 84.5%
Total 100% 100% 100%
Weighted nonreporting respondents 0.1M 0.2M 0.2M
Total weighted N 1.8M 5.4M 6.0M
Data Source: Hunger in America 2014 Client Survey, Q17, Q20, and Q21.
Numbers may not sum to 100% due to rounding.
Total weighted N for this table represents the weighted number of survey respondents. Because respondents at grocery programs were not
randomly selected among household members, respondent experience may not represent all Feeding America clients.
NOTE: All data were weighted as described in Chapter 2. Percentages reported in tables are calculated from valid responses which exclude
nonresponse and valid skips due to survey item skip patterns. Numbers listed under nonreporting clients include missing data due to item
nonresponse from participating clients. All estimates are weighted to account for program and client sampling as well as survey
nonresponse from nonparticipating food banks, agencies, programs, and clients. Total weighted N reflects the weighted number of
respondents eligible to answer the question. It includes missing data but excludes valid skips. Total weighted N can vary across tables
because of valid skips. Meal program numbers and grocery program numbers do not sum to all food program numbers because the

Hunger in America 2014 National Report 105
Characteristics of Feeding America Clients and Their Households 4
unduplicated count that forms the basis for the weight for all food programs removes double-counting of clients served by both types of
programs.
The final housing characteristic we examine is cooking or cold storage capacity at home
(Table 4-14). Having access to equipment to cook and store food at home is an essential element of
preparing meals at home. When considering that most meal programs, such as kitchens and shelters,
provide pre-prepared meals to clients outside of the home, it is not surprising that statistically
significantly fewer meal program client households, as compared to grocery program client
households, have these capacities. It is possible that meal program clients rely on these programs to
prepare the food they consume because they do not have individual access to equipment that cooks
or keeps food cold. Overall most client households report having equipment to cook and store food,
which was defined broadly, and therefore may include households that have only provisional
equipment such as hot plates, camp stoves, or coolers.
Table 4-14. Client households by cooking or cold storage capacity at home
Housing contains…
Type of program All food
programs Meal Grocery
All households
Equipment to cook food 77.3% 95.6% 93.9%
Weighted nonreporting client households 0.2M 0.9M 1.0M
Total weighted N 1.1M 5.4M 5.8M
Equipment to keep food cold 75.2% 95.5% 93.4%
Weighted nonreporting client households 0.2M 0.9M 0.9M
Total weighted N 1.1M 5.4M 5.8M
Households with at least one child
Equipment to cook food 89.9% 96.8% 96.7%
Equipment to keep food cold 88.5% 97.0% 96.8%
Households with at least one senior
Equipment to cook food 91.2% 97.2% 96.9%
Equipment to keep food cold 90.0% 97.1% 96.6%
Households with at least one child and one senior
Equipment to cook food 92.2% 97.2% 97.1%
Equipment to keep food cold 91.9% 97.2% 97.1%
Households with no children or seniors
Equipment to cook food 70.6% 93.7% 89.6%
Equipment to keep food cold 67.5% 93.2% 88.4%
Data Source: Hunger in America 2014 Client Survey, Q44 and Q45.
Equipment to cook food includes stove, microwave, or hot plate. Equipment to keep food cold includes any place to store food to keep it
cold so it does not spoil, like a refrigerator.
NOTE: All data were weighted as described in Chapter 2. Percentages reported in tables are calculated from valid responses which
exclude nonresponse and valid skips due to survey item skip patterns. Numbers listed under nonreporting clients include missing data
due to item nonresponse from participating clients. All estimates are weighted to account for program and client sampling as well as
survey nonresponse from nonparticipating food banks, agencies, programs, and clients. Total weighted N reflects the weighted number
of respondents eligible to answer the question. It includes missing data but excludes valid skips. Total weighted N can vary across
tables because of valid skips. Meal program numbers and grocery program numbers do not sum to all food program numbers because
the unduplicated count that forms the basis for the weight for all food programs removes double-counting of clients served by both
types of programs.

Hunger in America 2014 National Report 106
Characteristics of Feeding America Clients and Their Households 4
4.3 Work, School, and Barriers and Bridges to Work
Employment increases the likelihood of becoming financially secure. Yet not everyone is able to
participate in the workforce, either due to labor market conditions or extenuating personal
situations. The Client Survey asked respondents to report on the employment status of select people
in their households, time spent out of the workforce, and potential barriers or bridges that their
households face in seeking employment, including adult student status. Specifically, the survey asked
respondents whether they had worked for pay within the last 12 months; whether they typically
worked part- or full-time; and whether they had worked within the last four weeks. If respondents
indicated that they had not worked for pay within the last four weeks, the Client Survey probed how
long they had been out of work; whether they were actively looking for work during the previous
four weeks; and if not, reasons why not. If another person in the household was employed in the
past 12 months, respondents were asked to answer this same battery of questions for the other
person in their household who worked the most months in the past 12 months. Employment
circumstances were asked only about these two people in the household to ease survey burden on
respondents.
In the following sections, the person in the household with the greatest number of months of
employment over the past 12 months—regardless of whether this was full- or part-time
employment—is referred to as the most employed person. It is this person in the household on
whom all the employment data are reported. We first explore the number of months the most
employed person in each client household has worked during the past year, and whether that
employment is typically full-time or part-time.
We then turn to an examination of employment in the past four weeks. We describe employment
status in the past four weeks of the most employed person in each household, and focus specifically
the subset of households in which the most employed person has not worked within the past four
weeks. In these analyses, we examine how long the most employed person who is not currently
working has been without employment; whether he or she has looked actively for work in the past
four weeks; and if not looking for work, reasons why not.
Finally, we explore potential barriers and bridges to employment that some Feeding America
households face, including extenuating circumstances that may prevent employment, and
educational activities that may ultimately promote employment.
Hunger in America 2014 National Report 107
Characteristics of Feeding America Clients and Their Households 4
These data provide a glimpse of employment in client households, but should be interpreted within
the limitations of what the survey questions reveal. For analytic clarity we focus on the person in the
household with the most months of employment over the past 12 months, but this person may not
be the only employed person in the household. If the most employed person has been without
employment in the past four weeks it is possible, for example, that another household member has
since become the primary earner, or seasonal employment has caused a temporary interruption in
employment. Thus, while the data do describe the employment circumstances of the person
employed the most months in the past year, they do not fully account for employment of other
household members who may have worked less often.
4.3.1 Household Employment
As described in the previous section, in analyzing household employment we focus on the most
employed person in the household, defined as the person who has worked for pay the most number
of months within the past 12 months. This individual is typically a primary source of income for the
household. As such, interruptions in this individual’s employment may have profound effects on the
household’s ability to be self-sufficient, potentially increasing their need for charitable food program
services.
Looking first at months employed by the most employed person over the past 12 months, we see
that across all food programs, both meal and grocery, 53.9 percent of client households include at
least one person who has worked for pay in the past 12 months. Among all client households,
34.3 percent report that the person employed the longest has worked more than six of the past
12 months (Table 4-15). Comparing households with at least one child and households with at least
one senior to all households, we see that employment rates and durations are statistically
significantly higher in households with children, and statistically significantly lower in those with
seniors. In households with at least one child, 70.6 percent of households report that someone has
worked in the past 12 months, and 48.9 percent worked more than six of the past 12 months. In
households with at least one senior, 34.0 percent of households report that someone has worked in
the past 12 months, and 21.5 percent worked more than six of the past 12 months. These patterns
are similar for meal and grocery programs as well.

Hunger in America 2014 National Report 108
Characteristics of Feeding America Clients and Their Households 4
Table 4-15. Client households by most employed person in the past 12 months
Months employed during the past 12 months
Type of program All food
programs Meal Grocery
All households
None 51.7% 45.7% 46.1%
Less than 1 month 6.7% 4.4% 4.5%
1-3 months 10.7% 7.5% 7.6%
4-6 months 9.3% 7.4% 7.5%
7-9 months 10.2% 17.8% 17.3%
10-12 months 11.4% 17.3% 17.0%
Total 100% 100% 100%
Weighted nonreporting client households 0.0M 0.2M 0.2M
Total weighted N 1.1M 5.4M 5.8M
Households with at least one child
None 35.4% 29.1% 29.4%
Less than 1 month 5.4% 3.7% 3.7%
1-3 months 9.9% 8.9% 8.9%
4-6 months 7.7% 9.2% 9.1%
7-9 months 21.8% 26.1% 25.9%
10-12 months 19.7% 23.0% 23.0%
Households with at least one senior
None 69.8% 66.0% 66.0%
Less than 1 month 7.0% 3.2% 3.2%
1-3 months 3.7% 5.0% 5.1%
4-6 months 2.6% 4.3% 4.2%
7-9 months 8.4% 12.0% 12.0%
10-12 months 8.6% 9.4% 9.5%
Data source: Hunger in America 2014 Client Survey, Q8 and Q8A-H.
Numbers may not sum to 100% due to rounding.
NOTE: All data were weighted as described in Chapter 2. Percentages reported in tables are calculated from valid responses which
exclude nonresponse and valid skips due to survey item skip patterns. Numbers listed under nonreporting clients include missing data
due to item nonresponse from participating clients. All estimates are weighted to account for program and client sampling as well as
survey nonresponse from nonparticipating food banks, agencies, programs, and clients. Total weighted N reflects the weighted number
of respondents eligible to answer the question. It includes missing data but excludes valid skips. Total weighted N can vary across
tables because of valid skips. Meal program numbers and grocery program numbers do not sum to all food program numbers because
the unduplicated count that forms the basis for the weight for all food programs removes double-counting of clients served by both
types of programs.
4.3.2 Full-Time and Part-Time Work
The number of months of employment does not tell the full story of workforce participation. The
number of hours typically worked per week is an important factor in achieving the financial stability
employment can bring. We define full-time employment using the standard measure of more than
30 hours per week of employment. It is here that we see that although many Feeding America client
households have an employed household member, they are typically working part-time rather than
full-time (Table 4-16). Across all household compositions, and focusing on all food programs

Hunger in America 2014 National Report 109
Characteristics of Feeding America Clients and Their Households 4
combined, the person with the longest employment duration is statistically significantly more likely
to be employed part-time rather than full-time. Households with at least one child are the most likely
to report full-time employment of the most employed person, and households with at least one
senior the least likely.
Table 4-16. Client households by typical hours worked per week, among households with
employment in the past 12 months
Typical hours worked per week
Type of program All food
programs Meal Grocery
All households
Full-time 41.6% 42.3% 43.0%
Part-time 58.4% 57.7% 57.0%
Total 100% 100% 100%
Weighted nonreporting client households 0.0M 0.2M 0.2M
Total weighted N 0.5M 2.3M 2.5M
Households with at least one child
Full-time 49.4% 47.1% 47.0%
Part-time 50.6% 52.9% 53.0%
Households with at least one senior
Full-time 27.7% 35.6% 35.7%
Part-time 72.3% 64.4% 64.3%
Data source: Hunger in America 2014 Client Survey, Q8, Q8A and Q8H.
Numbers may not sum to 100% due to rounding.
For the purposes of analyses employment more than 30 hours per week was considered full time.
NOTE: All data were weighted as described in Chapter 2. Percentages reported in tables are calculated from valid responses which
exclude nonresponse and valid skips due to survey item skip patterns. Numbers listed under nonreporting clients include missing data
due to item nonresponse from participating clients. All estimates are weighted to account for program and client sampling as well as
survey nonresponse from nonparticipating food banks, agencies, programs, and clients. Total weighted N reflects the weighted number
of respondents eligible to answer the question. It includes missing data but excludes valid skips. Total weighted N can vary across
tables because of valid skips. Meal program numbers and grocery program numbers do not sum to all food program numbers because
the unduplicated count that forms the basis for the weight for all food programs removes double-counting of clients served by both
types of programs.
4.3.3 Being Unemployed or Out of the Workforce
The U.S. Bureau of Labor Statistics’ (BLS) definition of an unemployed person requires that the
individual without a job be 16 years of age or older, has looked for work in the past four weeks, and
is currently available for work.72 Given this definition of unemployment, not all people in Feeding
America client households who are not working are officially unemployed. Consequently, we use the
term out of the workforce to refer to people who are both not currently working and do not meet the
technical definition of unemployed. The following data describe unemployment and being out of the
72 U.S. Bureau of Labor Statistics definition of unemployment: http://www.bls.gov/cps/cps_htgm.htm#unemployed.

Hunger in America 2014 National Report 110
Characteristics of Feeding America Clients and Their Households 4
workforce among those “most employed” individuals in Feeding America client households who
have worked the most months of the past 12 months, but have not worked in the past four weeks.
We explore reasons why some have not looked for work in the past four weeks, finding that age and
health are often the driving forces behind leaving the workforce.
Figure 4-2 shows employment status in the past four weeks of the most employed person in Feeding
America client households: 34.4 percent of households indicate that the most employed person has
worked within the past four weeks. Nearly a quarter (23.3 percent) of households report that the
most employed person is unemployed and actively looking for work. The remaining 42.3 percent do
not meet the BLS requirements for being unemployed; thus, in 42.3 percent of the households that
Feeding America serves, the most employed person is out of the workforce.
Figure 4-2. Employment status in the past four weeks of the most employed person
Data Source: Hunger in America 2014 Client Survey, Q8, and Q8A – 8H.
Number may not sum to 100% due to rounding.
Weighted nonreporting client households 2.7M; total weighted N 5.8M.
Among households where the person who was the most employed in the past 12 months is not
currently working (encompassing both unemployed and out of the workforce), the majority (70.1
percent) of households report that this person has been without employment for more than one
year (Table 4-17). This pattern holds across program type and across household composition type.
Health and retirement are the most common reasons why people are not in the workforce (Table 4-
18). Also noteworthy is that households with at least one child, as compared to other household
42%
34%
23%
Out of the workforce
Employed
Unemployed

Hunger in America 2014 National Report 111
Characteristics of Feeding America Clients and Their Households 4
types, report a statistically significantly higher percentage of the most employed person being
without employment for six months or less.
Table 4-17. Client households by duration without employment, among client households where
most employed person is currently not working
Length of time without employment
Type of program All food
programs Meal Grocery
All households
Less than 1 month 4.8% 5.6% 5.6%
1-6 months 19.0% 16.8% 16.8%
7-12 months 9.5% 7.3% 7.5%
More than 1 year 66.6% 70.3% 70.1%
Total 100% 100% 100%
Weighted nonreporting client households 0.0M 0.2M 0.2M
Total weighted N 0.8M 3.5M 3.8M
Households with at least one child
Less than 1 month 8.0% 7.5% 7.6%
1-6 months 24.7% 26.7% 26.4%
7-12 months 6.7% 9.3% 9.3%
More than 1 year 60.7% 56.4% 56.7%
Households with at least one senior
Less than 1 month 1.7% 3.6% 3.4%
1-6 months 6.1% 8.3% 8.3%
7-12 months 9.2% 4.7% 4.8%
More than 1 year 83.0% 83.4% 83.5%
Data source: Hunger in America 2014 Client Survey, Q8 and Q8A-H.
Numbers may not sum to 100% due to rounding.
NOTE: All data were weighted as described in Chapter 2. Percentages reported in tables are calculated from valid responses which
exclude nonresponse and valid skips due to survey item skip patterns. Numbers listed under nonreporting clients include missing data
due to item nonresponse from participating clients. All estimates are weighted to account for program and client sampling as well as
survey nonresponse from nonparticipating food banks, agencies, programs, and clients. Total weighted N reflects the weighted number
of respondents eligible to answer the question. It includes missing data but excludes valid skips. Total weighted N can vary across
tables because of valid skips. Meal program numbers and grocery program numbers do not sum to all food program numbers because
the unduplicated count that forms the basis for the weight for all food programs removes double-counting of clients served by both
types of programs.
To understand better the circumstances surrounding those who are not working, we explore
whether the formerly most employed person in the client households who are not currently working
have been actively looking for work in the past four weeks, and if not, the main reason for not
looking for work (Table 4-18). Nearly a quarter (23.3 percent) of households report that the
formerly most employed person is unemployed and actively looking for work. A closer examination
of household types shows households with at least one senior are the least likely to report an active
job search, with only 13.6 percent of households reporting active job searching.

Hunger in America 2014 National Report 112
Characteristics of Feeding America Clients and Their Households 4
Table 4-18. Client households’ work status in the past four weeks; and reasons for not looking
for work, among client households where formerly most employed person is now
out of the workforce
Work status and reasons for not looking for work
Type of program All food
programs Meal Grocery
All households
Employed 24.8% 35.0% 34.4%
Unemployed and looking for work 26.1% 23.0% 23.3%
Out of the workforce and not looking for work because… 49.1% 42.0% 42.3%
Are a caretaker for another person 0.5% 1.4% 1.3%
Are disabled or in poor health 22.5% 22.0% 21.9%
Are in school or in job training 1.6% 0.9% 0.8%
Are retired 13.3% 12.4% 12.4%
Because of some other reason 8.9% 3.6% 4.0%
Stopped looking because could not find a job 1.4% 0.8% 0.8%
Unknown 0.9% 1.0% 1.0%
Total 100% 100% 100%
Weighted nonreporting client households 0.0M 0.1M 0.1M
Total weighted N 1.1M 5.4M 5.8M
Households with at least one child
Employed 40.5% 50.3% 49.9%
Unemployed and looking for work 24.9% 25.5% 25.3%
Out of the workforce and not looking for work because… 34.6% 24.3% 24.8%
Are a caretaker for another person 2.8% 1.7% 1.7%
Are disabled or in poor health 24.0% 13.9% 14.4%
Are in school or in job training 0.8% 0.9% 0.9%
Are retired 1.4% 3.4% 3.4%
Because of some other reason 5.4% 3.4% 3.5%
Stopped looking because could not find a job 0.0% 0.4% 0.4%
Unknown 0.2% 0.4% 0.4%
Households with at least one senior
Employed 17.8% 21.0% 21.0%
Unemployed and looking for work 13.0% 13.9% 13.6%
Out of the workforce and not looking for work because… 69.2% 65.1% 65.4%
Are a caretaker for another person 0.4% 1.4% 1.4%
Are disabled or in poor health 16.4% 23.9% 23.5%
Are in school or in job training 0.3% 0.6% 0.6%
Are retired 46.4% 33.9% 34.6%
Because of some other reason 3.1% 3.2% 3.1%
Stopped looking because could not find a job 0.9% 0.8% 0.8%
Unknown 1.7% 1.4% 1.4%
Data source: Hunger in American 2014 Client Survey, Q8 and Q8A-H.
Numbers may not sum to 100% due to rounding.
Responses for in school or in job training were combined in analyses.
NOTE: All data were weighted as described in Chapter 2. Percentages reported in tables are calculated from valid responses which
exclude nonresponse and valid skips due to survey item skip patterns. Numbers listed under nonreporting clients include missing data
due to item nonresponse from participating clients. All estimates are weighted to account for program and client sampling as well as
survey nonresponse from nonparticipating food banks, agencies, programs, and clients. Total weighted N reflects the weighted number
of respondents eligible to answer the question. It includes missing data but excludes valid skips. Total weighted N can vary across
tables because of valid skips. Meal program numbers and grocery program numbers do not sum to all food program numbers because

Hunger in America 2014 National Report 113
Characteristics of Feeding America Clients and Their Households 4
the unduplicated count that forms the basis for the weight for all food programs removes double-counting of clients served by both
types of programs.
Among all households where the person employed the most in the past 12 months is now out of the
workforce, that is, not actively looking for work, the most common reason given (21.9 percent) is
that this person is now disabled or in poor health (Table 4-18). The second most common reason
(12.4 percent) is because this person is retired. Not surprisingly this pattern differs for households
with at least one senior, where the most common reason is retirement, and the second most
common reason is being disabled or in poor health. Thus, health and age are the primary reasons
why people who have worked the most months in the past 12 months are out of the workforce and
no longer looking for work.
4.3.4 Potential Barriers and Bridges to Employment
There are many life circumstances that may act as barriers to employment, such as health, caregiving
responsibility, age, and criminal history. Similarly, there are circumstances such as job training and
education that may negatively affect current employment status, but ultimately may increase the
likelihood of future employment. Client Survey respondents were asked about such circumstances in
their households. Although clients do not identify these circumstances specifically as related to
household employment status, we describe them here under potential barriers and bridges to
employment to provide a fuller picture of the conditions surrounding employment in client
households.
Potential Barriers to Employment
In the previous section we presented data on reasons why people no longer in the workforce are not
looking for work. The most common reasons for not seeking employment include the worker being
disabled or in poor health, or being retired. Some households report that the most employed person
is now a caregiver. One specific instance of this probed on the survey is that of grandparents who
have responsibility for grandchildren who live with them (Table 4-19). Among client households
from grocery programs, 18.3 percent report being grandparents who care for a resident grandchild.
This is statistically significantly less common among client households from meal programs, where
only 6.8 percent care for grandchildren.

Hunger in America 2014 National Report 114
Characteristics of Feeding America Clients and Their Households 4
Table 4-19. Respondents responsible for grandchildren in the household
Employment barrier
Type of program All food
programs Meal Grocery
All households
Care for grandchildren they live with 6.8% 18.3% 17.4%
Weighted nonreporting client households 0.0M 0.2M 0.2M
Total weighted N 1.1M 5.4M 5.8M
Data Source: Hunger in America 2014 Client Survey, Q11 and Q12.
NOTE: All data were weighted as described in Chapter 2. Percentages reported in tables are calculated from valid responses which
exclude nonresponse and valid skips due to survey item skip patterns. Numbers listed under nonreporting clients include missing data
due to item nonresponse from participating clients. All estimates are weighted to account for program and client sampling as well as
survey nonresponse from nonparticipating food banks, agencies, programs, and clients. Total weighted N reflects the weighted number
of respondents eligible to answer the question. It includes missing data but excludes valid skips. Total weighted N can vary across
tables because of valid skips. Meal program numbers and grocery program numbers do not sum to all food program numbers because
the unduplicated count that forms the basis for the weight for all food programs removes double-counting of clients served by both
types of programs.
Another potential barrier to household employment is having household members who have been
released from prison in the previous year and may have difficulty finding employment (Table 4-20).
Release from prison, while a substantial barrier to employment, is less common overall with only 7.4
percent of meal program client households and 3.0 percent of grocery program client households
reporting this barrier.
Table 4-20. Client households with household member(s) released from prison in the past
12 months
Employment barrier
Type of program All food
programs Meal Grocery
All households
Household member released from prison in past 12 months 7.4% 3.0% 3.2%
Weighted nonreporting client households 0.0M 0.2M 0.2M
Total weighted N 1.1M 5.4M 5.8M
Data Source: Hunger in America 2014 Client Survey, Q11 and Q12.
NOTE: All data were weighted as described in Chapter 2. Percentages reported in tables are calculated from valid responses which
exclude nonresponse and valid skips due to survey item skip patterns. Numbers listed under nonreporting clients include missing data
due to item nonresponse from participating clients. All estimates are weighted to account for program and client sampling as well as
survey nonresponse from nonparticipating food banks, agencies, programs, and clients. Total weighted N reflects the weighted number
of respondents eligible to answer the question. It includes missing data but excludes valid skips. Total weighted N can vary across
tables because of valid skips. Meal program numbers and grocery program numbers do not sum to all food program numbers because
the unduplicated count that forms the basis for the weight for all food programs removes double-counting of clients served by both
types of programs.

Hunger in America 2014 National Report 115
Characteristics of Feeding America Clients and Their Households 4
Potential Bridges to Employment
Having higher levels of educational attainment can be a bridge to employment, increasing one’s
employment prospects and potential earnings.73,74 Obtaining additional education can be challenging,
however, requiring investments of time and money. In addition to probing the educational
attainment of all food program clients (Section 4.1.3) and the level of educational attainment in
client households (Section 4.2.4), the Client Survey probed whether adults in the household are
currently students, either full-time or part-time (Table 4-21). Looking at all food programs,
18.7 percent of households contain one or more adult students. Respondents do not always indicate
whether each student in their household is attending school full-time or part-time. Among those
who do report this information, however, statistically significantly more adult students are full-time
rather than part-time. This pattern is similar for grocery program client households. In contrast, a
much lower percentage of meal program client households report having students, and the students
are evenly split between full-time and part-time. Finally, compared to all households, a statistically
significantly higher percentage of households with at least one child contain adult students, and a
statistically significantly lower percentage of households with at least one senior contain adult
students.
73 Anthony P. Carnevale, Nicole Smith, and Jeff Strohl. (2010). “Help Wanted: Projections of Job and Education Requirements Through 2018.” Washington, DC: Georgetown University Center on Education and the Workforce.
74 Gloria L. Beckles, and Benedict I. Truman. (2011). “Education and Income—United States, 2005 and 2009.” Morbidity and Mortality Weekly Report, Supplements, 60(01), 13-17.

Hunger in America 2014 National Report 116
Characteristics of Feeding America Clients and Their Households 4
Table 4-21. Client households by adult student status
Adult student status
Type of program All food
programs Meal Grocery
All households
At least one adult student 9.5% 19.6% 18.7%
Full-time student(s) 4.7% 12.0% 11.4%
Part-time student(s) 4.7% 6.7% 6.5%
Unknown status 4.6% 12.3% 11.9%
No adult students 90.5% 80.4% 81.3%
Weighted nonreporting client households 0.1M 0.5M 0.5M
Total weighted N 1.1M 5.4M 5.8M
Households with at least one child
At least one adult student 28.2% 25.8% 25.6%
Full-time student(s) 14.6% 16.6% 16.4%
Part-time student(s) 13.4% 9.7% 9.7%
Unknown status 4.6% 5.2% 5.1%
No adult students 71.8% 74.2% 74.4%
Households with at least one senior
At least one adult student 4.1% 11.1% 10.7%
Full-time student(s) 3.0% 6.5% 6.3%
Part-time student(s) 1.5% 4.3% 4.2%
Unknown status 3.5% 9.8% 9.5%
No adult students 95.9% 88.9% 89.3%
Data Source: Hunger in America 2014 Client Survey, Q6 and Q6A.
Households may have full-time and part-time students, and students of unknown status, so percentages may not sum to the total
percentage of students.
NOTE: All data were weighted as described in Chapter 2. Percentages reported in tables are calculated from valid responses which
exclude nonresponse and valid skips due to survey item skip patterns. Numbers listed under nonreporting clients include missing data
due to item nonresponse from participating clients. All estimates are weighted to account for program and client sampling as well as
survey nonresponse from nonparticipating food banks, agencies, programs, and clients. Total weighted N reflects the weighted number
of respondents eligible to answer the question. It includes missing data but excludes valid skips. Total weighted N can vary across
tables because of valid skips. Meal program numbers and grocery program numbers do not sum to all food program numbers because
the unduplicated count that forms the basis for the weight for all food programs removes double-counting of clients served by both
types of programs.
4.4 Health, Income, and Poverty
In this section we discuss challenges to the well-being of Feeding America clients and their
households, including health status and health conditions, medical insurance status, and income and
poverty. These challenges can keep people out of the workforce, increase expenses, and limit
resources. Together, these challenges may increase a household’s need for charitable food assistance.

Hunger in America 2014 National Report 117
Characteristics of Feeding America Clients and Their Households 4
4.4.1 Health Status and Health Conditions
The Client Survey asked respondents to characterize both their own health and the health of other
members of their households. Respondents use a scale from “poor” to “excellent” to describe their
health, while they also indicate whether another household member is in poor health. Although such
self-reports of health are necessarily broad, research has found that these reports are largely reliable
as measures of health and health care use.75,76 Across all food programs the weighted respondents
range in health substantially, from 47.4 percent reporting fair or poor health to 52.6 percent
reporting good, very good, or excellent health (Table 4-22). Although the most commonly endorsed
category is fair health, the median category is good health.
The respondent’s health, however, may be better than that of other household members, particularly
for grocery programs since this person was surveyed while out of the home picking up food for the
household. Data on whether any household members are in poor health support this, as statistically
significantly more households have a member other than the respondent in poor health. This holds
true for all households, but particularly for households with at least one child, in which 26.2 percent
of households have a member in poor health, and households with at least one senior, in which
32.6 percent of households have a member in poor health.
75 Seppo Miilunpalo, Ikka Vuori, Pekka Oja, Matti Pasanen, and Helka Urponen. (1997). “Self-Rated Health Status As a Health Measure: The Predictive Value of Self-Reported Health Status on the Use of Physician Services and on Mortality in the Working-Age Population.” Journal of Clinical Epidemiology, 50(5): 517-528.
76 Daniel L. McGee, Youlian Liao, Guichan Cao, and Richard S. Cooper. (1999). “Self-Reported Health Status and Mortality in a Multiethnic US Cohort.” American Journal of Epidemiology, 149(1): 41-46.

Hunger in America 2014 National Report 118
Characteristics of Feeding America Clients and Their Households 4
Table 4-22. Client households by health status of respondent and presence of another
household member in poor health
Health status
Type of program All food
programs Meal Grocery
All households
Respondent’s self-reported status
Excellent 13.7% 9.5% 10.1%
Very good 20.0% 15.6% 15.9%
Good 27.9% 26.3% 26.6%
Fair 24.1% 29.8% 29.0%
Poor 14.3% 18.8% 18.4%
Total 100% 100% 100%
Weighted nonreporting client households 0.2M 0.6M 0.7M
Total weighted N 1.1M 5.4M 5.8M
All households
Another household member in poor health
Yes 7.5% 25.5% 23.9%
No 20.0% 48.5% 46.2%
Live alone 72.5% 26.0% 29.9%
Total 100% 100% 100%
Weighted nonreporting client households 0.2M 0.9M 1.0M
Total weighted N 1.1M 5.4M 5.8M
Households with at least one child
Another household member in poor health
Yes 18.2% 26.5% 26.2%
No 81.8% 73.5% 73.8%
Live alone 0.0% 0.0% 0.0%
Households with at least one senior
Another household member in poor health
Yes 11.3% 34.1% 32.6%
No 24.7% 31.4% 31.0%
Live alone 64.0% 34.5% 36.4%
Data Source: Hunger in America 2014 Client Survey, Q13 and Q13A.
Numbers may not sum to 100% due to rounding.
NOTE: All data were weighted as described in Chapter 2. Percentages reported in tables are calculated from valid responses which
exclude nonresponse and valid skips due to survey item skip patterns. Numbers listed under nonreporting clients include missing data
due to item nonresponse from participating clients. All estimates are weighted to account for program and client sampling as well as
survey nonresponse from nonparticipating food banks, agencies, programs, and clients. Total weighted N reflects the weighted number
of respondents eligible to answer the question. It includes missing data but excludes valid skips. Total weighted N can vary across
tables because of valid skips. Meal program numbers and grocery program numbers do not sum to all food program numbers because
the unduplicated count that forms the basis for the weight for all food programs removes double-counting of clients served by both
types of programs.

Hunger in America 2014 National Report 119
Characteristics of Feeding America Clients and Their Households 4
Looking at select health conditions of all household members (Table 4-23), we see that high blood
pressure is common among client households—more than half (57.8 percent) of all households have
at least one member living with high blood pressure. One third (33.2 percent) of all households
report a member with diabetes.77 Households with at least one senior are particularly affected, with
47.2 percent of households reporting a member with diabetes, and 77.3 percent of households
reporting a member with high blood pressure. The difference in percentage of households affected
between meal and grocery programs is statistically significant: more households using grocery
programs than meal programs had a member suffering from diabetes. An understanding of the
select health conditions experienced by Feeding America clients and their household members is
particularly relevant given that nutrition education and special diets are often needed for appropriate
management of these conditions. The Feeding America network faces an important challenge in
helping their clients manage their health through the nutrition assistance they receive from food
programs.
Table 4-23. Client households with member(s) having select health conditions
Select health conditions
Type of program All food
programs Meal Grocery
All households
Household member with diabetes 23.2% 34.2% 33.2%
Weighted nonreporting client households 0.2M 0.7M 0.8M
Total weighted N 1.1M 5.4M 5.8M
Household member with high blood pressure 51.9% 58.8% 57.8%
Weighted nonreporting client households 0.2M 0.8M 0.8M
Total weighted N 1.1M 5.4M 5.8M
Households with at least one child
Household member with diabetes 18.7% 28.7% 28.4%
Household member with high blood pressure 34.7% 49.8% 49.4%
Households with at least one senior
Household member with diabetes 29.0% 48.0% 47.2%
Household member with high blood pressure 65.1% 77.9% 77.3%
Data Source: Hunger in America 2014 Client Survey, Q14A and Q14B.
NOTE: All data were weighted as described in Chapter 2. Percentages reported in tables are calculated from valid responses which
exclude nonresponse and valid skips due to survey item skip patterns. Numbers listed under nonreporting clients include missing data
due to item nonresponse from participating clients. All estimates are weighted to account for program and client sampling as well as
survey nonresponse from nonparticipating food banks, agencies, programs, and clients. Total weighted N reflects the weighted number
of respondents eligible to answer the question. It includes missing data but excludes valid skips. Total weighted N can vary across
tables because of valid skips. Meal program numbers and grocery program numbers do not sum to all food program numbers because
the unduplicated count that forms the basis for the weight for all food programs removes double-counting of clients served by both
types of programs.
77 Actual presence of these conditions may be underreported, as some clients and their household members may have high blood pressure or diabetes but be undiagnosed.

Hunger in America 2014 National Report 120
Characteristics of Feeding America Clients and Their Households 4
4.4.2 Health Insurance and Unpaid Medical Bills
Illnesses and medical conditions require management and supervision, and medical care can present
a substantial financial challenge. The Client Survey explored whether any member of the clients’
household had health insurance, either private or government sponsored (such as Medicaid or
Medicare),78 and whether the households had any unpaid medical bills (Table 4-24). Across all
households and all program types, 28.6 percent of households contain no members with health
insurance. Lack of health insurance is most common in households with no children or seniors, in
which only 59.4 percent of households include anyone with some type of health insurance.
Households with at least one senior are the most likely to have health insurance, at 81.1 percent of
households, likely due to being eligible for Medicare.79
Many households also face unpaid medical bills—55.1 percent of all households report some
medical debt. Even with insurance, unpaid medical bills can accumulate due to deductibles and
uncovered care. Most household compositions show high levels of unpaid medical bills, but the
burden is highest among households containing at least one child and at least one senior, at
64.9 percent. The group with the lowest rate of unpaid medical bills is households with at least one
senior, in which nearly half (49.6 percent) of households still face unpaid bills.
78 Medicare is available to most people age 65 or older who are citizens or permanent residents of the United States. Medicaid is also available to select others younger than 65 who have disabilities or other qualifying conditions or circumstances. Source: http://www.socialsecurity.gov/pubs/EN-05-10043.pdf
79 The Affordable Care Act, which expands health care insurance coverage options for adults and children, particularly those who previously did not have health insurance, went into effect after the fielding period of the Client Survey. See http://www.hhs.gov/healthcare/facts/timeline/timeline-text.html

Hunger in America 2014 National Report 121
Characteristics of Feeding America Clients and Their Households 4
Table 4-24. Client households in which no one has health insurance, and client households with
unpaid medical bills
Health insurance and unpaid bills
Type of program All food
programs Meal Grocery
All households
Has no health insurance 36.5% 27.7% 28.6%
Weighted nonreporting client households 0.2M 0.6M 0.7M
Total weighted N 1.1M 5.4M 5.8M
Unpaid medical bills 52.5% 55.6% 55.1%
Weighted nonreporting client households 0.2M 0.6M 0.7M
Total weighted N 1.1M 5.4M 5.8M
Households with at least one child
Has no health insurance 14.2% 23.0% 22.7%
Unpaid medical bills 61.4% 59.9% 59.9%
Households with at least one senior
Has no health insurance 18.5% 19.2% 18.9%
Unpaid medical bills 39.0% 50.7% 49.6%
Households with at least one child and one senior
Has no health insurance 10.9% 20.3% 20.3%
Unpaid medical bills 60.0% 65.0% 64.9%
Households with no children or seniors
Has no health insurance 44.7% 38.8% 40.6%
Unpaid medical bills 58.0% 58.2% 57.4%
Data Source: Hunger in America 2014 Client Survey, Q15 and Q24.
NOTE: All data were weighted as described in Chapter 2. Percentages reported in tables are calculated from valid responses which
exclude nonresponse and valid skips due to survey item skip patterns. Numbers listed under nonreporting clients include missing data
due to item nonresponse from participating clients. All estimates are weighted to account for program and client sampling as well as
survey nonresponse from nonparticipating food banks, agencies, programs, and clients. Total weighted N reflects the weighted number
of respondents eligible to answer the question. It includes missing data but excludes valid skips. Total weighted N can vary across
tables because of valid skips. Meal program numbers and grocery program numbers do not sum to all food program numbers because
the unduplicated count that forms the basis for the weight for all food programs removes double-counting of clients served by both
types of programs.
4.4.3 Income and Poverty
All of these health and health insurance needs must be met despite limited income. Although
households use grocery and meal programs for a variety of reasons, many households rely on
charitable food assistance because they are operating with a highly restricted budget and may not
have enough money for food. To allow a detailed picture of the finances of Feeding America client
households, the Client Survey probed household income in both the past month and in the past
12 months. In order to ensure comparability between the Hunger in America (HIA) study and other
nationally-representative assessments of income, the Client Survey used income questions that
appear in the U.S. Census Bureau’s Current Population Survey (CPS) for both monthly and annual
income. While some clients may be able to report annual income, others may more easily recall

Hunger in America 2014 National Report 122
Characteristics of Feeding America Clients and Their Households 4
income received in the last month, a pattern supported by the higher response rate for the monthly
income question (86 percent, see Table 4-25) as compared to annual income question (76 percent,
see Table 4-28).
Self-reported income information is commonly probed on surveys, but is subject to error as
respondents may not recall all sources and amounts of household income, or may choose to skip
such questions for privacy or other personal reasons.80 Although self-administered interviewing,
such as the Audio Computer-Assisted Self-Interviewing (ACASI) used in HIA 2014, reduces
nonresponse to sensitive questions including income, the presence of third parties who may judge
the responses negatively may increase misreporting in those who do respond.81 This may be
particularly salient for HIA 2014 clients who completed surveys at food programs with income
eligibility requirements. Because program staff responsible for eligibility determinations were
present, even if they could not hear responses, clients may have been biased toward providing
underestimates of income to avoid inadvertently disqualifying themselves for services.
We first present monthly household income, by program type and household compositions, to give
a snapshot of the circumstances of client households at the time of the survey (Tables 4-25, 4-26,
4-27). Looking at all households combined (Table 4-25), households of meal program clients are
statistically significantly more likely than those of grocery program clients to report no income at all
in the past month, with 26.5 percent of meal program clients reporting no household income as
compared to 10.1 percent of grocery program clients. Across all food programs, meal and grocery,
11.7 percent report no income in the past month. Median monthly income is $927, which requires
critical budget management to cover all expenses, including but not limited to housing-related costs,
food, clothing, transportation, and medical expenses, for all household members. Households with
at least one child report slightly higher median monthly incomes at $1,106 (Table 4-26). Despite
having slightly higher incomes, however, such households tend to be larger than other household
types; thus, they have more people to support.82
80 Jeffrey C. Moore, Linda L. Stinson, and Edward J. Welniak, Jr. (2000). “Income Measurement Error in Surveys: A Review.” Journal Of Official Statistics-Stockholm, 16(4), 331-362.
81 Roger Tourangeau, and Ting Yan. (2007). “Sensitive Questions in Surveys.” Psychological Bulletin, 133(5), 859-883.
82 Among HIA 2014 client households, households with at least one child have a median household size of four, whereas households with at least one senior and all households have a median household size of two.

Hunger in America 2014 National Report 123
Characteristics of Feeding America Clients and Their Households 4
Table 4-25. All client households by reported monthly income ranges, and monthly household
income as a percentage of the poverty level
Monthly household income
Type of program All food
programs Meal Grocery
Income in the past month
$0 26.5% 10.1% 11.7%
$500 or less 17.2% 12.6% 13.1%
$501 – $1,000 21.2% 30.5% 29.6%
$1,001 – $2,000 18.7% 28.4% 27.4%
$2,001 – $3,000 6.2% 9.4% 9.3%
$3,001 – $4,000 2.4% 3.2% 3.1%
More than $4,000 7.7% 5.7% 5.9%
Total 100% 100% 100%
Median monthly income $649 $946 $927
Weighted nonreporting client households 0.2M 0.8M 0.8M
Total weighted N 1.1M 5.4M 5.8M
As a percentage of the poverty level
0% (no income) 27.1% 10.5% 12.1%
1% – 50% 5.1% 14.9% 14.0%
51% – 75% 14.7% 12.5% 12.7%
76% – 100% 4.7% 12.5% 11.9%
101% – 130% 18.0% 21.5% 20.9%
131% – 150% 0.5% 1.6% 1.5%
151% – 185% 4.4% 11.4% 10.8%
186% or higher 25.5% 15.0% 15.9%
Total 100% 100% 100%
Weighted nonreporting client households 0.2M 0.9M 1.0M
Total weighted N 1.1M 5.4M 5.8M
Data Source: Hunger in America 2014 Client Survey, Q22, Q1.
Numbers may not sum to 100% due to rounding.
Missing data in household size needed to calculate poverty level may result in some differences between income percentages and
poverty level percentages.
Median income was calculated as follows = (lower bound of median interval) + [[((total weighted N)/2) – (cumulative frequency of groups
before the median group)]/(frequency of median group)] *(median group width).
The federal poverty guidelines provide income limits below which households are deemed to be in poverty. Colloquially referred to as the
federal poverty level, the guidelines are updated periodically in the Federal Register by the U.S. Department of Health and Human
Services under the authority of 42 U.S.C. 9902(2). Income limits vary by family size and whether the household resides in the 48
contiguous states (including the District of Columbia), Alaska, or Hawaii. Federal poverty guidelines are not specifically defined for
Puerto Rico. For most household sizes, the 2013 guidelines approximate the Census Bureau’s poverty thresholds for 2012. For this
report, we compared annualized monthly income by household size to the 2013 poverty guidelines found at
http://aspe.hhs.gov/poverty/13poverty.cfm#thresholds.
NOTE: All data were weighted as described in Chapter 2. Percentages reported in tables are calculated from valid responses which
exclude nonresponse and valid skips due to survey item skip patterns. Numbers listed under nonreporting clients include missing data
due to item nonresponse from participating clients. All estimates are weighted to account for program and client sampling as well as
survey nonresponse from nonparticipating food banks, agencies, programs, and clients. Total weighted N reflects the weighted number
of respondents eligible to answer the question. It includes missing data but excludes valid skips. Total weighted N can vary across
tables because of valid skips. Meal program numbers and grocery program numbers do not sum to all food program numbers because
the unduplicated count that forms the basis for the weight for all food programs removes double-counting of clients served by both
types of programs.

Hunger in America 2014 National Report 124
Characteristics of Feeding America Clients and Their Households 4
Table 4-26. Households with at least one child by reported monthly income ranges, and monthly
household income as a percentage of the poverty level
Monthly household income
Type of program All food
programs Meal Grocery
Income in the past month
$0 12.3% 7.8% 7.8%
$500 or less 18.8% 12.7% 12.8%
$501 – $1,000 27.5% 25.8% 26.0%
$1,001 – $2,000 22.6% 32.7% 32.4%
$2,001 – $3,000 9.0% 12.2% 12.2%
$3,001 – $4,000 3.2% 4.0% 4.0%
More than $4,000 6.6% 4.8% 4.8%
Total 100% 100% 100%
Median monthly income $844 $1,116 $1,106
Weighted nonreporting client households 0.0M 0.1M 0.1M
Total weighted N 0.1M 2.0M 2.0M
As a percentage of the poverty level
0% (no income) 12.3% 7.8% 7.8%
1% – 50% 23.9% 23.6% 23.6%
51% – 75% 8.3% 15.5% 15.2%
76% – 100% 22.6% 14.9% 15.3%
101% – 130% 12.9% 19.6% 19.4%
131% – 150% 2.7% 3.4% 3.4%
151% – 185% 8.8% 8.7% 8.8%
186% or higher 8.6% 6.5% 6.5%
Total 100% 100% 100%
Weighted nonreporting client households 0.0M 0.1M 0.1M
Total weighted N 0.1M 2.0M 2.0M
Data Source: Hunger in America 2014 Client Survey, Q22, Q1.
Numbers may not sum to 100% due to rounding.
Missing data in household size needed to calculate poverty level may result in some differences between income percentages and
poverty level percentages.
Median income was calculated as follows = (lower bound of median interval) + [[((total weighted N)/2) – (cumulative frequency of groups
before the median group)]/(frequency of median group)] *(median group width).
The federal poverty guidelines provide income limits below which households are deemed to be in poverty. Colloquially referred to as the
federal poverty level, the guidelines are updated periodically in the Federal Register by the U.S. Department of Health and Human
Services under the authority of 42 U.S.C. 9902(2). Income limits vary by family size and whether the household resides in the 48
contiguous states (including the District of Columbia), Alaska, or Hawaii. Federal poverty guidelines are not specifically defined for
Puerto Rico. For most household sizes, the 2013 guidelines approximate the Census Bureau’s poverty thresholds for 2012. For this
report, we compared annualized monthly income by household size to the 2013 poverty guidelines found at
http://aspe.hhs.gov/poverty/13poverty.cfm#thresholds.
NOTE: All data were weighted as described in Chapter 2. Percentages reported in tables are calculated from valid responses which
exclude nonresponse and valid skips due to survey item skip patterns. Numbers listed under nonreporting clients include missing data
due to item nonresponse from participating clients. All estimates are weighted to account for program and client sampling as well as
survey nonresponse from nonparticipating food banks, agencies, programs, and clients. Total weighted N reflects the weighted number
of respondents eligible to answer the question. It includes missing data but excludes valid skips. Total weighted N can vary across
tables because of valid skips. Meal program numbers and grocery program numbers do not sum to all food program numbers because
the unduplicated count that forms the basis for the weight for all food programs removes double-counting of clients served by both
types of programs.

Hunger in America 2014 National Report 125
Characteristics of Feeding America Clients and Their Households 4
Table 4-27. Households with at least one senior by reported monthly income ranges, and
monthly household income as a percentage of the poverty level
Monthly household income
Type of program All food
programs Meal Grocery
Income in the past month
$0 10.2% 5.3% 5.4%
$500 or less 7.9% 7.2% 7.2%
$501 – $1,000 26.2% 33.0% 32.6%
$1,001 – $2,000 33.3% 33.4% 33.0%
$2,001 – $3,000 8.7% 10.5% 10.6%
$3,001 – $4,000 4.6% 3.5% 3.7%
More than $4,000 9.1% 7.2% 7.6%
Total 100% 100% 100%
Median monthly income $1,173 $1,136 $1,146
Weighted nonreporting client households 0.0M 0.1M 0.1M
Total weighted N 0.2M 1.7M 1.7M
As a percentage of the poverty level
0% (no income) 10.5% 5.5% 5.6%
1% – 50% 1.9% 7.7% 7.3%
51% – 75% 8.2% 9.0% 9.0%
76% – 100% 3.8% 11.7% 11.2%
101% – 130% 27.9% 25.6% 25.4%
131% – 150% 0.2% 1.4% 1.4%
151% – 185% 8.1% 16.4% 15.8%
186% or higher 39.3% 22.7% 24.2%
Total 100% 100% 100%
Weighted nonreporting client households 0.0M 0.2M 0.2M
Total weighted N 0.2M 1.7M 1.7M
Data Source: Hunger in America 2014 Client Survey, Q22, Q1.
Numbers may not sum to 100% due to rounding.
Missing data in household size needed to calculate poverty level may result in some differences between income percentages and
poverty level percentages.
Median income was calculated as follows = (lower bound of median interval) + [[((total weighted N)/2) – (cumulative frequency of groups
before the median group)]/(frequency of median group)] *(median group width).
The federal poverty guidelines provide income limits below which households are deemed to be in poverty. Colloquially referred to as the
federal poverty level, the guidelines are updated periodically in the Federal Register by the U.S. Department of Health and Human
Services under the authority of 42 U.S.C. 9902(2). Income limits vary by family size and whether the household resides in the 48
contiguous states (including the District of Columbia), Alaska, or Hawaii. Federal poverty guidelines are not specifically defined for
Puerto Rico. For most household sizes, the 2013 guidelines approximate the Census Bureau’s poverty thresholds for 2012. For this
report, we compared annualized monthly income by household size to the 2013 poverty guidelines found at
http://aspe.hhs.gov/poverty/13poverty.cfm#thresholds.
NOTE: All data were weighted as described in Chapter 2. Percentages reported in tables are calculated from valid responses which
exclude nonresponse and valid skips due to survey item skip patterns. Numbers listed under nonreporting clients include missing data
due to item nonresponse from participating clients. All estimates are weighted to account for program and client sampling as well as
survey nonresponse from nonparticipating food banks, agencies, programs, and clients. Total weighted N reflects the weighted number
of respondents eligible to answer the question. It includes missing data but excludes valid skips. Total weighted N can vary across
tables because of valid skips. Meal program numbers and grocery program numbers do not sum to all food program numbers because
the unduplicated count that forms the basis for the weight for all food programs removes double-counting of clients served by both
types of programs.

Hunger in America 2014 National Report 126
Characteristics of Feeding America Clients and Their Households 4
The federal poverty guidelines are income levels used to determine a household’s eligibility for
federal assistance programs such as the Supplemental Nutrition Assistance Program (SNAP) and the
Special Supplemental Nutrition Program for Women, Infants, and Children (WIC), taking into
account both income and household size. In 2013, the year in which these data were collected, the
federal poverty guideline for a family of four living in the 48 contiguous states or the District of
Columbia was $23,550 per year.83 Looking at monthly income as a percentage of the poverty level,
across all households and all food program types, 50.7 percent of Feeding America client
households fall at or below 100 percent of the poverty level. These findings are highly similar for
meal and grocery program client households. Among households with at least one child,
61.9 percent fall at or below 100 percent of poverty, and among households with at least one senior
the figure is 33.1 percent. This demonstrates the depth of need among Feeding America clients’
households.
The Client Survey also probed annual income by asking respondents to report total household
income during the previous 12 months. In addition to presenting income ranges, we calculate both
median annual income, and annual income as a percentage of the federal poverty guideline
(Tables 4-28, 4-29, 4-30).
Across all households and all food program types (Table 4-28), 10.2 percent of client households
report no income in the previous 12 months. Meal program client households, as compared to those
at grocery programs, are statistically significantly more likely to report no income. Households with
at least one child (Table 4-29) and households with at least one senior (Table 4-30) report less
extreme circumstances, with 6.3 percent and 4.5 percent respectively reporting no income, and no
statistically significant differences across meal and grocery programs. Median annual income across
all household and food program types is $9,175, and as with monthly income, the median is higher
for households with at least one child and households with at least one senior. According to the
CPS, in 2012 the median annual income for U.S. households was $51,017,84 more than five times
higher the median income of Feeding America client households.
83 Poverty-level guidelines are higher for Alaska and Hawaii, where cost of living is also higher. http://aspe.hhs.gov/poverty/13poverty.cfm. Puerto Rico does not have federally designated poverty-level guidelines, but because no participants from Puerto Rico were included in HIA 2014 weighted estimates that include Puerto Rico were achieved through nonresponse adjustments to the data rather than calculation of poverty levels for individual responses.
84 DeNavas-Walt et al., “Income, Poverty, and Health Insurance Coverage in the United States: 2012.”

Hunger in America 2014 National Report 127
Characteristics of Feeding America Clients and Their Households 4
Table 4-28. All client households by reported annual income ranges, and annual household
income as a percentage of the poverty level
Annual household income
Type of program All food
programs Meal Grocery
Income in the past 12 months
$0 24.9% 8.6% 10.2%
$5,000 or less 27.1% 25.2% 25.0%
$5,001 – $10,000 15.0% 17.9% 17.8%
$10,001 – $15,000 12.8% 17.3% 16.5%
$15,001 – $20,000 6.1% 11.6% 11.1%
$20,001 – $25,000 4.6% 8.0% 7.9%
$25,001 – $30,000 3.0% 4.8% 4.7%
$30,001 – $35,000 2.0% 3.1% 3.1%
$35,001 – $50,000 1.8% 2.6% 2.6%
More than $50,000 2.6% 1.0% 1.2%
Total 100% 100% 100%
Median annual income $4,615 $9,532 $9,175
Weighted nonreporting client households 0.3M 1.3M 1.4M
Total weighted N 1.1M 5.4M 5.8M
As a percentage of the poverty level
0% (no income) 25.4% 8.9% 10.5%
1% – 50% 28.0% 31.3% 30.6%
51% – 75% 5.9% 13.5% 13.0%
76% – 100% 12.3% 18.5% 17.9%
101% – 130% 3.3% 11.0% 10.3%
131% – 150% 9.3% 6.2% 6.2%
151% – 185% 5.3% 5.8% 5.7%
186% or higher 10.5% 4.9% 5.7%
Total 100% 100% 100%
Weighted nonreporting client households 0.3M 1.4M 1.6M
Total weighted N 1.1M 5.4M 5.8M
Data Source: Hunger in America 2014 Client Survey, Q23, Q1.
Numbers may not sum to 100% due to rounding.
Missing data in household size needed to calculate poverty level may result in some differences between income percentages and
poverty level percentages.
Median income was calculated as follows = (lower bound of median interval) + [[((total weighted N)/2) – (cumulative frequency of groups
before the median group)]/(frequency of median group)] *(median group width).
The federal poverty guidelines provide income limits below which households are deemed to be in poverty. Colloquially referred to as the
federal poverty level, the guidelines are updated periodically in the Federal Register by the U.S. Department of Health and Human
Services under the authority of 42 U.S.C. 9902(2). Income limits vary by family size and whether the household resides in the 48
contiguous states (including the District of Columbia), Alaska, or Hawaii. Federal poverty guidelines are not specifically defined for
Puerto Rico. For most household sizes, the 2013 guidelines approximate the Census Bureau’s poverty thresholds for 2012. For this
report, we compared annual income by household size to the 2013 poverty guidelines found at
http://aspe.hhs.gov/poverty/13poverty.cfm#thresholds.
NOTE: All data were weighted as described in Chapter 2. Percentages reported in tables are calculated from valid responses which
exclude nonresponse and valid skips due to survey item skip patterns. Numbers listed under nonreporting clients include missing data
due to item nonresponse from participating clients. All estimates are weighted to account for program and client sampling as well as
survey nonresponse from nonparticipating food banks, agencies, programs, and clients. Total weighted N reflects the weighted number
of respondents eligible to answer the question. It includes missing data but excludes valid skips. Total weighted N can vary across
tables because of valid skips. Meal program numbers and grocery program numbers do not sum to all food program numbers because
the unduplicated count that forms the basis for the weight for all food programs removes double-counting of clients served by both
types of programs.

Hunger in America 2014 National Report 128
Characteristics of Feeding America Clients and Their Households 4
Table 4-29. Client households with at least one child by reported annual income ranges, and
annual household income as a percentage of the poverty level
Annual household income
Type of program All food
programs Meal Grocery
Income in the past 12 months
$0 9.6% 6.3% 6.3%
$5,000 or less 21.4% 25.1% 24.8%
$5,001 – $10,000 30.8% 13.0% 13.9%
$10,001 – $15,000 14.4% 14.8% 14.6%
$15,001 – $20,000 3.6% 13.2% 12.9%
$20,001 – $25,000 5.0% 10.4% 10.3%
$25,001 – $30,000 4.4% 7.3% 7.2%
$30,001 – $35,000 3.9% 4.7% 4.7%
$35,001 – $50,000 3.8% 4.0% 4.0%
More than $50,000 3.0% 1.2% 1.2%
Total 100% 100% 100%
Median annual income $8,085 $11,875 $11,721
Weighted nonreporting client households 0.0M 0.3M 0.3M
Total weighted N 0.1M 2.0M 2.0M
As a percentage of the poverty level
0% (no income) 9.6% 6.3% 6.3%
1% – 50% 27.0% 36.7% 36.2%
51% – 75% 37.3% 18.5% 19.1%
76% – 100% 7.2% 15.6% 15.4%
101% – 130% 7.9% 14.4% 14.2%
131% – 150% 1.1% 1.7% 1.7%
151% – 185% 4.3% 3.9% 4.0%
186% or higher 5.6% 2.9% 3.0%
Total 100% 100% 100%
Weighted nonreporting client households 0.0M 0.3M 0.3M
Total weighted N 0.1M 2.0M 2.0M
Data Source: Hunger in America 2014 Client Survey, Q23, Q1.
Numbers may not sum to 100% due to rounding.
Missing data in household size needed to calculate poverty level may result in some differences between income percentages and
poverty level percentages.
Median income was calculated as follows = (lower bound of median interval) + [[((total weighted N)/2) – (cumulative frequency of groups
before the median group)]/(frequency of median group)] *(median group width).
The federal poverty guidelines provide income limits below which households are deemed to be in poverty. Colloquially referred to as the
federal poverty level, the guidelines are updated periodically in the Federal Register by the U.S. Department of Health and Human
Services under the authority of 42 U.S.C. 9902(2). Income limits vary by family size and whether the household resides in the 48
contiguous states (including the District of Columbia), Alaska, or Hawaii. Federal poverty guidelines are not specifically defined for
Puerto Rico. For most household sizes, the 2013 guidelines approximate the Census Bureau’s poverty thresholds for 2012. For this
report, we compared annual income by household size to the 2013 poverty guidelines found at
http://aspe.hhs.gov/poverty/13poverty.cfm#thresholds.
NOTE: All data were weighted as described in Chapter 2. Percentages reported in tables are calculated from valid responses which
exclude nonresponse and valid skips due to survey item skip patterns. Numbers listed under nonreporting clients include missing data
due to item nonresponse from participating clients. All estimates are weighted to account for program and client sampling as well as
survey nonresponse from nonparticipating food banks, agencies, programs, and clients. Total weighted N reflects the weighted number
of respondents eligible to answer the question. It includes missing data but excludes valid skips. Total weighted N can vary across
tables because of valid skips. Meal program numbers and grocery program numbers do not sum to all food program numbers because
the unduplicated count that forms the basis for the weight for all food programs removes double-counting of clients served by both
types of programs.

Hunger in America 2014 National Report 129
Characteristics of Feeding America Clients and Their Households 4
Table 4-30. Client households with at least one senior by reported annual income ranges, and
annual household income as a percentage of the poverty level
Annual household income
Type of program All food
programs Meal Grocery
Income in the past 12 months
$0 7.9% 4.5% 4.5%
$5,000 or less 26.0% 21.0% 20.8%
$5,001 – $10,000 14.7% 20.5% 20.5%
$10,001 – $15,000 24.3% 22.3% 22.0%
$15,001 – $20,000 8.8% 13.2% 13.0%
$20,001 – $25,000 5.3% 9.2% 9.2%
$25,001 – $30,000 4.2% 3.7% 3.8%
$30,001 – $35,000 2.1% 2.9% 2.9%
$35,001 – $50,000 2.6% 2.1% 2.2%
More than $50,000 4.1% 0.7% 1.1%
Total 100% 100% 100%
Median annual income $10,300 $10,920 $10,955
Weighted nonreporting client households 0.0M 0.3M 0.4M
Total weighted N 0.2M 1.7M 1.7M
As a percentage of the poverty level
0% (no income) 8.1% 4.7% 4.7%
1% – 50% 26.7% 24.8% 24.5%
51% – 75% 4.4% 11.9% 11.5%
76% – 100% 14.6% 23.2% 23.1%
101% – 130% 5.5% 11.6% 11.2%
131% – 150% 19.1% 10.2% 10.3%
151% – 185% 6.6% 8.2% 8.2%
186% or higher 14.8% 5.4% 6.6%
Total 100% 100% 100%
Weighted nonreporting client households 0.0M 0.4M 0.4M
Total weighted N 0.2M 1.7M 1.7M
Data Source: Hunger in America 2014 Client Survey, Q23, Q1.
Numbers may not sum to 100% due to rounding.
Missing data in household size needed to calculate poverty level may result in some differences between income percentages and
poverty level percentages.
Median income was calculated as follows = (lower bound of median interval) + [[((total weighted N)/2) – (cumulative frequency of groups
before the median group)]/(frequency of median group)] *(median group width).
The federal poverty guidelines provide income limits below which households are deemed to be in poverty. Colloquially referred to as the
federal poverty level, the guidelines are updated periodically in the Federal Register by the U.S. Department of Health and Human
Services under the authority of 42 U.S.C. 9902(2). Income limits vary by family size and whether the household resides in the 48
contiguous states (including the District of Columbia), Alaska, or Hawaii. Federal poverty guidelines are not specifically defined for
Puerto Rico. For most household sizes, the 2013 guidelines approximate the U.S. Census Bureau’s poverty thresholds for 2012. For this
report, we compared annual income by household size to the 2013 poverty guidelines found at
http://aspe.hhs.gov/poverty/13poverty.cfm#thresholds.
NOTE: All data were weighted as described in Chapter 2. Percentages reported in tables are calculated from valid responses which
exclude nonresponse and valid skips due to survey item skip patterns. Numbers listed under nonreporting clients include missing data
due to item nonresponse from participating clients. All estimates are weighted to account for program and client sampling as well as
survey nonresponse from nonparticipating food banks, agencies, programs, and clients. Total weighted N reflects the weighted number
of respondents eligible to answer the question. It includes missing data but excludes valid skips. Total weighted N can vary across
tables because of valid skips. Meal program numbers and grocery program numbers do not sum to all food program numbers because
the unduplicated count that forms the basis for the weight for all food programs removes double-counting of clients served by both
types of programs.

Hunger in America 2014 National Report 130
Characteristics of Feeding America Clients and Their Households 4
Looking at annual income as a percentage of the poverty level, across all households and all program
types, 72.0 percent of Feeding America client households fall at or below 100 percent of the poverty
level. These findings are almost identical for meal and grocery programs. Among households with at
least one child, 77.0 percent fall at or below 100 percent of poverty, and among households with at
least one senior the figure is 63.8 percent.
Reviewing Feeding America client households’ income as a percentage of the poverty level is also
relevant when considering a household’s potential income eligibility for federal nutrition assistance
programs, such as SNAP and WIC. Although eligibility for federal nutrition assistance programs is
contingent on a variety of criteria not included here, including household size, assets, and citizenship
status, household income can provide a directional indicator of a household’s potential program
eligibility. Across all food programs, both meal and grocery, and all household types, 82.3 percent of
households fall at or below 130 percent of the poverty level, which is the federal income guideline
for SNAP eligibility. Additionally, 11.9 percent of households fall between 130 and 185 percent of
the poverty level. Although these households may be ineligible for SNAP, they may be eligible for
the National School Lunch Program (NSLP), School Breakfast Program (SBP), and WIC (if there
are children or pregnant women in the household), or the Emergency Food Assistance Program
(TEFAP). While 5.7 percent of households report incomes at 186 percent or above the poverty
guideline, and thus are likely ineligible for federal assistance programs, it is important to note that
these households are still frequenting charitable food programs. A household may have income
and/or assets that place them just above the eligibility threshold for federal program support,
leaving the charitable sector as one of the few sources of food assistance that they receive. These
income distributions demonstrate that charitable food assistance is utilized even by households
whose incomes exceed the federal poverty line thresholds.
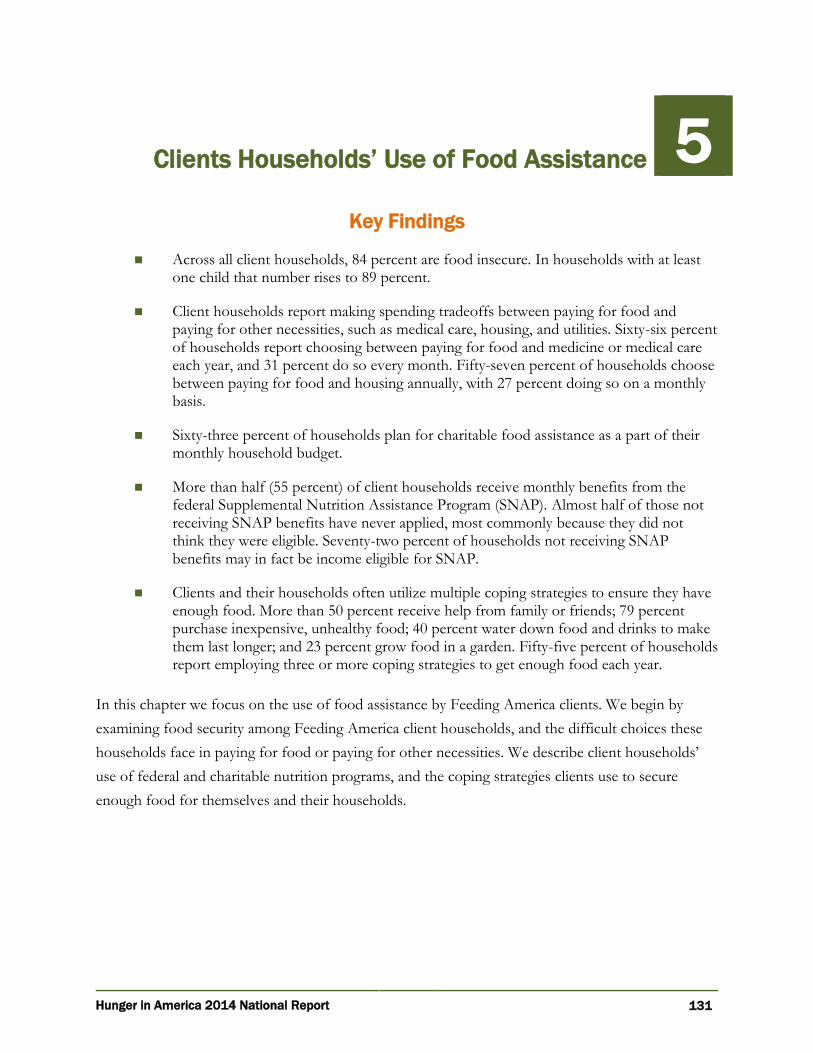
Hunger in America 2014 National Report 131
Key Findings
Across all client households, 84 percent are food insecure. In households with at least one child that number rises to 89 percent.
Client households report making spending tradeoffs between paying for food and paying for other necessities, such as medical care, housing, and utilities. Sixty-six percent of households report choosing between paying for food and medicine or medical care each year, and 31 percent do so every month. Fifty-seven percent of households choose between paying for food and housing annually, with 27 percent doing so on a monthly basis.
Sixty-three percent of households plan for charitable food assistance as a part of their monthly household budget.
More than half (55 percent) of client households receive monthly benefits from the federal Supplemental Nutrition Assistance Program (SNAP). Almost half of those not receiving SNAP benefits have never applied, most commonly because they did not think they were eligible. Seventy-two percent of households not receiving SNAP benefits may in fact be income eligible for SNAP.
Clients and their households often utilize multiple coping strategies to ensure they have enough food. More than 50 percent receive help from family or friends; 79 percent purchase inexpensive, unhealthy food; 40 percent water down food and drinks to make them last longer; and 23 percent grow food in a garden. Fifty-five percent of households report employing three or more coping strategies to get enough food each year.
In this chapter we focus on the use of food assistance by Feeding America clients. We begin by
examining food security among Feeding America client households, and the difficult choices these
households face in paying for food or paying for other necessities. We describe client households’
use of federal and charitable nutrition programs, and the coping strategies clients use to secure
enough food for themselves and their households.
Clients Households’ Use of Food Assistance 5

Hunger in America 2014 National Report 132
Clients Households’ Use of Food Assistance 5
5.1 Securing Enough Food for the Household
The use of food programs and difficulty getting enough food to feed one’s household are likely
deeply intertwined. Households that experience limitations in access to adequate food to the extent
that it causes changes in diet or reduced food intake are deemed food insecure.85 According to the
U.S. Department of Agriculture, 17.6 million or 14.5 percent of U.S. households were food insecure
in 2012, including 7.8 million households with children.86 In this section, we examine challenges
Feeding America client households face in providing food for household members, including the
level of food insecurity of client households, the tradeoffs they make to secure enough food, and the
role charitable food assistance plays in their monthly plan to secure food.
5.1.1 Household Food Security Status
Documenting the extent of household food insecurity through surveys is an important part of
understanding the issue of hunger. In survey research that covers a range of topics, however, the
detailed measures of food security may present too much burden for respondents. In the Client
Survey, we employed the 6-item food security module designed by the Economic Research Service
of the U.S. Department of Agriculture.87 This brief survey module has the advantage of reducing the
burden on respondents and although it is broadly comparable to the longer 18-item module, it is
somewhat less precise. The 6-item module permits categorization of households as food secure or food
insecure. Households that are food secure have access at all times to enough food for a healthy, active
lifestyle; households that are food insecure have limited or uncertain access to adequate food due to a
lack of money or other resources.
Many client households report struggling with food security in the past 12 months (Table 5-1).
Looking at all households and all food program types, 83.8 classify as food insecure. Food insecurity
is highest in households with at least one child, affecting 88.8 percent of those households. The
lowest rate of food insecurity is among households with at least one senior, yet still 76.2 percent of
client households with seniors are food insecure. Among all client households, as well as households
85 U.S. Department of Agriculture, Economic Research Service. http://www.ers.usda.gov/topics/food-nutrition-assistance/food-security-in-the-us/definitions-of-food-security.aspx
86 Coleman-Jensen et al., “Household Food Security in the United States in 2012.”
87 U.S. Department of Agriculture, Economic Research Service. http://www.ers.usda.gov/topics/food-nutrition-assistance/food-security-in-the-us/survey-tools.aspx#six

Hunger in America 2014 National Report 133
Clients Households’ Use of Food Assistance 5
with seniors and households with no children or seniors, grocery program client households are
statistically significantly88 more likely than meal program client households to be food insecure—
85.3 percent of grocery program client households are food insecure, compared to 75.8 percent of
meal program client households. Overall, it is apparent that many households served by the Feeding
America network struggle to find sufficient nutritious foods.
Table 5-1. Client households by level of food security
Food security
Type of program All food
programs Meal Grocery
All households
Food Secure 24.2% 14.7% 16.2%
Food Insecure 75.8% 85.3% 83.8%
Total 100% 100% 100%
Weighted nonreporting households 0.2M 0.7M 0.8M
Total weighted N 1.1M 5.4M 5.8M
Households with at least one child
Food Secure 15.9% 10.9% 11.2%
Food Insecure 84.1% 89.1% 88.8%
Households with at least one senior
Food Secure 38.6% 21.6% 23.8%
Food Insecure 61.4% 78.4% 76.2%
Households with at least one child and one senior
Food Secure 20.7% 13.1% 13.3%
Food Insecure 79.3% 87.0% 86.7%
Households with no children or seniors
Food Secure 21.0% 12.0% 13.9%
Food Insecure 79.0% 88.0% 86.1%
Data Source: Hunger in America 2014 Client Survey, Q37A, Q37B, Q38, Q38A, Q39, and Q40.
Numbers may not sum to 100% due to rounding.
NOTE: All data were weighted as described in Chapter 2. Percentages reported in tables are calculated from valid responses which
exclude nonresponse and valid skips due to survey item skip patterns. Numbers listed under nonreporting clients include missing data
due to item nonresponse from participating clients. All estimates are weighted to account for program and client sampling as well as
survey nonresponse from nonparticipating food banks, agencies, programs, and clients. Total weighted N reflects the weighted number
of respondents eligible to answer the question. It includes missing data but excludes valid skips. Total weighted N can vary across
tables because of valid skips. Meal program numbers and grocery program numbers do not sum to all food program numbers because
the unduplicated count that forms the basis for the weight for all food programs removes double-counting of clients served by both
types of programs.
Although most client households are food insecure, there are a variety of reasons why some of
Feeding America’s client households may identify as food secure. Respondents may take into
account the food they receive through the charitable food system or federal programs like SNAP
when they are answering the questions on the food security module. This could indicate that their
food secure status is contingent on the help they receive. Additionally, households may make
88 All statistical significance in the HIA 2014 report is calculated based on a 90 percent confidence interval.

Hunger in America 2014 National Report 134
Clients Households’ Use of Food Assistance 5
tradeoffs to ensure that they have enough food on the table, as discussed in the next section of this
report. Furthermore, HIA 2014 includes non-emergency programs in its scope, thus capturing
clients who are in need but may not classify as food insecure. A food secure status does not indicate
a lack of need for charitable feeding support.
5.1.2 Making Difficult Decisions about Buying Food vs. Paying for Other
Necessities
We can learn more about the challenges faced by Feeding America clients by looking at the
decisions their households make when confronting choices between paying for food and paying for
other essentials. These dilemmas can put households in the position of choosing between competing
necessities.
Across all food program types, the majority of client households report having to choose between
paying for food and paying for medical care (65.9 percent), utilities (69.3 percent), housing
(57.1 percent), or transportation (66.5 percent) at some point in the past 12 months (Table 5-2).
Households making these tradeoffs most often report doing so every month. Households make
choices between food and educational expenses least frequently, perhaps because not all households
contain students, although 30.5 percent of households have still found themselves choosing between
food and education in the past 12 months. The households of clients visiting meal programs seem to
be making these hard choices less often than those at grocery programs, although this may be
because some meal programs are residential and thus reduce the need for individual choices between
food and competing necessities.

Hunger in America 2014 National Report 135
Clients Households’ Use of Food Assistance 5
Table 5-2. Client households reporting frequency of choosing between food and other
necessities in the past 12 months
How often in the past 12 months, did you or your
household have to choose between…
Type of program All food
programs Meal Grocery
Paying for food and paying for medicine/medical care
Ever 52.8% 67.8% 65.9%
Every month 21.5% 31.8% 30.8%
Some months during the year 19.8% 23.8% 23.3%
1 or 2 times a year 11.5% 12.2% 11.8%
Never 47.2% 32.3% 34.2%
Total 100% 100% 100%
Weighted nonreporting client households 0.1M 0.2M 0.2M
Total weighted N 1.1M 5.4M 5.8M
Paying for food and paying for utilities
Ever 51.1% 71.7% 69.3%
Every month 23.3% 34.7% 33.6%
Some months during the year 17.8% 24.6% 23.8%
1 or 2 times a year 10.0% 12.4% 11.9%
Never 48.9% 28.3% 30.7%
Total 100% 100% 100%
Weighted nonreporting client households 0.1M 0.4M 0.5M
Total weighted N 1.1M 5.4M 5.8M
Paying for food and paying for housing
Ever 46.6% 58.8% 57.1%
Every month 23.1% 27.9% 27.2%
Some months during the year 13.9% 20.0% 19.5%
1 or 2 times a year 9.6% 10.9% 10.4%
Never 53.4% 41.3% 42.8%
Total 100% 100% 100%
Weighted nonreporting client households 0.1M 0.4M 0.4M
Total weighted N 1.1M 5.4M 5.8M
Paying for food and paying for transportation
Ever 47.6% 68.7% 66.5%
Every month 23.8% 35.3% 34.1%
Some months during the year 15.1% 22.6% 21.9%
1 or 2 times a year 8.7% 10.8% 10.5%
Never 52.4% 31.2% 33.5%
Total 100% 100% 100%
Weighted nonreporting client households 0.1M 0.4M 0.4M
Total weighted N 1.1M 5.4M 5.8M

Hunger in America 2014 National Report 136
Clients Households’ Use of Food Assistance 5
Table 5-2. Client households reporting frequency of choosing between food and other
necessities in the past 12 months (continued)
How often in the past 12 months, did you or your
household have to choose between…
Type of program All food
programs Meal Grocery
Paying for food and paying for education expenses
Ever 22.0% 31.7% 30.5%
Every month 9.3% 14.8% 14.1%
Some months during the year 7.0% 10.3% 10.1%
1 or 2 times a year 5.7% 6.6% 6.3%
Never 77.9% 68.3% 69.5%
Total 100% 100% 100%
Weighted nonreporting client households 0.1M 0.4M 0.5M
Total weighted N 1.1M 5.4M 5.8M
Data Source: Hunger in America 2014 Client Survey, Q25, Q26, Q27, Q28, and Q29.
Numbers may not sum to 100% due to rounding.
NOTE: All data were weighted as described in Chapter 2. Percentages reported in tables are calculated from valid responses which
exclude nonresponse and valid skips due to survey item skip patterns. Numbers listed under nonreporting clients include missing data
due to item nonresponse from participating clients. All estimates are weighted to account for program and client sampling as well as
survey nonresponse from nonparticipating food banks, agencies, programs, and clients. Total weighted N reflects the weighted number
of respondents eligible to answer the question. It includes missing data but excludes valid skips. Total weighted N can vary across
tables because of valid skips. Meal program numbers and grocery program numbers do not sum to all food program numbers because
the unduplicated count that forms the basis for the weight for all food programs removes double-counting of clients served by both
types of programs.
5.1.3 Needing to Plan for Food Assistance to Meet a Monthly Budget
Although charitable food assistance is often seen as an emergency resource, many clients who have
persistent difficulty securing food for their households plan to incorporate charitable assistance into
their overall monthly strategy for obtaining food. Although some clients report seeking assistance on
an emergency basis if or when food runs out, the majority plan for charitable food assistance as an
element of their monthly household budgets (Table 5-3).

Hunger in America 2014 National Report 137
Clients Households’ Use of Food Assistance 5
Table 5-3. Client households reporting different strategies for food assistance
Planned use of programs
Type of program All food
programs Meal Grocery
All households
I usually wait to come until I run out of food 38.5% 36.8% 36.8%
I plan to get food here on a regular basis 61.5% 63.2% 63.2%
Total 100% 100% 100%
Weighted nonreporting client households 0.3M 0.9M 1.0M
Total weighted N 1.1M 5.4M 5.8M
Households with at least one child
I usually wait to come until I run out of food 46.5% 42.9% 43.0%
I plan to get food here on a regular basis 53.5% 57.1% 57.0%
Households with at least one senior
I usually wait to come until I run out of food 23.9% 24.2% 24.3%
I plan to get food here on a regular basis 76.1% 75.8% 75.7%
Households with at least one child and one senior
I usually wait to come until I run out of food 30.6% 29.2% 29.2%
I plan to get food here on a regular basis 69.4% 70.8% 70.8%
Households with no children or seniors
I usually wait to come until I run out of food 42.3% 40.2% 40.6%
I plan to get food here on a regular basis 57.7% 59.8% 59.4%
Data Source: Hunger in America 2014 Client Survey, Q41.
Numbers may not sum to 100% due to rounding.
NOTE: All data were weighted as described in Chapter 2. Percentages reported in tables are calculated from valid responses which
exclude nonresponse and valid skips due to survey item skip patterns. Numbers listed under nonreporting clients include missing data
due to item nonresponse from participating clients. All estimates are weighted to account for program and client sampling as well as
survey nonresponse from nonparticipating food banks, agencies, programs, and clients. Total weighted N reflects the weighted number
of respondents eligible to answer the question. It includes missing data but excludes valid skips. Total weighted N can vary across
tables because of valid skips. Meal program numbers and grocery program numbers do not sum to all food program numbers because
the unduplicated count that forms the basis for the weight for all food programs removes double-counting of clients served by both
types of programs.
Across all households, 63.2 percent of households plan to get food at meal or grocery programs on a
regular basis to help with their monthly food budget. For such households, charitable food
assistance is not just a safety net, but an integral part of planning for monthly food. Households with
at least one senior are statistically significantly more likely, in comparison to all households, to plan
for program visits with 75.7 percent planning visits on a regular basis rather than waiting for food to
run out.
5.2 Client Households’ Use of Other Food Assistance
Households receiving charitable food assistance through the Feeding America network may also get
assistance from other nutrition programs. Survey respondents were asked about household
participation in the largest federal food assistance programs, including SNAP and the Special

Hunger in America 2014 National Report 138
Clients Households’ Use of Food Assistance 5
Supplemental Nutrition Program for Women, Infants, and Children (WIC). Additionally, those in
households with children were asked about participation in the free and reduced-priced school lunch
and school breakfast programs, afterschool snack and meal programs, and BackPack weekend food
programs that provide children with nutritious and easy-to-prepare food for weekend consumption.
SNAP is the largest federal nutrition assistance program. Eligible households receive their monthly
SNAP benefit allotment on an electronic benefits (EBT) card. While some of the eligibility and
participation rules vary by state, eligibility is generally limited to households with gross income below
130 percent of the poverty line ($23,550 for a family of four in 2013).89 In some states, eligible
households must pass an asset test, with financial assets limited to $2,000 for nonelderly households
and $3,250 for elderly and disabled households. SNAP benefit amounts are based on the Thrifty
Food Plan (TFP), and families with no net income after allowable deductions receive the maximum
allotment, the full cost of the TFP for their household size. Most SNAP households have income
and receive a benefit equal to the difference between the maximum allotment and 30 percent of
their net income.90
Other large federal and charitable food assistance programs focus on households with pregnant and
post-partum women and children.91 WIC provides supplemental foods for low-income pregnant and
post-partum women and children up to age five who are at nutritional risk. WIC eligibility restricts
benefits to families with incomes below 185 percent of the federal poverty guidelines (states may use
lower income cut offs). Low-income households with children may also qualify for a free or
reduced-price lunch through the National School Lunch Program (NSLP) and/or a free or reduced
price breakfast through the School Breakfast Program (SBP), both federal programs.92 Afterschool
snacks and meals, as well as summer meals, are reimbursable through federal programs, Child and
Adult Care Food Program (CACFP) and Summer Food Service Program (SFSP), respectively;
89 Most states, including 43 in 2013, use SNAP’s optional Broad-Based Categorical Eligibility rules. These rules confer SNAP eligibility to those receiving a Temporary Assistance for Needy Families-funded non-cash service such as a brochure about assistance programs. These states typically apply a gross income eligibility limit that ranges between 130 and 200 percent of the federal poverty guideline. See Elizabeth Laird and Carole Trippe, (February 2014). “Programs Conferring Categorical Eligibility for SNAP: State Policies and the Number and Characteristics of Households Affected.” Final Report to the USDA. Washington, DC: Mathematica Policy Research.
90 See www.fns.usda.gov/snap/eligibility#Deductions? for details on deductions.
91 The federal government offers additional, smaller, nutrition programs. See www.fns.usda.gov/programs-and-services for a full listing.
92 Families with incomes below 130 percent of the federal poverty level qualify for a free lunch or breakfast and families with incomes between 130 and 185 percent of the poverty level qualify for a reduced-price lunch or breakfast. See www.fns.usda.gov/school-meals/income-eligibility-guidelines.

Hunger in America 2014 National Report 139
Clients Households’ Use of Food Assistance 5
however, in many cases these programs are offered though charitable agencies apart from the federal
programs.93 Some schools and partner agencies offer these programs for households that qualify.
5.2.1 Client Households’ Use of SNAP
Just over half (54.8 percent) of all client households report that they are currently receiving SNAP
benefits (Table 5-4). Across all food programs, both meal and grocery, receipt is statistically
significantly higher for households with at least one child (58.9 percent), and lower for households
with at least one senior (46.6 percent) as compared to all households. Reports of SNAP benefit
receipt are similar overall for clients of meal and grocery programs. Receipt of SNAP benefits is
often underreported, however, so actual levels of SNAP receipt by Feeding America client
households may be higher.94
Among all client households not currently receiving SNAP, almost half report that they had never
applied for SNAP benefits (Table 5-4). Households with at least one senior are statistically
significantly more likely than other households to report never having applied (28.8 percent of
households with seniors), and households with at least one senior receiving meal program help are
most likely to say that they have never applied for SNAP (34.1 percent of households). This is
consistent with the literature indicating that seniors more often avoid SNAP, often because of lack
of program knowledge, stigma, a desire for privacy, or a decline in income volatility.95,96
93 CACFP is a federally-funded program administered by eligible states that includes at-risk afterschool care programs. SFSP is federally funded and provides free summer meals to children at approved sites located where there are substantial concentrations of low-income children. For more information on both, visit www.fns.usda.gov.
94 Bruce D. Meyer, Wallace K.C. Mok, and James X. Sullivan. (2009). “The Under-Reporting of Transfers in Household Surveys: Its Nature and Consequences.” NBER Working Paper No. 15181. Cambridge, MA: National Bureau of Economic Research.
95 See Steven Haider, Alison Jacknowitz, and Robert Schoeni. (2003). “Food Stamps and the Elderly: Why is Participation So Low?” Journal of Human Resources, 38 (Suppl.): 1080-1111.
96 Craig Gundersen, and J. Ziliak. (2008). “The Age Gradient in Food Stamp Program Participation: Does Income Volatility Matter?” Income Volatility and Food Assistance in the United States, 171-216. Edited by D. Jolliffe and J. Ziliak. Kalamazoo, MI: W.E. Upjohn Institute for Employment Research.

Hunger in America 2014 National Report 140
Clients Households’ Use of Food Assistance 5
Table 5-4. Client households by reported current receipt of SNAP benefits, and among those
not currently receiving benefits, whether or not they have applied
Current receipt of SNAP and whether applied
Type of program All food
programs Meal Grocery
All households
Receiving SNAP 57.8% 55.1% 54.8%
Not receiving SNAP 42.2% 44.9% 45.2%
Never applied 19.9% 20.1% 20.4%
Have applied 20.5% 23.5% 23.4%
Unknown 1.8% 1.3% 1.3%
Total 100% 100% 100%
Weighted nonreporting client households 0.2M 0.6M 0.7M
Total weighted N 1.1M 5.4M 5.8M
Households with at least one child
Receiving SNAP 63.8% 59.1% 58.9%
Not receiving SNAP 36.2% 40.9% 41.1%
Never applied 9.2% 15.6% 15.5%
Have applied 26.7% 24.6% 24.9%
Unknown 0.3% 0.7% 0.7%
Households with at least one senior
Receiving SNAP 46.6% 47.2% 46.6%
Not receiving SNAP 53.4% 52.8% 53.4%
Never applied 34.1% 27.6% 28.8%
Have applied 14.7% 23.4% 22.9%
Unknown 4.6% 1.7% 1.7%
Households with at least one child and one senior
Receiving SNAP 69.9% 47.8% 47.9%
Not receiving SNAP 30.1% 52.2% 52.1%
Never applied 15.0% 23.5% 23.5%
Have applied 11.5% 27.2% 27.1%
Unknown 3.6% 1.5% 1.5%
Households with no children or seniors
Receiving SNAP 60.5% 57.9% 57.4%
Not receiving SNAP 39.5% 42.1% 42.6%
Never applied 15.1% 17.1% 17.3%
Have applied 23.2% 23.7% 24.0%
Unknown 1.3% 1.3% 1.3%
Data Source: Hunger in America 2014 Client Survey, Q30, and Q31.
Numbers may not sum to 100% due to rounding.
NOTE: All data were weighted as described in Chapter 2. Percentages reported in tables are calculated from valid responses which
exclude nonresponse and valid skips due to survey item skip patterns. Numbers listed under nonreporting clients include missing data
due to item nonresponse from participating clients. All estimates are weighted to account for program and client sampling as well as
survey nonresponse from nonparticipating food banks, agencies, programs, and clients. Total weighted N reflects the weighted number
of respondents eligible to answer the question. It includes missing data but excludes valid skips. Total weighted N can vary across
tables because of valid skips. Meal program numbers and grocery program numbers do not sum to all food program numbers because
the unduplicated count that forms the basis for the weight for all food programs removes double-counting of clients served by both
types of programs.

Hunger in America 2014 National Report 141
Clients Households’ Use of Food Assistance 5
5.2.1.1 Exhaustion of SNAP Benefits
By definition, SNAP benefits are intended to supplement a household’s monthly grocery budget,
and Table 5-5 reveals that SNAP benefits typically do not last recipients the entire month. Across all
households and food programs, 21.1 percent report that these benefits only last one week or less,
31.3 percent report that benefits last two weeks, and 33.9 percent report benefits last for three
weeks. A minority (13.6 percent) report that SNAP benefits usually last four weeks or more. Clients
of meal programs are statistically significantly more likely than clients of grocery programs to report
that SNAP benefits last for four weeks or longer (25.1 percent compared with 12.7 percent), and the
median number of weeks benefits last is two weeks for those in grocery programs, but three weeks
for those in meal programs. This may reflect the difference in food preparation patterns between
these groups. Grocery clients typically prepare meals at home and use SNAP benefits to purchase
the food they make, but meal-program clients may prepare food at home less often since they are
receiving meals on site at a program.
Reports of the time that SNAP benefits last are similar across household types, except that
households with at least one senior are statistically significantly more likely than other households to
report that benefits last one week or less. In contrast to other household types, households with at
least one senior using meal programs also have a lower median numbers of weeks that benefits
last—two weeks in comparison to three weeks for other household types that use meal programs.
These finding are consistent with federal reports indicating that households with seniors do not
typically receive the maximum benefit and that their lower monthly SNAP allocation may be due in
large part to a smaller-than-average household size: 81 percent of SNAP households with seniors,
according to the latest federal study, consisted of a senior living alone.97 It should be noted,
however, that differences in the duration of SNAP benefits may also be attributable to individual
households’ food preparation and spending patterns, irrespective of benefit size and charitable food
program type.
97 U.S. Department of Agriculture, Food and Nutrition Service. (February 2014.) “Characteristics of Supplemental Nutrition Assistance Program Households: Fiscal Year 2012.” Table 3-3, February 2014. http://www.fns.usda.gov/sites/default/files/2012Characteristics.pdf

Hunger in America 2014 National Report 142
Clients Households’ Use of Food Assistance 5
Table 5-5. Client households by reported usual time to exhaustion of SNAP benefits, among
households receiving SNAP benefits
Time to exhaustion of benefits
Type of program All food
programs Meal Grocery
All households
1 week or less 14.9% 21.8% 21.1%
2 weeks 29.0% 31.7% 31.3%
3 weeks 31.0% 33.9% 33.9%
4 weeks 16.0% 9.3% 9.9%
More than 4 weeks 9.1% 3.4% 3.7%
Total 100% 100% 100%
Median number of weeks 3 2 2
Weighted nonreporting client households 0.2M 0.7M 0.7M
Total weighted N 0.6M 3.1M 3.2M
Households with at least one child
1 week or less 18.1% 16.8% 16.7%
2 weeks 26.8% 33.0% 32.9%
3 weeks 38.9% 39.1% 39.2%
4 weeks 9.9% 8.4% 8.5%
More than 4 weeks 6.3% 2.6% 2.7%
Median number of weeks 3 2 2
Households with at least one senior
1 week or less 21.4% 29.6% 29.1%
2 weeks 33.9% 28.4% 28.4%
3 weeks 27.6% 27.3% 27.6%
4 weeks 11.8% 10.7% 10.9%
More than 4 weeks 5.3% 3.9% 4.0%
Median number of weeks 2 2 2
Households with at least one child and one senior
1 week or less 2.7% 18.3% 18.2%
2 weeks 25.8% 32.1% 32.2%
3 weeks 56.2% 37.3% 37.3%
4 weeks 13.3% 8.9% 8.8%
More than 4 weeks 2.0% 3.4% 3.4%
Median number of weeks 3 2 2
Households with no children or seniors
1 week or less 11.8% 20.7% 19.4%
2 weeks 26.1% 33.3% 31.8%
3 weeks 32.8% 33.2% 33.8%
4 weeks 18.3% 9.0% 10.5%
More than 4 weeks 11.0% 3.8% 4.4%
Median number of weeks 3 2 2
Data Source: Hunger in America 2014 Client Survey, Q30 and Q30A.
Numbers may not sum to 100% due to rounding.
NOTE: All data were weighted as described in Chapter 2. Percentages reported in tables are calculated from valid responses which
exclude nonresponse and valid skips due to survey item skip patterns. Numbers listed under nonreporting clients include missing data
due to item nonresponse from participating clients. All estimates are weighted to account for program and client sampling as well as
survey nonresponse from nonparticipating food banks, agencies, programs, and clients. Total weighted N reflects the weighted number
of respondents eligible to answer the question. It includes missing data but excludes valid skips. Total weighted N can vary across
tables because of valid skips. Meal program numbers and grocery program numbers do not sum to all food program numbers because
the unduplicated count that forms the basis for the weight for all food programs removes double-counting of clients served by both
types of programs.

Hunger in America 2014 National Report 143
Clients Households’ Use of Food Assistance 5
5.2.1.2 Reasons Why Clients Do Not Receive SNAP
There can be many reasons why nearly half of Feeding America clients do not receive SNAP
benefits. They may not have applied because they do not know about the program or perhaps know
about the program but do not think they were eligible. Others may apply but do not pass the
eligibility screens, and others may fail to complete the full application process. SNAP limits eligibility
to households with incomes below certain limits, and other state-specific eligibility requirements may
affect SNAP eligibility and participation rates. For instance, in some states households must pass an
asset test. Also, SNAP benefits are not available to documented immigrants in the country for fewer
than five years (unless the applicant is a child under age 18 or a person with a disability), and all
undocumented immigrants are excluded. A time limit may also apply to receipt of SNAP for able-
bodied adults without dependents who are not working, or in work programs that limit benefits to
three months out of a three-year period. This restriction was lifted in many states, however, during
2013 because of high unemployment.98 Individuals also may not apply or qualify for SNAP benefits
for other reasons related to specific eligibility criteria not previously mentioned. Finally, as noted in
Section 5.2.1, participation in SNAP is often under-reported by survey respondents and this
phenomenon may affect this survey as well, resulting in a lower reported SNAP participation rate
than actually exists in the population.99
The client households not participating in SNAP may or may not be eligible for SNAP benefits.
Nonetheless, reported household cash income provides some indication of SNAP eligibility among
nonparticipating households, and reasons for nonparticipation given among this group provide
additional insight.
When asked about the reasons they and their household members have never applied for SNAP,
clients most often report that they do not think they are eligible for benefits (Table 5-6). Relatively
few (6.3 percent) report they have never heard of SNAP; this percentage was likely influenced by the
fact that their state-specific SNAP EBT card image was presented in the Client Survey, making
recognition of the benefit easier. Only 8.1 percent say that it is too hard to apply for benefits.
98 See www.fns.usda.gov/SNAP/able-bodied-adults-without-dependents-abawds? for the current status of state waivers due to high unemployment.
99 Bruce D. Meyer, Wallace K.C. Mok, and James X. Sullivan. (2009). “The Under-Reporting of Transfers in Household Surveys: Its Nature and Consequences.” NBER Working Paper No. 15181. Cambridge, MA: National Bureau of Economic Research.

Hunger in America 2014 National Report 144
Clients Households’ Use of Food Assistance 5
Table 5-6. Client households reporting select reasons for not applying for SNAP benefits,
among households that have never applied
Reasons have not applied
Type of program All food
programs Meal Grocery
All households
Did not think eligible 48.1% 52.5% 52.1%
Never heard of program 4.3% 6.4% 6.3%
Personal reasons 16.8% 14.9% 14.6%
Too hard to apply 4.7% 8.3% 8.1%
Another reason 32.7% 27.6% 28.4%
Weighted nonreporting client households 0.1M 0.5M 0.5M
Total weighted N 0.2M 1.1M 1.2M
Households with at least one child
Did not think eligible 64.2% 51.8% 52.1%
Never heard of program 1.1% 7.7% 7.5%
Personal reasons 17.4% 17.1% 17.0%
Too hard to apply 5.8% 10.6% 10.5%
Another reason 13.5% 23.7% 23.5%
Households with at least one senior
Did not think eligible 53.8% 56.0% 55.0%
Never heard of program 3.5% 4.6% 4.6%
Personal reasons 13.6% 12.4% 12.3%
Too hard to apply 1.1% 8.1% 7.4%
Another reason 32.7% 26.7% 28.3%
Data Source: Hunger in America 2014 Client Survey, Q31 and Q31A.
Respondents could mark more than one reason, thus responses may sum to more than 100%.
NOTE: All data were weighted as described in Chapter 2. Percentages reported in tables are calculated from valid responses which
exclude nonresponse and valid skips due to survey item skip patterns. Numbers listed under nonreporting clients include missing data
due to item nonresponse from participating clients. All estimates are weighted to account for program and client sampling as well as
survey nonresponse from nonparticipating food banks, agencies, programs, and clients. Total weighted N reflects the weighted number
of respondents eligible to answer the question. It includes missing data but excludes valid skips. Total weighted N can vary across
tables because of valid skips. Meal program numbers and grocery program numbers do not sum to all food program numbers because
the unduplicated count that forms the basis for the weight for all food programs removes double-counting of clients served by both
types of programs.
Over one-third of client households that report having applied for SNAP benefits report not
qualifying at some point. Among those that report not qualifying for SNAP benefits, the most
common reason given was that their income was too high (Table 5-7). A small percentage of client
households reported that either their assets were too high or the application was too difficult. The
percentage of client households that report citizenship status as the main reason for not qualifying
for SNAP benefits is also small; however, it is possible that citizenship was underreported given that
citizenship is a potentially sensitive topic.

Hunger in America 2014 National Report 145
Clients Households’ Use of Food Assistance 5
Table 5-7. Client households reporting not having qualified for SNAP benefits at some point,
among households that have ever applied, and main reason for not qualifying
Type of program All food
programs Meal Grocery
All households
Did not qualify for SNAP in the past 29.3% 37.2% 36.3%
Main reason for not qualifying
Application too difficult 1.2% 1.5% 1.5%
Assets too high 2.7% 4.5% 4.4%
Income too high 10.4% 15.8% 15.4%
Not a U.S. citizen 0.7% 1.0% 1.0%
Another reason 10.9% 11.0% 10.9%
Unknown 3.4% 3.3% 3.2%
Weighted nonreporting client households 0.1M 0.6M 0.7M
Total weighted N 0.9M 4.3M 4.6M
Data Source: Hunger in America 2014 Client Survey, Q32 and Q32A.
Reasons sum to percent that did not qualify. Numbers may not sum exactly due to rounding.
NOTE: All data were weighted as described in Chapter 2. Percentages reported in tables are calculated from valid responses which
exclude nonresponse and valid skips due to survey item skip patterns. Numbers listed under nonreporting clients include missing data
due to item nonresponse from participating clients. All estimates are weighted to account for program and client sampling as well as
survey nonresponse from nonparticipating food banks, agencies, programs, and clients. Total weighted N reflects the weighted number
of respondents eligible to answer the question. It includes missing data but excludes valid skips. Total weighted N can vary across
tables because of valid skips. Meal program numbers and grocery program numbers do not sum to all food program numbers because
the unduplicated count that forms the basis for the weight for all food programs removes double-counting of clients served by both
types of programs.
Many client households’ perceptions and experiences indicate that they do not think they are eligible
for SNAP (among those that never applied) or that their income disqualifies them (among those that
had applied but did not receive SNAP). Self-reported incomes of households not receiving SNAP,
however, indicate that 72.0 percent could be income eligible for SNAP (Table 5-8). Most report
current incomes below 130 percent of the federal poverty level. In addition to having gross income
at or below 130 percent of the poverty level, SNAP applicants must demonstrate that their net
income, which is their gross income minus any allowable deductions, is equal to or less than
100 percent of the poverty level to qualify for benefits. Client households that indicate not having
qualified for SNAP benefits at some point due to their income being too high may have met the
gross income eligibility requirements but not the net income component of the income test.
Notably, a smaller percentage of client households that have incomes above 130 percent of poverty
may still be potentially eligible for SNAP, because their incomes are below the higher income
eligibility level set by their states under Broad-Based Categorical Eligibility (BBCE) for certain
households.

Hunger in America 2014 National Report 146
Clients Households’ Use of Food Assistance 5
Table 5-8. Client households by potential income eligibility for SNAP benefits, among
households not receiving SNAP benefits
Level of potential household
income eligibility
Type of program All food
programs Meal Grocery
Potentially income eligible 61.1% 73.0% 72.0%
Income at or below 130% of poverty level 56.5% 62.1% 61.7%
Income from >130% to state-specific BBCE level 4.6% 10.9% 10.3%
Not eligible 38.9% 27.0% 28.0%
Total 100% 100% 100%
Weighted nonreporting client households 0.0M 0.3M 0.3M
Total weighted N 0.5M 2.3M 2.5M
Data Source: Hunger in America 2014 Client Survey, Q23 and Q23.
Broad-Based Categorical Eligibility (BBCE) makes households with incomes above 130% of poverty, but below a higher state-set income
threshold, categorically eligible for SNAP under some conditions.
NOTE: All data were weighted as described in Chapter 2. Percentages reported in tables are calculated from valid responses which
exclude nonresponse and valid skips due to survey item skip patterns. Numbers listed under nonreporting clients include missing data
due to item nonresponse from participating clients. All estimates are weighted to account for program and client sampling as well as
survey nonresponse from nonparticipating food banks, agencies, programs, and clients. Total weighted N reflects the weighted number
of respondents eligible to answer the question. It includes missing data but excludes valid skips. Total weighted N can vary across
tables because of valid skips. Meal program numbers and grocery program numbers do not sum to all food program numbers because
the unduplicated count that forms the basis for the weight for all food programs removes double-counting of clients served by both
types of programs.
Gaps in receipt of SNAP benefits present another factor that can increase the need for private food
assistance. SNAP requires households to reapply for benefits on a regular basis, and to be evaluated
for continued eligibility at that time. Among client households that either currently receive SNAP or
that applied but are not currently receiving SNAP, 29.9 percent report that SNAP benefits had been
stopped at some time (Table 5-9). Just under a third of those households report that they missed the
recertification deadline, and nearly as many report their income had become too high for eligibility.
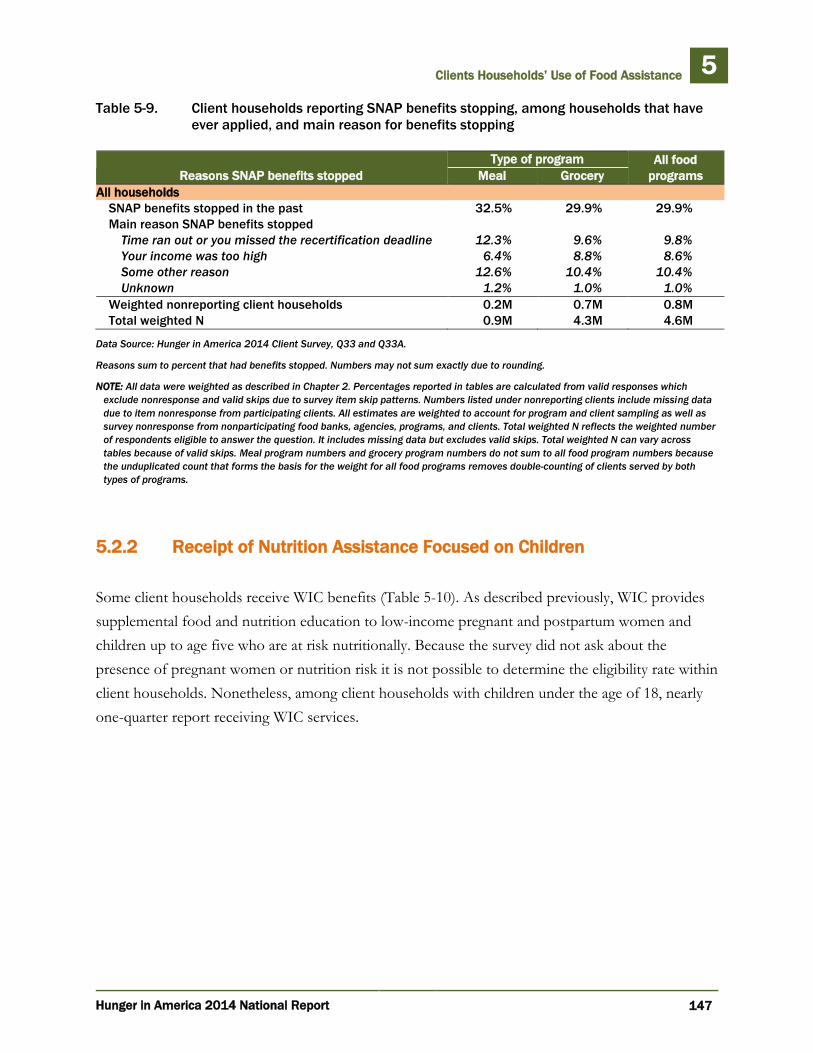
Hunger in America 2014 National Report 147
Clients Households’ Use of Food Assistance 5
Table 5-9. Client households reporting SNAP benefits stopping, among households that have
ever applied, and main reason for benefits stopping
Reasons SNAP benefits stopped
Type of program All food
programs Meal Grocery
All households
SNAP benefits stopped in the past 32.5% 29.9% 29.9%
Main reason SNAP benefits stopped
Time ran out or you missed the recertification deadline 12.3% 9.6% 9.8%
Your income was too high 6.4% 8.8% 8.6%
Some other reason 12.6% 10.4% 10.4%
Unknown 1.2% 1.0% 1.0%
Weighted nonreporting client households 0.2M 0.7M 0.8M
Total weighted N 0.9M 4.3M 4.6M
Data Source: Hunger in America 2014 Client Survey, Q33 and Q33A.
Reasons sum to percent that had benefits stopped. Numbers may not sum exactly due to rounding.
NOTE: All data were weighted as described in Chapter 2. Percentages reported in tables are calculated from valid responses which
exclude nonresponse and valid skips due to survey item skip patterns. Numbers listed under nonreporting clients include missing data
due to item nonresponse from participating clients. All estimates are weighted to account for program and client sampling as well as
survey nonresponse from nonparticipating food banks, agencies, programs, and clients. Total weighted N reflects the weighted number
of respondents eligible to answer the question. It includes missing data but excludes valid skips. Total weighted N can vary across
tables because of valid skips. Meal program numbers and grocery program numbers do not sum to all food program numbers because
the unduplicated count that forms the basis for the weight for all food programs removes double-counting of clients served by both
types of programs.
5.2.2 Receipt of Nutrition Assistance Focused on Children
Some client households receive WIC benefits (Table 5-10). As described previously, WIC provides
supplemental food and nutrition education to low-income pregnant and postpartum women and
children up to age five who are at risk nutritionally. Because the survey did not ask about the
presence of pregnant women or nutrition risk it is not possible to determine the eligibility rate within
client households. Nonetheless, among client households with children under the age of 18, nearly
one-quarter report receiving WIC services.

Hunger in America 2014 National Report 148
Clients Households’ Use of Food Assistance 5
Table 5-10. Client households by reported current receipt of WIC benefits
Household composition
Type of program All food
programs Meal Grocery
All households 5.1% 12.1% 11.5%
Households with at least one child 23.4% 24.7% 24.4%
Households with at least one senior 1.3% 4.9% 4.7%
Households with at least one child and one senior 11.0% 13.8% 13.8%
Households with no children or seniors 4.5% 5.0% 5.1%
Weighted nonreporting client households 0.2M 0.7M 0.8M
Total weighted N 1.1M 5.4M 5.8M
Data Source: Hunger in America 2014 Client Survey, Q34.
WIC is the federal Special Supplemental Nutrition Program for Women, Infants, and Children. Pregnant women without children in the
household are also eligible for WIC. Because WIC serves children only to age five, some households with at least one child may not
contain eligible children.
NOTE: All data were weighted as described in Chapter 2. Percentages reported in tables are calculated from valid responses which
exclude nonresponse and valid skips due to survey item skip patterns. Numbers listed under nonreporting clients include missing data
due to item nonresponse from participating clients. All estimates are weighted to account for program and client sampling as well as
survey nonresponse from nonparticipating food banks, agencies, programs, and clients. Total weighted N reflects the weighted number
of respondents eligible to answer the question. It includes missing data but excludes valid skips. Total weighted N can vary across
tables because of valid skips. Meal program numbers and grocery program numbers do not sum to all food program numbers because
the unduplicated count that forms the basis for the weight for all food programs removes double-counting of clients served by both
types of programs.
Some client households also benefit from other federal and charitable nutrition programs targeted at
school-aged children (Table 5-11). In this report, we consider school-aged children to be children
ages 5-18. This particular age group was selected as an approximation for school-aged children that
would be age-eligible for child nutrition programs, but there may be slight variation in eligibility
given receipt by some younger children, such as preschoolers. Most (93.7 percent) client households
with school-aged children report receipt of free or reduced-price school lunch benefits, and
46.2 percent report receipt of free or reduced-price school breakfast benefits. As noted earlier,
breakfast is not available in all schools, and some families may prefer to feed their children at home,
which may account for the lower rate of participation in school breakfast programs. Households
with school-aged children in the meal programs are statistically significantly more likely than those in
grocery programs to report receipt of school breakfast benefits.

Hunger in America 2014 National Report 149
Clients Households’ Use of Food Assistance 5
Table 5-11. Client household participation in programs targeted at children other than WIC,
among households with school-aged children
Household participates in…
Type of program All food
programs Meal Grocery
Afterschool snack or meal programs 10.1% 8.2% 8.1%
BackPack weekend food programs 10.1% 8.0% 8.0%
Free or reduced-price school breakfast programs 65.1% 45.3% 46.2%
Free or reduced-price school lunch programs 95.2% 93.6% 93.7%
Weighted nonreporting client households 0.1M 0.8M 0.8M
Total weighted N 0.1M 1.4M 1.4M
Data Source: Hunger in America 2014 Client Survey, Q35.
WIC is the federal Special Supplemental Nutrition Program for Women, Infants, and Children.
Free or reduced-price school breakfast and school lunch programs are fully federally reimbursed. Afterschool snack or meal programs
are eligible for reimbursement but may not be reimbursed. BackPack programs are not eligible for federal reimbursement.
School-aged children are children ages 5-18.
NOTE: All data were weighted as described in Chapter 2. Percentages reported in tables are calculated from valid responses which
exclude nonresponse and valid skips due to survey item skip patterns. Numbers listed under nonreporting clients include missing data
due to item nonresponse from participating clients. All estimates are weighted to account for program and client sampling as well as
survey nonresponse from nonparticipating food banks, agencies, programs, and clients. Total weighted N reflects the weighted number
of respondents eligible to answer the question. It includes missing data but excludes valid skips. Total weighted N can vary across
tables because of valid skips. Meal program numbers and grocery program numbers do not sum to all food program numbers because
the unduplicated count that forms the basis for the weight for all food programs removes double-counting of clients served by both
types of programs.
Some children receive afterschool snack or meal programs (8.1 percent), and some participate in
BackPack weekend food programs (8.0 percent) which are charitable programs and not federally
funded. Low rates of participation likely reflect lower availability of these programs. Because
multiple programs, both federal and charitable, may be available to families some families may rely
on both federal and charitable programs to address child nutrition needs.
5.3 Households’ Engagement in Coping Strategies
When faced with the threat of food insecurity, individuals may engage in various coping strategies
that range from relatively small changes in eating practices to extreme changes. Coping strategies are
active and immediate responses to avoid hunger and its consequences. They are not, however,
always successful, and/or may result in unintended negative health effects. In Section 5.1.3 we
discussed the spending tradeoffs that Feeding America client households report making between
food and other necessities as one type of coping strategy. This section of the report discusses
additional coping strategies employed by Feeding America client households.

Hunger in America 2014 National Report 150
Clients Households’ Use of Food Assistance 5
5.3.1 Coping Strategies to Get Enough Food
Client households report engaging in a range of coping strategies (Table 5-12). Across all
households, the purchase of inexpensive, unhealthy food is the most commonly reported coping
strategy (78.7 percent). Households with at least one child, as compared to all households, are
statistically significantly more likely to report purchasing inexpensive, unhealthy food, with
83.5 percent reporting this coping strategy. Grocery program client households are statistically
significantly more likely than meal program households to report purchasing inexpensive, unhealthy
food (80.0 percent as compared to 69.1 percent). This strategy has known risks for negative health
outcomes. For example, foods that are higher in fat, sodium, and sugar can contribute to obesity,
heart disease, diabetes, low energy levels, and poor nutrition.
Many households also report making less optimal food choices, including eating food past the
expiration date100 (56.1 percent), and watering down food or drink (40.0 percent). More than half of
households report purchasing food in dented or damaged packages, although this is not necessarily
an unsafe practice if the food is handled safely.101 Households of grocery program clients are
statistically significantly more likely to purchase food with dented or damaged packaging
(53.2 percent) as compared to households of meal program clients (44.4 percent). Households with
at least one senior, as compared to all households, are statistically significantly more likely to eat
food past the expiration date (60.2 percent). Households with at least one child, as compared to all
households, are statistically significantly more likely to purchase food in dented or damaged
packages (55.4 percent) and to water down food and drink (44.8 percent). These particular coping
strategies suggest that some Feeding America clients and their household members are engaging in
concerning behaviors in order to feed themselves and their families.
100 Clients were asked about “expiration date” on the survey, which they may have interpreted as either the sell-by date or the best-by date since either can be displayed on products.
101 See www.fda.gov/Food/FoodborneIllnessContaminants/BuyStoreServeSafeFood/ucm197835.htm

Hunger in America 2014 National Report 151
Clients Households’ Use of Food Assistance 5
Table 5-12. Client households by coping strategies used to get enough food in the past
12 months
Coping strategies used to get enough food
Type of program All food programs Meal Grocery
All households Eaten food past expiration date 54.1% 57.1% 56.1% Grew food in a garden 14.6% 23.6% 22.7% Sold or pawned personal property 31.8% 35.9% 34.9% Purchased food in dented or damaged packages 44.4% 53.2% 51.7% Purchased inexpensive, unhealthy food 69.1% 80.0% 78.7% Received help from family or friends 49.7% 53.5% 52.5% Watered down food or drinks 38.3% 40.9% 40.0%
Weighted nonreporting client households 0.2M 0.9M 1.0M Total weighted N 1.1M 5.4M 5.8M
Households with at least one child Eaten food past expiration date 55.7% 54.4% 54.6% Grew food in a garden 12.8% 25.9% 25.5% Sold or pawned personal property 38.4% 45.2% 45.0% Purchased food in dented or damaged packages 50.9% 55.5% 55.4% Purchased inexpensive, unhealthy food 77.0% 83.7% 83.5% Received help from family or friends 57.3% 61.4% 60.9% Watered down food or drinks 45.2% 44.6% 44.8%
Households with at least one senior Eaten food past expiration date 59.3% 61.3% 60.2% Grew food in a garden 22.6% 25.7% 25.4% Sold or pawned personal property 21.7% 23.4% 22.8% Purchased food in dented or damaged packages 40.8% 51.3% 50.0% Purchased inexpensive, unhealthy food 58.8% 75.1% 73.5% Received help from family or friends 36.1% 41.2% 40.5% Watered down food or drinks 33.4% 35.2% 34.1%
Households with at least one child and one senior Eaten food past expiration date 59.5% 62.1% 62.0% Grew food in a garden 35.6% 29.9% 29.9% Sold or pawned personal property 24.5% 36.5% 36.5% Purchased food in dented or damaged packages 54.5% 54.9% 54.9% Purchased inexpensive, unhealthy food 72.5% 81.2% 81.2% Received help from family or friends 50.3% 53.2% 53.0% Watered down food or drinks 37.6% 43.3% 43.1%
Households with no children or seniors Eaten food past expiration date 53.4% 58.1% 56.1% Grew food in a garden 13.1% 20.0% 18.8% Sold or pawned personal property 36.0% 38.9% 37.4% Purchased food in dented or damaged packages 46.6% 52.7% 50.3% Purchased inexpensive, unhealthy food 71.8% 81.8% 80.0% Received help from family or friends 56.0% 57.0% 56.0% Watered down food or drinks 39.7% 43.2% 41.3%
Data Source: Hunger in America 2014 Client Survey, Q43A through Q43G.
Respondents could select multiple strategies, thus numbers do not sum to 100%.
NOTE: All data were weighted as described in Chapter 2. Percentages reported in tables are calculated from valid responses which
exclude nonresponse and valid skips due to survey item skip patterns. Numbers listed under nonreporting clients include missing data
due to item nonresponse from participating clients. All estimates are weighted to account for program and client sampling as well as
survey nonresponse from nonparticipating food banks, agencies, programs, and clients. Total weighted N reflects the weighted number
of respondents eligible to answer the question. It includes missing data but excludes valid skips. Total weighted N can vary across
tables because of valid skips. Meal program numbers and grocery program numbers do not sum to all food program numbers because
the unduplicated count that forms the basis for the weight for all food programs removes double-counting of clients served by both
types of programs.

Hunger in America 2014 National Report 152
Clients Households’ Use of Food Assistance 5
One possible reason for making less optimal food choices is the lack of healthier or better choices
that are both available and affordable. The Client Survey also asked clients to identify foods they
most want, but do not usually get, from the meal or grocery program they were visiting. Clients
identify fresh fruit and vegetables as the most desired item not received (55.0 percent), followed by
protein food items like meat (47.1 percent) and dairy products such as milk, cheese, or yogurt
(40.0 percent).102 Nonperishable items, which may be more easily available through the food
programs, were identified at much lower rates.
Across all households slightly more than 50 percent receive help from family and friends as a
strategy for getting enough food. While this coping strategy may be successful in the short term, it
may not be a long-term solution as it could create burden for family or friends who may not have
the resources for long-term support. Notably, households with at least one senior are statistically
significantly less likely than other household types to receive help from families and friends in
getting enough food.
Growing food in a garden is the least commonly employed coping strategy (22.7 percent overall),
and it is statistically significantly lower among households of meal program clients (14.6 percent) as
compared to grocery program clients (23.6 percent), possibly reflecting that some meal programs are
residential and have no facilities for gardens. The percentage of households growing food in gardens
is statistically significantly higher, however, among households with at least one child and at least
one senior (29.9 percent) as compared to all households.
Selling or pawning personal property to obtain funds for food is reported by 34.9 percent of
households overall, but is statistically significantly more common among households with at least
one child (45.0 percent), and statistically significantly less common among households with at least
one senior (22.8 percent).
Also important is the percentage of households that report engaging in more than one of these
coping strategies within the same 12-month period (Table 5-13). More than half of households
(54.8 percent) report using three or more coping strategies in the past 12 months. Most households
are employing multiple coping strategies, in addition to seeking federal or charitable food assistance,
to try to secure enough food, demonstrating that they are expending great effort to piece together
solutions to reduce the likelihood of hunger in their households.
102 Clients could identify up to three items they most want, so percentages exceed 100 percent.
Hunger in America 2014 National Report 153
Clients Households’ Use of Food Assistance 5

Hunger in America 2014 National Report 154
Clients Households’ Use of Food Assistance 5
Table 5-13. Client households reporting number of coping strategies used to get enough food in
the past 12 months
Number of coping strategies used
Type of program All food
programs Meal Grocery
None 16.4% 10.2% 11.2%
1 19.9% 15.2% 16.0%
2 15.1% 18.4% 18.1%
3 16.9% 19.8% 19.3%
4 18.7% 19.5% 19.2%
5 or more 12.9% 16.9% 16.3%
Total 100% 100% 100%
Weighted nonreporting client households 0.1M 0.3M 0.3M
Total weighted N 1.1M 5.4M 5.8M
Data Source: Hunger in America 2014 Client Survey, Q43A through Q43G.
Numbers may not sum to 100% due to rounding.
NOTE: All data were weighted as described in Chapter 2. Percentages reported in tables are calculated from valid responses which
exclude nonresponse and valid skips due to survey item skip patterns. Numbers listed under nonreporting clients include missing data
due to item nonresponse from participating clients. All estimates are weighted to account for program and client sampling as well as
survey nonresponse from nonparticipating food banks, agencies, programs, and clients. Total weighted N reflects the weighted number
of respondents eligible to answer the question. It includes missing data but excludes valid skips. Total weighted N can vary across
tables because of valid skips. Meal program numbers and grocery program numbers do not sum to all food program numbers because
the unduplicated count that forms the basis for the weight for all food programs removes double-counting of clients served by both
types of programs.

Hunger in America 2014 National Report 155
Hunger in America 2014 (HIA 2014) is Feeding America’s sixth quadrennial comprehensive study of
its network of charitable food assistance. Using a four-stage sampling design and two phases of data
collection, the study utilizes more than 32,000 surveys of Feeding America member food banks’
partner agencies that provide food assistance services, and more than 60,000 surveys of clients
served by the meal and grocery programs the partner agencies operate. The survey results, weighted
to represent the full national Feeding America network, provide the most up-to-date and complete
profile of this critical part of the charitable sector in the United States. We estimate that Feeding
America is currently serving 46.5 million unique individuals in 15.5 million households annually
across the 50 states, Washington DC, and Puerto Rico. Feeding America’s more than 200 member
food banks offer this assistance through collaboration with more than 46,000 partner agencies, and
more than 58,000 meal and grocery programs the agencies operate.
Completed at the end of August 2013, HIA 2014 data collection took place during a period with
historically high demand for food assistance. Unemployment, poverty, and food insecurity rates
remained high since the Great Recession of 2008, and the number of households receiving nutrition
assistance from the federal government’s Supplemental Nutrition Assistance Program (SNAP) had
increased by approximately 50 percent between 2009 and 2013. Demand for charitable food
assistance also expanded during this time.
This national report summarizes the study methods, including the challenges and lessons for future
research. It describes the range of partner agencies and programs in the Feeding America network,
including the services they provide, their sources of food, how they staff their operations, and the
challenges they face. The report details the number and characteristics of individual clients served by
these programs, and explores clients’ household circumstances including demographic
characteristics, employment, health, and household income. Client households’ food security status,
use of other nutrition assistance programs, and coping strategies employed to secure enough food
complete this profile. The information will help to guide future policy decisions to address the issue
of hunger in America.
Summary of Findings 6

Hunger in America 2014 National Report 156
Summary of Findings 6
6.1 Completing a National Profile of the Feeding America
Network and Its Clients
6.1.1 Innovations in Hunger in America 2014
HIA 2014 marks a departure from previous Hunger in America (HIA) studies in an effort to capture
more effectively the scope of services provided by the Feeding America network and the
characteristics of the clients and households using the services. As described in Chapter 2, HIA 2014
included many additional types of programs, such as nonemergency programs, for the first time, and
broadened the program categories to those that provide meals and those that provide groceries. The
study design was also modified to use results from the Agency Survey as the basis for the sample
design for the Client Survey to ensure a more rigorous random sampling process and better tailor
the sampling plans for each individual food bank.
Data collection was modernized to take advantage of the benefits of electronic data collection. For
the Agency Survey phase of data collection, the use of electronic surveys allowed for more secure
transmission of survey data and increased monitoring of the data collection efforts. Conducting the
Client Survey electronically on tablet computers allowed for the embedding of skip logic into the
surveys. In addition, the use of tablets made it possible to offer the Client Survey through Audio
Computer-Assisted Self-Interviewing (ACASI), providing the respondents with increased privacy for
their responses. ACASI also opened the door to offering the survey in five languages rather than the
two languages offered in previous HIA studies.
Finally, innovations in HIA 2014 led to an increased number of completed program visits for the
Client Survey at the national level. In an effort to obtain more precise data, and because there is
known to be greater diversity among clients across different programs than within the same
program, food banks were asked to visit a larger number of their food programs to survey their
clients. As a result, food banks collectively visited more than twice as many programs in 2014 as in
the previous HIA study.
6.1.2 Select Challenges in Hunger in America 2014
While design and survey innovations have resulted in a study that moves HIA forward in its goal of
representing fully the services and clients of the Feeding America network, innovation is not without

Hunger in America 2014 National Report 157
Summary of Findings 6
consequences: comparisons to previous HIA studies must be made cautiously as the changes in
design and population studied mean that direct comparisons of the data are no longer fully
interpretable. While some differences in results may be due to changes over time in the network,
others may be consequences of the differences between the studies.
Using Agency Survey data as the basis for Client Survey sampling was an innovation that tightened
the study design. Yet doing so required that member food banks identify all their partner agencies
for the initial frame, and this proved to be an unexpected challenge. The differentiation between
partner agencies and the programs they operate is not always immediately apparent or easy to
determine, and confusion about who should be included in the agency sampling frame led to
inadvertent omissions from the sample. When omissions were discovered after the Client Survey
program visit sample was drawn, introduction of those cases into the sample post-hoc changed the
nature of the probability sample and required complex statistical adjustments to maintain the
integrity of the estimates (see the Technical Volume for details).
Innovation also did not obviate all previous challenges. As in previous HIA studies, children are
underrepresented in the Client Survey data. Children are not able to consent to direct participation
in surveys. Consequently, programs that serve children uniquely were not eligible to be sampled for
the Client Survey, and as children were not eligible to be sampled at multigenerational meal
programs, the number of children served by the network is underestimated. This has been a
consistent challenge for the HIA studies, and remained so for HIA 2014. Future HIA studies, or
embedded sub-studies, may want to look for creative methodologies to estimate more effectively the
number of children served.
HIA 2014 also encountered the same benefits and challenges as in past HIA studies related to the
use of volunteer data collectors. The study could not be implemented without the dedicated work of
the food banks in training and monitoring generous volunteer data collectors alongside their regular
staff. Yet volunteer data collectors, with their limited time dedicated to the study, bring a level of
unpredictability to the work that resulted in some departures from the specified sampling design and
study procedures. The ACASI surveys eased the burden on data collectors to learn skip patterns and
survey administration techniques, but could not simplify the complex task of sampling or other
operational and scheduling challenges.

Hunger in America 2014 National Report 158
Summary of Findings 6
6.2 The Feeding America Network of Services
6.2.1 Range of Partner Agencies and Programs
Feeding America’s member food banks, working with their partner agencies, provide food and
services to people in all 50 states, Washington, DC and Puerto Rico. Based on the Agency Survey,
weighted to represent the entire network, the food banks in the Feeding America network partner
with more than 46,000 charitable agencies to distribute food to clients through more than 58,000
meal and grocery programs. More than half (62 percent) of partner agencies are faith-based
organizations or located in a religious institution, but agencies also include numerous other
nonprofit or private organizations, Community Action Programs, and state or local government
agencies.
In addition to the 58,000 programs operated by partner agencies that provide clients with meals and
groceries, many partner agencies also offer assistance and outreach for food-related benefit
programs such as SNAP, nutrition education, and assistance with other non-food challenges related
to housing, clothing, and legal advice. Although most agencies offer only food programs (either meal
or grocery, 64.9 percent), nearly one-third of agencies offer both food and non-food programs, or
provide non-food services such as benefits assistance, outreach, or referrals, as an integrated
component of their food programs. The breadth of services offered reflects the diversity of needs
among Feeding America clients. While hunger-relief is a major part of most partner agencies’
missions, ensuring that people in need can get appropriate assistance with other hurdles of daily life
emerges as a strong focus.
6.2.2 Partner Agency and Program Resources
Partner agencies and their programs require personnel, food, and money to operate. Only half of the
partner agencies employ any paid staff. Instead they rely on a volunteer workforce to deliver their
services. In a typical month, nearly 2 million volunteers contribute more than 8.4 million hours of
their time to food programs. Volunteers are of all ages, and once engaged tend to stay engaged.
But volunteers are not enough to perpetuate services; partner agencies and their programs need both
food and money to continue operating. Programs acquire food from various sources. The majority
comes from Feeding America member food banks (61.8 percent of the total food distributed). Food

Hunger in America 2014 National Report 159
Summary of Findings 6
also comes from donations, food banks outside the Feeding America network, and purchases to fill
gaps. Funding directly to the partner agencies comes from various sources, including individual
contributions, religious institutions, government, foundations, corporations, and other sources. Few
partner agencies collect funds from client service fees they could charge for non-food services such
as trainings, social activities, or professional services, choosing instead to serve clients without
charge.
Programs often stretch to meet clients’ food assistance needs. To maintain their ability to serve
clients, some partner agencies report making reductions during the past 12 months, including cutting
back on hours of operation, laying off staff, and limiting service areas. The partner agencies that
have scaled back operations most often attribute their actions to reductions in monetary and food
donations rather than the increase in demand for food. The majority of the partner agencies making
these reductions are at least somewhat worried about their ability to continue providing services,
citing need for more money and more food supplies as the most pressing concerns.
6.3 Food Assistance Clients and Their Households Are Diverse
Using the HIA 2014 data, we estimate the Feeding America network serves 46.5 million unique or
“unduplicated” individuals in 15.5 million households annually across the United States. Each
month 5.8 million unique households receive assistance from the network. Many clients receive food
multiple times during the year, so estimating each time clients are reached through food distributions
yields a “duplicated” estimate of 389.2 million individual client interactions through food programs
in a year.
6.3.1 Client and Household Demographic Characteristics
Individual clients vary greatly in their demographic characteristics. On an annual level, individual
clients range from infants to seniors, including 28.5 percent of the clients who are children under age
18 (a likely underestimate for reasons described earlier in this chapter). They are racially and
ethnically diverse, and although more than one-quarter of the adults do not hold a high school
diploma or General Equivalency Diploma (GED), the majority of adult clients have at least a high
school diploma or more. Over one-quarter of the adult clients have completed education beyond

Hunger in America 2014 National Report 160
Summary of Findings 6
high school, and 5.7 percent hold a four-year college degree or higher. More than 10 percent are
currently students, continuing their education.
Households of Feeding America clients are also diverse. Ages of household members vary. Nearly
40 percent of households contain at least one child under age 18, and approximately one-third of
households contain at least one senior age 60 or older. Household size varies, with 28.4 percent of
households being one-person households. Most meal program clients (70.1 percent) do not live with
anyone else with whom they share living expenses. The modal household size for grocery program
clients is two to three members, but over 5 percent of grocery program client households have more
than six members. More than one in seven client households contain individuals of multiple races or
ethnicities. Approximately 20 percent of households contain someone who has either past or
present military service.
6.3.2 Challenges Client Households Face
Feeding America clients and their households come from diverse backgrounds and circumstances.
Their commonality is a need for food assistance, but food may be only one challenge among many
that they face. Looking at income in the past month as a percentage of the poverty level, 50.7
percent of Feeding America client households fall at or below 100 percent of the poverty level.
Among households with at least one child, 61.9 percent fall at or below the poverty level, and
among households with at least one senior 33.1 percent are at or below the poverty level. One in 10
client households reports having no income during the past year.
In 34 percent of client households, the most employed person worked within the past four weeks.
In 23 percent of client households, the most employed person from the past year is currently
unemployed, but looking for work and ready for employment. An additional 42 percent are out of
the workforce and not looking for work, in most cases because they are retired, disabled, or in poor
health. Some households have additional barriers to employment, including caregiving
responsibilities, or in a small percentage of households criminal histories that may make finding
employment more challenging. Among those who have worked in the past year, 57 percent report
typically working only part-time rather than full-time. But nearly 20 percent of all households
contain adult students, and education or training may serve as a bridge to future employment.
Health problems are common in client households. Nearly 50 percent of respondents report being
in fair or poor health, and nearly one-quarter report having another household member in poor

Hunger in America 2014 National Report 161
Summary of Findings 6
health. Client households generally have high rates of diabetes (33.2 percent) and high blood
pressure (57.8 percent). While chronic disease rates are highest among households with at least one
senior (47.2 percent have a member with diabetes and 77.3 percent have a member with high blood
pressure), 28.4 percent of households with at least one child have a member with diabetes and nearly
half (49.4 percent) have a member with high blood pressure. In 28.6 percent of households, no one
in the household has health insurance, and 55.1 percent of households have unpaid medical bills.
Regarding housing, most (93.2 percent) client households reside in a nontemporary housing
arrangement, including houses or townhouses (42.9 percent), apartments (33.7 percent), and mobile
homes or trailers (12.5 percent). But 6.9 percent live in temporary housing such as shelters, missions,
transitional living situations, or on the streets. Temporary housing is more common among those
using meal programs (33.6 percent) than those using grocery programs (4.5 percent). At least
4.9 percent of client households meet the U.S. Department of Housing and Urban Development’s
definition of “homeless.”103
6.3.3 Client Households’ Food Security, Use of Food Assistance, and Other
Coping Strategies
Given their high rates of poverty, many clients struggle to provide sufficient and healthy food for
their households. Based on a six-item set of food security questions, 83.8 percent of all client
households classify as experiencing food insecurity in the past 12 months. Clients work to make
ends meet and secure food however they can, including making tough choices about what
necessities they can afford, seeking out various sources of food assistance, and employing a variety
of coping strategies to get enough food.
Most client households face tough choices between paying for food and other necessities. For
example, 65.9 percent report choosing between paying for food and medical care during the year;
69.3 percent choose between paying for food and utilities, 57.1 percent choose between paying for
food and housing, and 66.5 percent choose between paying for food and transportation.
103 This percentage includes client households reporting residing in abandoned buildings, bus or train stations, parks, campgrounds, or airports; residing in cars, vans, boats, or recreational vehicles; living on the street; and residing in shelters, missions, or transitional living situations.

Hunger in America 2014 National Report 162
Summary of Findings 6
More than 60 percent of client households plan on getting charitable food assistance from a Feeding
America program as a regular strategy for making ends meet. Many client households also seek help
from government food assistance programs; about half (54.8 percent) report currently receiving
benefits from SNAP. Almost half of those not receiving SNAP have never applied for this benefit,
most often because they do not think they are eligible. Despite this perception, 72.0 percent of
households not receiving SNAP report incomes at or below the SNAP income eligibility limit in
their state.
Many households receive other types of nutrition assistance focused specifically on children. For
example, among households with at least one child, 24.4 percent receive benefits from the Special
Supplemental Nutrition Program for Women, Infants, and Children (WIC), which serves pregnant
women and children ages 0-5. Ninety-four percent of households with school-aged children receive
free or reduced-price school lunches, and more than 46 percent receive free or reduced-price school
breakfast. Approximately 8 percent of households participate in afterschool snack or meal programs,
and 8 percent receive nutritious, easy-to-prepare food for the weekends through the BackPack
weekend food program.
Besides participation in food assistance programs, client households also engage in a range of other
coping strategies to ensure they have sufficient food. More than half receive help from family or
friends in getting enough food, and nearly 23 percent grow food in a garden, but many turn to less
than optimal solutions. Nearly 79 percent purchase inexpensive unhealthy food just to have enough
food, and 40.0 percent water down their food or drinks to make what they have last.
Feeding America client households face a multitude of challenges, and employ many productive and
some potentially detrimental strategies to try to ensure that they and their households have enough
to eat.
The HIA 2014 national report provides a picture of the circumstances of the national Feeding
America network and its clients. Local circumstances are further described through state- and food
bank-level reports based on HIA 2014 data. Other Feeding America reports, including Map the Meal
Gap, delve further into the need for and use of food assistance in communities across the United
States. HIA 2014 and these other studies illuminate the critical role that Feeding America, its
member food banks, partner agencies, and their programs play in addressing hunger in America.