Embed Size (px)
Citation preview

Mathematica Reference No.: 06521-600
HUNGER IN AMERICA 2010 Local Report Prepared for The Capital Area Food Bank of Texas, Inc (4408) Final Report January 2010 James Mabli Rhoda Cohen Frank Potter Zhanyun Zhao
Submitted to:
Feeding America 35 E. Wacker Drive, Suite 2000 Chicago, IL 60601
George Braley Senior Vice President of Government Relations and Public Policy Maura Daly Vice President of Government Relations and Advocacy Elaine Waxman Director of Research and Analysis Emily Engelhard Manager of Social Policy Research and Analysis
Submitted by:
Mathematica Policy Research P.O. Box 2393 Princeton, NJ 08543-2393 (609) 799-3535
Rhoda Cohen Project Director


Hunger in America 2010 The Capital Area Food Bank of Texas, Inc (4408)
iii
ACKNOWLEDGMENTS
We would like to acknowledge the strong support and vision of the staff at Feeding
America, George Braley, Maura Daly, Elaine Waxman, Emily Engelhard, and Lindsey Baker, who provided strong support throughout the research process. The quality of the product was also much improved through sound advice from the Technical Advisory Group: John Cook, Jim Ohls, Rob Santos, Chris Gundersen, Beth Osborne Daponte, and Steve Carlson. We also acknowledge the contributions of the Member Advisory Committee, Mariann Guinn, Karen Joyner, Jeff Dronkers, Nicholas Saccaro, Erin Rockhill, JC Dwyer and Kristen Yandora, in the review of the data collection instruments and procedures.
Also, a number of staff from Mathematica Policy Research, Inc. (MPR) made important
contributions, which contributed to the success of the project. Frank Potter, working with Zhanyun Zhao, developed and implemented the sampling plan and developed the analysis weights for the project, with the assistance of Yuhong Zheng, Cathy Lu and Shinu Verghese. MPR internal advisors, including Laura Castner and John Hall, made many important suggestions for the analysis and reports.
On the survey side, Marcia Comly and Laurie Bach spent long hours obtaining the
sample frames from the food banks and providing feedback to them throughout the sampling process. The data they obtained were placed in a comprehensive computer tracking database developed by Shilpa Khambati and Roland Scurato. David Eden worked tirelessly to update and produce the training video for affiliates to use in training large numbers of field interviewers. Andrea Smith made significant contributions to the series of webinars supporting the development of the sample frame and the in-person training sessions for the Hunger Study Coordinators. Andrea Sleeper provided on-going support for the distribution of data collection materials to the food banks.
Marcia Tobias, Pat Barta, Cynthia Campbell, Cheryl Lichtenstein, Leslie Randall,
Lorraine Davis, Linda Warren, and Brandon Wentworth, under the supervision of Ae Sengmavong, Season Bedell-Boyle and Marcia Tobias provided guidance to the food banks’ Hunger Study Coordinators. Jessica Boehm played a key role in reviewing and preparing the completed client questionnaires for shipment to Questar for electronic data capture.
Jeffrey Holt, Ira Nichols-Barrer, and Elizabeth Petraglia provided critical and advanced
programming and analysis skills needed to produce the report. Carlo Caci offered extraordinary computer skills in enhancing and implementing a system to expeditiously generate national, local, state, and special analysis database. Dawn Patterson provided exceptional secretarial support throughout the process. The competency and flexibility demonstrated by all involved were key factors in the success of the project.


Hunger in America 2010 The Capital Area Food Bank of Texas, Inc (4408)
v
CONTENTS
Chapter Page
1. HIGHLIGHTS OF FINDINGS .......................................................................................1
2. INTRODUCTION ...........................................................................................................5
2.1 OBJECTIVES .......................................................................................................7
2.2 OVERVIEW OF THE FEEDING AMERICA NETWORK ................................8
2.3 GROUPS AND ORGANIZATIONS INVOLVED IN THE STUDY ...............12
2.4 OVERVIEW OF THE REST OF REPORT .......................................................13
3. METHODS ....................................................................................................................15
3.1 INSTRUMENT DEVELOPMENT ....................................................................15
3.2 TRAINING .........................................................................................................15
3.3 AGENCY SURVEY ...........................................................................................16
3.4 CLIENT SURVEY .............................................................................................19
3.5 RESPONSE RATES ...........................................................................................23
3.6 ANALYSIS METHODS ....................................................................................27
3.6.1 Tables .......................................................................................................27
3.6.2 Other Methodological Considerations ......................................................29
3.7 REPORTING CONVENTIONS IN FOOD BANK REPORTS .........................34
4. ESTIMATED NUMBERS OF AGENCIES AND CLIENTS ......................................37
4.1 ESTIMATED NUMBER OF AGENCIES .........................................................37
4.2 ESTIMATED NUMBER OF CLIENTS ............................................................38
4.3 BACKGROUND AND LIMITATIONS OF THE ESTIMATES ......................39
5. CLIENTS: DEMOGRAPHIC PROFILE .....................................................................43
5.1 NUMBER OF CLIENT RESPONDENTS .........................................................43
5.2 SUMMARY DEMOGRAPHIC PROFILE ........................................................45

Hunger in America 2010 The Capital Area Food Bank of Texas, Inc (4408)
CONTENTS (continued)
Chapter Page
vi
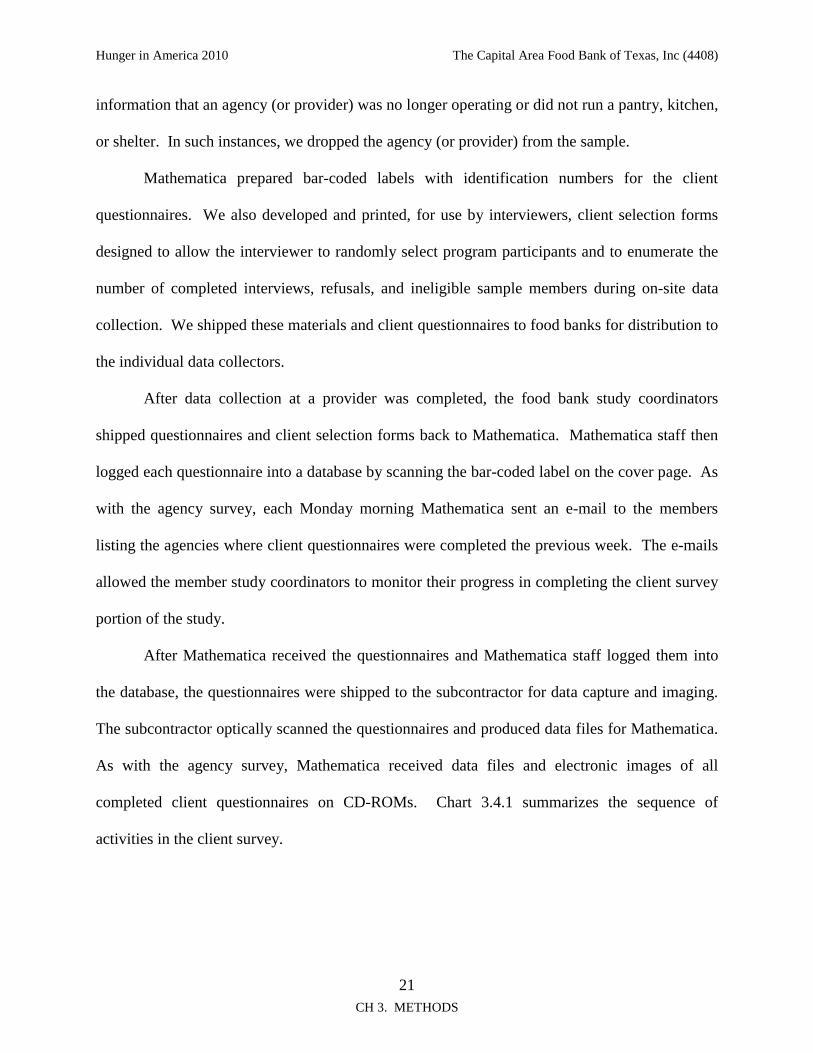
5.3 AGE, GENDER, AND CITIZENSHIP COMPOSITION ..................................48
5.4 MARITAL STATUS ..........................................................................................54
5.5 HIGHEST EDUCATION LEVEL ATTAINED ................................................55
5.6 RACIAL AND ETHNIC BACKGROUND .......................................................57
5.7 EMPLOYMENT OF ADULTS IN HOUSEHOLD ...........................................59
5.8 HOUSEHOLD INCOME ...................................................................................64
5.8.1 Federal Poverty Level ..............................................................................64
5.8.2 Household Income for the Previous Month .............................................65
5.8.3 Sources of Household Income for the Previous Month ...........................69
5.8.4 Annual Household Income in 2008 ..........................................................74
5.8.5 Education and Income in 2008 .................................................................77
5.8.6 Presence of Elderly or Children and Income in 2008 ..............................79
5.9 HOUSING...........................................................................................................81
5.9.1 Housing Status ..........................................................................................81
5.9.2 Household Resources ...............................................................................87
6. CLIENTS: FOOD INSECURITY ................................................................................89
6.1 HOUSEHOLD FOOD INSECURITY ...............................................................91
6.1.1 Household Food Insecurity and Household Composition ........................91
6.1.2 Household Food Insecurity and Supplemental Nutrition Assistance Program Participation .............................................................................100
6.1.3 Household Food Insecurity and Household Income ..............................103
6.1.4 Household Food Insecurity and Health ..................................................106
6.1.5 Household Food Insecurity and Citizenship Status ................................107

Hunger in America 2010 The Capital Area Food Bank of Texas, Inc (4408)
CONTENTS (continued)
Chapter Page
vii
6.2 INDICATORS OF FOOD INSECURITY IN HOUSEHOLDS .......................109
6.3 INDICATORS OF FOOD INSECURITY AMONG ADULTS .......................113
6.4 INDICATORS OF FOOD INSECURITY AMONG HOUSEHOLDS WITH CHILDREN ...........................................................................................118
6.5 CHOICE BETWEEN FOOD AND NECESSITIES ........................................124
7. CLIENTS: USE OF FOOD ASSISTANCE PROGRAMS ........................................133
7.1 USE OF THE SUPPLEMENTAL NUTRITION ASSISTANCE PROGRAM .......................................................................................................133
7.2 REASONS WHY CLIENTS NEVER APPLIED FOR SUPPLEMENTAL NUTRITION ASSISTANCE PROGRAM BENEFITS ...................................140
7.3 REASONS WHY CLIENTS OR THEIR HOUSEHOLDS ARE NOT CURRENTLY RECEIVING SUPPLEMENTAL NUTRITION ASSISTANCE PROGRAM BENEFITS, FOR THOSE WHO HAVE APPLIED ..........................................................................................................146
7.4 USE OF OTHER PROGRAMS........................................................................152
7.5 GENERAL ASSISTANCE, WELFARE, AND TANF IN THE PREVIOUS TWO YEARS ...............................................................................155
7.6 GROCERY SHOPPING PATTERNS ..............................................................156
8. CLIENTS: HEALTH STATUS .................................................................................159
8.1 HEALTH STATUS ..........................................................................................159
8.2 HEALTH INSURANCE AND ACCESS TO MEDICAL CARE ....................162
9. CLIENTS: SERVICES RECEIVED AT FOOD PROGRAMS .................................167
9.1 NUMBER OF PANTRIES OR KITCHENS USED ........................................167
9.2 SATISFACTION WITH SERVICES AT FOOD PROGRAMS .....................169
9.3 WHAT CLIENTS WOULD DO WITHOUT FOOD ASSISTANCE FROM THE AGENCY .....................................................................................172
10. AGENCIES AND FOOD PROGRAMS: PROFILES ...............................................175

Hunger in America 2010 The Capital Area Food Bank of Texas, Inc (4408)
CONTENTS (continued)
Chapter Page
viii
10.1 PARTICIPATING AGENCIES AND PROGRAMS REPRESENTED ..........175
10.2 NUMBER OF PROGRAMS OPERATED BY AGENCIES ...........................178
10.3 AGENCIES OPERATING VARIOUS TYPES OF PROGRAMS ..................179
10.4 LENGTH OF PROGRAM OPERATION ........................................................179
10.5 OTHER SERVICES OR FACILITIES PROVIDED IN ADDITION TO FOOD DISTRIBUTION ...................................................................................182
10.6 TYPE OF AGENCY THAT OPERATES THE PROGRAM ..........................187
10.7 PROGRAMS SERVING SELECTED TYPES OF CLIENTS ........................189
10.8 AGENCY ESTIMATES OF CHANGE IN NUMBER OF CLIENTS FROM 2006 TO 2009 .......................................................................................191
10.9 SEASONALITY OF CLIENT MIX .................................................................192
11. AGENCIES AND FOOD PROGRAMS: FOOD SERVICES ...................................195
11.1 NUMBER OF BOXES OR BAGS DISTRIBUTED IN A TYPICAL WEEK ...............................................................................................................195
11.2 AMOUNT OF FOOD SERVED ON THE DAY THE PROGRAM WAS LAST OPEN .....................................................................................................197
12. AGENCIES AND FOOD PROGRAMS: ABILITY TO MEET CLIENT NEEDS ........................................................................................................................201
12.1 STABILITY OF EXISTING FOOD PROGRAMS .........................................201
12.2 FREQUENCY OF STRETCHING FOOD RESOURCES...............................206
12.3 PROGRAMS THAT TURNED AWAY CLIENTS .........................................211
12.4 ADDITIONAL FOOD RESOURCES NEEDED PER WEEK ........................215
13. AGENCIES AND FOOD PROGRAMS: RESOURCES ..........................................217
13.1 SOURCES OF FOOD DISTRIBUTED BY PROGRAMS ..............................217
13.2 STAFF AND VOLUNTEER RESOURCES DURING PREVIOUS WEEK ..223

Hunger in America 2010 The Capital Area Food Bank of Texas, Inc (4408)
CONTENTS (continued)
Chapter Page
ix
13.3 PRODUCTS PURCHASED FROM SOURCES OTHER THAN FOOD BANKS .............................................................................................................226
14. AGENCIES AND FOOD PROGRAMS: IMPORTANCE OF FOOD BANKS .......229
14.1 PRODUCTS NEEDED FROM FOOD BANKS ..............................................229
14.2 IMPACT OF ELIMINATION OF FOOD BANK............................................233
14.3 AREAS OF ADDITIONAL ASSISTANCE DESIRED ..................................235
APPENDIX A PRECISION OF REPORTED ESTIMATES: SURVEY ERROR AND SAMPLING ERROR
APPENDIX B SNAP ELIGIBILITY CRITERIA
APPENDIX C SOURCES OF INFORMATION SHOWN IN THE CHARTS AND TABLES IN CHAPTERS 5 THROUGH 14
APPENDIX D HUNGER IN AMERICA TABLE CROSSWALK FOR NATIONAL REPORT AND LOCAL REPORTS (WHERE APPLICABLE), 2005 TO 2009


Hunger in America 2010 The Capital Area Food Bank of Texas, Inc (4408)
xi
CHARTS
Chart Page
CHART 2.2.1 SOURCES OF FOOD AND CHANNELS OF FOOD DISTRIBUTION FOR FOOD BANKS....................................................................................... 10
CHART 3.3.1 AGENCY SURVEY ACTIVITIES ................................................................ 18
CHART 3.4.1 CLIENT SURVEY ACTIVITIES ................................................................... 22
CHART 3.5.1 STUDY OVERVIEW ..................................................................................... 24
CHART 3.5.2 ORGANIZATIONS AND INDIVIDUALS INVOLVED IN THE RESEARCH PROCESS.................................................................................. 25
CHART 3.5.3 THE CAPITAL AREA FOOD BANK OF TEXAS, INC SERVICE AREA .............................................................................................................. 26
CHART 5.1.1 WEIGHTED PERCENTAGES OF CLIENT RESPONDENTS BY TYPE OF INTERVIEW SITE ................................................................................... 44
CHART 5.3.1 GENDER COMPOSITION OF CLIENTS AT PROGRAM SITES BY PROGRAM TYPE .......................................................................................... 50
CHART 5.3.2 AGE COMPOSITION OF ALL MEMBERS OF CLIENT HOUSEHOLDS BY PROGRAM TYPE ........................................................ 53
CHART 5.6.1 RACIAL AND ETHNIC BACKGROUND BY PROGRAM TYPE ............. 58
CHART 5.7.1 HOUSEHOLDS WITH AT LEAST ONE WORKING ADULT BY PROGRAM TYPE .......................................................................................... 60
CHART 5.7.2 EMPLOYMENT STATUS OF ALL ADULTS IN CLIENT HOUSEHOLDS BY PROGRAM TYPE ........................................................ 63
CHART 5.8.2.1 HOUSEHOLD INCOME FOR PREVIOUS MONTH AS PERCENTAGE OF FEDERAL POVERTY LEVEL BY PROGRAM TYPE ............................................................................................................... 68
CHART 5.8.3.1 MAIN SOURCE OF HOUSEHOLD INCOME FOR PREVIOUS MONTH AMONG ALL CLIENTS ................................................................ 71
CHART 5.8.3.2 ALL SOURCES OF HOUSEHOLD INCOME FOR PREVIOUS MONTH AMONG ALL CLIENTS ................................................................ 73
CHART 5.8.4.1 HOUSEHOLD INCOME IN 2008 AS PERCENTAGE OF FEDERAL POVERTY LEVEL BY PROGRAM TYPE .................................................. 76

Hunger in America 2010 The Capital Area Food Bank of Texas, Inc (4408)
CHARTS (continued)
Chart Page
xii
CHART 5.9.1.1 HOUSING BY PROGRAM TYPE ................................................................. 83
CHART 5.9.2.1 HOUSEHOLD RESOURCES BY PROGRAM TYPE .................................. 88
CHART 6.1.1.1 FOOD INSECURITY AMONG ALL CLIENT HOUSEHOLDS.................. 93
CHART 6.1.1.1A FOOD INSECURITY AMONG HOUSEHOLDS WITH CHILDREN YOUNGER THAN AGE 18 ........................................................................... 93
CHART 6.1.1.1B FOOD INSECURITY AMONG HOUSEHOLDS WITH SENIORS AGE 65 OR OLDER ................................................................................................ 94
CHART 6.4.1A INDICATOR OF FOOD INSECURITY AMONG HOUSEHOLD WITH CHILDREN: ANSWERED 'OFTEN' OR 'SOMETIMES' TO 'CHILDREN WERE NOT EATING ENOUGH' BY PROGRAM TYPE ... 120
CHART 6.4.1B INDICATOR OF FOOD INSECURITY AMONG HOUSEHOLD WITH CHILDREN: HOUSEHOLDS WHERE CHILDREN EVER SKIPPED MEALS BY PROGRAM TYPE ................................................................... 120
CHART 6.4.1C INDICATOR OF HUNGER AMONG HOUSEHOLD WITH CHILDREN: HOUSEHOLDS WITH CHILDREN WHO WERE EVER HUNGRY BY PROGRAM TYPE ............................................................... 121
CHART 7.1.1 USE OF SUPPLEMENTAL NUTRITION ASSISTANCE PROGRAM BY PROGRAM TYPE ................................................................................. 136
CHART 7.2.1 REASONS WHY CLIENT HOUSEHOLDS NEVER APPLIED FOR SUPPLEMENTAL NUTRITION ASSISTANCE PROGRAM BENEFITS BY PROGRAM TYPE .............................................................. 143
CHART 7.3.1 REASONS WHY CLIENT HOUSEHOLDS ARE NOT RECEIVING SUPPLEMENTAL NUTRITION ASSISTANCE PROGRAM BENEFITS BY PROGRAM TYPE .............................................................. 147
CHART 8.1.1 HOUSEHOLDS WITH AT LEAST ONE MEMBER REPORTED TO BE IN POOR HEALTH BY PROGRAM TYPE ......................................... 161
CHART 8.2.1 HEALTH INSURANCE AMONG ALL CLIENTS ..................................... 164
CHART 9.2.1 SATISFACTION WITH FOOD PROVIDED BY PROGRAM TYPE ........ 171
CHART 9.3.1 WHAT CLIENTS WOULD DO WITHOUT FOOD ASSISTANCE FROM THE AGENCY ALL CLIENTS ...................................................... 173

Hunger in America 2010 The Capital Area Food Bank of Texas, Inc (4408)
CHARTS (continued)
Chart Page
xiii
CHART 10.1.1 PERCENTAGE OF PARTICIPATING PROGRAMS BY PROGRAM TYPE ............................................................................................................. 177
CHART 10.6.1 TYPE OF AGENCY THAT OPERATES THE PROGRAM BY PROGRAM TYPE ........................................................................................ 188
CHART 12.1.1 PROGRAMS THAT FACE AT LEAST ONE PROBLEM THREATENING THEIR CONTINUED OPERATION BY PROGRAM TYPE ............................................................................................................. 202
CHART 12.1.1P NATURE OF PROBLEMS THAT THREATEN CONTINUED OPERATION AMONG PANTRY PROGRAMS ....................................... 203
CHART 12.2.1 FREQUENCY OF STRETCHING FOOD RESOURCES BY PROGRAM TYPE ........................................................................................ 207
CHART 12.3.1P REASONS FOR TURNING AWAY CLIENTS AMONG PANTRY PROGRAMS ................................................................................................. 213
CHART 12.4.1 AVERAGE AND MEDIAN NUMBER OF ADDITIONAL MEAL EQUIVALENTS NEEDED BY PROGRAM TYPE .................................... 216
CHART 13.2.1 MEDIAN NUMBER OF PAID STAFF AND VOLUNTEERS DURING PREVIOUS WEEK BY PROGRAM TYPE ................................................ 225
CHART 14.1.1P PRODUCTS NEEDED FROM FOOD BANKS AMONG PANTRY PROGRAMS ................................................................................................. 231
CHART 14.1.1K PRODUCTS NEEDED FROM FOOD BANKS AMONG KITCHEN PROGRAMS ................................................................................................. 231
CHART 14.1.1S PRODUCTS NEEDED FROM FOOD BANKS AMONG SHELTER PROGRAMS ................................................................................................. 232
CHART 14.2.1 IMPACT OF ELIMINATION OF FOOD BANK BY PROGRAM TYPE .. 234
CHART 14.3.1P AREAS OF ADDITIONAL ASSISTANCE NEEDED AMONG PANTRY PROGRAMS ................................................................................ 236
CHART 14.3.1K AREAS OF ADDITIONAL ASSISTANCE NEEDED AMONG KITCHEN PROGRAMS .............................................................................. 237
CHART 14.3.1S AREAS OF ADDITIONAL ASSISTANCE NEEDED AMONG SHELTER PROGRAMS .............................................................................. 237


Hunger in America 2010 The Capital Area Food Bank of Texas, Inc (4408)
xv
TABLES Table Page
TABLE 5.1.1 NUMBER OF CLIENT RESPONDENTS ..................................................... 43
TABLE 5.2.1 SUMMARY DEMOGRAPHIC PROFILE OF CLIENTS ............................. 45
TABLE 5.3.1 AGE, GENDER, AND CITIZENSHIP COMPOSITION AMONG ADULT CLIENTS .......................................................................................... 48
TABLE 5.3.2 AGE, GENDER, AND CITIZENSHIP COMPOSITION .............................. 51
TABLE 5.4.1 MARITAL STATUS ....................................................................................... 54
TABLE 5.5.1 HIGHEST EDUCATION LEVEL ATTAINED ............................................. 55
TABLE 5.6.1 RACIAL AND ETHNIC BACKGROUND .................................................... 57
TABLE 5.7.1 EMPLOYMENT STATUS OF ADULTS IN HOUSEHOLD........................ 59
TABLE 5.7.2 DETAILED EMPLOYMENT STATUS OF ADULTS IN HOUSEHOLD ... 61
TABLE 5.8.1.1 THE 2009 FEDERAL POVERTY LEVEL—MONTHLY INCOME ........... 64
TABLE 5.8.2.1 HOUSEHOLD INCOME FOR THE PREVIOUS MONTH .......................... 65
TABLE 5.8.3.1 MAIN SOURCE OF HOUSEHOLD INCOME FOR THE PREVIOUS MONTH .......................................................................................................... 69
TABLE 5.8.3.2 ALL SOURCES OF HOUSEHOLD INCOME FOR PREVIOUS MONTH .......................................................................................................... 72
TABLE 5.8.4.1 HOUSEHOLD INCOME FOR 2008 .............................................................. 74
TABLE 5.8.5.1 INCOME IN 2008, BY EDUCATION ........................................................... 77
TABLE 5.8.6.1 INCOME IN 2008, BY PRESENCE OF ELDERLY OR CHILDREN ......... 79
TABLE 5.9.1.1 HOUSING STATUS ....................................................................................... 81
TABLE 5.9.1.2 INCOME IN 2008, BY HOUSING STATUS ................................................ 84
TABLE 5.9.1.3 INCOME IN 2008, BY HOME OWNERSHIP .............................................. 85
TABLE 5.9.2.1 HOUSEHOLD RESOURCES ........................................................................ 87
TABLE 6.1.1.1 HOUSEHOLD FOOD INSECURITY ............................................................ 91
TABLE 6.1.1.2 FOOD INSECURITY, BY PRESENCE OF CHILDREN ............................. 95

Hunger in America 2010 The Capital Area Food Bank of Texas, Inc (4408)
TABLES (continued)
Table Page
xvi
TABLE 6.1.1.3 FOOD INSECURITY, BY PRESENCE OF YOUNG CHILDREN .............. 96
TABLE 6.1.1.4 FOOD INSECURITY, BY PRESENCE OF ELDERLY OR CHILDREN .... 97
TABLE 6.1.2.1 FOOD INSECURITY, BY SUPPLEMENTAL NUTRITION ASSISTANCE PROGRAM PARTICIPATION........................................... 100
TABLE 6.1.3.1 FOOD INSECURITY, BY INCOME IN 2008 ............................................. 103
TABLE 6.1.3.2 INCOME IN 2008, BY FOOD SECURITY STATUS ................................. 104
TABLE 6.1.4.1 FOOD INSECURITY, BY HEALTH STATUS ........................................... 106
TABLE 6.1.5.1 FOOD INSECURITY, BY CITIZENSHIP STATUS .................................. 107
TABLE 6.1.5.2 FOOD INSECURITY AMONG HOUSEHOLDS CONTAINING AT LEAST ONE NONCITIZEN, BY PRESENCE OF YOUNG CHILDREN................................................................................................... 108
TABLE 6.2.1 INDICATORS OF FOOD INSECURITY IN HOUSEHOLDS ................... 109
TABLE 6.2.2 INDICATORS OF FOOD INSECURITY IN HOUSEHOLDS, BY SUPPLEMENTAL NUTRITION ASSISTANCE PROGRAM BENEFIT RECEIPT....................................................................................................... 111
TABLE 6.3.1 INDICATORS OF FOOD INSECURITY AMONG ADULTS ................... 113
TABLE 6.3.2 INDICATORS OF FOOD INSECURITY AMONG ADULTS, BY SUPPLEMENTAL NUTRITION ASSISTANCE PROGRAM BENEFIT RECEIPT....................................................................................................... 115
TABLE 6.4.1 INDICATORS OF FOOD INSECURITY AMONG HOUSEHOLDS WITH CHILDREN ....................................................................................... 118
TABLE 6.4.2 INDICATORS OF FOOD INSECURITY AMONG HOUSEHOLDS WITH CHILDREN, BY SUPPLEMENTAL NUTRITION ASSISTANCE PROGRAM BENEFIT RECEIPT ....................................... 122
TABLE 6.5.1 CHOICE BETWEEN FOOD AND NECESSITIES ..................................... 124
TABLE 6.5.2 HOUSEHOLD TRADE-OFFS, BY FOOD SECURITY STATUS ............. 126
TABLE 6.5.3 HOUSEHOLD TRADE-OFFS, BY HOUSEHOLD STRUCTURE ............ 129

Hunger in America 2010 The Capital Area Food Bank of Texas, Inc (4408)
TABLES (continued)
Table Page
xvii
TABLE 7.1.1 USE OF THE SUPPLEMENTAL NUTRITION ASSISTANCE PROGRAM ................................................................................................... 133
TABLE 7.1.2 USE OF THE SUPPLEMENTAL NUTRITION ASSISTANCE PROGRAM, BY PRESENCE OF ELDERLY OR CHILDREN ................. 137
TABLE 7.2.1 REASONS WHY CLIENTS NEVER APPLIED FOR SUPPLEMENTAL NUTRITION ASSISTANCE PROGRAM BENEFITS ............................... 140
TABLE 7.2.2 REASONS WHY CLIENTS NEVER APPLIED FOR SUPPLEMENTAL NUTRITION ASSISTANCE PROGRAM BENEFITS, BY PRESENCE OF ELDERLY OR CHILDREN ................................................................... 144
TABLE 7.3.1 REASONS WHY CLIENTS OR THEIR HOUSEHOLDS ARE NOT CURRENTLY RECEIVING SUPPLEMENTAL NUTRITION ASSISTANCE PROGRAM BENEFITS, FOR THOSE WHO HAVE APPLIED ...................................................................................................... 146
TABLE 7.3.2 REASONS THAT RESPONDENTS OR THEIR HOUSEHOLDS DO NOT CURRENTLY RECEIVE SUPPLEMENTAL NUTRITION ASSISTANCE PROGRAM BENEFITS, FOR THOSE WHO HAVE APPLIED, BY PRESENCE OF ELDERLY OR CHILDREN ..................... 148
TABLE 7.3.3 REPORTED INCOME LEVELS OF CLIENTS WHO INDICATED INELIGIBLE INCOME AS A REASON FOR NOT RECEIVING SUPPLEMENTAL NUTRITION ASSISTANCE PROGRAM BENEFITS .................................................................................................... 150
TABLE 7.3.4 REPORTED INCOME LEVELS OF CLIENTS WHO INDICATED INELIGIBLE INCOME AS A REASON FOR NOT RECEIVING SUPPLEMENTAL NUTRITION ASSISTANCE PROGRAM BENEFITS, BY ELDERLY AND CHILD STATUS .................................. 151
TABLE 7.4.1 USE OF OTHER PROGRAMS .................................................................... 152
TABLE 7.4.2 NONPARTICIPATION IN THE SUMMER FOOD PROGRAM ............... 153
TABLE 7.5.1 GENERAL ASSISTANCE, WELFARE, AND TANF IN THE PREVIOUS TWO YEARS ........................................................................... 155
TABLE 7.6.1 GROCERY SHOPPING PATTERNS .......................................................... 156
TABLE 8.1.1 HEALTH STATUS ....................................................................................... 159

Hunger in America 2010 The Capital Area Food Bank of Texas, Inc (4408)
TABLES (continued)
Table Page
xviii
TABLE 8.2.1 HEALTH INSURANCE AND ACCESS TO MEDICAL CARE ................ 162
TABLE 8.2.2 INCOME IN 2008, BY MEDICAID PARTICIPATION STATUS ............. 165
TABLE 8.2.3 INCOME IN 2008, BY UNINSURED STATUS ......................................... 166
TABLE 9.1.1 NUMBER OF DIFFERENT PANTRIES OR KITCHENS USED .............. 167
TABLE 9.2.1 SATISFACTION WITH SERVICES AT FOOD PROGRAMS .................. 169
TABLE 9.3.1 WHAT CLIENTS WOULD DO WITHOUT FOOD ASSISTANCE FROM THE AGENCY ................................................................................. 172
TABLE 10.1.1 PROGRAMS REPORTED ON BY PARTICIPATING AGENCIES, BY PROGRAM TYPE ........................................................................................ 176
TABLE 10.2.1 NUMBER OF PROGRAMS OPERATED BY AGENCIES ........................ 178
TABLE 10.3.1 AGENCIES OPERATING VARIOUS TYPES OF PROGRAMS .............. 179
TABLE 10.4.1 LENGTH OF PROGRAM OPERATION .................................................... 180
TABLE 10.5.1 OTHER SERVICES OR FACILITIES AGENCIES OR PROGRAMS PROVIDE IN ADDITION TO FOOD DISTRIBUTION, BY PROGRAM TYPE ........................................................................................ 182
TABLE 10.5.2 NUMBER OF ADDITIONAL SERVICES, BY PROGRAM TYPE ........... 184
TABLE 10.5.3 OTHER FACILITIES AGENCIES PROVIDE IN ADDITION TO FOOD DISTRIBUTION, BY PROGRAM TYPE ................................................... 185
TABLE 10.6.1 TYPE OF AGENCY THAT OPERATES THE PROGRAM ....................... 187
TABLE 10.7.1 PROGRAMS SERVING SELECTED TYPES OF CLIENTS ..................... 189
TABLE 10.8.1 AGENCY ESTIMATES OF CHANGE IN NUMBER OF CLIENTS FROM 2006 TO 2009 ................................................................................... 191
TABLE 10.9.1 SEASONALITY OF CLIENT MIX ............................................................. 192
TABLE 11.1.1 NUMBER OF BOXES OR BAGS DISTRIBUTED IN A TYPICAL WEEK ........................................................................................................... 195
TABLE 11.2.1 AMOUNT OF FOOD SERVED ON THE DAY THE PROGRAM WAS LAST OPEN ................................................................................................. 197

Hunger in America 2010 The Capital Area Food Bank of Texas, Inc (4408)
TABLES (continued)
Table Page
xix
TABLE 11.2.2 AMOUNT OF FOOD SERVED ON THE DAY THE PROGRAM WAS LAST OPEN, BY TYPE OF AGENCY THAT OPERATES THE PROGRAM ................................................................................................... 199
TABLE 12.1.1 STABILITY OF EXISTING FOOD PROGRAMS ...................................... 201
TABLE 12.1.2 STABILITY OF EXISTING FOOD PROGRAMS, BY TYPE OF AGENCY THAT OPERATES THE PROGRAM ........................................ 204
TABLE 12.2.1 FREQUENCY OF STRETCHING FOOD RESOURCES ........................... 206
TABLE 12.2.2 FREQUENCY OF STRETCHING FOOD RESOURCES, BY TYPE OF AGENCY THAT OPERATES THE PROGRAM ........................................ 208
TABLE 12.3.1 PROGRAMS THAT TURNED AWAY CLIENTS ..................................... 211
TABLE 12.3.2 MOST FREQUENT REASONS THE PROGRAM TURNED AWAY CLIENTS ...................................................................................................... 214
TABLE 12.4.1 ADDITIONAL FOOD RESOURCES NEEDED PER WEEK .................... 215
TABLE 13.1.1 SOURCES OF FOOD DISTRIBUTED BY PROGRAMS .......................... 217
TABLE 13.1.2 PERCENTAGE OF FOOD RECEIVED BY PROGRAMS FROM FOOD BANK, BY TYPE OF AGENCY THAT OPERATES THE PROGRAM .. 219
TABLE 13.1.3 PERCENTAGE OF FOOD RECEIVED BY PROGRAMS FROM FOOD BANK, BY FREQUENCY OF STRETCHING FOOD RESOURCES ...... 221
TABLE 13.2.1 STAFF AND VOLUNTEER RESOURCES DURING PREVIOUS WEEK ........................................................................................................... 223
TABLE 13.3.1 PRODUCTS PURCHASED FROM SOURCES OTHER THAN FOOD BANK ........................................................................................................... 226
TABLE 14.1.1 PRODUCTS NEEDED FROM FOOD BANKS .......................................... 229
TABLE 14.2.1 IMPACT OF ELIMINATION OF FOOD BANK ........................................ 233
TABLE 14.3.1 AREAS OF ADDITIONAL ASSISTANCE DESIRED ............................... 235

Hunger in America 2010 The Capital Area Food Bank of Texas, Inc (4408)
TABLES (continued)
Table Page
xx

Hunger in America 2010 The Capital Area Food Bank of Texas, Inc (4408)
1 CH 1. HIGHLIGHTS OF FINDINGS
1. HIGHLIGHTS OF FINDINGS
This report presents information on the clients and agencies served by The Capital Area
Food Bank of Texas, Inc. The information is drawn from a national study, Hunger in America
2010, conducted in 2009 for Feeding America (FA) (formerly America’s Second Harvest), the
nation’s largest organization of emergency food providers. The national study is based on
completed in-person interviews with more than 62,000 clients served by the FA national
network, as well as on completed questionnaires from more than 37,000 FA agencies. The study
summarized below focuses on emergency food providers and their clients who are supplied with
food by food banks in the FA network. Emergency food programs are defined to include food
pantries, soup kitchens, and emergency shelters serving short-term residents. It should be
recognized that many other types of providers served by food banks are, for the most part, not
described in this study, including such programs as Congregate Meals for seniors, day care
facilities, and after school programs.
Key findings are summarized below:
HOW MANY CLIENTS RECEIVE EMERGENCY FOOD FROM THE CAPITAL AREA FOOD BANK OF TEXAS, INC?
• The FA system served by The Capital Area Food Bank of Texas, Inc provides emergency food for an estimated 284,900 different people annually.
• About 48,000 different people receive emergency food assistance in any given week.
WHO RECEIVES EMERGENCY FOOD ASSISTANCE?
FA agencies served by The Capital Area Food Bank of Texas, Inc provide food for a
broad cross-section of households. Key characteristics include:

Hunger in America 2010 The Capital Area Food Bank of Texas, Inc (4408)
2 CH 1. HIGHLIGHTS OF FINDINGS
• 41% of the members of households served by The Capital Area Food Bank of Texas, Inc are children under 18 years old (Table 5.3.2).
• 8% of the members of households are children age 0 to 5 years (Table 5.3.2).
• 4% of the members of households are elderly (Table 5.3.2).
• About 37% of clients are non-Hispanic white, 24% are non-Hispanic black, 38% are Hispanic, and the rest are from other racial groups (Table 5.6.1).
• 43% of households include at least one employed adult (Table 5.7.1).
• 73% have incomes below the federal poverty level (Table 5.8.2.1) during the previous month.
• 18% are homeless (Table 5.9.1.1).
MANY CLIENTS ARE FOOD INSECURE WITH LOW OR VERY LOW FOOD SECURITY
• Among all client households served by emergency food programs of The Capital Area Food Bank of Texas, Inc, 80% are food insecure, according to the U.S. government’s official food security scale. This includes client households who have low food security and those who have very low food security (Table 6.1.1.1).
• 40% of the clients have very low food security (Table 6.1.1.1).
• Among households with children, 76% are food insecure and 29% are food insecure with very low food security (Table 6.1.1.1).
MANY CLIENTS REPORT HAVING TO CHOOSE BETWEEN FOOD AND OTHER NECESSITIES
• 55% of clients served by The Capital Area Food Bank of Texas, Inc report having to choose between paying for food and paying for utilities or heating fuel (Table 6.5.1).
• 44% had to choose between paying for food and paying their rent or mortgage (Table 6.5.1).
• 27% had to choose between paying for food and paying for medicine or medical care (Table 6.5.1).
• 35% had to choose between paying for food and paying for transportation (Table 6.5.1).

Hunger in America 2010 The Capital Area Food Bank of Texas, Inc (4408)
3 CH 1. HIGHLIGHTS OF FINDINGS
• 37% had to choose between paying for food and paying for gas for a car (Table 6.5.1).
DO CLIENTS ALSO RECEIVE FOOD ASSISTANCE FROM THE GOVERNMENT?
• 26% of client households served by The Capital Area Food Bank of Texas, Inc are receiving Supplemental Nutrition Assistance Program (SNAP) benefits (Table 7.1.1); however, it is likely that many more are eligible (Table 7.3.2).
• Among households with children ages 0-3 years, 54% participate in the Special Supplemental Nutrition Program for Women, Infants, and Children (WIC) (Table 7.4.1).
• Among households with school-age children, 64% and 63%, respectively, participate in the federal school lunch and school breakfast programs (Table 7.4.1)
• Among households with school-age children, 7% participate in the summer food program (Table 7.4.1).
MANY CLIENTS ARE IN POOR HEALTH
• 23% of households served by The Capital Area Food Bank of Texas, Inc report having at least one household member in poor health (Table 8.1.1)
MOST CLIENTS ARE SATISFIED WITH THE SERVICES THEY RECEIVE FROM THE AGENCIES OF THE CAPITAL AREA FOOD BANK OF TEXAS, INC
• 92% of adult clients said they were either “very satisfied” or “somewhat satisfied” with the amount of food they received from their provider; 83% were satisfied with the quality of the food they received (Table 9.2.1).
HOW LARGE IS THE CAPITAL AREA FOOD BANK OF TEXAS, INC?
• The Capital Area Food Bank of Texas, Inc included approximately 325 agencies at the administration of this survey, of which 257 have responded to the agency survey. Of the responding agencies, 207 had at least one food pantry, soup kitchen, or shelter.

Hunger in America 2010 The Capital Area Food Bank of Texas, Inc (4408)
4 CH 1. HIGHLIGHTS OF FINDINGS
WHAT KINDS OF ORGANIZATIONS OPERATE EMERGENCY FOOD PROGRAMS OF THE CAPITAL AREA FOOD BANK OF TEXAS, INC?
• 57% of pantries, 43% of kitchens, and 28% of shelters are run by faith-based agencies affiliated with churches, mosques, synagogues, and other religious organizations (Table 10.6.1).
• At the agency level, 55% of agencies with at least one pantry, kitchen, or shelter and 47% of all agencies including those with other types of programs are faith-based (Table 10.6.1).
• Private nonprofit organizations with no religious affiliation make up a large share of other types of agencies (Table 10.6.1).
HAVE AGENCIES WITH EMERGENCY FOOD PROVIDERS REPORTED CHANGES IN THE NUMBER OF CLIENTS SEEKING SERVICES?
• Among programs that existed in 2006, 85% of pantries, 45% of kitchens, and 42% of shelters of The Capital Area Food Bank of Texas, Inc reported that there had been an increase since 2006 in the number of clients who come to their emergency food program sites (Table 10.8.1).
WHERE DO AGENCIES WITH EMERGENCY FOOD PROVIDERS OBTAIN THEIR FOOD?
• Food banks are by far the single most important source of food for agencies with emergency food providers, accounting for 82% of the food distributed by pantries, 48% of the food distributed by kitchens, and 47% of the food distributed by shelters (Table 13.1.1).
• Other important sources of food include religious organizations, government, and direct purchases from wholesalers and retailers (Table 13.1.1).
• 40% of pantries, 20% of kitchens, and 19% of shelters receive food from The Emergency Food Assistance Program (Table 13.1.1).
VOLUNTEERS ARE EXTREMELY IMPORTANT IN THE FA NETWORK
• As many as 88% of pantries, 58% of kitchens, and 63% of shelters in The Capital Area Food Bank of Texas, Inc use volunteers (Table 13.2.1).
• Many programs rely entirely on volunteers; 56% of pantry programs and 4% of kitchens have no paid staff at all (Table 13.2.1).

Hunger in America 2010 The Capital Area Food Bank of Texas, Inc (4408)
5 CH 2. INTRODUCTION
2. INTRODUCTION
Many individuals and families across the United States confront a diverse and extensive
range of barriers in their procurement of adequate food such as financial constraints associated
with income and job loss, the high cost of a nutritious diet, and limited access to large stores with
more variety and lower prices.1 These challenges are reflected in statistics found using recent
government data that indicate that at least 14.6% of all households in the United States (17.1
million households) were food insecure at least some time during 2008. 2 Moreover, 5.7% of all
U.S. households (6.7 million households) had very low food security characterized by
disruptions in eating patterns and reductions in food intake of one or more household members,
at least some time during the year from not being able to afford enough food. These disruptions
are even more common among households with children younger than 18 (6.6% of all U.S.
households, or 2.6 million households, with children under 18 have very low food security). In
acknowledging the extent of food insecurity, policy makers, in accordance with Healthy People
2010, have set the public health goal of reducing the rate of food insecurity to 6 percent by the
year 2010. 3 This task has proved difficult, as the number Americans who are FI remains
1 Banks, J., M. Marmot, Z. Oldfield, and J.P. Smith. “Disease and Disadvantage in the United States and in
England.” Journal of the American Medical Association, vol. 295, 2006, pp. 2037-2045. Also, Turrell, G., B. Hewitt, C. Patterson, B. Oldenburg, and T. Gould. “Socioeconomic Differences in Food Purchasing Behavior and Suggested Implications for Diet-Related Health Promotion.” Journal of Human Nutrition and Dietetics, vol. 15, 2002, pp. 355-64. Powell, M. and Y. Bao. “Food Prices, Access to Food Outlets and Child Weight.” Economics & Human Biology, vol. 7, no. 1, March 2009, pp.64-72.
2 Mark Nord, Margaret Andrews, and Steven Carlson. “Household Food Security in the United States, 2008.” U.S. Department of Agriculture, Food and Nutrition Service. Economic Research Report No. 83 (ERS-83) November 2009.
3 Office of Disease Prevention and Health Promotion, U.S. Department of Health and Human Services. “Healthy People 2010.” Washington, DC: DHHS Office of Disease Prevention and Health Promotion, 2000.

Hunger in America 2010 The Capital Area Food Bank of Texas, Inc (4408)
6 CH 2. INTRODUCTION
stubbornly high. Indeed, the existence of large numbers of people without secure access to
adequate nutritious food represents a serious national concern.
While a sizable portion of low-income households and individuals adopt cost-saving
practices such as buying products when they are on sale and buying products in bulk, many find
it necessary to rely on an extensive network of public and private emergency food providers in
order to maintain an adequate food supply. In particular, throughout the United States, food
pantries, emergency kitchens, and homeless shelters play a critical role in meeting the nutritional
needs of America’s low-income population. By providing people who need assistance with food
for home preparation (pantries) and with prepared food that can be eaten at the agencies
(kitchens and shelters), these organizations help meet the needs of people and households that
otherwise, in many instances, would lack sufficient food.
Feeding America (FA), formerly America’s Second Harvest, plays a critical role in
helping these organizations accomplish their mission. FA, a network comprised of about 80% of
all food banks in the United States, supports the emergency food system by obtaining food for
the system from national organizations, such as major food companies, and providing technical
assistance and other services to the food banks and food rescue organizations. In addition to its
role in directly negotiating food donations and in providing, through its affiliates, substantial
amounts of food in bulk to emergency food providers, FA plays an extremely important role by
increasing awareness of the problems and ramifications of food insecurity and hunger and by
developing public and private initiatives to respond to it.
Over the years, FA has periodically studied the workings of its network and the
characteristics of the clients the network serves, both to assess the severity of nutrition-related
problems of the poor in America and to identify ways of increasing the effectiveness of its

Hunger in America 2010 The Capital Area Food Bank of Texas, Inc (4408)
7 CH 2. INTRODUCTION
operations. This report presents the results of the fifth comprehensive study sponsored by FA.
The study provides detailed information about the programs and agencies that operate under FA
network members and the clients the programs serve and provides an important basis for
developing public and private responses to food insecurity and hunger at both the national and
local levels.
This chapter of the report provides important background for the findings. Subsequent
sections are as follows:
• A highlight of the objectives of the study.
• An overview of the FA Network.
• An identification of the groups of organizations involved in conducting the study.
• A description of the layout of the report.
2.1 OBJECTIVES
The Hunger in America 2010 study comprises a national survey of FA emergency food
providers and their clients. The study had the following primary objectives:
• To provide annual and weekly estimates at the national and local levels of the number of distinct, unduplicated clients who use the FA network and to provide a comprehensive description of the nature of hunger and food insecurity among them.
• To describe the national and local demographic characteristics, income levels, SNAP benefit utilization, food security status, and service needs of persons and households served by the FA network, and to examine the ability of local agencies to meet the food security needs of their clients.
• To present national and local profiles of the characteristics of the agencies and programs that constitute the FA network in describing the charitable response to hunger throughout the nation.
• To compare national data between the 2005 and 2009 FA research studies and, where possible, to prior studies, to identify trends in emergency food assistance

Hunger in America 2010 The Capital Area Food Bank of Texas, Inc (4408)
8 CH 2. INTRODUCTION
demands, federal food assistance program use, and changing compositions of the network’s agencies and the clients they serve.
The Hunger in America 2010 study was designed to provide a comprehensive profile of
the extent and nature of hunger and food insecurity as experienced by people who access FA’s
national network of charitable feeding agencies. Information was collected on clients’
sociodemographic characteristics, including income and employment, benefits from SNAP and
other federal or private programs, frequency of visits to emergency feeding sites, and satisfaction
with local access to emergency food assistance. Information obtained from provider agencies
included size of programs, services provided, sources of food, and adequacy of food supplies.
2.2 OVERVIEW OF THE FEEDING AMERICA NETWORK
The FA network’s 205 certified members are regularly monitored by FA staff and food
industry professionals to ensure compliance with acceptable food handling, storage, and
distribution standards and practices. FA network members distribute food and grocery products
to charitable organizations in their specified service areas, as shown in Chart 2.2.1.
Within this system, a number of different types of charitable organizations and programs
provide food, directly or indirectly, to needy clients. However, there is no uniform use of terms
identifying the essential nature of the organizations. Hunger relief organizations are usually
grassroot responses to local needs. As such, they frequently differ throughout the country and
use different terminology. For clarity, and consistency with the terminology used in the 2005
study), the terms used in this report are defined as follows:
Food Bank. A food bank is a charitable organization that solicits, receives, inventories,
stores, and distributes donated food and grocery products to charitable agencies that directly

Hunger in America 2010 The Capital Area Food Bank of Texas, Inc (4408)
9 CH 2. INTRODUCTION
serve needy clients. These agencies include churches and qualifying nonprofit [Internal Revenue
Code 501(c) (3)] charitable organizations.
Partner Distribution Organization (PDO). PDOs, smaller food banks or larger
agencies allied with affiliated food banks, are private, nonprofit, charitable organizations
providing important community services. Although some are agencies, all PDOs distribute part
of their food to other charities for direct distribution to clients.
Food Rescue Organization (FRO). FROs are nonprofit organizations that obtain
mainly prepared and perishable food products from groceries, farmers, warehouses and
distributors, as well as from food service organizations, such as restaurants, hospitals, caterers,
and cafeterias, and distribute to agencies that serve clients.
Agencies and Food Programs. FA network members distribute food to qualifying
charitable agencies, most of which provide food directly to needy clients through food programs.
Some agencies operate single-type and single-site food programs, while others operate food
programs at multiple sites and sometimes operate several types of food programs.

Hunger in America 2010 The Capital Area Food Bank of Texas, Inc (4408)
10 CH 2. INTRODUCTION
CHART 2.2.1
SOURCES OF FOOD AND CHANNELS OF FOOD DISTRIBUTION FOR FOOD BANKS
FEEDING AMERICATHE NATION’S FOOD BANK NETWORK
205 NETWORK MEMBERS
(FOOD BANKS AND FOOD RESCUE
ORGANIZATIONS)
LOCAL FOOD SOURCESNational DonorsPurchased Food ProgramsProduce ProgramsFood Salvage & ReclamationPrepared Food ProgramsLocal Food DrivesLocal FarmersLocal Retailers, Growers, & ManufacturersUSDA Commodities
SUBSIDIARYDISTRIBUTION
ORGANIZATIONS(SDOs)
EMERGENCY FOOD PROGRAMS(Primary Purpose to Provide Food
to People in a Hunger Crisis)
NON-EMERGENCY FOOD PROGRAMS(Primary Purpose Other than to Provide
Food in a Hunger Crisis)
Youth Programs
Drug & Alcohol Rehab Programs
Senior Programs
Other Programs
EmergencyPantries
EmergencyKitchens
EmergencyShelters
FEEDING AMERICANATIONAL FOOD SOURCES
National Donors & National Food Drives
a Non-Emergency food programs were not sampled for client data collection.

Hunger in America 2010 The Capital Area Food Bank of Texas, Inc (4408)
11 CH 2. INTRODUCTION
For this research, there are two general categories of food programs that FA network
members serve: emergency and nonemergency. Emergency food programs include food
pantries, soup kitchens, and shelters. Their clients typically need short-term or emergency
assistance.
• Emergency Food Pantries distribute nonprepared foods and other grocery products to needy clients, who then prepare and use these items where they live. Some food pantries also distribute fresh and frozen food and nutritious prepared food. Food is distributed on a short-term or emergency basis until clients are able to meet their food needs. An agency that picks up boxed food from the food bank to distribute to its clients was included as a food pantry. The study excluded from this category any agency that does not directly distribute food to clients or distributes bulk food only on a basis other than emergency need (such as U.S. Department of Agriculture [USDA] commodities to all people over age 60). On the other hand, a food bank distributing food directly to clients, including clients referred from another agency, qualified as a food pantry.
• Emergency Soup Kitchens provide prepared meals served at the kitchen to needy clients who do not reside on the premises. In some instances, kitchens may also provide lighter meals or snacks, such as fresh fruit, vegetables, yogurt and other dairy products, and prepared food such as sandwiches, for clients to take with them when the kitchen is closed. This category includes “Kids Cafe” providers.
• Emergency Shelters provide shelter and serve one or more meals a day on a short-term basis to low-income clients in need. Shelter may be the primary or secondary purpose of the service. Examples include homeless shelters, shelters with substance abuse programs, and transitional shelters such as those for battered women. The study did not categorize as shelters residential programs that provide services to the same clients for an extended time period. Other excluded programs are mental health/retardation group homes and juvenile probation group homes.
Nonemergency organizations refer to any programs that have a primary purpose other than
emergency food distribution but also distribute food. Examples include day care programs,
senior congregate-feeding programs, and summer camps.

Hunger in America 2010 The Capital Area Food Bank of Texas, Inc (4408)
12 CH 2. INTRODUCTION
2.3 GROUPS AND ORGANIZATIONS INVOLVED IN THE STUDY
The study was conceived and coordinated by the national offices of FA. Data were
collected by 185 FA network members or consortia around the country. FA’s research
contractor, Mathematica Policy Research provided technical advice throughout the study and
implemented the sampling and data analysis activities.
As part of the study review process, oversight and advice were provided by a Technical
Advisory Group convened by FA. This group consisted of:
• John Cook, Associate Professor at Boston Medical Center Department of Pediatrics (Chair)
• Beth Osborne Daponte of the United Nation Development Programme’s Human Development Report Office (on leave fromYale University)
• Jim Ohls, independent consultant for Feeding America
• Rob Santos, Senior Institute Methodologist at the Urban Institute
As part of the study review process, an additional team of reviewers participated in the
review of the national draft report:
• Steve Carlson, Office of Research and Analysis Food and Nutrition Service at the U.S. Department of Agriculture
• Stacy Dean, Director, Food Assistance Policy Center on Budget and Policy Priorities
• Craig Gundersen, Associate Professor at the Department of Agricultural and Consumer Economics at the University of Illinois
• Walter Lamia, doctoral candidate at the Colorado State University School of Education
Also, the Member’s Advisory Committee (MAC), consisting of selected members of the
FA national network, provided valuable input during the research process:
• Marian Guinn, CEO of God’s Pantry Food Bank (Committee Chair)

Hunger in America 2010 The Capital Area Food Bank of Texas, Inc (4408)
13 CH 2. INTRODUCTION
• Jeff Dronkers, Chief Programs & Policy Officer of the Los Angeles Regional Food Bank
• Karen Joyner, Chief Financial Officer of the Food Bank of Southeastern Virginia
• Lori Kapu, Chief Programs Officer of Care and Share Food Bank
• Erin Rockhill, Director of Agency Relations & Program Development of the Second Harvest Food Bank of East Central Indiana
• Carol Tienken, Chief Operating Officer of the Greater Boston Food Bank
• Kristen Yandora, Controller of Forgotten Harvest
• JC Dwyer, State Policy Coordinator of the Texas Food Bank Network
2.4 OVERVIEW OF THE REST OF REPORT
Chapter 3 provides an overview of the methodologies used in the study and shows the
proportion of agencies that participated among all eligible agencies in the FA National Network
and The Capital Area Food Bank of Texas, Inc. Chapter 4 makes projections of the numbers of
clients served by The Capital Area Food Bank of Texas, Inc. Chapters 5 through 9 present
detailed findings from the client survey, including information about characteristics of The
Capital Area Food Bank of Texas, Inc clients, their levels of need, and their experiences with the
program. Chapters 10 through 14 present findings from the agency survey, including data on
characteristics and program operations in The Capital Area Food Bank of Texas, Inc service
area.


Hunger in America 2010 The Capital Area Food Bank of Texas, Inc (4408)
15 CH 3. METHODS
3. METHODS
This study had two components: (1) an agency survey that collected information about
the food programs operating in the FA network, and (2) a client survey that collected information
from the people using food pantries, emergency kitchens, and shelters in order to provide a better
understanding of their needs. Each of the participating food banks helped Mathematica with the
development of the sampling frame and with the data collection. Mathematica provided technical
assistance with the implementation of the agency and client surveys.
This section provides an overview of the methods used in the survey and analysis work.
(Detailed information is contained in the Technical Appendix of the report.) We first discuss
two key activities common to both surveys: (1) instrument development, and (2) the training of
food bank staff on survey procedures. We then describe each of the two surveys.
3.1 INSTRUMENT DEVELOPMENT
The data collection instruments for this study were based on the questionnaires used in
the 2005 study, revised to reflect the 2005 data collection experience and the needs of FA.
Mathematica worked closely with FA to revise the questionnaires so that they would provide
high-quality data.
3.2 TRAINING
To ensure that each food bank study coordinator had the proper knowledge to administer
the surveys, Mathematica conducted three regional, two-day, in-depth training sessions. Most of
the training dealt with showing the study coordinators how to prepare local interviewers to
conduct the client survey. Each study coordinator also received a training video demonstrating

Hunger in America 2010 The Capital Area Food Bank of Texas, Inc (4408)
16 CH 3. METHODS
the client interview process and a manual containing sample materials and an outline of the FA
network members’ responsibilities.
3.3 AGENCY SURVEY
Mathematica developed the sampling frame for the agency survey by first obtaining,
from participating FA network members, lists of all active agencies each member served and
then entering the names into a database. The agency survey sample consisted of a census of the
agencies provided by the participating members.
After entering the data, Mathematica staff printed bar-coded mailing labels to identify the
agencies and their addresses and then shipped the proper number of questionnaires, labels, and
mailing envelopes to each participating member. Some members mailed advance letters
informing agencies of the planned survey. Study coordinators were instructed, at the training
and in the manual, how to assemble and mail the questionnaires. Each envelope included a
personalized cover letter.
Agencies also had the option to complete the agency survey online. In letters mailed to
their member agencies, food banks provided the web address and log-in information that each
agency could use to complete the questionnaire online. In addition, those agencies for which
Mathematica had valid e-mail addresses were e-mailed an invitation to participate. Reminder e-
mails were sent every two weeks during the early part of the field period and weekly toward the
end of the February to June 2009 field period to agencies that had not submitted a questionnaire.
The cover letter, as well as the instructions on the hardcopy questionnaire, directed the
agency to complete the questionnaire and mail it back to Mathematica. In most instances,
agencies did so, but some members collected the instruments from their agencies and mailed
them to Mathematica in bulk. When Mathematica received a questionnaire, staff logged it into a

Hunger in America 2010 The Capital Area Food Bank of Texas, Inc (4408)
17 CH 3. METHODS
database by scanning the bar code on the mailing label. Each Monday morning, Mathematica
sent an e-mail to the members listing all the questionnaires received the previous week. These e-
mails served as the basis for the mailing of reminder postcards to those agencies that did not
return the questionnaire within two weeks of the initial mailing, and a second mailing, this time
of questionnaires, to agencies that did not return the first one within two weeks after the mailing
of reminder postcards. The weekly e-mails also helped the member study coordinators schedule
reminder calls to agencies that did not return the questionnaire within three weeks after the
second mailing. Occasionally, in areas where response to the mailings of questionnaires was
particularly low, member coordinators completed the questionnaires with nonresponding
agencies over the phone. Members were also asked to apprise Mathematica of agencies that no
longer provided food services so that they could be identified as ineligible in the database.
After Mathematica received, logged into the database, and reviewed the questionnaires,
they were shipped to a subcontractor for data capture and imaging. The subcontractor optically
scanned all questionnaires and produced data files and CD-ROMs with images of each
completed questionnaire for Mathematica. Chart 3.3.1 summarizes the sequence of activities of
the agency survey.

Hunger in America 2010 The Capital Area Food Bank of Texas, Inc (4408)
18 CH 3. METHODS
CHART 3.3.1
AGENCY SURVEY ACTIVITIES
Responsibility for Activity
Mathematica Policy Research
Participating FA Network Members
Review of Agency Survey Designfrom 2005 Study
Report Preparation--National--Local--State--Special Reports
Data Processing--Data capture by optical scanning--Data tabulation and analysis
Follow-up with Agencies NotResponding to Initial Mailing
Participating Food BankSurvey Mailing
Database Preparation--Cleaning and editing--Addition of tracking numbers
Agency Survey Final Design
Agency Database Creation
Agency DatabaseStructure Development
Agency Survey Redesign
Survey Materials and InstructionsMailed to Participating Food Banks
Computer File of Active Agencies
Assist Food Banks and Agencies
Mailing Label Generation
Survey Instrument Printing
HUNGER IN AMERICA 2010FEEDING AMERICA NATIONAL RESEARCH STUDY
Develop Web Survey
Finalize Web Survey
Web Survey Instructions Emailed to Food Banks
with Valid Email Addresses
Email Reminders Sent toNon-responding Agencies

Hunger in America 2010 The Capital Area Food Bank of Texas, Inc (4408)
19 CH 3. METHODS
3.4 CLIENT SURVEY
Preparation for the client survey began with the selection of the FA providers where
interviewing was to take place. As previous Hunger in America surveys had done, the client
survey in the 2010 study focused on obtaining data on emergency food providers in the FA
system and on the people those providers serve. The three types of providers whose clients were
included in the 2009 survey (and previous Hunger in America surveys) were food pantries,
emergency kitchens, and shelters. Many food banks also provide food to other types of agencies,
such as those serving congregate meals to seniors and agencies operating day care centers or
after-school programs. These other types of agencies perform important roles, but they were
defined to be outside the purview of the study because they do not focus on supplying emergency
food to low-income clients.
At the outset of the 2010 study, we asked the FA food banks that chose to participate to
provide Mathematica with lists of all the agencies they served, indicating whether each agency
was involved in emergency food provision and, if so, what type of agency it was (pantry,
kitchen, shelter, or multitype). Mathematica sampling statisticians then drew initial samples of
the agencies where interviews were to take place. These selections were made with probabilities
proportional to a measure of size based on reported poundage distributions as the measure of
size; that is, large agencies had greater probabilities of selection.
After the initial sampling, Mathematica asked the food banks to provide detailed
information for the providers or programs in the sample of agencies. The information sought
included when they were open and the average number of clients they served per day. For small,
medium, and large food banks (as classified by FA), the sample of agencies for this detailed
information was approximately 57, 76, and 95, respectively. Mathematica then used the detailed

Hunger in America 2010 The Capital Area Food Bank of Texas, Inc (4408)
20 CH 3. METHODS
information from the sample of agencies to form three pools of providers and drew samples of
providers for the client interviewing. At this time, we also selected a reserve sample to account
for possible refusal or ineligibility of a provider selected in the primary sample.
For each sampled provider or program, Mathematica selected a specific day and time
when the interviewing was to occur, based on the detailed information the food bank had sent to
Mathematica. We also provided a range of acceptable dates and times if our selection was not
workable for the data collectors. The food banks were responsible for sending staff or volunteers
to each selected program at the specified date and time to conduct the interviews. The data
collectors were to use (1) the client selection forms developed by Mathematica and approved by
FA, and (2) a questionnaire that Mathematica and FA had designed jointly. Clients at the
facilities were selected for the interviews through locally implemented randomization procedures
designed by Mathematica.4 In total, more than 62,000 clients were interviewed for the national
study. Mathematica had another firm (a subcontractor) optically scan the completed
questionnaires into an electronic database, and the resulting data files provided the basis for the
client analysis.
During the fielding, we used randomly selected site replacements only when an agency,
provider, or program refused to participate in the client interview effort or if, after conferring
with the food bank and agency, we determined the provider to be ineligible for the study. In
cases where food banks did not have reserve sample, we drew a supplemental first-stage sample
and requested additional information or assigned an additional visit to a program among the
programs already sampled. In some instances, we discovered while obtaining additional
4 These procedures involve enumerating the client being served at the time of data collection (for example,
by when they came to the facility or their place in a line), then taking a “1 in n” sample with a random starting point.
Hunger in America 2010 The Capital Area Food Bank of Texas, Inc (4408)
21 CH 3. METHODS
information that an agency (or provider) was no longer operating or did not run a pantry, kitchen,
or shelter. In such instances, we dropped the agency (or provider) from the sample.
Mathematica prepared bar-coded labels with identification numbers for the client
questionnaires. We also developed and printed, for use by interviewers, client selection forms
designed to allow the interviewer to randomly select program participants and to enumerate the
number of completed interviews, refusals, and ineligible sample members during on-site data
collection. We shipped these materials and client questionnaires to food banks for distribution to
the individual data collectors.
After data collection at a provider was completed, the food bank study coordinators
shipped questionnaires and client selection forms back to Mathematica. Mathematica staff then
logged each questionnaire into a database by scanning the bar-coded label on the cover page. As
with the agency survey, each Monday morning Mathematica sent an e-mail to the members
listing the agencies where client questionnaires were completed the previous week. The e-mails
allowed the member study coordinators to monitor their progress in completing the client survey
portion of the study.
After Mathematica received the questionnaires and Mathematica staff logged them into
the database, the questionnaires were shipped to the subcontractor for data capture and imaging.
The subcontractor optically scanned the questionnaires and produced data files for Mathematica.
As with the agency survey, Mathematica received data files and electronic images of all
completed client questionnaires on CD-ROMs. Chart 3.4.1 summarizes the sequence of
activities in the client survey.

Hunger in America 2010 The Capital Area Food Bank of Texas, Inc (4408)
22 CH 3. METHODS
CHART 3.4.1
CLIENT SURVEY ACTIVITIES
Sample Frame andDatabase Creation
Review of Client Surveyfrom 2005 Study
Database Preparation--Cleaning and editing--Addition of tracking numbers
Sampling DesignClient Survey Final Design
Client Survey Redesign
Interviewer Training
Training Material Development
Spanish Translationof Final Survey
Report Preparation-- National-- Local-- State-- Special Reports
Data Processing--Data capture by optical scanning--Data tabulation and analysis
Follow-up with Food Banksfor Interview Problem Solving
Conduct Interviews withClients at Sampled Agencies
RESPONSIBILITY FOR ACTIVITY
Mathematica Policy Research Participating Food Banks Feeding America
SurveyInstrument Printing
Interviewing Date andTime Assigned
Labels and Client Selection Forms Printed
Data Collection and Training Materials Shipped to Food Banks
Revision of Training DVD
Hunger Study Coordinator Training
HUNGER IN AMERICA 2010FEEDING AMERICA NATIONAL RESEARCH STUDY
Webinars for Hunger Study Coordinators

Hunger in America 2010 The Capital Area Food Bank of Texas, Inc (4408)
23 CH 3. METHODS
3.5 RESPONSE RATES
As Chart 3.5.1 shows, of the FA national network of 205 members, 185 member food
banks covering all or part of 47 states and the District of Columbia participated in the agency
survey. Of those members, 181 completed data collection for the client survey.
Client Survey. A total of 181 individual members contacted 12,700 agencies to gain
access for on-site client data collection. Of those agencies, 12,554 provided detailed information
about their programs and 6,454 were sampled for their program sites and participated in client
data collection.
FA network members’ staff and volunteers sampled 82,301 clients at the eligible
agencies; of those 1,557 were determined to be ineligible for age or other reasons. Client
interviews were completed with 62,143, or 77.0%, of the eligible respondents.5
Agency Survey. A total of 185 participating FA network members sent out
questionnaires to 50,471 eligible agencies.6 Mathematica received completed questionnaires
from 37,098 (73.5%) agencies.
FA Research Involvement. Chart 3.5.2 shows an overview of the process The Capital
Area Food Bank of Texas, Inc followed for this study. It also identifies the completed numbers
of responses from the client interviews and the agency survey, by program type. For the service
area of The Capital Area Food Bank of Texas, Inc, see Chart 3.5.3.
5 Interviews were conducted only with respondents age 18 or older. 6 Some additional questionnaires were mailed out to agencies who were later found to be no longer
operating or to be otherwise ineligible.

Hunger in America 2010 The Capital Area Food Bank of Texas, Inc (4408)
24 CH 3. METHODS
CHART 3.5.1
STUDY OVERVIEW
HUNGER IN AMERICA 2010FEEDING AMERICA NATIONAL RESEARCH STUDY
Feeding America’s Food Banks--205 Network Members Serve the United Statesa
--185 Network Members Participated in Agency Survey--181 Network Members Participated in Client Survey--Research Conducted in 47 States and Washington, DCb
Data Collection from Member Agencies--185 Network Members Participated--50,471 Eligible Agencies Received Survey-- 37,098 Agencies Returned Information--Methodology
-Universal Sampling-Web or Hard Copy Questionnaires
--Design/Analysis by Mathematica--Review of Design by FA
Data Collection from Clients:--181 Network Members Participated--62,143 Total Client Respondents--Methodology
-Representative Sampling by Agency Type-In-Person Interviews
--Design/Analysis by Mathematica--Review of Design by FA
Reports--Comprehensive National Report--Local Reports
-Food Bank Level-State Level-Special Area Reports
--Technical Appendix
a This includes Puerto Rico. b Client survey conducted in 47 states and Washington, DC.

Hunger in America 2010 The Capital Area Food Bank of Texas, Inc (4408)
25 CH 3. METHODS
CHART 3.5.2
ORGANIZATIONS AND INDIVIDUALS INVOLVED IN THE RESEARCH PROCESS
HUNGER IN AMERICA 2010FEEDING AMERICA NATIONAL RESEARCH STUDY
The Capital Area Food Bank of Texas, Inc
EMERGENCY FOOD PROGRAMS(Primary Purpose to Provide Food to People in
a Hunger Crisis)
NONEMERGENCY FOOD PROGRAMS
(Primary Purpose Other than to Provide Food in a Hunger
Crisis)
EmergencyPantries
EmergencyKitchens
EmergencyShelters
OtherPrograms
296 ClientsInterviewed296 ClientsInterviewed
46 ClientsInterviewed46 Clients
Interviewed12 Clients
Interviewed12 Clients
Interviewed
Reported on210 Programs
Reported on210 Programs
Reported on187 Programs
Reported on187 Programs
Reported on30 Programs
Reported on30 Programs
Reported on30 Programs
Reported on30 Programs
FoodProgram
Types
ClientInterviews
AgencySurvey
Client Interviews: 354 Clients Interviewed at Emergency Food Programs
Agency Survey: 257 Agencies Responded to the Agency SurveyReporting on 457 Programs
TECHNICAL ADVISORY GROUP
MATHEMATICAPOLICY RESEARCH
FEEDING AMERICA (FA)
MEMBER ADVISORYCOMMITTEE

Hunger in America 2010 The Capital Area Food Bank of Texas, Inc (4408)
26 CH 3. METHODS
CHART 3.5.3
THE CAPITAL AREA FOOD BANK OF TEXAS, INC SERVICE AREA

Hunger in America 2010 The Capital Area Food Bank of Texas, Inc (4408)
27 CH 3. METHODS
3.6 ANALYSIS METHODS
Most of the findings presented in this report are based on tabulations of the survey data.
In this section, we describe the methods used in this work.
3.6.1 Tables
In the descriptive tabulations of clients presented in chapters 5 through 9, the percentage
figures in the tables are based on the total weighted number of usable responses to the client
survey, unless specified otherwise. Responses are weighted to represent clients or households of
all emergency food programs. In general, weights are based on the inverse probabilities of
selection in the sampling and also account for survey nonresponse.7 Weights were scaled so that
the final weights represent a month-level count of different clients, as derived in Chapter 4 of the
national report.8
Similarly, all tables containing information obtained from the agency survey, as
presented in chapters 10 through 14, are based on the weighted total number of usable responses
to the agency survey, unless specified otherwise. The descriptive tabulations in these chapters
represent all FA emergency food programs. The weights, calculated based on the sampling
frame, also account for survey nonresponse.
Percentage distributions in the client tables are presented by the type of the programs
where clients were interviewed (pantries, kitchens, or shelters). When appropriate, the
percentage distribution for “all clients” is shown in the last column. Most tabulations of the
agency data are presented by the type of programs operated by the agencies.
7 To reduce variances in the analysis, we truncated weights with extremely large values. However, to keep the sum of weights unchanged, we then adjusted the weights by an adjustment factor, which is the ratio of the sum of the original weights to the sum of the truncated weights.
8 Originally, we computed weights to make the sample representative at the weekly level. We later
converted them to a monthly scale to take into account the fact that, compared with kitchen and shelter users, most pantry users do not visit the program in any given week.

Hunger in America 2010 The Capital Area Food Bank of Texas, Inc (4408)
28 CH 3. METHODS
The percentages in the tables are rounded to one decimal place and are based only on the
valid responses. They exclude missing, “don’t know,” refusal, and other responses deemed
incomplete for the question.
The sample sizes presented at the bottom of single-panel tables (or at the bottom of each
panel of multipanel tables) reflect the total number of responses to the question (unweighted).
Where the question relates to a subset of the respondents, the appropriate sample size is
presented. In general, these sample sizes include missing responses, as well as “don’t know” and
refusal responses. We report the percentages of item nonresponse in notes to each table.
The main reason for including only valid responses is to present appropriately the
weighted percentage distribution among the main response categories of interest. Our
preliminary analysis of item nonresponse revealed little evidence of any systematic biases, and
excluding missing data also has the advantage of being consistent with the convention used for
previous studies commissioned by FA.
Some tables also present the average (mean) or the median values associated with the
variable of interest. The average, a measure of central tendency for continuous variables, is
calculated as the weighted sum of all valid values in a distribution, divided by the weighted
number of valid responses. The median is another measure of central tendency. It is the value
that exactly divides an ordered frequency distribution into equal halves. Therefore, 50% of the
weighted number of valid responses have values smaller than the median, and the other
50% have values larger. The median is suitable only for describing central tendency in
distributions where the categories of the variable can be ordered, as from lowest to highest.

Hunger in America 2010 The Capital Area Food Bank of Texas, Inc (4408)
29 CH 3. METHODS
3.6.2 Other Methodological Considerations
Certain other conventions should be noted in interpreting the findings of the study and
how they are presented. Below we discuss the distinction between clients and respondents and
describe the structure of reports available from the project.
Clients Versus Respondents. Clients are defined differently by program type. The
kitchen and shelter programs are viewed as serving only those who are present at the program
site. (Thus, in general for these providers, the survey respondents are representative of all
clients.) 9 However, pantry programs are regarded as serving all members of respondents’
households.
At the kitchen and shelter providers, the sampling unit was the individual. That is, the
interviewers were instructed to treat members of a single household as separate respondents if
they were selected by our random sampling process and met other eligibility criteria (such as
being at least 18 years of age). At the pantry programs, on the other hand, the sampling unit was
the household, and only one interview was completed for each randomly selected household,
even when two or more members of the household were present at the program.
Ideally, the survey would have obtained all relevant information about every member of
the household, especially among pantry users. However, so as not to overburden respondents,
the survey was designed to acquire information about at most 10 members of the household,
including the respondent. Also, this series of questions was limited to a set of variables of
interest, such as sex, age, relationship to the respondent, citizenship, and employment status.
9 One exception was children at the kitchens and shelters. They were clients, but they were not
respondents, because only clients age 18 or older were interviewed for this study. However, the children were taken into account in estimating the total number of clients.

Hunger in America 2010 The Capital Area Food Bank of Texas, Inc (4408)
30 CH 3. METHODS
Because households with more than 10 members are uncommon, we do not believe that this has
significantly affected our estimates.
National Versus Local Reports. Hunger in America 2010 has produced a set of reports
to serve both national and local interests and to be useful to a wide range of audiences with
varying needs. This national report consists of information gathered through 181 participating
members for the client survey and 185 members for the agency survey. In addition, in most
cases, a local report was generated containing information on clients and agencies served by a
particular member. There are roughly 185 member-level local reports. In addition, state-level
reports were produced when all FA network members in a particular state participated in this
study. About forty-one states achieved full participation of their members.
In addition to the comprehensive national and local reports, FA will disseminate Hunger
in America 2010: An Extended Executive Summary, which contains key findings from the
comprehensive national report. A Technical Appendix, which describes in detail the
methodologies of the current study, will be available separately for technical audiences.
Tables in the local and national reports are numbered comparably to facilitate
comparisons between the local and national findings. Not all tables from the national report are
reproduced in the local documents.
Statistical Sampling Variation and Measurement Error. As with all estimates relying
on statistical samples, the client survey estimates in this report are subject to “sampling error,”
resulting from the fact that they are based on samples of clients rather than information about all
clients. The margins of error due to this factor vary among individual estimates, depending on
such factors as sample sizes, the nature of the client characteristics being estimated, and the
number of different providers within a food bank at which the client data collection took place.

Hunger in America 2010 The Capital Area Food Bank of Texas, Inc (4408)
31 CH 3. METHODS
In addition to the sampling error, error also exists in the estimates from the operational
components of the survey (non-sampling error), such as nonresponse, reporting error, and
measurement error. While the sampling design and sample sizes can impose some control on the
sampling error (and while this error can be quantified), the non-sampling error reflects the degree
of success in designing the questionnaire and data collection procedures and in conducting the
data collection activities at all stages. Unfortunately, the non-sampling error cannot be
quantified. The exact amount of variation (both sampling error and non-sampling error) will be
different for different data items, and the relative contribution of sampling error and non-
sampling error to the total survey error will also vary by survey estimate.
For most percentage estimates based on the full sample size for a food bank, this
sampling variation can lead to “confidence intervals” extending approximately plus or minus
8 percentage points around the estimate. For instance, if a certain client characteristic percentage
is estimated to be 60% within a given food bank, and the “margin of error” is 8 percentage
points, we can be reasonably certain it is someplace in the range of 52% to 68%. In many
instances, particularly when the sample is divided into subgroups, the width of the confidence
interval can be greater.
The ranges of precision highlighted above focus only on sampling variation due to
statistical sampling and the number of completed interviews. As noted previously, other forms of
survey error (the non-sampling error) will increase overall survey error. These other forms of
error include
• Nonresponse. When completed interviews are obtained from only a portion of the clients selected for the survey
• Response Error. When the client interviewed does not provide an accurate answer to a question because the client either misunderstands the question or chooses not to provide an accurate answer

Hunger in America 2010 The Capital Area Food Bank of Texas, Inc (4408)
32 CH 3. METHODS
• Reporting Error. When counts or other information used in the sampling and other data collection activities are in error or missing
• Measurement Error. When the question in the questionnaire is not worded effectively to obtain the desired information from the client
These forms of error exist in all surveys, but the size of the non-sampling error (relative
to the sampling error) depends on the design of the data collection activities and implementation
of these by all persons involved. In this survey, most of the interviewers did not have extensive
experience in data collection work, and while Mathematica supplied general training guidelines
and materials, there was undoubtedly considerable variation between food banks as to how the
training was implemented. Inevitably, as in any survey, some interviewers may have read
questions incorrectly, clients may have understood questions incorrectly, and even correct
answers may sometimes have been incorrectly recorded on the survey instrument. All these
factors may have led to “non-sampling error” that is in addition to the sampling error
discussed above.
Estimating Client Turnover Rates Within the FA System. An important goal of the
periodic FA surveys has been to develop annual estimates of the number of clients participating
in the FA emergency food assistance system. However, it is much more straightforward to
estimate the number of clients at a given point in time than to estimate the number over a year.
This is because the annual number depends on turnover in the system. As an example, consider
a pantry that serves 100 clients per month. If the same clients go to the pantry month after
month, then the annual number of clients for the pantry will be equal to 100 since there is no
turnover across months. If mostly the same clients go to the pantry month after month, then the
annual number of clients for the pantry will be slightly greater than 100 to account for a few
clients leaving and others replacing them. If mostly different clients come each month, however,

Hunger in America 2010 The Capital Area Food Bank of Texas, Inc (4408)
33 CH 3. METHODS
the pantry could serve 1,000 clients, or even more, in a year. Thus, taking into account the
amount of client turnover can have major implications for overall client estimates.
Turnover rates are important for the research objective of making annual estimates of
different clients. They are much less important from an operational perspective, however, and
most FA providers do not have reliable data on the total number of different clients served in a
year. Also complicating annual estimation research is the constraint that, for logistical reasons,
the survey can observe the system directly for only a few months.
Because of these factors, the study depends on information obtained during the client
interviews to draw inferences about client usage of the system over a 12-month period. Survey
recall problems pose formidable challenges to interpreting the data, however, because many
clients may not accurately recall and report their past usage patterns for an entire year.
Typically, clients are able to supply accurate information about their usage of the emergency
food system during a recent period, such as a week (or even perhaps a month), but as the period
gets longer, recall usually becomes less reliable. While long recall periods are a problem for
many surveys, they may be particularly problematic for the FA client population, because many
of them are concentrating on how to meet day-to-day household needs with low resources, rather
than thinking about the past year.
As in the 2005 survey, we tried to examine client turnover based on the self-reports of
survey respondents about their patterns of using the FA system. The research strategy focuses on
the “newcomer rate,” defined as the percentage of clients at a given point in time who have
started using FA providers within the past month but had not used the FA system in the previous

Hunger in America 2010 The Capital Area Food Bank of Texas, Inc (4408)
34 CH 3. METHODS
12 months. If we can estimate “newcomers” defined in this way for 12 months in a row, the sum
yields a measure of all the people who entered the system during the past year.10
The 2009 survey used a question that was first added to the survey questionnaire in 2005:
P61b Now, thinking about the past year, did you or anyone in your household use a pantry…
1 ! Every month, (12 MONTHS)
2 ! Almost every month, (10-11 MONTHS)
3 ! Most months, (6-9 MONTHS)
4 ! Some months, (4-5 MONTHS)
5 ! Just a few months, (2-3 MONTHS)
6 ! Just this month?
D ! DON’T KNOW
R ! REFUSED
3.7 REPORTING CONVENTIONS IN FOOD BANK REPORTS
In some instances, there were certain client-based tabular analyses for which fewer than
30 observations were available. (This happened mostly with shelters and, to a lesser extent,
kitchens.) In these instances, the relevant tabulations have not been included in the tables,
because there are too few client observations for the results to be statistically reliable.11
When client tabulations have been suppressed because of small sample sizes, the entry
n.p. (“not presented) is made in the relevant columns of the tables. In these cases, the client
10 Key to the approach outlined in the text is that a “newcomer” is defined as a person who starts using the
FA system and has not previously used it for at least a year. Of course, some people may enter and exit the system several times during the year; however, in making annual unduplicated estimates, we want to count these people only once a year.
11 On the other hand, when presenting agency findings, we have reported tabulations with fewer than 30 programs, in part because some of the smaller members do not have as many as 30 kitchens or shelters.

Hunger in America 2010 The Capital Area Food Bank of Texas, Inc (4408)
35 CH 3. METHODS
observations are included in computing the “total” column, which is aggregated across the three
types of programs.12
In some instances, there may be no observations available at all for a column or cell of a
table. In those cases, we have entered N.A. (“not available”). In other instances, a survey
question is asked only of clients at a specific type of program such as pantries. In these cases, the
entry n.a. (“not applicable”) is made in the relevant columns of the tables.
12 Because of a limitation of the computer system used to generate the member-level reports, in some
instances a chart corresponding to a table with the n.p. or N.A. conventions may actually have a graphic corresponding to the suppressed column in the table. In those instances, that part of the chart should be ignored.


Hunger in America 2010 The Capital Area Food Bank of Texas, Inc (4408)
37 CH 4. ESTIMATED NUMBERS OF AGENCIES AND CLIENTS
4. ESTIMATED NUMBERS OF AGENCIES AND CLIENTS
This section presents estimates of the number of clients and agencies in the area served
by The Capital Area Food Bank of Texas, Inc. These estimates are derived from the sampling
and data collection work in the area covered. In assessing these estimates, it is important to
remember that the FA system is dynamic and constantly changing. Also, because of various
factors detailed later in the chapter, the available estimation methodologies sometimes involve
substantial margins of error. For the annual and weekly client counts, we discuss both the
estimate and the associated margin of error.
Sections 4.1 and 4.2 present an overview of the estimates. Section 4.3 discusses the
limitations of the projections.
4.1 ESTIMATED NUMBER OF AGENCIES
During the preparation for the survey work, FA network members were asked to supply
Mathematica with lists of all the member agencies to which they distribute food. Mathematica
then carefully reviewed these lists, and to refine them, in some instances performed several
stages of interaction with members.
On the basis of the final list of agencies generated by this process, we estimate that The
Capital Area Food Bank of Texas, Inc served approximately 325 agencies at the time of the
survey, of which 257 agencies responded to the agency survey. These responses contained
usable information on 187 pantries, 30 kitchens, 30 shelters, and 210 other nonemergency food
programs.

Hunger in America 2010 The Capital Area Food Bank of Texas, Inc (4408)
38 CH 4. ESTIMATED NUMBERS OF AGENCIES AND CLIENTS
4.2 ESTIMATED NUMBER OF CLIENTS
The Capital Area Food Bank of Texas, Inc attempted interviews with clients at certain
agencies that it serves, determined as a subsample of agencies Mathematica selected using
randomizing procedures. Based on the results of this agency-level sampling process and of the
random sampling of clients implemented at the sites, Mathematica developed survey weights that
make the sample representative of all clients of The Capital Area Food Bank of Texas, Inc.
From these weights we have developed estimates of the numbers of FA clients served
within the areas of The Capital Area Food Bank of Texas, Inc. Originally we did the weighting
at the weekly level, to make the sample representative of clients served in a given week. We
then extrapolated these weekly estimates to cover an annual period, using the same percentage
projection factors as those used with the national data, as described in the Hunger in America
2010 National Report.
Based on this approach, the estimated number of different clients served per week by FA
emergency food providers in the area served by The Capital Area Food Bank of Texas, Inc is
48,000. The estimate of different clients served annually is 284,900. Because these estimates
are based on relatively small survey samples and are therefore subject to considerable statistical
sampling error, it is important qualify these estimates with a measure of error. The 90-percent
confidence interval for the weekly count is 41,000 to 54,900 clients and the 90-percent
confidence interval for the annual count is 200,900 to 368,800 clients. Standard statistical
analysis indicates that we can be reasonably certain the true values of the weekly and annual
counts fall within these ranges. Additional details of how to interpret estimates using ranges
based on sampling error are provided in Appendix A.

Hunger in America 2010 The Capital Area Food Bank of Texas, Inc (4408)
39 CH 4. ESTIMATED NUMBERS OF AGENCIES AND CLIENTS
The weekly estimate is meant to be an estimate of the number of different people who use
emergency food services supplied by the food bank in a week. Each person is only included
once. For instance, if the same person goes to a soup kitchen three times during the week, that
person is only counted once not three times. For pantry users, all persons in a household are
included in the count.
The annual unduplicated count is defined similarly to the weekly count. It is an estimate
of all of the people served during a year by emergency food providers that are supplied by the
food bank. People who use the system multiple times are only counted once. For instance, if a
household used a pantry every month for the year, members of that household would only be
counted once. In general, the annual count will be much less than 52 times the weekly count,
because most people getting food from a provider in a given week are likely to use the system in
other weeks as well. On the other hand, the annual count is much larger than the weekly count
because there is considerable turnover of people entering and leaving the system.
4.3 BACKGROUND AND LIMITATIONS OF THE ESTIMATES
We used several data sources to derive estimates of the size of the FA system:
• Information from the survey sample frame of providers, which was compiled from records of FA network members
• Information from the sampling and data collection operations concerning the observed numbers of clients served by providers, the providers’ days of operation, and similar factors
• Information from the client survey concerning respondents’ length and frequency of use of the emergency food system
• Information from FA administrative files concerning the relative sizes of the FA members that participated in the study compared with those that did not participate

Hunger in America 2010 The Capital Area Food Bank of Texas, Inc (4408)
40 CH 4. ESTIMATED NUMBERS OF AGENCIES AND CLIENTS
Given these rich data sources, several approaches could be taken in the estimation work.
In much of the work below, we drew primarily on an approach, rooted in standard statistical
estimation theory, whereby we (1) computed the probabilities of various providers and clients
being in our survey sample, (2) computed analysis weights based on these probabilities, and
(3) estimated the underlying population totals by summing the relevant analysis weights. In
some instances, however, we employed alternative approaches to supplement the estimates.
For each food bank, the estimate of weekly clients served is derived from the sums of the
weekly client weights for the food bank. As described in detail in the National Report for the
study, these weekly weights reflect the probabilities of client selection at the multiple sampling
stages,13 together with adjustments for non-response and similar factors.
For estimates of annual unduplicated clients at the food bank level, the basic approach
taken was to allocate the national total as estimated in the National Report, among the various
food banks. In part, the allocation process was based on the food bank-level weekly estimates
derived during the weighting process. In addition, because of the relatively small sample sizes at
the food bank level, we used a second variable, the “goal factor” determined by FA to essentially
provide more stability and thus anchor the estimates.14 Specifically, we (1) rescaled the goal
factors to place them on a scale comparable to the estimates based on the sums of statistical
weights; (2) took the simple average of these two components (sums of weights and rescaled
goal factor) to form a composite indicator; and then (3) used that composite index to
proportionately allocate the national totals to the individual food banks.
13 Including sampling agencies, sampling providers within agencies, and sampling clients within providers. 14 The goal factor is based on population and poverty data and is designed to be a measure of the relative
need for emergency food in each food bank’s service area.

Hunger in America 2010 The Capital Area Food Bank of Texas, Inc (4408)
41 CH 4. ESTIMATED NUMBERS OF AGENCIES AND CLIENTS
There is unavoidably some uncertainty in the estimates presented. This uncertainty
derives from several factors, including:
• Reporting Error. Some of the interview questions on which our estimates are based were unavoidably somewhat complex. As a result, there is undoubtedly some error caused by respondents not always understanding the questions and not always reporting accurately.
• Nonresponse Bias. As with any survey, it must be assumed that there is at least some nonresponse error caused by the agencies and clients who did not respond to our surveys being different from those that did.
• Seasonality. Because of logistical requirements, most of the data were collected during the spring of 2009. It is therefore not possible with this data set to fully examine and correct for fluctuations in providers of The Capital Area Food Bank of Texas, Inc and clients over the entire year.


Hunger in America 2010 The Capital Area Food Bank of Texas, Inc (4408)
43 CH 5. CLIENTS: DEMOGRAPHIC PROFILE
5. CLIENTS: DEMOGRAPHIC PROFILE
One of the most important purposes of the evaluation has been to develop a description of
the people and households served by the FA National Network. Key findings are presented in
this section. Results reported in Chapters 5 through 9 represent all clients served by The Capital
Area Food Bank of Texas, Inc.
We begin by describing the client sample on which the analysis is based. Section 5.2
then provides an overall profile of clients served by The Capital Area Food Bank of Texas, Inc.
Subsequent sections provide additional details about clients’ demographic characteristics,
citizenship, education levels, household income levels, and other resources.
5.1 NUMBER OF CLIENT RESPONDENTS
A total of 354 clients were interviewed at selected program sites of The Capital Area
Food Bank of Texas, Inc. The clients interviewed at the pantry programs (296 clients) account
for 83.6% of all client respondents. Those interviewed at the kitchen programs (46 clients) make
up 13.0% of the total, and those interviewed at the shelter programs (12 clients) account for the
remaining 3.4%. See Table 5.1.1, which also shows the percentage distribution after the weights
described earlier were applied to each observation.
TABLE 5.1.1
NUMBER OF CLIENT RESPONDENTS
Client Respondents
Site of Interview Number Unweighted Percentage Weighted Percentage
Pantry 296 83.6% 68.9% Kitchen 46 13.0% 20.2% Shelter 12 3.4% 10.9% TOTAL 354 100.0% 100.0%

Hunger in America 2010 The Capital Area Food Bank of Texas, Inc (4408)
44 CH 5. CLIENTS: DEMOGRAPHIC PROFILE
CHART 5.1.1 WEIGHTED PERCENTAGES OF CLIENT RESPONDENTSBy Type of Interview Site
Pantry69%
Kitchen20%
Shelter11%
Pantry Kitchen Shelter
Note: Charts corresponding to tables that contain values of "n.p." or "N.A." (see section 3.7) may display the
suppressed numbers in place of "n.p" or "N.A". This is due to the limitation of the computer system used to generate the member-level reports. The parts of the chart for which this is true should be ignored.

Hunger in America 2010 The Capital Area Food Bank of Texas, Inc (4408)
45 CH 5. CLIENTS: DEMOGRAPHIC PROFILE
5.2 SUMMARY DEMOGRAPHIC PROFILE
Client respondents provided information about various demographic characteristics of
themselves and their households. Table 5.2.1 summarizes the demographic profile of the client
households of The Capital Area Food Bank of Texas, Inc. It also contains statistics about adult
clients who visit emergency food programs.
TABLE 5.2.1
SUMMARY DEMOGRAPHIC PROFILE OF CLIENTS
Pantry Kitchen Shelter All
Client Households
Size of householda Households with 1 member 21.9% 33.0% n.p. 32.7% Households with 2-3 members 33.0% 54.0% n.p. 33.6% Households with 4-6 members 35.3% 12.7% n.p. 26.9% Households with more than
6 members 9.8% 0.2% n.p. 6.8% Average household size 3.5 2.1 n.p. 2.9 Median household size 3 2 n.p. 2
Households with nonfamily
members 5.3% 30.7% n.p. 9.8% Households with one or more
adults employed 47.8% 47.0% n.p. 42.6% Households with single parents 13.1% 2.3% n.p. 9.5% Households with single parents
among households with children younger than age 18b 23.4% 12.7% N.A. 22.5%
Elderly and children in household Households with children
younger than age 18 57.0% 18.0% n.p. 42.9% Households with children ages
0-5 years 25.1% 5.1% n.p. 18.3% Households with children ages
0-3 years 18.9% 5.1% n.p. 14.0% Households with any member
65 years or older 13.2% 0.0% n.p. 9.1% Households with grandchildren 17.3% 13.2% n.p. 15.3%
Households with a respondent who provides basic needs to grandchild, among households with a grandchild 14.2% 13.2% n.p. 13.0%

Hunger in America 2010 The Capital Area Food Bank of Texas, Inc (4408)
46 CH 5. CLIENTS: DEMOGRAPHIC PROFILE
Pantry Kitchen Shelter All
Adult Clients at Program Sites
Adult Clients at Program Sites Male 30.0% 76.5% n.p. 46.8% Female 70.0% 23.5% n.p. 53.2% U.S. citizens 83.0% 93.2% n.p. 85.3% Registered votersc 53.5% 58.9% n.p. 56.1% Married or living as married 44.6% 8.5% n.p. 32.4% High school graduate 60.0% 72.2% n.p. 59.0% Currently employed 26.5% 30.0% n.p. 24.5%
SAMPLE SIZE (N) 296 46 12 354
Source: This table was constructed based on usable responses to questions 2, 3, 4, 5, 6, 7, 9, 10, 11, 11a, 12, 81a,
and 82 of the client survey. Notes: The percentages presented in this table are based only on usable responses, excluding missing, don’t
know, and refusal responses, except for the percentage of employed clients (See Table 5.7.2). All usable responses were weighted as described in Chapter 3 and in the Technical Appendix volume to represent all emergency food clients of The Capital Area Food Bank of Texas, Inc. The sample sizes (N) also include missing data.
aFor all programs, responses greater than 24 people in a household were recoded as 24 people. Additional data are available for at most 10 members of each household. See Chapter 3 for details. bThe sample size is 168 for the pantry, 6 for the kitchen 0 for the shelter, and 174 for all. cFor registered voters, missing, don’t know, and refusal responses combined are 3.4% for pantry clients, 0.0% for kitchen clients, 3.9% for shelter clients, and 2.7% for all clients.
The upper part of Table 5.2.1 shows the composition of client households. The average
household size is 2.9, and 42.6% of the households have an employed adult. In addition:
• 32.7% of the client households are single-person households.
• 6.8% of the client households have more than six members.
• Among client households with children younger than age 18, 22.5% are single-parent households.
• 42.9% of the client households have at least one member younger than age 18.
• 18.3% of the client households have one or more children ages 0 to 5 years.
• 9.1% of the households have at least one member age 65 years or older.

Hunger in America 2010 The Capital Area Food Bank of Texas, Inc (4408)
47 CH 5. CLIENTS: DEMOGRAPHIC PROFILE
The lower part of Table 5.2.1 shows that 46.8% of the adult clients visiting emergency
food programs are men, while 53.2% are women. (Table 5.3.1 contains detailed age, gender, and
citizenship information.) Among adults at emergency providers, 85.3% are U.S. citizens, 59.0%
are high school graduates, and 24.5% are currently working. These statistics, however, take into
account only the client population who come to the program sites. Since the pantries’ client base
is not limited to the individual members who come to pick up food, but includes all members of
such clients’ households, it is also of interest to examine similar tabulations based on all
individual members of client households. Table 5.3.2 in the next section presents age, gender,
and citizenship composition of all members of client households.
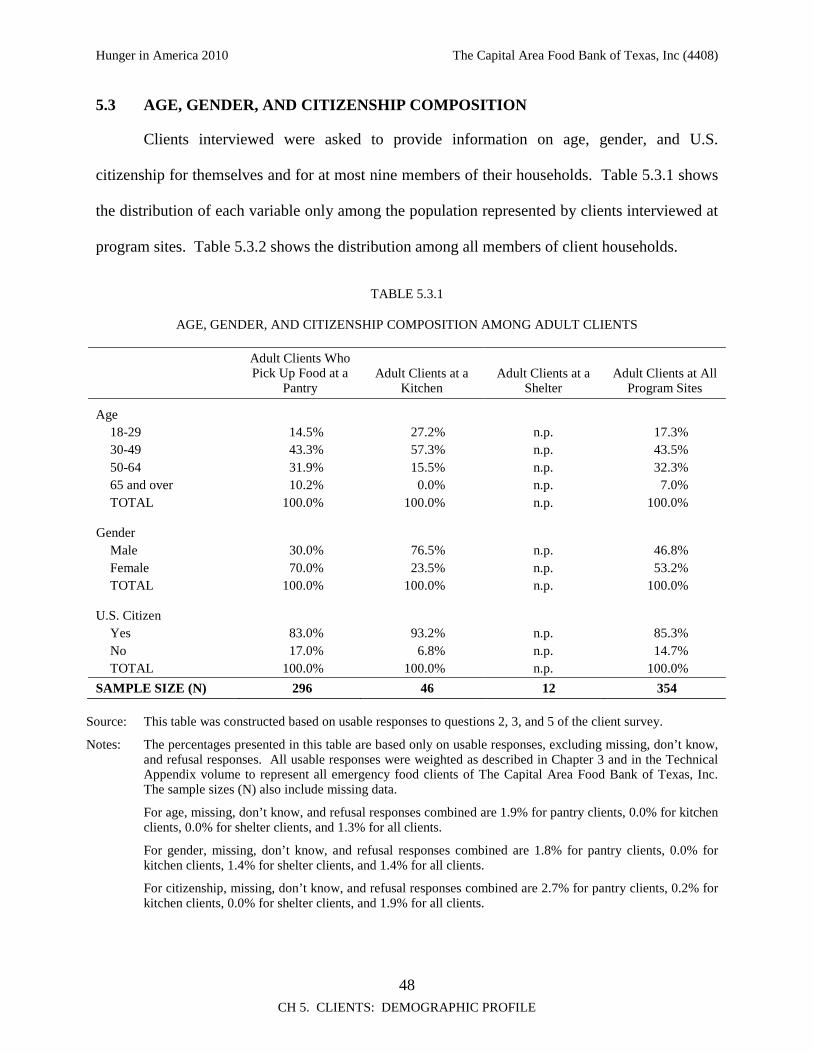
Hunger in America 2010 The Capital Area Food Bank of Texas, Inc (4408)
48 CH 5. CLIENTS: DEMOGRAPHIC PROFILE
5.3 AGE, GENDER, AND CITIZENSHIP COMPOSITION
Clients interviewed were asked to provide information on age, gender, and U.S.
citizenship for themselves and for at most nine members of their households. Table 5.3.1 shows
the distribution of each variable only among the population represented by clients interviewed at
program sites. Table 5.3.2 shows the distribution among all members of client households.
TABLE 5.3.1
AGE, GENDER, AND CITIZENSHIP COMPOSITION AMONG ADULT CLIENTS Adult Clients Who
Pick Up Food at a Pantry
Adult Clients at a Kitchen
Adult Clients at a Shelter
Adult Clients at All Program Sites
Age
18-29 14.5% 27.2% n.p. 17.3% 30-49 43.3% 57.3% n.p. 43.5% 50-64 31.9% 15.5% n.p. 32.3% 65 and over 10.2% 0.0% n.p. 7.0% TOTAL 100.0% 100.0% n.p. 100.0%
Gender Male 30.0% 76.5% n.p. 46.8% Female 70.0% 23.5% n.p. 53.2% TOTAL 100.0% 100.0% n.p. 100.0%
U.S. Citizen
Yes 83.0% 93.2% n.p. 85.3% No 17.0% 6.8% n.p. 14.7% TOTAL 100.0% 100.0% n.p. 100.0%
SAMPLE SIZE (N) 296 46 12 354
Source: This table was constructed based on usable responses to questions 2, 3, and 5 of the client survey.
Notes: The percentages presented in this table are based only on usable responses, excluding missing, don’t know, and refusal responses. All usable responses were weighted as described in Chapter 3 and in the Technical Appendix volume to represent all emergency food clients of The Capital Area Food Bank of Texas, Inc. The sample sizes (N) also include missing data.
For age, missing, don’t know, and refusal responses combined are 1.9% for pantry clients, 0.0% for kitchen clients, 0.0% for shelter clients, and 1.3% for all clients.
For gender, missing, don’t know, and refusal responses combined are 1.8% for pantry clients, 0.0% for kitchen clients, 1.4% for shelter clients, and 1.4% for all clients.
For citizenship, missing, don’t know, and refusal responses combined are 2.7% for pantry clients, 0.2% for kitchen clients, 0.0% for shelter clients, and 1.9% for all clients.

Hunger in America 2010 The Capital Area Food Bank of Texas, Inc (4408)
49 CH 5. CLIENTS: DEMOGRAPHIC PROFILE
Among the adult clients who come to program sites, 17.3% are ages 18 to 29; 43.5% ages
30 to 49; 32.3% ages 50 to 64; and 7.0% ages 65 and older. In addition:
• Among the adult pantry clients who were represented at the interview sites (not including all members of their households), 14.5% are ages 18 to 29; 43.3% ages 30 to 49; 31.9% ages 50 to 64; and 10.2% ages 65 and older.
• 30.0% of adult pantry clients at program sites are male.
• 83.0% of adult pantry clients at program sites are U.S. citizens.
• Among the adult kitchen clients, 27.2% are ages 18 to 29, 57.3% ages 30 to 49, 15.5% ages 50 to 64, and 0.0% ages 65 and older.
• 76.5% of adult kitchen clients at program sites are male.
• 93.2% of adult kitchen clients at program sites are U.S. citizens.
• Among the adult shelter clients, n.p. are ages 18 to 29, n.p. ages 30 to 49, n.p. ages 50 to 64, and n.p. ages 65 and older.
• n.p. of adult shelter clients at program sites are male.
• n.p. of adult shelter clients at program sites are U.S. citizens.

Hunger in America 2010 The Capital Area Food Bank of Texas, Inc (4408)
50 CH 5. CLIENTS: DEMOGRAPHIC PROFILE
CHART 5.3.1 GENDER COMPOSITION OF CLIENTS AT PROGRAM SITESBy Program Type
30.0%
76.5%
97.0%
70.0%
23.5%
3.0%
0.0%
20.0%
40.0%
60.0%
80.0%
100.0%
120.0%
Adult clients who pick up food at a pantry Adult clients at a kitchen Adult clients at a shelter
Gender
Per
cen
tag
e o
f A
ll C
lien
ts
Male Female
Note: Charts corresponding to tables that contain values of "n.p." or "N.A." (see section 3.7) may display the
suppressed numbers in place of "n.p" or "N.A". This is due to the limitation of the computer system used to generate the member-level reports. The parts of the chart for which this is true should be ignored.

Hunger in America 2010 The Capital Area Food Bank of Texas, Inc (4408)
51 CH 5. CLIENTS: DEMOGRAPHIC PROFILE
TABLE 5.3.2
AGE, GENDER, AND CITIZENSHIP COMPOSITION
All Members of
Household, Pantry All Members of
Household, Kitchen All Members of
Household, Shelter
All Members of Household, All
Programs
Agea
0-3 6.3% 3.3% n.p. 5.6% 4-5 3.0% 0.0% n.p. 2.4% 6-17 36.2% 22.4% n.p. 32.9% 18-29 16.8% 27.1% n.p. 18.3% 30-49 21.4% 40.3% n.p. 24.1% 50-64 11.5% 6.9% n.p. 12.7% 65 and over 4.8% 0.0% n.p. 3.9% TOTAL 100.0% 100.0% n.p. 100.0%
SAMPLE SIZE (N)b 1,035 84 12 1,131
Gendera
Male 48.4% 77.9% n.p. 54.6% Female 51.6% 22.1% n.p. 45.4% TOTAL 100.0% 100.0% n.p. 100.0%
U.S. Citizena
Yes 84.2% 91.3% n.p. 85.2% No 15.8% 8.7% n.p. 14.8% TOTAL 100.0% 100.0% n.p. 100.0%
SAMPLE SIZE (N) 985 71 12 1,068 Source: This table was constructed based on usable responses to questions 2, 3, 5, 6a, and 6b of the client survey. Notes: The percentages presented in this table are based only on usable responses, excluding missing, don’t
know, and refusal responses. All usable responses were weighted as described in Chapter 3 and in the Technical Appendix volume to represent all emergency food clients of The Capital Area Food Bank of Texas, Inc. The sample sizes (N) also include missing data.
For age, missing, don’t know, and refusal responses combined are 2.2% for pantry clients, 0.0% for kitchen clients, 0.0% for shelter clients, and 1.8% for all clients. For gender, missing, don’t know, and refusal responses combined are 1.1% for pantry clients, 0.0% for kitchen clients, 1.4% for shelter clients, and 0.9% for all clients. For citizenship, missing, don’t know, and refusal responses combined are 1.4% for pantry clients, 0.2% for kitchen clients, 0.0% for shelter clients, and 1.2% for all clients.
aData available for at most 10 members of household. See the Technical Appendix volume for details. bThe sample sizes for age variables may be larger than those for the other two variables in this table. This is because the client questionnaire had additional questions to identify household members who are younger than age 18 and whether the household has any children between ages 0 and 5.

Hunger in America 2010 The Capital Area Food Bank of Texas, Inc (4408)
52 CH 5. CLIENTS: DEMOGRAPHIC PROFILE
When we consider all members of client households, 5.6% are ages 0 to 3, 2.4% are ages
4 to 5, 32.9% are ages 6 to 17, 18.3% are ages 18 to 29, 24.1% are ages 30 to 49, 12.7% are ages
50 to 64, and 3.9% are ages 65 and older. Information on age distribution, as well as gender and
citizenship distributions, by program type follows:
• Among all members of pantry client households, 9.3% are ages 0 to 5; 36.2% ages 6 to 17; 16.8% are ages 18 to 29; 21.4% are ages 30 to 49, 11.5% are ages 50 to 64, and 4.8% are ages 65 and older.
• 48.4% of all members of pantry client households are male.
• 84.2% of all members of pantry client households are U.S. citizens.
• Among all members of kitchen client households, 3.3% are ages 0 to 5; 22.4% ages 6 to 17; 27.1% are ages 18 to 29; 40.3% are ages 30 to 49; 6.9% are ages 50 to 64, and 0.0% are ages 65 and older.
• 77.9% of all members of kitchen client households are male.
• 91.3% of all members of kitchen client households are U.S. citizens.
• Among all members of shelter client households, 0.0% are ages 0 and 5; n.p. are ages 6 and 17; n.p. are ages 18 to 29; n.p. are ages 30 to 49; n.p. are ages 50 to 64; and n.p. are ages 65 and older.
• n.p. of all members of shelter client households are male.
• n.p. of all members of shelter client households are U.S. citizens.

Hunger in America 2010 The Capital Area Food Bank of Texas, Inc (4408)
53 CH 5. CLIENTS: DEMOGRAPHIC PROFILE
CHART 5.3.2 AGE COMPOSITION OF ALL MEMBERS OF CLIENT HOUSEHOLDSBy Program Type
36.2%
22.4%
0.0%
16.8%
27.1%
15.7%
21.4%
40.3%
19.2%
11.5%
6.9%
65.0%
4.8%
0.0% 0.0%0.0%
10.0%
20.0%
30.0%
40.0%
50.0%
60.0%
70.0%
All members of household, pantry All members of household, kitchen All members of household, shelter
Age Group
Per
cen
tag
e o
f A
ll C
lien
ts
6 to 17 18 to 29 30 to 49 50 to 64 65 and over
Note: Charts corresponding to tables that contain values of "n.p." or "N.A." (see section 3.7) may display the
suppressed numbers in place of "n.p" or "N.A". This is due to the limitation of the computer system used to generate the member-level reports. The parts of the chart for which this is true should be ignored.

Hunger in America 2010 The Capital Area Food Bank of Texas, Inc (4408)
54 CH 5. CLIENTS: DEMOGRAPHIC PROFILE
5.4 MARITAL STATUS
Clients were also asked about their marital status. Table 5.4.1 presents the findings.
TABLE 5.4.1
MARITAL STATUS
Clients’ Marital Status
Adult Clients Who Pick Up Food at a
Pantry Adult Clients at a
Kitchen Adult Clients at a
Shelter Adult Clients at
All Program Sites
Married 34.3% 7.4% n.p. 25.0% Living as married 10.4% 1.1% n.p. 7.3% Widowed 8.4% 3.7% n.p. 6.9% Divorced 23.2% 44.9% n.p. 25.9% Separated 6.8% 0.3% n.p. 4.8% Never been married 17.0% 42.6% n.p. 30.0% TOTAL 100.0% 100.0% n.p. 100.0%
SAMPLE SIZE (N) 296 46 12 354 Source: This table was constructed based on usable responses to Question 9 of the client survey. Notes: The percentages presented in this table are based only on usable responses, excluding missing, don’t
know, and refusal responses. All usable responses were weighted as described in Chapter 3 and in the Technical Appendix volume to represent all emergency food clients of The Capital Area Food Bank of Texas, Inc. The sample sizes (N) also include missing data.
Missing, don’t know, and refusal responses combined are 4.0% for pantry clients, 0.0% for kitchen clients, 6.4% for shelter clients, and 3.4% for all clients.
Key findings include:
• Overall, 25.0% of the clients at all program sites are married.
- The percentage of married clients at pantry programs is 34.3%.
- The percentage of married clients at kitchen programs is 7.4%.
- The percentage of married clients at shelter programs is n.p..
• 7.3% of the clients at all program sites are living as married.
• 6.9% of the clients at all program sites are widowed.
• 4.8% of the clients at all program sites are separated.
• 30.0% of the clients at all program sites have never been married.

Hunger in America 2010 The Capital Area Food Bank of Texas, Inc (4408)
55 CH 5. CLIENTS: DEMOGRAPHIC PROFILE
5.5 HIGHEST EDUCATION LEVEL ATTAINED
Clients were asked the highest education level they had attained. Education levels of
clients based on their responses are provided in Table 5.5.1.
TABLE 5.5.1
HIGHEST EDUCATION LEVEL ATTAINED
Clients’ Education Level
Adult Clients Who Pick Up
Food at a Pantry
Adult Clients at a Kitchen
Adult Clients at a Shelter
All Adult Clients
Less than high school 40.0% 27.8% n.p. 41.0% Completed high school or equivalent
degree (but not higher) 36.7% 16.3% n.p. 28.9% Completed noncollege business/trade/
technical school 3.4% 0.1% n.p. 2.4% Some college/two-year degree 14.0% 43.0% n.p. 21.0% Completed college or higher 5.9% 12.9% n.p. 6.7% TOTAL 100.0% 100.0% n.p. 100.0%
SAMPLE SIZE (N) 296 46 12 354 Source: This table was constructed based on usable responses to Question 10 of the client survey. Notes: The percentages presented in this table are based only on usable responses, excluding missing, don’t
know, and refusal responses. All usable responses were weighted as described in Chapter 3 and in the Technical Appendix volume to represent all emergency food clients of The Capital Area Food Bank of Texas, Inc. The sample sizes (N) also include missing data.
Missing, don’t know, and refusal responses combined are 2.9% for pantry clients, 0.0% for kitchen clients, 0.0% for shelter clients, and 2.0% for all clients.
As Table 5.5.1 shows, 41.0% of the clients at emergency food programs have not
completed high school. The comparable percentage for the entire U.S. adult population is
14.3%.15 More details follow:
• 28.9% of all clients finished high school but received no further education beyond high school.
15 Statistical Abstract of the United States, 2009. Table No. 221.

Hunger in America 2010 The Capital Area Food Bank of Texas, Inc (4408)
56 CH 5. CLIENTS: DEMOGRAPHIC PROFILE
• 21.0% of all clients have some college education or completed a two-year degree.
• 6.7% of all clients have completed college or beyond.

Hunger in America 2010 The Capital Area Food Bank of Texas, Inc (4408)
57 CH 5. CLIENTS: DEMOGRAPHIC PROFILE
5.6 RACIAL AND ETHNIC BACKGROUND
Clients were asked about their racial and ethnic background. Table 5.6.1 summarizes
the results.
TABLE 5.6.1
RACIAL AND ETHNIC BACKGROUND
Clients’ Raciala and Ethnic Background
Adult Clients Who Pick Up
Food at a Pantry Adult Clients at a
Kitchen Adult Clients at a
Shelter All
Adult Clients
Non-Hispanic White 35.7% 34.0% n.p. 37.2% Non-Hispanic Black 24.3% 36.0% n.p. 24.5% American Indian or Alaskan
Native 0.4% 0.0% n.p. 1.0% Native Hawaiian or other Pacific
Islander 0.3% 0.0% n.p. 0.2% Asian 0.0% 0.0% n.p. 0.0% Latino or Hispanic
Mexican, Mexican American, Chicano 31.1% 36.6% n.p. 30.2%
Puerto Rican 2.1% 0.6% n.p. 1.7% Cuban 0.6% 0.0% n.p. 0.5% Other Latino or Hispanic 4.2% 3.0% n.p. 5.9% SUBTOTAL 38.1% 40.2% n.p. 38.3%
Otherb 1.8% 0.0% n.p. 1.3%
SAMPLE SIZE (N) 296 46 12 354 SOURCE: This table was constructed based on usable responses to questions 11, 11a, and 12 of the client survey.
NOTES: The percentages presented in this table are based only on usable responses, excluding missing, don’t know, and refusal responses. All usable responses were weighted as described in Chapter 3 and in the Technical Appendix volume to represent all emergency food clients of The Capital Area Food Bank of Texas, Inc. The sample sizes (N) also include missing data.
For race, missing, don’t know, and refusal responses combined are 1.5% for pantry clients, 0.0% for kitchen clients, 0.0% for shelter clients, and 1.1% for all clients.
For ethnicity, missing, don’t know, and refusal responses combined are 1.5% for pantry clients, 25.2% for kitchen clients, 0.0% for shelter clients, and 6.1% for all clients.
aMultiple responses were accepted for races. bMost respondents who marked “Other” as their choice did not provide further information. Those who provided an answer sometimes indicated their nationality, but because the number of usable responses was small, recoding of those responses based on this information was not performed.
Racial or ethnic background of the clients at emergency food program sites follows:

Hunger in America 2010 The Capital Area Food Bank of Texas, Inc (4408)
58 CH 5. CLIENTS: DEMOGRAPHIC PROFILE
• Among the clients who come to all program sites, 37.2% are non-Hispanic white; 24.5% non-Hispanic black; and 1.0% American Indian or Alaskan Native.
• 0.2% are native Hawaiian or other Pacific Islander, and 0.0% are Asian.
• A total of 38.3% of the clients at all program sites indicate they are Spanish, Latino, or of Hispanic descent or origin.
CHART 5.6.1 RACIAL AND ETHNIC BACKGROUNDBy Program Type
35.7%34.0%
52.5%
24.3%
36.0%
4.6%
0.4% 0.0%
6.4%
0.3% 0.0% 0.0%0.0% 0.0% 0.0%
38.1%40.2%
36.5%
0.0%
10.0%
20.0%
30.0%
40.0%
50.0%
60.0%
Adult clients who pick up food at a pantry Adult clients at a kitchen Adult clients at a shelter
Racial and Ethnic Background
Per
cen
tag
e o
f C
lien
ts
Non-Hispanic White Non-Hispanic Black American Indian or Alaskan Native Native Hawaiian or other Pacific Islander Asian Latino or Hispanic
Note: Charts corresponding to tables that contain values of "n.p." or "N.A." (see section 3.7) may display the
suppressed numbers in place of "n.p" or "N.A". This is due to the limitation of the computer system used to generate the member-level reports. The parts of the chart for which this is true should be ignored.

Hunger in America 2010 The Capital Area Food Bank of Texas, Inc (4408)
59 CH 5. CLIENTS: DEMOGRAPHIC PROFILE
5.7 EMPLOYMENT OF ADULTS IN HOUSEHOLD
Client respondents provided information on their households’ current employment status.
Table 5.7.1 and Table 5.7.2 present the findings regarding all adults in the households.16
TABLE 5.7.1
EMPLOYMENT STATUS OF ADULTS IN HOUSEHOLD
All Adult Members of Household,
Pantry
All Adult Members of Household,
Kitchen
All Adult Members of Household,
Shelter
All Adult Members of Household,
All Programs
Percentage of employed adults among all adults in client households 33.5% 46.3% n.p. 34.0%
SAMPLE SIZE (N) 590 60 12 662
Percentage of employed adults among adults younger than age 65 in client householda 36.7% 46.3% n.p. 36.3%
SAMPLE SIZE (N) 523 60 12 595
Percentage of client households with one or more adults employed 47.8% 47.0% n.p. 42.6%
SAMPLE SIZE (N) 296 46 12 354 SOURCE: This table was constructed based on all responses to questions 3 and 6 of the client survey.
NOTES: The percentages in this table, unlike those in most other tables, were calculated without leaving out item nonresponses. Because this table was constructed combining responses to several questions, excluding item nonresponses could have caused confusion.
For all adults in the household, missing, don’t know, and refusal responses combined are 1.1% for pantry clients, 0.2% for kitchen clients, 0.0% for shelter clients, and 0.9% for all clients.
For adults younger than age 65 in the household, missing, don’t know, and refusal responses combined are 1.3% for pantry clients, 0.2% for kitchen clients, 0.0% for shelter clients, and 1.0% for all clients.
For client households, missing, don’t know, and refusal responses combined are 0.0% for pantry clients, 0.1% for kitchen clients, 0.0% for shelter clients, and 0.0% for all clients.
aIncludes only households with at least one adult younger than age 65.
16 Data are available for at most 10 members of the household. See Technical Appendix volume for details.

Hunger in America 2010 The Capital Area Food Bank of Texas, Inc (4408)
60 CH 5. CLIENTS: DEMOGRAPHIC PROFILE
Among all adults in client households, 34.0% are employed. When we consider adults
younger than age 65, 36.3% are currently working. At the household level, 42.6% have one or
more adults employed. Results by program type show:
• 47.8% of the pantry client households have one or more adults currently employed.
• 47.0% of the kitchen client households have one or more adults currently employed.
• n.p. of the shelter client households have one or more adults currently employed.
CHART 5.7.1 HOUSEHOLDS WITH AT LEAST ONE WORKING ADULTBy Program Type
47.8% 47.0%
1.6%
0.0%
10.0%
20.0%
30.0%
40.0%
50.0%
60.0%
Pantry client households Kitchen client households Shelter client households
Per
cen
tag
e o
f C
lien
t H
ou
seh
old
s
Note: Charts corresponding to tables that contain values of "n.p." or "N.A." (see section 3.7) may display the
suppressed numbers in place of "n.p" or "N.A". This is due to the limitation of the computer system used to generate the member-level reports. The parts of the chart for which this is true should be ignored.

Hunger in America 2010 The Capital Area Food Bank of Texas, Inc (4408)
61 CH 5. CLIENTS: DEMOGRAPHIC PROFILE
TABLE 5.7.2
DETAILED EMPLOYMENT STATUS OF ADULTS IN HOUSEHOLD
All Adult Members of Household,
Pantry
All Adult Members of Household,
Kitchen
All Adult Members of Household,
Shelter
All Adult Members of Household,
All Programs
Current employment status of all adults in client householdsa
Full-time 15.8% 10.6% n.p. 13.9% Part-time 17.7% 35.6% n.p. 20.1% Not employedb 66.5% 53.7% n.p. 66.0%
SAMPLE SIZE (N) 590 60 12 662
Current employment status of all adults younger than age 65 in client householdsa,c
Full-time 17.4% 10.6% n.p. 14.9% Part-time 19.1% 35.6% n.p. 21.3% Not employedb 63.5% 53.7% n.p. 63.8%
SAMPLE SIZE (N) 523 60 12 595
Employment status of adult clients interviewed at program sitesa
Currently working Full-time 15.5% 1.0% n.p. 10.8% Part-time 11.0% 28.9% n.p. 13.7% Unknown 0.0% 0.1% n.p. 0.0% SUBTOTAL 26.5% 30.0% n.p. 24.5%
Not working
Never worked 3.0% 0.1% n.p. 3.4%
Have not worked for Less than 3 months 11.7% 3.0% n.p. 9.8% 3-5 months 7.0% 14.6% n.p. 8.1% 6-8 months 6.5% 6.6% n.p. 6.0% 9-11 months 0.8% 8.1% n.p. 2.2% 1-2 years 9.2% 20.4% n.p. 11.0% More than 2 years 33.6% 17.1% n.p. 32.2% Unknown 0.0% 0.0% n.p. 0.0% Missing 1.7% 0.0% n.p. 2.9% SUBTOTAL 70.4% 69.9% n.p. 72.1%
Unknown 0.0% 0.0% n.p. 0.0% TOTAL 100.0% 100.0% n.p. 100.0%
SAMPLE SIZE (N) 296 46 12 354

Hunger in America 2010 The Capital Area Food Bank of Texas, Inc (4408)
62 CH 5. CLIENTS: DEMOGRAPHIC PROFILE
All Adult Members of Household,
Pantry
All Adult Members of Household,
Kitchen
All Adult Members of Household,
Shelter
All Adult Members of Household,
All Programs
Clients with managerial or professional jobs among those who have worked before or are currently workingd 15.3% 17.8% n.p. 14.7%
SAMPLE SIZE (N) 281 45 10 336
Clients participating in government-sponsored job training or work experience programs among those who have never worked n.p. n.p. n.p. n.p.
SAMPLE SIZE (N) 0 0 0 0 SOURCE: This table was constructed based on all responses to questions 3, 6, 12a, 13, 14a, and 15 of the
client survey.
NOTE: For all adults with managerial or professional jobs, missing, don’t know, and refusal responses combined are 7.6% for pantry clients, 1.2% for kitchen clients, 0.0% for shelter clients, and 5.5% for all clients.
For all adults participating in government-sponsored job training missing, don’t know, and refusal responses combined are 0.0% for pantry clients, 0.0% for kitchen clients, 0.0% for shelter clients, and 0.0% for all clients.
aThe percentages were calculated without leaving out item nonresponses. Because this panel of the table was constructed combining responses to several questions, excluding item nonresponses could have caused confusion. All responses were weighted as described in Chapter 3 and in the Technical Appendix volume to represent all emergency food clients or households of The Capital Area Food Bank of Texas, Inc.
bIncludes both individuals who are unemployed and out of the labor force. cIncludes only households with at least one adult younger than age 65. dThis was assessed by the interviewer given the respondent’s description of the tasks performed at the respondent’s current or last job.
As shown in Table 5.7.2, when we consider the employment status of all adults in client
households, 13.9% are employed full-time, 20.1% are employed part-time, and 66.0% are
currently unemployed. Details of the employment status of adult clients who come to program
sites follow:
• Overall, 10.8% of the adult clients at program sites are currently employed full-time; 13.7% employed part-time.

Hunger in America 2010 The Capital Area Food Bank of Texas, Inc (4408)
63 CH 5. CLIENTS: DEMOGRAPHIC PROFILE
• 9.8% of the clients have recently lost their job, having been unemployed for three months or less.
• 11.0% of all clients have been unemployed for one to two years.
• 32.2% of all clients have not worked for more than two years.
• Among those who have worked before or are currently working, 14.7% either had or currently have managerial or professional jobs.
• 3.4% of the clients had never worked; of these, n.p. are participating in government-sponsored job training or work experience programs.
CHART 5.7.2 EMPLOYMENT STATUS OF ALL ADULTS IN CLIENT HOUSEHOLDSBy Program Type
15.8%
10.6%
0.0%
17.7%
35.6%
1.6%
0.0%
5.0%
10.0%
15.0%
20.0%
25.0%
30.0%
35.0%
40.0%
Pantry Kitchen Shelter
Employment Status of All Adults in Client Households
Per
cen
tag
e o
f A
du
lts
in C
lien
t H
ou
seh
old
s
Full-time Part-time
Note: Charts corresponding to tables that contain values of "n.p." or "N.A." (see section 3.7) may display the
suppressed numbers in place of "n.p" or "N.A". This is due to the limitation of the computer system used to generate the member-level reports. The parts of the chart for which this is true should be ignored.

Hunger in America 2010 The Capital Area Food Bank of Texas, Inc (4408)
64 CH 5. CLIENTS: DEMOGRAPHIC PROFILE
5.8 HOUSEHOLD INCOME
Lack of sufficient income usually plays a major role in forcing a person or a family to
seek assistance from an emergency food provider. In this section, we examine patterns of
income receipt, for both monthly and annual income.
5.8.1 Federal Poverty Level
The U.S. government periodically establishes poverty guidelines to provide an indication
of the levels of income below which households of various sizes would be considered
impoverished. In parts of the analysis in this section, it will be useful to refer to these guidelines
as a tool in understanding the meaning of various income levels. For reference, Table 5.8.1.1
presents 100% of these federal poverty levels.
TABLE 5.8.1.1
THE 2009 FEDERAL POVERTY LEVEL—MONTHLY INCOME
Household Size
48 Contiguous States and District of Columbia
Alaska
Hawaii
1 $903 $1,128 $1,038 2 $1,214 $1,518 $1,397 3 $1,526 $1,908 $1,755 4 $1,838 $2,298 $2,113 5 $2,149 $2,688 $2,472 6 $2,461 $3,078 $2,830 7 $2,773 $3,468 $3,188 8 $3,084 $3,858 $3,547 Each additional member +$312 +$390 +$358
SOURCE: Federal Register, Vol. 74, No. 13, January 23, 2009, pp. 4199-4201. NOTE: The 2009 federal poverty guidelines (also known as the federal poverty level) reflect price changes
through calendar year 2008; accordingly they are approximately equal to the Census Bureau poverty thresholds for calendar year 2008.

Hunger in America 2010 The Capital Area Food Bank of Texas, Inc (4408)
65 CH 5. CLIENTS: DEMOGRAPHIC PROFILE
5.8.2 Household Income for the Previous Month
Clients were asked to report their total household income for the previous month or to
choose from a set of predefined income brackets. The results are in Table 5.8.2.1.
TABLE 5.8.2.1
HOUSEHOLD INCOME FOR THE PREVIOUS MONTH
Income for the Previous Month Pantry Client Households
Kitchen Client Households
Shelter Client Households
All Client Households
Total monthly income No income 5.3% 19.4% n.p. 16.3% $1-$499 14.5% 11.7% n.p. 12.5% $500-$999 30.1% 5.0% n.p. 21.7% $1,000-$1,499 19.5% 30.0% n.p. 19.5% $1,500-$1,999 13.2% 2.1% n.p. 11.3% $2,000-$2,499 3.7% 0.0% n.p. 2.6% $2,500-$2,999 1.0% 0.0% n.p. 0.7% $3,000 or more 5.0% 12.6% n.p. 6.0% Unknown 7.6% 19.2% n.p. 9.4% TOTAL 100.0% 100.0% n.p. 100.0%
Average monthly income among
valid responses (in dollars)a 1,050 1,080 n.p. 970
Median monthly income among valid responses (in dollars)
800 1,000 n.p. 800
Income as a percentage of the federal poverty levelb c
0% (no income) 5.3% 19.4% n.p. 16.3% 1%-50% 30.3% 11.7% n.p. 23.4% 51%-75% 25.8% 4.5% n.p. 18.7% 76%-100% 14.0% 25.7% n.p. 14.8% 101%-130% 7.2% 0.8% n.p. 5.1% 131%-150% 5.3% 4.0% n.p. 4.5% 151%-185% 2.3% 0.4% n.p. 1.7% 186% or higher 2.1% 14.3% n.p. 6.1% Unknown 7.6% 19.2% n.p. 9.4% TOTAL 100.0% 100.0% n.p. 100.0%
Average monthly income as a
percentage of the poverty level among valid responses
66.3% 76.0% n.p. 64.2%
Median monthly income as a percentage of the poverty level among valid responses
59.9% 82.4% n.p. 57.4%

Hunger in America 2010 The Capital Area Food Bank of Texas, Inc (4408)
66 CH 5. CLIENTS: DEMOGRAPHIC PROFILE
Income for the Previous Month Pantry Client Households
Kitchen Client Households
Shelter Client Households
All Client Households
SAMPLE SIZE (N) 296 46 12 354 SOURCE: This table was constructed based on all responses to questions 27 and 27a of the client survey. NOTES: The percentages presented in this table, unlike those in most other tables, were calculated without leaving
out item nonresponses. To ensure that key percentages, such as that for no income, appear consistent within this table and across related tables, a constant denominator, which includes item nonresponses, was used. All responses were weighted as described in Chapter 3 and in the Technical Appendix volume to represent all emergency food clients or households of The Capital Area Food Bank of Texas, Inc.
For total monthly income, missing, don’t know, and refusal responses combined are 7.6% for pantry clients, 19.2% for kitchen clients, n.p. for shelter clients, and 9.4% for all clients. The missing rates we report here were obtained after we cross-imputed missing responses for monthly and yearly income variables. For income as percentage of federal poverty level, missing, don’t know, and refusal responses combined are 7.6% for pantry clients, 19.2% for kitchen clients, n.p. for shelter clients, and 9.4% for all clients.
aFor the calculation of the average and the median, responses given as a range were recoded to be the midpoint of the range. bThe percentages in this panel may not be equal to those in the corresponding row of the upper panel of this table because the two panels of data may have different item nonresponse rates. The calculation in the lower panel required information about household size as well as household income. cIncome as a percentage of the federal poverty level is determined by dividing each client’s income by the federal poverty level in Table 5.8.1.1 corresponding to the client’s household size. For example, for a client with a monthly income of $1,000 who lives in a 2-person household in Virginia, his or her income as a percentage of the federal poverty level ($1,214) is $1,000/$1,214, or 82.4%.
Table 5.8.2.1 shows that 16.3% of all client households had no income at all for the
month prior to the interview. More details on income follow:
• 5.3% of the pantry client households had no monthly income.
• 19.4% of the kitchen client households had no monthly income.
• n.p. of the shelter client households had no monthly income.
• 50.6% of all client households had monthly household income less than $1,000.

Hunger in America 2010 The Capital Area Food Bank of Texas, Inc (4408)
67 CH 5. CLIENTS: DEMOGRAPHIC PROFILE
• Average household income among all clients during the previous month was $970 (median: $800). By contrast, the mean for the U.S. population as a whole in 2008 was $5,702 (median: $4,192).17
• Average monthly household income among the pantry clients was $1,050 (median: $800).
• Average monthly household income among the kitchen clients was $1,080 (median: $1,000).
• Average monthly household income among the shelter clients was $n.p. (median: $n.p.).
• 78.3% of client households had an income of 130% of the federal poverty level or below during the previous month.
• Average monthly household income among all client households was 64.2% (median: 57.4%) of the federal poverty level.
• Average monthly household income among pantry client households was 66.3% (median: 59.9%) of the federal poverty level.
• Average monthly household income among kitchen client households was 76.0% (median: 82.4%) of the federal poverty level.
• Average monthly household income among shelter client households was n.p. (median: n.p.) of the federal poverty level.
17 Computed using annual estimates found in “U.S. Census Bureau. Income, Poverty, and Health Insurance
Coverage in the United States: 2008." September 2009.

Hunger in America 2010 The Capital Area Food Bank of Texas, Inc (4408)
68 CH 5. CLIENTS: DEMOGRAPHIC PROFILE
CHART 5.8.2.1 HOUSEHOLD INCOME FOR PREVIOUS MONTH AS PERCENTAGE OF FEDERAL POVERTY LEVEL
By Program Type
66.3%
76.0%
33.6%
59.9%
82.4%
0.0%0.0%
10.0%
20.0%
30.0%
40.0%
50.0%
60.0%
70.0%
80.0%
90.0%
Pantry client households Kitchen client households Shelter client householdsIncome
Per
cen
tag
e o
f F
eder
al P
ove
rty
Lev
el
Average Income Median Income
Note: Charts corresponding to tables that contain values of "n.p." or "N.A." (see section 3.7) may display the
suppressed numbers in place of "n.p" or "N.A". This is due to the limitation of the computer system used to generate the member-level reports. The parts of the chart for which this is true should be ignored.

Hunger in America 2010 The Capital Area Food Bank of Texas, Inc (4408)
69 CH 5. CLIENTS: DEMOGRAPHIC PROFILE
5.8.3 Sources of Household Income for the Previous Month
Clients were asked to indicate the major source of their household income for the
previous month. They were then asked to name all sources of their household income. Table
5.8.3.1 and Table 5.8.3.2 summarize the findings.
TABLE 5.8.3.1
MAIN SOURCE OF HOUSEHOLD INCOME FOR THE PREVIOUS MONTH
Main Source of Household Income for Previous Month
Pantry Client Households
Kitchen Client Households
Shelter Client Households
All Client Households
Job 47.8% 25.9% n.p. 40.4%
Government welfare assistance Temporary Assistance for Needy
Families (TANF) 0.4% 0.0% n.p. 0.3%
General Assistance (GA)a 0.0% 0.0% n.p. 0.0% SUBTOTAL 0.4% 0.0% n.p. 0.3%
Other government sources Social Security 17.0% 2.2% n.p. 12.3% Unemployment Compensation 1.2% 0.0% n.p. 0.8% Disability (SSDI)/Workers’
Compensation 10.4% 4.5% n.p. 8.1%
Supplemental Security Income (SSI)
6.2% 1.3% n.p. 4.6%
SUBTOTAL 34.8% 8.0% n.p. 25.9%
Nongovernment, nonjob sources Pension 0.7% 4.0% n.p. 1.2% Child support 2.7% 0.0% n.p. 1.9% Churches 0.7% 0.0% n.p. 0.5% Alimony 0.0% 0.0% n.p. 0.0% Relatives 2.3% 31.5% n.p. 7.3% SUBTOTAL 6.4% 35.4% n.p. 10.9%
Otherb 1.6% 6.3% n.p. 2.2%
No income 5.7% 24.0% n.p. 18.0%
Unknown 3.3% 0.3% n.p. 2.4%
TOTAL 100.0% 100.0% n.p. 100.0%
SAMPLE SIZE (N) 296 46 12 354 SOURCE: This table was constructed based on all responses to question 28 of the client survey.

Hunger in America 2010 The Capital Area Food Bank of Texas, Inc (4408)
70 CH 5. CLIENTS: DEMOGRAPHIC PROFILE
NOTES: The percentages presented in this table, unlike those in most other tables, were calculated without leaving out item nonresponses. To ensure that key percentages, such as that for no income, appear consistent within this table and across related tables, a constant denominator, which includes item nonresponses, was used. All responses were weighted as described in Chapter 3 and in the Technical Appendix volume to represent all emergency food clients or households of The Capital Area Food Bank of Texas, Inc.
Missing, don’t know, and refusal responses combined are 3.3% for pantry clients, 0.3% for kitchen clients, n.p. for shelter clients, and 2.4% for all clients.
aEstimates for GA and TANF should be used with caution, since some respondents may not have understood the names of the programs under which they were receiving benefits. Indeed, in some states, the regular GA program is not offered, although other sources of assistance are sometimes available and could have been confused with GA. bThis includes some form of limited income from savings.
Overall, 40.4% of the clients indicated that a job was the main source of income for their
households for the previous month. Other sources of income are as follows:
• For 0.3% of all clients, welfare assistance from the government such as TANF or GA was the main source of household income.
• For 25.9% of all clients, other government assistance such as Social Security, Unemployment Compensation, Disability (SSDI)/Worker’s Compensation, and Supplemental Security Income (SSI) was the main source of household income.
• For 10.9% of all clients, income came mainly from nongovernment, nonjob sources, such as pension and child support.

Hunger in America 2010 The Capital Area Food Bank of Texas, Inc (4408)
71 CH 5. CLIENTS: DEMOGRAPHIC PROFILE
CHART 5.8.3.1 MAIN SOURCE OF HOUSEHOLD INCOME FOR PREVIOUS MONTHAmong All Clients
40.4%
0.3%
0.0%
12.3%
0.8%
8.1%
4.6%
1.2%
1.9%
0.5%
0.0%
7.3%
2.2%
18.0%
0.0% 5.0% 10.0% 15.0% 20.0% 25.0% 30.0% 35.0% 40.0% 45.0%
Job
Temporary Assistance for Needy Families (TANF)
General Assistance (GA)
Social Security
Unemployment Compensation
Disability (SSDI)/Workers' Compensation
Supplemental Security Income (SSI)
Pension
Child support
Churches
Alimony
Relatives
Other
No income
So
urc
es o
f In
com
e
Percentage of Households
Note: Charts corresponding to tables that contain values of "n.p." or "N.A." (see section 3.7) may display the
suppressed numbers in place of "n.p" or "N.A". This is due to the limitation of the computer system used to generate the member-level reports. The parts of the chart for which this is true should be ignored.

Hunger in America 2010 The Capital Area Food Bank of Texas, Inc (4408)
72 CH 5. CLIENTS: DEMOGRAPHIC PROFILE
TABLE 5.8.3.2
ALL SOURCES OF HOUSEHOLD INCOME FOR PREVIOUS MONTH
All Sources of Household Income for Previous Montha
Pantry Client Households
Kitchen Client Households
Shelter Client Households
All Client Households
Job 47.8% 47.0% n.p. 42.6%
Government welfare assistance Temporary Assistance for Needy
Families (TANF) 3.8% 0.0% n.p. 2.6%
General Assistance (GA)b 1.3% 0.5% n.p. 1.0%
Other government sources Social Security 28.8% 4.5% n.p. 20.5% Unemployment Compensation 3.5% 12.6% n.p. 5.0% Disability (SSDI)/Workers’
Compensation 16.0% 17.0% n.p. 14.4%
Supplemental Security Income (SSI) 15.9% 1.6% n.p. 11.2% Government assistance with child care
costs 1.2% 2.3% n.p. 1.3%
Nongovernment, nonjob sources Pension 3.0% 6.2% n.p. 3.3% Child support 6.8% 12.6% n.p. 7.3% Alimony 0.0% 0.0% n.p. 0.0% Relatives 16.1% 31.8% n.p. 17.5%
No income 5.7% 24.0% n.p. 18.0%
SAMPLE SIZE (N) 296 46 12 354 SOURCE: This table was constructed based on all responses to questions 6, 25, and 27 of the client survey. NOTES: The percentages presented in this table, unlike those in most other tables, were calculated without leaving
out item nonresponses. To ensure that key percentages, such as that for no income, appear consistent within this table and across related tables, a constant denominator, which includes item nonresponses, was used. All responses were weighted as described in Chapter 3 and in the Technical Appendix volume to represent all emergency food clients or households of The Capital Area Food Bank of Texas, Inc.
Missing, don’t know, and refusal responses combined are 2.1% for pantry clients, 0.0% for kitchen clients, 0.0% for shelter clients, and 1.5% for all clients.
aMultiple responses were accepted. bEstimates for GA and TANF should be used with caution, since some respondents may not have understood the names of the programs under which they were receiving benefits. Indeed, in some states, the regular GA program is not offered, although other sources of assistance are sometimes available and could have been confused with GA.
When clients were asked about all sources of their household income for the previous
month, 42.6% included a job as a source.

Hunger in America 2010 The Capital Area Food Bank of Texas, Inc (4408)
73 CH 5. CLIENTS: DEMOGRAPHIC PROFILE
• For 2.6% of all clients, TANF was a source of household income during the previous month.
• For 1.0%, GA was a source of household income.
• 20.5% of all clients said they received Social Security benefits
• 14.4% chose SSDI or Workers’ Compensation as a source of household income.
• 11.2% mentioned SSI as a source.
• In addition, 3.3%, 7.3%, and 17.5% of the clients indicate pension, child support, and their relatives, respectively, as a source of income.
CHART 5.8.3.2 ALL SOURCES OF HOUSEHOLD INCOME FOR PREVIOUS MONTHAmong All Clients
42.6%
2.6%
1.0%
20.5%
5.0%
14.4%
11.2%
1.3%
3.3%
7.3%
0.0%
17.5%
18.0%
0.0% 10.0% 20.0% 30.0% 40.0% 50.0% 60.0%
Job
Temporary Assistance for Needy Families (TANF)
General Assistance (GA)
Social Security
Unemployment Compensation
Disability (SSDI)/Workers' Compensation
Supplemental Security Income (SSI)
Government assistance with child care costs
Pension
Child support
Alimony
Relatives
No income
So
urc
es o
f In
com
e
Percentage of Households
Note: Charts corresponding to tables that contain values of "n.p." or "N.A." (see section 3.7) may display the
suppressed numbers in place of "n.p" or "N.A". This is due to the limitation of the computer system used to generate the member-level reports. The parts of the chart for which this is true should be ignored.
Hunger in America 2010 The Capital Area Food Bank of Texas, Inc (4408)
74 CH 5. CLIENTS: DEMOGRAPHIC PROFILE
5.8.4 Annual Household Income in 2008
Clients also provided estimates of their total household income in the year 2008. Table
5.8.4.1 shows their annual income in dollars and as a percentage of the federal poverty level.
TABLE 5.8.4.1
HOUSEHOLD INCOME FOR 2008
Pantry Client Households
Kitchen Client Households
Shelter Client Households
All Client Households
Total annual income No income 3.7% 14.4% n.p. 12.5% $1-$4,999 14.3% 12.0% n.p. 12.9% $5,000-$9,999 26.5% 5.1% n.p. 20.6% $10,000-$14,999 15.1% 30.5% n.p. 16.8% $15,000-$19,999 14.0% 3.1% n.p. 10.2% $20,000-$24,999 10.4% 0.0% n.p. 7.2% $25,000-$29,999 3.0% 0.0% n.p. 2.1% $30,000-$34,999 2.2% 0.0% n.p. 1.5% $35,000-$39,999 1.9% 3.0% n.p. 1.9% $40,000-$44,999 0.9% 12.6% n.p. 4.9% $45,000-$49,999 1.1% 0.0% n.p. 0.7% $50,000 and over 0.1% 0.0% n.p. 0.1% Unknown 6.8% 19.2% n.p. 8.5% TOTAL 100.0% 100.0% n.p. 100.0%
Average annual income among
valid responses (in dollars)a 12,980 13,960 n.p. 12,500
Median annual income among valid responses (in dollars)
10,000 12,000 n.p. 9,700
Income as a percentage of the federal poverty levelb c
0% (no income)d 3.7% 14.4% n.p. 12.5% 1%-50% 33.3% 14.7% n.p. 27.3% 51%-75% 24.1% 2.6% n.p. 17.7% 76%-100% 14.0% 28.3% n.p. 15.4% 101%-130% 8.6% 4.2% n.p. 6.9% 131%-150% 3.4% 1.0% n.p. 2.6% 151%-185% 3.4% 0.0% n.p. 2.3% 186% or higher 2.8% 15.6% n.p. 6.8% Unknown 6.8% 19.2% n.p. 8.5% TOTAL 100.0% 100.0% n.p. 100.0%

Hunger in America 2010 The Capital Area Food Bank of Texas, Inc (4408)
75 CH 5. CLIENTS: DEMOGRAPHIC PROFILE
Pantry Client Households
Kitchen Client Households
Shelter Client Households
All Client Households
Average annual income as percentage of the poverty level among valid responses
68.5% 85.2% n.p. 71.6%
Median annual income as percentage of the poverty level among valid responses
64.5% 82.4% n.p. 63.5%
SAMPLE SIZE (N) 296 46 12 354 SOURCE: This table was constructed based on all responses to Question 29 of the client survey. NOTES: The percentages presented in this table, unlike those in most other tables, were calculated without leaving
out item nonresponses. To ensure that key percentages, such as that for no income, appear consistent within this table, a constant denominator, which includes item nonresponses, was used. All responses were weighted as described in Chapter 3 and in the Technical Appendix volume to represent all emergency food clients or households of The Capital Area Food Bank of Texas, Inc.
For total annual income, missing, don’t know, and refusal responses combined are 6.8% for pantry clients, 19.2% for kitchen clients, n.p. for shelter clients, and 8.5% for all clients. The missing rates we report here were obtained after we cross-imputed missing responses for monthly and yearly income variables. For income as percentage of the federal poverty level, missing, don’t know, and refusal responses combined are 6.8% for pantry clients, 19.2% for kitchen clients, n.p. for shelter clients, and 8.5% for all clients.
aFor the calculation of the average and the median, responses given as a range were recoded to be the midpoint of the bracket. bSee Table 5.8.1.1 for the monthly federal poverty levels (and multiply by 12 to obtain annual levels). See Table 5.8.1.2 for an example of how to compute income as a percentage of the federal poverty level. cIncome as a percentage of the federal poverty level is determined by dividing each client’s annual income by 12 times the federal poverty level in Table 5.8.1.1 corresponding to the client’s household size. For example, for a client with an annual income of $12,000 who lives in a 2-person household in Virginia, his or her annual income as a percentage of the federal poverty level ($1,214*12) is $12,000/($1,214*12), or 82.4%. dThe percentages in this row may not be equal to those in the corresponding row of the upper panel of this table, because the two panels of data may have different item nonresponse rates. The calculation in the lower panel required information about household size as well as household income.
In the year 2008, 46.0% of all clients had a household income less than $10,000. More
information about annual income of client households follows:
• Average household income among all clients in year 2008 was $12,500.
• 79.8% of the clients’ households had an income of 130% of the federal poverty level or below.

Hunger in America 2010 The Capital Area Food Bank of Texas, Inc (4408)
76 CH 5. CLIENTS: DEMOGRAPHIC PROFILE
• Average household income as percentage of the federal poverty level was 71.6% (median: 63.5%).
CHART 5.8.4.1 HOUSEHOLD INCOME IN 2008 AS PERCENTAGE OF FEDERAL POVERTY LEVEL
By Program Type
68.5%
85.2%
69.6%
64.5%
82.4%
0.0%0.0%
10.0%
20.0%
30.0%
40.0%
50.0%
60.0%
70.0%
80.0%
90.0%
Pantry client households Kitchen client households Shelter client householdsIncome in 2008
Per
cen
tag
e o
f F
eder
al P
ove
rty
Lev
el
Average Income Median Income
Note: Charts corresponding to tables that contain values of "n.p." or "N.A." (see section 3.7) may display the
suppressed numbers in place of "n.p" or "N.A". This is due to the limitation of the computer system used to generate the member-level reports. The parts of the chart for which this is true should be ignored.

Hunger in America 2010 The Capital Area Food Bank of Texas, Inc (4408)
77 CH 5. CLIENTS: DEMOGRAPHIC PROFILE
5.8.5 Education and Income in 2008
Not surprisingly, education status is highly correlated with income (Table 5.8.5.1).
TABLE 5.8.5.1
INCOME IN 2008, BY EDUCATION
Highest Education Level Achieved
Income in 2008 as a Percentage of Federal Poverty Levela
All Clients
Less than High School
Completed High School
Completed Noncollege/
Business/ Technical
School
Some College/
Two-Year Degree
Completed College
0% (no income) 13.8% 27.5% 7.2% n.p. 1.0% n.p. 1%-50% 29.6% 30.9% 33.8% n.p. 21.5% n.p. 51%-75% 18.5% 14.1% 32.6% n.p. 12.4% n.p. 76%-100% 17.9% 13.9% 12.7% n.p. 31.9% n.p. 101%-130% 7.2% 6.9% 6.2% n.p. 7.7% n.p. SUBTOTAL 87.1% 93.4% 92.5% n.p. 74.4% n.p. 131%-150% 2.8% 3.9% 3.3% n.p. 1.2% n.p. 151%-185% 2.6% 1.7% 1.8% n.p. 3.5% n.p. 186% or higher 7.5% 1.1% 2.5% n.p. 20.8% n.p. SUBTOTAL 12.9% 6.6% 7.5% n.p. 25.6% n.p.
TOTAL 100.0% 100.0% 100.0% n.p. 100.0% n.p.
SAMPLE SIZE (N) 334 127 117 10 60 20 SOURCE: This table was constructed based on all responses to questions 10 and 29 of the client survey. NOTES: The percentages presented in this table, unlike those in most other tables, were calculated without leaving
out item nonresponses. To ensure that key percentages, such as that for no income, appear consistent within this table, a constant denominator, which includes item nonresponses, was used. All responses were weighted as described in Chapter 3 and in the Technical Appendix volume to represent all emergency food clients or households of The Capital Area Food Bank of Texas, Inc.
For income as percentage of the federal poverty level, missing, don’t know, and refusal responses combined are 7.6% for all clients, 6.7% for clients who completed less than high school, 0.3% for clients who completed high school, 0.3% for clients who completed noncollege schooling, 0.0% for clients who completed some college, and 0.3% for clients who completed college.
aSee Table 5.8.1.1 for the monthly federal poverty levels (and multiply by 12 to obtain annual levels). Findings presented in Table 5.8.5.1 include:
• In 2008, 93.4% of the clients who had not completed high school and 92.5% of the clients who had completed up to high school had either no income or an income less than 130% of the federal poverty level. In addition, n.p. of the clients

Hunger in America 2010 The Capital Area Food Bank of Texas, Inc (4408)
78 CH 5. CLIENTS: DEMOGRAPHIC PROFILE
who had completed college had either no income or an income less than 130% of the federal poverty level.
• The percentage of the clients who had an income more than 130% of the federal poverty level in 2008 is only 6.6% among the clients who had not completed high school. It is as high as n.p. among the clients who had completed college.

Hunger in America 2010 The Capital Area Food Bank of Texas, Inc (4408)
79 CH 5. CLIENTS: DEMOGRAPHIC PROFILE
5.8.6 Presence of Elderly or Children and Income in 2008
Table 5.8.6.1 shows differences in income between households with various household
structures.
TABLE 5.8.6.1
INCOME IN 2008, BY PRESENCE OF ELDERLY OR CHILDREN
Income in 2008 as Percentage of Federal Poverty Levela All Households
Households with Seniors
Households with Children,
No Seniors
One-Person Households with Neither Children nor
Seniors
Households with Two or More People
but with Neither Children nor
Seniors
0% (no income) 13.7% 0.0% 3.2% 37.4% 4.7% 1%-50% 29.8% 25.7% 42.0% 18.3% 23.0% 51%-75% 18.4% 25.2% 23.7% 11.4% 14.9% 76%-100% 17.7% 23.6% 11.7% 10.7% 40.0% 101%-130% 7.6% 15.1% 5.2% 6.8% 10.9% SUBTOTALa 87.2% 89.6% 85.9% 84.5% 93.5% 131%-150% 2.8% 0.5% 4.2% 2.5% 1.2% 151%-185% 2.5% 9.9% 2.3% 0.8% 2.7% 186% or higher 7.4% 0.0% 7.6% 12.2% 2.6% SUBTOTAL 12.8% 10.4% 14.1% 15.5% 6.5%
TOTAL 100.0% 100.0% 100.0% 100.0% 100.0%
SAMPLE SIZE (N) 337 47 150 87 53
SOURCE: This table was constructed based on all responses to questions 3, 6a, 6b, 6c, 7, and 29 of the client survey. NOTES: The percentages presented in this table, unlike those in most other tables, were calculated without leaving
out item nonresponses. To ensure that key percentages, such as that for no income, appear consistent within this table, a constant denominator, which includes item nonresponses, was used. All responses were weighted as described in Chapter 3 and in the Technical Appendix volume to represent all emergency food clients or households of The Capital Area Food Bank of Texas, Inc.
For income as percentage of the federal poverty level, missing, don’t know, and refusal responses combined are 8.5% for all households, 1.3% for households with seniors, 0.7% for households with seniors and no children, 2.2% for one-person households with neither seniors nor children, and 4.3% for households with two or more people but neither seniors nor children.
aSee Table 5.8.1.1 for the monthly federal poverty levels (and multiply by 12 to obtain annual levels). Key findings include:

Hunger in America 2010 The Capital Area Food Bank of Texas, Inc (4408)
80 CH 5. CLIENTS: DEMOGRAPHIC PROFILE
• The percentage of one-person households with neither children nor seniors without income is 37.4%. For all households, this percentage is 13.7%.
• The percentage of households with two or more people but without seniors or children who have incomes above 130% of the federal poverty level is 6.5%. For all households in the population, the percentage is 12.8%.

Hunger in America 2010 The Capital Area Food Bank of Texas, Inc (4408)
81 CH 5. CLIENTS: DEMOGRAPHIC PROFILE
5.9 HOUSING
5.9.1 Housing Status
Table 5.9.1.1 shows the housing status of the client households. It shows whether they
have a place to live, what kind of housing they have, whether they own or rent, and what their
other housing-related experiences have been.
TABLE 5.9.1.1
HOUSING STATUS
Pantry Client Households
Kitchen Client Households
Shelter Client Households
All Client Households
Clients with a place to live
House 45.7% 63.7% n.p. 44.3% Mobile home/trailer 17.2% 1.0% n.p. 12.0% Apartment 30.9% 4.9% n.p. 22.2% Room 0.8% 0.0% n.p. 0.5% Motel/Hotel 0.9% 0.0% n.p. 0.6% Live with family, friends 2.7% 1.7% n.p. 2.2% SUBTOTAL 98.1% 71.3% n.p. 81.8%
Clients without a place to live
Homeless, living in shelter or mission 0.5% 19.5% n.p. 10.0%
Homeless, living on the street 0.3% 8.6% n.p. 7.3%
Car, van, or recreational vehicle 1.1% 0.6% n.p. 0.9%
Abandoned building 0.0% 0.0% n.p. 0.0% SUBTOTAL 1.9% 28.7% n.p. 18.2%
TOTAL 100.0% 100.0% n.p. 100.0%
SAMPLE SIZE (N) 296 46 12 354
Among clients who have a place to live
Own the place you live 22.0% n.p. N.A. 18.0% Rent your place 68.8% n.p. N.A. 68.2% Live free with someone else 6.8% n.p. N.A. 11.8% Othera 2.4% n.p. N.A. 2.0% TOTAL 100.0% n.p. n.p. 100.0%

Hunger in America 2010 The Capital Area Food Bank of Texas, Inc (4408)
82 CH 5. CLIENTS: DEMOGRAPHIC PROFILE
Pantry Client Households
Kitchen Client Households
Shelter Client Households
All Client Households
Clients late paying the last month’s rent or mortgage 31.2% n.p. N.A. 28.6%
Clients whose households receive Section 8 or Public Housing Assistance 13.1% n.p. n.p. 9.6%
SAMPLE SIZE (N) 289 16 0 305 SOURCE: This table was constructed based on usable responses to questions 16, 17, 18, and 81 of the client survey. NOTES: The percentages presented in this table are based only on usable responses, excluding missing, don’t
know, and refusal responses. All usable responses were weighted as described in Chapter 3 and in the Technical Appendix volume to represent all emergency food clients of The Capital Area Food Bank of Texas, Inc. The sample sizes (N) also include missing data.
For the kind of place where living, missing, don’t know, and refusal responses combined are 1.5% for pantry clients, 0.0% for kitchen clients, 0.0% for shelter clients, and 1.1% for all clients. For those with a place to live, missing, don’t know, and refusal responses combined are 5.4% for pantry clients, 0.0% for kitchen clients, 0.0% for shelter clients, and 3.7% for all clients. For those late paying rent or mortgage, missing, don’t know, and refusal responses combined are 5.3% for pantry clients, 0.1% for kitchen clients, 0.0% for shelter clients, and 3.7% for all clients. For those receiving Section 8 or Public Housing Assistance, missing, don’t know, and refusal responses combined are 8.9% for pantry clients, 2.7% for kitchen clients, 18.7% for shelter clients, and 8.7% for all clients.
aThis includes “working for rent” and halfway houses.
Among all client households, 18.2% were without a place to live. More details on
housing status of the clients follow:
• n.p. of shelter client households were without a place to live.
• 28.7% of kitchen client households were without a place to live.
• 1.9% of pantry client households were without a place to live.
• 22.0% of pantry client households with a place to live own the place where they live.
• 28.6% of the client households with a place to live were late paying the previous month’s rent or mortgage.
• 9.6% of the client households with a place to live said they received Section 8 or Public Housing Assistance at the time of the interview.

Hunger in America 2010 The Capital Area Food Bank of Texas, Inc (4408)
83 CH 5. CLIENTS: DEMOGRAPHIC PROFILE
CHART 5.9.1.1 HOUSINGBy Program Type
98.1%
71.3%
0.0%1.9%
28.7%
100.0%
0.0%
20.0%
40.0%
60.0%
80.0%
100.0%
120.0%
Adult clients who pick up food at a pantry Adult clients at a kitchen Adult clients at a shelter
Housing
Per
cen
tag
e o
f C
lien
ts
Clients with a Place to Live Clients wihtout a Place to Live
Note: Charts corresponding to tables that contain values of "n.p." or "N.A." (see section 3.7) may display the
suppressed numbers in place of "n.p" or "N.A". This is due to the limitation of the computer system used to generate the member-level reports. The parts of the chart for which this is true should be ignored.

Hunger in America 2010 The Capital Area Food Bank of Texas, Inc (4408)
84 CH 5. CLIENTS: DEMOGRAPHIC PROFILE
Table 5.9.1.2 compares income levels for clients who reported being without a place to
live with income levels for those who have a place to live.
TABLE 5.9.1.2
INCOME IN 2008, BY HOUSING STATUS
Housing Status
Income in 2008 as Percentage of Federal Poverty Levela All Clients
Clients with a Place to Live
Clients Without a Place to Live
0% (no income) 13.7% 4.7% 51.2% 1%-50% 29.8% 32.8% 17.1% 51%-75% 18.4% 22.0% 3.7% 76%-100% 17.7% 20.7% 5.4% 101%-130% 7.6% 7.4% 8.3% SUBTOTAL 87.2% 87.6% 85.6% 131%-150% 2.8% 3.2% 1.1% 151%-185% 2.5% 3.2% 0.0% 186% or Higher 7.4% 6.0% 13.3% SUBTOTAL 12.8% 12.4% 14.4%
TOTAL 100.0% 100.0% 100.0%
SAMPLE SIZE (N) 337 290 47 SOURCE: This table was constructed based on all responses to questions 16 and 29 of the client survey. NOTES: The percentages presented in this table, unlike those in most other tables, were calculated without leaving
out item nonresponses. To ensure that key percentages, such as that for no income, appear consistent within this table, a constant denominator, which includes item nonresponses, was used. All responses were weighted as described in Chapter 3 and in the Technical Appendix volume to represent all emergency food clients or households of The Capital Area Food Bank of Texas, Inc.
For income as percentage of the federal poverty level, missing, don’t know, and refusal responses combined are 7.6% for all clients, 7.3% for clients with a place to live, and 0.3% for clients without a place to live.
aSee Table 5.8.1.1 for the monthly federal poverty levels (and multiply by 12 to obtain annual levels).
Key findings include:
• The percentage of the clients who were without a place to live that had no income in 2008 is 51.2%, compared with only 4.7% of the clients who have a place to live.
• In 2008, among the clients who had a place to live, 87.6% had income less than or equal to 130% of the federal poverty level, while 12.4% had income above 130% of the federal poverty level.

Hunger in America 2010 The Capital Area Food Bank of Texas, Inc (4408)
85 CH 5. CLIENTS: DEMOGRAPHIC PROFILE
• In 2008, among the clients who were without a place to live, 85.6% had income less than or equal to 130% of the federal poverty level, while 14.4% had income above 130% of the federal poverty level.
Table 5.9.1.3 describes the association between income and home ownership among
clients with a place to live.
TABLE 5.9.1.3
INCOME IN 2008, BY HOME OWNERSHIP
Income in 2008 as Percentage of Federal Poverty Levela
All Clients with a Place to Live
Clients Who Own a Place
Clients Who Rent a Place
Clients Who Live with Someone for Free Other
0% (no income) 4.8% 3.0% 2.3% n.p. n.p. 1%-50% 31.8% 29.7% 31.1% n.p. n.p. 51%-75% 22.1% 23.4% 24.2% n.p. n.p. 76%-100% 21.5% 16.0% 23.0% n.p. n.p. 101%-130% 7.1% 10.8% 7.1% n.p. n.p. SUBTOTAL 87.3% 82.9% 87.6% n.p. n.p. 131%-150% 3.3% 8.4% 2.3% n.p. n.p. 151%-185% 3.1% 8.7% 2.2% n.p. n.p. 186% or higher 6.2% 0.0% 7.9% n.p. n.p. SUBTOTAL 12.7% 17.1% 12.4% n.p. n.p.
TOTAL 100.0% 100.0% 100.0% n.p. n.p.
SAMPLE SIZE (N) 279 73 175 22 9 SOURCE: This table was constructed based on all responses to questions 16 and 29 of the client survey. NOTES: The percentages presented in this table, unlike those in most other tables, were calculated without leaving
out item nonresponses. To ensure that key percentages, such as that for no income, appear consistent within this table, a constant denominator, which includes item nonresponses, was used. All responses were weighted as described in Chapter 3 and in the Technical Appendix volume to represent all emergency food clients or households of The Capital Area Food Bank of Texas, Inc.
For income as percentage of the federal poverty level, missing, don’t know, and refusal responses combined are 9.2% for all clients, 1.5% for clients who own a place, 2.3% for clients who rent a place, 5.0% for clients who live with someone for free, and 0.5% for clients with some other living arrangement.
aSee Table 5.8.1.1 for the monthly federal poverty levels (and multiply by 12 to obtain annual levels). Among the findings illustrated by the table are:
• 3.0% of the clients who own a place to live, 2.3% of the clients who rent, and n.p. of the clients who live with someone else for free had no income in 2008.

Hunger in America 2010 The Capital Area Food Bank of Texas, Inc (4408)
86 CH 5. CLIENTS: DEMOGRAPHIC PROFILE
• 82.9% of the clients who own a place to live, 87.6% of the clients who rent, and n.p. of the clients who live with someone else for free had either no income or an income at or below 130% of the federal poverty level.
• On the other hand, 17.1% of the clients who own a place to live, 12.4% of the clients who rent, and n.p. of the clients who live with someone else for free had an income over 130% of the federal poverty level.

Hunger in America 2010 The Capital Area Food Bank of Texas, Inc (4408)
87 CH 5. CLIENTS: DEMOGRAPHIC PROFILE
5.9.2 Household Resources
Clients indicated whether their households have access to a kitchen, a working telephone,
or a working car. Responses are presented in Table 5.9.2.1.
TABLE 5.9.2.1
HOUSEHOLD RESOURCES
Household Resources Pantry Client Households
Kitchen Client Households
Shelter Client Households
All Client Households
Clients have access to a place where they can prepare a meal
Yes 99.2% 81.1% n.p. 92.8% No 0.8% 18.9% n.p. 7.2% TOTAL 100.0% 100.0% n.p. 100.0%
Clients have access to a working telephone
Yes 85.8% 68.5% n.p. 83.7% No 14.2% 31.5% n.p. 16.3% TOTAL 100.0% 100.0% n.p. 100.0%
Clients have access to a working car Yes 74.2% 42.7% n.p. 59.5% No 25.8% 57.3% n.p. 40.5% TOTAL 100.0% 100.0% n.p. 100.0%
SAMPLE SIZE (N) 296 46 12 354 SOURCE: This table was constructed based on usable responses to Question 19 of the client survey. NOTES: The percentages presented in this table are based only on usable responses, excluding missing, don’t
know, and refusal responses. All usable responses were weighted as described in Chapter 3 and in the Technical Appendix volume to represent all emergency food clients of The Capital Area Food Bank of Texas, Inc. The sample sizes (N) also include missing data.
For access to a place to prepare a meal, missing, don’t know, and refusal responses combined are 1.7% for pantry clients, 0.0% for kitchen clients, 0.0% for shelter clients, and 1.2% for all clients. For access to a working telephone, missing, don’t know, and refusal responses combined are 1.7% for pantry clients, 0.0% for kitchen clients, 0.0% for shelter clients, and 1.2% for all clients. For clients with access to a working car, missing, don’t know, and refusal responses combined are 1.7% for pantry clients, 0.4% for kitchen clients, 0.0% for shelter clients, and 1.3% for all clients.
Findings about selected household resources presented in Table 5.9.2.1 include:

Hunger in America 2010 The Capital Area Food Bank of Texas, Inc (4408)
88 CH 5. CLIENTS: DEMOGRAPHIC PROFILE
• Overall, 92.8% of the clients have access to a place where they can prepare a meal. The percentages of pantry, kitchen, and shelter clients who have access to such a place are 99.2%, 81.1%, and n.p., respectively.
• Overall, 83.7% of the clients have access to a working telephone. The percentages of pantry, kitchen, and shelter clients who have access to a working telephone are 85.8%, 68.5%, and n.p., respectively.
• Overall, 59.5% of the clients have access to a working car. The percentages of pantry, kitchen, and shelter clients who have access to a working car are 74.2%, 42.7%, and n.p., respectively.
CHART 5.9.2.1 HOUSEHOLD RESOURCESBy Program Type
99.2%
81.1%
75.0%
85.8%
68.5%
98.6%
74.2%
42.7%
0.0%0.0%
20.0%
40.0%
60.0%
80.0%
100.0%
120.0%
Pantry client households Kitchen client households Shelter client households
Kitchen, Phone, and Car
Per
cen
tag
e o
f H
ou
seh
old
s
Access to a place where they can prepare a meal Have access to a working phone Have access to a working car
Note: Charts corresponding to tables that contain values of "n.p." or "N.A." (see section 3.7) may display the
suppressed numbers in place of "n.p" or "N.A". This is due to the limitation of the computer system used to generate the member-level reports. The parts of the chart for which this is true should be ignored.

Hunger in America 2010 The Capital Area Food Bank of Texas, Inc (4408)
89 CH 6. CLIENTS: FOOD INSECURITY
6. CLIENTS: FOOD INSECURITY
Food insecurity is a complex, multifaceted phenomenon that varies along a continuum of
successive stages as it becomes more severe. A scaling tool developed by the USDA provides an
important approach being used increasingly to assess food security among households. Six
questions in a six-item short module, the minimal information required to construct the scale,
were included in the client survey.18 Food security and food insecurity are conceptually defined
as the following:19
• Food security: “Access by all people at all times to enough food for an active, healthy life. Food security includes at a minimum: (1) the ready availability of nutritionally adequate and safe foods, and (2) an assured ability to acquire acceptable foods in socially acceptable ways (e.g., without resorting to emergency food supplies, scavenging, stealing, or other coping strategies).”
• Food insecurity: “Limited or uncertain availability of nutritionally adequate and safe foods or limited or uncertain ability to acquire acceptable foods in socially acceptable ways.”
Previous Hunger in America studies further classified food-insecure individuals and
households as “food insecure without hunger” and “food insecure with hunger.” Changes in
these descriptions to “food insecure with low food security” and “food insecure with very low
food security,” respectively, were made in 2006 at the recommendation of the Committee on
National Statistics in order to distinguish the physiological state of hunger from indicators of
18 Bickel, Gary, Mark Nord, Cristofer Price, William Hamilton, and John Cook. “Guide to Measuring
Household Food Security, Revised 2000.” U.S. Department of Agriculture, Food and Nutrition Service, March 2000.
19 “Core Indicators of Nutritional State for Difficult-to-Sample Populations.” Journal of Nutrition, vol. 120, no.11S, November 1990.

Hunger in America 2010 The Capital Area Food Bank of Texas, Inc (4408)
90 CH 6. CLIENTS: FOOD INSECURITY
food availability.20 While the terminology changed, the classification of households into the three
food security levels remained the same. Clients responded to a six-item short module for
classifying households by food security status level (the same module was used in Hunger in
America 2006). Food security scale scores were assigned to households according to the “Guide
to Measuring Household Food Security, Revised 2000.”21
The main distinction between a household being classified as having very low food
security and low food security is that households with very low food security have had one or
more members experience reductions in food intake or disruptions in eating patterns due to a
lack of adequate resources for food. Households with low food security, while faced with food-
access problems, typically do not experience incidents of reduced food intake.
This chapter begins by assessing clients’ levels of food security, first for all households
and then separately for households with children and for households with elderly members.
Cross-tabulations with household income levels, participation in federal food assistance
programs, and several demographic characteristics are also examined. Subsequent sections then
provide data on household responses to the specific questions used in constructing the food
security scores.
20 Mark Nord, Margaret Andrews, and Steven Carlson. “Household Food Security in the United States,
2007.” U.S. Department of Agriculture, Food and Nutrition Service, 2008. Economic Research Report No. 66 (ERS-66) November 2008.
21 Bickel et al. March 2000.

Hunger in America 2010 The Capital Area Food Bank of Texas, Inc (4408)
91 CH 6. CLIENTS: FOOD INSECURITY
6.1 HOUSEHOLD FOOD INSECURITY
In this section, we examine household food insecurity across a variety of populations.
6.1.1 Household Food Insecurity and Household Composition
Table 6.1.1.1 describes the prevalence of food insecurity among all households,
households with children, and households with elderly members based on self-reported
information about household food situations.
TABLE 6.1.1.1
HOUSEHOLD FOOD INSECURITY
Food Security Among Clients’ Households
Pantry Client Households
Kitchen Client Households
Shelter Client Households
All Client Households
Food security among all households
Food secure 19.5% 21.9% n.p. 19.9% Food insecure
With low food security 43.8% 13.1% n.p. 39.8% With very low food security 36.7% 65.0% n.p. 40.3% SUBTOTAL 80.5% 78.1% n.p. 80.1%
TOTAL 100.0% 100.0% n.p. 100.0%
SAMPLE SIZE (N) 296 46 12 354
Food security among households with children younger than age 18
Food secure 19.4% n.p. N.A. 23.9% Food insecure
With low food security 48.4% n.p. N.A. 46.6%
With very low food security 32.2% n.p. N.A. 29.4% SUBTOTAL 80.6% n.p. N.A. 76.1%
TOTAL 100.0% n.p. n.p. 100.0%
SAMPLE SIZE (N) 168 6 0 174
Food security among households with seniors age 65 or older
Food secure 29.6% N.A. N.A. 29.6% Food insecure
With low food security 35.2% N.A. N.A. 35.2%
With very low food security 35.2% N.A. N.A. 35.2% SUBTOTAL 70.4% N.A. N.A. 70.4%
TOTAL 100.0% n.p. n.p. 100.0%

Hunger in America 2010 The Capital Area Food Bank of Texas, Inc (4408)
92 CH 6. CLIENTS: FOOD INSECURITY
Food Security Among Clients’ Households
Pantry Client Households
Kitchen Client Households
Shelter Client Households
All Client Households
SAMPLE SIZE (N) 51 0 0 51 SOURCE: This table was constructed based on usable responses to questions 42, 43, 44, 44a, 45, and 46 of the client
survey.
NOTES: The percentages presented in this table are based only on usable responses, excluding missing, don’t know, and refusal responses. All usable responses were weighted as described in Chapter 3 and in the Technical Appendix volume to represent all emergency food clients of The Capital Area Food Bank of Texas, Inc. The sample sizes (N) also include missing data.
Constructed according to Bickel et al. (2000).
For all households, missing, don’t know, and refusal responses combined are 3.2% for pantry clients, 0.0% for kitchen clients, 11.8% for shelter clients, and 3.5% for all clients.
For households with children younger than age 18, missing, don’t know, and refusal responses combined are 1.9% for pantry clients, 0.0% for kitchen clients, N.A. for shelter clients, and 1.8% for all clients.
For households with seniors, missing, don’t know, and refusal responses combined are 0.0% for pantry clients, N.A. for kitchen clients, N.A. for shelter clients, and 0.0% for all clients.
According to the six-item short module, 39.8% of all client households of the emergency
food programs had low food security. Another 40.3% had very low food security. Combined, a
total of 80.1% were food insecure. Other findings include:
• Among the client households with children younger than age 18, 46.6% had low food security and 29.4% had very low food security.
• Among the client households with seniors age 65 years or older, 35.2% had low food security and 35.2% had very low food security.
The results in Table 6.1.1.1 suggest that 19.9% households are food secure. There are
several reasons that may help to explain the apparent paradox that food secure households are
seeking emergency food from pantries, kitchens, and shelters. The questions on which the food
security estimates are based ask about client food situations over the last twelve months and thus
may not properly characterize current circumstances. In addition, the emergency food assistance
that respondents receive may ameliorate their food situations by enough to make them food
secure, but their situations could be drastically different in the absence of this assistance.

Hunger in America 2010 The Capital Area Food Bank of Texas, Inc (4408)
93 CH 6. CLIENTS: FOOD INSECURITY
CHART 6.1.1.1 FOOD INSECURITYAmong All Client Households
19.5%21.9%
18.2%
43.8%
13.1%
67.5%
36.7%
65.0%
14.3%
0.0%
10.0%
20.0%
30.0%
40.0%
50.0%
60.0%
70.0%
80.0%
Pantry client households Kitchen client households Shelter client households
Per
cen
tag
e o
f H
ou
seh
old
s
Food secure Food insecure with low food security Food insecure with very low food security
CHART 6.1.1.1A FOOD INSECURITYAmong Households with Children Younger than Age 18
19.4%
71.4%
0.0%
48.4%
27.8%
0.0%
32.2%
0.8% 0.0%0.0%
10.0%
20.0%
30.0%
40.0%
50.0%
60.0%
70.0%
80.0%
Pantry client households Kitchen client households Shelter client households
Per
cen
tag
e o
f H
ou
seh
old
s
Food secure Food insecure with low food security Food insecure with very low food security

Hunger in America 2010 The Capital Area Food Bank of Texas, Inc (4408)
94 CH 6. CLIENTS: FOOD INSECURITY
CHART 6.1.1.1B FOOD INSECURITYAmong Households with Seniors Age 65 or Older
29.6%
0.0% 0.0%
35.2%
0.0% 0.0%
35.2%
0.0% 0.0%0.0%
5.0%
10.0%
15.0%
20.0%
25.0%
30.0%
35.0%
40.0%
Pantry client households Kitchen client households Shelter client households
Per
cen
tag
e o
f H
ou
seh
old
s
Food secure Food insecure with low food security Food insecure with very low food security
Note: Charts corresponding to tables that contain values of "n.p." or "N.A." (see section 3.7) may display the
suppressed numbers in place of "n.p" or "N.A". This is due to the limitation of the computer system used to generate the member-level reports. The parts of the chart for which this is true should be ignored.

Hunger in America 2010 The Capital Area Food Bank of Texas, Inc (4408)
95 CH 6. CLIENTS: FOOD INSECURITY
Food insecurity may cause particular hardships in households with children or seniors.
Below, we explore associations between food security and the presence of children younger than
18, children younger than 5, and senior household members.
Table 6.1.1.2 shows that 76.1% of client households with children under 18 are food
insecure, while the percentage among childless households is 83.2%. In Table 6.1.1.3, we
present the same table for households with and without young children.
TABLE 6.1.1.2
FOOD INSECURITY, BY PRESENCE OF CHILDREN
Households With or Without Children Younger than 18
All Client Households
With Children Younger than 18
Without Children Younger than 18
Food secure 19.9% 23.9% 16.8% Food insecure with low food
security 39.8% 46.6% 34.5% Food insecure with very low
food security 40.3% 29.4% 48.7%
TOTAL 100.0% 100.0% 100.0%
SAMPLE SIZE (N) 346 169 177
SOURCE: This table was constructed based on usable responses to questions 6b, 42, 43, 44, 44a, 45, and 46 of the client survey.
NOTES: The percentages presented in this table are based only on usable responses, excluding missing, don’t know, and refusal responses. All usable responses were weighted as described in Chapter 3 and in the Technical Appendix volume to represent all emergency food clients of The Capital Area Food Bank of Texas, Inc. The sample sizes (N) also include missing data. Constructed according to Bickel et al. (2000).
Missing, don’t know, and refusal responses combined are 3.5% for all clients, 0.7% for households with children younger than age 18, and 2.7% for households without children younger than age 18.

Hunger in America 2010 The Capital Area Food Bank of Texas, Inc (4408)
96 CH 6. CLIENTS: FOOD INSECURITY
TABLE 6.1.1.3
FOOD INSECURITY, BY PRESENCE OF YOUNG CHILDREN
Households With or Without Children Ages 0-5
All Client Households With Children Ages 0-5 Without Children Ages 0-5
Food secure 19.9% 10.2% 22.1% Food insecure with low food
security 39.8% 55.3% 36.2%
Food insecure with very low food security
40.3% 34.4% 41.7%
TOTAL 100.0% 100.0% 100.0%
SAMPLE SIZE (N) 346 80 266 SOURCE: This table was constructed based on usable responses to questions 7, 42, 43, 44, 44a, 45, and 46 of the
client survey.
NOTES: The percentages presented in this table are based only on usable responses, excluding missing, don’t know, and refusal responses. All usable responses were weighted as described in Chapter 3 and in the Technical Appendix volume to represent all emergency food clients of The Capital Area Food Bank of Texas, Inc. The sample sizes (N) also include missing data. Constructed according to Bickel et al. (2000).
Missing, don’t know, and refusal responses combined are 3.5% for all clients, 0.4% for households with children ages 0-5, and 3.0% for households without children ages 0-5.
Specific findings include:
• 29.4% of client households with children under 18 and 34.4% with children ages 0 to 5 are classified as having very low food security.
• 46.6% of client households with children under 18 and 55.3% of those with children ages 0 to 5 are classified as having low food security.
To further the relationship between household composition and food security, Table
6.1.1.4 breaks down household composition in terms of both the presence of children younger
than 18 and the presence of seniors age 65 or older. There are four panels in the table, the top
panel showing the tabulations for the entire client data and the subsequent three disaggregating
the analysis by type of program.

Hunger in America 2010 The Capital Area Food Bank of Texas, Inc (4408)
97 CH 6. CLIENTS: FOOD INSECURITY
TABLE 6.1.1.4
FOOD INSECURITY, BY PRESENCE OF ELDERLY OR CHILDREN
All Households Households with Seniors
Households with Children,
No Seniors
One-Person Households with Neither Children nor
Seniors
Households with Two or More People
but with Neither Children nor
Seniors
For All Three Programs
Food secure 19.9% 29.6% 22.7% 18.2% 13.0% Food insecure
with low food security 39.8% 35.2% 48.9% 42.6% 21.9%
Food insecure with very low food security 40.3% 35.2% 28.5% 39.3% 65.2%
TOTAL 100.0% 100.0% 100.0% 100.0% 100.0%
SAMPLE SIZE (N) 346 51 150 89 56
For Pantry Programs
Food secure 19.5% 29.6% 17.6% 12.7% 24.0% Food insecure
with low food security 43.8% 35.2% 51.1% 31.9% 40.5%
Food insecure with very low food security 36.7% 35.2% 31.4% 55.4% 35.6%
TOTAL 100.0% 100.0% 100.0% 100.0% 100.0%
SAMPLE SIZE (N)
289 51 144 46 48
For Kitchen Programs
Food secure 21.9% n.p. n.p. 27.3% n.p.
Food insecure with low food security 13.1% n.p. n.p. 24.3% n.p.
Food insecure with very low food security 65.0% n.p. n.p. 48.4% n.p.
TOTAL 100.0% n.p. n.p. 100.0% n.p.
SAMPLE SIZE (N)
46 0 6 32 8
For Shelter Programs

Hunger in America 2010 The Capital Area Food Bank of Texas, Inc (4408)
98 CH 6. CLIENTS: FOOD INSECURITY
All Households Households with Seniors
Households with Children,
No Seniors
One-Person Households with Neither Children nor
Seniors
Households with Two or More People
but with Neither Children nor
Seniors
Food secure n.p. n.p. n.p. n.p. n.p. Food insecure
with low food security n.p. n.p. n.p. n.p. n.p.
Food insecure with very low food security n.p. n.p. n.p. n.p. n.p.
TOTAL n.p. n.p. n.p. n.p. n.p.
SAMPLE SIZE (N)
11 0 0 11 0 SOURCE: This table was constructed based on usable responses to questions 3, 6a, 6b, 6c, 7, 42, 43, 44, 44a, 45, and
46 of the client survey.
NOTES: The percentages presented in this table are based only on usable responses, excluding missing, don’t know, and refusal responses. All usable responses were weighted as described in Chapter 3 and in the Technical Appendix volume to represent all emergency food clients of The Capital Area Food Bank of Texas, Inc. The sample sizes (N) also include missing data.
Constructed according to Bickel et al. (2000).
For all clients, missing, don’t know, and refusal responses combined are 3.5% for clients in all households, 0.0% for clients in households with seniors, 0.7% for clients in households with children and no seniors, 2.6% for clients in one-person households with neither children nor seniors, and 0.1% for clients in households with two or more people but with neither children nor seniors.
For pantry clients, missing, don’t know, and refusal responses combined are 3.2% for clients in all households, 0.0% for clients in households with seniors, 1.1% for clients in households with children and no seniors, 1.9% for clients in one-person households with neither children nor seniors, and 0.2% for clients in households with two or more people but with neither children nor seniors.
For kitchen clients, missing, don’t know, and refusal responses combined are 0.0% for clients in all households, 0.0% for clients in households with seniors, 0.0% for clients in households with children and no seniors, 0.0% for clients in one-person households with neither children nor seniors, and 0.0% for clients in households with two or more people but with neither children nor seniors.
For shelter clients, missing, don’t know, and refusal responses combined are 11.8% for clients in all households, 0.0% for clients in households with seniors, 0.0% for clients in households with children and no seniors, 11.8% for clients in one-person households with neither children nor seniors, and 0.0% for clients in households with two or more people but with neither children nor seniors.
Key findings include:
• For the overall sample, 48.9% of households with children and no seniors are food insecure with low food security compared to 35.2% of households with

Hunger in America 2010 The Capital Area Food Bank of Texas, Inc (4408)
99 CH 6. CLIENTS: FOOD INSECURITY
seniors. In addition, 28.5% of households with children and no seniors are food insecure with very low food security compared to 35.2% of households with seniors.
• For pantry and kitchen programs, rates of very low food security for one-person households with neither children nor elderly members are 55.4% and 48.4%, respectively.
• For shelters, the percentage of two-person households with neither seniors nor children that have very low food security is n.p..

Hunger in America 2010 The Capital Area Food Bank of Texas, Inc (4408)
100 CH 6. CLIENTS: FOOD INSECURITY
6.1.2 Household Food Insecurity and Supplemental Nutrition Assistance Program Participation
As will be discussed in detail in Chapter 7, about 25.9% of client households also receive
benefits from the Supplemental Nutrition Assistance Program (SNAP). Associations between
food security and SNAP benefit receipt are of interest for at least two reasons. On the one hand,
it is important that the households who are least food secure have effective access to the major
government nutrition assistance programs, such as SNAP. On the other hand, it is of interest to
examine whether SNAP benefit receipt appears to increase food security, recognizing, however,
that causality may be difficult to establish in a cross-sectional study such as this one.
Table 6.1.2.1 compares food security status among SNAP participants to that of eligible
and ineligible nonparticipants.
TABLE 6.1.2.1
FOOD INSECURITY, BY SUPPLEMENTAL NUTRITION ASSISTANCE PROGRAM PARTICIPATION
Food Security Among Clients’ Households
Pantry Client Households
Kitchen Client Households
Shelter Client Households
All Client Households
Among SNAP participants
Food secure 24.8% n.p. n.p. 23.3% Food insecure
With low food security 41.5% n.p. n.p. 42.3% With very low food security 33.7% n.p. n.p. 34.3% SUBTOTAL 75.2% n.p. n.p. 76.7%
TOTAL 100.0% n.p. n.p. 100.0%
SAMPLE SIZE (N) 95 8 5 108
Among SNAP eligible nonparticipantsa
Food secure 16.3% 10.2% n.p. 12.8% Food insecure
With low food security 44.9% 16.2% n.p. 44.0% With very low food security 38.9% 73.7% n.p. 43.2% SUBTOTAL 83.7% 89.8% n.p. 87.2%
TOTAL 100.0% 100.0% n.p. 100.0%
SAMPLE SIZE (N) 160 31 5 196

Hunger in America 2010 The Capital Area Food Bank of Texas, Inc (4408)
101 CH 6. CLIENTS: FOOD INSECURITY
Food Security Among Clients’ Households
Pantry Client Households
Kitchen Client Households
Shelter Client Households
All Client Households
Among SNAP ineligible nonparticipantsa
Food secure n.p. n.p. n.p. 54.4% Food insecure
With low food security n.p. n.p. n.p. 19.7% With very low food security n.p. n.p. n.p. 25.9% SUBTOTAL n.p. n.p. N.A. 45.6%
TOTAL n.p. n.p. n.p. 100.0%
SAMPLE SIZE (N) 24 5 1 30
Among SNAP nonparticipantsb
Food secure 16.6% 22.5% n.p. 18.6% Food insecure
With low food security 45.2% 11.2% n.p. 38.9% With very low food security 38.3% 66.3% n.p. 42.5% SUBTOTAL 83.4% 77.5% n.p. 81.4%
TOTAL 100.0% 100.0% n.p. 100.0%
SAMPLE SIZE (N) 201 38 7 246 SOURCE: This table was constructed based on usable responses to questions 42, 43, 44, 44a, 45, and 46 of the client
survey. NOTES: The percentages presented in this table are based only on usable responses, excluding missing, don’t
know, and refusal responses. All usable responses were weighted as described in Chapter 3 and in the Technical Appendix volume to represent all emergency food clients of The Capital Area Food Bank of Texas, Inc. The sample sizes (N) also include missing data.
Constructed according to “Guide to Measuring Household Food Security, Revised 2000.” For participating households, missing, don’t know, and refusal responses combined are 0.9% for pantry clients, 0.0% for kitchen clients, 0.0% for shelter clients, and 0.8% for all clients. For nonparticipating households, missing, don’t know, and refusal responses combined are 4.4% for pantry clients, 0.0% for kitchen clients, 13.0% for shelter clients, and 4.4% for all clients. a Eligibility based on the previous month’s income alone. b The coding of SNAP participants versus nonparticipants depends on the survey question asking whether the client participates in SNAP. Among nonparticipants, however, the coding that divides the group into eligibles and ineligibles depends on income. Because there are clients who respond to the SNAP participation question but do not respond to the income question, the sum of the number of eligible and ineligible nonparticipants may not equal the total number of nonparticipants.
Specific findings in this analysis include:
• 42.3% of the client households receiving SNAP benefits had low food security and another 34.3% had very low food security.

Hunger in America 2010 The Capital Area Food Bank of Texas, Inc (4408)
102 CH 6. CLIENTS: FOOD INSECURITY
• Among the client households that are eligible to participate but are not receiving SNAP benefits, 44.0% and 43.2% had low and very low food security, respectively.
• Among households apparently ineligible for SNAP benefits, 19.7% and 25.9% had low or very low food security, respectively.
Note that the fact that substantial numbers of client households are classified as hungry
despite receiving SNAP benefits does not by itself mean that SNAP is not providing useful
assistance. Indeed, many of these households might be much worse off without SNAP benefits.
However, the data suggest that, for many households in the FA network, SNAP benefits may not
be sufficient to prevent the reductions in food intake or disruptions in eating patterns.

Hunger in America 2010 The Capital Area Food Bank of Texas, Inc (4408)
103 CH 6. CLIENTS: FOOD INSECURITY
6.1.3 Household Food Insecurity and Household Income
Table 6.1.3.1 and Table 6.1.3.2 examine the relationship between income and food
security. Table 6.1.3.1 presents the percentage of client households that are food secure and food
insecure for households grouped by income relative to the federal poverty level. Table 6.1.3.2
describes the distribution of household income for client households grouped by food security
status.
TABLE 6.1.3.1
FOOD INSECURITY, BY INCOME IN 2008
Income in 2008
All Client Households
0% to 130% of Federal Poverty Levela
131% of Federal Poverty Level or Highera
Food secure 20.9% 15.6% 56.1% Food insecure with low
food security 40.9% 43.4% 24.2% Food insecure with very
low food security 38.3% 41.0% 19.7% TOTAL 100.0% 100.0% 100.0%
SAMPLE SIZE (N) 332 295 37 SOURCE: This table was constructed based on usable responses to questions 29, 42, 43, 44, 44a, 45, and 46 of the
client survey.
NOTES: The percentages presented in this table are based only on usable responses, excluding missing, don’t know, and refusal responses. All usable responses were weighted as described in Chapter 3 and in the Technical Appendix volume to represent all emergency food clients of The Capital Area Food Bank of Texas, Inc. The sample sizes (N) also include missing data. Constructed according to Bickel et al. (2000).
Missing, don’t know, and refusal responses combined are 2.2% for all clients, 2.2% for households with income at 0% to 130% of the federal poverty level, and 0.0% for households with income at 131% of the federal poverty level or higher.
aSee Table 5.8.1.1 for the monthly federal poverty levels (and multiply by 12 to obtain annual levels).

Hunger in America 2010 The Capital Area Food Bank of Texas, Inc (4408)
104 CH 6. CLIENTS: FOOD INSECURITY
We find that among the households with incomes less than or equal to 130% of the
federal poverty level in year 2008, 15.6% are food secure, while 56.1% of the households with
incomes higher than 130% of the federal poverty level are food secure. On the other hand, as
many as 41.0% of the client households with income less than or equal to 130% of the federal
poverty level have very low food security. The comparable figure is 19.7% for the households
with income more than 130% of the federal poverty level.
Table 6.1.3.2 presents the distribution of income as a percentage of the Federal Poverty
Level for client households according to the households’ food security status.
TABLE 6.1.3.2
INCOME IN 2008, BY FOOD SECURITY STATUS
Food Security Status at Client Households
Income in 2008 as Percentage of Federal Poverty Levela
All Client Households Food Secure
Food Insecure with Low Food
Security
Food Insecure with Very Low Food Security
0% (no income) 12.5% 3.7% 20.5% 8.9% 1%-50% 30.2% 22.3% 28.4% 36.5% 51%-75% 18.5% 20.9% 21.7% 13.7% 76%-100% 17.9% 6.4% 13.1% 29.3% 101%-130% 7.8% 11.7% 8.5% 4.8% SUBTOTAL 86.9% 64.9% 92.3% 93.3% 131%-150% 2.9% 5.4% 3.3% 1.0% 151%-185% 2.6% 3.5% 1.8% 2.9% 186% or higher 7.6% 26.2% 2.6% 2.7% SUBTOTAL 13.1% 35.1% 7.7% 6.7%
TOTAL 100.0% 100.0% 100.0% 100.0%
SAMPLE SIZE (N) 332 62 143 127 SOURCE: This table was constructed based on all responses to questions 29, 42, 43, 44, 44a, 45, and 46 of the client
survey. NOTES: The percentages presented in this table, unlike those in most other tables, were calculated without leaving
out item nonresponses. To ensure that key percentages, such as that for no income, appear consistent within this table, a constant denominator, which includes item nonresponses, was used. All responses were weighted as described in Chapter 3 and in the Technical Appendix volume to represent all emergency food clients or households of The Capital Area Food Bank of Texas, Inc.

Hunger in America 2010 The Capital Area Food Bank of Texas, Inc (4408)
105 CH 6. CLIENTS: FOOD INSECURITY
For income as percentage of the federal poverty level, missing, don’t know, and refusal responses combined are 7.3% for all clients, 0.5% for households that are food secure, 1.9% for households that are food insecure with low security, and 4.9% for households that are food insecure with very low security.
Other findings include:
• In 2008, 93.3% of the client households characterized as having very low food security, 92.3% of those characterized as having low food security, and 64.9% of those characterized as food secure had income less than or equal to 130% of the federal poverty level.
• In 2008, 6.7% of the client households characterized as having very low food security, 7.7% of those characterized as having low food security, and 35.1% of those characterized as food secure had income more than 130% of the federal poverty level.

Hunger in America 2010 The Capital Area Food Bank of Texas, Inc (4408)
106 CH 6. CLIENTS: FOOD INSECURITY
6.1.4 Household Food Insecurity and Health
Table 6.1.4.1 presents food security rates for client households grouped by whether a
member of the household is in poor health.
TABLE 6.1.4.1
FOOD INSECURITY, BY HEALTH STATUS
Households with or Without Members in Poor Health
All Households
With Members in Poor Health
Without Members in Poor Health
Food secure 19.9% 13.6% 21.9% Food insecure with low
food security 39.8% 35.9% 41.0% Food insecure with very
low food security 40.3% 50.5% 37.1%
TOTAL 100.0% 100.0% 100.0%
SAMPLE SIZE (N) 346 112 234 SOURCE: This table was constructed based on usable responses to questions 20, 21, 42, 43, 44, 44a, 45, and 46 of
the client survey.
NOTES: The percentages presented in this table are based only on usable responses, excluding missing, don’t know, and refusal responses. All usable responses were weighted as described in Chapter 3 and in the Technical Appendix volume to represent all emergency food clients of The Capital Area Food Bank of Texas, Inc. The sample sizes (N) also include missing data. Constructed according to Bickel et al. (2000).
Missing, don’t know, and refusal responses combined are 3.4% for all clients, 0.0% for households with members in poor health, and 3.4% for households without members in poor health.
We find that among the client households with at least one member in poor health, 13.6%
are food secure; 35.9% have low food security; and 50.5% have very low food security. In
addition, among the client households with no one in poor health, 21.9% are food secure; 41.0%
have low food security; and 37.1% have very low food security.

Hunger in America 2010 The Capital Area Food Bank of Texas, Inc (4408)
107 CH 6. CLIENTS: FOOD INSECURITY
6.1.5 Household Food Insecurity and Citizenship Status
Table 6.1.5.1 examines associations between citizenship status and food security among
client households.
TABLE 6.1.5.1
FOOD INSECURITY, BY CITIZENSHIP STATUS
Citizenship Status of Clients at
Program Sites
All Client Households
Households Represented by Citizen
Clientsa
Households Represented by
Noncitizen Clients
Food secure 20.0% 22.4% 5.2% Food insecure with low food
security 39.8% 38.1% 51.1%
Food insecure with very low food security
40.1% 39.6% 43.7%
TOTAL 100.0% 100.0% 100.0%
SAMPLE SIZE (N) 338 279 59
SOURCE: This table was constructed based on usable responses to questions 5, 42, 43, 44, 44a, 45, and 46 of the client survey.
NOTES: The percentages presented in this table are based only on usable responses, excluding missing, don’t know, and refusal responses. All usable responses were weighted as described in Chapter 3 and in the Technical Appendix volume to represent all emergency food clients of The Capital Area Food Bank of Texas, Inc. The sample sizes (N) also include missing data. Constructed according to Bickel et al. (2000).
Missing, don’t know, and refusal responses combined are 2.5% for all clients, 1.0% for households represented by citizen clients, and 1.4% for households represented by noncitizen clients.
aHouseholds represented by respondents who are U.S. citizens.
The table shows that 51.1% of the noncitizen households have low food security,
compared with 38.1% of the citizen households. In addition, 43.7% of the noncitizen households
have very low food security, compared with 39.6% of the citizen households.
Table 6.1.5.2 contrasts, within noncitizen households, food security rates for households
that have and do not have young children.

Hunger in America 2010 The Capital Area Food Bank of Texas, Inc (4408)
108 CH 6. CLIENTS: FOOD INSECURITY
TABLE 6.1.5.2
FOOD INSECURITY AMONG HOUSEHOLDS CONTAINING AT LEAST ONE NONCITIZEN, BY PRESENCE OF YOUNG CHILDREN
Noncitizen Households With or
Without Children Ages 0-5
All Client Households Having at Least
One Noncitizen Member With Children
Ages 0-5 Without Children
Ages 0-5
Food secure 5.8% 0.3% 11.0% Food insecure with
low food security 49.6% 64.4% 35.4% Food insecure with
very low food security 44.6% 35.3% 53.6%
TOTAL 100.0% 100.0% 100.0%
SAMPLE SIZE (N) 66 33 33 SOURCE: This table was constructed based on usable responses to questions 5, 42, 43, 44, 44a, 45, and 46 of the
client survey.
NOTES: The percentages presented in this table are based only on usable responses, excluding missing, don’t know, and refusal responses. All usable responses were weighted as described in Chapter 3 and in the Technical Appendix volume to represent all emergency food clients of The Capital Area Food Bank of Texas, Inc. The sample sizes (N) also include missing data. Constructed according to Bickel et al. (2000).
Missing, don’t know, and refusal responses combined are 9.4% for all client households with at least one noncitizen member, 0.0% for noncitizen households with children ages 0-5, and 9.4% for noncitizen households without children ages 0-5.
We find that 0.3% of noncitizen households with young children are classified as food
secure, compared with 11.0% of those households without them.

Hunger in America 2010 The Capital Area Food Bank of Texas, Inc (4408)
109 CH 6. CLIENTS: FOOD INSECURITY
6.2 INDICATORS OF FOOD INSECURITY IN HOUSEHOLDS
Table 6.2.1 presents responses to two of the questions involved in the six-item
short module.
TABLE 6.2.1
INDICATORS OF FOOD INSECURITY IN HOUSEHOLDS
Pantry Client Households
Kitchen Client Households
Shelter Client Households
All Client Households
“The food we bought just didn’t last, and we didn’t have money to get more.” In the last 12 months, was that…?
Often true 34.1% 39.9% n.p. 33.1% Sometimes true 53.8% 42.5% n.p. 52.3% Never true 12.1% 17.7% n.p. 14.6% TOTAL 100.0% 100.0% n.p. 100.0%
“We couldn’t afford to eat balanced meals.” In the last 12 months, was that…?
Often true 24.9% 37.3% n.p. 27.3% Sometimes true 50.1% 43.7% n.p. 44.1% Never true 25.0% 18.9% n.p. 28.6% TOTAL 100.0% 100.0% n.p. 100.0%
SAMPLE SIZE (N) 296 46 12 354 SOURCE: This table was constructed based on usable responses to questions 42 and 43 of the client survey. NOTES: The percentages presented in this table are based only on usable responses, excluding missing, don’t
know, and refusal responses. All usable responses were weighted as described in Chapter 3 and in the Technical Appendix volume to represent all emergency food clients of The Capital Area Food Bank of Texas, Inc. The sample sizes (N) also include missing data.
For the first food security indicator in the table, missing, don’t know, and refusal responses combined are 5.0% for pantry clients, 0.8% for kitchen clients, 11.8% for shelter clients, and 4.9% for all clients. For the second food security indicator in the table, missing, don’t know, and refusal responses combined are 4.6% for pantry clients, 0.8% for kitchen clients, 11.8% for shelter clients, and 4.6% for all clients.

Hunger in America 2010 The Capital Area Food Bank of Texas, Inc (4408)
110 CH 6. CLIENTS: FOOD INSECURITY
Overall, 85.4% of the client households reported that, during the previous 12 months,
they had been in a situation where the food they bought “just didn’t last” and [they] did not have
money to get more. In addition, 71.4% of the client households were, often or sometimes during
the previous 12 months, in a situation where they “couldn’t afford to eat balanced meals.”

Hunger in America 2010 The Capital Area Food Bank of Texas, Inc (4408)
111 CH 6. CLIENTS: FOOD INSECURITY
Table 6.2.2 examines the associations between the responses presented in Table 6.2.1 and
participation and eligibility in SNAP. There are a number of reasons why SNAP benefit receipt
and food security might be associated. On the one hand, SNAP benefit receipt may increase
food security, other things being equal. On the other hand, food insecurity may influence
households to apply for SNAP benefits. Other types of associations caused by both SNAP
participation and food security being determined by other factors are also possible.
TABLE 6.2.2
INDICATORS OF FOOD INSECURITY IN HOUSEHOLDS, BY SUPPLEMENTAL NUTRITION ASSISTANCE PROGRAM BENEFIT RECEIPT
SNAP Benefit Receipt Status of Households
All Client Households with
Valid SNAP Benefit Receipt
Status Receiving SNAP
Benefits
Apparently Eligible, not Receiving
Apparently Ineligible
Because of Income, not Receivinga
“The food we bought just didn’t last, and we didn’t have money to get more.” In the last 12 months, was that …?b
Often true 30.6% 31.4% 31.6% 24.1% Sometimes true 54.2% 54.1% 58.4% 34.6% Never true 15.2% 14.6% 10.0% 41.4% TOTAL 100.0% 100.0% 100.0% 100.0%
SAMPLE SIZE (N) 326 107 189 30
“We couldn’t afford to eat balanced meals.” In the last 12 months, was that …?b
Often true 24.2% 22.7% 27.2% 13.4% Sometimes true 46.4% 44.5% 51.2% 28.2% Never true 29.5% 32.8% 21.7% 58.4% TOTAL 100.0% 100.0% 100.0% 100.0%
SAMPLE SIZE (N) 329 107 192 30 SOURCE: This table was constructed based on usable responses to questions 29, 31, 42, and 43 of the client survey. NOTES: The percentages presented in this table are based only on usable responses, excluding missing, don’t
know, and refusal responses. All usable responses were weighted as described in Chapter 3 and in the Technical Appendix volume to represent all emergency food clients of The Capital Area Food Bank of Texas, Inc. The sample sizes (N) also include missing data.

Hunger in America 2010 The Capital Area Food Bank of Texas, Inc (4408)
112 CH 6. CLIENTS: FOOD INSECURITY
For the first survey indicator of food security in the table, missing, don’t know, and refusal responses combined are 3.7% for all clients with valid SNAP benefit receipt status, 0.2% for clients receiving SNAP benefits, 3.5% for eligible, not receiving clients, and 0.0% for ineligible clients. For the second survey indicator of food security in the table, missing, don’t know, and refusal responses combined are 3.4% for all clients with valid SNAP benefit receipt status, 0.2% for clients receiving SNAP benefits, 3.2% for eligible, not receiving clients, and 0.0% for ineligible clients.
aEligibility was determined based on the previous month’s income alone. bA “valid” SNAP benefit receipt status is one in which all participation and eligibility (i.e. income) questions have valid responses.
Key findings include:
• 31.4% of SNAP benefit recipients and 31.6% of apparently eligible nonparticipants said that it was “often true” that food did not last and there was no money to buy more; the comparable percentage for apparently ineligible clients was 24.1%.
• 22.7% of SNAP benefit recipients and 27.2% of apparently eligible nonparticipants said that it was “often true” that they could not afford to eat balanced meals; the comparable percentage for apparently ineligible clients was 13.4%.

Hunger in America 2010 The Capital Area Food Bank of Texas, Inc (4408)
113 CH 6. CLIENTS: FOOD INSECURITY
6.3 INDICATORS OF FOOD INSECURITY AMONG ADULTS
Table 6.3.1 presents responses to the four questions about adults in the six-item
short module.
TABLE 6.3.1
INDICATORS OF FOOD INSECURITY AMONG ADULTS
Pantry Client Households
Kitchen Client Households
Shelter Client Households
All Client Households
How often adult clients or other adults in the household cut the size of meals or skipped meals because there wasn’t enough money for food in the previous 12 monthsa
Almost every month 26.3% 31.7% n.p. 25.9% Some months but not every month 19.8% 32.7% n.p. 21.2% Only one or two months 14.0% 4.3% n.p. 10.6% Never 39.9% 31.3% n.p. 42.3%
Clients who ate less than they felt they should because there wasn’t enough money to buy food in the previous 12 months
Yes 61.5% 68.9% n.p. 59.3% No 38.5% 31.1% n.p. 40.7% TOTAL 100.0% 100.0% n.p. 100.0%
Clients who were hungry but didn’t eat because they couldn’t afford enough food in the previous 12 months
Yes 39.7% 71.9% n.p. 44.2% No 60.3% 28.1% n.p. 55.8% TOTAL 100.0% 100.0% n.p. 100.0%
Clients or other adults in the household ever did not eat for a whole day because there wasn’t enough money for food in the previous 12 months
Yes 22.5% 70.6% n.p. 36.6% No 77.5% 29.4% n.p. 63.4% TOTAL 100.0% 100.0% n.p. 100.0%
SAMPLE SIZE (N) 296 46 12 354 SOURCE: This table was constructed based on usable responses to questions 44, 44a, 45, 46, and 47 of the client
survey.

Hunger in America 2010 The Capital Area Food Bank of Texas, Inc (4408)
114 CH 6. CLIENTS: FOOD INSECURITY
NOTES: The percentages presented in this table are based only on usable responses, excluding missing, don’t know, and refusal responses. All usable responses were weighted as described in Chapter 3 and in the Technical Appendix volume to represent all emergency food clients of The Capital Area Food Bank of Texas, Inc. The sample sizes (N) also include missing data.
For the first food security indicator in the table, missing, don’t know, and refusal responses combined are 3.3% for pantry clients, 0.0% for kitchen clients, 0.0% for shelter clients, and 2.2% for all clients. For the second food security indicator in the table, missing, don’t know, and refusal responses combined are 3.6% for pantry clients, 0.0% for kitchen clients, 11.8% for shelter clients, and 3.8% for all clients. For the third food security indicator in the table, missing, don’t know, and refusal responses combined are 4.3% for pantry clients, 0.0% for kitchen clients, 11.8% for shelter clients, and 4.2% for all clients. For the fourth food security indicator in the table, missing, don’t know, and refusal responses combined are 3.9% for pantry clients, 0.0% for kitchen clients, 11.8% for shelter clients, and 4.0% for all clients.
aResponses may not add up to 100% because this panel was constructed from two questions: “Never” came from Question 44, and the other responses from Question 44a.
Adults in 25.9% of the client households had to cut the size of meals or skip meals
because there was not enough money for food almost every month of the previous 12 months.
Responses to the remaining three questions are:
• 59.3% of the clients ate less than they felt they should because there was not enough money to buy food at least once during the previous 12 months.
• Adults in 44.2% of the client households were hungry but did not eat because they could not afford enough food at least once during the previous 12 months.
• Adults in 36.6% of the client households did not eat for a whole day at least once during the previous 12 months because there was not enough money for food.

Hunger in America 2010 The Capital Area Food Bank of Texas, Inc (4408)
115 CH 6. CLIENTS: FOOD INSECURITY
Table 6.3.2 examines the associations between the responses presented in Table 6.3.1 and
participation and eligibility in SNAP.
TABLE 6.3.2
INDICATORS OF FOOD INSECURITY AMONG ADULTS, BY SUPPLEMENTAL NUTRITION ASSISTANCE PROGRAM BENEFIT RECEIPT
SNAP Benefit Receipt Status of Households
All Client Households with
Valid SNAP Benefit Receipt
Statusa Receiving SNAP
Benefits
Apparently Eligible, Not
Receiving
Apparently Ineligible
Because of Income, Not Receivingb
How often adult clients or other adults in the household cut the size of meals or skipped meals because there wasn’t enough money for food in the previous 12 months
Almost every month 22.8% 20.2% 25.0% 17.6% Some months but not every
month 22.3% 25.3% 22.3% 15.9% Only one or two months 10.7% 8.6% 12.9% 5.0% Never 44.1% 45.9% 39.8% 61.5% TOTAL 100.0% 100.0% 100.0% 100.0%
SAMPLE SIZE (N) 327 106 191 30
Clients who ate less than they felt they should because there wasn’t enough money to buy food in the previous 12 months
Yes 58.4% 60.5% 61.8% n.p. No 41.6% 39.5% 38.2% n.p. TOTAL 100.0% 100.0% 100.0% n.p.
SAMPLE SIZE (N) 330 107 194 29
Clients who were hungry but didn’t eat because they couldn’t afford enough food in the previous 12 months
Yes 42.6% 41.6% 46.6% 25.9% No 57.4% 58.4% 53.4% 74.1% TOTAL 100.0% 100.0% 100.0% 100.0%
SAMPLE SIZE (N) 329 107 192 30

Hunger in America 2010 The Capital Area Food Bank of Texas, Inc (4408)
116 CH 6. CLIENTS: FOOD INSECURITY
SNAP Benefit Receipt Status of Households
All Client Households with
Valid SNAP Benefit Receipt
Statusa Receiving SNAP
Benefits
Apparently Eligible, Not
Receiving
Apparently Ineligible
Because of Income, Not Receivingb
Clients or other adults in the household ever did not eat for a whole day because there wasn’t enough money for food in the previous 12 months
Yes 34.5% 22.0% 44.2% 17.4% No 65.5% 78.0% 55.8% 82.6% TOTAL 100.0% 100.0% 100.0% 100.0%
SAMPLE SIZE (N) 331 107 194 30 SOURCE: This table was constructed based on usable responses to questions 29, 31, 44a, 45, 46, and 47 of the client
survey. NOTES: The percentages presented in this table are based only on usable responses, excluding missing, don’t
know, and refusal responses. All usable responses were weighted as described in Chapter 3 and in the Technical Appendix volume to represent all emergency food clients of The Capital Area Food Bank of Texas, Inc. The sample sizes (N) also include missing data.
For the first survey indicator of food security in the table, missing, don’t know, and refusal responses combined are 2.2% for all clients with valid SNAP benefit receipt status, 0.7% for clients receiving SNAP benefits, 1.6% for eligible, not receiving clients, and 0.0% for ineligible clients. For the second survey indicator of food security in the table, missing, don’t know, and refusal responses combined are 2.6% for all clients with valid SNAP benefit receipt status, 0.2% for clients receiving SNAP benefits, 2.3% for eligible, not receiving clients, and 0.1% for ineligible clients. For the third survey indicator of food security in the table, missing, don’t know, and refusal responses combined are 3.0% for all clients with valid SNAP benefit receipt status, 0.2% for clients receiving SNAP benefits, 2.8% for eligible, not receiving clients, and 0.0% for ineligible clients. For the fourth survey indicator of food security in the table, missing, don’t know, and refusal responses combined are 2.7% for all clients with valid SNAP benefit receipt status, 0.2% for clients receiving SNAP benefits, 2.5% for eligible, not receiving clients, and 0.0% for ineligible clients.
aA “valid” SNAP benefit receipt status is one in which all participation and eligibility (i.e. income) questions have valid responses.
bEligibility was determined based on the previous month’s income alone.
Key findings include:
• 45.5% of SNAP benefit recipients and 47.3% of apparently eligible nonparticipants said that they or adults in the household reduced meal sizes or skipped meals entirely some months or every month in the past year because there

Hunger in America 2010 The Capital Area Food Bank of Texas, Inc (4408)
117 CH 6. CLIENTS: FOOD INSECURITY
was not enough money for food; the comparable percentage for apparently ineligible clients was 33.5%.
• 60.5% of SNAP benefit recipients and 61.8% of apparently eligible nonparticipants said they ate less than they should because they lacked money to buy food; the comparable figure for the apparently ineligible respondents was n.p..
• 22.0% of SNAP benefit recipients and 44.2% of apparently eligible nonparticipants said that they or adults in the household did not eat for a whole day because there was not enough money for food; the comparable percentage for apparently ineligible clients was 17.4%.

Hunger in America 2010 The Capital Area Food Bank of Texas, Inc (4408)
118 CH 6. CLIENTS: FOOD INSECURITY
6.4 INDICATORS OF FOOD INSECURITY AMONG HOUSEHOLDS WITH CHILDREN
In addition to the six questions shown in Tables 6.2.1 and 6.3.1, clients were asked three
additional questions about their children’s skipping of meals, being hungry, and not eating
enough.
TABLE 6.4.1
INDICATORS OF FOOD INSECURITY AMONG HOUSEHOLDS WITH CHILDREN
Pantry Client Households
Kitchen Client Households
Shelter Client Households
All Client Households
How often during the previous 12 months clients’ child/children was/were not eating enough because they just couldn’t afford enough food
Often 11.5% n.p. N.A. 10.5% Sometimes 21.2% n.p. N.A. 19.3% Never 67.3% n.p. N.A. 70.2% TOTAL 100.0% n.p. n.p. 100.0%
Clients whose child/children ever skipped meals because there wasn’t enough money for food during the previous 12 months
Yes 8.5% n.p. N.A. 7.8% No 91.5% n.p. N.A. 92.2% TOTAL 100.0% n.p. n.p. 100.0%
Clients whose child/children was/were hungry at least once during the previous 12 months, but couldn’t afford more food
Yes 14.7% n.p. N.A. 13.5% No 85.3% n.p. N.A. 86.5% TOTAL 100.0% n.p. n.p. 100.0%
SAMPLE SIZE (N) 168 6 0 174
SOURCE: This table was constructed based on usable responses to questions 3, 6b, 49, 50, and 51 of the client
survey. NOTES: The percentages presented in this table are based only on usable responses, excluding missing, don’t
know, and refusal responses. All usable responses were weighted as described in Chapter 3 and in the Technical Appendix volume to represent all emergency food clients of The Capital Area Food Bank of Texas, Inc. The sample sizes (N) also include missing data.

Hunger in America 2010 The Capital Area Food Bank of Texas, Inc (4408)
119 CH 6. CLIENTS: FOOD INSECURITY
For the first survey indicator of food security in the table, missing, don’t know, and refusal responses combined are 4.5% for pantry clients, 0.0% for kitchen clients, N.A. for shelter clients, and 4.1% for all clients. For the second survey indicator of food security in the table, missing, don’t know, and refusal responses combined are 5.2% for pantry clients, 0.0% for kitchen clients, N.A. for shelter clients, and 4.8% for all clients. For the third survey indicator of food security in the table, missing, don’t know, and refusal responses combined are 3.8% for pantry clients, 0.0% for kitchen clients, N.A. for shelter clients, and 3.4% for all clients.
Among all clients with children, 10.5% stated that, during the previous 12 months, their
children were often not eating enough because they just could not afford enough food. Another
19.3% of the clients experienced such a situation sometimes during the previous 12 months.
• 7.8% of the clients with children said that their children skipped meals because there was not enough money for food during the previous 12 months.
• 13.5% of the clients with children said that their children were hungry at least once during the previous 12 months, but they could not afford more food.
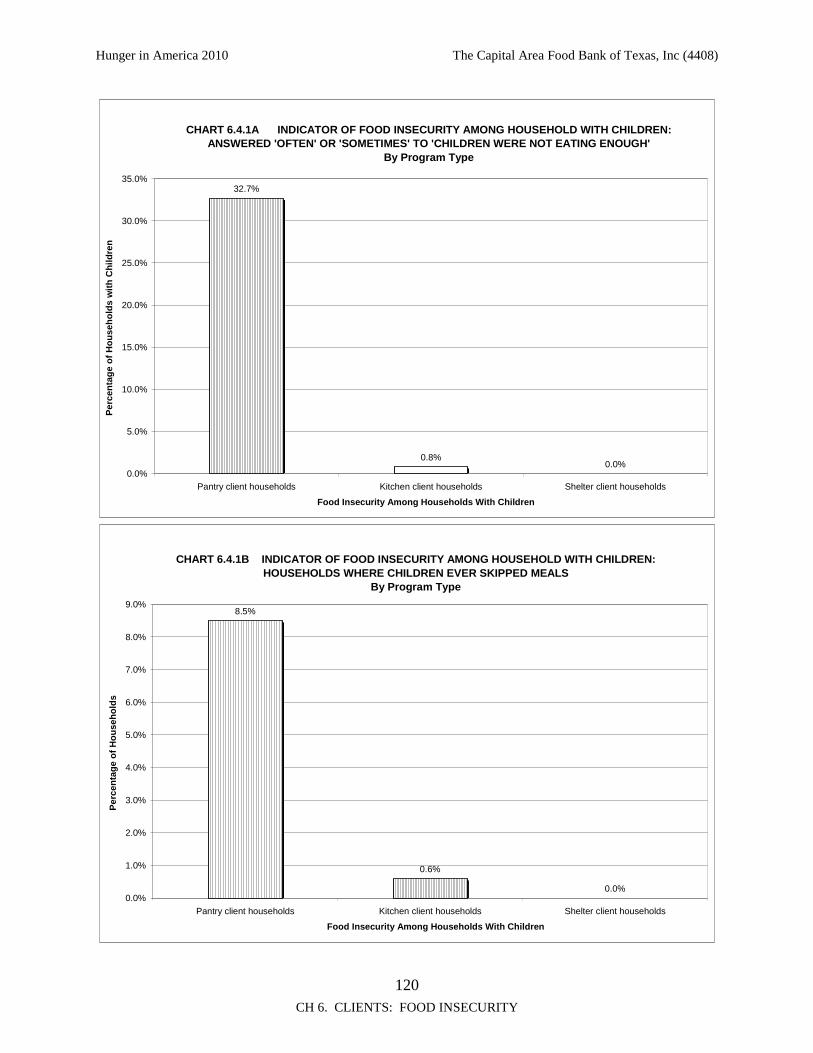
Hunger in America 2010 The Capital Area Food Bank of Texas, Inc (4408)
120 CH 6. CLIENTS: FOOD INSECURITY
CHART 6.4.1A INDICATOR OF FOOD INSECURITY AMONG HOUSEHOLD WITH CHILDREN: ANSWERED 'OFTEN' OR 'SOMETIMES' TO 'CHILDREN WERE NOT EATING ENOUGH'
By Program Type
32.7%
0.8%0.0%
0.0%
5.0%
10.0%
15.0%
20.0%
25.0%
30.0%
35.0%
Pantry client households Kitchen client households Shelter client households
Food Insecurity Among Households With Children
Per
cen
tag
e o
f H
ou
seh
old
s w
ith
Ch
ildre
n
CHART 6.4.1B INDICATOR OF FOOD INSECURITY AMONG HOUSEHOLD WITH CHILDREN: HOUSEHOLDS WHERE CHILDREN EVER SKIPPED MEALS
By Program Type
8.5%
0.6%
0.0%0.0%
1.0%
2.0%
3.0%
4.0%
5.0%
6.0%
7.0%
8.0%
9.0%
Pantry client households Kitchen client households Shelter client households
Food Insecurity Among Households With Children
Per
cen
tag
e o
f H
ou
seh
old
s

Hunger in America 2010 The Capital Area Food Bank of Texas, Inc (4408)
121 CH 6. CLIENTS: FOOD INSECURITY
CHART 6.4.1C INDICATOR OF HUNGER AMONG HOUSEHOLD WITH CHILDREN: HOUSEHOLDS WITH CHILDREN WHO WERE EVER HUNGRY
By Program Type
14.7%
0.8%
0.0%0.0%
2.0%
4.0%
6.0%
8.0%
10.0%
12.0%
14.0%
16.0%
Pantry client households Kitchen client households Shelter client households
Hunger Among Households With Children
Per
cen
tag
e o
f H
ou
seh
old
s
Note: Charts corresponding to tables that contain values of "n.p." or "N.A." (see section 3.7) may display the
suppressed numbers in place of "n.p" or "N.A". This is due to the limitation of the computer system used to generate the member-level reports. The parts of the chart for which this is true should be ignored.

Hunger in America 2010 The Capital Area Food Bank of Texas, Inc (4408)
122 CH 6. CLIENTS: FOOD INSECURITY
Table 6.4.2 examines the associations between the responses presented in Table 6.4.1 and
participation and eligibility in SNAP.
TABLE 6.4.2
INDICATORS OF FOOD INSECURITY AMONG HOUSEHOLDS WITH CHILDREN, BY SUPPLEMENTAL NUTRITION ASSISTANCE PROGRAM BENEFIT RECEIPT
SNAP Benefit Receipt Status of Households
All Client Households with Valid
SNAP Benefit Receipt Statusb
Receiving SNAP Benefits
Apparently Eligible, Not
Receiving
Apparently Ineligible
Because of Income, Not Receivinga
How often during the previous 12 months clients’ child/children was/were not eating enough because they just couldn’t afford enough food
Often 10.8% 7.8% 14.3% n.p. Sometimes 19.8% 23.6% 21.2% n.p. Never 69.4% 68.6% 64.5% n.p. TOTAL 100.0% 100.0% 100.0% n.p.
SAMPLE SIZE (N) 158 60 87 11 Clients whose child/children ever skipped meals because there wasn’t enough money for food during the previous 12 months
Yes 7.9% 11.1% 5.6% n.p. No 92.1% 88.9% 94.4% n.p. TOTAL 100.0% 100.0% 100.0% n.p.
SAMPLE SIZE (N) 157 59 87 11 Clients whose child/children was/were hungry at least once during the previous 12 months, but couldn’t afford more food
Yes 13.8% 15.6% 14.7% n.p. No 86.2% 84.4% 85.3% n.p. TOTAL 100.0% 100.0% 100.0% n.p.
SAMPLE SIZE (N) 159 61 87 11
SOURCE: This table was constructed based on usable responses to questions 29, 31, 49, 50, and 51 of the client
survey. NOTES: The percentages presented in this table are based only on usable responses, excluding missing, don’t
know, and refusal responses. All usable responses were weighted as described in Chapter 3 and in the
Hunger in America 2010 The Capital Area Food Bank of Texas, Inc (4408)
123 CH 6. CLIENTS: FOOD INSECURITY
Technical Appendix volume to represent all emergency food clients of The Capital Area Food Bank of Texas, Inc. The sample sizes (N) also include missing data.
For the first survey indicator of food security in the table, missing, don’t know, and refusal responses combined are 56.7% for all clients with valid SNAP benefit receipt status, 12.1% for clients receiving SNAP benefits, 37.8% for eligible, not receiving clients, and 6.8% for ineligible clients. For the second survey indicator of food security in the table, missing, don’t know, and refusal responses combined are 57.0% for all clients with valid SNAP benefit receipt status, 12.4% for clients receiving SNAP benefits, 37.8% for eligible, not receiving clients, and 6.8% for ineligible clients. For the third survey indicator of food security in the table, missing, don’t know, and refusal responses combined are 56.4% for all clients with valid SNAP benefit receipt status, 11.8% for clients receiving SNAP benefits, 37.8% for eligible, not receiving clients, and 6.8% for ineligible clients.
aEligibility was determined based on the previous month’s income alone. bA “valid” SNAP benefit receipt status is one in which all participation and eligibility (i.e. income) questions have valid responses.
Several findings include:
• Among all clients with children that participated in SNAP, 7.8% stated that, during the previous 12 months, their children were often not eating enough because they just could not afford enough food. This compares to 14.3% of eligible nonparticipants and n.p. of ineligible nonparticipants.
• Among all clients with children that participated in SNAP with children, 11.1% said that their children skipped meals because there was not enough money for food during the previous 12 months. This compares to 5.6% of eligible nonparticipants and n.p. of ineligible nonparticipants.
• Among all clients with children that participated in SNAP with children, 15.6% said that their children were hungry at least once during the previous 12 months, but they could not afford more food. This compares to 14.7% of eligible nonparticipants and n.p. of ineligible nonparticipants.

Hunger in America 2010 The Capital Area Food Bank of Texas, Inc (4408)
124 CH 6. CLIENTS: FOOD INSECURITY
6.5 CHOICE BETWEEN FOOD AND NECESSITIES
Clients were asked whether their families had to choose between food and necessities
during the 12-month period prior to the interview. Table 6.5.1 summarizes the results.
TABLE 6.5.1
CHOICE BETWEEN FOOD AND NECESSITIES
Pantry Client Households
Kitchen Client Households
Shelter Client Households
All Client Households
In the previous 12 months, clients or their family who ever had to choose at least once between
Paying for food and paying for utilities or heating fuel
59.4% 66.2% n.p. 54.8%
Paying for food and paying for rent or mortgage
41.5% 70.8% n.p. 43.6%
Paying for food and paying for medicine or medical care
32.9% 14.7% n.p. 26.7%
Paying for food and paying for transportation
38.4% 41.6% n.p. 35.4%
Paying for food and paying for gas for a car
41.9% 41.4% n.p. 37.1%
Households with all five of the situations
9.9% 12.0% n.p. 9.2%
Households with four of the five situations
21.4% 0.4% n.p. 15.2%
Households with three of the five situations
13.5% 51.1% n.p. 19.6%
Households with two of the five situations
11.8% 6.1% n.p. 9.6%
Households with just one of the situations
14.4% 7.4% n.p. 12.3%
SAMPLE SIZE (N) 296 46 12 354
SOURCE: This table was constructed based on usable responses to Question 52 of the client survey. NOTES: All usable responses were weighted as described in Chapter 3 and in the Technical Appendix volume to
represent all emergency food clients of The Capital Area Food Bank of Texas, Inc. The sample sizes (N) also include missing data.
For choosing between food and utilities, missing, don’t know, and refusal responses combined are 3.7% for pantry clients, 2.6% for kitchen clients, 0.0% for shelter clients, and 3.1% for all clients.

Hunger in America 2010 The Capital Area Food Bank of Texas, Inc (4408)
125 CH 6. CLIENTS: FOOD INSECURITY
For choosing between food and rent (mortgage), missing, don’t know, and refusal responses combined are 3.4% for pantry clients, 2.6% for kitchen clients, 0.0% for shelter clients, and 2.9% for all clients. For choosing between food and medical care, missing, don’t know, and refusal responses combined are 3.5% for pantry clients, 3.9% for kitchen clients, 0.0% for shelter clients, and 3.2% for all clients. For choosing between food and transportation, missing, don’t know, and refusal responses combined are 3.6% for pantry clients, 2.6% for kitchen clients, 0.0% for shelter clients, and 3.0% for all clients. For choosing between food and gas for a car, missing, don’t know, and refusal responses combined are 3.8% for pantry clients, 2.6% for kitchen clients, 0.0% for shelter clients, and 3.1% for all clients. For number of situations, missing, don’t know, and refusal responses combined are 3.3% for pantry clients, 2.6% for kitchen clients, 0.0% for shelter clients, and 2.8% for all clients.
As shown in Table 6.5.1, among pantry client households, 59.4% had to choose between
paying for food and paying for utilities or heating fuel; 41.5% had to choose between food and
rent or mortgage; 32.9% had to choose between food and medicine or medical care; 38.4% had
to choose between food and paying for transportation; and 41.9% had to choose between food
and paying for gas for a car. Results for kitchen and shelter client households are:
• Among kitchen client households, 66.2% had to choose between paying for food and paying for utilities or heating fuel; 70.8% between food and rent or mortgage; 14.7% between food and medicine or medical care; 41.6% between food and paying for transportation; and 41.4% between food and gas for a car.
• Among shelter client households, n.p. had to choose between paying for food and paying for utilities or heating; n.p. between food and rent or mortgage; n.p. between food and medicine or medical care; n.p. between food and paying for transportation; and n.p. between food and gas for a car.

Hunger in America 2010 The Capital Area Food Bank of Texas, Inc (4408)
126 CH 6. CLIENTS: FOOD INSECURITY
The responses to the question of whether the household had to make choices between
buying food and spending money on other necessities provides another indicator of the
constraints that households face. It is therefore of interest to examine how these responses are
correlated with selected measures of household well-being such as food security. Table 6.5.2
presents the results.
TABLE 6.5.2
HOUSEHOLD TRADE-OFFS, BY FOOD SECURITY STATUS
Food Security Status of Client Households
All Client
Households Food Secure
Food Insecure with Low Food
Security
Food Insecure with Very Low Food Security
Choose between food and utilities or heating fuel
Yes 55.6% 13.3% 50.7% 81.6% No 44.4% 86.7% 49.3% 18.4% TOTAL 100.0% 100.0% 100.0% 100.0%
SAMPLE SIZE (N) 341 65 147 129
Choose between food and rent or mortgage
Yes 44.1% 15.1% 37.3% 65.5% No 55.9% 84.9% 62.7% 34.5% TOTAL 100.0% 100.0% 100.0% 100.0%
SAMPLE SIZE (N) 342 65 148 129
Choose between food and medical care
Yes 27.1% 7.0% 24.7% 39.5% No 72.9% 93.0% 75.3% 60.5% TOTAL 100.0% 100.0% 100.0% 100.0%
SAMPLE SIZE (N) 341 65 148 128
Choose between food and paying for transportation
Yes 35.9% 10.8% 29.9% 54.4% No 64.1% 89.2% 70.1% 45.6% TOTAL 100.0% 100.0% 100.0% 100.0%
SAMPLE SIZE (N) 341 65 148 128

Hunger in America 2010 The Capital Area Food Bank of Texas, Inc (4408)
127 CH 6. CLIENTS: FOOD INSECURITY
Choose between food and paying for gas for a car
Yes 37.6% 11.2% 31.2% 57.2% No 62.4% 88.8% 68.8% 42.8% TOTAL 100.0% 100.0% 100.0% 100.0%
SAMPLE SIZE (N) 340 65 148 127 SOURCE: This table was constructed based on usable responses to Questions 52, 44, 44a, 45, and 46 of the client
survey. NOTES: All usable responses were weighted as described in Chapter 3 and in the Technical Appendix volume to
represent all emergency food clients of The Capital Area Food Bank of Texas, Inc. The sample sizes (N) also include missing data.
For choosing between food and utilities, missing, don’t know, and refusal responses combined are 0.0% for all clients, 0.0% for households that are food secure, 0.2% for households that are food insecure with low security, and 0.7% for households that are food insecure with very low security. For choosing between food and rent (mortgage), missing, don’t know, and refusal responses combined are 0.0% for all clients, 0.0% for households that are food secure, 0.1% for households that are food insecure with low security, and 0.6% for households that are food insecure with very low security. For choosing between food and medical care, missing, don’t know, and refusal responses combined are 0.0% for all clients, 0.0% for households that are food secure, 0.1% for households that are food insecure with low security, and 1.0% for households that are food insecure with very low security. For choosing between food and transportation, missing, don’t know, and refusal responses combined are 0.0% for all clients, 0.0% for households that are food secure, 0.1% for households that are food insecure with low security, and 0.7% for households that are food insecure with very low security. For choosing between food and gas for a car, missing, don’t know, and refusal responses combined are 0.0% for all clients, 0.0% for households that are food secure, 0.1% for households that are food insecure with low security, and 0.9% for households that are food insecure with very low security.
Table 6.5.2 describes the proportions of households that face direct trade-offs among
necessities for subgroups defined by food security status. Specific results include:
• 7.0% of the households categorized as food secure, 24.7% of those categorized as having low food security, and 39.5% of those categorized as having very low food security had to choose between food and medical care during the past year.
• 13.3% of the households categorized as food secure, 50.7% of those categorized as having low food security, and 81.6% of those categorized as having very low food security had to choose between food and utilities (or heating fuel) during the past year.

Hunger in America 2010 The Capital Area Food Bank of Texas, Inc (4408)
128 CH 6. CLIENTS: FOOD INSECURITY
• 15.1% of the households categorized as food secure, 37.3% of those categorized as having low food security, and 65.5% of those categorized as having very low food security had to choose between food and rent (or mortgage) during the past year.
• 10.8% of the households categorized as food secure, 29.9% of those categorized as having low food security, and 54.4% of those categorized as having very low food security had to choose between food and transportation during the past year.
• 11.2% of the households categorized as food secure, 31.2% of those categorized as having low food security, and 57.2% of those categorized as having very low food security had to choose between food and gas for a car during the past year.

Hunger in America 2010 The Capital Area Food Bank of Texas, Inc (4408)
129 CH 6. CLIENTS: FOOD INSECURITY
There is also a notable association between household structure and reporting direct
trade-offs between necessities (Table 6.5.3).
TABLE 6.5.3
HOUSEHOLD TRADE-OFFS, BY HOUSEHOLD STRUCTURE
All Households Households with Seniors
Households with Children,
No Seniors
One-Person Households with Neither Children Nor
Seniors
Households with Two or
More People but with Neither Children Nor
Seniors
Choose between food and utilities or heating fuel
Yes 54.8% 46.5% 58.3% 34.0% 79.5% No 45.2% 53.5% 41.7% 66.0% 20.5% TOTAL 100.0% 100.0% 100.0% 100.09% 100.0%
SAMPLE SIZE (N) 342 50 150 87 55
Choose between food and rent or mortgage
Yes 43.6% 33.0% 40.8% 29.1% 72.2% No 56.4% 67.0% 59.2% 70.9% 27.8% TOTAL 100.0% 100.0% 100.0% 100.0% 100.0%
SAMPLE SIZE (N) 343 50 150 88 55
Choose between food and medical care
Yes 26.7% 35.3% 26.7% 23.9% 26.7% No 73.3% 64.7% 73.3% 76.1% 73.3% TOTAL 100.0% 100.0% 100.0% 100.0% 100.0%
SAMPLE SIZE (N) 342 51 150 87 54
Choose between food and paying for transportation
Yes 35.4% 33.5% 39.6% 28.2% 38.1%
No 64.6% 66.5% 60.4% 71.8% 61.9%

Hunger in America 2010 The Capital Area Food Bank of Texas, Inc (4408)
130 CH 6. CLIENTS: FOOD INSECURITY
All Households Households with Seniors
Households with Children,
No Seniors
One-Person Households with Neither Children Nor
Seniors
Households with Two or
More People but with Neither Children Nor
Seniors
TOTAL 100.0% 100.0% 100.0% 100.09% 100.0%
SAMPLE SIZE (N) 342 50 150 87 55
Choose between food and paying for gas for a car
Yes 37.1% 26.8% 42.1% 23.9% 49.8%
No 62.9% 73.2% 57.9% 76.1% 50.2%
TOTAL 100.0% 100.0% 100.0% 100.0% 100.0%
SAMPLE SIZE (N) 341 50 149 87 55 SOURCE: This table was constructed based on usable responses to Questions 52, 44, 44a, 45, and 46 of the client
survey. NOTES: All usable responses were weighted as described in Chapter 3 and in the Technical Appendix volume to
represent all emergency food clients of The Capital Area Food Bank of Texas, Inc. The sample sizes (N) also include missing data.
For choosing between food and utilities, missing, don’t know, and refusal responses combined are 0.1% for all households, 0.1% for households with seniors, 0.7% for households with seniors and no children, 2.0% for one-person households with neither seniors nor children, and 0.2% for households with two or more people but neither seniors nor children. For choosing between food and rent (mortgage), missing, don’t know, and refusal responses combined are 0.1% for all households, 0.1% for households with seniors, 0.7% for one-person households with neither seniors nor children, 1.8% for one-person households with neither seniors nor children, and 0.2% for households with two or more people but neither seniors nor children. For choosing between food and medical care, missing, don’t know, and refusal responses combined are 0.0% for all households, 0.0% for households with seniors, 0.7% for one-person households with neither seniors nor children, 2.1% for one-person households with neither seniors nor children, and 0.4% for households with two or more people but neither seniors nor children. For choosing between food and transportation, missing, don’t know, and refusal responses combined are 0.1% for all households, 0.1% for households with seniors, 0.7% for one-person households with neither seniors nor children, 2.0% for one-person households with neither seniors nor children, and 0.2% for households with two or more people but neither seniors nor children. For choosing between food and gas for a car, missing, don’t know, and refusal responses combined are 0.1% for all households, 0.1% for households with seniors, 0.9% for one-person households with neither

Hunger in America 2010 The Capital Area Food Bank of Texas, Inc (4408)
131 CH 6. CLIENTS: FOOD INSECURITY
seniors nor children, 2.0% for one-person households with neither seniors nor children, and 0.2% for households with two or more people but neither seniors nor children.
Key findings include:
• 35.3% of households with seniors and 26.7% of households with children and no seniors reported making trade-offs between food and medical care, compared with 26.7% for the whole population.
• The comparable percentages for trade-offs between food and utilities were 46.5% for households with seniors and 58.3% for households with children but no seniors, compared with 54.8% for the whole population.
For the choice between food and rent (or mortgage payments), 40.8% of households with
children but no seniors had to choose, compared with only 33.0% of households with seniors.


Hunger in America 2010 The Capital Area Food Bank of Texas, Inc (4408)
133 CH 7. CLIENTS: USE OF FOOD ASSISTANCE PROGRAMS
7. CLIENTS: USE OF FOOD ASSISTANCE PROGRAMS
Given the high levels of need evidenced by many clients in the FA network, it is
important to assess whether the clients of The Capital Area Food Bank of Texas, Inc are
receiving all of the governmental nutrition assistance for which they are eligible. In this chapter,
we begin by examining client participation in the Supplemental Nutrition Assistance Program
(formerly the Food Stamp Program), since it is the largest and most widely available government
nutrition assistance program. Levels of participation and reasons for non-participation are both
examined. A subsequent section examines participation in other government nutrition programs.
7.1 USE OF THE SUPPLEMENTAL NUTRITION ASSISTANCE PROGRAM
Clients were asked a series of questions relating to the Supplemental Nutrition Assistance
Program (SNAP). Table 7.1.1 summarizes the findings.
TABLE 7.1.1
USE OF THE SUPPLEMENTAL NUTRITION ASSISTANCE PROGRAM
Participation in SNAP Pantry Client Households
Kitchen Client Households
Shelter Client Households
All Client Households
Client or anyone in the household had ever applied for SNAP benefits 74.3% 90.5% n.p. 76.4%
Client or anyone in the household currently receiving SNAP benefits 34.8% 4.7% n.p. 25.9%
Client or anyone in the household currently not receiving but received SNAP benefits during the previous 12 months 12.8% 33.7% n.p. 16.4%
Client or anyone in the household had applied for but had not received SNAP benefits during the previous 12 months 25.4% 52.1% n.p. 33.5%
SAMPLE SIZE (N) 296 46 12 354

Hunger in America 2010 The Capital Area Food Bank of Texas, Inc (4408)
134 CH 7. CLIENTS: USE OF FOOD ASSISTANCE PROGRAMS
Participation in SNAP Pantry Client Households
Kitchen Client Households
Shelter Client Households
All Client Households
Number of weeks clients or their households have currently been receiving SNAP benefits (for those who are receiving)
Less than 2 weeks 0.4% n.p. n.p. 17.0% 2-4 weeks 7.1% n.p. n.p. 6.3% 5-12 weeks 7.6% n.p. n.p. 6.5% 13-51 weeks 29.8% n.p. n.p. 24.6% 1-2 years (52-103 weeks) 7.9% n.p. n.p. 7.0% 2-4 years (104-207 weeks) 14.4% n.p. n.p. 12.0% 4 years or more 32.8% n.p. n.p. 26.5% TOTAL 100.0% n.p. n.p. 100.0%
Average number of weeks clients or
their households have currently been receiving SNAP benefitsa 183.7 n.p. n.p. 147.6
Median number of weeks clients or their households have currently been receiving SNAP benefitsa 52 n.p. n.p. 30
Number of weeks during which SNAP benefits usually lasta
1 week or less 18.2% n.p. n.p. 17.1% 2 weeks 30.7% n.p. n.p. 30.1% 3 weeks 30.4% n.p. n.p. 32.3% 4 weeks 20.7% n.p. n.p. 20.1% More than 4 weeks 0.0% n.p. n.p. 0.5% TOTAL 100.0% n.p. n.p. 100.0%
Average number of weeks during the
month over which SNAP benefits usually last 2.6 n.p. n.p. 3.3
Median number of weeks during the month over which SNAP benefits usually last 3 n.p. n.p. 3
SAMPLE SIZE (N) 95 8 5 108 SOURCE: This table was constructed based on usable responses to questions 30, 31, 32, 34, and 35 of the client
survey.
NOTES: The percentages presented in this table are based only on usable responses, excluding missing, don’t know, and refusal responses. All usable responses were weighted as described in Chapter 3 and in the Technical Appendix volume to represent all emergency food clients of The Capital Area Food Bank of Texas, Inc. The sample sizes (N) also include missing data.
The second, third, and fourth rows of the first panel do not add up exactly to the first row due to varying item nonresponses to the question involved.

Hunger in America 2010 The Capital Area Food Bank of Texas, Inc (4408)
135 CH 7. CLIENTS: USE OF FOOD ASSISTANCE PROGRAMS
For the table section describing the number of weeks currently receiving SNAP benefits, missing, don’t know, and refusal responses combined are 52.6% for pantry clients, 96.3% for kitchen clients, 10.0% for shelter clients, and 59.1% for all clients.
For the table section describing the number of weeks SNAP benefits usually last, missing, don’t know, and refusal responses combined are 49.4% for pantry clients, 95.3% for kitchen clients, 85.6% for shelter clients, and 63.6% for all clients.
a Most SNAP households (67 percent) receive less than the maximum SNAP benefit with the expectation that they can contribute some of their own funds for food purchases. In other words, program benefits are not designed to last the full month in all households.
Overall, 76.4% of the clients have ever applied for, and 25.9% are currently receiving,
SNAP benefits. 22 More information includes:
• 38.5% of the clients who are receiving SNAP benefits have been receiving them for more than two years.
• For 79.4% of the clients who are receiving SNAP benefits, the benefits last for three weeks or less. For 47.1%, they last for two weeks or less.
• On average, SNAP benefits last for 3.3 weeks.
22 Caution should be taken in comparing these estimates because one asks whether the respondent has ever
applied for SNAP benefits, while the other asks whether the respondent is currently receiving benefits.

Hunger in America 2010 The Capital Area Food Bank of Texas, Inc (4408)
136 CH 7. CLIENTS: USE OF FOOD ASSISTANCE PROGRAMS
CHART 7.1.1 USE OF SUPPLEMENTAL NUTRITION ASSISTANCE PROGRAMBy Program Type
74.3%
90.5%
63.7%
34.8%
4.7%9.1%
0.0%
10.0%
20.0%
30.0%
40.0%
50.0%
60.0%
70.0%
80.0%
90.0%
100.0%
Pantry client households Kitchen client households Shelter client households
Application and Use of SNAP
Per
cen
tag
e o
f H
ou
seh
old
s
Clients who ever applied for SNAP Clients currently receiving food from SNAP
Note: Charts corresponding to tables that contain values of "n.p." or "N.A." (see section 3.7) may display the
suppressed numbers in place of "n.p" or "N.A". This is due to the limitation of the computer system used to generate the member-level reports. The parts of the chart for which this is true should be ignored.

Hunger in America 2010 The Capital Area Food Bank of Texas, Inc (4408)
137 CH 7. CLIENTS: USE OF FOOD ASSISTANCE PROGRAMS
SNAP use is known to differ according to household composition. Table 7.1.2 examines
the relationship between household structure and the characteristics presented in Table 7.1.1
TABLE 7.1.2
USE OF THE SUPPLEMENTAL NUTRITION ASSISTANCE PROGRAM, BY PRESENCE OF ELDERLY OR CHILDREN
Participation in SNAP
Elderly Clients at Program
Sites Households with Seniors
Households with Children
Younger than 18
Households with Children
Ages 0-5
Client or anyone in the household had ever applied for SNAP benefits 60.5% 65.2% 78.0% 71.0%
Client or anyone in the household currently receiving SNAP benefits 27.2% 27.0% 36.4% 47.0%
Client or anyone in the household currently not receiving but received SNAP benefits during the previous 12 months 0.0% 3.7% 15.5% 11.7%
Client or anyone in the household had applied for but had not received SNAP benefits during the previous 12 months 33.2% 34.5% 26.0% 12.1%
SAMPLE SIZE (N) 37 51 173 82
Number of weeks clients or their households have currently been receiving SNAP benefits (for those who are receiving)
Less than 2 weeks n.p. n.p. n.p. n.p. 2-4 weeks n.p. n.p. n.p. n.p. 5-12 weeks n.p. n.p. n.p. n.p. 13-51 weeks n.p. n.p. n.p. n.p. 1-2 years (52-103 weeks) n.p. n.p. n.p. n.p. 2-4 years (104-207 weeks) n.p. n.p. n.p. n.p. 4 years or more n.p. n.p. n.p. n.p. TOTAL n.p. n.p. n.p. n.p.
Average number of weeks clients or
their households have currently been receiving SNAP benefits n.p. n.p. n.p. n.p.
Median number of weeks clients or their households have currently been receiving SNAP benefits n.p. n.p. n.p. n.p.
Number of weeks during which SNAP benefits usually lasta

Hunger in America 2010 The Capital Area Food Bank of Texas, Inc (4408)
138 CH 7. CLIENTS: USE OF FOOD ASSISTANCE PROGRAMS
Participation in SNAP
Elderly Clients at Program
Sites Households with Seniors
Households with Children
Younger than 18
Households with Children
Ages 0-5
1 week or less n.p. n.p. n.p. n.p. 2 weeks n.p. n.p. n.p. n.p. 3 weeks n.p. n.p. n.p. n.p. 4 weeks n.p. n.p. n.p. n.p. More than 4 weeks n.p. n.p. n.p. n.p. TOTAL n.p. n.p. n.p. n.p.
Average number of weeks during the
month over which SNAP benefits usually lasta n.p. n.p. n.p. n.p.
Median number of weeks during the month over which SNAP benefits usually lasta n.p. n.p. n.p. n.p.
SAMPLE SIZE (N) 8 11 11 11 SOURCE: This table was constructed based on usable responses to questions 3, 6a, 6b, 6c, 7, 30, 31, 32, 34, and 35
of the client survey.
NOTES: The percentages presented in this table are based only on usable responses, excluding missing, don’t know, and refusal responses. All usable responses were weighted as described in Chapter 3 and in the Technical Appendix volume to represent all emergency food clients of The Capital Area Food Bank of Texas, Inc. The sample sizes (N) also include missing data.
The second, third, and fourth rows of the first panel do not add up exactly to the first row due to varying item nonresponses to the question involved. For the table section describing the number of weeks currently receiving SNAP benefits, missing, don’t know, and refusal responses combined are 65.3% for elderly clients at program sites, 64.0% for households with seniors, 52.5% for households with children younger than 18, and 39.2% for households with children ages 0-5.
For the table section describing the number of weeks SNAP benefits usually last, missing, don’t know, and refusal responses combined are 58.4% for elderly clients at program sites, 58.9% for households with seniors, 48.4% for households with children younger than 18, and 31.7% for households with children ages 0-5.
Key findings include:
• 65.2% of clients living in households with seniors have ever applied to SNAP. This compares to 78.0% of households with children younger than 18 and 71.0% of households with children ages 0 to 5.
• 27.0% of clients living in households with seniors are currently receiving SNAP benefits. This compares to 36.4% of households with children younger than 18 and 47.0% of households with children ages 0 to 5.

Hunger in America 2010 The Capital Area Food Bank of Texas, Inc (4408)
139 CH 7. CLIENTS: USE OF FOOD ASSISTANCE PROGRAMS
• The median number of weeks during the month over which SNAP benefits usually last is n.p. weeks for clients in households with seniors, n.p. weeks for clients in households with children younger than 18, and n.p. weeks for clients in households with children ages 0 to 5.

Hunger in America 2010 The Capital Area Food Bank of Texas, Inc (4408)
140 CH 7. CLIENTS: USE OF FOOD ASSISTANCE PROGRAMS
7.2 REASONS WHY CLIENTS NEVER APPLIED FOR SUPPLEMENTAL NUTRITION ASSISTANCE PROGRAM BENEFITS
Clients who had not applied for SNAP benefits were asked why they or their households
never applied for SNAP benefits. Table 7.2.1 shows the results.
TABLE 7.2.1
REASONS WHY CLIENTS NEVER APPLIED FOR SUPPLEMENTAL NUTRITION ASSISTANCE PROGRAM BENEFITS
Reasons Why Clients or Their Households Never Applied for SNAP Benefitsa
Pantry Client Households
Kitchen Client Households
Shelter Client Households
All Client Households
Ineligibilityb Don’t think eligible because of
income or assets All clients 24.6% n.p. n.p. 20.9%
Clients with income 130% of the federal poverty level or lower
17.9% n.p. n.p. 15.7%
Clients with income higher than 130% of the federal poverty level
6.7% n.p. n.p. 5.2%
Unknown 0.0% n.p. n.p. 0.0% Don’t think eligible because of
citizenship status 16.2% n.p. n.p. 22.5%
Eligible for only a low benefit amount 2.1% n.p. n.p. 1.6% SUBTOTALc 42.2% n.p. n.p. 42.6%
Inconvenience
Don’t know where to go or who to contact to apply 4.8% n.p. n.p. 9.6%
Hard to get to the SNAP office 0.2% n.p. n.p. 0.1% Application process is too long and
complicated 1.8% n.p. n.p. 1.4%
Questions are too personal 0.9% n.p. n.p. 0.7% SNAP office staff are disrespectful 0.0% n.p. n.p. 0.0% SNAP office is unpleasant or in unsafe
area 0.0% n.p. n.p. 0.0%
SNAP office is not open when I am available
0.0% n.p. n.p. 0.0%
SNAP office does not offer services in my language
0.0% n.p. n.p. 0.0%
Didn’t want to be fingerprinted 0.0% n.p. n.p. 0.0% Nowhere to redeem benefits near me 0.0% n.p. n.p. 0.0% SUBTOTAL 7.7% n.p. n.p. 11.9%

Hunger in America 2010 The Capital Area Food Bank of Texas, Inc (4408)
141 CH 7. CLIENTS: USE OF FOOD ASSISTANCE PROGRAMS
Reasons Why Clients or Their Households Never Applied for SNAP Benefitsa
Pantry Client Households
Kitchen Client Households
Shelter Client Households
All Client Households
No need No need for benefit 7.1% n.p. n.p. 7.5% Others need benefits more 1.0% n.p. n.p. 8.2% SUBTOTAL 8.1% n.p. n.p. 15.7%
Social stigma Feel embarrassed applying for benefits 4.3% n.p. n.p. 3.3% Family or friends do not approve of my
receiving benefits 0.0% n.p. n.p. 0.0% Dislike relying on the government for
assistance 3.3% n.p. n.p. 2.5% Feel embarrassed using benefits 1.0% n.p. n.p. 0.7% SUBTOTAL 8.6% n.p. n.p. 6.6%
Other
Planning to apply, but not yet applied 1.2% n.p. n.p. 1.8% Otherd 29.4% n.p. n.p. 24.6%
SAMPLE SIZE (N) 86 8 5 99 SOURCE: This table was constructed based on usable responses to Question 36 of the client survey. NOTES: All usable responses were weighted as described in Chapter 3 and in the Technical Appendix volume to
represent all emergency food clients of The Capital Area Food Bank of Texas, Inc. The sample sizes (N) also include missing data.
Missing, don’t know, and refusal responses combined are 2.7% for pantry clients, 47.2% for kitchen clients, 0.0% for shelter clients, and 5.9% for all clients.
aMultiple responses were accepted. bSee Appendix B for SNAP eligibility criteria. cThe subtotal in this table indicates the percentage of people who provided one or more component items as their responses; thus, it may differ from the sum of component items. dThis includes working, having no mailing address, and being in a temporary living situation.
Reasons for not having applied for SNAP benefits include:
• Overall, 42.6% of the clients who had not applied for SNAP benefits did not do so because they believe they are not eligible or eligible for only a low benefit amount; 11.9% because it is too much hassle; 15.7% either because there is no need or because they think others would need the benefits more; and 6.6% because they associate a social stigma with SNAP benefits.

Hunger in America 2010 The Capital Area Food Bank of Texas, Inc (4408)
142 CH 7. CLIENTS: USE OF FOOD ASSISTANCE PROGRAMS
• 20.9% of the clients indicated income or assets above the eligible level as a reason for having not applied for SNAP benefits.
• That 20.9% was broken down into two categories: those who had an income that is at or below 130% of the federal poverty level (15.7%), and those who had an income that is higher than 130% of the federal poverty level (5.2%).23,24
23 Generalizing this result requires caution, as the income data collected through our client survey were not
validated. 24 Broadly speaking, a household usually meets the income eligibility requirements for SNAP if its gross
income is less than 130% of the poverty level. However, it was not possible during the survey to collect all the detailed data necessary to assess eligibility. See Appendix B for the eligibility criteria.

Hunger in America 2010 The Capital Area Food Bank of Texas, Inc (4408)
143 CH 7. CLIENTS: USE OF FOOD ASSISTANCE PROGRAMS
CHART 7.2.1 REASONS WHY CLIENT HOUSEHOLDS NEVER APPLIED FOR SUPPLEMENTAL NUTRITION ASSISTANCE PROGRAM BENEFITS
By Program Type
42.2%
45.1%
43.3%
7.7%
0.0%
32.5%
8.1%
43.5%
40.6%
8.6%
0.0% 0.0%0.0%
5.0%
10.0%
15.0%
20.0%
25.0%
30.0%
35.0%
40.0%
45.0%
50.0%
Pantry client households Kitchen client households Shelter client households
Reasons
Per
cen
tag
e o
f H
ou
seh
old
s
Eligibility factors Convenience factors Need factors Stigma factors
Note: Charts corresponding to tables that contain values of "n.p." or "N.A." (see section 3.7) may display the
suppressed numbers in place of "n.p" or "N.A". This is due to the limitation of the computer system used to generate the member-level reports. The parts of the chart for which this is true should be ignored.

Hunger in America 2010 The Capital Area Food Bank of Texas, Inc (4408)
144 CH 7. CLIENTS: USE OF FOOD ASSISTANCE PROGRAMS
Given the importance of understanding why some households that need SNAP assistance
fail to get it, Table 7.2.2 examines the relationship between household structure and factors
associated with not applying for SNAP benefits.
TABLE 7.2.2
REASONS WHY CLIENTS NEVER APPLIED FOR SUPPLEMENTAL NUTRITION ASSISTANCE PROGRAM BENEFITS, BY PRESENCE OF ELDERLY OR CHILDREN
Reasons Why Respondents or Their Households Never Applied for SNAP Benefitsa
Elderly Clients at Program
Sites Households with Seniors
Households with Children
Younger than 18
Households with Children
Ages 0-5
Factors associated with eligibility Don’t think eligible because of income
or assets All n.p. n.p. 24.4% n.p.
Income 130% of federal poverty level or lower
n.p. n.p. 19.4% n.p.
Income higher than 130% of federal poverty level
n.p. n.p. 5.1% n.p.
Unknown n.p. n.p. 0.0% n.p. Don’t think eligible because of
citizenship status n.p. n.p. 21.1% n.p.
Eligible for only a low benefit amount n.p. n.p. 0.0% n.p. SUBTOTALb n.p. n.p. 44.3% n.p.
Factors associated with program operation
Don’t know where to go or whom to contact to apply
n.p. n.p. 3.2% n.p.
Hard to get to the SNAP office n.p. n.p. 0.0% n.p. Application process is too long and
complicated n.p. n.p. 2.6% n.p.
Questions are too personal n.p. n.p. 0.0% n.p. SNAP office staff are disrespectful n.p. n.p. 0.0% n.p. SNAP office is unpleasant or in unsafe
area n.p. n.p. 0.0% n.p.
SNAP office is not open when I am available
n.p. n.p. 0.0% n.p.
SNAP office does not offer services in my language
n.p. n.p. 0.0% n.p.
Didn’t want to be fingerprinted n.p. n.p. 0.0% n.p. Nowhere to redeem benefits near me n.p. n.p. 0.0% n.p. SUBTOTAL n.p. n.p. 5.8% n.p.

Hunger in America 2010 The Capital Area Food Bank of Texas, Inc (4408)
145 CH 7. CLIENTS: USE OF FOOD ASSISTANCE PROGRAMS
Reasons Why Respondents or Their Households Never Applied for SNAP Benefitsa
Elderly Clients at Program
Sites Households with Seniors
Households with Children
Younger than 18
Households with Children
Ages 0-5
Factors associated with financial needs No need for benefit n.p. n.p. 4.6% n.p. Others need benefits more n.p. n.p. 0.0% n.p. SUBTOTAL n.p. n.p. 4.6% n.p.
Factors associated with social stigma
Feel embarrassed applying for benefits n.p. n.p. 0.0% n.p. Family or friends do not approve of
my receiving benefits n.p. n.p. 0.0% n.p.
Dislike relying on the government for assistance
n.p. n.p. 0.0% n.p.
Feel embarrassed using benefits n.p. n.p. 0.0% n.p. SUBTOTAL n.p. n.p. 0.0% n.p.
Other factors
Planning to apply, but not yet n.p. n.p. 2.3% n.p. Other n.p. n.p. 35.3% n.p.
SAMPLE SIZE (N) 18 20 44 21 SOURCE: This table was constructed based on usable responses to questions 3, 6a, 6b, 6c, 7, and 36 of the client
survey. NOTES: All usable responses were weighted as described in Chapter 3 and in the Technical Appendix volume to
represent all emergency food clients of The Capital Area Food Bank of Texas, Inc. The sample sizes (N) also include missing data.
In calculating percentages and sample sizes, we excluded item nonresponses to all variables involved.
Missing, don’t know, and refusal responses combined are 0.0% for elderly clients at program sites, 0.0% for households with seniors, 3.9% for households with children younger than 18, and 6.9% for households with children ages 0-5.
aMultiple responses were accepted. bThe subtotal indicates the percentage of people who provided one or more component items as their responses; thus it may differ from the sum of component items. See Appendix B for SNAP eligibility criteria.
Key findings include:
• n.p. of households with young children cited factors associated with program operation for not applying, compared with n.p. of households with seniors.
• n.p. of households with seniors, compared with n.p. of households with young children indicated a reason associated with their financial needs.

Hunger in America 2010 The Capital Area Food Bank of Texas, Inc (4408)
146 CH 7. CLIENTS: USE OF FOOD ASSISTANCE PROGRAMS
7.3 REASONS WHY CLIENTS OR THEIR HOUSEHOLDS ARE NOT CURRENTLY RECEIVING SUPPLEMENTAL NUTRITION ASSISTANCE PROGRAM BENEFITS, FOR THOSE WHO HAVE APPLIED
Clients who have applied but are not currently receiving SNAP benefits were asked why
this is so. Results are shown in Table 7.3.1.
TABLE 7.3.1
REASONS WHY CLIENTS OR THEIR HOUSEHOLDS ARE NOT CURRENTLY RECEIVING SUPPLEMENTAL NUTRITION ASSISTANCE PROGRAM BENEFITS,
FOR THOSE WHO HAVE APPLIED
Reasons Why Clients or Their Households Are Not Currently Receiving SNAP benefits, for Those Who Have Applied for SNAP Benefitsa
Pantry Client Households
Kitchen Client Households
Shelter Client Households
All Client Households
Ineligibility Ineligible income level 37.6% 23.5% n.p. 28.4% Change of household makeup 3.0% 0.0% n.p. 1.6% Time limit for receiving the help ran out 9.0% 1.1% n.p. 5.3% Citizenship status 2.4% 0.0% n.p. 1.3% SUBTOTALb 49.3% 24.6% n.p. 35.1%
Inconvenience
Too much hassle 13.1% 20.2% n.p. 24.4% Hard to get to SNAP office 2.8% 0.0% n.p. 11.9% SUBTOTAL 16.0% 20.2% n.p. 25.9%
No need
No need for benefits 0.6% 1.3% n.p. 0.7% Others need benefits more 0.6% 0.0% n.p. 0.3% Need is only temporary 4.5% 0.6% n.p. 4.0% SUBTOTAL 4.5% 1.8% n.p. 4.5%
Other
Other reasonsc 22.4% 42.0% n.p. 26.4%
SAMPLE SIZE (N) 115 30 2 147 SOURCE: This table was constructed based on usable responses to Question 33 of the client survey. NOTES: All usable responses were weighted as described in Chapter 3 and in the Technical Appendix volume to
represent all emergency food clients of The Capital Area Food Bank of Texas, Inc. The sample sizes (N) also include missing data.
Missing, don’t know, and refusal responses combined are 1.0% for pantry clients, 0.6% for kitchen clients, 0.0% for shelter clients, and 0.8% for all clients.

Hunger in America 2010 The Capital Area Food Bank of Texas, Inc (4408)
147 CH 7. CLIENTS: USE OF FOOD ASSISTANCE PROGRAMS
aMultiple responses were accepted. bThe subtotal in this table indicates the percentage of people who provided one or more component items as their responses; thus it may differ from the sum of component items. cThis includes “waiting” and “in progress.”
Several main findings include:
• Overall, 35.1% of the clients say that they are not receiving SNAP benefits because they believe they are not eligible.
• 25.9% are not receiving SNAP benefits because it is too much hassle.
• 4.5% are not receiving SNAP benefits either because there is no need or because they think others would need the benefits more, or the need is only temporary.
CHART 7.3.1 REASONS WHY CLIENT HOUSEHOLDS ARE NOT RECEIVING SUPPLEMENTAL NUTRITION ASSISTANCE PROGRAM BENEFITS
By Program Type
49.3%
24.6%
0.0%
16.0%
20.2%
88.3%
4.5%1.8%
11.7%
0.0%
10.0%
20.0%
30.0%
40.0%
50.0%
60.0%
70.0%
80.0%
90.0%
100.0%
Pantry client households Kitchen client households Shelter client households
Reasons
Per
cen
tag
e o
f H
ou
seh
old
s
Eligibility Factors Convenience Factors Need Factors
Note: Charts corresponding to tables that contain values of "n.p." or "N.A." (see section 3.7) may display the
suppressed numbers in place of "n.p" or "N.A". This is due to the limitation of the computer system used to generate the member-level reports. The parts of the chart for which this is true should be ignored.

Hunger in America 2010 The Capital Area Food Bank of Texas, Inc (4408)
148 CH 7. CLIENTS: USE OF FOOD ASSISTANCE PROGRAMS
Table 7.3.2 examines the relationship between household structure and factors associated
with not receiving SNAP benefits, among those who applied. It also presents a summary of the
previous month’s household income levels for those clients who reported higher income levels as
the reason for non-receipt.
TABLE 7.3.2
REASONS THAT RESPONDENTS OR THEIR HOUSEHOLDS DO NOT CURRENTLY RECEIVE SUPPLEMENTAL NUTRITION ASSISTANCE PROGRAM BENEFITS, FOR THOSE WHO HAVE APPLIED,
BY PRESENCE OF ELDERLY OR CHILDREN
Reasons That Clients or Their Households Do Not Currently Receive SNAP Benefits, Among the Ones Who Have Applied for SNAP Benefitsa
Elderly Clients at Program
Sites Households with Seniors
Households with Children
Younger than 18
Households with Children
Ages 0-5
Factors associated with eligibility Ineligible income level
All n.p. n.p. 46.3% n.p. Income 130% of federal poverty
level or lower n.p. n.p. 28.2% n.p.
Income higher than 130% of federal poverty level
n.p. n.p. 17.0% n.p.
Unknown n.p. n.p. 1.1% n.p. Change of household makeup n.p. n.p. 1.0% n.p. Time limit receiving for the help ran out n.p. n.p. 10.1% n.p. Citizenship status n.p. n.p. 3.7% n.p. SUBTOTALb n.p. n.p. 57.2% n.p.
Factors associated with program operation
Too much hassle n.p. n.p. 26.7% n.p. Hard to get to SNAP office n.p. n.p. 3.5% n.p. SUBTOTAL n.p. n.p. 30.2% n.p.
Factors Associated with Need
No need for benefits n.p. n.p. 0.0% n.p. Others need benefits more n.p. n.p. 0.0% n.p. Need is only temporary n.p. n.p. 5.6% n.p. SUBTOTAL n.p. n.p. 5.6% n.p.
Other Factors
Other reasonsc n.p. n.p. 20.4% n.p.
SAMPLE SIZE (N) 11 20 66 25

Hunger in America 2010 The Capital Area Food Bank of Texas, Inc (4408)
149 CH 7. CLIENTS: USE OF FOOD ASSISTANCE PROGRAMS
SOURCE: This table was constructed based on usable responses to questions 3, 6a, 6b, 6c, 7, and 33 of the client survey.
NOTES: All usable responses were weighted as described in Chapter 3 and in the Technical Appendix volume to
represent all emergency food clients of The Capital Area Food Bank of Texas, Inc. The sample sizes (N) also include missing data.
Missing, don’t know, and refusal responses combined are 0.0% for elderly clients, 0.0% for households with seniors, 0.0% for households with children younger than 18, and 0.0% for households with children 0-5.
aMultiple responses were accepted. bThe subtotal indicates the percentage of people who provided one or more component items as their responses; thus, it may differ from the sum of component items. cThis includes “waiting” and “in progress.”
We find:
• 57.2% of households with children mentioned one or more reasons related to eligibility, compared with n.p. of households with seniors.
• n.p. of elderly clients and n.p. of households with elderly members mentioned factors associated with program operations, compared to 30.2% of households with children younger than 18 and n.p. of households with children ages 0 to 5.
• n.p. of elderly clients and n.p. of households with elderly members mentioned factors associated with the need for benefits, compared to 5.6% of households with children younger than 18 and n.p. of households with children ages 0 to 5.

Hunger in America 2010 The Capital Area Food Bank of Texas, Inc (4408)
150 CH 7. CLIENTS: USE OF FOOD ASSISTANCE PROGRAMS
Tables 7.3.1 and 7.3.2 show that some clients indicated a higher-than-required income
level as a reason they were not currently receiving SNAP benefits. This percentage is 28.4%
among all clients. In Table 7.3.3, those clients are further broken down into two categories based
on the information about their previous month’s household income: those whose income is
130% of the federal poverty level or lower (16.5%); and those whose income is higher than
130% of the federal poverty level (10.9%).
TABLE 7.3.3
REPORTED INCOME LEVELS OF CLIENTS WHO INDICATED INELIGIBLE INCOME AS A REASON FOR NOT RECEIVING SUPPLEMENTAL NUTRITION ASSISTANCE PROGRAM BENEFITS
Reported Income Levels of Clients Who Indicated Ineligible Income as a Reason for Not Receiving SNAP Benefits
Pantry Client Households
Kitchen Client Households
Shelter Client Households
All Client Households
Ineligible income level 37.6% 23.5% n.p. 28.4% Income 130% of the federal poverty
level or lower 27.7% 4.1% n.p. 16.5% Income higher than 130% of the federal
poverty level 8.0% 19.3% n.p. 10.9% Income unknown 1.5% 0.0% n.p. 0.8%
SAMPLE SIZE (N) 115 30 2 147
SOURCE: This table was constructed based on usable responses to Question 33 of the client survey. NOTES: All usable responses were weighted as described in Chapter 3 and in the Technical Appendix volume to
represent all emergency food clients of The Capital Area Food Bank of Texas, Inc. The sample sizes (N) also include missing data.
Missing, don’t know, and refusal responses combined are 5.2% for pantry clients, 20.9% for kitchen
clients, 0.0% for shelter clients, and 9.9% for all clients.
In Table 7.3.4 by elderly and child status, we find that the percentage of clients that
indicated a higher income level as a reason they were not currently receiving SNAP benefits
whose income is 130% of the federal poverty level or lower is n.p. for households with seniors,

Hunger in America 2010 The Capital Area Food Bank of Texas, Inc (4408)
151 CH 7. CLIENTS: USE OF FOOD ASSISTANCE PROGRAMS
28.2% for households with children younger than 18, and n.p. for households with young
children.
TABLE 7.3.4
REPORTED INCOME LEVELS OF CLIENTS WHO INDICATED INELIGIBLE INCOME AS A REASON FOR NOT RECEIVING SUPPLEMENTAL NUTRITION ASSISTANCE PROGRAM
BENEFITS, BY ELDERLY AND CHILD STATUS
Reported Income Levels of Clients Who Indicated Ineligible Income as a Reason for Not Receiving SNAP Benefits
Elderly Clients at Program
Sites Households with Seniors
Households with Children
Younger than 18
Households with Children
Ages 0-5
Ineligible income level n.p. n.p. 46.3% n.p. Income 130% of the federal poverty
level or lower n.p. n.p. 28.2% n.p. Income higher than 130% of the federal
poverty level n.p. n.p. 17.0% n.p. Income unknown n.p. n.p. 1.1% n.p.
SAMPLE SIZE (N) 11 20 66 25 SOURCE: This table was constructed based on usable responses to Question 33 of the client survey. NOTES: All usable responses were weighted as described in Chapter 3 and in the Technical Appendix volume to
represent all emergency food clients of The Capital Area Food Bank of Texas, Inc. The sample sizes (N) also include missing data.
Missing, don’t know, and refusal responses combined are 0.0% for elderly clients at program sites, 0.0%
for households with seniors, 0.6% for households with children younger than 18, and 0.0% for households with children ages 0-5.

Hunger in America 2010 The Capital Area Food Bank of Texas, Inc (4408)
152 CH 7. CLIENTS: USE OF FOOD ASSISTANCE PROGRAMS
7.4 USE OF OTHER PROGRAMS
Clients also reported on other federal nutrition or child care programs they use. Table
7.4.1 shows the results.
TABLE 7.4.1
USE OF OTHER PROGRAMS
Other Program(s) Clients or Their Families Currently Participate Ina
Pantry Client Households
Kitchen Client Households
Shelter Client Households
All Client Households
Government Mass Distribution Program or TEFAP (cheese, butter, etc., not from pantries)b 49.1% 38.0% n.p. 43.3%
SAMPLE SIZE (N) 296 46 12 354
Senior nutrition sites, such as senior centers that serve lunch 7.6% N.A. N.A. 7.6%
Home-delivered meals or meals-on-wheels (usually for seniors or people with disabilities) 9.1% N.A. N.A. 9.1%
Senior brown-bag programs that give out groceries and produce 7.2% N.A. N.A. 7.2%
SAMPLE SIZE (N) – Households with at least one senior member age 65 or older 51 0 0 51
Special Supplemental Nutrition Program for Women, Infants, and Children (WIC) 53.3% n.p. N.A. 53.5%
SAMPLE SIZE (N) – Households with at least one child ages 0-3 years 58 3 0 61
Child day care 4.7% n.p. N.A. 7.0% Government assistance for child day care
among those using child day care 61.2% n.p. N.A. 75.5%
SAMPLE SIZE (N) – Households with at least one child ages 0-5 years 79 3 0 82
School lunch program 62.4% n.p. N.A. 64.4% School breakfast program 60.7% n.p. N.A. 62.8% After-school snack program 8.6% n.p. N.A. 7.8% Child care food program, such as meals at
subsidized child care centers 3.4% n.p. N.A. 4.2% Summer food program 7.8% n.p. N.A. 7.1% Backpack weekend food program 1.3% n.p. N.A. 1.1%
SAMPLE SIZE (N) – Households with at least one child younger than age 18 168 6 0 174

Hunger in America 2010 The Capital Area Food Bank of Texas, Inc (4408)
153 CH 7. CLIENTS: USE OF FOOD ASSISTANCE PROGRAMS
SOURCE: This table was constructed based on usable responses to questions 7a, 8, 39, and 41 of the client survey. NOTES: All usable responses were weighted as described in Chapter 3 and in the Technical Appendix volume to
represent all emergency food clients of The Capital Area Food Bank of Texas, Inc. The sample sizes (N) also include missing data.
aMultiple responses were accepted. bThe percentages of clients receiving food from these programs may be underestimated, as clients may not be aware of the exact source of the food they receive.
Among all client households, 43.3% participate in Government Mass Distribution
programs or TEFAP. Participation in other programs is as follows:
• Among the households with at least one senior member age 65 or older, 7.6% use senior nutrition sites; 9.1% use home-delivered meals or meals-on-wheels; and 7.2% participate in senior brown-bag programs.
• Among the households with at least one child younger than age 18, 64.4% and 62.8% benefit from the school lunch and the school breakfast program, respectively; 7.8% use an after-school snack program; 4.2% use a child care food program; and 7.1% participate in the summer food program, which provides free, nutritious meals and snacks to children throughout the summer months when they are out of school.
Clients with children who did not participate in the summer food program were asked the
reason that did not participate. Table 7.4.2 shows the results.
TABLE 7.4.2
NONPARTICIPATION IN THE SUMMER FOOD PROGRAM
Reason Children in Client Households Did Not Participatea
Pantry Client Households
Kitchen Client Households
Shelter Client Households
All Client Households
Didn’t know about it 35.0% n.p. N.A. 32.7% No site or program near client 6.5% n.p. N.A. 5.8% No transportation 5.2% n.p. N.A. 4.7% No need 16.9% n.p. N.A. 15.2% Enrolled in another program 0.0% n.p. N.A. 7.1% Do not qualify 1.9% n.p. N.A. 1.8% Other 34.5% n.p. N.A. 32.6%

Hunger in America 2010 The Capital Area Food Bank of Texas, Inc (4408)
154 CH 7. CLIENTS: USE OF FOOD ASSISTANCE PROGRAMS
Reason Children in Client Households Did Not Participatea
Pantry Client Households
Kitchen Client Households
Shelter Client Households
All Client Households
SAMPLE SIZE (N) – Households with at least one child younger than age 18 who did not participate in the summer food program 141 6 0 147
SOURCE: This table was constructed based on usable responses to questions 41 and 41a of the client survey. NOTES: All usable responses were weighted as described in Chapter 3 and in the Technical Appendix volume to
represent all emergency food clients of The Capital Area Food Bank of Texas, Inc. The sample sizes (N) also include missing data.
Missing, don’t know, and refusal responses combined are 7.6% for pantry clients, 1.4% for kitchen
clients, N.A. for shelter clients, and 7.0% for all clients. aMultiple responses were not accepted.
Reasons for not participating in the summer food program include:
• Among all households with at least one child younger than age 18, 32.7% said they did not know about the summer food program, 5.8% said there was no site or program near them, and 4.7% said they did not have transportation.
• Among all households with at least one child younger than age 18, 15.2% said they did not have a need to participate, while 1.8% said they did not qualify for the program.

Hunger in America 2010 The Capital Area Food Bank of Texas, Inc (4408)
155 CH 7. CLIENTS: USE OF FOOD ASSISTANCE PROGRAMS
7.5 GENERAL ASSISTANCE, WELFARE, AND TANF IN THE PREVIOUS TWO YEARS
Clients were asked whether they received General Assistance, welfare, or TANF in the
previous two years. Table 7.5.1 presents the results.
TABLE 7.5.1
GENERAL ASSISTANCE, WELFARE, AND TANF IN THE PREVIOUS TWO YEARS
Pantry Client Households
Kitchen Client Households
Shelter Client Households
All Client Households
Clients who received General Assistance, welfare, or TANF during the past two years
Yes 8.3% 2.9% n.p. 6.2% No 91.7% 97.1% n.p. 93.8% TOTAL 100.0% 100.0% n.p. 100.0%
SAMPLE SIZE (N) 296 46 12 354 SOURCE: This table was constructed based on usable responses to Question 26 of the client survey. NOTES: The percentages presented in this table are based only on usable responses, excluding missing, don't
know, and refusal responses. All usable responses were weighted as described in Chapter 3 and in the Technical Appendix volume to represent all emergency food clients of The Capital Area Food Bank of Texas, Inc. The sample sizes (N) also include missing data.
Missing, don’t know, and refusal responses combined are 7.7% for pantry clients, 0.0% for kitchen clients, 0.0% for shelter clients, and 5.3% for all clients.
During the previous two years, 6.2% of the clients received general assistance, welfare,
or TANF benefits.

Hunger in America 2010 The Capital Area Food Bank of Texas, Inc (4408)
156 CH 7. CLIENTS: USE OF FOOD ASSISTANCE PROGRAMS
7.6 GROCERY SHOPPING PATTERNS
Clients were asked where they do most of their grocery shopping. Results are shown in
Table 7.6.1.
TABLE 7.6.1
GROCERY SHOPPING PATTERNS
Where do you do most of your grocery shopping?
Adult Clients Who Pick Up
Food at a Pantry
Adult Clients at a Kitchen
Adult Clients at a Shelter
Adult Clients at All Program
Sites
Supermarkets or grocery stores 76.4% 68.9% n.p. 73.4%
Discount stores (e.g., Wal-Mart, Target, K-Mart) 18.8% 0.0% n.p. 12.7%
Warehouse clubs (e.g., Price Club, Costco, Pace, Sam’s Club, BJ’s) 0.0% 0.0% n.p. 1.8%
Convenience stores (e.g., 7-11, Quickshop, Wawa) 0.9% 2.5% n.p. 1.3%
Ethnic food stores (e.g., bodegas, Asian food markets, or Caribbean markets) 1.3% 0.0% n.p. 0.9%
Farmer’s market 0.1% 0.0% n.p. 0.0% Dollar stores 0.6% 0.0% n.p. 0.4% Some other place 1.8% 0.2% n.p. 1.7% Don’t know because someone else in
family shops 0.0% 0.2% n.p. 0.1% Don’t buy groceries, free food only 0.2% 28.1% n.p. 7.6% TOTAL 100.0% 100.0% n.p. 100.0%
SAMPLE SIZE (N) 296 46 12 354 SOURCE: This table was constructed based on usable responses to Question 38 of the client survey. NOTES: The percentages presented in this table are based only on usable responses, excluding missing, don't
know, and refusal responses. All usable responses were weighted as described in Chapter 3 and in the Technical Appendix volume to represent all emergency food clients of The Capital Area Food Bank of Texas, Inc. The sample sizes (N) also include missing data.
Missing, don’t know, and refusal responses combined are 4.9% for pantry clients, 0.1% for kitchen clients, 0.0% for shelter clients, and 3.4% for all clients.
Among all clients, 73.4% shop mostly at supermarkets or grocery stores. Information
about other places where some of the clients do most their grocery shopping follows:
Hunger in America 2010 The Capital Area Food Bank of Texas, Inc (4408)
157 CH 7. CLIENTS: USE OF FOOD ASSISTANCE PROGRAMS
• 12.7% of the clients shop mostly at discount stores such as Wal-Mart, Target, or K-Mart.
• 0.4% of the clients use dollar stores for most of their grocery shopping.
• 1.3% of the clients use convenience stores for most of their grocery shopping.
• 7.6% of the clients do not buy groceries. They rely only on free food.


Hunger in America 2010 The Capital Area Food Bank of Texas, Inc (4408)
159 CH 8. CLIENTS: HEALTH STATUS
8. CLIENTS: HEALTH STATUS
Health status can be an important determinant of overall household circumstances and
need. Therefore, the survey asked clients for information on the health of both themselves and
other household members. The responses to these questions are presented below. In addition,
data are presented on clients’ access to health insurance and health care.
8.1 HEALTH STATUS
Clients were asked to indicate their health status, then to indicate whether anyone else in
their household was in poor health. Table 8.1.1 summarizes the results.
TABLE 8.1.1
HEALTH STATUS
Adult Clients Who Pick Up
Food at a Pantry Adult Clients at
a Kitchen Adult Clients at
a Shelter
Adult Clients at All Program
Sites
Clients who indicated that their health was…
Excellent 11.6% 4.3% n.p. 11.9% Very good 9.0% 8.0% n.p. 7.8% Good 23.7% 32.3% n.p. 24.1% Fair 40.1% 46.5% n.p. 43.4% Poor 15.6% 9.0% n.p. 12.9% TOTAL 100.0% 100.0% n.p. 100.0%
Clients who indicated that someone else in the household was in poor health
Yes 20.6% 0.2% n.p. 14.2% No 57.2% 66.8% n.p. 52.8% Live alone 22.2% 33.0% n.p. 33.0% TOTAL 100.0% 100.0% n.p. 100.0%
Households with at least one member reported to be in poor health 30.5% 9.2% n.p. 23.2%
SAMPLE SIZE (N) 296 46 12 354

Hunger in America 2010 The Capital Area Food Bank of Texas, Inc (4408)
160 CH 8. CLIENTS: HEALTH STATUS
SOURCE: This table was constructed based on usable responses to questions 20 and 21 of the client survey. NOTES: The percentages presented in this table are based only on usable responses, excluding missing, don’t
know, and refusal responses. All usable responses were weighted as described in Chapter 3 and in the Technical Appendix volume to represent all emergency food clients of The Capital Area Food Bank of Texas, Inc. The sample sizes (N) also include missing data.
For clients reporting about their own health, missing, don’t know, and refusal responses combined are 1.7% for pantry clients, 0.0% for kitchen clients, 0.0% for shelter clients, and 1.2% for all clients. For clients reporting about the health of other household members, missing, don’t know, and refusal responses combined are 1.4% for pantry clients, 0.0% for kitchen clients, 0.0% for shelter clients, and 0.9% for all clients.
Overall, 12.9% of the clients at all program sites are in poor health, and 23.2% of the
client households have one or more members in poor health. More details follow:
• Among pantry clients, 11.6% were in excellent health, 9.0% in very good health, 23.7% in good health, 40.1% in fair health, and 15.6% in poor health.
• Among kitchen clients, 4.3% were in excellent health, 8.0% in very good health, 32.3% in good health, 46.5% in fair health, and 9.0% in poor health.
• Among shelter clients, n.p. were in excellent health, n.p. in very good health, n.p. in good health, n.p. in fair health, and n.p. in poor health
• 30.5% of the pantry client households had at least one person in poor health.
• 9.2% of the kitchen client households had at least one person in poor health.
• n.p. of the shelter client households had at least one person in poor health.

Hunger in America 2010 The Capital Area Food Bank of Texas, Inc (4408)
161 CH 8. CLIENTS: HEALTH STATUS
CHART 8.1.1 HOUSEHOLDS WITH AT LEAST ONE MEMBER REPORTED TO BE IN POOR HEALTH
By Program Type
30.5%
9.2%
3.2%
0.0%
5.0%
10.0%
15.0%
20.0%
25.0%
30.0%
35.0%
Pantry client households Kitchen client households Shelter client households
Per
cen
tag
e o
f H
ou
seh
old
s
Note: Charts corresponding to tables that contain values of "n.p." or "N.A." (see section 3.7) may display the
suppressed numbers in place of "n.p" or "N.A". This is due to the limitation of the computer system used to generate the member-level reports. The parts of the chart for which this is true should be ignored.

Hunger in America 2010 The Capital Area Food Bank of Texas, Inc (4408)
162 CH 8. CLIENTS: HEALTH STATUS
8.2 HEALTH INSURANCE AND ACCESS TO MEDICAL CARE
Clients were asked whether they or anyone in their households had various kinds of
health insurance. Clients also indicated whether they had unpaid medical or hospital bills and
whether they had been refused medical care during the previous 12 months. Results are provided
in Table 8.2.1.
TABLE 8.2.1
HEALTH INSURANCE AND ACCESS TO MEDICAL CARE
Adult Clients Who Pick Up
Food at a Pantry
Adult Clients at a Kitchen
Adult Clients at a Shelter
Adult Clients at All Program
Sites
Client or his or her family with following types of health insurancea
Medicareb 29.6% 22.1% n.p. 25.4% State Medical Assistance Program or
Medicaid 45.2% 34.4% n.p. 38.0% State Children’s Health Insurance
Program (SCHIP) 6.9% 12.9% n.p. 7.3% Veterans Administration (VA) benefits 5.3% 3.2% n.p. 4.3% Private health insurance 11.6% 13.9% n.p. 10.7% Other health insurancec 6.8% 6.7% n.p. 12.5% No insurance 26.5% 39.5% n.p. 30.4%
Clients who had unpaid medical or hospital bills
Yes 49.2% 46.9% n.p. 44.5% No 50.8% 53.1% n.p. 55.5% TOTAL 100.0% 100.0% n.p. 100.0%
Clients who had been refused medical care because they could not pay or because they had a Medicaid or Medical Assistance card during the previous 12 months
Yes 9.6% 1.6% n.p. 7.4% No 89.2% 96.7% n.p. 91.1% Not refused care, but avoid providers
who don’t accept medical assistance 1.3% 1.3% n.p. 1.4% Not refused care, but finding providers
that accept medical assistance is a problem 0.0% 0.4% n.p. 0.1%
TOTAL 100.0% 100.0% n.p. 100.0%
Hunger in America 2010 The Capital Area Food Bank of Texas, Inc (4408)
163 CH 8. CLIENTS: HEALTH STATUS
Adult Clients Who Pick Up
Food at a Pantry
Adult Clients at a Kitchen
Adult Clients at a Shelter
Adult Clients at All Program
Sites
SAMPLE SIZE (N) 296 46 12 354 SOURCE: This table was constructed based on usable responses to questions 22a-f, 23, and 24 of the client survey. NOTES: The percentages presented in this table are based only on usable responses, excluding missing, don’t
know, and refusal responses. All usable responses were weighted as described in Chapter 3 and in the Technical Appendix volume to represent all emergency food clients of The Capital Area Food Bank of Texas, Inc. The sample sizes (N) also include missing data.
For the survey item addressing types of health insurance, missing, don’t know, and refusal responses combined are 2.0% for pantry clients, 0.0% for kitchen clients, 0.0% for shelter clients, and 1.4% for all clients. For the survey item addressing unpaid medical bills, missing, don’t know, and refusal responses combined are 2.4% for pantry clients, 3.3% for kitchen clients, 0.0% for shelter clients, and 2.3% for all clients. For the survey item addressing refused medical care, missing, don’t know, and refusal responses combined are 1.7% for pantry clients, 4.5% for kitchen clients, 0.0% for shelter clients, and 2.1% for all clients.
aMultiple responses were accepted. bAt the national level, the percentage of people who reported having Medicare coverage is substantially larger than what appears to be appropriate considering the percentage of households with seniors. One possible explanation for the discrepancy is widespread confusion between Medicare and Medicaid programs. cThis category includes government retirement benefits and military health system (TRICARE).
Findings presented in Table 8.2.1 include:
• 26.5% of the pantry, 39.5% of the kitchen, and n.p. of the shelter clients or their households are without health insurance. This accounts for 30.4% of all clients.
• 44.5% of the clients have unpaid medical or hospital bills.
• 7.4% of the clients report that they have been refused medical care because they could not pay or because they had a Medicaid or Medical Assistance card during the previous 12 months.

Hunger in America 2010 The Capital Area Food Bank of Texas, Inc (4408)
164 CH 8. CLIENTS: HEALTH STATUS
CHART 8.2.1 HEALTH INSURANCEAmong All Clients
25.4%
38.0%
7.3%
4.3%
10.7%
12.5%
30.4%
0.0%
5.0%
10.0%
15.0%
20.0%
25.0%
30.0%
35.0%
40.0%
Medicare Medicaid SCHIP VA Private Other No insurance
Health Insurance
Per
cen
tag
e o
f H
ou
seh
old
s
Note: Charts corresponding to tables that contain values of "n.p." or "N.A." (see section 3.7) may display the
suppressed numbers in place of "n.p" or "N.A". This is due to the limitation of the computer system used to generate the member-level reports. The parts of the chart for which this is true should be ignored.

Hunger in America 2010 The Capital Area Food Bank of Texas, Inc (4408)
165 CH 8. CLIENTS: HEALTH STATUS
Table 8.2.1 showed that 38.0% of all adult clients participate in the State Medical
Assistance Program or Medicaid. In Table 8.2.2, we examine how participation in the Medicaid
program is associated with income relative to the federal poverty level.
TABLE 8.2.2
INCOME IN 2008, BY MEDICAID PARTICIPATION STATUS
Client Household Receiving Medicaid Benefits?
Income in 2008 as Percentage of Federal Poverty Levela
All Clients Yes No
0% (no income) 13.8% 4.7% 19.9% 1%-50% 29.8% 33.1% 27.6% 51%-75% 18.5% 23.1% 15.4% 76%-100% 17.5% 27.3% 10.9% 101%-130% 7.6% 8.3% 7.1% SUBTOTAL 87.1% 96.5% 80.8% 131%-150% 2.9% 2.6% 3.1% 151%-185% 2.5% 0.7% 3.6% 186% or higher 7.6% 0.2% 12.5% SUBTOTAL 12.9% 3.5% 19.2%
TOTAL 100.0% 100.0% 100.0%
SAMPLE SIZE (N) 324 128 196
SOURCE: This table was constructed based on usable responses to questions 22b and 29 of the client survey. NOTES: The percentages presented in this table are based only on usable responses, excluding missing, don’t
know, and refusal responses. All usable responses were weighted as described in Chapter 3 and in the Technical Appendix volume to represent all emergency food clients of The Capital Area Food Bank of Texas, Inc. The sample sizes (N) also include missing data.
For all client income levels, missing, don’t know, and refusal responses combined are 7.4% for all clients, 0.9% for households receiving Medicaid benefits, and 6.5% for households not receiving Medicaid benefits.
aSee Table 5.8.1.1 for the federal poverty levels (and multiply by 12 to obtain annual levels).
Findings presented in Table 8.2.2 include:
• Among the client households receiving Medicaid benefits, 96.5% had income at or below 130% of the federal poverty level in 2008. In comparison, 80.8% of the clients not receiving Medicaid benefits had income at or below that level.

Hunger in America 2010 The Capital Area Food Bank of Texas, Inc (4408)
166 CH 8. CLIENTS: HEALTH STATUS
Table 8.2.1 showed that 30.4% of all adult clients do not have health insurance. In Table
8.2.3, we examine the association between income and being insured.
TABLE 8.2.3
INCOME IN 2008, BY UNINSURED STATUS
Client Household Health Insurance Status
Income in 2008 as Percentage of Federal Poverty Levela
All Clients Without Health Insurance With Health Insurance
0% (no income) 13.6% 14.7% 13.2% 1%-50% 29.7% 30.3% 29.5% 51%-75% 18.5% 20.3% 17.7% 76%-100% 17.8% 13.7% 19.4% 101%-130% 7.6% 6.8% 7.9% SUBTOTAL 87.2% 85.7% 87.8% 131%-150% 2.8% 2.6% 2.9% 151%-185% 2.6% 0.9% 3.2% 186% or higher 7.4% 10.8% 6.2% SUBTOTAL 12.8% 14.3% 12.2%
TOTAL 100.0% 100.0% 100.0%
SAMPLE SIZE (N) 335 84 251
SOURCE: This table was constructed based on usable responses to questions 22a-f and 29 of the client survey. NOTES: The percentages presented in this table are based only on usable responses, excluding missing, don’t
know, and refusal responses. All usable responses were weighted as described in Chapter 3 and in the Technical Appendix volume to represent all emergency food clients of The Capital Area Food Bank of Texas, Inc. The sample sizes (N) also include missing data.
For all client income levels, missing, don’t know, and refusal responses combined are 7.5% for all clients, 4.7% for households without medical insurance, and 2.8% for households receiving medical insurance.
aSee Table 5.8.1.1 for the federal poverty levels (and multiply by 12 to obtain annual levels).
We find that among client households without health insurance, 85.7% had income at or
below 130% of the federal poverty level in 2008. In comparison, 87.8% of the clients with
health insurance had income at or below that level.
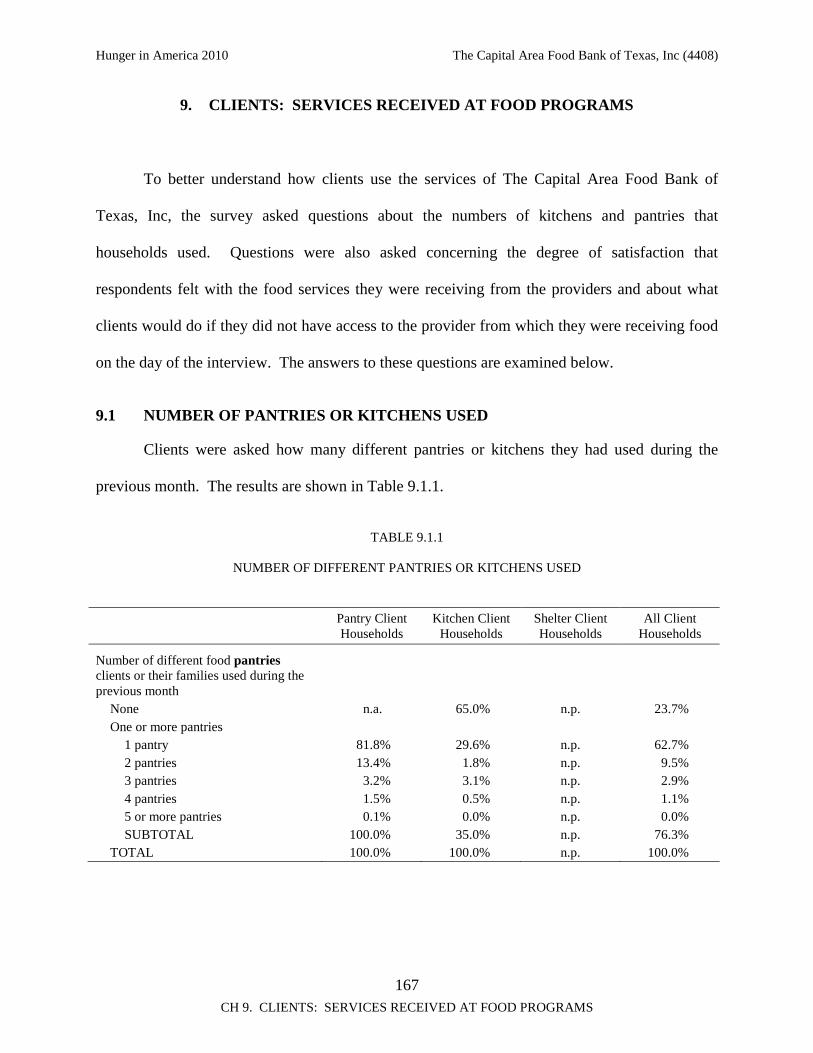
Hunger in America 2010 The Capital Area Food Bank of Texas, Inc (4408)
167 CH 9. CLIENTS: SERVICES RECEIVED AT FOOD PROGRAMS
9. CLIENTS: SERVICES RECEIVED AT FOOD PROGRAMS
To better understand how clients use the services of The Capital Area Food Bank of
Texas, Inc, the survey asked questions about the numbers of kitchens and pantries that
households used. Questions were also asked concerning the degree of satisfaction that
respondents felt with the food services they were receiving from the providers and about what
clients would do if they did not have access to the provider from which they were receiving food
on the day of the interview. The answers to these questions are examined below.
9.1 NUMBER OF PANTRIES OR KITCHENS USED
Clients were asked how many different pantries or kitchens they had used during the
previous month. The results are shown in Table 9.1.1.
TABLE 9.1.1
NUMBER OF DIFFERENT PANTRIES OR KITCHENS USED
Pantry Client Households
Kitchen Client Households
Shelter Client Households
All Client Households
Number of different food pantries clients or their families used during the previous month
None n.a. 65.0% n.p. 23.7% One or more pantries
1 pantry 81.8% 29.6% n.p. 62.7% 2 pantries 13.4% 1.8% n.p. 9.5% 3 pantries 3.2% 3.1% n.p. 2.9% 4 pantries 1.5% 0.5% n.p. 1.1% 5 or more pantries 0.1% 0.0% n.p. 0.0% SUBTOTAL 100.0% 35.0% n.p. 76.3%
TOTAL 100.0% 100.0% n.p. 100.0%

Hunger in America 2010 The Capital Area Food Bank of Texas, Inc (4408)
168 CH 9. CLIENTS: SERVICES RECEIVED AT FOOD PROGRAMS
Pantry Client Households
Kitchen Client Households
Shelter Client Households
All Client Households
Number of different soup kitchens clients or their families used during the previous month
None 91.3% n.a. n.p. 63.9% One or more kitchens
1 kitchen 4.3% 78.5% n.p. 26.9% 2 kitchens 2.0% 11.9% n.p. 4.0% 3 kitchens 0.6% 4.9% n.p. 2.6% 4 kitchens 0.7% 4.7% n.p. 1.6% 5 or more kitchens 1.2% 0.0% n.p. 1.0% SUBTOTAL 8.7% 100.0% n.p. 36.1%
TOTAL 100.0% 100.0% n.p. 100.0%
SAMPLE SIZE (N) 296 46 12 354 SOURCE: This table was constructed based on usable responses to questions 56 and 57a of the client survey. NOTES: The percentages presented in this table are based only on usable responses, excluding missing, don’t
know, and refusal responses. All usable responses were weighted as described in Chapter 3 and in the Technical Appendix volume to represent all emergency food clients of The Capital Area Food Bank of Texas, Inc. The sample sizes (N) also include missing data.
For survey responses about pantries used, missing, don’t know, and refusal responses combined are 3.6% for pantry clients, 0.0% for kitchen clients, 2.9% for shelter clients, and 2.8% for all clients. For survey responses about kitchens used, missing, don’t know, and refusal responses combined are 4.6% for pantry clients, 0.0% for kitchen clients, 2.9% for shelter clients, and 3.5% for all clients.
Among the pantry clients, 81.8% used just one food pantry during the previous month.
More information on the clients’ use of the emergency food programs follows:
• 78.5% of the kitchen clients used only one soup kitchen, and 35.0% also used one or more pantries.
• n.p. of the shelter clients used one or more pantries, and n.p. of the shelter clients also used one or more kitchens.
• 8.7% of the pantry clients also used one or more kitchens.

Hunger in America 2010 The Capital Area Food Bank of Texas, Inc (4408)
169 CH 9. CLIENTS: SERVICES RECEIVED AT FOOD PROGRAMS
9.2 SATISFACTION WITH SERVICES AT FOOD PROGRAMS
Clients were asked how satisfied they were with the amount, variety, and overall quality
of food provided at the emergency food programs. Clients were also asked how often they were
treated with respect by the staff of those programs. Table 9.2.1 summarizes the findings.
TABLE 9.2.1
SATISFACTION WITH SERVICES AT FOOD PROGRAMS
Level of Satisfaction with Various Aspects of the Service Provided to Clients or Others in the Household:
Adult Clients Who Pick Up
Food at a Pantry
Adult Clients at a Kitchen
Adult Clients at a Shelter
Adult Clients at All Program
Sites
Amount of food provided Very satisfied 58.1% 12.1% n.p. 53.3% Somewhat satisfied 35.9% 72.0% n.p. 38.7% Somewhat dissatisfied 4.8% 12.8% n.p. 6.5% Very dissatisfied 1.3% 3.2% n.p. 1.5% TOTAL 100.0% 100.0% n.p. 100.0%
Variety of food provided
Very satisfied 55.9% 8.7% n.p. 49.7% Somewhat satisfied 36.5% 38.7% n.p. 32.1% Somewhat dissatisfied 5.8% 15.5% n.p. 7.9% Very dissatisfied 1.9% 37.2% n.p. 10.3% TOTAL 100.0% 100.0% n.p. 100.0%
Overall quality of food provided
Very satisfied 56.9% 8.9% n.p. 50.5% Somewhat satisfied 35.2% 42.1% n.p. 32.9% Somewhat dissatisfied 7.9% 13.4% n.p. 10.0% Very dissatisfied 0.0% 35.7% n.p. 6.6% TOTAL 100.0% 100.0% n.p. 100.0%
Frequency with which clients are treated with respect by the staff who distribute food
All of the time 77.3% 40.3% n.p. 72.0% Most of the time 8.6% 12.0% n.p. 8.5% Some of the time 3.3% 28.5% n.p. 8.1% Never 0.0% 0.0% n.p. 0.0% Never came before 10.9% 19.2% n.p. 11.4% TOTAL 100.0% 100.0% n.p. 100.0%

Hunger in America 2010 The Capital Area Food Bank of Texas, Inc (4408)
170 CH 9. CLIENTS: SERVICES RECEIVED AT FOOD PROGRAMS
Level of Satisfaction with Various Aspects of the Service Provided to Clients or Others in the Household:
Adult Clients Who Pick Up
Food at a Pantry
Adult Clients at a Kitchen
Adult Clients at a Shelter
Adult Clients at All Program
Sites
SAMPLE SIZE (N) 296 46 12 354 SOURCE: This table was constructed based on usable responses to questions 53 and 54 of the client survey. NOTES: The percentages presented in this table are based only on usable responses, excluding missing, don’t
know, and refusal responses. All usable responses were weighted as described in Chapter 3 and in the Technical Appendix volume to represent all emergency food clients of The Capital Area Food Bank of Texas, Inc. The sample sizes (N) also include missing data.
For the first indicator of client satisfaction in the table, missing, don’t know, and refusal responses combined are 17.2% for pantry clients, 22.4% for kitchen clients, 0.0% for shelter clients, and 16.4% for all clients. For the second indicator of client satisfaction in the table, missing, don’t know, and refusal responses combined are 17.0% for pantry clients, 22.5% for kitchen clients, 0.0% for shelter clients, and 16.3% for all clients. For the third indicator of client satisfaction in the table, missing, don’t know, and refusal responses combined are 18.3% for pantry clients, 23.8% for kitchen clients, 0.0% for shelter clients, and 1.3% for all clients. For the fourth indicator of client satisfaction in the table, missing, don’t know, and refusal responses combined are 3.7% for pantry clients, 0.0% for kitchen clients, 0.0% for shelter clients, and 2.5% for all clients.
Across all three kinds of emergency food programs, the level of satisfaction among
clients is high. 92.1% are either very satisfied or somewhat satisfied with the amount of the food
they receive at the programs. Client satisfaction with specific aspects of the programs follows:
• 81.8% of the clients are either very satisfied or somewhat satisfied with the variety of the food.
• 83.4% of the clients are either very satisfied or somewhat satisfied with overall quality of the food.
• 72.0% of the clients say that they are treated with respect by the staff all the time.

Hunger in America 2010 The Capital Area Food Bank of Texas, Inc (4408)
171 CH 9. CLIENTS: SERVICES RECEIVED AT FOOD PROGRAMS
CHART 9.2.1 SATISFACTION WITH FOOD PROVIDEDBy Program Type
94.0%
84.1%
93.6%92.4%
47.4%
75.7%
92.1%
51.0%
83.9%
0.0%
10.0%
20.0%
30.0%
40.0%
50.0%
60.0%
70.0%
80.0%
90.0%
100.0%
Adult clients who pick up food at the pantry Adult clients at the kitchen Adult clients at the shelter
Satisfied with Food Provided
Per
cen
tag
e o
f R
esp
on
den
ts
"Very Satisfied" or "Somewhat Satisfied" with amount of food "Very Satisfied" or "Somewhat Satisfied" with variety of food
"Very Satisfied" or "Somewhat Satisfied" with overall quality of food
Note: Charts corresponding to tables that contain values of "n.p." or "N.A." (see section 3.7) may display the
suppressed numbers in place of "n.p" or "N.A". This is due to the limitation of the computer system used to generate the member-level reports. The parts of the chart for which this is true should be ignored.
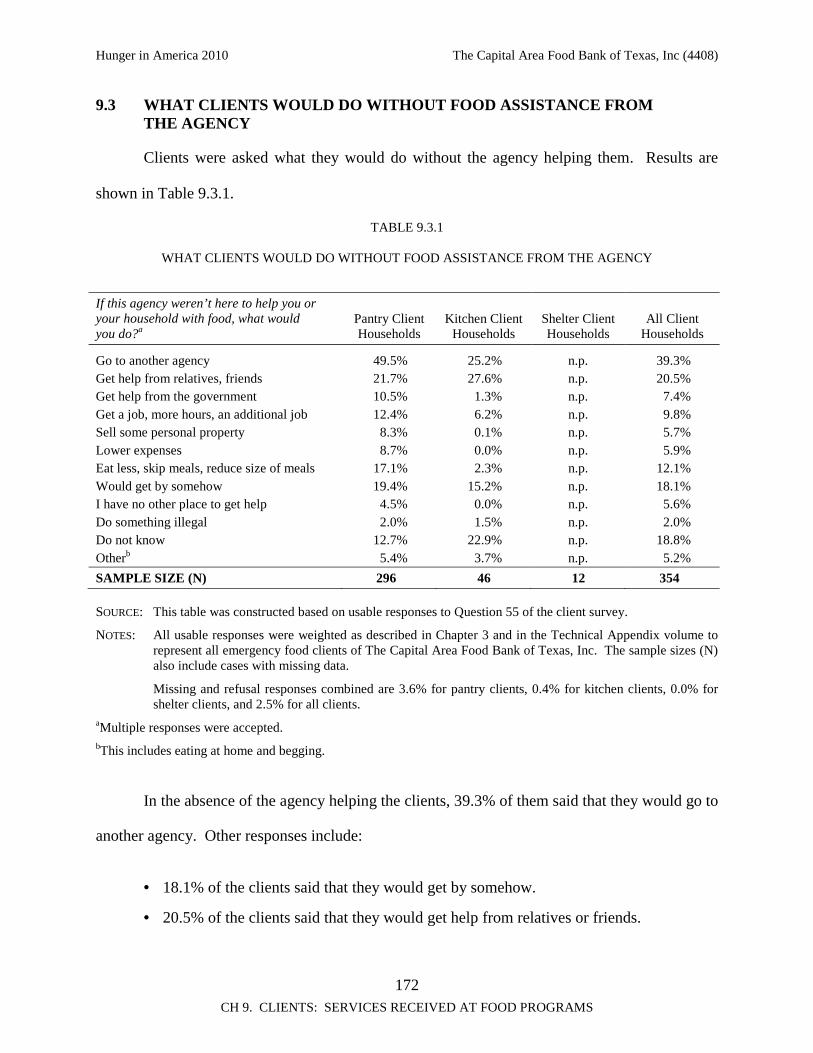
Hunger in America 2010 The Capital Area Food Bank of Texas, Inc (4408)
172 CH 9. CLIENTS: SERVICES RECEIVED AT FOOD PROGRAMS
9.3 WHAT CLIENTS WOULD DO WITHOUT FOOD ASSISTANCE FROM THE AGENCY
Clients were asked what they would do without the agency helping them. Results are
shown in Table 9.3.1.
TABLE 9.3.1
WHAT CLIENTS WOULD DO WITHOUT FOOD ASSISTANCE FROM THE AGENCY
If this agency weren’t here to help you or your household with food, what would you do?a
Pantry Client Households
Kitchen Client Households
Shelter Client Households
All Client Households
Go to another agency 49.5% 25.2% n.p. 39.3% Get help from relatives, friends 21.7% 27.6% n.p. 20.5% Get help from the government 10.5% 1.3% n.p. 7.4% Get a job, more hours, an additional job 12.4% 6.2% n.p. 9.8% Sell some personal property 8.3% 0.1% n.p. 5.7% Lower expenses 8.7% 0.0% n.p. 5.9% Eat less, skip meals, reduce size of meals 17.1% 2.3% n.p. 12.1% Would get by somehow 19.4% 15.2% n.p. 18.1% I have no other place to get help 4.5% 0.0% n.p. 5.6% Do something illegal 2.0% 1.5% n.p. 2.0% Do not know 12.7% 22.9% n.p. 18.8% Otherb 5.4% 3.7% n.p. 5.2%
SAMPLE SIZE (N) 296 46 12 354 SOURCE: This table was constructed based on usable responses to Question 55 of the client survey.
NOTES: All usable responses were weighted as described in Chapter 3 and in the Technical Appendix volume to represent all emergency food clients of The Capital Area Food Bank of Texas, Inc. The sample sizes (N) also include cases with missing data.
Missing and refusal responses combined are 3.6% for pantry clients, 0.4% for kitchen clients, 0.0% for shelter clients, and 2.5% for all clients.
aMultiple responses were accepted. bThis includes eating at home and begging.
In the absence of the agency helping the clients, 39.3% of them said that they would go to
another agency. Other responses include:
• 18.1% of the clients said that they would get by somehow.
• 20.5% of the clients said that they would get help from relatives or friends.

Hunger in America 2010 The Capital Area Food Bank of Texas, Inc (4408)
173 CH 9. CLIENTS: SERVICES RECEIVED AT FOOD PROGRAMS
• 12.1% of the clients said that they would eat less, skip meals, or reduce the size of meals.
CHART 9.3.1 WHAT CLIENTS WOULD DO WITHOUT FOOD ASSISTANCE FROM THE AGENCY
All Clients
39.3%
20.5%
7.4%
9.8%
5.7%
5.9%
12.1%
18.1%
5.6%
2.0%
18.8%
5.2%
0.0% 5.0% 10.0% 15.0% 20.0% 25.0% 30.0% 35.0% 40.0% 45.0%
Go to another agency
Get help from relatives, friends
Get help from the government
Get a job, more hours, an additional job
Sell some personal property
Lower expenses
Eat less, skip meals, reduce size of meals
Would get by somehow
I have no other place to get help
Do something illegal
Do not know
Other
Op
tio
ns
Percentage of Clients
Note: Charts corresponding to tables that contain values of "n.p." or "N.A." (see section 3.7) may display the
suppressed numbers in place of "n.p" or "N.A". This is due to the limitation of the computer system used to generate the member-level reports. The parts of the chart for which this is true should be ignored.


Hunger in America 2010 The Capital Area Food Bank of Texas, Inc (4408)
175 CH 10. AGENCIES AND FOOD PROGRAMS: PROFILES
10. AGENCIES AND FOOD PROGRAMS: PROFILES
Until now, the discussion has focused on information from the client survey. This
chapter begins the presentation of the results from the survey of agencies affiliated with The
Capital Area Food Bank of Texas, Inc. The first section below details the numbers of responses
received from various types of agencies. Next we present information on what combinations of
programs are operated by the responding agencies. Subsequent sections examine characteristics
of emergency food programs operated by these agencies, such as years of program operation,
services provided other than food distribution, and types of organizations. Agency estimates of
the changes in their numbers of clients between 2005 and 2009 are also presented.
10.1 PARTICIPATING AGENCIES AND PROGRAMS REPRESENTED
The agency survey questionnaire was sent to 325 agencies affiliated with The Capital
Area Food Bank of Texas, Inc. Each agency was asked to provide detailed information about
one of each type of emergency food programs it operates (such as one pantry, one kitchen, and
one shelter). Agencies operating nonemergency food programs only (referred to as “other
programs”) were asked to answer several general questions only.
Of the agencies that received the questionnaire, 257 agencies completed the survey.
Among those that completed the survey, 207 operate one or more emergency programs, and the
remaining agencies operate other nonemergency food programs. Those 257 responding agencies

Hunger in America 2010 The Capital Area Food Bank of Texas, Inc (4408)
176 CH 10. AGENCIES AND FOOD PROGRAMS: PROFILES
reported on 457 programs,25 of which 54.1% are emergency food programs. Table 10.1.1 shows
the breakdown of the participating agencies by the type of program they operate.
TABLE 10.1.1
PROGRAMS REPORTED ON BY PARTICIPATING AGENCIES, BY PROGRAM TYPE
Program Type Number Unweighted Percentage Unweighted Percentage Excluding “Other” Type
Pantry 187 40.4% 74.8% Kitchen 30 6.8% 12.6% Shelter 30 6.8% 12.6% Othera 210 45.9% n.a. TOTALb 457 100.0% 100.0% aOther programs refer to nonemergency food programs. They are programs that have a primary purpose other than emergency food distribution but also distribute food. Examples include day care programs, senior congregate-feeding programs, and summer camps. bThis is the number of programs about which agencies provide detailed or some information. The total number of programs operated by these agencies is larger.
Among the total of 457 programs reported on by the agencies, 40.4% are pantries, 6.8%
are kitchens, and 6.8% are shelters. The remaining 45.9% are other nonemergency food
programs, such as child day care, senior-congregate feeding programs, and summer camps.
Excluding other nonemergency food programs makes the percentage breakdown
74.8% pantries, 12.6% kitchens, and 12.6% shelters.
25 There are more programs than agencies, because agencies often run two or more programs of different
types.

Hunger in America 2010 The Capital Area Food Bank of Texas, Inc (4408)
177 CH 10. AGENCIES AND FOOD PROGRAMS: PROFILES
CHART 10.1.1 PERCENTAGE OF PARTICIPATING PROGRAMSBy Program Type
Pantry40%
Kitchen7%Shelter
7%
Other46%
Pantry Kitchen Shelter Other
Note: Charts corresponding to tables that contain values of "n.p." or "N.A." (see section 3.7) may display the
suppressed numbers in place of "n.p" or "N.A". This is due to the limitation of the computer system used to generate the member-level reports. The parts of the chart for which this is true should be ignored.

Hunger in America 2010 The Capital Area Food Bank of Texas, Inc (4408)
178 CH 10. AGENCIES AND FOOD PROGRAMS: PROFILES
10.2 NUMBER OF PROGRAMS OPERATED BY AGENCIES
Percentages of the agencies operating various types of programs, as well as the total
number of programs operated of each program type, are shown in Table 10.2.1.
TABLE 10.2.1
NUMBER OF PROGRAMS OPERATED BY AGENCIES
Percentage of All Agencies That Operate the Specified Number of Each Program Type
Number of Programs of Each Type Operated by Agencies
Agencies with Pantries
Agencies with Kitchens
Agencies with Shelters
Agencies with Others
1 95.7% 93.3% 89.9% 95.7% 2 3.3% 3.3% 6.7% 1.4% 3 or more 1.1% 3.4% 3.4% 2.9% TOTAL 100.0% 100.0% 100.0% 100.0%
SAMPLE SIZE (N) – Agencies with at least one program for each program type 187 30 30 210
Total number of participating agencies 257
Total number of programs reported on by participating agencies 457
SOURCE: This table was constructed based on usable responses to Question 1 of the agency survey.
Among the participating agencies, 187 operate at least one pantry program, 30 at least
one kitchen program, and 30 at least one shelter program. A total of 257 agencies provided
information about 457 programs.

Hunger in America 2010 The Capital Area Food Bank of Texas, Inc (4408)
179 CH 10. AGENCIES AND FOOD PROGRAMS: PROFILES
10.3 AGENCIES OPERATING VARIOUS TYPES OF PROGRAMS
Table 10.3.1 shows the distribution of agencies by types of programs they operate.
TABLE 10.3.1
AGENCIES OPERATING VARIOUS TYPES OF PROGRAMS
Combinations of Programs the Agency Operates Agencies
Pantry only 6.2% Kitchen only 0.8% Shelter only 2.4% Other program only 19.9% Pantry and Kitchen 2.0% Kitchen and Shelter 0.0% Shelter and Pantry 2.3% Pantry and Other 54.3% Kitchen and Other 2.0% Shelter and Other 2.4% Pantry, Kitchen, and Shelter 4.5% Pantry, Kitchen, and Other 2.3% Kitchen, Shelter, and Other 0.4% Shelter, Pantry, and Other 0.0% Pantry, Kitchen, Shelter, and Other 0.0% Unknown 0.4% TOTAL 100.0%
SAMPLE SIZE (N) – Total number of participating agencies 257 SOURCE: This table was constructed based on responses to Question 1 of the agency survey.
As Table 10.3.1 shows, 6.2% of the participating agencies exclusively operate one or
more pantries, while 0.8% and 2.4% operate exclusively kitchen or shelter programs,
respectively.
10.4 LENGTH OF PROGRAM OPERATION
Responding agencies identified the year their emergency food programs opened. Table
10.4.1 shows the distribution of the length of program operation.

Hunger in America 2010 The Capital Area Food Bank of Texas, Inc (4408)
180 CH 10. AGENCIES AND FOOD PROGRAMS: PROFILES
TABLE 10.4.1
LENGTH OF PROGRAM OPERATION
Percentage of Programs That Have Operated
for a Specified Period
How Long the Program Has Been Operatinga Pantry Programs Kitchen Programs Shelter Programs
Agencies with Pantry, Kitchen,
or Shelter
2 years or less 11.6% 5.7% 0.0% 10.7% 3-4 years 10.8% 5.7% 0.0% 9.4%
5-6 years 13.5% 0.0% 0.0% 11.6%
7-10 years 21.0% 43.8% 22.2% 23.0% 11-20 years 24.9% 11.2% 39.1% 24.6%
21-30 years 10.1% 16.9% 33.2% 13.6%
More than 30 years 8.2% 16.7% 5.5% 7.1%
TOTAL 100.0% 100.0% 100.0% 100.0%
SAMPLE SIZE (N) 187 30 30 207
Average length of operation among valid responses (in years) 13 19 19 13
Median length of operation among valid responses (in years) 9 10 17 10
SAMPLE SIZE (N) 148 18 18 170
SOURCE: This table was constructed based on usable responses to Question 3b of the agency survey. NOTES: The percentages presented in this table are based only on usable responses, excluding missing, don’t
know, and refusal responses. All usable responses were weighted as described in Chapter 3 and in the Technical Appendix volume to represent all emergency food programs of The Capital Area Food Bank of Texas, Inc. The sample sizes (N) also include missing data.
Missing, don’t know, and refusal responses combined are 21.1% for pantry programs, 40.4% for kitchen programs, 40.1% for shelter programs, and 18.0% for all agencies.
aFor all programs, responses greater than 70 years of operation were recoded as 70 years. Responses less than 1 year were recoded as 1 year.
The average length of operation among the pantry programs is 13 years. It is 19 years for
the kitchens and 19 years for the shelter programs. Details follow:
• 11.6% of the pantries, 5.7% of the kitchens, and 0.0% of the shelters have been operating for two years or less.

Hunger in America 2010 The Capital Area Food Bank of Texas, Inc (4408)
181 CH 10. AGENCIES AND FOOD PROGRAMS: PROFILES
• 24.9% of the pantries, 11.2% of the kitchens, and 39.1% of the shelters have been operating for 11 to 20 years.
• 10.1% of the pantries, 16.9% of the kitchens, and 33.2% of the shelters have been operating for 21 to 30 years.
• 8.2% of the pantries, 16.7% of the kitchens, and 5.5% of the shelters have been operating for more than 30 years.

Hunger in America 2010 The Capital Area Food Bank of Texas, Inc (4408)
182 CH 10. AGENCIES AND FOOD PROGRAMS: PROFILES
10.5 OTHER SERVICES OR FACILITIES PROVIDED IN ADDITION TO FOOD DISTRIBUTION
Agencies were provided with a list of additional possible services and asked which
services their programs provide to their clients. Table 10.5.1 shows what percentage of food
programs supply the services listed.
TABLE 10.5.1
OTHER SERVICES OR FACILITIES AGENCIES OR PROGRAMS PROVIDE IN ADDITION TO FOOD DISTRIBUTION, BY PROGRAM TYPE
Pantry Programs Kitchen Programs Shelter Programs
Food-related support Nutrition counseling 26.7% 35.6% 28.7% Eligibility counseling for WIC 19.1% 0.0% 23.4% Eligibility counseling for SNAP
benefits 44.0% 15.0% 37.8% Soup kitchen meals 9.3% n.a. 9.6% Food pantry bags n.a. 4.9% 9.2%
Client training
Employment training 18.6% 40.3% 47.3% Supported employment (Welfare to
Work or job training) 4.7% 5.1% 4.7% Retraining physically disabled 1.8% 4.9% 9.2% Retraining mentally ill/challenged 2.9% 15.3% 9.4%
Other assistance
Eligibility counseling for other government programs 13.9% 5.1% 28.8%
Legal services 4.7% 5.1% 28.2% Tax preparation help (Earned
Income Tax Credit) 10.4% 0.0% 0.0% Utility bill assistance (Low-Income
Heating and Energy Assistance Programs) 28.3% 5.1% 23.4%
Short-term financial assistance 23.3% 10.0% 33.0% Budget and credit counseling 17.5% 15.0% 37.6% Consumer protection 4.1% 5.1% 4.7% Information and referral 58.1% 34.7% 80.7% Language translation 19.8% 0.0% 37.8%

Hunger in America 2010 The Capital Area Food Bank of Texas, Inc (4408)
183 CH 10. AGENCIES AND FOOD PROGRAMS: PROFILES
Pantry Programs Kitchen Programs Shelter Programs
Housing services Short-term shelter 7.6% 19.8% 85.7% Subsidized housing assistance 11.7% 10.0% 37.6% Housing rehabilitation or repair 5.2% 0.0% 0.0%
Health and other services
Health services or health clinics 17.9% 25.3% 28.6% Transportation 15.8% 30.1% 80.9% Clothing 45.2% 19.9% 95.1% Furniture 19.2% 10.0% 51.8% Senior programs 11.6% 0.0% 4.7%
No additional services 15.2% 24.9% 4.9%
SAMPLE SIZE (N) 187 30 30 SOURCE: This table was constructed based on usable responses to Question 4 of the agency survey.
NOTES: All usable responses were weighted as described in Chapter 3 and in the Technical Appendix volume to represent all emergency food programs of The Capital Area Food Bank of Texas, Inc. The sample sizes (N) also include missing data.
Missing, don’t know, and refusal responses combined are 8.2% for pantry programs, 33.5% for kitchen programs, and 30.3% for shelter programs.
19.1% of pantries and 23.4% of shelters provide eligibility counseling for WIC. Other
services provided by the programs or the agencies include:
• 44.0% of the pantries, 15.0% of the kitchens, and 37.8% of the shelters provide eligibility counseling for SNAP benefits.
• 28.8% of the shelters provide counseling for other government programs.
• 28.3% of the pantries provide utility bill assistance.
• 58.1% of the pantries, 34.7% of the kitchens, and 80.7% of the shelters provide information and referral services.
• 47.3% of the shelters provide employment training.
• 17.9% of the pantries, 25.3% of the kitchens, and 28.6% of the shelters provide health services or health clinics.
• 80.9% of the shelters provide transportation.
• 45.2% of the pantries, 19.9% of the kitchens, and 95.1% of the shelters provide clothing.

Hunger in America 2010 The Capital Area Food Bank of Texas, Inc (4408)
184 CH 10. AGENCIES AND FOOD PROGRAMS: PROFILES
Table 10.5.2 shows the distribution of the number of additional services that emergency
food programs offer to their clients.
TABLE 10.5.2
NUMBER OF ADDITIONAL SERVICES, BY PROGRAM TYPE
Number of Additional Services or Facilities Provided by Programs Pantry Programs Kitchen Programs Shelter Programs
None 15.2% 24.9% 4.9% 1 15.8% 15.3% 0.0% 2-5 34.1% 44.7% 19.2% 6-10 26.2% 4.9% 43.0% More than 10 8.7% 10.2% 32.9% TOTAL 100.0% 100.0% 100.0%
SAMPLE SIZE (N) 187 30 30
Average number of additional services among those that provide at least one such service 4 3 8
Median number of additional services among those that provide at least one such service 3 2 9
SAMPLE SIZE (N) 172 20 21 SOURCE: This table was constructed based on usable responses to Question 4 of the agency survey. NOTES: The percentages presented in this table are based only on usable responses, excluding missing, don’t
know, and refusal responses. All usable responses were weighted as described in Chapter 3 and in the Technical Appendix volume to represent all emergency food programs of The Capital Area Food Bank of Texas, Inc. The sample sizes (N) also include missing data.
Missing, don’t know, and refusal responses combined are 8.2% for pantry programs, 33.5% for kitchen programs, and 30.3% for shelter programs.
On average, pantries provide 4 additional services or facilities. Kitchens and shelters
provide, on average, 3 and 8 additional services, respectively.
• 15.2% of pantry programs, 24.9% of kitchen programs, and 4.9% of shelter programs do not offer any other services or facilities.
• 15.8% of pantry programs, 15.3% of kitchen programs, and 0.0% of the shelter programs offer one additional service or facility.

Hunger in America 2010 The Capital Area Food Bank of Texas, Inc (4408)
185 CH 10. AGENCIES AND FOOD PROGRAMS: PROFILES
• 34.1% of pantry programs, 44.7% of kitchen programs, and 19.2% of shelter programs offer two to five additional services or facilities.
• 26.2% of pantry programs, 4.9% of kitchen programs, and 43.0% of shelter programs offer as many as 6 to 10 additional services or facilities.
• 8.7% of pantry programs, 10.2% of kitchen programs, and 32.9% of shelter programs offer more than 10 additional services or facilities.
In addition to other services provided by their programs, agencies were asked whether
they provide other facilities at the agency level for their clients. Table 10.5.3 summarizes the
results.
TABLE 10.5.3
OTHER FACILITIES AGENCIES PROVIDE IN ADDITION TO FOOD DISTRIBUTION, BY PROGRAM TYPE
Agencies with Pantry, Kitchen, or Shelter
Health clinic 5.7% Group home for physically/mentally disadvantaged 2.2% Other residential facility 7.2% Child day care program 4.4% Youth after school program 8.8% Summer camp serving low-income clients 2.2% Senior congregate feeding program 2.1% Commodity Supplemental Food Program (CSFP)a 2.1% Otherb 12.5% No other facilities/programs 74.7%
SAMPLE SIZE (N) 207 SOURCE: This table was constructed based on usable responses to Question 26 of the agency survey. NOTES: All usable responses were weighted as described in Chapter 3 and in the Technical Appendix volume to
represent all emergency food programs of The Capital Area Food Bank of Texas, Inc. The sample sizes (N) also include missing data.
Missing, don’t know, and refusal responses combined are 12.4%.
aFor states in which the CSFP was not offered, agencies most likely confused food received from TEFAP with food received from CSFP. bThis includes learning centers, food delivery services, and day programs for mentally disabled adults.

Hunger in America 2010 The Capital Area Food Bank of Texas, Inc (4408)
186 CH 10. AGENCIES AND FOOD PROGRAMS: PROFILES
As many as 5.7% of agencies also operate health clinics. Other facilities run by agencies
include:
• 2.2% of agencies run group homes for physically/mentally disadvantaged.
• 7.2% of agencies run other types of residential facilities.
• 4.4% of agencies run child day care programs.
• 8.8% of agencies run youth after-school programs.
• 2.2% of agencies run summer camps serving low-income clients.
• 2.1% of agencies run senior congregate-feeding programs.
• 2.1% of agencies run a Commodity Supplemental Food Program (CSFP).
• 12.5% of agencies run some other type of facility not mentioned above.

Hunger in America 2010 The Capital Area Food Bank of Texas, Inc (4408)
187 CH 10. AGENCIES AND FOOD PROGRAMS: PROFILES
10.6 TYPE OF AGENCY THAT OPERATES THE PROGRAM
Table 10.6.1 shows types of agencies operating each type of program.
TABLE 10.6.1
TYPE OF AGENCY THAT OPERATES THE PROGRAM
Type of Agency That Operates the Program
Pantry Programs
Kitchen Programs
Shelter Programs
Agencies with Pantry,
Kitchen, or Shelter All Agencies
Faith-based or religion-affiliated nonprofit 57.5% 43.4% 28.3% 54.6% 46.8%
Other private nonprofit 27.3% 36.3% 64.5% 30.5% 34.3% Governmental 10.0% 16.3% 7.3% 9.6% 8.5% Community Action
Program (CAP) 0.6% 0.0% 0.0% 0.5% 0.4% Othera 4.7% 4.1% 0.0% 4.8% 10.0% TOTAL 100.0% 100.0% 100.0% 100.0% 100.0%
SAMPLE SIZE (N) 187 30 30 207 257 SOURCE: This table was constructed based on usable responses to Question 27 of the agency survey. NOTES: The percentages presented in this table are based only on usable responses, excluding missing, don't
know, and refusal responses. All usable responses were weighted as described in Chapter 3 and in the Technical Appendix volume to represent all emergency food programs of The Capital Area Food Bank of Texas, Inc. The sample sizes (N) also include missing data.
Missing, don’t know, and refusal responses combined are 7.6% for pantry programs, 16.8% for kitchen programs, 6.4% for shelter programs, 8.9% for agencies with pantry, kitchen, or shelter programs, and 8.3% for all agencies.
aThis includes various community-based organizations.
Table 10.6.1 shows that 57.5% of the pantries, 43.4% of the kitchens, and 28.3% of the
shelters are run by faith-based or religion-affiliated nonprofit agencies. In addition:
• 10.0% of the pantries, 16.3% of the kitchens, and 7.3% of the shelters are run by government-affiliated agencies.
• The remaining agencies are operated by other kinds of private nonprofit organizations, such as community-based charities or philanthropic organizations.
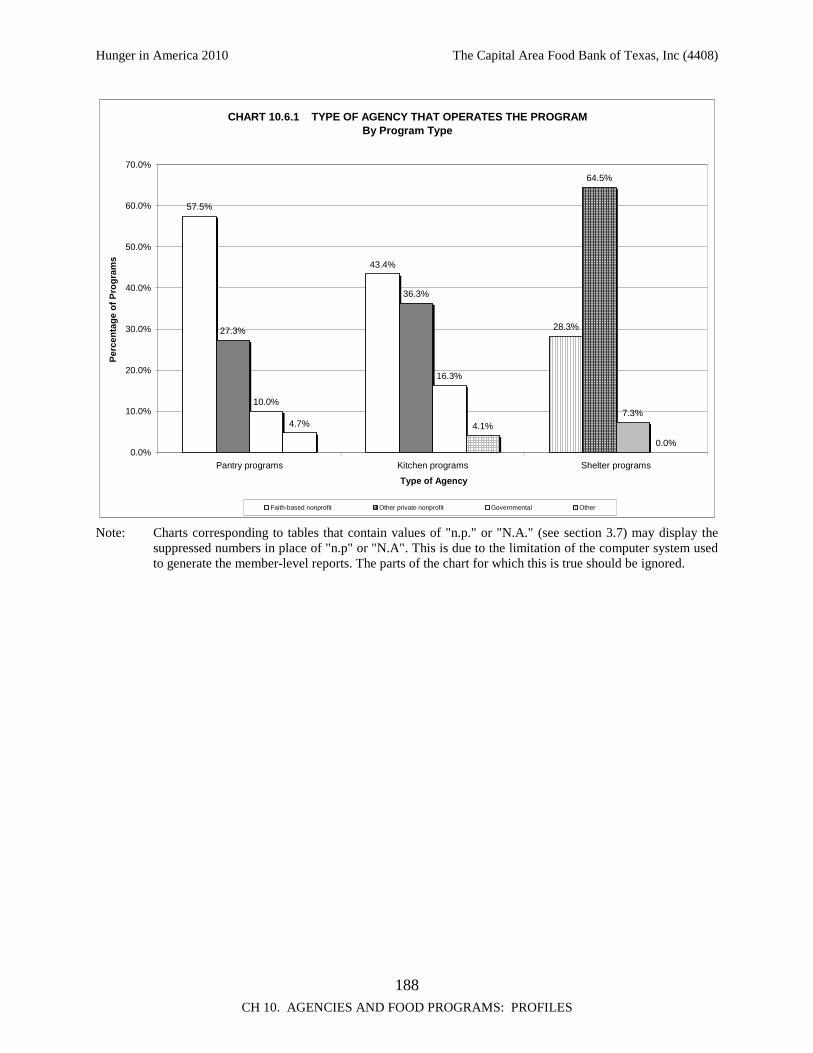
Hunger in America 2010 The Capital Area Food Bank of Texas, Inc (4408)
188 CH 10. AGENCIES AND FOOD PROGRAMS: PROFILES
CHART 10.6.1 TYPE OF AGENCY THAT OPERATES THE PROGRAMBy Program Type
57.5%
43.4%
28.3%27.3%
36.3%
64.5%
10.0%
16.3%
7.3%4.7% 4.1%
0.0%0.0%
10.0%
20.0%
30.0%
40.0%
50.0%
60.0%
70.0%
Pantry programs Kitchen programs Shelter programs
Type of Agency
Per
cen
tag
e o
f P
rog
ram
s
Faith-based nonprofit Other private nonprofit Governmental Other
Note: Charts corresponding to tables that contain values of "n.p." or "N.A." (see section 3.7) may display the
suppressed numbers in place of "n.p" or "N.A". This is due to the limitation of the computer system used to generate the member-level reports. The parts of the chart for which this is true should be ignored.

Hunger in America 2010 The Capital Area Food Bank of Texas, Inc (4408)
189 CH 10. AGENCIES AND FOOD PROGRAMS: PROFILES
10.7 PROGRAMS SERVING SELECTED TYPES OF CLIENTS
Agencies were asked whether their programs serve migrant workers, legal immigrants, or
undocumented immigrants.26
TABLE 10.7.1
PROGRAMS SERVING SELECTED TYPES OF CLIENTS
Pantry Programs Kitchen Programs Shelter Programs
Migrant Workers Yes 63.9% 37.5% 33.0% No 36.1% 62.5% 67.0% TOTAL 100.0% 100.0% 100.0%
Legal Immigrants
Yes 88.8% 53.6% 58.7% No 11.2% 46.4% 41.3% TOTAL 100.0% 100.0% 100.0%
Undocumented Immigrants
Yes 79.6% 37.6% 41.0% No 20.4% 62.4% 59.0% TOTAL 100.0% 100.0% 100.0%
SAMPLE SIZE (N) 187 30 30 SOURCE: This table was constructed based on usable responses to Question 18 of the agency survey. NOTES: The percentages presented in this table are based only on usable responses, excluding missing, don’t
know, and refusal responses. All usable responses were weighted as described in Chapter 3 and in the Technical Appendix volume to represent all emergency food programs of The Capital Area Food Bank of Texas, Inc. The sample sizes (N) also include missing data.
For migrant workers, missing, don’t know, and refusal responses combined are 40.1% for pantry programs, 29.9% for kitchen programs, and 30.1% for shelter programs. For legal immigrants, missing, don’t know, and refusal responses combined are 22.1% for pantry programs, 20.2% for kitchen programs, and 26.8% for shelter programs. For undocumented immigrants, missing, don’t know, and refusal responses combined are 36.5% for pantry programs, 29.9% for kitchen programs, and 43.5% for shelter programs.
26 The question asked “do the selected programs currently serve any of the following groups?” Agencies
had to select “yes”, “no”, or “don’t know” for each of the three types of clients. At the national level, a large number of the responding agencies left these three questions unanswered.

Hunger in America 2010 The Capital Area Food Bank of Texas, Inc (4408)
190 CH 10. AGENCIES AND FOOD PROGRAMS: PROFILES
Findings in Table 10.7.1 include:
• 63.9% of the pantries, 37.5% of the kitchens, and 33.0% of the shelters serve migrant workers.
• 88.8% of the pantries, 53.6% of the kitchens, and 58.7% of the shelters serve legal immigrants.
• 79.6% of the pantries, 37.6% of the kitchens, and 41.0% of the shelters serve undocumented immigrants.

Hunger in America 2010 The Capital Area Food Bank of Texas, Inc (4408)
191 CH 10. AGENCIES AND FOOD PROGRAMS: PROFILES
10.8 AGENCY ESTIMATES OF CHANGE IN NUMBER OF CLIENTS FROM 2006 TO 2009
Agencies were asked whether they serve more or fewer clients than they did in 2006.
Table 10.8.1 shows the findings.
TABLE 10.8.1
AGENCY ESTIMATES OF CHANGE IN NUMBER OF CLIENTS FROM 2006 TO 2009
Agency Estimate of Change in the Number of Clients Compared with Year 2006 Pantry Programs Kitchen Programs Shelter Programs
More clients 77.6% 41.3% 39.7% Fewer clients 6.0% 8.2% 5.1% About the same number of clients 7.9% 42.1% 50.1% Program did not exist in 2006 8.5% 8.4% 5.1% TOTAL 100.0% 100.0% 100.0%
SAMPLE SIZE (N) 187 30 30 SOURCE: This table was constructed based on usable responses to Question 7 of the agency survey. NOTES: The percentages presented in this table are based only on usable responses, excluding missing, don’t
know, and refusal responses. All usable responses were weighted as described in Chapter 3 and in the Technical Appendix volume to represent all emergency food programs of The Capital Area Food Bank of Texas, Inc. The sample sizes (N) also include missing data.
Missing, don’t know, and refusal responses combined are 11.0% for pantry programs, 20.2% for kitchen programs, and 33.4% for shelter programs.
Regarding the volume of the clients, 77.6% of the pantries, 41.3% of the kitchens, and
39.7% of the shelters indicate that they serve more clients now than they did in 2006.
• 7.9% of the pantries, 42.1% of the kitchens, and 50.1% of the shelters indicated that they serve about the same number of clients in 2009 as in 2006.
• 6.0% of the pantries, 8.2% of the kitchens, and 5.1% of the shelters indicated that they serve fewer clients in 2009 than they did in 2006.
• 8.5% of the pantries, 8.4% of the kitchens, and 5.1% of the shelters did not exist in 2006.

Hunger in America 2010 The Capital Area Food Bank of Texas, Inc (4408)
192 CH 10. AGENCIES AND FOOD PROGRAMS: PROFILES
10.9 SEASONALITY OF CLIENT MIX
Agencies were asked whether their programs experience significant change in client mix
by season and, if so, what kinds of change. Results are shown in Table 10.9.1.
TABLE 10.9.1
SEASONALITY OF CLIENT MIX
Nature of Changes in Client Mix During the Yeara Pantry Programs Kitchen Programs Shelter Programs
Ratio of men to women changes 21.1% 4.2% 24.0% Mix of ethnic groups changes 28.8% 12.3% 38.2% Many more children in summer 43.3% 28.9% 14.1% Many more migrant workers in summer 4.8% 8.0% 0.0% Many more migrant workers in winter 7.2% 3.9% 0.0% Different group of people at the
holidays 54.0% 12.2% 28.3% Otherb 4.8% 4.1% 9.7% Do not experience change in client mix 30.3% 50.5% 28.5%
SAMPLE SIZE (N) 166 24 21 SOURCE: This table was constructed based on usable responses to Question 19 of the agency survey. NOTES: All usable responses were weighted as described in Chapter 3 and in the Technical Appendix volume to
represent all emergency food programs of The Capital Area Food Bank of Texas, Inc. The sample sizes (N) also include missing data.
Missing, don’t know, and refusal responses combined are 11.6% for pantry programs, 20.1% for kitchen programs, and 30.0% for shelter programs.
aMultiple responses were accepted. bThis includes fewer elderly people in winter and more families in winter.
We find that 30.3% of the pantries, 50.5% of the kitchens, and 28.5% of the shelters
indicated that they do not experience seasonal changes in the mix of clients during the year. As
to the nature of seasonal changes:
• 21.1% of the pantries, 4.2% of the kitchens, and 24.0% of the shelters said they experience changes in the ratio of men to women.

Hunger in America 2010 The Capital Area Food Bank of Texas, Inc (4408)
193 CH 10. AGENCIES AND FOOD PROGRAMS: PROFILES
• 43.3% of the pantries, 28.9% of the kitchens, and 14.1% of the shelters said they serve more children in summer.
• 54.0% of the pantries, 12.2% of the kitchens, and 28.3% of the shelters said they serve a different group of people during the holidays.


Hunger in America 2010 The Capital Area Food Bank of Texas, Inc (4408)
195 CH 11. AGENCIES AND FOOD PROGRAMS: FOOD SERVICES
11. AGENCIES AND FOOD PROGRAMS: FOOD SERVICES
In understanding the workings of the FA network, it is important to understand the broad
differences between providers in their scales of operations. The chapter discusses a number of
indicators of the size of provider food service operations. As will be seen, providers vary
dramatically in size, from pantries that serve just a few clients a day to pantries and kitchens that
provide food to hundreds of clients on a given day of operation.
There is great variation among providers in the detail with which they keep long-term
records such as service and client counts. Therefore, the analysis below focuses on measures of
size based on either a “typical week” or on the “most recent day the provider was open,” since
these are the size concepts to which respondents were in general best able to relate.
11.1 NUMBER OF BOXES OR BAGS DISTRIBUTED IN A TYPICAL WEEK
Agencies were asked how much food their pantries distribute during a typical week.
Table 11.1.1 shows the results.
TABLE 11.1.1
NUMBER OF BOXES OR BAGS DISTRIBUTED IN A TYPICAL WEEK
Pantry Programs
Programs distributing the following number of boxes or bags of food in a typical weeka:
1-9 9.4% 10-29 20.7% 30-49 8.0% 50-99 19.3% 100-299 21.3% 300-499 11.3% 500 or more 10.0% TOTAL 100.0%
SAMPLE SIZE (N) 187

Hunger in America 2010 The Capital Area Food Bank of Texas, Inc (4408)
196 CH 11. AGENCIES AND FOOD PROGRAMS: FOOD SERVICES
Pantry Programs
Average number of boxes or bags of food distributed in a typical week among valid responsesb 216
Median number of boxes or bags of food distributed in a typical week among valid responsesb 70
SAMPLE SIZE (N) 154 SOURCE: This table was constructed based on usable responses to question 6 of the agency survey. NOTES: The percentages presented in this table are based only on usable responses, excluding missing, don’t
know, and refusal responses. All usable responses were weighted as described in Chapter 3 and in the Technical Appendix volume to represent all pantries (as noted earlier in this footnote only) of The Capital Area Food Bank of Texas, Inc. The sample sizes (N) also include missing data.
Missing, don’t know, and refusal responses combined are 20.2% for pantry programs.
aFor pantries, responses greater than 5,000 bags or boxes distributed were recoded as 5,000 bags or boxes. bIn 2005 and 2009, zeros as responses were included as valid responses for calculating the average and the median.
On average, the participating pantries distributed 216 boxes or bags (median: 70) of food
during a typical week. More details on the amount of food distributed during a typical week
follow:
• 20.7% of the pantries distributed 10 to 29 boxes or bags of food.
• 8.0% of the pantries distributed 30 to 49 boxes or bags of food.
• 19.3% of the pantries distributed 50 to 99 boxes or bags of food.
• 21.3% of the pantries distributed 100 to 299 boxes or bags of food.
• 11.3% of the pantries distributed 300 to 499 boxes or bags of food.
• 10.0% of the pantries distributed 500 or more boxes or bags.

Hunger in America 2010 The Capital Area Food Bank of Texas, Inc (4408)
197 CH 11. AGENCIES AND FOOD PROGRAMS: FOOD SERVICES
11.2 AMOUNT OF FOOD SERVED ON THE DAY THE PROGRAM WAS LAST OPEN
Agencies were asked how much food their programs distributed when they were last
open. Results are presented in Table 11.2.1.
TABLE 11.2.1
AMOUNT OF FOOD SERVED ON THE DAY THE PROGRAM WAS LAST OPEN
Pantry Programs (in Bags or
Boxes)
Kitchen Programs (in Meals)
Shelter Programs (in Meals)
Programs that distributed the following number of boxes/bags or meals of fooda,b
1-9 9.0% 0.0% 20.2% 10-29 26.0% 10.6% 6.6% 30-49 12.3% 15.8% 33.3% 50-99 21.2% 15.8% 20.0% 100-149 5.7% 31.2% 6.6% 150-199 9.7% 0.0% 6.6% 200-249 1.6% 5.4% 6.6% 250 or more 14.6% 21.2% 0.0% TOTAL 100.0% 100.0% 100.0%
SAMPLE SIZE (N) 187 30 30
Average number of bags or boxes of food distributed, among valid responsesa,b,c 120 n.a. n.a.
Median number of bags or boxes of food distributed, among valid responsesa,b,c 52 n.a. n.a.
Average number of meals served, among valid
responsesa,b,c n.a. 193 63 Median number of meals served, among valid
responsesa,b,c n.a. 120 42
SAMPLE SIZE (N) 126 19 15 SOURCE: This table was constructed based on usable responses to Question 6b of the agency survey. NOTES: The percentages presented in this table are based only on usable responses, excluding missing, don’t
know, and refusal responses. All usable responses were weighted as described in Chapter 3 and in the Technical Appendix volume to represent all emergency food programs of The Capital Area Food Bank of Texas, Inc. The sample sizes (N) also include missing data.
Missing, don’t know, and refusal responses combined are 34.6% for pantry programs, 37.0% for kitchen programs, and 50.1% for shelter programs.

Hunger in America 2010 The Capital Area Food Bank of Texas, Inc (4408)
198 CH 11. AGENCIES AND FOOD PROGRAMS: FOOD SERVICES
aFor pantries and kitchens, responses greater than 1,000 bags or boxes distributed or meals served were recoded as 1,000 bags or boxes distributed or meals served. For shelters, responses greater than 300 meals served were recoded as 300 meals served. bThe amounts distributed per day can vary substantially over the month, particularly for pantries, so responses may depend on when the survey was filled out. cZeros as responses were not included as valid responses for calculating the average and the median.
Emergency food programs vary greatly in size. On average, the pantry programs
distributed 120 boxes/bags (median: 52) of food when they were last open. The kitchen
programs distributed 193 meals (median: 120) and the shelter programs distributed 63 meals
(median: 42). Details follow:
• 9.0% of the pantries and 20.2% of the shelters distributed 1 to 9 boxes or bags or meals of food on the day they were last open.
• 59.4% of the pantries and 59.9% of the shelters distributed 10 to 99 boxes or bags or meals of food on the day they were last open.
• 16.2% of the pantries and 6.6% of the shelters distributed 200 or more boxes or bags or meals of food on the day they were last open.
• 26.6% of the kitchens served more than 200 meals on the day they were last open.

Hunger in America 2010 The Capital Area Food Bank of Texas, Inc (4408)
199 CH 11. AGENCIES AND FOOD PROGRAMS: FOOD SERVICES
Table 11.2.2 describes how much food programs distributed when they were last open
according to the type of agency that operates the program.
TABLE 11.2.2
AMOUNT OF FOOD SERVED ON THE DAY THE PROGRAM WAS LAST OPEN, BY TYPE OF AGENCY THAT OPERATES THE PROGRAM
Agency Type
Faith-Based or Religion-Affiliated Nonprofit
Other Private Nonprofit Governmental
Community Action
Program (CAP)
Pantry Programs
Average number of bags or boxes of food distributed, among valid responsesa,b,c 128 127 31 47
Median number of bags or boxes of food distributed, among valid responsesa,b,c 55 49 17 47
SAMPLE SIZE (N) 83 25 7 1
Kitchen Programs Average number of meals served, among valid
responsesa,b,c 209 333 115 N.A. Median number of meals served, among valid
responsesa,b,c 120 437 120 N.A.
SAMPLE SIZE (N) 10 3 3 0
Shelter Programs Average number of meals served, among valid
responsesa,b,c 76 64 N.A. N.A. Median number of meals served, among valid
responsesa,b,c 39 45 N.A. N.A.
SAMPLE SIZE (N) 4 10 0 0
SOURCE: This table was constructed based on usable responses to Questions 6b and 27 of the agency survey. NOTES: The percentages presented in this table are based only on usable responses, excluding missing, don’t
know, and refusal responses. All usable responses were weighted as described in Chapter 3 and in the Technical Appendix volume to represent all emergency food programs of The Capital Area Food Bank of Texas, Inc. The sample sizes (N) also include missing data.
For pantry programs, missing, don’t know, and refusal responses combined are 18.0% for programs in faith-based agencies, 49.5% for private nonprofit programs, 59.3% for governmental programs, and 0.0% for community action programs. For kitchen programs, missing, don’t know, and refusal responses combined are 9.4% for programs in faith-based agencies, 67.0% for private nonprofit programs, 25.0% for governmental programs, and N.A. for community action programs.

Hunger in America 2010 The Capital Area Food Bank of Texas, Inc (4408)
200 CH 11. AGENCIES AND FOOD PROGRAMS: FOOD SERVICES
For shelter programs, missing, don’t know, and refusal responses combined are 50.1% for programs in faith-based agencies, 44.7% for private nonprofit programs, 100.0% for governmental programs, and N.A. for community action programs.
aFor pantries and kitchens, responses greater than 1,000 bags or boxes distributed or meals served were recoded as 1,000 bags or boxes distributed or meals served. For shelters, responses greater than 300 meals served were recoded as 300 meals served. bIt should be noted that, particularly for pantries, amounts distributed per day can vary substantially over the month, so responses may depend on when the survey was filled out. cZeros as responses were not included as valid responses for calculating the average and the median.
Key findings include:
• For pantry programs, the average number of boxes/bags distributed on the day they were last open is 127 for programs operated by non-faith-based or religion-affiliated private nonprofit agencies, compared to 31 for programs operated by governmental agencies.
• For kitchen programs, the average number of meals served on the day they were last open is 209 for programs operated by faith-based or religion-affiliated nonprofit agencies, compared to 115 for programs operated by governmental agencies.
• For shelter programs, the average number of meals served on the day they were last open is 76 for programs operated by faith-based or religion-affiliated nonprofit agencies, compared to N.A. for programs operated by community action programs.

Hunger in America 2010 The Capital Area Food Bank of Texas, Inc (4408)
201 CH 12. AGENCIES AND FOOD PROGRAMS: ABILITY TO MEET CLIENT NEEDS
12. AGENCIES AND FOOD PROGRAMS: ABILITY TO MEET CLIENT NEEDS
The study has also examined the capacity of the agencies and food programs to meet
client needs. Below, we consider the stability of the programs, the main problems they face, and
the degree to which they have had to stretch resources or turn away clients. Reasons why some
agencies have had to turn away clients are also discussed.
12.1 STABILITY OF EXISTING FOOD PROGRAMS
Agencies were asked whether their food programs are stable or facing problems that
threaten their food programs’ continued operation and, if so, which of several listed factors were
the causes of the threat. Agencies were asked to check more than one reason, if more than one
was appropriate. Table 12.1.1 shows the percentage of food programs affected by each of the
factors cited.
TABLE 12.1.1
STABILITY OF EXISTING FOOD PROGRAMS
Pantry Programs
Kitchen Programs
Shelter Programs
Nature of the problema Problems related to funding 46.8% 34.5% 61.2% Problems related to food supplies 33.5% 34.5% 16.5% Problems related to paid staff or personnel 5.5% 4.3% 11.2% Problems related to volunteers 16.4% 12.7% 0.0% Community resistance 2.4% 0.0% 5.5% Other problems 3.6% 4.3% 5.5%
Programs not facing problems that threaten their continued operation 39.1% 56.8% 33.3%
SAMPLE SIZE (N) 187 30 30 SOURCE: This table was constructed based on usable responses to Question 17 of the agency survey.

Hunger in America 2010 The Capital Area Food Bank of Texas, Inc (4408)
202 CH 12. AGENCIES AND FOOD PROGRAMS: ABILITY TO MEET CLIENT NEEDS
NOTES: All usable responses were weighted as described in Chapter 3 and in the Technical Appendix volume to represent all emergency food programs of The Capital Area Food Bank of Texas, Inc. The sample sizes (N) also include missing data.
Missing, don’t know, and refusal responses combined are 12.7% for pantry programs, 23.5% for kitchen programs, and 40.0% for shelter programs.
aMultiple responses were accepted.
As Table 12.1.1 shows, 60.9% of the pantries, 43.2% of the kitchens, and 66.7% of the
shelters believe they are facing one or more problems that threaten their continued operation:
• 46.8% of pantries, 34.5% of kitchens, and 61.2% of shelters referred to funding issues as a threat; 33.5% of the pantries, 34.5% of kitchens, and 16.5% of shelters indicated food supplies as a threat to their continued operation.
• 4.3% of kitchens and 11.2% of shelters identified issues related to paid staff or personnel as a threat; 16.4% of pantries and 12.7% of kitchens stated that volunteer-related problems posed a threat.
CHART 12.1.1 PROGRAMS THAT FACE AT LEAST ONE PROBLEM THREATENING THEIR CONTINUED OPERATION
By Program Type
60.9%
43.2%
66.7%
0.0%
10.0%
20.0%
30.0%
40.0%
50.0%
60.0%
70.0%
80.0%
Pantry programs Kitchen programs Shelter programs
Per
cen
tag
e o
f P
rog
ram
s

Hunger in America 2010 The Capital Area Food Bank of Texas, Inc (4408)
203 CH 12. AGENCIES AND FOOD PROGRAMS: ABILITY TO MEET CLIENT NEEDS
CHART 12.1.1P NATURE OF PROBLEMS THAT THREATEN CONTINUED OPERATION Among Pantry Programs
46.8%
33.5%
5.5%
16.4%
2.4% 3.6%
0.0%
10.0%
20.0%
30.0%
40.0%
50.0%
60.0%
70.0%
80.0%
90.0%
100.0%
Funding Food supplies Paid staff orpersonnel
Volunteers Communityresistance
Other
Problems
Per
cen
tag
e o
f P
rog
ram
s
Note: Charts corresponding to tables that contain values of "n.p." or "N.A." (see section 3.7) may display the
suppressed numbers in place of "n.p" or "N.A". This is due to the limitation of the computer system used to generate the member-level reports. The parts of the chart for which this is true should be ignored.

Hunger in America 2010 The Capital Area Food Bank of Texas, Inc (4408)
204 CH 12. AGENCIES AND FOOD PROGRAMS: ABILITY TO MEET CLIENT NEEDS
Table 12.1.2 shows the percentage of food programs affected by each of the factors cited
according to the type of agency that operates the program.
TABLE 12.1.2
STABILITY OF EXISTING FOOD PROGRAMS, BY TYPE OF AGENCY THAT OPERATES THE PROGRAM
Agency Type
Faith-Based or Religion-Affiliated Nonprofit
Other Private Nonprofit Governmental
Community Action
Program (CAP)
Pantry Programsa Problems related to funding 50.5% 47.2% 26.3% 100.0% Problems related to food supplies 41.5% 28.0% 13.1% 0.0%
Problems related to paid staff or personnel 1.0% 16.8% 6.6% 0.0%
Problems related to volunteers 19.1% 11.3% 13.1% 0.0%
SAMPLE SIZE (N) 100 47 17 1
Kitchen Programsa Problems related to funding 54.6% 33.2% 0.0% N.A. Problems related to food supplies 54.6% 16.4% 33.3% N.A.
Problems related to paid staff or personnel 0.0% 16.4% 0.0% N.A.
Problems related to volunteers 17.8% 16.4% 0.0% N.A.
SAMPLE SIZE (N) 11 9 4 0
Shelter Programsa Problems related to funding 49.8% 66.8% N.A. N.A.
Problems related to food supplies 16.6% 16.5% N.A. N.A.
Problems related to paid staff or personnel 16.6% 8.5% N.A. N.A.
Problems related to volunteers 0.0% 0.0% N.A. N.A.
SAMPLE SIZE (N) 8 18 2 0
SOURCE: This table was constructed based on usable responses to Questions 17 and 27 of the agency survey. NOTES: All usable responses were weighted as described in Chapter 3 and in the Technical Appendix volume to
represent all emergency food programs of The Capital Area Food Bank of Texas, Inc. The sample sizes (N) also include missing data.
For pantry programs, missing, don’t know, and refusal responses combined are 1.0% for programs in a faith-based agency, 24.1% for private nonprofit programs, 12.4% for governmental programs, and 0.0% for community action programs. For kitchen programs, missing, don’t know, and refusal responses combined are 0.0% for programs in a faith-based agency, 33.3% for private nonprofit programs, 25.0% for governmental programs, and N.A. for community action programs.

Hunger in America 2010 The Capital Area Food Bank of Texas, Inc (4408)
205 CH 12. AGENCIES AND FOOD PROGRAMS: ABILITY TO MEET CLIENT NEEDS
For shelter programs, missing, don’t know, and refusal responses combined are 24.7% for programs in a faith-based agency, 33.6% for private nonprofit programs, 100.0% for governmental programs, and N.A. for community action programs.
aMultiple responses were accepted.
Key findings include:
• For pantry programs, 26.3% of programs operated by governmental agencies believe they are facing problems related to funding, compared to 47.2% of programs operated by non-faith-based or religion-affiliated private nonprofit agencies.
• For kitchen programs, 0.0% of programs operated by governmental agencies believe they are facing problems related to volunteers, compared to 17.8% of programs operated by faith-based or religion-affiliated nonprofit agencies.
• For shelter programs, N.A. of programs operated by community action program agencies indicated food supplies as a threat to their continued operation. This compares to N.A. of programs operated by governmental agencies and 16.6% operated by faith-based or religion-affiliated nonprofit agencies.

Hunger in America 2010 The Capital Area Food Bank of Texas, Inc (4408)
206 CH 12. AGENCIES AND FOOD PROGRAMS: ABILITY TO MEET CLIENT NEEDS
12.2 FREQUENCY OF STRETCHING FOOD RESOURCES
Agencies were asked whether their programs ever had to ration or limit food in order to
provide some food to all clients and, if so, how often. Table 12.2.1 shows the varying degrees of
frequency with which the food programs stretched food resources.
TABLE 12.2.1
FREQUENCY OF STRETCHING FOOD RESOURCES
During 2008, How Often Did the Program Have to Reduce Meal Portions or Reduce the Quantity of Food in Food Packages Because of a Lack of Food
Pantry Programs
Kitchen Programs
Shelter Programs
Never 31.6% 78.5% 72.3% Rarely 45.4% 4.3% 22.2% SUBTOTAL 76.9% 82.8% 94.5%
Sometimes 21.9% 17.2% 5.5% Always 1.2% 0.0% 0.0% SUBTOTAL 23.1% 17.2% 5.5%
TOTAL 100.0% 100.0% 100.0%
SAMPLE SIZE (N) 187 30 30 SOURCE: This table was constructed based on usable responses to Question 13 of the agency survey. NOTES: The percentages presented in this table are based only on usable responses, excluding missing, don’t
know, and refusal responses. All usable responses were weighted as described in Chapter 3 and in the Technical Appendix volume to represent all emergency food programs of The Capital Area Food Bank of Texas, Inc. The sample sizes (N) also include missing data.
Missing, don’t know, and refusal responses combined are 10.0% for pantry programs, 23.6% for kitchen programs, and 40.1% for shelter programs.
During the year 2008, 31.6% of pantries, 78.5% of kitchens, and 72.3% of shelters never
experienced the need to stretch food resources (reduce meal portions or reduce the quantity of
food in food packages).
• Nevertheless, 23.1% of the pantries, 17.2% of the kitchens, and 5.5% of the shelters indicated that they sometimes or always had to stretch food resources.

Hunger in America 2010 The Capital Area Food Bank of Texas, Inc (4408)
207 CH 12. AGENCIES AND FOOD PROGRAMS: ABILITY TO MEET CLIENT NEEDS
CHART 12.2.1 FREQUENCY OF STRETCHING FOOD RESOURCESBy Program Type
31.6%
78.5%
72.3%
45.4%
4.3%
22.2%21.9%
17.2%
5.5%
1.2% 0.0% 0.0%0.0%
10.0%
20.0%
30.0%
40.0%
50.0%
60.0%
70.0%
80.0%
90.0%
Pantry programs Kitchen programs Shelter programs
Frequency
Per
cen
tag
e o
f P
rog
ram
s
Never Rarely Sometimes Always
Note: Charts corresponding to tables that contain values of "n.p." or "N.A." (see section 3.7) may display the
suppressed numbers in place of "n.p" or "N.A". This is due to the limitation of the computer system used to generate the member-level reports. The parts of the chart for which this is true should be ignored.

Hunger in America 2010 The Capital Area Food Bank of Texas, Inc (4408)
208 CH 12. AGENCIES AND FOOD PROGRAMS: ABILITY TO MEET CLIENT NEEDS
Table 12.2.2 shows the varying degrees of frequency with which the food programs
stretched food resources, according to the type of agency that operates the program.
TABLE 12.2.2
FREQUENCY OF STRETCHING FOOD RESOURCES, BY TYPE OF AGENCY THAT OPERATES THE PROGRAM
During 2008, How Often Did the Program Have to Reduce Meal Portions or Reduce the Quantity of Food in Food Packages Because of a Lack of Food Agency Type
Faith-Based or Religion-Affiliated Nonprofit
Other Private Nonprofit Governmental
Community Action
Program (CAP)
Pantry Programs
Never 24.3% 34.1% 47.5% 0.0% Rarely 48.4% 43.9% 45.9% 100.0% SUBTOTAL 72.7% 78.0% 93.4% 100.0%
Sometimes 25.3% 22.0% 6.6% 0.0% Always 2.0% 0.0% 0.0% 0.0% SUBTOTAL 27.3% 22.0% 6.6% 0.0%
TOTAL 100.0% 100.0% 100.0% 100.0%
SAMPLE SIZE (N) 100 47 17 1
Kitchen Programs
Never 59.7% 85.9% 100.0% N.A.
Rarely 10.1% 0.0% 0.0% N.A.
SUBTOTAL 69.8% 85.9% 100.0% N.A.
Sometimes 30.2% 14.1% 0.0% N.A.
Always 0.0% 0.0% 0.0% N.A.
SUBTOTAL 30.2% 14.1% 0.0% N.A.
TOTAL 100.0% 100.0% 100.0% 100.0%
SAMPLE SIZE (N) 11 9 4 0
Shelter Programs
Never 60.0% 77.0% N.A. N.A.
Rarely 20.0% 23.0% N.A. N.A.
SUBTOTAL 80.0% 100.0% N.A. N.A.
Sometimes 20.0% 0.0% N.A. N.A.
Always 0.0% 0.0% N.A. N.A.
SUBTOTAL 20.0% 0.0% N.A. N.A.

Hunger in America 2010 The Capital Area Food Bank of Texas, Inc (4408)
209 CH 12. AGENCIES AND FOOD PROGRAMS: ABILITY TO MEET CLIENT NEEDS
During 2008, How Often Did the Program Have to Reduce Meal Portions or Reduce the Quantity of Food in Food Packages Because of a Lack of Food Agency Type
Faith-Based or Religion-Affiliated Nonprofit
Other Private Nonprofit Governmental
Community Action
Program (CAP)
TOTAL 100.0% 100.0% 100.0% 100.0%
SAMPLE SIZE (N) 8 18 2 0 SOURCE: This table was constructed based on usable responses to Question 13 of the agency survey. NOTES: The percentages presented in this table are based only on usable responses, excluding missing, don’t
know, and refusal responses. All usable responses were weighted as described in Chapter 3 and in the Technical Appendix volume to represent all emergency food programs of The Capital Area Food Bank of Texas, Inc. The sample sizes (N) also include missing data.
For pantry programs, missing, don’t know, and refusal responses combined are 1.1% for programs operated by faith-based agencies, 13.4% for programs operated by nonprofit agencies, 12.4% for programs operated by governmental agencies, and 0.0% for programs operated by community action programs. For kitchen programs, missing, don’t know, and refusal responses combined are 9.4% for programs operated by faith-based agencies, 22.4% for programs operated by nonprofit agencies, 25.0% for programs operated by governmental agencies, and N.A. for programs operated by community action programs. For shelter programs, missing, don’t know, and refusal responses combined are 37.6% for programs operated by faith-based agencies, 28.1% for programs operated by nonprofit agencies, 100.0% for programs operated by governmental agencies, and N.A. for programs operated by community action programs.
We find that for pantry programs, 47.5% of programs operated by governmental agencies
never experienced the need to stretch food resources (reduce meal portions or reduce the quantity
of food in food packages). This percentage is 0.0% for programs operated by community action
program agencies and 24.3% for programs operated by faith-based or religion-affiliated
nonprofit agencies. In addition, we find:
• For kitchen programs, 100.0% of programs operated by governmental agencies never experienced the need to stretch food resources (reduce meal portions or reduce the quantity of food in food packages). This percentage is 59.7% for programs operated by faith-based or religion-affiliated nonprofit agencies.
• For shelter programs, 77.0% of programs operated by non-faith-based or religion-affiliated nonprofit agencies never experienced the need to stretch food resources

Hunger in America 2010 The Capital Area Food Bank of Texas, Inc (4408)
210 CH 12. AGENCIES AND FOOD PROGRAMS: ABILITY TO MEET CLIENT NEEDS
(reduce meal portions or reduce the quantity of food in food packages). This percentage is 60.0% for programs operated by faith-based or religion-affiliated nonprofit agencies.

Hunger in America 2010 The Capital Area Food Bank of Texas, Inc (4408)
211 CH 12. AGENCIES AND FOOD PROGRAMS: ABILITY TO MEET CLIENT NEEDS
12.3 PROGRAMS THAT TURNED AWAY CLIENTS
Agencies were asked whether clients had been turned away within the past year and, if
so, how many and for what reasons. Agencies were asked to use either their records or their best
estimates to supply this information. Table 12.3.1 and Table 12.3.2 show the results.
TABLE 12.3.1
PROGRAMS THAT TURNED AWAY CLIENTS
Pantry Programs
Kitchen Programs
Shelter Programs
Did the program turn away clients during the past year?a Yes 22.1% 18.1% 41.0% No 77.9% 81.9% 59.0% TOTAL 100.0% 100.0% 100.0%
SAMPLE SIZE (N) 187 30 30
Average number of clients turned away in the past year among those that turned away at least one client 115 507 45
Median number of clients turned away in the past year among those that turned away at least one client 20 30 22
SAMPLE SIZE (N) – Programs providing a valid number of clients who were turned away 20 3 4
Reasons for turning away clientsb Lack of food resources 34.2% 33.3% 0.0% Services needed not provided by the program 28.5% 66.7% 85.4% Clients were ineligible or could not prove eligibility 40.4% 33.3% 56.9% Clients abused program/came too often 71.1% 0.0% 14.2% Clients exhibited drug, alcohol, or behavior problem 19.9% 66.7% 71.1% Clients lived outside service area 54.1% 0.0% 0.0% Clients had no proper identification 31.4% 0.0% 0.0% Client’s income exceeded the guidelines 14.3% 0.0% 0.0% Other 17.5% 33.3% 57.3%
SAMPLE SIZE (N) – Programs that turned away clients 35 4 7 SOURCE: This table was constructed based on usable responses to questions 9, 10, and 12 of the agency survey. NOTES: All usable responses were weighted as described in Chapter 3 and in the Technical Appendix volume to
represent all emergency food programs of The Capital Area Food Bank of Texas, Inc. The sample sizes (N) also include missing data.
For programs that turned away clients, missing, don’t know, and refusal responses combined are 15.8% for pantry programs, 26.8% for kitchen programs, and 43.4% for shelter programs.

Hunger in America 2010 The Capital Area Food Bank of Texas, Inc (4408)
212 CH 12. AGENCIES AND FOOD PROGRAMS: ABILITY TO MEET CLIENT NEEDS
For reasons for turning away clients, missing, don’t know, and refusal responses combined are 0.0% for pantry programs, 25.5% for kitchen programs, and 0.0% for shelter programs.
aFor pantries, responses greater than 3,000 clients turned away were recoded as 3,000 clients. For kitchens and shelters, responses greater than 2,500 clients turned away were recoded as 2,500 clients. bMultiple responses were accepted.
As Table 12.3.1 shows, 22.1% of the pantries, 18.1% of the kitchens, and 41.0% of the
shelters responded that they turned away clients during the past year. Reasons for turning away
clients follow:
• Among programs turning away clients, 34.2% of the pantries, 33.3% of the kitchens, and 0.0% of the shelters turned away clients at least once due to lack of food resources.
• Among programs turning away clients, 28.5% of the pantries, 66.7% of the kitchens, and 85.4% of the shelters turned away clients at least once because the services needed were not provided by the program.
• Among programs turning away clients, 40.4% of the pantries, 33.3% of the kitchens, and 56.9% of the shelters turned away clients at least once because the clients were ineligible or could not prove eligibility.
• Among programs turning away clients, 71.1% of the pantries, 0.0% of the kitchens, and 14.2% of the shelters turned away clients at least once because the clients abused the program or because they came too often.

Hunger in America 2010 The Capital Area Food Bank of Texas, Inc (4408)
213 CH 12. AGENCIES AND FOOD PROGRAMS: ABILITY TO MEET CLIENT NEEDS
CHART 12.3.1P REASONS FOR TURNING AWAY CLIENTSAmong Pantry Programs
34.2%
28.5%
40.4%
71.1%
19.9%
54.1%
31.4%
14.3%17.5%
0.0%
10.0%
20.0%
30.0%
40.0%
50.0%
60.0%
70.0%
Lack of foodor resources
Servicesneeded not
provided
Clientsineligible
Clientsabused
programs
Clientsexhibited
drug, alcohol,or behavior
problem
Clients livedoutside
service area
Clients had noproper ID
Clients'income
exceeded theguidelines
Other
Reasons
Per
cen
tag
e o
f P
antr
y P
rog
ram
s
Note: Charts corresponding to tables that contain values of "n.p." or "N.A." (see section 3.7) may display the
suppressed numbers in place of "n.p" or "N.A". This is due to the limitation of the computer system used to generate the member-level reports. The parts of the chart for which this is true should be ignored.

Hunger in America 2010 The Capital Area Food Bank of Texas, Inc (4408)
214 CH 12. AGENCIES AND FOOD PROGRAMS: ABILITY TO MEET CLIENT NEEDS
TABLE 12.3.2
MOST FREQUENT REASONS THE PROGRAM TURNED AWAY CLIENTS
Pantry Programs
Kitchen Programs
Shelter Programs
Most frequent reason Lack of food or resources 17.2% 0.0% 14.6% Services needed not provided by the program 5.7% 33.3% 28.5% Clients were ineligible or could not prove
eligibility 11.4% 0.0% 14.2%
Clients abused program/came too often 31.2% 0.0% 0.0% Clients exhibited drug, alcohol, or behavior
problem 0.0% 33.3% 0.0%
Clients lived outside service area 11.4% 0.0% 0.0% Clients had no proper identification 8.5% 0.0% 0.0% Client’s income exceeded the guidelines 2.8% 0.0% 0.0% Other 11.8% 33.3% 42.7% TOTAL 100.0% 100.0% 100.0%
Second most frequent reason
Lack of food or resources 13.7% 50.4% 14.6% Services needed not provided by the program 10.3% 0.0% 28.5% Clients were ineligible or could not prove
eligibility 17.8% 0.0% 0.0%
Clients abused program/came too often 24.0% 0.0% 14.2% Clients exhibited drug, alcohol, or behavior
problem 6.8% 49.6% 42.7%
Clients lived outside service area 10.3% 0.0% 0.0% Clients had no proper identification 13.7% 0.0% 0.0% Client’s income exceeded the guidelines 0.0% 0.0% 0.0% Other 3.4% 0.0% 0.0% TOTAL 100.0% 100.0% 100.0%
SAMPLE SIZE (N) – Programs that turned away clients 35 4 7
SOURCE: This table was constructed based on usable responses to Question 11of the agency survey. NOTES: The percentages presented in this table are based only on usable responses, excluding missing, don’t
know, and refusal responses. All usable responses were weighted as described in Chapter 3 and in the Technical Appendix volume to represent all emergency food programs of The Capital Area Food Bank of Texas, Inc. The sample sizes (N) also include missing data.
For the most frequent reason, missing, don’t know, and refusal responses combined are 0.0% for pantry programs, 25.5% for kitchen programs, and 0.0% for shelter programs. For the second most frequent reason, missing, don’t know, and refusal responses combined are 17.0% for pantry programs, 0.0% for kitchen programs, and 0.0% for shelter programs.

Hunger in America 2010 The Capital Area Food Bank of Texas, Inc (4408)
215 CH 12. AGENCIES AND FOOD PROGRAMS: ABILITY TO MEET CLIENT NEEDS
12.4 ADDITIONAL FOOD RESOURCES NEEDED PER WEEK
Agencies were asked how much additional food is needed during a typical week to
adequately meet the demand for food at kitchen and shelter programs. Results are summarized
in Table 12.4.1.
TABLE 12.4.1
ADDITIONAL FOOD RESOURCES NEEDED PER WEEK
Pantry Programs
Kitchen Programs
Shelter Programs
No additional meals or meal equivalents needed n.a. 79.3% 88.4% 1 to 10 additional meals or meal equivalents needed n.a. 5.3% 0.0% 11 to 49 additional meals or meal equivalents needed n.a. 5.2% 5.8% 50 to 149 additional meals or meal equivalents needed n.a. 5.2% 0.0% 150 or more additional meals or meal equivalents needed n.a. 5.0% 5.8% TOTAL n.a. 100.0% 100.0%
SAMPLE SIZE (N) n.a. 30 30
Average number of additional meal equivalents needed among valid answersb n.a. 67 108
Median number of additional meal equivalents needed among valid answersb n.a. 30 108
SAMPLE SIZE (N) – Programs that need more food resources n.a. 4 2
SOURCE: This table was constructed based on usable responses to Question 14 of the agency survey. NOTES: The percentages presented in this table are based only on usable responses, excluding missing, don’t
know, and refusal responses. All usable responses were weighted as described in Chapter 3 and in the Technical Appendix volume to represent all emergency food programs of The Capital Area Food Bank of Texas, Inc. The sample sizes (N) also include missing data.
Missing, don’t know, and refusal responses combined are 36.7% for kitchen programs and 43.3% for shelter programs.
aZeros as responses were not included as valid responses for calculating the average and the median. For kitchens, responses greater than 1,300 meals were recoded as 1,300 meals. For shelters, responses greater than 1,600 meals were recoded as 1,600 meals.
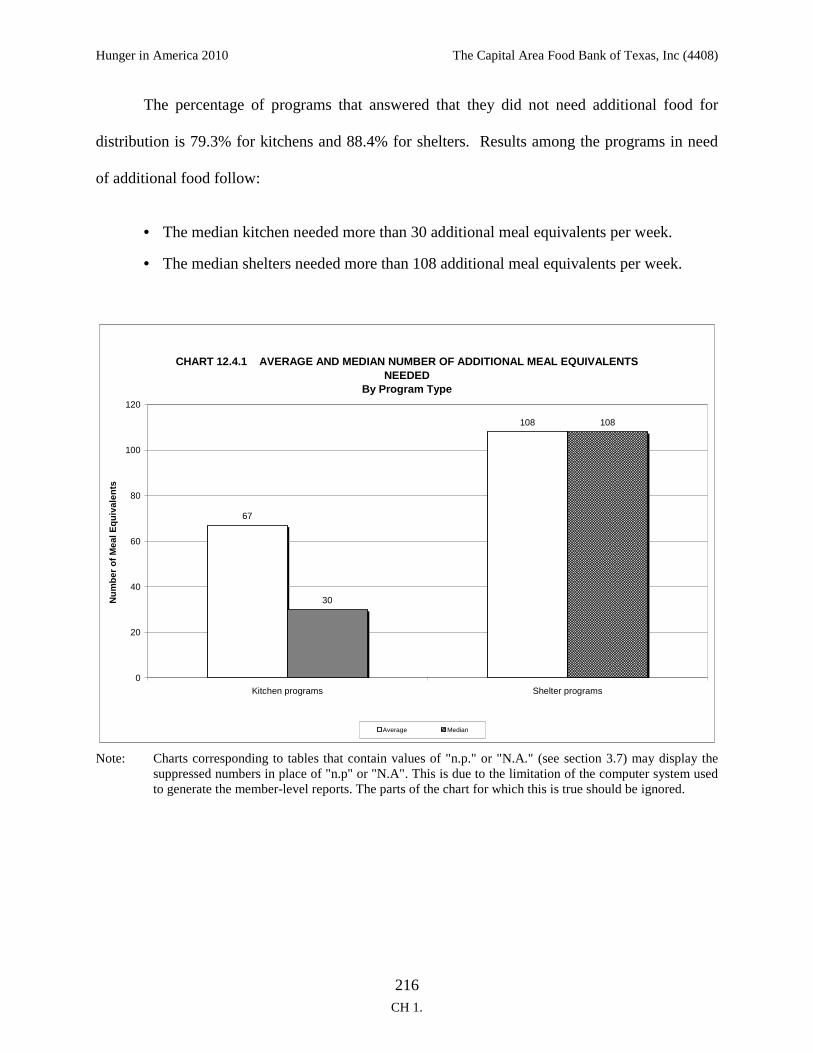
Hunger in America 2010 The Capital Area Food Bank of Texas, Inc (4408)
216 CH 1.
The percentage of programs that answered that they did not need additional food for
distribution is 79.3% for kitchens and 88.4% for shelters. Results among the programs in need
of additional food follow:
• The median kitchen needed more than 30 additional meal equivalents per week.
• The median shelters needed more than 108 additional meal equivalents per week.
CHART 12.4.1 AVERAGE AND MEDIAN NUMBER OF ADDITIONAL MEAL EQUIVALENTS NEEDED
By Program Type
67
108
30
108
0
20
40
60
80
100
120
Kitchen programs Shelter programs
Nu
mb
er o
f M
eal E
qu
ival
ents
Average Median
Note: Charts corresponding to tables that contain values of "n.p." or "N.A." (see section 3.7) may display the
suppressed numbers in place of "n.p" or "N.A". This is due to the limitation of the computer system used to generate the member-level reports. The parts of the chart for which this is true should be ignored.

Hunger in America 2010 The Capital Area Food Bank of Texas, Inc (4408)
217 CH 13. AGENCIES AND FOOD PROGRAMS: RESOURCES
13. AGENCIES AND FOOD PROGRAMS: RESOURCES
Substantial resources are required to operate emergency food programs effectively,
including food, staffing, and physical space. This chapter reports the types and sources of the
resources used by providers of The Capital Area Food Bank of Texas, Inc. We begin by
examining the sources of food reported by the providers. The use of paid and unpaid staff is then
examined, with a focus on the great importance of volunteers to the system.
13.1 SOURCES OF FOOD DISTRIBUTED BY PROGRAMS
The survey asked how much of the food distributed through the emergency food
programs comes from food banks, versus other sources. In particular, agencies were asked to
state the percentage of food received from each of the sources shown in Table 13.1.1.
TABLE 13.1.1
SOURCES OF FOOD DISTRIBUTED BY PROGRAMS
Sources of Food Pantry
Programs Kitchen
Programs Shelter
Programs
Average percentage of food received from food bank(s) 81.9% 47.6% 47.0%
Median percentage of food received from food bank(s) 90.0% 50.0% 50.0% Percentage of programs receiving food froma:
Commodity Supplemental Food Program (CSFP)b 31.3% 22.6% 0.0% The Emergency Food Assistance Program (TEFAP/EFAP) 40.2% 19.6% 18.6% Food Distribution Program on Indian Reservations (FDPIR) 4.3% 5.1% 0.0% Church or religious congregations 82.0% 47.2% 44.3% Local merchant or farmer donations 43.0% 39.2% 55.4% Local food drives (e.g., Boy Scouts) 62.8% 27.5% 38.7% Food purchased by agency 59.0% 71.6% 94.5% Otherc 22.6% 44.3% 27.7%
SAMPLE SIZE (N) 187 30 30 SOURCE: This table was constructed based on usable responses to questions 8, 8a, and 8b of the agency survey.

Hunger in America 2010 The Capital Area Food Bank of Texas, Inc (4408)
218 CH 13. AGENCIES AND FOOD PROGRAMS: RESOURCES
NOTES: The percentages presented in this table are based only on usable responses, excluding missing, don’t know, and refusal responses. All usable responses were weighted as described in Chapter 3 and in the Technical Appendix volume to represent all emergency food programs of The Capital Area Food Bank of Texas, Inc. The sample sizes (N) also include missing data. For the average percentage of food received from food bank, missing, don’t know, and refusal responses combined are 10.0% for pantry programs, 24.4% for kitchen programs, and 36.8% for shelter programs. For the percentage of programs that distribute government or USDA commodities received through CSFP, missing, don’t know, and refusal responses are 45.6% for pantry programs, 40.0% for kitchen programs, and 53.1% for shelter programs. For the percentage of programs that distribute government or USDA commodities received through TEFAP/EFAP, missing, don’t know, and refusal responses are 41.9% for pantry programs, 33.3% for kitchen programs, and 46.4% for shelter programs. For the percentage of programs that distribute government or USDA commodities received through FDPIR, missing, don’t know, and refusal responses are 27.0% for pantry programs, 33.3% for kitchen programs, and 43.0% for shelter programs. For the percentage of food from the other listed sources, missing, don’t know, and refusal responses combined are 19.6% for pantry programs, 16.8% for kitchen programs, and 40.1% for shelter programs.
aMultiple responses were accepted. bFor states in which the CSFP was not offered, agencies most likely confused food received from TEFAP with food received from CSFP.
cThis includes individual donations, organization gardens, and donations from other volunteer or civic groups.
According to agencies that operate the program, food banks are a major source of food.
81.9% of the food the pantries distribute, 47.6% of the food the kitchens serve, and 47.0% of the
food the shelters serve are provided by their food banks. Programs also receive food from other
sources:
• 40.2% of pantries, 19.6% of kitchens, and 18.6% of shelters receive food from TEFAP.
• 82.0% of pantries, 47.2% of kitchens, and 44.3% of shelters receive food from churches or religious congregations.
• 43.0% of pantries, 39.2% of kitchens, and 55.4% of shelters receive food from local merchants or farmer donations.
• 62.8% of pantries, 27.5% of kitchens, and 38.7% of shelters receive food from local food drives.

Hunger in America 2010 The Capital Area Food Bank of Texas, Inc (4408)
219 CH 13. AGENCIES AND FOOD PROGRAMS: RESOURCES
Table 13.1.2 presents the percentage of food received from a program’s food bank
according to the type of agency that operates the program.
TABLE 13.1.2
PERCENTAGE OF FOOD RECEIVED BY PROGRAMS FROM FOOD BANK, BY TYPE OF AGENCY THAT OPERATES THE PROGRAM
Agency Type
Sources of Food
Faith-Based or Religion-Affiliated Nonprofit
Other Private
Nonprofit Governmental
Community Action
Program (CAP)
Pantry Programs
Average percentage of food received from food bank(s) 81.1% 79.4% 96.1% 90.0%
SAMPLE SIZE (N) 100 47 17 1
Kitchen Programs
Average percentage of food received from food bank(s) 43.7% 25.8% 81.7% N.A.
SAMPLE SIZE (N) 11 9 4 0
Shelter Programs
Average percentage of food received from food bank(s) 40.0% 45.9% N.A. N.A.
SAMPLE SIZE (N) 8 18 2 0 SOURCE: This table was constructed based on usable responses to questions 8, 8a, 8b, and 27 of the agency survey. NOTES: The percentages presented in this table are based only on usable responses, excluding missing, don’t
know, and refusal responses. All usable responses were weighted as described in Chapter 3 and in the Technical Appendix volume to represent all emergency food programs of The Capital Area Food Bank of Texas, Inc. The sample sizes (N) also include missing data.
For pantry programs, missing, don’t know, and refusal responses combined are 2.1% for programs run by faith-based agencies, 13.4% for private nonprofit programs, 12.4% for governmental programs, and 0.0% for community action programs. For kitchen programs, missing, don’t know, and refusal responses combined are 10.3% for programs run by faith-based agencies, 22.4% for private nonprofit programs, 25.0% for governmental programs, and N.A. for community action programs. For shelter programs, missing, don’t know, and refusal responses combined are 37.6% for programs run by faith-based agencies, 28.1% for private nonprofit programs, 100.0% for governmental programs, and N.A. for community action programs.
Key findings include:

Hunger in America 2010 The Capital Area Food Bank of Texas, Inc (4408)
220 CH 13. AGENCIES AND FOOD PROGRAMS: RESOURCES
• Pantry programs operated by governmental agencies receive 96.1% of their food from the program’s food bank, whereas those operated by community action program agencies receive 90.0% from the program’s food bank.
• Kitchen programs operated by faith-based or religion-affiliated nonprofit agencies receive 43.7% of their food from the program’s food bank, whereas those operated by non-faith-based or non-religion-affiliated agencies receive 25.8% from the program’s food bank.
• Shelter programs operated by governmental agencies receive N.A. of their food from the program’s food bank. This compares to 40.0% for programs operated by a faith-based or religion-affiliated agency.

Hunger in America 2010 The Capital Area Food Bank of Texas, Inc (4408)
221 CH 13. AGENCIES AND FOOD PROGRAMS: RESOURCES
Table 13.1.3 presents the percentage of food received from a program’s food bank
according to the frequency with which the program stretched food resources.
TABLE 13.1.3
PERCENTAGE OF FOOD RECEIVED BY PROGRAMS FROM FOOD BANK, BY FREQUENCY OF STRETCHING FOOD RESOURCES
Frequency of Stretching Food Resources
Sources of Food Never Rarely Sometimes or
Always
Pantry Programs
Average percentage of food received from food bank(s) 79.2% 83.4% 82.2%
SAMPLE SIZE (N) 53 77 39
Kitchen Programs
Average percentage of food received from food bank(s) 46.7% 100.0% 38.8%
SAMPLE SIZE (N) 18 1 4
Shelter Programs
Average percentage of food received from food bank(s) 37.4% 59.0% 75.0%
SAMPLE SIZE (N) 13 4 1 SOURCE: This table was constructed based on usable responses to questions 8, 8a, 8b, and 13 of the agency survey. NOTES: The estimates presented in this table are based only on usable responses, excluding missing, don’t know,
and refusal responses. All usable responses were weighted as described in Chapter 3 and in the Technical Appendix volume to represent all emergency food programs of The Capital Area Food Bank of Texas, Inc. The sample sizes (N) also include missing data.
For pantry programs, missing, don’t know, and refusal responses combined are 1.9% for programs which report never having to stretch food resources, 0.0% for programs which rarely have to stretch food resources, and 0.0% for programs which sometimes or always have to stretch food resources. For kitchen programs, missing, don’t know, and refusal responses combined are 0.0% for programs which report never having to stretch food resources, 0.0% for programs which rarely have to stretch food resources, and 0.0% for programs which sometimes or always have to stretch food resources. For shelter programs, missing, don’t know, and refusal responses combined are 0.0% for programs which report never having to stretch food resources, 0.0% for programs which rarely have to stretch food resources, and 0.0% for programs which sometimes or always have to stretch food resources.
We find that pantry programs who report stretching food resources either
“sometimes” or “always” receive 82.2% of their food from the program’s food bank. Those who

Hunger in America 2010 The Capital Area Food Bank of Texas, Inc (4408)
222 CH 13. AGENCIES AND FOOD PROGRAMS: RESOURCES
report never having to stretch food resources receive 79.2% from the program’s food bank. In
addition:
• Kitchen programs who report stretching food resources either “sometimes” or “always” receive 38.8% of their food from the program’s food bank. Those who report never having to stretch food resources receive 46.7% from the program’s food bank.
• Shelter programs who report stretching food resources either “sometimes” or “always” receive 75.0% of their food from the program’s food bank. Those who report never having to stretch food resources receive 37.4% from the program’s food bank.

Hunger in America 2010 The Capital Area Food Bank of Texas, Inc (4408)
223 CH 13. AGENCIES AND FOOD PROGRAMS: RESOURCES
13.2 STAFF AND VOLUNTEER RESOURCES DURING PREVIOUS WEEK
Agencies were asked how many paid staff and volunteers they had and how many
volunteer hours they had received during the previous week. Table 13.2.1 presents the results.
TABLE 13.2.1
STAFF AND VOLUNTEER RESOURCES DURING PREVIOUS WEEK
Staff and Volunteer Resources Pantry
Programs Kitchen
Programs Shelter
Programs Other
Programs
Number of paid staffa None 56.2% 4.4% 0.0% n.a. 1 16.7% 30.2% 5.5% n.a. 2 11.0% 21.6% 11.0% n.a. 3 4.5% 8.6% 0.0% n.a. 4 3.8% 13.2% 0.0% n.a. 5 2.6% 4.3% 5.5% n.a. 6-10 4.6% 4.4% 27.7% n.a. More than 10 0.6% 13.3% 50.2% n.a. TOTAL 100.0% 100.0% 100.0% n.a.
Average number of paid staff among valid
responses 1 4 17 n.a. Median number of paid staff among valid
responses 0 2 12 n.a. Number of volunteersb
None 12.0% 42.4% 36.8% 18.2% 1 5.0% 4.2% 5.2% 5.0% 2-3 14.5% 8.4% 10.6% 22.8% 4-6 13.1% 0.0% 15.9% 16.2% 7-10 18.1% 8.2% 15.6% 16.5% 11-20 23.0% 12.2% 10.6% 8.0% 21-50 10.6% 16.5% 0.0% 8.3% More than 50 3.7% 8.1% 5.2% 4.9% TOTAL 100.0% 100.0% 100.0% 100.0%
Average number of volunteers among valid
responses 13 18 9 16 Median number of volunteers among valid
responses 8 2 3 4

Hunger in America 2010 The Capital Area Food Bank of Texas, Inc (4408)
224 CH 13. AGENCIES AND FOOD PROGRAMS: RESOURCES
Staff and Volunteer Resources Pantry
Programs Kitchen
Programs Shelter
Programs Other
Programs
Number of volunteer hoursc
None 12.0% 42.4% 36.8% 18.2% 1-5 9.4% 8.4% 5.2% 11.4% 6-10 15.0% 8.4% 5.4% 13.1% 11-25 25.6% 0.0% 21.0% 27.6% 26-50 18.7% 8.1% 5.4% 9.8% 51-100 11.5% 8.2% 15.8% 8.6% More than 100 8.1% 24.5% 10.4% 11.6% TOTAL 100.0% 100.0% 100.0% 100.0%
Average number of volunteer hours among
valid responses (hours) 37 58 42 16 Median number of volunteer hours among valid
responses (hours) 16 4 12 4
SAMPLE SIZE (N) 187 30 30 210 SOURCE: This table was constructed based on usable responses to questions 15, 16, and 26 of the agency survey. NOTES: The percentages presented in this table are based only on usable responses, excluding missing, don’t
know, and refusal responses. All usable responses were weighted as described in Chapter 3 and in the Technical Appendix volume to represent all emergency food programs of The Capital Area Food Bank of Texas, Inc. The sample sizes (N) also include missing data.
For number of paid staff, missing, don’t know, and refusal responses combined are 17.0% for pantry programs, 23.6% for kitchen programs, and 40.1% for shelter programs. For number of volunteers, missing, don’t know, and refusal responses combined are 14.9% for pantry programs, 20.2% for kitchen programs, 36.7% for shelter programs, and 70.4% for other programs. For number of volunteer hours, missing, don’t know, and refusal responses combined are 14.9% for pantry programs, 20.2% for kitchen programs, 36.7% for shelter programs, and 70.4% for other programs.
aFor pantries and kitchens, responses greater than 50 paid staff members were recoded as 50 paid staff members. For shelters, responses greater than 75 paid staff members were recoded as 75 paid staff members. bFor pantries, kitchens, and shelters, responses greater than 200 volunteers were recoded as 200 volunteers. For other programs, responses greater than 3,500 volunteers were recoded as 3,500 volunteers. cFor pantries, kitchens, and shelters, responses greater than 1,000 volunteer hours were recoded as 1,000 volunteer hours. For other programs, responses greater than 7,000 volunteer hours were recoded as 7,000 volunteer hours.
As Table 13.2.1 shows, 56.2% of the pantries, 4.4% of the kitchens, and 0.0% of the
shelters had no paid staff in their workforce during the week prior to this study. The median

Hunger in America 2010 The Capital Area Food Bank of Texas, Inc (4408)
225 CH 13. AGENCIES AND FOOD PROGRAMS: RESOURCES
number of paid staff was 0 for the pantries, 2 for the kitchens, and 12 for the shelters. More
results include:
• The median number of volunteers in a week was 8 for the pantries, 2 for the kitchens, and 3 for the shelters, and 4 for the other programs.
• The median number of volunteer hours during the previous week was 16 for the pantries, 4 for the kitchens, and 12 for the shelters, and 4 for the other programs.
• 12.0% of the pantries, 42.4% of the kitchens, and 36.8% of the shelters, and 18.2% of the other programs had no volunteers in their workforce during the previous week of this study.
CHART 13.2.1 MEDIAN NUMBER OF PAID STAFF AND VOLUNTEERS DURING PREVIOUS WEEK
By Program Type
0
2
12
8
2
3
0
2
4
6
8
10
12
14
Pantry programs Kitchen programs Shelter programs
Paid Staff and Volunteers
Med
ian
Nu
mb
er
Median number of paid staff Median number of volunteers
Note: Charts corresponding to tables that contain values of "n.p." or "N.A." (see section 3.7) may display the
suppressed numbers in place of "n.p" or "N.A". This is due to the limitation of the computer system used to generate the member-level reports. The parts of the chart for which this is true should be ignored.

Hunger in America 2010 The Capital Area Food Bank of Texas, Inc (4408)
226 CH 13. AGENCIES AND FOOD PROGRAMS: RESOURCES
13.3 PRODUCTS PURCHASED FROM SOURCES OTHER THAN FOOD BANKS
Agencies were asked to indicate the categories of products that their programs purchased
with cash from sources other than their food bank resources. Results based on agency responses
are summarized in Table 13.3.1.
TABLE 13.3.1
PRODUCTS PURCHASED FROM SOURCES OTHER THAN FOOD BANK
Categories of Products Programs Purchased with Cash from Sources Other than the Agency’s Food Banka
Pantry Programs
Kitchen Programs
Shelter Programs
Agencies with
Pantry, Kitchen,
or Shelter
Bread, cereal, rice, and pasta 40.9% 68.9% 69.9% 48.5% Fresh fruits and vegetables 15.4% 80.6% 70.0% 29.8% Canned or frozen fruits and vegetables 28.6% 46.2% 35.1% 32.5% Meat, poultry, fish, beans, eggs, and nuts 40.2% 72.6% 74.8% 49.0% Milk, yogurt, and cheese 16.5% 80.7% 79.9% 31.9% Fats, oils, condiments, and sweets 16.0% 69.2% 69.9% 28.2% Cleaning or personal hygiene products, diapers,
and toilet paper 39.6% 53.8% 79.9% 46.9% Otherb 7.9% 3.9% 5.0% 7.9% No outside purchases 31.8% 11.7% 10.2% 0.6%
SAMPLE SIZE (N) 187 30 30 207 SOURCE: This table was constructed based on usable responses to Question 22 of the agency survey. NOTES: All usable responses were weighted as described in Chapter 3 and in the Technical Appendix volume to
represent all emergency food programs of The Capital Area Food Bank of Texas, Inc. The sample sizes (N) also include missing data.
Missing, don’t know, and refusal responses combined are 12.6% for pantry programs, 13.4% for kitchen programs, 33.3% for shelter programs, and 8.8% for agencies with a pantry, kitchen, or shelter.
aMultiple responses were accepted. bThis includes beverages, such as coffee, tea, and juice; paper products, such as plastic utensils, paper plates, and garbage bags; and laundry products.
As Table 13.3.1 shows, 31.8% of the pantries, 11.7% of the kitchens, and 10.2% of the
shelters did not purchase products from sources other than their food banks. However, most

Hunger in America 2010 The Capital Area Food Bank of Texas, Inc (4408)
227 CH 13. AGENCIES AND FOOD PROGRAMS: RESOURCES
emergency food programs purchased products they needed from sources other than their food
banks. More details follow:
• 40.9% of the pantries, 68.9% of the kitchens, and 69.9% of the shelters purchased bread, cereal, rice, and pasta.
• 15.4% of the pantries, 80.6% of the kitchens, and 70.0% of the shelters purchased fresh fruits and vegetables.
• 28.6% of the pantries, 46.2% of the kitchens, and 35.1% of the shelters purchased canned or frozen fruits and vegetables.
• 40.2% of the pantries, 72.6% of the kitchens, and 74.8% of the shelters purchased meat, poultry, fish, beans, eggs, and nuts.
• 16.5% of the pantries, 80.7% of the kitchens, and 79.9% of the shelters purchased milk, yogurt, and cheese.
• 16.0% of the pantries, 69.2% of the kitchens, and 69.9% of the shelters purchased fats, oils, condiments, and sweets.
• 39.6% of the pantries, 53.8% of the kitchens, and 79.9% of the shelters purchased cleaning or personal hygiene products, diapers, and toilet paper.


Hunger in America 2010 The Capital Area Food Bank of Texas, Inc (4408)
229 CH 14. AGENCIES AND FOOD PROGRAMS: IMPORTANCE OF FOOD BANKS
14. AGENCIES AND FOOD PROGRAMS: IMPORTANCE OF FOOD BANKS
At the national level, food banks are by far the single largest source of food to agencies
and programs. This chapter examines the providers’ relationship to the food banks in more
detail. We first present tabulations of what products the providers would like to be able to obtain
in greater quantity from their food banks. Subsequent sections explore the overall importance of
the food banks to the operations of the providers and additional types of services the providers
would like to obtain from the food banks.
14.1 PRODUCTS NEEDED FROM FOOD BANKS
Agencies were asked to identify the categories of products they need more of from their
food bank. Table 14.1.1 presents the findings.
TABLE 14.1.1
PRODUCTS NEEDED FROM FOOD BANKS
Categories of Food and Nonfood Products Programs Need or Need More of from Their Food Banka Pantry
Programs Kitchen
Programs Shelter
Programs
Agencies with Pantry,
Kitchen, or Shelter
Bread, cereal, rice, and pasta 41.4% 31.3% 22.2% 40.1% Fresh fruits and vegetables 33.6% 57.8% 44.5% 36.2% Canned or frozen fruits and vegetables 20.0% 21.0% 11.0% 19.5% Meat, poultry, fish, beans, eggs, and nuts 64.5% 52.1% 55.0% 62.1% Milk, yogurt, and cheese 45.1% 63.0% 38.8% 45.5% Fats, oils, condiments, and sweets 17.0% 26.2% 33.3% 20.2% Cleaning or personal hygiene products, diapers,
and toilet paper 50.0% 36.4% 49.8% 48.6% Otherb 11.0% 10.7% 0.0% 10.6%
SAMPLE SIZE (N) 187 30 30 207 SOURCE: This table was constructed based on usable responses to Question 23 of the agency survey.

Hunger in America 2010 The Capital Area Food Bank of Texas, Inc (4408)
230 CH 14. AGENCIES AND FOOD PROGRAMS: IMPORTANCE OF FOOD BANKS
NOTES: All usable responses were weighted as described in Chapter 3 and in the Technical Appendix volume to represent all emergency food programs of The Capital Area Food Bank of Texas, Inc. The sample sizes (N) also include missing data.
Missing, don’t know, and refusal responses combined are 12.7% for pantry programs, 36.5% for kitchen programs, 40.0% for shelter programs, and 8.9% for agencies with a pantry, kitchen, or shelter.
aMultiple responses were accepted. bThis includes paper products, such as plastic utensils, paper plates, and garbage bags; beverages, such as juice, coffee, and tea; and dietary supplements, such as vitamins and Ensure.
As presented in Table 14.1.1, many agencies wish to receive more of certain products
from their food banks. Specifics are as follows:
• 41.4% of the pantries, 31.3% of the kitchens, and 22.2% of the shelters need more bread, cereal, rice, and pasta.
• 33.6% of the pantries, 57.8% of the kitchens, and 44.5% of the shelters need more fresh fruits and vegetables.
• 20.0% of the pantries, 21.0% of the kitchens, and 11.0% of the shelters need more canned or frozen fruits and vegetables.
• 64.5% of the pantries, 52.1% of the kitchens, and 55.0% of the shelters need more meat, poultry, fish, beans, eggs, and nuts.
• 45.1% of the pantries, 63.0% of the kitchens, and 38.8% of the shelters need more milk, yogurt, and cheese.
• 17.0% of the pantries, 26.2% of the kitchens, and 33.3% of the shelters need more fats, oils, condiments, and sweets.
• 50.0% of the pantries, 36.4% of the kitchens, and 49.8% of the shelters need more products in the category of cleaning or personal hygiene products, diapers, and toilet paper.

Hunger in America 2010 The Capital Area Food Bank of Texas, Inc (4408)
231 CH 14. AGENCIES AND FOOD PROGRAMS: IMPORTANCE OF FOOD BANKS
CHART 14.1.1P PRODUCTS NEEDED FROM FOOD BANKSAmong Pantry Programs
41.4%
33.6%
20.0%
64.5%
45.1%
17.0%
50.0%
11.0%
0.0% 10.0% 20.0% 30.0% 40.0% 50.0% 60.0% 70.0%
Bread, cereal, rice, and pasta
Fresh fruits and vegetables
Canned or frozen fruits andvegetables
Meat, poultry, fish, beans, eggs,and nuts
Milk, yogurt, and cheese
Fats, oils, condiments, and sweets
Cleaning or hygiene products
Other
Pro
du
cts
Percentage of Pantry Programs
CHART 14.1.1K PRODUCTS NEEDED FROM FOOD BANKSAmong Kitchen Programs
31.3%
57.8%
21.0%
52.1%
63.0%
26.2%
36.4%
10.7%
0.0% 10.0% 20.0% 30.0% 40.0% 50.0% 60.0% 70.0%
Bread, cereal, rice, and pasta
Fresh fruits and vegetables
Canned or frozen fruits andvegetables
Meat, poultry, fish, beans, eggs,and nuts
Milk, yogurt, and cheese
Fats, oils, condiments, and sweets
Cleaning or hygiene products
Other
Pro
du
cts
Percentage of Kitchen Programs

Hunger in America 2010 The Capital Area Food Bank of Texas, Inc (4408)
232 CH 14. AGENCIES AND FOOD PROGRAMS: IMPORTANCE OF FOOD BANKS
CHART 14.1.1S PRODUCTS NEEDED FROM FOOD BANKSAmong Shelter Programs
22.2%
44.5%
11.0%
55.0%
38.8%
33.3%
49.8%
0.0%
0.0% 10.0% 20.0% 30.0% 40.0% 50.0% 60.0%
Bread, cereal, rice, and pasta
Fresh fruits and vegetables
Canned or frozen fruits andvegetables
Meat, poultry, fish, beans, eggs,and nuts
Milk, yogurt, and cheese
Fats, oils, condiments, and sweets
Cleaning or hygiene products
Other
Pro
du
cts
Percentage of Shelter Programs
Note: Charts corresponding to tables that contain values of "n.p." or "N.A." (see section 3.7) may display the
suppressed numbers in place of "n.p" or "N.A". This is due to the limitation of the computer system used to generate the member-level reports. The parts of the chart for which this is true should be ignored.

Hunger in America 2010 The Capital Area Food Bank of Texas, Inc (4408)
233 CH 14. AGENCIES AND FOOD PROGRAMS: IMPORTANCE OF FOOD BANKS
14.2 IMPACT OF ELIMINATION OF FOOD BANK
Agencies were asked how much of an impact the elimination of their food bank would
have on their programs. Table 14.2.1 shows the results.
TABLE 14.2.1
IMPACT OF ELIMINATION OF FOOD BANK
If the Food Supply You (i.e., Agency) Receive from Your Food Bank Was Eliminated, How Much of an Impact Would This Have on Your Program?
Pantry Programs
Kitchen Programs
Shelter Programs
No impact at all 1.2% 11.8% 10.0% Minimal impact 2.4% 12.2% 19.9% Significant impact 24.1% 35.8% 29.9% Devastating impact 70.6% 32.1% 29.9% Unsure 1.8% 8.1% 10.2% TOTAL 100.0% 100.0% 100.0%
SAMPLE SIZE (N) 187 30 30 SOURCE: This table was constructed based on usable responses to Question 24 of the agency survey. NOTES: The percentages presented in this table are based only on usable responses, excluding missing, don’t
know, and refusal responses. All usable responses were weighted as described in Chapter 3 and in the Technical Appendix volume to represent all emergency food programs of The Capital Area Food Bank of Texas, Inc. The sample sizes (N) also include missing data.
Missing, don’t know, and refusal responses combined are 8.9% for pantry programs, 16.8% for kitchen programs, and 33.3% for shelter programs.
The results show that 94.7% of the pantries, 67.9% of the kitchens, and 59.9% of the
shelters said that the elimination of support from their food banks would have a significant or
devastating impact on their operation. Details include:
• 70.6% of the pantries, 32.1% of the kitchens, and 29.9% of the shelters believed that the elimination of the food bank would have a devastating impact on their programs.
• Another 24.1% of the pantries, 35.8% of the kitchens, and 29.9% of the shelters believed that the elimination of the food bank would have a significant impact on their programs.

Hunger in America 2010 The Capital Area Food Bank of Texas, Inc (4408)
234 CH 14. AGENCIES AND FOOD PROGRAMS: IMPORTANCE OF FOOD BANKS
CHART 14.2.1 IMPACT OF ELIMINATION OF FOOD BANKBy Program Type
1.2%
11.8%10.0%
2.4%
12.2%
19.9%
24.1%
35.8%
29.9%
70.6%
32.1%29.9%
0.0%
10.0%
20.0%
30.0%
40.0%
50.0%
60.0%
70.0%
80.0%
Pantry programs Kitchen programs Shelter programs
Degree of Impact
Per
cen
tag
e o
f P
rog
ram
s
No impact at all Minimal impact Significant impact Devastating impact
Note: Charts corresponding to tables that contain values of "n.p." or "N.A." (see section 3.7) may display the
suppressed numbers in place of "n.p" or "N.A". This is due to the limitation of the computer system used to generate the member-level reports. The parts of the chart for which this is true should be ignored.

Hunger in America 2010 The Capital Area Food Bank of Texas, Inc (4408)
235 CH 14. AGENCIES AND FOOD PROGRAMS: IMPORTANCE OF FOOD BANKS
14.3 AREAS OF ADDITIONAL ASSISTANCE DESIRED
Agencies were asked what kinds of additional assistance, in addition to food, they need to
meet their clients’ needs. Findings are presented in Table 14.3.1.
TABLE 14.3.1
AREAS OF ADDITIONAL ASSISTANCE DESIRED
Programs That Need Additional Assistance in Any of the Following Areasa
Pantry Programs
Kitchen Programs
Shelter Programs
Nutrition education 70.2% 35.9% 36.3% Training in food handling 50.3% 32.9% 25.1% Accessing local resources 74.5% 26.7% 24.8% Advocacy training 46.9% 9.8% 9.0% SNAP benefits and outreach 71.0% 36.2% 42.8% Summer feeding programs 54.1% 27.3% 22.1% Otherb 34.4% 10.1% 0.0%
SAMPLE SIZE (N) 187 30 30 SOURCE: This table was constructed based on usable responses to Question 25 of the agency survey. NOTE: All usable responses were weighted as described in Chapter 3 and in the Technical Appendix volume to
represent all emergency food programs of The Capital Area Food Bank of Texas, Inc. aMultiple responses were accepted. bThis includes funding and addiction programs.
Some programs wished to receive further assistance from their food banks in one or more
of the areas specified in Table 14.3.1. Details include:
• 70.2% of the pantries, 35.9% of the kitchens, and 36.3% of the shelters said that they needed additional assistance in nutrition education.
• 50.3% of the pantries, 32.9% of the kitchens, and 25.1% of the shelters said that they needed additional assistance in training in food handling.
• 74.5% of the pantries, 26.7% of the kitchens, and 24.8% of the shelters said that they needed additional assistance in accessing local resources.
• 46.9% of the pantries, 9.8% of the kitchens, and 9.0% of the shelters said that they needed additional assistance in advocacy training.

Hunger in America 2010 The Capital Area Food Bank of Texas, Inc (4408)
236 CH 14. AGENCIES AND FOOD PROGRAMS: IMPORTANCE OF FOOD BANKS
• 71.0% of the pantries, 36.2% of the kitchens, and 42.8% of the shelters said that they needed additional assistance in SNAP benefits and outreach.
• 54.1% of the pantries, 27.3% of the kitchens, and 22.1% of the shelters said that they needed additional assistance in summer feeding programs.
CHART 14.3.1P AREAS OF ADDITIONAL ASSISTANCE NEEDEDAmong Pantry Programs
70.2%
50.3%
74.5%
46.9%
71.0%
54.1%
34.4%
0.0%
10.0%
20.0%
30.0%
40.0%
50.0%
60.0%
70.0%
80.0%
90.0%
100.0%
Nutritioneducation
Training in foodhandling
Accessing localresources
Advocacy training SNAPbenefits/outreach
Summer feedingprograms
Other
Areas of Needed Assistance
Per
cen
tag
e o
f P
antr
y P
rog
ram
s

Hunger in America 2010 The Capital Area Food Bank of Texas, Inc (4408)
237 CH 14. AGENCIES AND FOOD PROGRAMS: IMPORTANCE OF FOOD BANKS
CHART 14.3.1K AREAS OF ADDITIONAL ASSISTANCE NEEDEDAmong Kitchen Programs
35.9%32.9%
26.7%
9.8%
36.2%
27.3%
10.1%
0.0%
10.0%
20.0%
30.0%
40.0%
50.0%
60.0%
70.0%
80.0%
90.0%
100.0%
Nutritioneducation
Training in foodhandling
Accessing localresources
Advocacy training SNAPbenefits/outreach
Summer feedingprograms
Other
Areas of Needed Assistance
Per
cen
tag
e o
f K
itch
en P
rog
ram
s
CHART 14.3.1S AREAS OF ADDITIONAL ASSISTANCE NEEDEDAmong Shelter Programs
36.3%
25.1% 24.8%
9.0%
42.8%
22.1%
0.0%0.0%
10.0%
20.0%
30.0%
40.0%
50.0%
60.0%
70.0%
80.0%
90.0%
100.0%
Nutritioneducation
Training in foodhandling
Accessing localresources
Advocacy training SNAPbenefits/outreach
Summer feedingprograms
Other
Areas of Needed Assistance
Per
cen
tag
e o
f S
hel
ter
Pro
gra
ms

Hunger in America 2010 The Capital Area Food Bank of Texas, Inc (4408)
238 CH 14. AGENCIES AND FOOD PROGRAMS: IMPORTANCE OF FOOD BANKS
Note: Charts corresponding to tables that contain values of "n.p." or "N.A." (see section 3.7) may display the suppressed numbers in place of "n.p" or "N.A". This is due to the limitation of the computer system used to generate the member-level reports. The parts of the chart for which this is true should be ignored.

Hunger in America 2010 The Capital Area Food Bank of Texas, Inc (4408)
APPENDIX A
PRECISION OF REPORTED ESTIMATES: SURVEY ERROR AND SAMPLING ERROR

Hunger in America 2010 The Capital Area Food Bank of Texas, Inc (4408)

Hunger in America 2010 The Capital Area Food Bank of Texas, Inc (4408)
Food banks should be aware that many of the estimates in the report are based on
relatively small sample sizes and are subject to survey error, which includes statistical sampling
error and error from the operational components of the survey (non-sampling error), such as
nonresponse, reporting error and measurement error. While the sampling design and sample
sizes can impose some control on the sampling error (and while this error can be quantified), the
non-sampling error reflects the degree of success in designing the questionnaire and data
collection procedures and in conducting the data collection activities at all stages. Unfortunately,
the non-sampling error cannot be quantified. The exact amount of variation (both sampling error
and non-sampling error) will be different for different food banks, and the relative contribution
of sampling error and non-sampling error to the total survey error will also vary by food bank.
In general, food banks should be aware that, at a minimum, most of the percentages in the
report are measured with sampling variation in the range of 8 to 12 percentage points.27 For
instance, if SNAP participation rates among households served by a food bank are estimated to
be—say—32%, it is very likely that the margin of error at a minimum extends from 24% to 40%
around the 32% estimate. Furthermore, in many instances this margin of error could be
12 percentage points or more, especially for subgroups with small sample sizes.
For estimates of annual numbers of clients, for most food banks the margin of error tends
to be in the range of about 25% of the estimates. For instance if a food bank’s providers are
estimated to serve—say—100,000 different clients annually, the margin of error around this
estimate would extent from about 75,000 to 125,000. In general, sampling error can depend on
such factors as:
27 Sampling variation is measured in these reports in terms of the 90% confidence interval around an
estimate. The 90% confidence interval implies that, with 90% confidence, the true value of an estimate will be in the interval. These confidence intervals, however, do not account for the non-sampling error, which can increase (sometimes substantially) the size of the confidence interval.

Hunger in America 2010 The Capital Area Food Bank of Texas, Inc (4408)
A.4
• Overall number of clients interviewed
• The number of different providers of each type at which clients were interviewed
• The specific variable(s) being considered
The ranges of precision highlighted above focus only on sampling variation due to
statistical sampling and the number of completed interviews. As noted previously, other forms
of survey error (the non-sampling error) will increase overall survey error. These other forms of
error include:
• Nonresponse. When completed interviews is obtained from only a portion of the clients selected for the survey
• Response Error. When the client interviewed does not provide an accurate answer to a question because the client either misunderstands the question or chooses not to provide an accurate answer
• Reporting Error. When counts or other information used in the sampling and other data collection activities are in error or missing
• Measurement Error. When the question in the questionnaire is not worded effectively to obtain the desired information from the client
These forms of error exist in all surveys, but the size of the non-sampling error (relative to the
sampling error) depends on the design of the data collection activities and implementation of
these by all persons involved in the survey.
SAMPLING ERROR UNDER DIFFERENT CIRCUMSTANCES
The food bank reports contain a wealth of information and an extensive number of estimates
based on the survey data. While in general it is desirable and useful to provide detailed
information on the sampling variation for all variables for each specific food bank and in the
multiple food bank-level reports, this is not feasible and would potentially detract from the
usefulness of the reports. To provide a useful measure of the extent of sampling error in the
estimates, we have computed estimates of the statistical variation for selected variables to

Hunger in America 2010 The Capital Area Food Bank of Texas, Inc (4408)
A.5
identify the general range of sampling variation28. Based on those calculations, we provide
below some general guidelines that can be useful in helping food banks assess how much
statistical variation is present in their estimates. The guidelines follow.29
Guidelines for Estimated Percentages for All Clients or Only Pantry Clients
The largest sample sizes at the food bank level are for the overall client sample and for
the subsample of pantry users. Following are guidelines for sampling variation for these groups:
Guideline 1. If you are considering a percentage estimate in the range of 30% to 70%
and if the estimate is based on between 300 and 500 observations, then the margin of error is
likely to be plus-or-minus about 8 percentage points.
Example 1. Suppose that the report for a specific food bank estimates the percentage of pantry households that include at least one working member as 30%. Also, suppose the sample size for pantry clients at that food bank is 330. Then we can be 90% confident that the true value lies between 22% and 38%. Guideline 2. If you are considering a percentage estimate below 30% or above 70%, and
if the estimate is based on between 300 and 500 observations, then the margin of error is likely to
be plus-or-minus about 5 percentage points. (This is like Guideline 1 but with a different
percentage range.)
Example 2. Suppose that the report for a specific food bank estimates the percentage of all households that include at least one member who is 65 years old or older. Suppose the estimate is 10%, and suppose the sample size for pantry clients at that food bank is 316. Then we can be 90% confident that the true value lies between 5% and 15%.
28 As noted before, the measures of sampling variation do not account for non-sampling error. 29 Estimates of the sampling variation are based on estimates computed using data analysis software design
for complex surveys (SUDAAN) to estimate standard errors for selected estimates for each individual participating food banks. The estimates in this appendix reflect average standard errors across food banks. The calculations take into account clustering, differential sampling rates, and other aspects of the sampling design. The confidence intervals reported in the text are 90% confidence intervals.

Hunger in America 2010 The Capital Area Food Bank of Texas, Inc (4408)
A.6
Guideline 3. If you are considering a percentage estimate in the range of 30% to 70%
and if the estimate is based on 100 to 300 observations, then the margin of error is plus-or-minus
about 9 percentage points. (This is like Guideline 1 but with a different sample size.)
Example 3. Suppose that the report for a specific food bank estimates the percentage of pantry households that are food insecure to be 60%, and suppose the sample size for pantry clients at that food bank is 122. Then we can be 90% confident that the true value lies between 51% and 69%. Guideline 4. If you are considering a percentage estimate below 30% or above 70%, and
if the estimate is based on about 100 to 300 observations, then the margin of error is likely to be
about plus-or-minus about 6 percentage points. (This is like Guideline 2 but with a different
sample size.)
Example 4. Suppose that the report for a specific food bank has an estimate of 15% for the percentage of all households that include at least one member who is 65 years old or older. Suppose too that the sample size for pantry clients at that food bank is 220. Then we can be 90% confident that the true value lies between 9% and 21%.
Guidelines for Estimated Percentages for Clients at Kitchens or Shelters
The numbers of completed interviews at kitchens and shelters tend to be smaller and the
estimates from these providers also inherently have greater statistical variation because of the
frequency of operation. Following are guidelines for sampling variation for these groups:
For Kitchens
Guideline 5. If you are considering a percentage estimate for kitchens in the range of
30% to 70% and if the estimate is based on between 30 and 50 observations, then the margin of
error is approximately plus-or-minus about 18 percentage points.
Example 5. Suppose that the report for a specific food bank include an estimate that 40% of the kitchen households include at least one working member. Also, suppose the sample size for kitchen clients at that food bank is 45. Then we can be 90% confident that the true value lies between 27%and 63%.

Hunger in America 2010 The Capital Area Food Bank of Texas, Inc (4408)
A.7
Guideline 6. If you are considering a percentage estimate for kitchens that is below 30%
or above 70%, and if the estimate is based on between 30 and 50 observations, then the margin
of error is plus-or-minus about 10 percentage points. (This is like Guideline 5 but with a
different percentage range.)
Example 6. Suppose that the report for a specific food bank includes an estimate of the percentage of all households that include at least one member who is 65 years old or older. Suppose the estimate is 20%, and suppose the sample size for kitchen clients at that food bank is 43. Then we can be 90% confident that the true value lies between 10% and 30%. Guideline 7. If you are considering a percentage estimate for kitchen clients in the range
of 30% to 70% and if the estimate is based on more than 50 observations, then the margin of
error is plus-or-minus about 16 percentage points. (This is like Guideline 5 but with a different
sample size.)
Example 7. Suppose that the report for a specific food bank estimates the percentage of kitchen households that are food insecure to be 60%, and suppose the sample size for kitchen clients at that food bank is 87. Then we can be 90% confident that the true value lies between 44% and 76%. Guideline 8. If you are considering a percentage estimate for kitchen clients that is
below 30% or above 70%, and if the estimate is based on more than 50 completed interviews,
then the margin of error is plus-or-minus about 10 percentage points. (This is like Guideline 6
but with a different sample size.)
Example 8. Suppose that the report for a specific food bank has an estimate of 22% for all kitchen households include at least one member who is 65 years old or older. Suppose too that the sample size for kitchen clients at that food bank is 58. Then we can be 90% confident that the true value lies between 12% and 32%.

Hunger in America 2010 The Capital Area Food Bank of Texas, Inc (4408)
A.8
For Shelters
Guideline 9. If you are considering a percentage estimate for a shelter in the range of
30% to 70% and if the estimate is based on more than 30 completed interviews, then the margin
of error is plus-or-minus about 19 percentage points.
Example 9. Suppose that the report for a specific food bank estimates the percentage of shelter households which food insecure as 65%. Also, suppose the sample size for shelter clients at that food bank is 45. Then we can be 90% confident that the true value lies between 46% and 84%. Guideline 10. If you are considering a percentage estimate for shelters that is below 30%
or above 70%, and if the estimate is based on more than 30 observations, then the margin of error
is plus-or-minus about 11 percentage points. (This is like Guideline 9 but with a different
percentage range.)
Example 10. Suppose that the report for a specific food bank, there is the estimate of the percentage of shelter households that include at least one working member. Suppose the estimate is 20%, and suppose the sample size for shelter clients at that food bank is 43. Then we can be 90% confident that the true value lies between 9% and 31%.
Guidelines for Estimates of Numbers of Annual Clients
The food bank reports also include estimates of the numbers of different clients served by
the food banks in a year. For the typical food bank with about 400 overall client observations,
the margin of error is approximately plus-or-minus 25% of the estimate. For instance, if a food
bank is estimated to have approximately 20,000 different clients annually, then the statistical
margin of error extends between approximately 15,000 and 25,000 clients.

Hunger in America 2010 The Capital Area Food Bank of Texas, Inc (4408)
APPENDIX B
SNAP ELIGIBILITY CRITERIA

Hunger in America 2010 The Capital Area Food Bank of Texas, Inc (4408)

Hunger in America 2010 The Capital Area Food Bank of Texas, Inc (4408)
For 2009, the following SNAP eligibility rules applied to households in the 48 contiguous
states and the District of Columbia.30
A. RESOURCES (RULES ON RESOURCE LIMITS)
Households may have $2,000 in countable resources, such as a bank account, or $3,000
in countable resources if at least one person is age 60 or older or is disabled. However, certain
resources are not counted, such as a home and lot, the resources of people who receive
Supplemental Security Income (SSI), the resources of people who receive Temporary Assistance
for Needy Families (TANF) (formerly AFDC), and most retirement (pension) plans.
A licensed vehicle is not counted if:
• It is used for income-producing purposes
• It is annually producing income consistent with its fair market value
• It is needed for long distance travel for work (other than daily commute)
• It is used as the home
• It is needed to transport a physically disabled household member
• It is needed to carry most of the household’s fuel or water
• The household has little equity in the vehicle (because of money owed on the vehicle, it would bring no more than $1,500 if sold)
For the following licensed vehicles, the fair market value over $4,650 is counted:
• One per adult household member
• Any other vehicle a household member under 18 drives to work, school, job training, or to look for work
30 This information is taken from http://www.fns.usda.gov/fsp/applicant_recipients/Eligibility.htm accessed
on August 20, 2009.

Hunger in America 2010 The Capital Area Food Bank of Texas, Inc (4408)
B.4
For all other vehicles, the fair market value over $4,650 or the equity value, whichever is
more, is counted as a resource.
B. INCOME (RULES ON INCOME LIMITS)
Households must meet income tests unless all members are receiving Title IV (TANF),
SSI, or, in some places, general assistance. Most households must meet both the gross and net
income tests, but a household with an elderly person or a person who is receiving certain types of
disability payments only has to meet the net income test. Gross income is equal to a household’s
total, nonexcluded income, before any deductions have been made. Net income is equal to gross
income minus allowable deductions.
Households, except those noted, that have income over the amounts listed below cannot
get SNAP benefits.
People in Household Gross Monthly Income Limits Net Monthly Income Limits
1 $1,127 $867 2 $1,517 $1,167 3 $1,907 $1,467 4 $2,297 $1,767 5 $2,687 $2,067 6 $3,077 $2,367 7 $3,467 $2,667 8 $3,857 $2,967 Each additional person +$390 +$300 Note: Effective October 2008 through September 2009.
C. DEDUCTIONS (RULES ON ALLOWABLE DEDUCTIONS FROM INCOME) Deductions are allowed as follows (effective October 2008 through September 2009):
• A 20% deduction from earned income
• A standard deduction of $144 for households of 1 to 3 people and $147 for a household size of 4 (higher for larger households, and in Alaska, Hawaii, and Guam)

Hunger in America 2010 The Capital Area Food Bank of Texas, Inc (4408)
B.5
• A dependent care deduction when needed for work, training, or education
• Medical expenses for elderly or disabled members which are more than $35 for the month if they are not paid by insurance or someone else
• Legally owed child support payments
• Some states allow homeless households a set amount ($143) for shelter costs
• Excess shelter costs that are more than half the household’s income after the other deductions. Allowable costs include the cost of fuel to heat and cook with, electricity, water, the basic fee for one telephone, rent or mortgage payments, and taxes on the home. The amount of the shelter deduction cannot be more than $446 unless one person in the household is elderly or disabled. (The limit is higher in Alaska, Hawaii, and Guam.)
D. WORK AND ALIENS (RULES ON WORK, AND LEGAL IMMIGRANTS)
With some exceptions, able-bodied adults between 16 and 60 must register for work,
accept suitable employment, and take part in an employment and training program to which they
are referred by the SNAP office. Failure to comply with these requirements can result in
disqualification from the program. In addition, able-bodied adults between 18 and 50 who do
not have any dependent children can get SNAP benefits for only 3 months in a 36-month period
if they do not work or participate in a workfare or employment and training program other than
job search. This requirement is waived in some locations.
E. IMMIGRANT ELIGIBILITY REQUIREMENTS
The 2002 Farm bill restores SNAP eligibility to most legal immigrants that:
• Have lived in the country five years
• Are receiving disability-related assistance or benefits, regardless of entry date
• Starting October 1, 2003, are children regardless of entry date

Hunger in America 2010 The Capital Area Food Bank of Texas, Inc (4408)
B.6
Certain non-citizens, such as those admitted for humanitarian reasons and those admitted
for permanent residence, are also eligible for the program. Eligible household members can get
SNAP benefits even if there are other members of the household that are not eligible.
Non-citizens that are in the United States temporarily, such as students, are not eligible.
A number of states have their own programs to provide benefits to immigrants who do
not meet the regular SNAP eligibility requirements.

Hunger in America 2010 The Capital Area Food Bank of Texas, Inc (4408)
APPENDIX C
SOURCES OF INFORMATION SHOWN IN THE CHARTS AND TABLES IN CHAPTERS 5 THROUGH 14

Hunger in America 2010 The Capital Area Food Bank of Texas, Inc (4408)

Hunger in America 2010 The Capital Area Food Bank of Texas, Inc (4408)
Table Client Question Agency Question 5.1.1 Client data 5.2.1 2. Sex
3. Age 4. Relationship 5. Citizen 6. Employment 7. Are there any children age 0-5 years in household? 9. Are you married, living with someone as married, widowed, divorced, separated, or have you never been married? 10. What is the highest level of education you completed? 11. Are you Spanish, Latino, or of Hispanic descent or origin? 11a. Would that be Mexican, Puerto Rican, Cuban, some other Spanish, Hispanic, or Latino group? 12. What is your race? 81a. ZIP code 82. Are you a registered voter?
5.3.1 2. Sex 3. Age 5. Citizen
5.3.2 2. Sex 3. Age 5. Citizen 6a. Are there more than 10 people in the household? 6b. How many of those people are children less than 18 years old?
5.4.1 9. Are you married, living with someone as married, widowed, divorced, separated, or have you never been married?
5.5.1 10. What is the highest level of education you completed?
5.6.1 11. Are you Spanish, Latino, or of Hispanic descent or origin? 11a. Would that be Mexican, Puerto Rican, Cuban, some other Spanish, Hispanic, or Latino group? 12. What is your race?
5.7.1 3. Age 6. Employment

Hunger in America 2010 The Capital Area Food Bank of Texas, Inc (4408)
C.4
Table Client Question Agency Question 5.7.2 6. Employment
12a. Is respondent working? 13. You mentioned that you are not working now. How long has it been since you worked? 14a. Is this job a managerial or professional job? 15. Are you participating in any gov’t sponsored job training or work experience programs, such as the food stamp employment training program or any work program tied to your receipt of TANF?
5.8.1.1 Federal Poverty Level Table 5.8.2.1 27a. What was your household’s total
income for last month?
5.8.3.1 27. What was your total income last month before taxes? 28. What was your household’s main source of income last month?
5.8.3.2 6. Employment 25. Did you get money in the last month from any of the following….? 27. What was your total income last month before taxes?
5.8.4.1 29. What was your household’s total income before taxes and other deductions last year from all sources, including Social Security and other gov’t programs?
5.8.5.1 10. What is the highest level of education you completed? 29. What was your household’s total income before taxes and other deductions last year from all sources, including Social Security and other gov’t programs?

Hunger in America 2010 The Capital Area Food Bank of Texas, Inc (4408)
C.5
Table Client Question Agency Question 5.8.6.1 3. Age
6a. Are there more than 10 people in the household? 6b. How many of those people are children less than 18 years old? 6c. Does household include a grandchild? 7. Are there any children age 0-5 years in household? 29. What was your household’s total income before taxes and other deductions last year from all sources, including Social Security and other gov’t programs?
5.9.1.1 16. Please tell me the kind of place where you now live. 17. Do you own, rent, live free with someone else? 18. Were you late paying your last month’s rent or mortgage? 81. Does your household receive Section 8 or Public Housing Assistance?
5.9.1.2 16. Please tell me the kind of place where you now live. 29. What was your household’s total income before taxes and other deductions last year from all sources, including Social Security and other gov’t programs?
5.9.1.3 16. Please tell me the kind of place where you now live. 29. What was your household’s total income before taxes and other deductions last year from all sources, including Social Security and other gov’t programs?
5.9.2.1 19. Do you have access to a place to prepare a meal, a working telephone, and a car that runs?

Hunger in America 2010 The Capital Area Food Bank of Texas, Inc (4408)
C.6
Table Client Question Agency Question 6.1.1.1 42. “The food I/we bought just didn’t
last, and I/we didn’t have money to get more.” (Often, sometimes, never true) 43. “I/We couldn’t afford to eat balanced meals.” (Often, sometimes, never true) 44. In the last 12 months, did you ever cut the size of your meals or skip meals because there wasn’t enough money for food? 44a. How often did this happen? 45. In the last 12 months, did you ever eat less than you felt you should because there wasn’t enough money to buy food? 46. In the last 12 months, were you ever hungry but didn’t eat because you couldn’t afford enough food?
6.1.1.2 6b. How many of those people are children less than 18 years old? 42. “The food I/we bought just didn’t last, and I/we didn’t have money to get more.” (Often, sometimes, never true) 43. “I/We couldn’t afford to eat balanced meals.” (Often, sometimes, never true) 44. In the last 12 months, did you ever cut the size of your meals or skip meals because there wasn’t enough money for food? 44a. How often did this happen? 45. In the last 12 months, did you ever eat less than you felt you should because there wasn’t enough money to buy food? 46. In the last 12 months, were you ever hungry but didn’t eat because you couldn’t afford enough food?

Hunger in America 2010 The Capital Area Food Bank of Texas, Inc (4408)
C.7
Table Client Question Agency Question 6.1.1.3 7. Are there any children age 0-5 years
in household? 42. “The food I/we bought just didn’t last, and I/we didn’t have money to get more.” (Often, sometimes, never true) 43. “I/We couldn’t afford to eat balanced meals.” (Often, sometimes, never true) 44. In the last 12 months, did you ever cut the size of your meals or skip meals because there wasn’t enough money for food? 44a. How often did this happen? 45. In the last 12 months, did you ever eat less than you felt you should because there wasn’t enough money to buy food? 46. In the last 12 months, were you ever hungry but didn’t eat because you couldn’t afford enough food?

Hunger in America 2010 The Capital Area Food Bank of Texas, Inc (4408)
C.8
Table Client Question Agency Question 6.1.1.4 3. Age
6a. Are there more than 10 people in the household? 6b. How many of those people are children less than 18 years old? 6c. Does household include a grandchild? 7. Are there any children age 0-5 years in household? 42. “The food I/we bought just didn’t last, and I/we didn’t have money to get more.” (Often, sometimes, never true) 43. “I/We couldn’t afford to eat balanced meals.” (Often, sometimes, never true) 44. In the last 12 months, did you ever cut the size of your meals or skip meals because there wasn’t enough money for food? 44a. How often did this happen? 45. In the last 12 months, did you ever eat less than you felt you should because there wasn’t enough money to buy food? 46. In the last 12 months, were you ever hungry but didn’t eat because you couldn’t afford enough food?
6.1.2.1 42. “The food I/we bought just didn’t last, and I/we didn’t have money to get more.” (Often, sometimes, never true) 43. “I/We couldn’t afford to eat balanced meals.” (Often, sometimes, never true) 44. In the last 12 months, did you ever cut the size of your meals or skip meals because there wasn’t enough money for food? 44a. How often did this happen? 45. In the last 12 months, did you ever eat less than you felt you should because there wasn’t enough money to buy food? 46. In the last 12 months, were you ever hungry but didn’t eat because you couldn’t afford enough food?

Hunger in America 2010 The Capital Area Food Bank of Texas, Inc (4408)
C.9
Table Client Question Agency Question 6.1.3.1 29. What was your household’s total
income before taxes and other deductions last year from all sources, including Social Security and other gov’t programs? 42. “The food I/we bought just didn’t last, and I/we didn’t have money to get more.” (Often, sometimes, never true) 43. “I/We couldn’t afford to eat balanced meals.” (Often, sometimes, never true) 44. In the last 12 months, did you ever cut the size of your meals or skip meals because there wasn’t enough money for food? 44a. How often did this happen? 45. In the last 12 months, did you ever eat less than you felt you should because there wasn’t enough money to buy food? 46. In the last 12 months, were you ever hungry but didn’t eat because you couldn’t afford enough food?
6.1.3.2 29. What was your household’s total income before taxes and other deductions last year from all sources, including Social Security and other gov’t programs? 42. “The food I/we bought just didn’t last, and I/we didn’t have money to get more.” (Often, sometimes, never true) 43. “I/We couldn’t afford to eat balanced meals.” (Often, sometimes, never true) 44. In the last 12 months, did you ever cut the size of your meals or skip meals because there wasn’t enough money for food? 44a. How often did this happen? 45. In the last 12 months, did you ever eat less than you felt you should because there wasn’t enough money to buy food? 46. In the last 12 months, were you ever hungry but didn’t eat because you couldn’t afford enough food?

Hunger in America 2010 The Capital Area Food Bank of Texas, Inc (4408)
C.10
Table Client Question Agency Question 6.1.4.1 20. Would you say your own health is
excellent, very good, good, fair, or poor? 21. Does person live alone? 42. “The food I/we bought just didn’t last, and I/we didn’t have money to get more.” (Often, sometimes, never true) 43. “I/We couldn’t afford to eat balanced meals.” (Often, sometimes, never true) 44. In the last 12 months, did you ever cut the size of your meals or skip meals because there wasn’t enough money for food? 44a. How often did this happen? 45. In the last 12 months, did you ever eat less than you felt you should because there wasn’t enough money to buy food? 46. In the last 12 months, were you ever hungry but didn’t eat because you couldn’t afford enough food?
6.1.5.1 5. Citizen 42. “The food I/we bought just didn’t last, and I/we didn’t have money to get more.” (Often, sometimes, never true) 43. “I/We couldn’t afford to eat balanced meals.” (Often, sometimes, never true) 44. In the last 12 months, did you ever cut the size of your meals or skip meals because there wasn’t enough money for food? 44a. How often did this happen? 45. In the last 12 months, did you ever eat less than you felt you should because there wasn’t enough money to buy food? 46. In the last 12 months, were you ever hungry but didn’t eat because you couldn’t afford enough food?

Hunger in America 2010 The Capital Area Food Bank of Texas, Inc (4408)
C.11
Table Client Question Agency Question 6.1.5.2 5. Citizen
42. “The food I/we bought just didn’t last, and I/we didn’t have money to get more.” (Often, sometimes, never true) 43. “I/We couldn’t afford to eat balanced meals.” (Often, sometimes, never true) 44. In the last 12 months, did you ever cut the size of your meals or skip meals because there wasn’t enough money for food? 44a. How often did this happen? 45. In the last 12 months, did you ever eat less than you felt you should because there wasn’t enough money to buy food? 46. In the last 12 months, were you ever hungry but didn’t eat because you couldn’t afford enough food?
6.2.1 42. “The food I/we bought just didn’t last, and I/we didn’t have money to get more.” (Often, sometimes, never true) 43. “I/We couldn’t afford to eat balanced meals.” (Often, sometimes, never true)
6.2.2 29. What was your household’s total income before taxes and other deductions last year from all sources, including Social Security and other gov’t programs? 31. Are you (or others in your household) receiving Food Stamps (SNAP) now? 42. “The food I/we bought just didn’t last, and I/we didn’t have money to get more.” (Often, sometimes, never true) 43. “I/We couldn’t afford to eat balanced meals.” (Often, sometimes, never true)

Hunger in America 2010 The Capital Area Food Bank of Texas, Inc (4408)
C.12
Table Client Question Agency Question 6.3.1 44. In the last 12 months, did you ever
cut the size of your meals or skip meals because there wasn’t enough money for food? 44a. How often did this happen? 45. In the last 12 months, did you ever eat less than you felt you should because there wasn’t enough money to buy food? 46. In the last 12 months, were you ever hungry but didn’t eat because you couldn’t afford enough food? 47. In the last 12 months, did you ever not eat for a whole day because there wasn’t enough money for food?
6.3.2 29. What was your household’s total income before taxes and other deductions last year from all sources, including Social Security and other gov’t programs? 31. Are you (or others in your household) receiving Food Stamps (SNAP) now? 44a. How often did this happen? 45. In the last 12 months, did you ever eat less than you felt you should because there wasn’t enough money to buy food? 46. In the last 12 months, were you ever hungry but didn’t eat because you couldn’t afford enough food? 47. In the last 12 months, did you ever not eat for a whole day because there wasn’t enough money for food?

Hunger in America 2010 The Capital Area Food Bank of Texas, Inc (4408)
C.13
Table Client Question Agency Question 6.4.1 3. Age
6b. How many of the other people in your household are children less than 18 years old? 49. “My child was not eating enough because I/we just couldn’t afford enough food.” (Often, sometimes, never true) 50. In the last 12 months, did your child ever skip meals because there wasn’t enough money for food? 51. In the last 12 months, was your child ever hungry but you just couldn’t afford more food?
6.4.2 29. What was your household’s total income before taxes and other deductions last year from all sources, including Social Security and other gov’t programs? 31. Are you (or others in your household) receiving Food Stamps (SNAP) now? 49. “My child was not eating enough because I/we just couldn’t afford enough food.” (Often, sometimes, never true) 50. In the last 12 months, did your child ever skip meals because there wasn’t enough money for food? 51. In the last 12 months, was your child ever hungry but you just couldn’t afford more food?
6.5.1 52. In the past 12 months, have you or anyone in your household every had to choose between: paying for food and paying for medicine or medical care; paying for food and paying for utilities or heating fuel; paying for food and paying for rent or mortgage?

Hunger in America 2010 The Capital Area Food Bank of Texas, Inc (4408)
C.14
Table Client Question Agency Question 6.5.2 44. In the last 12 months, did you ever
cut the size of your meals or skip meals because there wasn’t enough money for food? 44a. How often did this happen? 45. In the last 12 months, did you ever eat less than you felt you should because there wasn’t enough money to buy food? 46. In the last 12 months, were you ever hungry but didn’t eat because you couldn’t afford enough food? 52. In the past 12 months, have you or anyone in your household every had to choose between: paying for food and paying for medicine or medical care; paying for food and paying for utilities or heating fuel; paying for food and paying for rent or mortgage?
6.5.3 44. In the last 12 months, did you ever cut the size of your meals or skip meals because there wasn’t enough money for food? 44a. How often did this happen? 45. In the last 12 months, did you ever eat less than you felt you should because there wasn’t enough money to buy food? 46. In the last 12 months, were you ever hungry but didn’t eat because you couldn’t afford enough food? 52. In the past 12 months, have you or anyone in your household every had to choose between: paying for food and paying for medicine or medical care; paying for food and paying for utilities or heating fuel; paying for food and paying for rent or mortgage?

Hunger in America 2010 The Capital Area Food Bank of Texas, Inc (4408)
C.15
Table Client Question Agency Question 7.1.1 30. Have you ever applied for SNAP
benefits? 31. Are you receiving SNAP benefits now? 32. Did you receive SNAP benefits in the past 12 months? 34. How long have you been receiving SNAP benefits? 35. How many weeks do your SNAP benefits usually last?
7.1.2 3. Age 6a. Are there more than 10 people in the household? 6b. How many of those people are children less than 18 years old? 6c. Does household include a grandchild? 7. Are there any children age 0-5 years in household? 30. Have you ever applied for SNAP benefits? 31. Are you receiving SNAP benefits now? 32. Did you receive SNAP benefits in the past 12 months? 34. How long have you been receiving SNAP benefits? 35. How many weeks do your SNAP benefits usually last?
7.2.1 36. Why haven’t you applied for the Supplemental Nutrition Assistance Program?
7.2.2 3. Age 6a. Are there more than 10 people in the household? 6b. How many of those people are children less than 18 years old? 6c. Does household include a grandchild? 7. Are there any children age 0-5 years in household? 36. Why haven’t you applied for the Supplemental Nutrition Assistance Program?
7.3.1 33. Why don’t you receive SNAP benefits now?

Hunger in America 2010 The Capital Area Food Bank of Texas, Inc (4408)
C.16
Table Client Question Agency Question 7.3.2 3. Age
6a. Are there more than 10 people in the household? 6b. How many of those people are children less than 18 years old? 6c. Does household include a grandchild? 7. Are there any children age 0-5 years in household? 33. Why don’t you receive SNAP benefits now?
7.3.3 33. Why don’t you receive SNAP benefits now?
7.3.4 33. Why don’t you receive SNAP benefits now?
7.4.1 7a. Do any of your younger-than-school-age children go to day care? 8. Does the government pay part of the cost of day care? 39. In which, if any, of the following programs do you currently participate? 41. Did the child(ren) in your household participate in the summer food programs providing free lunches for child(ren) in the summer of 2008?
7.4.2 41. Did the child(ren) in your household participate in the summer food programs providing free lunches for child(ren) in the summer of 2008? 41a. Why didn’t the child(ren) in your household participate in the summer food program?
7.5.1 26. Did you receive general assistance, welfare, or TANF at any time in the past two years?
7.6.1 38. Where do you do most of your grocery shopping?
8.1.1 20. Would you say your own health is excellent, very good, good, fair, or poor? 21. Is anyone in your household in poor health?

Hunger in America 2010 The Capital Area Food Bank of Texas, Inc (4408)
C.17
Table Client Question Agency Question 8.2.1 22a-f. Do you have any of the
following kinds of health insurance? 23. Do you have unpaid medical or hospital bills? 24. In the past 12 months, have you been refused medical care because you could not pay or because you had a Medicaid or Medical Assistance card?
8.2.2 22b. Do you have…State Medical Assistance Program or Medicaid? 29. What was your household’s total income before taxes and other deductions last year from all sources, including Social Security and other gov’t programs?
8.2.3 22a-f. Do you have any of the following kinds of health insurance? 29. What was your household’s total income before taxes and other deductions last year from all sources, including Social Security and other gov’t programs?
9.1.1 56. How many different food pantries gave you food in the past month? 57. How many different soup kitchens gave you meals in the past month?
9.2.1 53. Please rate how satisfied you are with the food that you and others in your household receive here. 54. When you come here, how often are you treated with respect by the staff who distribute food?
9.3.1 55. If this agency weren’t here to help you with food, what would you do?
10.1.1 Agency data 10.2.1 1. Record the total number of emergency
shelters, pantries, kitchens, and other programs you currently operate.
10.3.1 1. Record the total number of emergency shelters, pantries, kitchens, and other programs you currently operate.
10.4.1 3b. In what year did each selected program open?
10.5.1 4. For each selected program, please indicate which of the following services, if any, are currently being provided.

Hunger in America 2010 The Capital Area Food Bank of Texas, Inc (4408)
C.18
Table Client Question Agency Question 10.5.2
4. For each selected program, please indicate which of the following services, if any, are currently being provided.
10.5.3 26. Please indicate which of the following programs or facilities your agency operates
10.6.1 27. Type of agency.
10.7.1 18. Do the selected programs currently serve any of the following groups?
10.8.1 7. Compared to 3 years ago, that is, 2006, is this program providing food to more, fewer, same number of clients?
10.9.1 19. In which of the following ways does the client mix change during the year for any of the selected programs?
11.1.1 6. During a typical week, approximately how many meals are served and/or bags or boxes of food distributed by each of the selected programs?
11.2.1 6b. How many different persons or households did you serve on the last day you were open? And how many meals were served and/or bags or boxes of food distributed by each of the selected programs on that day?
11.2.2 6b. How many different persons or households did you serve on the last day you were open? And how many meals were served and/or bags or boxes of food distributed by each of the selected programs on that day? 27. Type of agency.
12.1.1 17. Is the continued operation of the selected programs threatened by one or more serious problems?
12.1.2 17. Is the continued operation of the selected programs threatened by one or more serious problems? 27. Type of agency.
12.2.1 13. During the past year, about how often did each of the selected programs have to reduce meal portions or reduce the quantity of food in food packages because of a lack of food?

Hunger in America 2010 The Capital Area Food Bank of Texas, Inc (4408)
C.19
Table Client Question Agency Question 12.2.2 13. During the past year, about how often did
each of the selected programs have to reduce meal portions or reduce the quantity of food in food packages because of a lack of food?
12.3.1 9. During the past year, did the selected programs turn away any clients for any reason? 10. For which of the following reasons did each selected program turn clients away? 12. During the past year, approximately how many clients did each selected program turn away?
12.3.2 11. What were each selected program’s two most frequent reasons for turning away clients?
12.4.1 14. In your opinion, during a typical week, how much more food, if any, does each of the selected programs need in order to adequately meet their demand for food? Your best estimate is fine.
13.1.1 8. For each selected program, approximately what percent of the distributed food comes from the food bank? 8a. Do the selected programs distribute government or USDA commodities from CSFP, TEFAP, or FDIRP? 8b. Approximately what percent of the distributed food comes from other sources?
13.1.2 8. For each selected program, approximately what percent of the distributed food comes from the food bank? 8a. Do the selected programs distribute government or USDA commodities from CSFP, TEFAP, or FDIRP? 8b. Approximately what percent of the distributed food comes from other sources? 27. Type of agency.

Hunger in America 2010 The Capital Area Food Bank of Texas, Inc (4408)
C.20
Table Client Question Agency Question 13.1.3 8. For each selected program, approximately
what percent of the distributed food comes from the food bank? 8a. Do the selected programs distribute government or USDA commodities from CSFP, TEFAP, or FDIRP? 8b. Approximately what percent of the distributed food comes from other sources? 13. During the past year, about how often did each of the selected programs have to reduce meal portions or reduce the quantity of food in food packages because of a lack of food?
13.2.1 15. Currently, how many paid staff are employed by each of the selected programs? 16. During the past week, how many volunteers assisted and the number of volunteer hours for each selected program. 26. Please indicate which of the following programs or facilities your agency operates
13.3.1 22. Please indicate for each selected program, which of the following categories of products are purchased with cash from sources other than your food bank?
14.1.1 23. What categories of food and non-food products do you need that you are not getting now, or need more of from your food bank to meet your clients’ needs?
14.2.1 24. If the food supply you receive from your food bank were eliminated, how much of an impact would this have on your program?
14.3.1 25. Does your program need additional assistance in any of the following areas?

Hunger in America 2010 The Capital Area Food Bank of Texas, Inc (4408)
APPENDIX D
HUNGER IN AMERICA TABLE CROSSWALK FOR NATIONAL REPORT AND LOCAL REPORTS (WHERE APPLICABLE), 2005 TO 2009

Hunger in America 2010 The Capital Area Food Bank of Texas, Inc (4408)

Hun
ger
in A
mer
ica
2010
T
he C
apita
l Are
a Fo
od B
ank
of T
exas
, Inc
(44
08)
D.3
Tabl
e N
umbe
r in
201
0 Re
port
Ta
ble
Title
Tabl
e N
umbe
r in
20
06 R
epor
t (if
diff
eren
t th
an in
20
10)
New
Ta
ble
in
2010
Re
port
Row
s ad
ded
in 2
010
to
exis
ting
2006
Tab
les
CHA
PTER
2
N
o Ta
bles
in th
is C
hapt
er
CH
APT
ER 3
No
Tabl
es in
this
Cha
pter
CHA
PTER
4
4.
2.1
Estim
ates
of N
umbe
rs o
f Diff
eren
t Clie
nts
Serv
ed b
y th
e FA
Net
wor
k
4.3.
1 Es
timat
ed N
umbe
r of P
antr
ies
in th
e FA
Net
wor
k
4.4.
1 D
eriv
atio
n of
Est
imat
e of
Diff
eren
t Peo
ple
Usi
ng P
antr
ies
Ann
ually
4.
5.1
Estim
ated
Num
ber o
f Kitc
hens
in th
e FA
Net
wor
k
4.6.
1 D
eriv
atio
n of
Est
imat
e of
Diff
eren
t Peo
ple
Usi
ng K
itche
ns A
nnua
lly
4.7.
1 Es
timat
ed N
umbe
r of S
helte
rs in
the
FA N
etw
ork
4.
7.2
Der
ivat
ion
of E
stim
ate
of D
iffer
ent P
eopl
e U
sing
She
lters
Ann
ually
4.
8.1
Estim
ated
Ann
ual C
lient
s U
ndup
licat
ed a
cros
s A
genc
ies
CHA
PTER
5
5.
1.1
Num
ber o
f Clie
nt R
espo
nden
ts

Hun
ger
in A
mer
ica
2010
T
he C
apita
l Are
a Fo
od B
ank
of T
exas
, Inc
(44
08)
D.4
Tabl
e N
umbe
r in
201
0 Re
port
Ta
ble
Title
Tabl
e N
umbe
r in
20
06 R
epor
t (if
diff
eren
t th
an in
20
10)
New
Ta
ble
in
2010
Re
port
Row
s ad
ded
in 2
010
to
exis
ting
2006
Tab
les
5.2.
1 Su
mm
ary
Dem
ogra
phic
Pro
file
of C
lient
s
Two
new
row
s ad
ded
"Hou
seho
lds
with
G
rand
child
ren"
and
"H
ouse
hold
s w
ith a
re
spon
dent
who
pro
vide
s ba
sic
need
s to
gra
ndch
ild,
amon
g ho
useh
olds
with
a
gran
dchi
ld"
5.3.
1 A
ge, G
ende
r, a
nd C
itize
nshi
p Co
mpo
sitio
n (A
dult
Clie
nts
at P
rogr
am S
ites)
5.
3.2
Age
, Gen
der,
and
Citi
zens
hip
Com
posi
tion
(All
Hou
seho
ld M
embe
rs a
t Pro
gram
Si
tes)
5.3.
2N
Age
Com
posi
tion
(Est
imat
ed N
umbe
r of C
lient
s)
5.
4.1
Mar
ital S
tatu
s
5.5.
1 H
ighe
st E
duca
tion
Leve
l Att
aine
d
5.6.
1 Ra
cial
and
Eth
nic
Back
grou
nd
5.7.
1 Em
ploy
men
t Sta
tus
of A
dults
in H
ouse
hold
5.
7.2
Det
aile
d Em
ploy
men
t Sta
tus
of A
dults
in H
ouse
hold
5.
7.2N
Es
timat
ed N
umbe
r of E
mpl
oyed
Adu
lts, F
ull-T
ime
and
Part
-Tim
e
5.
8.1.
1 Th
e 20
09 F
eder
al In
com
e Le
vel--
Mon
thly
Inco
me
5.
8.2.
1 H
ouse
hold
Inco
me
for t
he P
revi
ous
Mon
th
5.8.
3.1
Mai
n So
urce
of H
ouse
hold
Inco
me
for
the
Prev
ious
Mon
th
5.8.
3.2
All
Sour
ces
of H
ouse
hold
Inco
me
for P
revi
ous
Mon
th
5.8.
4.1
Hou
seho
ld In
com
e fo
r 200
8

Hun
ger
in A
mer
ica
2010
T
he C
apita
l Are
a Fo
od B
ank
of T
exas
, Inc
(44
08)
D.5
Tabl
e N
umbe
r in
201
0 Re
port
Ta
ble
Title
Tabl
e N
umbe
r in
20
06 R
epor
t (if
diff
eren
t th
an in
20
10)
New
Ta
ble
in
2010
Re
port
Row
s ad
ded
in 2
010
to
exis
ting
2006
Tab
les
5.8.
4.1N
Es
timat
ed N
umbe
r of C
lient
Hou
seho
lds
Rece
ivin
g TA
NF
or G
A D
urin
g Pr
evio
us
Mon
th
5.8.
5.1
Inco
me
in 2
008,
by
Educ
atio
n15
.3.3
5.
8.6.
1 In
com
e in
200
9, b
y Pr
esen
ce o
f Eld
erly
or
Child
ren
15.3
.55.
9.1.
1 H
ousi
ng S
tatu
s
Add
ed n
ew ro
w
"mot
el/h
otel
" fo
r cho
ices
un
der
"Clie
nts
with
a p
lace
to
live
"
5.9.
1.1N
Es
timat
ed N
umbe
r of C
lient
s w
ith o
r with
out a
Pla
ce to
Liv
e
5.9.
1.2
Inco
me
in 2
008,
by
Hou
sing
Sta
tus
15.3
.15.
9.1.
3 In
com
e in
200
8, b
y H
ome
Ow
ners
hip
15.3
.25.
9.1.
4 H
ouse
hold
Res
ourc
es
5.9.
2.1
CHA
PTER
6
6.
1.1.
1 H
ouse
hold
Foo
d In
secu
rity
6.
1.1
6.1.
1.1N
Es
timat
ed N
umbe
r of H
ouse
hold
s by
Foo
d Se
curi
ty S
tatu
s6.
1.1N
6.
1.1.
2 Fo
od S
ecur
ity, B
y Pr
esen
ce o
f Chi
ldre
n15
.2.4
6.1.
1.3
Food
Sec
urity
, By
Pres
ence
of Y
oung
Chi
ldre
n15
.2.5
6.1.
1.4
Food
Sec
urity
, By
Pres
ence
of E
lder
ly o
r Ch
ildre
n15
.2.6
6.1.
2.1
Food
Sec
urity
, by
Supp
lem
enta
l Nut
ritio
n A
ssis
tanc
e Pr
ogra
m P
artic
ipat
ion
6.1.
2 an
d 15
.2.3
6.1.
2.1N
Es
timat
ed N
umbe
r of H
ouse
hold
s by
Sup
plem
enta
l Nut
ritio
n A
ssis
tanc
e Pr
ogra
m P
artic
ipat
ion
and
Food
Sec
urity
Sta
tus
6.1.
2N
6.1.
3.1
Food
Sec
urity
, By
Inco
me
in 2
008
15.2
.16.
1.3.
2 In
com
e in
200
8, b
y Fo
od S
ecur
ity S
tatu
s15
.3.4
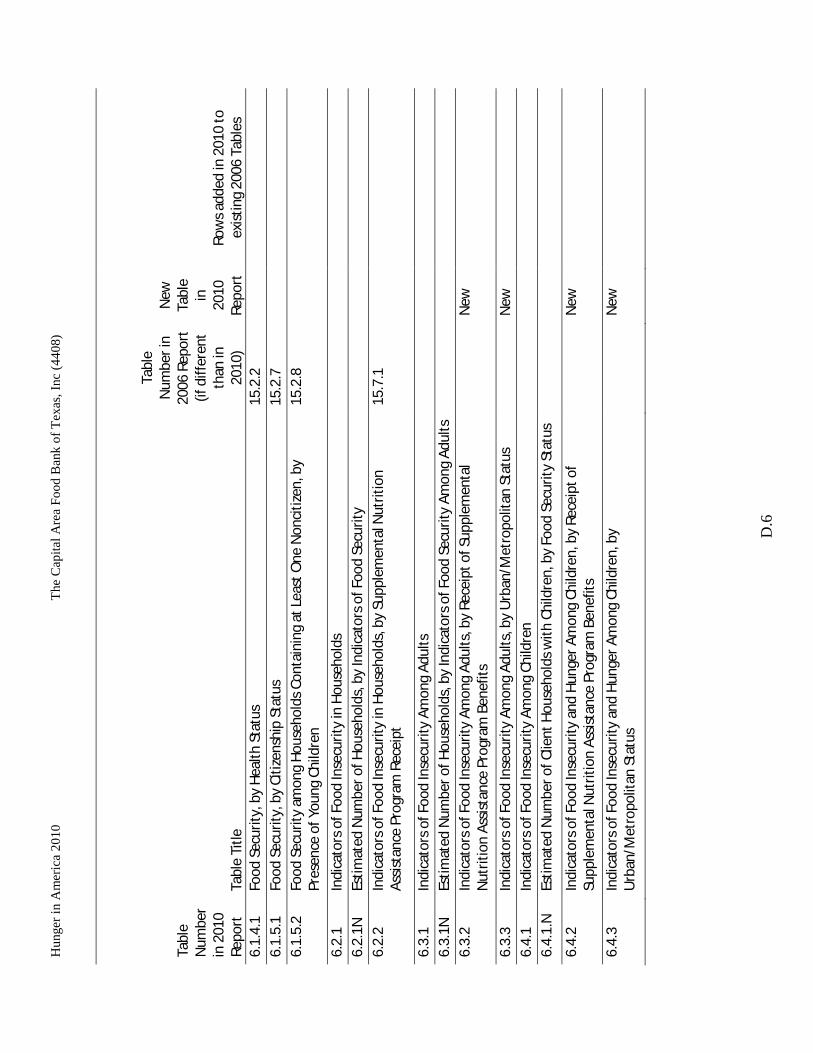
Hun
ger
in A
mer
ica
2010
T
he C
apita
l Are
a Fo
od B
ank
of T
exas
, Inc
(44
08)
D.6
Tabl
e N
umbe
r in
201
0 Re
port
Ta
ble
Title
Tabl
e N
umbe
r in
20
06 R
epor
t (if
diff
eren
t th
an in
20
10)
New
Ta
ble
in
2010
Re
port
Row
s ad
ded
in 2
010
to
exis
ting
2006
Tab
les
6.1.
4.1
Food
Sec
urity
, by
Hea
lth S
tatu
s15
.2.2
6.1.
5.1
Food
Sec
urity
, by
Citiz
ensh
ip S
tatu
s15
.2.7
6.1.
5.2
Food
Sec
urity
am
ong
Hou
seho
lds
Cont
aini
ng a
t Lea
st O
ne N
onci
tizen
, by
Pres
ence
of Y
oung
Chi
ldre
n 15
.2.8
6.2.
1 In
dica
tors
of F
ood
Inse
curi
ty in
Hou
seho
lds
6.
2.1N
Es
timat
ed N
umbe
r of H
ouse
hold
s, b
y In
dica
tors
of F
ood
Secu
rity
6.
2.2
Indi
cato
rs o
f Foo
d In
secu
rity
in H
ouse
hold
s, b
y Su
pple
men
tal N
utri
tion
Ass
ista
nce
Prog
ram
Rec
eipt
15
.7.1
6.3.
1 In
dica
tors
of F
ood
Inse
curi
ty A
mon
g A
dults
6.
3.1N
Es
timat
ed N
umbe
r of H
ouse
hold
s, b
y In
dica
tors
of F
ood
Secu
rity
Am
ong
Adu
lts
6.
3.2
Indi
cato
rs o
f Foo
d In
secu
rity
Amon
g A
dults
, by
Rece
ipt o
f Sup
plem
enta
l N
utri
tion
Ass
ista
nce
Prog
ram
Ben
efits
New
6.3.
3 In
dica
tors
of F
ood
Inse
curi
ty A
mon
g A
dults
, by
Urb
an/M
etro
polit
an S
tatu
s
New
6.4.
1 In
dica
tors
of F
ood
Inse
curi
ty A
mon
g Ch
ildre
n
6.4.
1.N
Es
timat
ed N
umbe
r of C
lient
Hou
seho
lds
with
Chi
ldre
n, b
y Fo
od S
ecur
ity S
tatu
s
6.4.
2 In
dica
tors
of F
ood
Inse
curit
y an
d H
unge
r Am
ong
Child
ren,
by
Rece
ipt o
f Su
pple
men
tal N
utrit
ion
Ass
ista
nce
Prog
ram
Ben
efits
New
6.4.
3 In
dica
tors
of F
ood
Inse
curi
ty a
nd H
unge
r Am
ong
Child
ren,
by
Urb
an/M
etro
polit
an S
tatu
s
New

Hun
ger
in A
mer
ica
2010
T
he C
apita
l Are
a Fo
od B
ank
of T
exas
, Inc
(44
08)
D.7
Tabl
e N
umbe
r in
201
0 Re
port
Ta
ble
Title
Tabl
e N
umbe
r in
20
06 R
epor
t (if
diff
eren
t th
an in
20
10)
New
Ta
ble
in
2010
Re
port
Row
s ad
ded
in 2
010
to
exis
ting
2006
Tab
les
6.5.
1 Ch
oice
bet
wee
n Fo
od a
nd N
eces
sitie
s
Add
two
row
s co
rres
pond
ing
to tw
o ne
w
2009
que
stio
ns (1
) pay
ing
for
food
and
pay
ing
for
tran
spor
tatio
n an
d (2
) pa
ying
for
food
and
pay
ing
for
gas
for
a ca
r.
Als
o, c
hang
ed th
e la
st
thre
e ro
ws
of th
e ta
ble
to
say:
"H
Hs
with
all
5 of
thes
e si
tuat
ions
", "
HH
s w
ith 4
out
of
the
5 si
tuat
ions
", "
HH
s w
ith 3
out
of t
he 5
si
tuat
ions
", "
HH
s w
ith 2
out
of
the
5 si
tuat
ions
", "
HH
s w
ith o
nly
1 of
the
situ
atio
ns"
6.5.
2 H
ouse
hold
Tra
deof
fs, b
y Fo
od S
ecur
ity S
tatu
s15
.5.1
Add
two
row
s co
rres
pond
ing
to tw
o ne
w
2009
que
stio
ns (1
) pay
ing
for
food
and
pay
ing
for
tran
spor
tatio
n an
d (2
) pa
ying
for
food
and
pay
ing
for
gas
for
a ca
r.

Hun
ger
in A
mer
ica
2010
T
he C
apita
l Are
a Fo
od B
ank
of T
exas
, Inc
(44
08)
D.8
Tabl
e N
umbe
r in
201
0 Re
port
Ta
ble
Title
Tabl
e N
umbe
r in
20
06 R
epor
t (if
diff
eren
t th
an in
20
10)
New
Ta
ble
in
2010
Re
port
Row
s ad
ded
in 2
010
to
exis
ting
2006
Tab
les
6.5.
3 H
ouse
hold
Tra
deof
fs, b
y H
ouse
hold
Str
uctu
re15
.5.2
Add
two
row
s co
rres
pond
ing
to tw
o ne
w
2009
que
stio
ns (1
) pay
ing
for
food
and
pay
ing
for
tran
spor
tatio
n an
d (2
) pa
ying
for
food
and
pay
ing
for
gas
for
a ca
r.
CHA
PTER
7
7.
1.1
Use
of t
he S
uppl
emen
tal N
utri
tion
Ass
ista
nce
Prog
ram
7.1.
1N
Use
of t
he S
uppl
emen
tal N
utri
tion
Ass
ista
nce
Prog
ram
(Clie
nt C
ount
s)
7.1.
2 U
se o
f the
Sup
plem
enta
l Nut
ritio
n A
ssis
tanc
e Pr
ogra
m ,
by P
rese
nce
ofEl
derly
or
Chi
ldre
n
New
7.1.
3 U
se o
f the
Sup
plem
enta
l Nut
ritio
n A
ssis
tanc
e Pr
ogra
m ,
by
Urb
an/M
etro
polit
an S
tatu
s
New
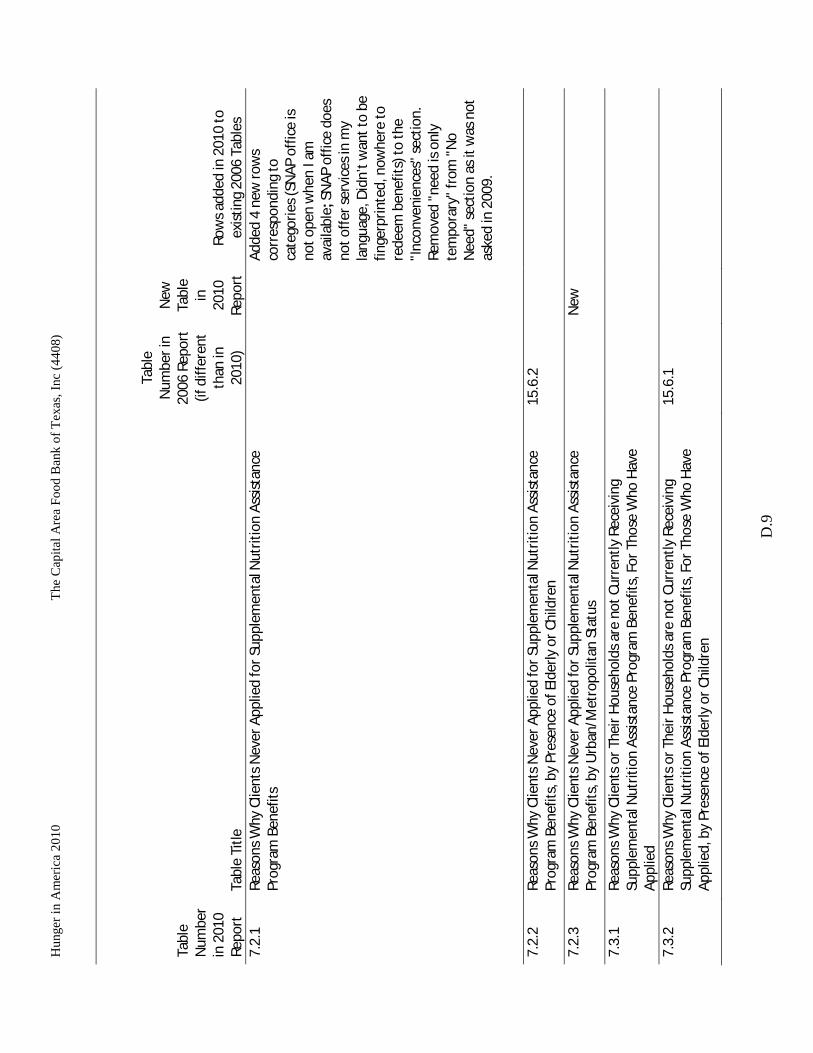
Hun
ger
in A
mer
ica
2010
T
he C
apita
l Are
a Fo
od B
ank
of T
exas
, Inc
(44
08)
D.9
Tabl
e N
umbe
r in
201
0 Re
port
Ta
ble
Title
Tabl
e N
umbe
r in
20
06 R
epor
t (if
diff
eren
t th
an in
20
10)
New
Ta
ble
in
2010
Re
port
Row
s ad
ded
in 2
010
to
exis
ting
2006
Tab
les
7.2.
1 Re
ason
s W
hy C
lient
s N
ever
App
lied
for
Supp
lem
enta
l Nut
ritio
n A
ssis
tanc
e Pr
ogra
m B
enef
its
A
dded
4 n
ew ro
ws
corr
espo
ndin
g to
ca
tego
ries
(SN
AP
offic
e is
no
t ope
n w
hen
I am
av
aila
ble;
SN
AP
offic
e do
es
not o
ffer
ser
vice
s in
my
lang
uage
, Did
n’t w
ant t
o be
fin
gerp
rinte
d, n
owhe
re to
re
deem
ben
efits
) to
the
"Inc
onve
nien
ces"
sec
tion.
Re
mov
ed "
need
is o
nly
tem
pora
ry"
from
"N
o N
eed"
sec
tion
as it
was
not
as
ked
in 2
009.
7.2.
2 Re
ason
s W
hy C
lient
s N
ever
App
lied
for
Supp
lem
enta
l Nut
ritio
n A
ssis
tanc
e Pr
ogra
m B
enef
its, b
y Pr
esen
ce o
f Eld
erly
or
Child
ren
15.6
.2
7.2.
3 Re
ason
s W
hy C
lient
s N
ever
App
lied
for
Supp
lem
enta
l Nut
ritio
n A
ssis
tanc
e Pr
ogra
m B
enef
its, b
y U
rban
/Met
ropo
litan
Sta
tus
N
ew
7.3.
1 Re
ason
s W
hy C
lient
s or
The
ir H
ouse
hold
s ar
e no
t Cur
rent
ly R
ecei
ving
Su
pple
men
tal N
utrit
ion
Ass
ista
nce
Prog
ram
Ben
efits
, For
Tho
se W
ho H
ave
App
lied
7.3.
2 Re
ason
s W
hy C
lient
s or
The
ir H
ouse
hold
s ar
e no
t Cur
rent
ly R
ecei
ving
Su
pple
men
tal N
utrit
ion
Ass
ista
nce
Prog
ram
Ben
efits
, For
Tho
se W
ho H
ave
App
lied,
by
Pres
ence
of E
lder
ly o
r Ch
ildre
n
15.6
.1

Hun
ger
in A
mer
ica
2010
T
he C
apita
l Are
a Fo
od B
ank
of T
exas
, Inc
(44
08)
D.1
0
Tabl
e N
umbe
r in
201
0 Re
port
Ta
ble
Title
Tabl
e N
umbe
r in
20
06 R
epor
t (if
diff
eren
t th
an in
20
10)
New
Ta
ble
in
2010
Re
port
Row
s ad
ded
in 2
010
to
exis
ting
2006
Tab
les
7.3.
3 Re
ason
s W
hy C
lient
s or
The
ir H
ouse
hold
s ar
e no
t Cur
rent
ly R
ecei
ving
Su
pple
men
tal N
utrit
ion
Ass
ista
nce
Prog
ram
Ben
efits
, For
Tho
se W
ho H
ave
App
lied,
by
Urb
an/M
etro
polit
an S
tatu
s
N
ew
7.3.
4 Re
port
ed In
com
e Le
vels
of C
lient
s W
ho in
dica
ted
Inel
igib
le In
com
e as
a R
easo
n fo
r no
t Rec
eivi
ng S
uppl
emen
tal N
utri
tion
Ass
ista
nce
Prog
ram
Ben
efits
7.
3.2
7.3.
5 Re
port
ed In
com
e Le
vels
of C
lient
s W
ho in
dica
ted
Inel
igib
le In
com
e as
a R
easo
n fo
r no
t Rec
eivi
ng S
uppl
emen
tal N
utri
tion
Ass
ista
nce
Prog
ram
Ben
efits
, by
Pres
ence
of E
lder
ly o
r Chi
ldre
n
N
ew
7.3.
6 Re
port
ed In
com
e Le
vels
of C
lient
s W
ho in
dica
ted
Inel
igib
le In
com
e as
a R
easo
n fo
r no
t Rec
eivi
ng S
uppl
emen
tal N
utri
tion
Ass
ista
nce
Prog
ram
Ben
efits
, by
Urb
an/M
etro
polit
an S
tatu
s
N
ew
7.4.
1 U
se o
f Oth
er P
rogr
ams
A
dded
bac
kpac
k w
eeke
nd
food
pro
gram
as
a ro
w.
7.4.
2 U
se o
f Oth
er P
rogr
ams,
by
Urb
an/M
etro
polit
an s
tatu
s
New
7.4.
3 Re
ason
s W
hy C
hild
did
n't P
artic
ipat
e in
Sum
mer
Foo
d Pr
ogra
m
New
7.4.
4 Re
ason
s W
hy C
hild
did
n't P
artic
ipat
e in
Sum
mer
Foo
d Pr
ogra
m, b
y U
rban
/Met
ropo
litan
Sta
tus
N
ew
7.5.
1 G
ener
al A
ssis
tanc
e, W
elfa
re, a
nd T
AN
Fin
the
Prev
ious
Tw
o Ye
ars
7.
6.1
Gro
cery
Sho
ppin
g Pa
tter
ns
A
dded
"do
llar
stor
es"
as a
se
para
te r
ow in
tabl
e.
CHA
PTER
8
8.
1.1
Hea
lth S
tatu
s
8.2.
1 H
ealth
Insu
ranc
e an
d Ac
cess
to M
edic
al C
are

Hun
ger
in A
mer
ica
2010
T
he C
apita
l Are
a Fo
od B
ank
of T
exas
, Inc
(44
08)
D.1
1
Tabl
e N
umbe
r in
201
0 Re
port
Ta
ble
Title
Tabl
e N
umbe
r in
20
06 R
epor
t (if
diff
eren
t th
an in
20
10)
New
Ta
ble
in
2010
Re
port
Row
s ad
ded
in 2
010
to
exis
ting
2006
Tab
les
8.2.
1N
Estim
ated
Num
ber o
f Clie
nts
at P
rogr
am S
ites
who
had
bee
n Re
fuse
d M
edic
al
Care
8.2.
2 In
com
e in
200
8, b
y M
edic
aid
Part
icip
atio
n St
atus
15.3
.68.
2.3
Inco
me
in 2
008,
by
Uni
nsur
ed S
tatu
s
New
CHA
PTER
9
9.
1.1
Num
ber o
f Diff
eren
t Pan
trie
s or
Kitc
hens
Use
d
9.2.
1 Sa
tisfa
ctio
n w
ith S
ervi
ces
at F
ood
Prog
ram
s
9.2.
2 Sa
tisfa
ctio
n w
ith S
ervi
ces
at F
ood
Prog
ram
s, b
y U
rban
/Met
ropo
litan
Sta
tus
N
ew9.
3.1
Wha
t Clie
nts
Wou
ld D
o W
ithou
t Fo
od A
ssis
tanc
e fr
om th
e A
genc
y
CH
APT
ER 1
0
10
.1.1
Pr
ogra
ms
Repo
rted
on
by P
artic
ipat
ing
Age
ncie
s, b
y Pr
ogra
m T
ype
10
.2.1
N
umbe
r of P
rogr
ams
Ope
rate
d by
Age
ncie
s
10.3
.1
Age
ncie
s O
pera
ting
Vario
us T
ypes
of P
rogr
ams
10
.4.1
Le
ngth
of P
rogr
am O
pera
tion
10
.4.2
Le
ngth
of P
rogr
am o
pera
tions
, by
Urb
an/M
etro
polit
an s
tatu
s
New
10.5
.1
Oth
er S
ervi
ces
or F
acili
ties
Age
ncie
s or
Pro
gram
s Pr
ovid
e in
Add
ition
to F
ood
Dis
trib
utio
n, b
y Pr
ogra
m T
ype
10.5
.2
Oth
er S
ervi
ces
or F
acili
ties
Age
ncie
s or
Pro
gram
s Pr
ovid
e in
Add
ition
to F
ood
Dis
trib
utio
n, b
y U
rban
/Met
ropo
litan
Sta
tus
N
ew
10.5
.3
Num
ber o
f Add
ition
al S
ervi
ces,
by
Prog
ram
Typ
e10
.5.2
10.5
.4
Oth
er F
acili
ties
Age
ncie
s Pr
ovid
e in
Add
ition
to F
ood
Dis
trib
utio
n, b
y Pr
ogra
m
Type
10
.5.3
Add
ed "
CSFP
" as
row
in
tabl
e.
10.6
.1
Type
of A
genc
y th
at O
pera
tes
the
Prog
ram
10
.6.2
Ty
pe o
f Age
ncy
that
Ope
rate
s th
e Pr
ogra
m, b
y U
rban
/Met
ropo
litan
sta
tus
N
ew

Hun
ger
in A
mer
ica
2010
T
he C
apita
l Are
a Fo
od B
ank
of T
exas
, Inc
(44
08)
D.1
2
Tabl
e N
umbe
r in
201
0 Re
port
Ta
ble
Title
Tabl
e N
umbe
r in
20
06 R
epor
t (if
diff
eren
t th
an in
20
10)
New
Ta
ble
in
2010
Re
port
Row
s ad
ded
in 2
010
to
exis
ting
2006
Tab
les
10.7
.1
Prog
ram
s Se
rvin
g Se
lect
ed T
ypes
of C
lient
s
10.8
.1
Age
ncy
Estim
ates
of C
hang
e in
Num
ber o
f Clie
nts
from
200
6 to
200
9
10.9
.1
Seas
onal
ity o
f Clie
nt M
ix
10
.9.2
Se
ason
ality
of C
lient
Mix
, by
Urb
an/M
etro
polit
an s
tatu
s
New
CHA
PTER
11
11
.1.1
N
umbe
r of B
oxes
or
Bags
Dis
trib
uted
in T
ypic
al W
eek
11
.2.1
A
mou
nt o
f Foo
d Se
rved
on
the
Day
the
Prog
ram
was
Las
t Ope
n
11.2
.2
Am
ount
of F
ood
Serv
ed o
n th
e D
ay th
e Pr
ogra
m w
as L
ast O
pen,
by
Urb
an/M
etro
polit
an S
tatu
s
New
11.2
.3
Am
ount
of F
ood
Serv
ed o
n th
e D
ay th
e Pr
ogra
m w
as L
ast O
pen,
by
Type
of
Age
ncy
that
Ope
rate
s th
e Pr
ogra
m
N
ew
CHA
PTER
12
12
.1.1
St
abili
ty o
f Exi
stin
g Fo
od P
rogr
ams
12
.1.2
St
abili
ty o
f Exi
stin
g Fo
od P
rogr
ams,
by
Urb
an/M
etro
polit
an S
tatu
s
New
12.1
.3
Stab
ility
of E
xist
ing
Food
Pro
gram
s, b
y Ty
pe o
f Age
ncy
that
Ope
rate
s th
e Pr
ogra
m
N
ew
12.2
.1
Freq
uenc
y of
Str
etch
ing
Food
Res
ourc
es
12.2
.1N
Es
timat
ed N
umbe
r of P
rogr
ams
Hav
ing
to S
tret
ch F
ood
Reso
urce
s
12.2
.2
Freq
uenc
y of
Str
etch
ing
Food
Res
ourc
es, b
y U
rban
/Met
ropo
litan
Sta
tus
N
ew12
.2.3
Fr
eque
ncy
of S
tret
chin
g Fo
od R
esou
rces
, by
Type
of A
genc
y th
at O
pera
tes
the
Prog
ram
New
12.3
.1
Prog
ram
s th
at T
urne
d A
way
Clie
nts
12
.3.2
M
ost F
requ
ent R
easo
ns th
e Pr
ogra
m T
urne
d A
way
Clie
nts
12
.4.1
A
dditi
onal
Foo
d Re
sour
ces
Nee
ded
Per W
eek

Hun
ger
in A
mer
ica
2010
T
he C
apita
l Are
a Fo
od B
ank
of T
exas
, Inc
(44
08)
D.1
3
Tabl
e N
umbe
r in
201
0 Re
port
Ta
ble
Title
Tabl
e N
umbe
r in
20
06 R
epor
t (if
diff
eren
t th
an in
20
10)
New
Ta
ble
in
2010
Re
port
Row
s ad
ded
in 2
010
to
exis
ting
2006
Tab
les
CHA
PTER
13
13
.1.1
So
urce
s of
Foo
d D
istr
ibut
ed
A
dded
row
for "
Food
di
stri
butio
n pr
ogra
m o
n In
dian
Res
erva
tion
(FD
IRP)
"
13.1
.2
Perc
enta
ge o
f Foo
d Re
ceiv
ed fr
om F
ood
Bank
, by
Urb
an/M
etro
polit
an S
tatu
s
N
ew13
.1.3
Pe
rcen
tage
of F
ood
Rece
ived
from
Foo
d Ba
nk ,
by T
ype
of A
genc
y th
at
Ope
rate
s th
e Pr
ogra
m
N
ew
13.1
.4
Perc
enta
ge o
f Foo
d Re
ceiv
ed fr
om F
ood
Bank
, by
Fre
quen
cy o
f Str
etch
ing
Food
Res
ourc
es
N
ew
13.2
.1
Staf
f and
Vol
unte
er R
esou
rces
13
.2.1
N
Estim
ated
Num
ber o
f Vol
unte
er a
nd V
olun
teer
Hou
rs d
urin
g Pr
evio
us W
eek
13
.3.1
Pr
oduc
ts P
urch
ased
from
Sou
rces
Oth
er th
an F
ood
Bank
CHA
PTER
14
14
.1.1
Pr
oduc
ts N
eede
d fr
om F
ood
Bank
s
14.2
.1
Impa
ct o
f Elim
inat
ion
of F
ood
Bank
14
.3.1
A
reas
of A
dditi
onal
Ass
ista
nce
Des
ired
A
dded
two
new
row
s:
"SN
AP
Bene
fits
and
Out
reac
h" a
nd "
Sum
mer
Fe
edin
g Pr
ogra
ms"
CHA
PTER
15
15
.1.1
Se
lect
ed C
lient
Cha
ract
eris
tics
in N
atio
nal D
ata:
199
3, 1
997,
200
1, 2
005,
and
20
09
16.1
.1
15.2
.1
Sele
cted
Age
ncy
Char
acte
ristic
s in
199
3, 1
997,
200
1, 2
005,
and
200
916
.2.1

Hun
ger
in A
mer
ica
2010
T
he C
apita
l Are
a Fo
od B
ank
of T
exas
, Inc
(44
08)
D.1
4
Tabl
e N
umbe
r in
201
0 Re
port
Ta
ble
Title
Tabl
e N
umbe
r in
20
06 R
epor
t (if
diff
eren
t th
an in
20
10)
New
Ta
ble
in
2010
Re
port
Row
s ad
ded
in 2
010
to
exis
ting
2006
Tab
les
CHA
PTER
16
16
.1.1
Ch
ange
s in
Dem
ogra
phic
Cha
ract
eris
tics
N
ew16
.1.2
Ch
ange
s in
Em
ploy
men
t and
Inco
me
Char
acte
ristic
s
New
16.2
.1
Chan
ges
in F
ood
Secu
rity
N
ew16
.2.2
Ch
ange
s in
Foo
d Se
curit
y, b
y Pr
esen
ce o
f Eld
erly
or
Child
ren
N
ew16
.2.3
Ch
ange
s in
Foo
d Se
curit
y, b
y Su
pple
men
tal N
utri
tion
Ass
ista
nce
Prog
ram
Pa
rtic
ipat
ion
and
Elig
ibili
ty S
tatu
s
New
16.2
.4
Chan
ges
in H
ouse
hold
Tra
de-O
ffs
Betw
een
Food
and
Nec
essi
ties,
by
Food
Se
curi
ty S
tatu
s
New
16.3
.1
Chan
ges
in th
e U
se o
f Fed
eral
Foo
d A
ssis
tanc
e Pr
ogra
ms
N
ew16
.3.2
Ch
ange
s in
the
Reas
ons
Why
Clie
nts
or th
eir
Hou
seho
lds
are
not C
urre
ntly
Re
ceiv
ing
Supp
lem
enta
l Nut
ritio
n A
ssis
tanc
e Pr
ogra
m B
enef
its, F
or T
hose
Who
H
ave
App
lied
N
ew
16.4
.1
Chan
ges
in H
ealth
Sta
tus
N
ew16
.5.1
Ch
ange
s in
the
Num
ber o
f Diff
eren
t Pan
trie
s or
Kitc
hens
Use
d
New
16.5
.2
Chan
ges
in th
e Sa
tisfa
ctio
n w
ith S
ervi
ces
at F
ood
Prog
ram
s
New
16.6
.1
Chan
ges
in th
e Ty
pes
of A
genc
y th
at O
pera
tes
the
Prog
ram
N
ew16
.6.2
Ch
ange
s in
Age
ncy
or P
rogr
am P
rovi
sion
of O
ther
Ser
vice
s in
Add
ition
to F
ood
Dis
trib
utio
n
New
16.6
.3
Chan
ges
in th
e Fr
eque
ncy
of S
tret
chin
g Fo
od R
esou
rces
N
ew16
.6.4
Ch
ange
s in
the
Sour
ces
of F
ood
Dis
trib
uted
by
Prog
ram
s
New
16.6
.5
Chan
ges
in S
taff
and
Vol
unte
er R
esou
rces
Dur
ing
Prev
ious
Wee
k
New
16.6
.6
Chan
ges
in P
rodu
cts
Purc
hase
d fr
om S
ourc
es O
ther
than
Foo
d Ba
nk
New

Hun
ger
in A
mer
ica
2010
T
he C
apita
l Are
a Fo
od B
ank
of T
exas
, Inc
(44
08)
D.1
5
Tabl
e N
umbe
r in
201
0 Re
port
Ta
ble
Title
Tabl
e N
umbe
r in
20
06 R
epor
t (if
diff
eren
t th
an in
20
10)
New
Ta
ble
in
2010
Re
port
Row
s ad
ded
in 2
010
to
exis
ting
2006
Tab
les
16.6
.7
Chan
ges
in P
rodu
cts
Nee
ded
from
Foo
d Ba
nks
N
ew