Embed Size (px)
Citation preview

SIXTY-SIXTH WORLD HEALTH ASSEMBLY A66/36Provisional agenda item 23.1 14 May 2013
Human resources: annual report
Report by the Secretariat
INTRODUCTION
1. The present report is composed of three sections:
• Section I. A presentation of the Organization’s workforce as at 31 December 2012 covering the following areas: staff profile; cost of staff; non-staff profile; cost of non-staff; staff category by office type; distribution of staff by gender; geographical representation; age and category of staff; recruitment; staff mobility; distribution of staff in professional and higher category posts across the main occupational groups; and staff health and well-being.
• Section II. An analysis of the evolution of the workforce over the past 10 years, including a commentary on significant reforms during the period.
• Section III. A look at the future of human resources management and a review of the goals of the reform process.
SECTION I
2. This section presents the Organization’s workforce as at 31 December 2012. Where relevant, it is compared with the corresponding profile from 2011. Unless otherwise specified, all data in this section relate to staff members holding a fixed-term or a continuing appointment (for ease of reference, both are referred to as “long-term appointments” to distinguish them from temporary appointments).1
Staff profile
3. As at 31 December 2012, WHO had a total of 7338 staff members worldwide of whom 6549 held long-term appointments and 789 temporary appointments.
4. Of those holding long-term appointments, 2155 (32.9%) were in the professional and higher categories, 896 (13.7%) were in the National Professional Officer category, and 3498 (53.4%) were in the general service category (see Table 1 and Figure 1).
1 This figure includes staff in special programmes and collaborative arrangements hosted by WHO. It also includes
WHO-funded PAHO/AMRO staff but does not include PAHO-funded staff members in the Region of the Americas; nor does it include IARC or any agencies administered by WHO.

A66/36
2
Figure 1. Distribution of staff by category
5. The number of staff members holding long-term appointments has decreased by 326 (5.0%) compared with the staffing profile as at 31 December 2011.1
6. As at 31 December 2012, only 789 staff members were on temporary appointments, a decrease of 153 or 19.4% compared with the number shown in the report as at 31 December 2011. Temporary staff currently constitute 10.8% of the total workforce. Table 2 sets out the distribution of staff members holding long-term appointments by major office, grade and sex. The distribution of staff in the professional and higher categories at grades P.3 to P.5 is currently, P.3: 14.7%; P.4: 36.6%; and P.5: 31.1%. Within the Organization, the figure of 6549 staff members on long-term appointments equates to 6506.4 full-time equivalent staff members.
Cost of staff
7. In 2012, staff and other personnel costs amounted to US$ 912.4 million or 43.8% of the Organization’s total expenditure of US$ 2.08 billion.2 By major office, staff costs amounted to: headquarters US$ 301 million; Regional Office for Africa US$ 199 million; Regional Office for the Americas US$ 31.7 million; Regional Office for South-East Asia US$ 52.5 million; Regional Office for Europe US$ 67.2 million; Regional Office for the Eastern Mediterranean US$ 73.4 million; and Regional Office for the Western Pacific US$ 60.1 million.
Non-staff profile
8. Non-staff individual contracts are shown in Table 14. The type and total number of contracts issued were as follows: Agreements for Performance of Work 8867: Consultants 1190: and Special Services Agreements 3463. In addition, this section includes details of Junior Professional Officers. These employees hold contracts issued by UNDP, which provides a central service to WHO.
9. An Agreement for Performance of Work is used to contract individuals or companies to provide services or prepare a specific product. In all cases, the individual concerned is paid a fixed-sum or maximum amount; does not normally work on WHO premises; does not perform work that requires
1 Document A65/34. 2 See document A66/29.
General service staff
53.4%
Professionaland highergraded staff
32.9%
National ProfessionalOfficers 13.7%

A66/36
3
close WHO technical guidance; and does not undertake travel for WHO (other than an occasional visit to WHO premises in order to present or discuss aspects of the work with WHO staff). An Agreement for Performance of Work may be for any period of time from one day upwards.
10. Consultants are recognized authorities or specialists in a specific field who are engaged in a technical, advisory or consultative capacity, often bringing unique expertise to the Organization. Such contracts should not duplicate staff work. A Consultant contract may be for any period of time from one day upwards.
11. A Special Services Agreement is a contract between the Organization and a national or resident of a host country for use of his/her services for either long or short assignments on a specific national project or activity. Special Services Agreements are typically of 12 months’ duration.
12. The Junior Professional Officer Programme provides young professionals pursuing a career in development with hands-on experience in multilateral technical cooperation. Junior Professional Officers are primarily sponsored for an initial two-year period, which may be extended for part or all of a third year by their respective governments.
Cost of non-staff
13. In 2012, contractual services amounted to US$ 301 million or 15.6% of the total expenditure of the Organization. The total expenditures for contractual services by major office were: headquarters US$ 104.1 million; the Regional Office for Africa US$ 34.5 million; the Regional Office for the Americas US$ 15.8 million; the Regional Office for South-East Asia US$ 46.4 million; the Regional Office for Europe US$ 18.7 million; the Regional Office for the Eastern Mediterranean US$ 57.1 million; and the Regional Office for the Western Pacific US$ 24.4 million.
Staff category by office type
14. As at 31 December 2012, 24.1% of staff members holding long-term appointments were assigned to headquarters (of which 4.0% were staff members working in the Special programmes and collaborative arrangements segment), 24.3% to regional offices and 51.6% to country offices (Figure 2).
Figure 2. Distribution of long-term staff as at 31 December 2012, by office type
Country offices 51.6%
Headquarters24.1%
Regional offices 24.3%

A66/36
4
Distribution of staff by gender
15. As at 31 December 2012, of the 2155 staff members in the professional and higher categories 1303 (60.5%) were men and 852 (39.5%) were women (see Figure 9). Among the women, 35.4% were in grade P.4 up to the level of ungraded positions (Table 2); and 35.9% in the National Professional Officer category. In the general service category, women accounted for 52.4% of staff members.
Geographical representation1
16. As at 31 December 2012, 875 posts counted for geographical representation in the professional and higher categories were held by staff members from developing countries (46.1% of all such posts), and 1024 posts (53.9%) were held by staff members from developed countries.
17. By the end of 2012, of the 196 Member States (including two Associate Members), 100 were within their desirable range of representation (three were at the top of their desirable range); 39 (including two Associate Members) were unrepresented; nine were underrepresented and 48 were overrepresented (see Table 3; Figure 3). Overrepresented countries are found in all WHO regions.
18. Tables 4a‒f give the status of representation of Member States for each region (the data exclude staff members in posts funded by their country of nationality). The following changes have taken place since the last annual report as at 31 December 20112
• four Member States that were previously unrepresented (Belize, Bosnia and Herzegovina, South Sudan and the former Yugoslav Republic of Macedonia) are now within their desirable range of representation;
• one Member State that was previously within its desirable range of representation (Viet Nam) is now underrepresented;
• one Member State that was previously within its desirable range of representation (Suriname) is now unrepresented;
• two Member States that were previously overrepresented (Argentina and Guinea) are now within their desirable range of representation;
• three Member States that were previously within their desirable range of representation (South Africa, Spain and Sweden) are now overrepresented.
19. Table 5 shows the distribution of staff in positions not counted for geographical representation: staff working for special programmes or collaborative arrangements; staff on secondment from their country or institution; and language staff, such as translators and editors.
1 For 2014, a new scale of assessment and populations figures for geographical representation will be used in
accordance with WHA guidelines. 2 Document A65/34.

Figurcateg
Age
20. were servic
Brit
re 3. Membgories
and catego
As at 31 Dunder 50 ye
ce category 4
United States o
United Kingdomtain and Northe
Ne
P
Sw
ber States wi
ory of staff
December 20ears of age; 47.5% (Tabl
of America
India
France
m of Great ern Ireland
Germany
Italy
etherlands
Canada
Japan
Australia
Philippines
China
Egypt
Brazil
Spain
Belgium
witzerland
Ethiopia
Pakistan
Denmark
O
ith the highe
012, in the pin the Natioes 6, 7 and 8
Overrepresented
est represen
professional onal Professi8; Figure 4).
Within ra
ntation in th
and higher onal Officer
ange
e profession
categories 4category 59
Underrepresente
nal and high
48.4% of sta9.9%; and in
ed Desirabof repre
A66/36
5
her
aff membersn the general
le range esentation
6
5
s l

A66/36
6
Figure 4. Distribution of staff by age and category
Recruitment
21. In 2012, 84 new staff members were appointed to the professional and higher categories. Of these new appointments, 33.7% were from countries that were previously unrepresented or underrepresented. Women represented 52.5% of the total number of new appointments in all categories in 2012. n the professional and higher categories, women represented 52.4% of newly recruited staff; 48.4% in the National Professional Officer category and 54.9% in the general service staff category. In 2012, across the Organization the average time taken from initial advertisement of a post to a final decision was 4.2 months.
Staff mobility across regions
22. Table 11 gives an overview of staff in the professional and higher categories by major office and region of nationality. It can be observed that staff from a particular region tend to be employed within that region. This is less marked in the South-East Asia, Eastern Mediterranean and Western Pacific regions where regional mobility schemes have opened up opportunities for staff across the regions (see also Figures 5a and 5b).
0
5
10
15
20
25
30
35
40
45
20‐29 years 30‐39 years 40‐49 years 50‐ 59 years 60‐62 years over 62 years
Staff in the professionaland higher categories
Staff in the generalservice category
Staff in the nationalprofessional officercategory

A66/36
7
Figure 5a. Percentage of staff outside headquarters working within their region of nationality (professional and higher categories)
Figure 5b. Distribution by region of nationality of staff working at headquarters (professional and higher categories)
23. Table 12 provides details of the movement of staff within the Organization during the period 1 January to 31 December 2012. The highest reassignment rate (28.8%) was in the African Region where 96.1% concerned reassignments within the Region.
24. As can be seen in Table 12 and Figure 6, a total of 184 staff members within the Organization changed their duty station in 2012, representing 8.6% of the total number of staff in the professional and higher categories. Of the 184 staff moves, 40 were to either another WHO region or headquarters.
0
10
20
30
40
50
60
70
80
90
100
0
5
10
15
20
25
30
35
40
45
50
%
Western Pacific
Eastern Mediterranean Europe South‐East
Asia The Americas Africa
Region of nationality
%
Africa The Americas South‐East Asia Europe Eastern
Mediterranean Western Pacific
Region of nationality

A66/36
8
Figure 6. Distribution of staff members in the professional and higher categories moving to another duty station
Occupational groups
25. Almost half the posts held by staff in the professional and higher categories (47.8%) were in the occupational group “Dental, nutrition, medical, nursing and veterinary specialists”. Within this group, 90.7% were “Medical specialists” (of which 49.8% are Public health specialists) with the remaining 50.2% spread over a range of other specialties (see Table 13). The second largest occupational group was that of “Administrative specialists”, which accounts for 34.5%. In that group, 17.1% of posts were held by “Technical cooperation specialists”, 13.8% by “Computer information systems specialists”, 11.5% by “Management and programme analysts”, and 11.3% by “Administrative officers” (Table 13).
Staff health and well-being
26. Health and medical services remain central to the health of staff members and continue to provide clinical and psychological support, and preventive medical care. In 2012, mental health causes accounted for 56% of sick leave days, followed by musculo-skeletal disorders (21%), malignancies (11%) and circulatory disorders (11%). During this period there were 3320 medical and psychosocial consultations and 1300 nurse consultations conducted, compared with 3400 medical and psychosocial consultations and 2050 nurse consultations in 2011. In 2012, women consulted such services in 56% of cases and men in 44%. In addition to these consultations which were on an individual basis, and as part of the assistance offered to staff affected by the restructuring exercise at headquarters, medical services facilitated support groups during 2011 and 2012.
27. As part of its global remit within the United Nations common system, WHO is responsible for the medical evacuations of local staff (carried out on an exceptional basis) and of international staff (when the evacuation takes place outside the country to which they are assigned). The health and medical services handled 64 cases of medical evacuations for the regions in 2011; a further 51 were dealt with in 2012. Daily interactions between the unit and the offices of the Regional Staff Physician have reinforced the physicians’ network, and as a consequence practices have now been harmonized.
Headquarters15%
Western Pacific 13.6%
Eastern Mediterranean
6%
Europe 21%
South‐East Asia 9%
The Americas6%
Africa 28%

A66/36
9
28. The health and medical services manage all medical cases that are submitted to the Advisory Committee on Compensation Claims for headquarters and the regional offices (64 cases were dealt with in 2011 and 120 in 2012). The unit also prepares the medical files to be presented to the WHO Staff Pension Committee for disability cases (39 in 2011 and 34 in 2012).
SECTION II
29. This section provides an analysis of the evolution of the workforce over the past 10 years, including a commentary on significant reforms during the period.
Appointment policies
30. Appointment policies have evolved over the past decade in response to the changing needs of the Organization. Prior to 2007, several contract types were in existence, including three types of short-term appointment (daily, monthly and consultant contracts); term-limited appointments with up to four successive 11 month contract periods (4 x 11 months); and career service and service appointments ‒ predecessors of today’s continuing appointments.
31. Following a major contractual review in 2006 and 2007, the number of different types of contract was reduced to three: continuing, fixed-term and temporary appointments. The aim was to ensure greater fairness and equity among staff members; increase the effectiveness, productivity and performance of both the Organization and its staff; lower administrative and transactional costs; and balance the gains against the potential direct costs associated with greater equity in pay and benefits.1
32. In the wake of the global financial crisis, the appointments policy was revisited. The nature of the Organization’s financing arrangements – with only 24% of its income derived from assessed contributions, and a significant part of the remaining voluntary contributions not representing predictable long-term commitments by donors ‒ left it vulnerable to the effects of the crisis. In response, between 2010 and late 2012, 937 filled fixed-term and temporary posts were abolished. It was recognized that the Organization could no longer sustain an appointments policy involving long-term liabilities that were out of step with the unpredictability of the financing arrangements. A contractual framework was required that would allow greater flexibility so that the Organization might more effectively manage its workforce in the future.
33. Following extensive consultations between headquarters and the regions, a more flexible contractual model was designed that takes account of both WHO’s changing priorities and the financing situation. The proposed changes were subsequently introduced in February 2013.
34. Over the past decade there has also been a reduction in the number of temporary staff from 5091 or 58.0% of the workforce in 2002 to 789 or 10.8% in 2012. The fall in the number of temporary appointments coincided with the global contract reform process within the United Nations common system and the trend has been prolonged by the recent financial crisis and further economic constraints. (Figure 7).
1 See document EB118/11.

A66/36
10
Figure 7. Evolution of staff numbers by contract type over the period 2002–2012
35. In line with recent changes to the appointments policy as it affects long-term staff members, human resources intends to review the situation with regard to temporary appointments in order to determine whether the current staffing level of 10.8% meets the Organization’s needs.
Recruitment
Distribution by grade
36. Within the distribution for the professional and higher categories, the proportion of staff by grade has changed most significantly during the decade in grades P.3 to P.5 (P.3: 10.9% to 14.7%; P.4: 27.7% to 36.6%; and P.5: 39.7% to 31.1%). This reflects the continuing practice of reviewing all vacant posts and recalibrating levels as necessary. In 2012, the number of staff members holding longer-term contracts declined from a peak in 2009‒2010, but still remains above the 2008 level. This decline is explained by the recent review of programmes, which resulted in downsizing (see Table 1).
Selections
37. Selection procedures have become more efficient, as indicated in Figure 8. The average time taken from initial advertisement to decision has fallen from about 5.9 months in 2010 to 4.2 months in 2012.
0
1000
2000
3000
4000
5000
6000
7000
8000
9000
10000
2002 2003 2004 2005 2006 2007 2008 2009 2010 2011 2012
Long‐term Temporary Total
Number of staff

A66/36
11
Figure 8. Trends in selection process timelines (2010–2012)
* Figures for 2010 not available
Gender balance
38. Since the introduction of its first 20% target in 1979, WHO has been working to increase the representation of women in the professional and higher categories. In 1997, the target was raised to 50% through resolution WHA50.16. In response, steps were taken to reach the target, including, special recruitment provisions to identify female candidates, a 60% recruitment threshold for women in the professional and higher categories, and management supported focal points for women to support cluster efforts to meet gender targets. Over the past decade the representation of women in the professional and higher categories has increased from 32.7% in 2002 to 39.5% at the end of 2012 (Figure 9).
Figure 9. Evolution of the percentage of women in the professional and higher categories, 1990‒2012
0 2 4 6 8 10Average in months
2012 2011 2010
Headquarters
*Africa
The Americas
South‐East Asia
EasternMediterranean
Europe
Western Pacific
21.823.0
24.5 24.926.5
25.227.1 27.4 28.2
29.931.9 31.8 32.7 33.6 34.4
35.9 36.437.7 37.8
39.5 40.0 39.839.5
0
5
10
15
20
25
30
35
40
45
1990 1991 1992 1993 1994 1995 1996 1997 1998 1999 2000 2001 2002 2003 2004 2005 2006 2007 2008 2009 2010 2011 2012
%
Year

A66/36
12
39. The reprofiling of the technical programmes and low recruitment numbers probably explain the slight drop in the percentage of women in the professional and higher categories in 2012. The proportion of women in those categories has traditionally been higher at headquarters than in most regions. Consequently, the relatively higher level of cuts at headquarters has particularly affected the overall percentage of women in the professional and higher categories. The reprofiling exercises themselves appear to have been gender neutral.
40. Over the decade, the number of female National Professional Officers has grown from 29.5% to 39.5%. In the general staff category, the disequilibrium in the gender balance has been reduced with the proportion of female staff members falling from 58.1% to 52.4%. It is worth noting that the percentage of women applying for posts at WHO was 43.2% in 2010, 45.8% in 2011 and 41.2% in 2012. Please refer to Table 16 for a breakdown by major office.
41. It is clear from the figures that renewed efforts are required to identify and encourage women candidates. More generally, parity of gender representation in WHO is an area that needs further thought and it has, therefore, been placed on the agenda for the coming year. However, all the signs are that gender parity could be attained within the next decade (Figure 10).
Figure 10. Projection of the movements towards gender parity in the professional and higher categories
42. A key initiative in this area is the United Nations System-wide Action Plan (UN-SWAP) ‒ a framework adopted in April 2012 that establishes a common understanding of gender equality and the empowerment of women, and a common method for achieving those ends. All agencies in the United Nations common system are expected to achieve gender parity in their workforce by 2017.
Geographical representation
43. Between 2002 and 2012, the proportion of staff members in the professional and higher categories who were nationals of developing countries had risen from 41.6% to 46.6%. Figure 11 reflects this upward trend in terms of staff numbers.
0
25
50
75
100
1990
1991
1992
1993
1994
1995
1996
1997
1998
1999
2000
2001
2002
2003
2004
2005
2006
2007
2008
2009
2010
2011
2012
2013
2014
2015
2016
2017
2018
2019
2020
2021
2022
Female staff
Male staff
%
Year

A66/36
13
Figure 11. Evolution of staff numbers in the professional and higher categories in posts counted for geographical representation, 2002–2012
44. In 2012, WHO had 196 Member States, including Croatia, Czech Republic, Serbia, Slovakia, Slovenia, South Sudan and Timor-Leste, which were admitted during the course of the decade.
45. In 1999, 120 Member States were within the established range of representation for positions at the professional or higher level, with 15 overrepresented, 13 underrepresented, and 43 unrepresented. In 2012, only 99 Member States were within the established range of representation, with 48 overrepresented, 10 underrepresented and 39 unrepresented. A total of 20 Member States with the highest representation now account for 53.1% of staff members in the professional and higher categories. While in absolute terms, the number of staff members from developing countries has increased over the past decade, the number of staff members from developed countries has similarly risen, so that the relative underrepresentation of developing countries has remained fairly static. As is the case for closing the gender gap across the Organization, targeted efforts are required to redress these geographical imbalances, including ongoing analysis of diversity profile statistics, pinpointing gaps in planning, and identifying priority groups for carrying out activities based on the staff diversity profile and future staffing needs.
Outreach efforts and talent management
46. Talent management involves the design and implementation of strategies, policies and systems to ensure that highly qualified individuals can be attracted, recruited and retained and their skills developed. Each year, about 500 interns visit WHO in order to work with both technical and administrative programmes in their chosen area and learn about the workings of an international organization. They provide an excellent pool of talent for future recruitment. In addition, contacts continue to be made with professional associations in the health sphere, academic institutions, and specialized recruitment and networking web sites. Outreach efforts to provide quality assurance include employing professional search and assessment companies to help fill senior positions in the Organization.
Mobility and rotation
47. In December 2002, 35.3% of staff members holding long-term appointments were assigned to headquarters, 40.5% to regional offices and 24.2% to country offices. As at 31 December 2012, the distribution was 24.1%, 24.3% and 51.6%, respectively (Figure 12).
0
200
400
600
800
1000
1200
1400
2002 2003 2004 2005 2006 2007 2008 2009 2010 2011 2012
Number of staff
YearDeveloped countries Developing countries

A66/36
14
Figure 12. Comparison of the distribution of long-term staff between 2002 and 2012, by office type
31 December 2002 31 December 2012
48. The percentage of staff members assigned to country offices has doubled over the last 10 years, representing a more balanced and strategic deployment of human resources and improved support for WHO’s country operations. Figure 13 shows that in the general service category, staff numbers at country-office level increased gradually between 2002 and 2006, more rapidly between 2006 and 2010, before beginning to decline. Since 2010, the number of general service staff at headquarters has also fallen. Over the same period, general service staff numbers have remained relatively stable in the regional offices (Figure 13).
Figure 13. Evolution of staff numbers in the general service category between 2002‒2012, by major office type
49. The introduction of a Global Roster of Heads of WHO Country Offices in 2009 has facilitated mobility for professional staff.
‐500
500
1500
2500
2002 2003 2004 2005 2006 2007 2008 2009 2010 2011 2012
Number of staff
Country offices 24.2%
Country offices51.6%
Regional offices 40.5%
Regional offices 24.3%
Headquarters 24.1%
Headquarters 35.3%
Headquarters Regional offices Country offices

A66/36
15
Succession planning
50. According to current projections, 983 staff members representing 15.0% of the total long-term workforce and 19.9% of staff members in the professional and higher categories are due to retire during the next five years (Table 10; Figure 14). Over the next 10 years, 2114 staff members, representing 32.3% of the workforce and 41.8% of the professional and higher categories, are due to retire. Figure 14 shows retirements occurring during the calendar year rather than at 31 December. A significant proportion of the people whom WHO recruits are specialists in their respective fields who generally join the Organization aged between 35 and 45. Projecting that to retirement age, between 40% and 50% of the workforce will retire every 10 years. A practice has recently been introduced requiring every post vacated to be reassessed and a decision taken on whether it should be retained, redesigned or abolished.
Figure 14. Projection of staff retirement over the next decade
51. Workforce planning and organizational development are hampered by a scarcity of both financial and human resources in a very competitive environment. Staff members should therefore be offered training and development opportunities that will equip them to assume additional responsibilities, in line with the objectives of learning, development, and performance management within the Organization.
The restructuring process
52. During the past three years, functional reviews have been conducted in several areas in order to better align the Organization’s essential functions with strategic reform. The reviews were followed by a corresponding reprofiling of the existing functions and some staff members were reassigned within the new structure. Since 2010, reassignments and separations have mainly affected staff at headquarters and in the Regional Office for Africa. Extensive career transition support was offered to all staff members concerned in the form of clinics for writing curricula vitae, networking workshops and individual sessions. Some 150 staff members availed themselves of individual support services in-house, with 20 staff members also using the services of an external company specializing in career transition.
53. Since 2010, across major offices, the number of staff members with long-term or temporary contracts fell by 937 or 11.3%. In headquarters, the number of staff fell by 491 or 19.3% and in the
0
10
20
30
40
50
60
70
80
90
2012 2013 2014 2015 2016 2017 2018 2019 2020 2021
P Staff NPO Staff GS Staff
Number of staff

A66/36
16
Regional Office for Africa by 304 or 11.5%. The remaining reductions occurred in the other regions. Since March 2012, there has been a reduction in payroll costs of about US$ 7 million per month, representing an overall saving of 8.5%.
Managing staff development
Learning and development activities
54. Since early 2004, WHO has been investing in staff learning and development, sending out a clear signal about the importance of learning as an integral part of improving staff performance. The creation of the Global Learning Committee represents a new form of governance for learning, encompassing identification of learning needs, management of resources and evaluation of learning outcomes. The Committee aligns learning and development with the strategic directions and priorities of the Organization by establishing policies for the Staff Development Award and allocating resources in accordance with the strategic directions. It also monitors progress and evaluates the impact of learning. A key development is the Global eLearning platform and Learning Management System, due to be introduced in September 2013. The main objectives of the eLearning initiative are cost–effectiveness and better access to training opportunities for all staff. It is supported by a framework comprising the following three elements: the WHO eLearning standards – guidelines for the development, implementation and facilitation of courses; the WHO eLearning policy – which outlines the eLearning programme objectives; and the OpenECB Check ‒ an accreditation and quality improvement scheme.
55. At the heart of the eLearning initiative lies the WHO eLearning platform ‒ a software-controlled learning infrastructure that replicates classroom-based teaching. The platform has several objectives, including, to consolidate all eLearning courses on a single, unified platform; to provide courses within a standard WHO template; to allow comparisons to be made between specific learning communities, such as regions and technical areas, as well as in connection with gender, grade and area of expertise of staff members; and to complement current face-to-face training. It is intended that the eLearning platform will initially include modules ranging from global induction and security in the field to job specific subjects within the areas of management and leadership, finance and budget, and human resources management. In due course the platform will also include specific technical modules. Courses will be available to all staff members.
Performance management
56. The Organization uses the performance management development system (PMDS), introduced in 2002, as a generic tool for performance appraisal and for guiding development. The former paper-based process has now been transformed into an electronic version (ePMDS) across the Organization. It is mandatory for all staff members and includes mid-term and end-of-cycle reviews of a workplan prepared at the beginning of the year. Although the performance management development system is clearly a tool for assessment performance, greater emphasis should be placed on the system’s instrumental value in the management of performance. A revised approach is envisioned that will enhance performance management, with a strong focus on using feedback from the system to promote learning and staff growth in the coming performance cycle. In keeping with this approach, all managers will be assessed on their ability to manage performance effectively.
Staff health and well-being
57. A key objective of human resources management is to improve staff health and well-being. Broadly, this encompasses a commitment to protecting and promoting health and safety at work and formulating policies and practices that will ensure an appropriate work-life balance. Several initiatives have already been introduced, including, part-time working arrangements for staff, study leave, parental leave, maternity leave, and the introduction of a teleworking pilot. Additional measures taken

A66/36
17
by health and medical services to support staff health and well-being include, organizing lunchtime seminars and a range of training sessions at headquarters and in the regions, such as workshops on stress reduction and intercultural communication in the workplace and monthly first-aid courses and refresher courses. The medical services are also represented on the interagency Human Resources Network Working Group on Employment of Persons with Disability, chaired by WHO.
58. During 2012, health and medical services finalized the implementation of the global web-based medical database in the regions and at headquarters. The new database will facilitate the monitoring of staff members’ health worldwide, the production of global statistics and the planning of adaptive and preventive measures in the workplace. Over the past decade, health and medical services have monitored staff members on sick leave more closely. Both sick leave and sick leave under insurance cover are now monitored monthly, in collaboration with the Global Service Centre and the headquarters departments dealing with staff health insurance and human resources. Continuing to follow up patients’ progress has been shown to facilitate their return to work.
Services and tools
Global Management System and Global Service Centre
59. Two major initiatives that have a direct impact on human resources functions are the Global Management System (GSM) and the Global Service Centre (GSC) in Kuala Lumpur, both of which became operational in July 2008 for the purpose of increasing the efficiency and cost-effectiveness of the Organization. The Global Service Centre provides support and information technology, procurement and human resources and finance services to all offices worldwide. Following the introduction of the Global Management System, teething problems were identified and an audit report in 2009 raised concerns about the quality of data in the human resources database. A project team was established to undertake activities to ensure data integrity for the future and to stabilize the system before its introduction in the regions. Continuous improvements mean that the Global Management System is now more robust and the data of a better quality.
SECTION III
60. A look at the future of human resources management and a review of the goals of the reform process.
Human resources reform
61. Human resources reform is an integral part of WHO reform whose aim is to equip the Organization to deal with increasingly complex health challenges in the twenty-first century. The WHO reform1 process has three objectives: to improve health outcomes, with WHO meeting the expectations of its Member States and partners in addressing agreed global health priorities, focused on the actions and areas where the Organization has a unique function or comparative advantage, and financed in a way that facilitates that focus; to strengthen coherence in global health, with WHO playing a leading role in enabling a wide range of actors to contribute actively and effectively to improving the health of all peoples; and to pursue excellence in order to enable the Organization to become effective, efficient, responsive, objective, transparent and accountable.
1 Please refer to WHO reform process documents at http://www.who.int/about/who_reform/documents/en/index.html.

A66/36
18
The four pillars of human resources reform
62. In keeping with the Organization-wide reform agenda, four pillars of human resources reform have been established embodying the following: a more flexible workforce and appointments policy covering recruitment, management of staffing levels and effective use of non-staff members that will allow the Organization to respond quickly to staffing needs; a more mobile workforce for whom rotation and mobility are part of an integrated approach to career development that includes tools, such as a skills inventory and an online career path mapping tool; a high-performance culture based on improved performance management processes and tools and complementary policies on rewards and recognition, accountability and improving performance; and enhanced staff development and learning through an Organization wide eLearning system and a management development programme. It is intended that a new human resources strategy incorporating the four pillars will be introduced in 2013. In addition, the following human resources priority activities will commence or be completed in 2013: Development of norms for the design of personnel structures, including ceilings on staff numbers, for all offices across the Organization; harmonization of selection practices across the Organization; further reduction in the time taken for recruitment; design and development of career paths for staff across functional areas; completion of a guide for managing performance; establishment of norms for objective setting and performance evaluation; identification of functional areas where generic and standard job descriptions can be prepared in order to facilitate mobility; and the launch of the eLearning platform and introduction of some mandatory courses for all staff and other courses for targeted groups.
ACTION BY THE HEALTH ASSEMBLY
63. The Health Assembly is invited to note the report.

A66/36
19
Index of tables The tables referred to in the preceding paragraphs are listed below for ease of reference (the information is as of 31 December 2012, unless otherwise stated):
Table 1 Number of staff holding long-term and temporary appointments
Table 2 Distribution of staff holding long-term appointments by major office, grade and sex
Table 3 Summary of countries not within range, by region
Table 4a-f Distribution of staff in positions counted for geographical representation, by country of origin
Table 5 Distribution of staff in positions not counted for geographical representation, by country of origin
Table 6 Staff by age, sex and major office
Table 7 Staff by grade and age, all locations
Table 8 Staff by length of service
Table 9 Appointments processed from 1 January to 31 December 2012
Table 10 Staff retirement projections
Table 11 Total staff in the professional and higher categories, by major office and region of nationality
Table 12 Staff mobility ‒ reassignments: change in duty station
Table 13 Distribution of occupied posts in the professional and higher categories across main occupational groups
Table 14 Number of non-staff contracts, by major office
Table 15 Number of Junior Professional Officers, by region and by donor countries
Table 16 Applications for posts at WHO: breakdown by sex of applicants and by major office

A66/36
20
TABLE 1. NUMBER OF STAFF HOLDING LONG-TERM AND TEMPORARY APPOINTMENTS
Category HeadquartersSpecial programmes
and collaborative arrangementsa
Africa The Americas South-East
Asia Europe
Eastern Mediterranean
Western Pacific
Total
Long-term appointments
Fixed-term appointments
Professional and higher category staff 356 76 150 98 54 96 96 85 1 011
National professional staff 43 0 428 5 21 49 54 48 648
General service staff 267 11 734 44 101 93 175 148 1 573
Total 666 87 1 312 147 176 238 325 281 3 232
Continuing appointments
Professional and higher category staff 539 54 204 15 77 96 84 75 1 144
National professional staff 1 0 146 1 21 37 25 17 248
General service staff 415 48 568 7 264 138 303 182 1 925
Total 955 102 918 23 362 271 412 274 3 317
Total number of long-term appointments 1 621 189 2 230 170 538 509 737 555 6 549
Temporary appointments
Temporary appointments under Staff Rule 420.4
Professional and higher category staff 122 27 59 4 39 13 64 33 361
National professional staff 2 0 16 0 43 2 22 21 106
General service staff 84 9 27 4 104 11 32 37 308
Total 208 36 102 8 186 26 118 91 775
Temporary appointments of 60 days or less
Professional and higher category staff 3 0 0 0 0 0 1 0 4
National professional staff 0 0 1 0 0 0 0 0 1
General service staff 5 1 1 0 0 0 0 2 9
Total 8 1 2 0 0 0 1 2 14
Total number of temporary appointments 216 37 104 8 186 26 119 93 789
Total number of staff 1 837 226 2 334 178 724 535 856 648 7 338 a This column includes: the Secretariat of the Roll Back Malaria Partnership, the Secretariat of the Stop TB Partnership, the Partnership for Maternal, Newborn and Child Health, the
Health Metrics Network, the Alliance for Health Policy and Systems Research, the Global Health Workforce Alliance and the United Nations System Standing Committee on Nutrition.

A66/36
21
TABLE 2. DISTRIBUTION OF STAFF HOLDING LONG-TERM APPOINTMENTS BY MAJOR OFFICE, GRADE AND SEXa
Professional and higher category staff
Major office P1 P2 P3 P4 P5 P6/D1 D2 Ungraded Total Percentage
M F T M F T M F T M F T M F T M F T M F T M F T M F T M F
Headquarters 0 0 0 8 28 36 61 93 154 147 165 312 186 97 283 54 18 72 22 4 26 8 4 12 486 409 895 54.3 45.7 Special programmes and collaborative arrangements 0 0 0 2 4 6 6 18 24 16 21 37 30 20 50 6 2 8 3 2 5 0 0 0 63 67 130 48.5 51.5 Africa 0 0 0 7 4 11 33 14 47 126 39 165 73 13 86 33 10 43 0 1 1 1 0 1 273 81 354 77.1 22.9 The Americas 0 1 1 3 8 11 5 7 12 43 30 73 10 4 14 1 0 1 0 0 0 0 1 1 62 51 113 54.9 45.1 South-East Asia 0 0 0 0 0 0 7 3 10 20 10 30 44 25 69 18 1 19 0 2 2 1 0 1 90 41 131 68.7 31.3 Europe 2 7 9 10 17 27 24 16 40 23 28 51 24 22 46 12 5 17 1 0 1 0 1 1 96 96 192 50.0 50.0 Eastern Mediterranean 2 1 3 3 6 9 14 9 23 41 15 56 34 20 54 24 5 29 4 1 5 1 0 1 123 57 180 68.3 31.7 Western Pacific 0 0 0 0 1 1 3 3 6 47 18 65 44 24 68 14 4 18 1 0 1 1 0 1 110 50 160 68.8 31.3 Total 4 9 13 33 68 101 153 163 316 463 326 789 445 225 670 162 45 207 31 10 41 12 6 18 1 303 852 2 155 60.5 39.5 Percentage by grade 30.8 69.2 100.0 32.7 67.3 100.0 48.4 51.6 100.0 58.7 41.3 100.0 66.4 33.6 100.0 78.3 21.7 100.0 75.6 24.4 100.0 66.7 33.3 100.0 60.5 39.5 100.0Percentage of total 0.6 4.7 14.7 36.6 31.1 9.6 1.9 0.8 100.0
National Professional Officers
Major office A B C D Total Percentage
M F T M F T M F T M F T M F T M F
Headquarters* 1 1 2 12 14 26 9 7 16 0 0 0 22 22 44 50.0 50.0 Special programmes and collaborative arrangements 0 0 0 0 0 0 0 0 0 0 0 0 0 0 0 0.0 0.0 Africa 11 2 13 134 37 171 259 123 382 7 1 8 411 163 574 71.6 28.4 The Americas 0 1 1 1 2 3 1 0 1 1 0 1 3 3 6 50.0 50.0 South-East Asia 4 2 6 6 6 12 15 8 23 1 0 1 26 16 42 61.9 38.1 Europe 6 6 12 22 35 57 8 9 17 0 0 0 36 50 86 41.9 58.1 Eastern Mediterranean 2 2 4 31 17 48 16 6 22 4 1 5 53 26 79 67.1 32.9 Western Pacific 1 8 9 13 18 31 9 15 24 0 1 1 23 42 65 35.4 64.6 Total 25 22 47 219 129 348 317 168 485 13 3 16 574 322 896 64.1 35.9 Percentage by grade 53.2 46.8 100.0 62.9 37.1 100.0 65.4 34.6 100.0 81.3 18.8 100.0 64.1 35.9 100.0Percentage of total 5.2 38.8 54.1 1.8 100.0
1 Includes all staff in all positions (including those not counted for geographical distribution purposes). * National Professional Officers appearing under headquarters are located in offices outside Geneva (e.g. Addis Ababa, Kobe, Kuala Lumpur).
22
A66/36
General service staff
Major office G1 G2 G3 G4 G5 G6 G7 Total Percentage
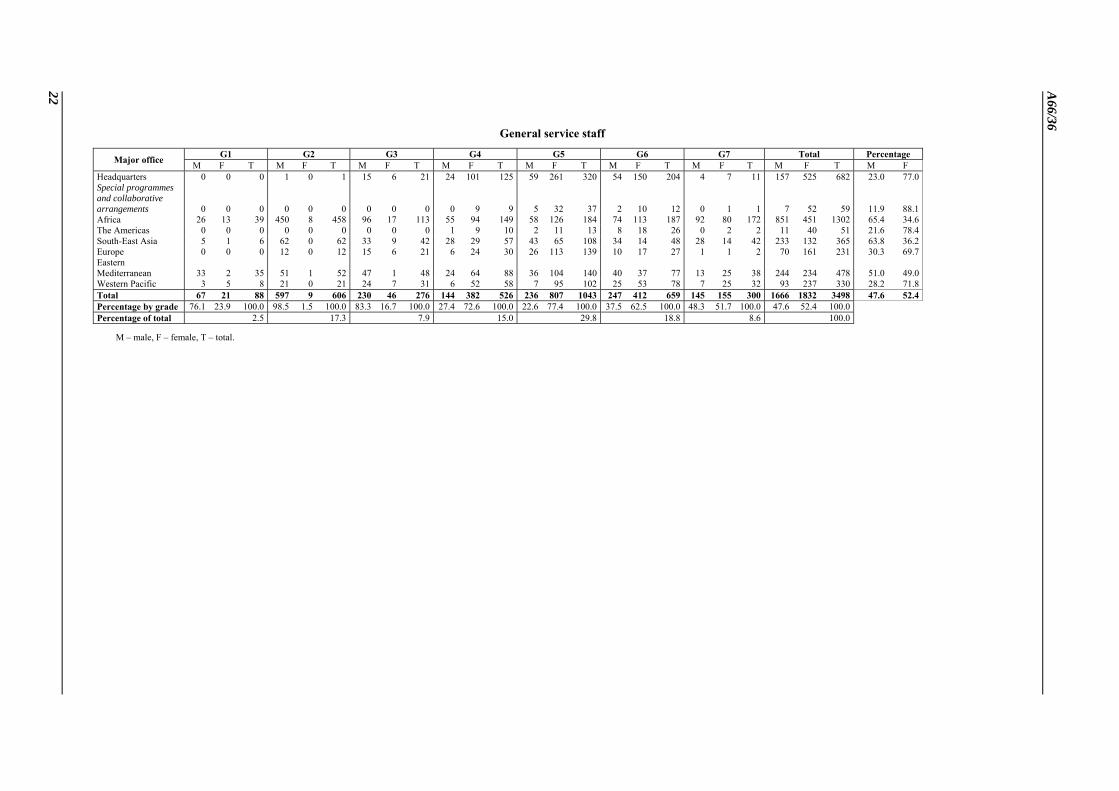
M F T M F T M F T M F T M F T M F T M F T M F T M F Headquarters 0 0 0 1 0 1 15 6 21 24 101 125 59 261 320 54 150 204 4 7 11 157 525 682 23.0 77.0Special programmes and collaborative arrangements 0 0 0 0 0 0 0 0 0 0 9 9 5 32 37 2 10 12 0 1 1 7 52 59 11.9 88.1Africa 26 13 39 450 8 458 96 17 113 55 94 149 58 126 184 74 113 187 92 80 172 851 451 1302 65.4 34.6The Americas 0 0 0 0 0 0 0 0 0 1 9 10 2 11 13 8 18 26 0 2 2 11 40 51 21.6 78.4South-East Asia 5 1 6 62 0 62 33 9 42 28 29 57 43 65 108 34 14 48 28 14 42 233 132 365 63.8 36.2Europe 0 0 0 12 0 12 15 6 21 6 24 30 26 113 139 10 17 27 1 1 2 70 161 231 30.3 69.7Eastern Mediterranean 33 2 35 51 1 52 47 1 48 24 64 88 36 104 140 40 37 77 13 25 38 244 234 478 51.0 49.0Western Pacific 3 5 8 21 0 21 24 7 31 6 52 58 7 95 102 25 53 78 7 25 32 93 237 330 28.2 71.8Total 67 21 88 597 9 606 230 46 276 144 382 526 236 807 1043 247 412 659 145 155 300 1666 1832 3498 47.6 52.4Percentage by grade 76.1 23.9 100.0 98.5 1.5 100.0 83.3 16.7 100.0 27.4 72.6 100.0 22.6 77.4 100.0 37.5 62.5 100.0 48.3 51.7 100.0 47.6 52.4 100.0Percentage of total 2.5 17.3 7.9 15.0 29.8 18.8 8.6 100.0
M – male, F – female, T – total.

A66/36
23
TABLE 3. SUMMARY OF COUNTRIES NOT WITHIN RANGE, BY REGION
Major office Unrepresented countries Underrepresented
countries Overrepresented countries
Africa Lesotho Swaziland
Benin Burkina Faso Burundi Cameroon Congo Côte d’Ivoire Democratic Republic of the Congo Ethiopia Ghana Kenya Malawi Mali Nigeria Rwanda Senegal South Africa Togo Uganda United Republic of Tanzania Zambia Zimbabwe
The Americas Antigua and Barbuda Bahamas Barbados Grenada Haiti Jamaica Paraguay Puerto Rico* Saint Kitts and Nevis Saint Lucia Saint Vincent and the Grenadines Suriname
Canada Peru
South-East Asia Indonesia Bangladesh India Nepal Sri Lanka

A66/36
24
Major office Unrepresented countries Underrepresented
countries Overrepresented countries
Europe Andorra Cyprus Lithuania Luxembourg Monaco Montenegro San Marino
Austria Israel Portugal
Belgium Denmark France Ireland Italy Netherlands Spain Sweden Switzerland United Kingdom of Great Britain and Northern Ireland
Eastern Mediterranean
Kuwait Oman Qatar United Arab Emirates
Saudi Arabia Egypt Iran (Islamic Republic of) Jordan Lebanon Pakistan Sudan Tunisia
Western Pacific Brunei Darussalam Cook Islands Kiribati Lao People’s Democratic Republic Marshall Islands Micronesia (Federated States of) Nauru Niue Palau Papua New Guinea Samoa Tokelau* Tuvalu Vanuatu
China Japan Republic of Korea Singapore Viet Nam
Australia Malaysia New Zealand Philippines
* Associate Member.

A66/36
25
TABLE 4a. DISTRIBUTION OF STAFF IN POSITIONS COUNTED FOR GEOGRAPHICAL REPRESENTATION,a BY COUNTRY OF ORIGIN
Nationals of Member States in the African Region
Country Range
Staff by grade and sex
P1 P2 P3 P4 P5 P6/D1 D2 UngradedAll professional
staff
M F M F M F M F M F M F M F M F M F Total Algeria 2-10 1 1 3 2 2 5 4 9 Angola 1-8 1 2 1 1 1 1 6 1 7 Benin 1-8 7 2 1 9 1 10 Botswana 1-8 1 0 1 1 Burkina Faso 1-8 1 2 4 3 4 1 11 4 15 Burundi 1-8 2 2 2 2 3 7 4 11 Cameroon 1-8 1 3 1 7 1 2 1 12 4 16 Cape Verde 1-7 1 0 1 1 Central African Republic 1-8 1 1 1 3 0 3 Chad 1-8 2 1 2 1 6 0 6 Comoros 1-7 1 1 0 1 Congo 1-8 1 4 1 3 1 10 0 10 Côte d’Ivoire 1-8 1 2 1 4 1 2 7 4 11 Democratic Republic of the Congo 2-12 2 12 1 3 1 1 19 1 20 Equatorial Guinea 1-7 1 1 0 1 Eritrea 1-8 3 3 0 3 Ethiopia 2-12 1 2 9 4 5 1 1 1 17 7 24 Gabon 1-8 2 1 1 2 2 4 Gambia 1-8 7 7 0 7 Ghana 1-8 1 1 1 4 4 4 2 1 1 12 7 19 Guinea 1-8 1 3 2 1 1 7 1 8 Guinea-Bissau 1-8 1 1 1 1 2 2 4 Kenya 1-10 1 2 5 6 4 1 2 12 9 21 Lesotho 1-8 0 0 0 Liberia 1-8 1 1 0 1 Madagascar 1-8 1 1 1 1 2 2 4 Malawi 1-8 1 3 1 5 9 1 10 Mali 1-8 1 7 7 1 16 0 16

A66/36
26
Country Range
Staff by grade and sex
P1 P2 P3 P4 P5 P6/D1 D2 UngradedAll professional
staff
M F M F M F M F M F M F M F M F M F Total Mauritania 1-8 1 1 2 1 5 0 5 Mauritius 1-8 1 1 1 1 1 4 1 5 Mozambique 1-8 2 1 1 1 3 4 Namibia 1-8 1 2 2 1 3 Niger 1-8 2 1 3 1 5 2 7 Nigeria 4-14 3 8 1 6 1 2 19 2 21 Rwanda 1-8 2 1 3 10 1 16 1 17 Sao Tome and Principe 1-7 1 1 0 1 Senegal 1-8 4 3 5 2 1 1 1 10 7 17 Seychelles 1-7 1 0 1 1 Sierra Leone 1-8 1 1 2 1 3 4 South Africa 4-11 1 1 2 5 2 1 6 6 12 Swaziland 1-7 0 0 0 Togo 1-8 2 4 1 3 1 10 1 11 Uganda 1-8 1 1 8 4 6 1 1 17 5 22 United Republic of Tanzania 1-10 1 3 3 1 2 1 1 6 6 12 Zambia 1-8 2 3 2 3 2 8 4 12 Zimbabwe 1-8 1 1 4 2 1 4 1 1 1 13 3 16
Total – African Region 0 0 6 5 39 19 124 46 104 19 34 11 2 2 2 0 311 102 413
a Counted posts exclude: language positions, seconded staff and staff working in partnerships. M – male, F – female.

A66/36
27
TABLE 4b. DISTRIBUTION OF STAFF IN POSITIONS COUNTED FOR GEOGRAPHICAL REPRESENTATION,a BY COUNTRY OF ORIGIN
Nationals of Member States in the Region of the Americas
Country Range
Staff by grade and sex
P1 P2 P3 P4 P5 P6/D1 D2 UngradedAll professional
staff
M F M F M F M F M F M F M F M F M F Total Antigua and Barbuda 1-7 0 0 0 Argentina 9-16 1 1 2 5 3 2 1 1 9 7 16 Bahamas 1-7 0 0 0 Barbados 1-7 0 0 0 Belize 1-7 1 0 1 1 Bolivia (Plurinational State of) 1-8 2 1 2 3 5 Brazil 21-29 4 5 7 5 3 4 14 14 28 Canada 19-26 2 5 12 9 9 2 2 2 1 1 25 20 45 Chile 2-9 1 3 1 2 4 3 7 Colombia 3-10 1 1 1 1 3 1 5 3 8 Costa Rica 1-8 1 2 2 1 3 Cuba 1-8 1 5 1 7 0 7 Dominica 1-7 1 0 1 1 Dominican Republic 1-8 1 1 0 1 Ecuador 1-8 1 1 2 2 3 3 6 El Salvador 1-8 2 3 2 3 5 Grenada 1-7 0 0 0 Guatemala 1-8 1 1 1 1 2 4 2 6 Guyana 1-7 1 1 0 2 2 Haiti 1-8 0 0 0 Honduras 1-8 2 2 0 2 Jamaica 1-8 0 0 0 Mexico 11-17 1 4 2 2 1 1 4 7 11 Nicaragua 1-8 2 0 2 2 Panama 1-8 2 1 2 1 3 Paraguay 1-8 0 0 0 Peru 2-10 2 2 8 3 1 1 12 5 17 Puerto Rico* 1-8 0 0 0

A66/36
28
Country Range
Staff by grade and sex
P1 P2 P3 P4 P5 P6/D1 D2 UngradedAll professional
staff
M F M F M F M F M F M F M F M F M F Total Saint Kitts and Nevis 1-7 0 0 0 Saint Lucia 1-7 0 0 0 Saint Vincent and the Grenadines 1-7 0 0 0 Suriname 1-7 0 0 0 Trinidad and Tobago 1-8 1 2 1 2 2 4 United States of America 142-193 1 2 6 7 12 29 31 36 19 12 6 2 1 89 75 164 Uruguay 1-8 1 1 1 1 2 Venezuela (Bolivarian Republic of) 2-9 1 1 1 2 1 4 2 6
Total – Region of the Americas 0 1 5 11 13 32 82 72 63 30 23 10 4 0 2 2 192 158 350
a Counted posts exclude: language positions, seconded staff and staff working in partnerships. M – male, F – female.
* Associate Member.

A66/36
29
TABLE 4c. DISTRIBUTION OF STAFF IN POSITIONS COUNTED FOR GEOGRAPHICAL REPRESENTATIONa
BY COUNTRY OF ORIGIN
Nationals of Member States in the South-East Asia Region
Country Range
Staff by grade and sex
P1 P2 P3 P4 P5 P6/D1 D2 UngradedAll professional
staff
M F M F M F M F M F M F M F M F M F Total Bangladesh 4-14 9 3 1 3 15 1 16 Bhutan 1-8 1 2 1 1 4 1 5 Democratic People’s Republic of Korea 1-8 1 1 2 0 2 India 27-38 2 2 15 7 29 7 18 15 6 1 70 32 102 Indonesia 7-14 1 4 4 1 5 Maldives 1-7 1 1 1 1 2 Myanmar 2-10 1 2 2 3 2 5 Nepal 1-8 1 3 3 3 10 0 10 Sri Lanka 1-8 1 1 4 3 3 8 4 12 Thailand 4-12 1 1 1 4 1 1 3 6 9 Timor-Leste 1-7 1 1 0 1
Total – South-East Asia Region 0 0 3 3 16 9 45 8 36 27 20 0 0 1 1 0 121 48 169
a Counted posts exclude: language positions, seconded staff and staff working in partnerships.
M – male, F – female.

A66/36
30
TABLE 4d. DISTRIBUTION OF STAFF IN POSITIONS COUNTED FOR GEOGRAPHICAL REPRESENTATIONa
BY COUNTRY OF ORIGIN
Nationals of Member States in the European Region
Country Range
Staff by grade and sex
P1 P2 P3 P4 P5 P6/D1 D2 UngradedAll professional
staff
M F M F M F M F M F M F M F M F M F Total Albania 1-8 1 1 1 0 3 3 Andorra 1-7 0 0 0 Armenia 1-8 1 1 2 0 2 Austria 7-14 1 2 1 1 1 4 2 6 Azerbaijan 1-8 3 1 1 3 2 5 Belarus 1-8 2 1 1 2 3 Belgium 9-15 1 1 1 1 4 8 1 7 1 1 1 18 9 27 Bosnia and Herzegovina 1-8 1 1 0 1 Bulgaria 1-8 1 1 1 1 2 2 4 Croatia 1-8 1 1 2 1 1 2 4 6 Cyprus 1-7 0 0 0 Czech Republic 2-9 1 2 1 2 2 4 Denmark 6-12 3 2 2 2 2 6 1 1 11 8 19 Estonia 1-8 1 1 1 2 1 3 Finland 4-11 1 2 1 3 1 5 3 8 France 42-58 6 8 7 17 11 24 13 7 3 1 1 57 41 98 Georgia 1-8 1 1 1 1 2 3 Germany 63-86 2 5 10 17 13 21 12 3 2 1 46 40 86 Greece 4-11 1 1 2 1 2 3 5 Hungary 1-8 2 2 1 1 1 1 4 4 8 Iceland 1-7 1 0 1 1 Ireland 3-9 1 5 2 4 1 4 9 13 Israel 3-10 1 0 1 1 Italy 34-47 1 6 2 10 5 15 9 10 5 1 46 18 64 Kazakhstan 1-8 1 1 2 2 2 4 Kyrgyzstan 1-8 1 0 1 1 Latvia 1-8 1 1 0 2 2 Lithuania 1-8 0 0 0

A66/36
31
Country Range
Staff by grade and sex
P1 P2 P3 P4 P5 P6/D1 D2 UngradedAll professional
staff
M F M F M F M F M F M F M F M F M F Total Luxembourg 1-8 0 0 0 Malta 1-7 2 1 1 3 1 4 Monaco 1-7 0 0 0 Montenegro 1-7 0 0 0 Netherlands 13-20 2 1 3 7 6 13 4 6 3 1 28 18 46 Norway 5-12 1 2 3 1 1 2 6 8 Poland 4-11 1 1 2 2 2 4 Portugal 4-10 1 1 1 1 2 3 Republic of Moldova 1-8 1 1 2 1 1 2 4 6 Romania 1-8 1 3 1 1 4 5 Russian Federation 12-19 3 3 1 2 1 4 3 1 10 8 18 San Marino 1-7 0 0 0 Serbia 1-8 1 1 2 3 1 6 7 Slovakia 1-8 1 1 0 1 Slovenia 1-8 1 0 1 1 Spain 18-26 1 2 3 1 5 6 4 4 1 1 14 14 28 Sweden 8-14 1 4 1 4 3 3 1 5 12 17 Switzerland 9-16 6 6 4 4 2 4 12 14 26 Tajikistan 1-8 1 2 0 3 3 The former Yugoslav Republic of
Macedonia 1-8 1 1 0 1 Turkey 5-12 3 2 4 1 1 6 5 11 Turkmenistan 1-8 1 1 1 1 2 3 Ukraine 2-10 2 1 1 2 2 4 United Kingdom of Great Britain and
Northern Ireland 37-51 1 3 5 3 9 14 13 21 15 6 1 3 1 51 44 95 Uzbekistan 1-10 1 1 0 1
Total – European Region 1 0 8 29 46 63 103 102 137 94 49 14 13 5 2 3 359 310 669
1 Counted posts exclude: language positions, seconded staff and staff working in partnerships.
M – male, F – female.

A66/36
32
TABLE 4e. DISTRIBUTION OF STAFF ON IN POSITIONS COUNTED FOR GEOGRAPHICAL REPRESENTATIONa BY COUNTRY OF ORIGIN
Nationals of Member States in the Eastern Mediterranean Region
Country Range
Staff by grade and sex
P1 P2 P3 P4 P5 P6/D1 D2 UngradedAll professional
staff
M F M F M F M F M F M F M F M F M F Total Afghanistan 1-8 1 1 1 1 3 1 4 Bahrain 1-7 1 1 0 2 2 Djibouti 1-7 1 1 2 0 2 Egypt 3-12 1 2 4 4 2 7 3 2 4 15 14 29 Iran (Islamic Republic of) 4-12 1 1 4 3 5 1 1 10 6 16 Iraq 2-9 3 1 4 0 4 Jordan 1-8 1 3 1 2 2 1 1 1 8 4 12 Kuwait 1-8 0 0 0 Lebanon 1-8 2 2 3 1 1 1 2 6 6 12 Libya 1-8 1 1 0 1 Morocco 1-10 1 1 1 1 1 2 4 3 7 Oman 1-8 0 0 0 Pakistan 5-14 1 8 1 10 3 22 1 23 Qatar 1-7 0 0 0 Saudi Arabia 5-11 1 1 1 1 2 3 Somalia 1-8 2 1 1 1 3 2 5 South Sudan 1-7 1 1 0 1 Sudan 1-10 1 1 4 2 1 4 10 3 13 Syrian Arab Republic 1-8 1 1 2 1 4 1 5 Tunisia 1-8 2 1 2 1 1 2 1 1 7 4 11 United Arab Emirates 2-8 0 0 0 Yemen 1-8 2 1 1 4 0 4 Total – Eastern Mediterranean Region 0 1 2 5 14 5 36 20 32 13 16 4 3 1 2 0 105 49 154
a Counted posts exclude: language positions, seconded staff, staff working in partnerships. M – male, F – female.

A66/36
33
TABLE 4f. DISTRIBUTION OF STAFF IN POSITIONS COUNTED FOR GEOGRAPHICAL REPRESENTATIONa
BY COUNTRY OF ORIGIN Nationals of Member States in the Western Pacific Region
Country Range
Staff by grade and sex
P1 P2 P3 P4 P5 P6/D1 D2 Ungraded All professional staff
M F M F M F M F M F M F M F M F M F Total Australia 12-19 3 1 2 9 6 6 4 5 1 3 24 16 40 Brunei Darussalam 1-7 0 0 0 Cambodia 1-8 1 1 2 0 2 China 40-55 1 2 5 9 8 2 3 1 1 1 1 19 15 34 Cook Islands 1-7 0 0 0 Fiji 1-7 2 1 2 1 3 Japan 121-166 1 1 2 1 6 8 11 8 1 1 1 23 18 41 Kiribati 1-7 0 0 0 Lao People’s Democratic Republic 1-8 0 0 0 Malaysia 3-9 1 2 2 2 2 1 5 5 10 Marshall Islands 1-7 0 0 0 Micronesia (Federated States of) 1-7 0 0 0 Mongolia 1-8 4 1 1 1 5 6 Nauru 1-7 0 0 0 New Zealand 2-9 2 3 3 1 1 1 7 4 11 Niue 1-7 0 0 0 Palau 1-7 0 0 0 Papua New Guinea 1-8 0 0 0 Philippines 3-12 1 1 6 7 5 9 4 1 2 1 1 19 19 38 Republic of Korea 15-21 2 2 2 3 3 1 1 7 7 14 Samoa 1-7 0 0 0 Singapore 3-10 1 1 0 1 Solomon Islands 1-7 1 1 0 1 Tokelau* 1-7 0 0 0 Tonga 1-7 1 0 1 1 Tuvalu 1-7 0 0 0 Vanuatu 1-7 0 0 0 Viet Nam 3-12 1 1 0 1
Total – Western Pacific Region 0 0 2 5 13 15 33 41 40 25 13 4 8 0 3 1 112 91 203 a Counted posts exclude: language positions, seconded staff and staff working in partnerships. M – male, F – female. * Associate Member.

A66/36
34
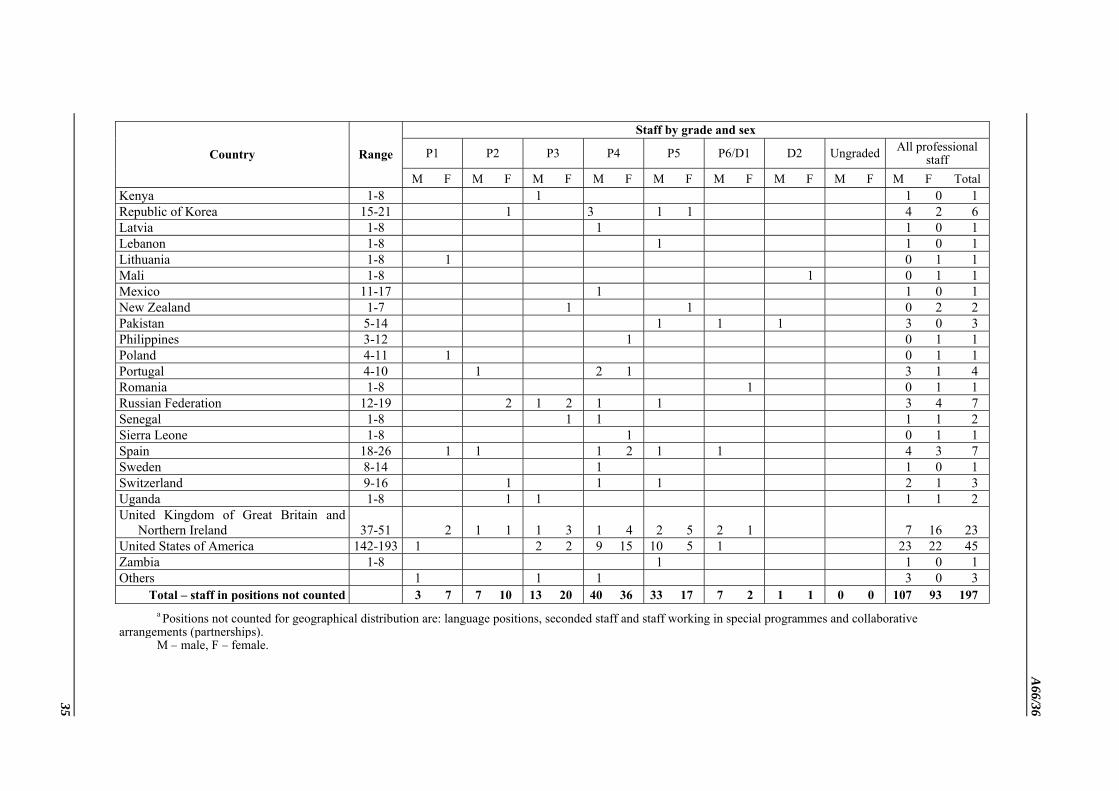
TABLE 5. DISTRIBUTION OF STAFF IN POSITIONS NOT COUNTED FOR GEOGRAPHICAL REPRESENTATION,a BY COUNTRY OF ORIGIN
Nationals of Member States of all regions
Country Range
Staff by grade and sex
P1 P2 P3 P4 P5 P6/D1 D2 Ungraded All professional staff
M F M F M F M F M F M F M F M F M F Total Algeria 2-10 1 0 1 1 Angola 1-8 1 0 1 1 Australia 12-19 1 1 2 1 2 3 5 Belgium 9-15 1 1 2 2 2 5 3 8 Bolivia (Pluriational State of) 1-8 1 1 0 1 Brazil 21-29 1 1 1 1 2 Bulgaria 1-8 1 1 0 2 2 Cameroon 1-8 2 2 0 2 Canada 19-26 1 1 2 1 2 3 5 Central African Republic 1-8 1 1 0 1 China 40-55 1 2 2 1 3 Colombia 3-10 1 1 0 1 Congo 1-8 1 1 0 1 Cote d’Ivoire 1-8 1 0 1 1 Cuba 1-8 1 1 0 1 Czech Republic 2-9 1 1 0 1 Democratic Republic of the Congo 2-12 1 0 1 1 Egypt 3-12 1 0 1 1 Ethiopia 2-12 1 1 2 0 2 Finland 4-11 1 0 1 1 France 42-58 1 3 2 3 4 1 1 7 8 15 Germany 63-86 1 1 4 1 1 6 2 8 Ghana 1-8 1 1 0 1 Hungary 1-8 1 0 1 1 India 27-38 1 2 1 2 2 4 Ireland 3-9 1 1 1 1 2 Italy 34-47 1 1 2 1 4 1 5 Jordan 1-8 1 1 0 1
35
A66/36
Country Range
Staff by grade and sex
P1 P2 P3 P4 P5 P6/D1 D2 Ungraded All professional staff
M F M F M F M F M F M F M F M F M F Total Kenya 1-8 1 1 0 1 Republic of Korea 15-21 1 3 1 1 4 2 6 Latvia 1-8 1 1 0 1 Lebanon 1-8 1 1 0 1 Lithuania 1-8 1 0 1 1 Mali 1-8 1 0 1 1 Mexico 11-17 1 1 0 1 New Zealand 1-7 1 1 0 2 2 Pakistan 5-14 1 1 1 3 0 3 Philippines 3-12 1 0 1 1 Poland 4-11 1 0 1 1 Portugal 4-10 1 2 1 3 1 4 Romania 1-8 1 0 1 1 Russian Federation 12-19 2 1 2 1 1 3 4 7 Senegal 1-8 1 1 1 1 2 Sierra Leone 1-8 1 0 1 1 Spain 18-26 1 1 1 2 1 1 4 3 7 Sweden 8-14 1 1 0 1 Switzerland 9-16 1 1 1 2 1 3 Uganda 1-8 1 1 1 1 2 United Kingdom of Great Britain and
Northern Ireland 37-51 2 1 1 1 3 1 4 2 5 2 1 7 16 23 United States of America 142-193 1 2 2 9 15 10 5 1 23 22 45 Zambia 1-8 1 1 0 1 Others 1 1 1 3 0 3
Total – staff in positions not counted 3 7 7 10 13 20 40 36 33 17 7 2 1 1 0 0 107 93 197
a Positions not counted for geographical distribution are: language positions, seconded staff and staff working in special programmes and collaborative arrangements (partnerships). M – male, F – female.

A66/36
36
TABLE 6. STAFF BY AGE, SEX AND MAJOR OFFICE
Professional and higher category staff
Major office 20–29 years 30–39 years 40–49 years 50–59 years 60–62 years Over 62 years Total
M F T M F T M F T M F T M F T M F T M F T
Headquarters 1 3 4 44 72 116 173 182 355 225 123 348 42 27 69 1 2 3 486 409 895
Special programmes and collaborative arrangements 0 0 0 7 15 22 23 31 54 29 18 47 4 3 7 0 0 0 63 67 130
Africa 0 0 0 9 5 14 80 26 106 140 40 180 44 10 54 0 0 0 273 81 354
The Americas 0 2 2 5 5 10 20 20 40 29 20 49 7 3 10 1 1 2 62 51 113
South-East Asia 0 0 0 3 5 8 18 16 34 50 14 64 18 5 23 1 1 2 90 41 131
Europe 1 0 1 16 28 44 44 42 86 30 24 54 4 2 6 1 0 1 96 96 192
Eastern Mediterranean 0 0 0 6 4 10 35 20 55 68 31 99 13 2 15 1 0 1 123 57 180
Western Pacific 0 2 2 10 3 13 46 22 68 42 20 62 11 3 14 1 0 1 110 50 160
Total 2 7 9 100 137 237 439 359 798 613 290 903 143 55 198 6 4 10 1303 852 2155
Percentage by bracket 22.2 77.8 100.0 42.2 57.8 100.0 55.0 45.0 100.0 67.9 32.1 100.0 72.2 27.8 100.0 60.0 40.0 100.0 60.5 39.5 100.0
Percentage of total 0.4 11.0 37.0 41.9 9.2 0.5 100.0
National Professional Officers
Major office 20–29 years 30–39 years 40–49 years 50–59 years 60–62 years Over 62 years Total
M F T M F T M F T M F T M F T M F T M F T
Headquarters 1 4 5 19 10 29 2 7 9 0 1 1 0 0 0 0 0 0 22 22 44
Special programmes and collaborative arrangements 0 0 0 0 0 0 0 0 0 0 0 0 0 0 0 0 0 0 0 0 0
Africa 1 1 2 56 21 77 179 62 241 143 71 214 32 8 40 0 0 0 411 163 574
The Americas 0 0 0 0 1 1 1 0 1 1 2 3 1 0 1 0 0 0 3 3 6
South-East Asia 0 0 0 2 5 7 5 4 9 16 5 21 3 2 5 0 0 0 26 16 42
Europe 0 0 0 8 15 23 16 23 39 9 11 20 3 1 4 0 0 0 36 50 86
Eastern Mediterranean 0 0 0 13 8 21 18 12 30 20 6 26 2 0 2 0 0 0 53 26 79
Western Pacific 0 2 2 6 12 18 9 14 23 7 14 21 1 0 1 0 0 0 23 42 65
Total 2 7 9 104 72 176 230 122 352 196 110 306 42 11 53 0 0 0 574 322 896
Percentage by bracket 22.2 77.8 100.0 59.1 40.9 100.0 65.3 34.7 100.0 64.1 35.9 100.0 79.2 20.8 100.0 0.0 0.0 0.0 64.1 35.9 100.0
Percentage of total 1.0 19.6 39.3 34.2 5.9 0.0 100.0

37
A66/36
General service staff
Major office 20–29 years 30–39 years 40–49 years 50–59 years 60–62 years Over 62 years Total
M F T M F T M F T M F T M F T M F T M F T
Headquarters 3 19 22 48 150 198 56 165 221 47 168 215 3 23 26 0 0 0 157 525 682
Special programmes and collaborative arrangements 0 0 0 2 7 9 4 12 16 1 31 32 0 2 2 0 0 0 7 52 59
Africa 9 9 18 153 134 287 373 170 543 278 127 405 38 11 49 0 0 0 851 451 1302
The Americas 0 0 0 4 1 5 5 11 16 2 25 27 0 3 3 0 0 0 11 40 51
South-East Asia 4 6 10 57 49 106 79 43 122 85 28 113 8 6 14 0 0 0 233 132 365
Europe 2 5 7 19 52 71 33 57 90 13 40 53 3 7 10 0 0 0 70 161 231
Eastern Mediterranean 15 21 36 76 86 162 83 77 160 66 44 110 4 6 10 0 0 0 244 234 478
Western Pacific 3 22 25 29 81 110 29 64 93 31 63 94 1 7 8 0 0 0 93 237 330
Total 36 82 118 388 560 948 662 599 1261 523 526 1049 57 65 122 0 0 0 1666 1832 3498
Percentage by bracket 30.5 69.5 100.0 40.9 59.1 100.0 52.5 47.5 100.0 49.9 50.1 100.0 46.7 53.3 100.0 0.0 0.0 0.0 47.6 52.4 100.0
Percentage of total 3.4 27.1 36.0 30.0 3.5 0.0 100.0
M – male, F – female, T – total.

A66/36
38
TABLE 7. STAFF BY GRADE AND AGE, ALL LOCATIONS
Professional and higher category staff
Grade 20–29 years 30–39 years 40–49 years 50–59 years 60–62 years Over 62 years Total
M F T M F T M F T M F T M F T M F T M F T
Ungraded 0 0 0 0 0 0 1 0 1 5 2 7 3 2 5 3 2 5 12 6 18
D2 0 0 0 0 0 0 2 0 2 21 6 27 7 3 10 1 1 2 31 10 41
D1/P6 0 0 0 0 1 1 21 14 35 106 26 132 34 4 38 1 0 1 162 45 207
P5 0 0 0 6 3 9 127 91 218 247 111 358 64 19 83 1 1 2 445 225 670
P4 0 0 0 46 42 88 205 167 372 186 98 284 26 19 45 0 0 0 463 326 789
P3 1 2 3 32 58 90 69 62 131 43 36 79 8 5 13 0 0 0 153 163 316
P2 0 5 5 1 8 9 2 1 3 0 0 0 0 0 0 0 0 0 3 14 17
P1 1 0 1 15 25 40 12 24 36 5 11 16 1 3 4 0 0 0 34 63 97
Total 2 7 9 100 137 237 439 359 798 613 290 903 143 55 198 6 4 10 1303 852 2155
Percentage by bracket 22.2 77.8 100.0 42.2 57.8 100.0 55.0 45.0 100.0 67.9 32.1 100.0 72.2 27.8 100.0 60.0 40.0 100.0 60.5 39.5 100.0
Percentage of total 0.4 11.0 37.0 41.9 9.2 0.5 100.0
National Professional Officers
Grade 20–29 years 30–39 years 40–49 years 50–59 years 60–62 years Over 62 years Total
M F T M F T M F T M F T M F T M F T M F T
D 0 0 0 2 0 2 3 2 5 8 1 9 0 0 0 0 0 0 13 3 16
C 0 0 0 36 23 59 123 71 194 132 67 199 26 7 33 0 0 0 317 168 485
B 2 5 7 59 40 99 92 44 136 50 37 87 16 3 19 0 0 0 219 129 348
A 0 2 2 7 9 16 12 5 17 6 5 11 0 1 1 0 0 0 25 22 47
Total 2 7 9 104 72 176 230 122 352 196 110 306 42 11 53 0 0 0 574 322 896
Percentage by bracket 22.2 77.8 100.0 59.1 40.9 100.0 65.3 34.7 100.0 64.1 35.9 100.0 79.2 20.8 100.0 0.0 0.0 0.0 64.1 35.9 100.0
Percentage of total 1.0 19.6 39.3 34.2 5.9 0.0 100.0

39
A66/36
General service staff
Grade 20–29 years 30–39 years 40–49 years 50–59 years 60–62 years Over 62 years Total
M F T M F T M F T M F T M F T M F T M F T
G7 5 1 6 23 5 28 17 9 26 22 6 28 0 0 0 0 0 0 67 21 88
G6 1 1 2 89 3 92 258 2 260 220 3 223 29 1 30 0 0 0 597 10 607
G5 2 4 6 45 13 58 96 18 114 76 10 86 11 1 12 0 0 0 230 46 276
G4 8 33 41 43 157 200 44 111 155 44 72 116 5 9 14 0 0 0 144 382 526
G3 10 38 48 61 264 325 92 258 350 68 216 284 5 31 36 0 0 0 236 807 1043
G2 8 4 12 90 89 179 99 154 253 45 151 196 5 13 18 0 0 0 247 411 658
G1 2 1 3 37 29 66 56 47 103 48 68 116 2 10 12 0 0 0 145 155 300
Total 36 82 118 388 560 948 662 599 1261 523 526 1049 57 65 122 0 0 0 1666 1832 3498
Percentage by bracket 30.5 69.5 100.0 40.9 59.1 100.0 52.5 47.5 100.0 49.9 50.1 100.0 46.7 53.3 100.0 0.0 0.0 0.0 47.6 52.4 100
Percentage of total 3.4 27.1 36.0 30.0 3.5 0.0 100.0
M – male, F– female, T – total.

A66/36
40
TABLE 8. STAFF BY LENGTH OF SERVICE
Major office Under 5 years 5–9 years 10–14 years 15–19 years 20–24 years 25–29 years 30 years All
P NPO GS T P NPO GS T P NPO GS T P NPO GS T P NPO GS T P NPO GS T P NPO GS T P NPO GS T
Headquarters 220 29 181 430 409 15 270 694 155 0 103 258 48 0 20 68 41 0 61 102 19 0 32 51 3 0 15 18 895 44 682 1621
Special programmes and collaborative arrangements 57 0 8 65 50 0 25 75 12 0 11 23 7 0 1 8 3 0 10 13 0 0 4 4 1 0 0 1 130 0 59 189
Africa 67 233 262 562 176 267 833 1276 82 62 68 212 11 6 43 60 14 5 44 63 2 1 36 39 2 0 16 18 354 574 1302 2230
The Americas 44 3 13 60 21 1 4 26 28 0 9 37 11 0 8 19 4 0 7 11 4 1 3 8 1 1 7 9 113 6 51 170
South-East Asia 42 20 60 122 51 12 131 194 22 3 57 82 9 0 37 46 3 2 47 52 3 4 29 36 1 1 4 6 131 42 365 538
Europe 66 31 60 157 92 46 124 262 18 9 24 51 5 0 8 13 9 0 8 17 1 0 3 4 1 0 4 5 192 86 231 509
Eastern Mediterranean 59 49 120 228 69 17 254 340 34 8 30 72 9 1 23 33 5 1 29 35 4 2 16 22 1 6 7 180 79 478 737
Western Pacific 64 41 107 212 57 17 112 186 28 48 76 8 1 25 34 2 5 22 29 0 0 11 11 1 1 5 7 160 65 330 555
Total 619 406 811 1836 925 375 1753 3053 379 82 350 811 108 8 165 281 81 13 228 322 33 8 134 175 10 4 57 71 2155 896 3498 6549
Percentage by bracket 33.7 22.1 44.2 100.0 30.3 12.3 57.4 100.0 46.7 10.1 43.2 100.0 38.4 2.8 58.7 100.0 25.2 4.0 70.8 100.0 18.9 4.6 76.6 100.0 14.1 5.6 80.3 100.0 32.9 13.7 53.4 100.0
Percentage of total 28.0 46.6 12.4 4.3 4.9 2.7 1.1 100.0
P – Professional and higher categories, NPO – national professional officer, GS – general service, T – total.

41
A66/36
TABLE 9. APPOINTMENTS PROCESSED FROM 1 JANUARY TO 31 DECEMBER 2012
Major office Category Total staff at 31 December 2012
External appointments Conversion of temporary contracts Interagency transfers Total
No. of staff % of total recruitment
% of women
No. of staff % of total recruitment
% of women
No. of staff
% of total recruitment
% of women
No. of staff
% of women
Headquarters
P 895 26 81.3 53.8 1 3.1 100.0 5 7.0 15.6 32 59.4
NPO 44 5 0.0 0.0 0 0.0 0.0 0 0.0 0.0 5 0.0
GS 682 4 100.0 75.0 0 0.0 0.0 0 0.0 0.0 4 75.0
Special programmes and collaborative arrangements
P 130 3 75.0 66.7 1 25.0 100.0 0 0.0 0.0 4 75.0
NPO 0 0 0.0 0.0 0 0.0 0.0 0 0.0 0.0 0 0.0
GS 59 0 0.0 0.0 0 0.0 0.0 0 0.0 0.0 0 0.0
Africa
P 354 5 62.5 0.0 0 0.0 0.0 3 0.0 37.5 8 0.0
NPO 574 21 100.0 47.6 0 0.0 0.0 0 0.0 0.0 21 47.6
GS 1302 36 100.0 44.4 0 0.0 0.0 0 0.0 0.0 36 44.4
The Americas
P 113 11 100.0 54.5 0 0.0 0.0 0 0.0 0.0 11 54.5
NPO 6 2 100.0 50.0 0 0.0 0.0 0 0.0 0.0 2 50.0
GS 51 1 100.0 0.0 0 0.0 0.0 0 0.0 0.0 1 0.0
South-East Asia
P 131 0 0.0 0.0 0 0.0 0.0 0 0.0 0.0 0 0.0
NPO 42 0 0.0 0.0 0 0.0 0.0 0 0.0 0.0 0 0.0
GS 365 4 26.7 50.0 11 73.3 54.5 0 0.0 0.0 15 53.3
Europe
P 192 10 90.9 80.0 0 0.0 0.0 1 0.0 9.1 11 72.7
NPO 86 5 100.0 100.0 0 0.0 0.0 0 0.0 0.0 5 100.0 GS 232 8 88.9 87.5 1 11.1 0.0 0 0.0 0.0 9 77.8
Eastern Mediterranean
P 180 8 80.0 50.0 0 0.0 0.0 2 0.0 20.0 10 40.0
NPO 79 15 93.8 20.0 1 6.3 0.0 0 0.0 0.0 16 18.8 GS 478 15 100.0 40.0 0 0.0 0.0 0 0.0 0.0 15 40.0
Western Pacific
P 160 7 87.5 42.9 0 0.0 0.0 1 0.0 12.5 8 37.5
NPO 65 13 100.0 61.5 0 0.0 0.0 0 0.0 0.0 13 61.5 GS 330 32 97.0 78.1 1 3.0 100.0 0 0.0 0.0 33 78.8
Total
P 2155 70 83.3 52.9 2 2.4 100.0 12 14.3 41.7 84 52.4
NPO 896 61 98.4 49.2 1 1.6 0.0 0 0.0 0.0 62 48.4
GS 3498 100 88.5 58.0 13 11.5 30.8 0 0.0 0.0 113 54.9
All 6549 231 89.2 54.1 16 6.2 37.5 12 4.6 41.7 259 52.5
P – Professional and higher categories, NPO – national professional officer, GS – general service, T – total.

A66/36
42
TABLE 10. STAFF RETIREMENT PROJECTIONSa
Major office Category Total staff at 31 December
2012
Staff due to retire
By 31 December 2013(1 year)
By 31 December 2015(3 years)
By 31 December 2017(5 years)
By 31 December 2022(10 years)
No. % No. % No. % No. %
Headquarters P 895 32 3.6 94 10.5 157 17.5 342 38.2
NPO 44 0 0.0 1 2.3 1 2.3 1 2.3 GS 682 15 2.2 47 6.9 102 15.0 191 28.0
Special programmes and collaborative arrangements
P 130 7 5.4 11 8.5 17 13.1 43 33.1 NPO 0 0 0.0 0 0.0 0 0.0 0 0.0 GS 59 0 0.0 6 10.2 13 22.0 30 50.8
Africa P 354 25 7.1 65 18.4 100 28.2 202 57.1
NPO 574 11 1.9 47 8.2 79 13.8 195 34.0 GS 1302 25 1.9 83 6.4 146 11.2 359 27.6
The Americas P 113 4 3.5 16 14.2 24 21.2 49 43.4
NPO 6 0 0.0 1 16.7 4 66.7 4 66.7 GS 51 1 2.0 6 11.8 13 25.5 26 51.0
South-East Asia P 131 11 8.4 25 19.1 41 31.3 71 54.2
NPO 42 3 7.1 7 16.7 12 28.6 26 61.9 GS 365 10 2.7 38 10.4 62 17.0 104 28.5
Europe P 192 2 1.0 7 3.6 15 7.8 43 22.4
NPO 86 3 3.5 4 4.7 8 9.3 18 20.9 GS 232 7 3.0 16 6.9 28 12.1 49 21.1
Eastern Mediterranean P 180 4 2.2 23 12.8 45 25.0 88 48.9
NPO 79 1 1.3 4 5.1 10 12.7 20 25.3 GS 478 4 0.8 17 3.6 38 7.9 101 21.1
Western Pacific P 160 7 4.4 18 11.3 30 18.8 62 38.8
NPO 65 1 1.5 2 3.1 6 9.2 13 20.0 GS 330 5 1.5 21 6.4 32 9.7 77 23.3
Total
P 2155 92 4.3 259 12.0 429 19.9 900 41.8 NPO 896 19 2.1 66 7.4 120 13.4 277 30.9 GS 3498 67 1.9 234 6.7 434 12.4 937 26.8 All 6549 178 2.7 559 8.5 983 15.0 2114 32.3
a Figures are cumulative. For example, the total number of staff due to retire by 31 December 2015 (259) includes those due to retire by 31 December 2013 (92). P – Professional and higher categories, NPO – National Professional Officer, GS – general service.

43
A66/36
TABLE 11. TOTAL STAFF IN THE PROFESSIONAL AND HIGHER CATEGORIES, BY MAJOR OFFICE
AND REGION OF NATIONALITY
By major office
Major office
Region of nationality
Africa The Americas South-East Asia Europe Eastern Mediterranean Western Pacific Total
No. % No. % No. % No. % No. % No. % No. %
Headquarters 103 10.0 211 20.6 72 7.0 461 45.0 47 4.6 131 12.8 1 025 100.0 Africa 312 88.1 16 4.5 7 2.0 15 4.2 3 0.8 1 0.3 354 100.0 The Americas 2 1.8 88 77.9 0.0 21 18.6 0 0.0 2 1.8 113 100.0 South-East Asia 1 0.8 14 10.7 73 55.7 25 19.1 5 3.8 13 9.9 131 100.0 Europe 1 0.5 22 11.5 3 1.6 160 83.3 1 0.5 5 2.6 192 100.0 Eastern Mediterranean 9 5.0 19 10.6 5 2.8 39 21.7 105 58.3 3 1.7 180 100.0 Western Pacific 8 5.0 31 19.4 13 8.1 41 25.6 2 1.3 65 40.6 160 100.0
Total 436 20.2 401 18.6 173 8.0 762 35.4 163 7.6 220 10.2 2 155 100.0
By region of nationality
Major office
Region of nationality
Africa The Americas South-East Asia Europe Eastern Mediterranean Western Pacific Total
No. % No. % No. % No. % No. % No. % No. %
Headquarters 103 23.6 211 52.6 72 41.6 461 60.5 47 28.8 131 59.5 1 025 47.6 Africa 312 71.6 16 4.0 7 4.0 15 2.0 3 1.8 1 0.5 354 16.4 The Americas 2 0.5 88 21.9 0 0.0 21 2.8 0 0.0 2 0.9 113 5.2 South-East Asia 1 0.2 14 3.5 73 42.2 25 3.3 5 3.1 13 5.9 131 6.1 Europe 1 0.2 22 5.5 3 1.7 160 21.0 1 0.6 5 2.3 192 8.9 Eastern Mediterranean 9 2.1 19 4.7 5 2.9 39 5.1 105 64.4 3 1.4 180 8.4 Western Pacific 8 1.8 31 7.7 13 7.5 41 5.4 2 1.2 65 29.5 160 7.4
Total 436 100.0 401 100.0 173 100.0 762 100.0 163 100.0 220 100.0 2 155 100.0

A66/36
44
TABLE 12. STAFF MOBILITY REASSIGNMENTS: CHANGE IN DUTY STATION
Major office leaving
Major office joining
Headquarters Africa The Americas South-East Asia Europe Eastern
Mediterranean Western Pacific Total
No. % No. % No. % No. % No. % No. % No. % No. %
Headquarters 10 35.7 2 7.1 0 0.0 2 7.1 3 10.7 3 10.7 8 28.6 28 100.0 Africa 1 2.0 49 96.1 0 0.0 0 0.0 0 0.0 1 2.0 0 0.0 51 100.0 The Americas 0 0.0 0 0.0 12 100.0 0 0.0 0 0.0 0 0.0 0 0.0 12 100.0 South-East Asia 1 6.3 0 0.0 0 0.0 12 75.0 2 12.5 0 0.0 1 6.3 16 100.0 Europe 2 5.3 0 0.0 0 0.0 2 5.3 33 86.8 0 0.0 1 2.6 38 100.0 Eastern Mediterranean 1 7.1 1 7.1 0 0.0 0 0.0 0 0.0 12 85.7 0 0.0 14 100.0 Western Pacific 5 20.0 1 4.0 0 0.0 3 12.0 0 0.0 2 8.0 14 56.0 25 100.0
Total 20 10.9 53 28.8 12 6.5 19 10.3 38 20.7 18 9.8 24 13.0 184 100.0

45
A66/36
TABLE 13. DISTRIBUTION OF OCCUPIED POSTS IN THE PROFESSIONAL AND HIGHER CATEGORIES ACROSS MAIN OCCUPATIONAL GROUPSa
1 Professional, managerial and technical work % % 1.A. Administrative specialists 34.5 1.A. Administrative specialists 1.B. Architects, engineers 0.5 1.A. Administrative (general) 3.1 1.C. Archivists, curators, information specialists and librarians 0.7 1.A.01. Financial management specialists 10.8 1.D. Artists 0.1 1.A.02. Management and programme analysts 11.5 1.E. Economists 0.1 1.A.03. Building services administrators 2.7 1.F. Education specialists 0.6 1.A.04. Meetings services administrators 1.1 1.G. Jurists 1.4 1.A.05. Computer information systems specialists 13.8 1.H. Life scientists 3.5 1.A.06. Human resources management specialists 7.2 1.A.07. Printing services specialists 0.3 1.A.08. Public information specialists 11.2 1.A.09. Purchasing and contracting specialists 2.2 1.A.10. Representation and protocol specialists 5.7 1.A.11. Technical cooperation administrators 17.1 1.A.12. Administrative officers 11.3 1.A.21. Auditors 1.4 1.A.23. Records and documents administrators 0.5 1.I. Dental, nutrition, medical, nursing and veterinary specialists 47.8 1.I. Dental, nutrition, medical, nursing and
veterinary specialists
1.J. Physical scientists 0.3 1.I. Medical specialists (general) 1.0 1.K. Sales and marketing specialists 0.2 1.I.01. Dentists 0.2 1.L. Social scientists 1.6 1.I.02. Dieticians and nutritionists 2.6 % 1.M. Statisticians and mathematicians 1.4 1.I.03. Medical specialists 90.7 1.I.03. Medical specialists (selected) 1.N. Transportation specialists 0.1 1.I.04. Nursing specialists 0.6 1.I.03 Medical specialists 5.8 1.O. Writers, translators, interpreters 3.1 1.I.05. Opticians and optometrists 0.2 1.I.03.a Anaesthesiologists 0.1 1.P. Professional, managerial and technical specialists for which no job family exists 1.2 1.I.06. Pharmacists 2.0 1.I.03.b Epidemiologists 14.4 1.Q. Postal services specialists 0.4 1.I.07. Sanitarians (public health) 0.2 1.I.03.c Dermatologists 0.0 1.R. Environmental specialists 0.9 1.I.08. Veterinarians 0.6 1.I.03.d General practitioners 0.4 1.S. Relief specialists 1.7 1.I.09. Rehabilitation specialists 0.5 1.I.03.e Haematologists and blood transfusion specialists 0.6 1.T. Electronic communications specialists 0.1 1.I.10 Health laboratory specialists 1.4 1.I.03.f Neurologists 0.1 1.U. Cultural development specialists 0.1 1.I.03.g Family health specialists 6.5 1.I.03.h Ophthalmologists 0.4 1.I.03.i Immunologists 2.0 1.I.03.j Pathologists 0.0 1.I.03.k Non-communicable disease specialists 2.3 1.I.03.l Geriatricians 0.1 1.I.03.m Mental health specialists 1.4 1.I.03.n Public health specialists 49.8 1.I.03.o Radiologists 0.1 1.I.03.p Surgeons 0.1 1.I.03.q Traditional medicine specialists 0.4 1.I.03.r Emergency care specialists 0.1 1.I.03.s Communicable disease specialists 14.8 1.I.03.t Occupational health specialists 0.6
a Occupied posts only; refers to the requirements of the job, not the skills of the incumbent. Coding is according to the Common Classification of Occupational Groups (CCOG), a UN system wide occupational directory.

A66/36
46
TABLE 14. NUMBER OF NON-STAFF CONTRACTS, BY MAJOR OFFICE
Major office Agreements for
Performance of Work Consultants Special Services
Agreements
Headquarters 2 435 741 0
Africa 1 198 177 327
South-East Asia 410 16 1 653
Europe 1 130 20 144
Eastern Mediterranean 2 884 55 1 200
Western Pacific 810 181 139
Total 8 867 1 190 3 463

47
A66/36
TABLE 15. NUMBER OF JUNIOR PROFESSIONAL OFFICERS BY REGION AND BY DONOR COUNTRIES
Major office
Donor countries
Headquarters Africa The Americas South-East Asia
Europe Eastern Mediterranean
Western Pacific
Total
Belgium 1 1 0 1 0 0 0 3
Denmark 0 1 0 0 0 0 0 1
Finland 1 1 0 0 0 0 0 2
France 3 0 0 0 0 0 0 3
Germany 9 0 0 0 2 1 0 12
Italy 1 0 0 0 0 0 1 2
Japan 2 1 0 0 0 0 1 4
Luxembourg 1 0 0 0 0 0 0 1
Netherlands 2 0 0 0 0 1 0 3
Norway 1 0 0 0 0 0 0 1
Spain 1 0 0 0 0 0 1 2
Sweden 1 0 0 0 0 0 0 1
Total 23 4 0 1 2 2 3 35

A66/36
48
TABLE 16. APPLICATIONS FOR POSTS AT WHO: BREAKDOWN BY SEX OF APPLICANTS AND BY MAJOR OFFICE
2010 2011 2012
Major office* Male Female Total %
women Male Female Total
% women
Male Female Total %
women
Headquarters 20 187 15 310 35 497 45.8 24 658 21 849 46 507 45.8 24 658 20 823 45 481 45.8
Africa 28 259 11 284 39 543 28.5 18 166 7 613 25 779 29.5 22 802 8 303 31 105 26.7
AMRO/PAHO 14 163 16 616 30 779 54.0 11 544 14 238 25 782 55.2 10 725 13 710 24 435 56.1
Eastern Mediterranean 15 825 5 927 21 752 27.2 13 419 5 185 18 604 27.9 13 780 5 511 19 291 28.6
Europe 14 835 17 319 32 154 53.9 11 227 13 569 24 796 54.7 11 156 13 391 24 547 54.6
South-East Asia 23 953 8 169 32 122 25.4 18 498 5 929 24 427 24.3 23 807 7 491 31 298 23.9
Western Pacific 6 190 8 858 15 048 58.9 5 197 7 673 12 870 59.6 6 660 10 451 17 111 61.1
Total 123 412 83 483 206 895 40.4 102 709 76 056 178 765 42.5 113 588 79 680 193 268 41.2
* Positions advertised in that major office.
= =
=