Embed Size (px)
Citation preview
ORIGINAL RESEARCHpublished: 29 June 2018
doi: 10.3389/fncel.2018.00181
Frontiers in Cellular Neuroscience | www.frontiersin.org 1 June 2018 | Volume 12 | Article 181
Edited by:
Dirk Feldmeyer,
Forschungszentrum Jülich, Germany
Reviewed by:
Hermann Cuntz,
Ernst Strüngmann Institut für
Neurowissenschaften, Germany
Zoltan F. Kisvarday,
University of Debrecen, Hungary
Guanxiao Qi,
Forschungszentrum Jülich, Germany
*Correspondence:
Idan Segev
Received: 20 February 2018
Accepted: 08 June 2018
Published: 29 June 2018
Citation:
Eyal G, Verhoog MB, Testa-Silva G,
Deitcher Y, Benavides-Piccione R,
DeFelipe J, de Kock CPJ,
Mansvelder HD and Segev I (2018)
Human Cortical Pyramidal Neurons:
From Spines to Spikes via Models.
Front. Cell. Neurosci. 12:181.
doi: 10.3389/fncel.2018.00181
Human Cortical Pyramidal Neurons:From Spines to Spikes via ModelsGuy Eyal 1, Matthijs B. Verhoog 2,3, Guilherme Testa-Silva 2, Yair Deitcher 4,
Ruth Benavides-Piccione 5, Javier DeFelipe 5, Christiaan P. J. de Kock 2,
Huibert D. Mansvelder 2 and Idan Segev 1,4*
1Department of Neurobiology, Hebrew University of Jerusalem, Jerusalem, Israel, 2Department of Integrative
Neurophysiology, Centre for Neurogenomics and Cognitive Research, Amsterdam Neuroscience, VU University Amsterdam,
Amsterdam, Netherlands, 3Department of Human Biology, Neuroscience Institute, University of Cape Town, Cape Town,
South Africa, 4 Edmond and Lily Safra Center for Brain Sciences, Hebrew University of Jerusalem, Jerusalem, Israel,5Departamento de Neurobiología Funcional y de Sistemas, Instituto Cajal (CSIC), and Laboratorio Cajal de Circuitos
Corticales (CTB), Universidad Politécnica de Madrid, Madrid, Spain
We present detailed models of pyramidal cells from human neocortex, including models
on their excitatory synapses, dendritic spines, dendritic NMDA- and somatic/axonal Na+
spikes that provided new insights into signal processing and computational capabilities
of these principal cells. Six human layer 2 and layer 3 pyramidal cells (HL2/L3 PCs)
were modeled, integrating detailed anatomical and physiological data from both fresh
and postmortem tissues from human temporal cortex. The models predicted particularly
large AMPA- and NMDA-conductances per synaptic contact (0.88 and 1.31 nS,
respectively) and a steep dependence of the NMDA-conductance on voltage. These
estimates were based on intracellular recordings from synaptically-connected HL2/L3
pairs, combined with extra-cellular current injections and use of synaptic blockers,
and the assumption of five contacts per synaptic connection. A large dataset of
high-resolution reconstructed HL2/L3 dendritic spines provided estimates for the EPSPs
at the spine head (12.7 ± 4.6mV), spine base (9.7 ± 5.0mV), and soma (0.3 ±
0.1mV), and for the spine neck resistance (50–80 M�). Matching the shape and
firing pattern of experimental somatic Na+-spikes provided estimates for the density
of the somatic/axonal excitable membrane ion channels, predicting that 134 ± 28
simultaneously activated HL2/L3-HL2/L3 synapses are required for generating (with 50%
probability) a somatic Na+ spike. Dendritic NMDA spikes were triggered in the model
when 20 ± 10 excitatory spinous synapses were simultaneously activated on individual
dendritic branches. The particularly large number of basal dendrites in HL2/L3 PCs and
the distinctive cable elongation of their terminals imply that ∼25 NMDA-spikes could
be generated independently and simultaneously in these cells, as compared to ∼14
in L2/3 PCs from the rat somatosensory cortex. These multi-sites non-linear signals,
together with the large (∼30,000) excitatory synapses/cell, equip human L2/L3 PCs
with enhanced computational capabilities. Our study provides the most comprehensive
model of any human neuron to-date demonstrating the biophysical and computational
distinctiveness of human cortical neurons.
Keywords: human pyramidal cells, compartmental modeling, non-linear dendrites, cortical excitatory synapses,
neuron computation, multi objective optimization, dendritic spines
Eyal et al. Comprehensive Models of Human Cortical Neurons
INTRODUCTION
Understanding the human brain is of high priority forhumankind, as is manifested by the thousands of studiespublished every year on the various aspects of the humanbrain and by the large-scale projects initiated in the last decadeworldwide (Markram et al., 2015; Amunts et al., 2016; Koch andJones, 2016; Martin and Chun, 2016; Poo et al., 2016). This isa challenging task; not only because of the complexity of thebrain and the technical difficulties involved, but also becauseethical limitations do not allow all of the necessary datasets tobe acquired directly from human brains. Consequently, mostof our present knowledge of the fine structure of the brainhas been obtained from experimental animals (DeFelipe, 2015).However, certain fundamental structural and behavioral aspectsare unique to humans and the functional significance of thehuman-specific structure should be dealt with by employing arange of specific strategies. Indeed, a major goal is to improvethe current technologies for the microanatomical, neurochemicaland physiological analysis of the human brain by adaptingmethodologies that are typically used to examine the brain ofexperimental animals.
The use of biopsy material obtained during neurosurgicaltreatment for epilepsy, or following the removal of certain braintumors, provide an excellent opportunity to study the micro-structure of the human brain, despite the fact that differentmedical characteristics of the patients may modify the braintissue. The resected tissue can be immediately immersed inthe fixative and therefore the ultrastructure and quality ofthe labeling achieved using a variety of markers for histologyand immunocytochemistry is comparable to that obtained inexperimental animals (del Río and DeFelipe, 1994; Alonso-Nanclares et al., 2008). Similarly, this resected human braintissue proved to be of great value in the 1980s and 1990s todirectly study the functional characteristics of human braintissue in vitro. These studies have mostly aimed to analyze themechanisms underlying seizures and epileptogenesis (reviewedin Avoli et al., 2005; Köhling and Avoli, 2006). Recently, therehas been renewed interest in using “non-epileptic” corticalsamples (removed during surgery on brain tumors) or “non-spiking” regions with normal histology (removed at a distancefrom the epileptic focus) in epileptic patients, as they providean unprecedented opportunity to study human cells and localcircuits, both biophysically and computationally (Szabadics et al.,2006; Verhoog et al., 2013; Testa-Silva et al., 2014; Tian et al.,2014; Mohan et al., 2015; Varga et al., 2015; Eyal et al., 2016;Molnár et al., 2016).
The other main source of tissue to study the structureof human brain is from autopsy of control individuals. Inprinciple, this is the only source of tissue that is free ofknown pathology, but it is not suitable for electrophysiologicalstudies. Another major limitation in using autopsied tissue isthe post-mortem time; the longer the post-mortem time delaythe larger are the alterations observed in the measurementsat all levels of biological organization (genetic, molecular,biochemical, anatomical). In previous studies we have shownthat post-mortem times shorter than 5 h yield excellent results
using fine anatomical tools like intracellular injections in fixedmaterial or electron microscopy techniques (Elston et al., 2001;Benavides-Piccione et al., 2005; Blazquez-Llorca et al., 2013).Thus, anatomical and physiological studies of the human brainshould ideally be performed by combining data from biopsies andautopsies.
Our own recent studies on human cortical neurons haveshown that they are distinguished from rodent neurons in somefundamental properties. Human L2/L3 PCs are anatomicallymore extended and have elaborated dendritic trees (Mohanet al., 2015; Deitcher et al., 2017); have unique membraneproperties (Eyal et al., 2016) and have a large number of dendriticspines/synapses per cell (Elston et al., 2001; Benavides-Piccioneet al., 2002; DeFelipe et al., 2002). These neurons are capableof tracking, via their axonal spikes, very fast modulations oftheir dendritic inputs and their synapses recover rapidly fromdepression (Eyal et al., 2014; Testa-Silva et al., 2014). Still,many other biophysical properties of human pyramidal neuronsremain unknown, including the magnitude, time-course andconductance composition of their synaptic inputs, and the natureof their dendritic and somatic non-linearities. These propertiesare key for constructing realistic models of these cells and,based on these models, for understanding signal processing andcomputational capabilities of human neurons.
To extract synaptic, dendritic and computational propertiesof individual neurons based on diverse morphological andbiophysical experiments, an overarching theoretical frameworkis required. Rall’s cable theory for dendrites (Rall, 1959) and hiscompartmental modeling approach (Rall, 1964; Segev et al., 1995)provided such theoretical framework. Indeed, in the last fewdecades, detailed compartmental models have been constructedfor a variety of neuron types for different species and brainregions—from flies to birds, to rodents and cats; and fromhippocampus to cerebellum, basal ganglia and the neocortex.These experimentally-based models provided key insights intothe mechanisms governing the large dynamic repertoire ofneurons and their computational and plastic capabilities (reviewsin Koch and Segev, 2000; Herz et al., 2006; Major et al., 2013;Stuart et al., 2016). But to what extent do these neuron modelsin non-human mammals (e.g., rodents) provide insights into thebiophysics and computational capabilities of human neurons?In our recent work (Eyal et al., 2016) we constructed passivecompartmental models of HL2/L3 PCs to study their membraneproperties. To our surprise, we found that the specific membranecapacitance (Cm) of human neurons is distinctive; ∼0.5 µF/cm2,half of the commonly accepted “universal” value (∼1 µF/cm2)for biological membranes. The low Cm has important functionalimplications for signal processing in these cells. This initialsurprise has led us to perform hereby a more comprehensivemodeling study of HL2/L3 PCs.
In the present work, we integrated a wide range of anatomicaland physiological data on six HL2/L3 PCs, including thefine anatomy of dendritic spines, which provided the mostcomprehensive models of human cortical pyramidal neuronsto date. We extended our existing passive models of HL2/L3PCs in order to estimate their synaptic properties, in particularthe NMDAR-kinetics, and to estimate the properties of the ion
Frontiers in Cellular Neuroscience | www.frontiersin.org 2 June 2018 | Volume 12 | Article 181
Eyal et al. Comprehensive Models of Human Cortical Neurons
channels underlying the somatic/axonal spiking mechanisms.Based on these parameters, we predicted the conditions for thegeneration of NMDA spikes in individual dendritic branchesreceiving excitatory axo-spinous synapses, as well as the numberof excitatory synapses required to initiate axo-somatic (output)Na+ spikes. Our models show that human L2/L3 PCs havethe capacity to generate tens of independent dendritic NMDAspikes (supporting local non-linear dendritic computations).We further show that, despite the extended dendritic cablestructure of human L2/L3 PCs, a relatively small number (∼135)of synchronously activated excitatory axo-spinous synapses isrequired to generate an axonal output spike. We concluded thathuman L2/L3 pyramidal cells expand the computational/memorycapacity of similar cells, e.g., in rodents, because of theirincreased numbers of local dendritic non-linear subunits,increased excitability due to low Cm value and their large number(∼30,000) of dendritic spines/excitatory synapses.
MATERIALS AND METHODS
Experimental DataHuman Brain Slice PreparationAll procedures on human tissue were performed with theapproval of the Medical Ethical Committee (METc) of theVU University Medical Centre (VUmc), with written informedconsent by patients involved to use brain tissue removedfor treatment of their disease for scientific research, and inaccordance with Dutch license procedures and the declarationof Helsinki (VUmc METc approval ‘kenmerk 2012/362’). Afterresection, the neocortical tissue was placed within 30 s in ice-cold artificial cerebrospinal fluid (aCSF) slicing solution whichcontained in (mM): 110 choline chloride, 26 NaHCO3, 10 D-glucose, 11.6 sodium ascorbate, 7 MgCl2, 3.1 sodium pyruvate,2.5 KCl, 1.25 NaH2PO4, and 0.5 CaCl2 −300 mOsm, saturatedwith carbogen gas (95% O2/ 5% CO2) and transported to theneurophysiology laboratory located 500m from the operatingroom. The transition time between resection of the tissue and thestart of preparing slices was <15min. Neocortical slices (350–400µm thickness) were prepared in ice-cold slicing solution,and were then transferred to holding chambers filled with aCSFcontaining (in mM): 126 NaCl; 3 KCl; 1 NaH2PO4; 1 MgSO4;2 CaCl2; 26 NaHCO3; 10 glucose −300 mOsm, bubbled withcarbogen gas (95% O2/ 5% CO2). Here, slices were stored for20min at 34◦C, and for at least 30min at room temperaturebefore recording.
3D Reconstructions of Dendritic Arbors and Dendritic
Spines of HL2/L3 Pyramidal CellsSix dendritic morphologies of L2/L3 from human temporalcortex, residing at the depths of 675–1,204µmbelow the pia wereused in this study. These are the same morphologies used in Eyalet al. (2016), taken fromMohan et al. (2015). These neurons wererecorded and then labeled using biocytin as a marker that wasrevealed with DAB using the chromogen 3,3-diaminobenzidinetetrahydrochloride and the avidin–biotin–peroxidase method.
For data on dendritic spines we used L3 pyramidal cellsthat were reconstructed with a confocal microscope after
intracellular injection with Lucifer Yellow in the temporalcortex, corresponding to Brodmann’s area 20 (Garey, 2006).These neurons were obtained from two human males (aged40 and 85) obtained at autopsy (2–3 h post-mortem) followingtraffic accidents. This human material has been used in aprevious study (Benavides-Piccione et al., 2013).We used data ondendritic spines from the post-mortem tissue instead of directlymeasuring dendritic spines from the recorded cells becauseconfocal microscopy of Lucifer Yellow-labeled neurons is moreappropriate to analyze the shape and the size of dendritic spinesthan light microscopy of biocytin-labeled neurons. The completemorphology of over 8,300 dendritic spines was reconstructedin 3D as in Benavides-Piccione et al. (2013). Briefly, spinesand dendritic branches were imaged using a Leica TCS 4Dconfocal scanning laser attached to a Leitz DMIRB fluorescencemicroscope. Consecutive stacks of images were acquired usinga 0.075 × 0.075 × 0.28 µm3 voxel size (Leica Objective Plan-Apochromat 63x/1.30 NA glycerol DIC M27) to capture the fulldendritic depths, lengths, and widths of the dendrites (Figure 2).Dendritic spine structure was analyzed in 20 basal dendritesand 16 main apical dendrites (10 basal dendrites and 8 mainapical dendrites per case), using Imaris 6.4.0 (Bitplane AG,Zurich, Switzerland). Correction factors used in other studiesin which dendritic spines were quantified in opaque material(e.g., Golgi method or biocytin/DAB material) were not used inthe present study as the fluorescent labeling and the high-powerreconstruction allowed the visualization of dendritic spines thatprotrude from the underside of dendrites. Since confocal stacksof images intrinsically result in a z-dimension distension, acorrection factor of 0.84 was applied to that dimension. Thisfactor was calculated using a 4.2µm Tetraspeck Fluorescentmicrosphere (Molecular Probes) under the same parameters usedfor the acquisition of dendritic stacks. No optical deconvolutionwas used for spine reconstruction. Finally, dendritic spines witha head diameter below the resolution limit were not consideredin the present study. However, for the purposes of modeling,this factor is probably insignificant since, in a previous electronmicroscopic study, it was found that “thin” dendritic spines (i.e.,those that lacked clear heads, resembling the filopodia found atearlier developmental stages) are non-synaptic (Arellano et al.,2007).
For modeling of typical dendritic spines, which establish atleast one synaptic contact, we measured the spine neck length,spine neck diameter and spine head area of a selection of 150dendritic spines (Figure S3). Only spines showing a clear headwhose morphology could be captured using a single surfaceof a particular intensity threshold were included in the study.The spine neck length and spine neck diameter were manuallymarked in each selected dendritic spine from the point ofinsertion in the dendritic shaft to the spine head, while rotatingthe image in 3D (Figure 2).
Electrophysiology (Acute Living Slices)Whole-cell, patch clamp electrophysiology recordings were madefrom human L2/L3 pyramidal neurons as described previously(Verhoog et al., 2013; Testa-Silva et al., 2014). Whole-cellrecordings were made using uncoated, standard borosilicate
Frontiers in Cellular Neuroscience | www.frontiersin.org 3 June 2018 | Volume 12 | Article 181
Eyal et al. Comprehensive Models of Human Cortical Neurons
glass pipettes. Recordings were made using multiclamp 700Bamplifiers (molecular devices) and were digitized using AxonInstruments Digidata 1440A. Recording aCSF matched thesolution of the aCSF in which slices were stored. The recordingtemperature was 32–35◦C. Internal solutions were (in mM): 110Kgluconate; 10 KCl; 10 HEPES; 10 K2Phosphocreatine; 4 ATP-Mg; 0.4 GTP, biocytin 5 mg/ml, pH adjusted with KOH to 7.3(290–300 mOsm).
EPSPs From Paired RecordingsEPSPs were measured from 10 connected pairs of L2/L3 humanpyramidal neurons (Testa-Silva et al., 2014, Figure S1). Theseexperimental EPSPs came from a different set of neurons thanthose used in Eyal et al. (2016). We therefore used experimentalEPSPs measured in HL2/L3 PCs that exhibit cable properties(input resistance, membrane time constant) similar to ourneuron models. The membrane time constant for the postsynaptic cell from which the EPSP was recorded was determinedby “peeling” the tail of the EPSP (Rall, 1969). The 10 connectedpairs used in this work come from cells with time constants inthe range of 12–22ms. Protocols for experiments are available inTesta-Silva et al. (2014).
Extracellular Stimulation and NMDA DataEPSPs were evoked every 7 s by extracellular stimulation usingtwo bipolar stimulating electrodes in glass pipettes loaded withextracellular/recording aCSF that were positioned extracellularly,100–150µm away from the soma and ∼50µm lateral to thecell’s apical dendrite. Duration (50 µs) and amplitude (∼40 µA,range 30–70 µA) of extracellular stimulation were controlledby Isoflex stimulators (A.M.P.I.). For each cell, two extracellularstimuli were applied at two different loci with respect to thecell body of the post-synaptic cell (6 experimental EPSPs).Seventeen EPSPs were evoked and averaged before the use ofblockers. Then, NMDA-receptor mediated EPSPs were isolatedby blocking AMPA and kainate receptors with NBQX (1µM,bath-applied, dissolved in recording aCSF) and blocking GABAA
with Bicuculline or gabazine (10µM, bath-applied, disssolved inrecording aCSF). For one of these cells (Figure 4B) we alreadyhad a passive model from Eyal et al. (2016). The model wasbased on brief current injections into the cell as well as its 3Dmorphology (Eyal et al., 2016, Figure 1c5). We used this modelwhen fitting the NMDA-receptor kinetics (Figure 4C, see belowfor more details).
Train of Somatic Action PotentialsA step of depolarizing current of 1 s long was injected to thesomata of the six HL2/L3 pyramidal cells that are the focus of thispaper. Current amplitudes were adjusted so that each cell fired atabout∼10Hz (examples are shown in Figure 7A). This stimuluswas repeated 10 times or more per cell, providing sufficientstatistics to use the multiple objective optimization (MOO) todevelop channel-based models for these spikes (see below). Alltraces were sampled at 100–250 kHz and low-passed filtered at14–15 kHz.
I-F Curves of HL2/L3 PCsWe computed the I-F curve for 25 additional HL2/L3 PCs (I-F curves for the six modeled cells were not available) as partof our modeling efforts to match experimental results to modelperformance using the MOO algorithm (see below). These I-F curves were computed from the spike trains following 1 secdepolarizing step current of different supra-threshold amplitudes(Deitcher et al., 2017). Nearby points in the I-F curve wereconnected by linear lines; individual I-F curves were thennormalized by the input current that lead to 10Hz firing rate.This normalization method allowed us to constrain each of ourmodels to have I-F curve similar to the mean I-F curve of HL2/L3PCs (see also Hay et al., 2011). The 25 normalized I-F curvesand their mean are shown in Figure 7B (gray and black traces,respectively).
ModelingSimulationsSimulations were performed using NEURON 7.4 (Carnevale andHines, 2006) running on a grid of 60 Sun 4100 AMD 64-bitOpteron dual core (240 cores in total), running Linux 2.6, or ongrid of 40 Intel(R) Xeon(R) CPU E5-2670 with 16 cores per node(640 cores in total), running Redhat 6.6.
Passive Neuron ModelsIn Eyal et al. (2016), we constructed detailed passivecompartmental models for six 3D reconstructed L2/L3 pyramidalneurons from human temporal cortex. The three passiveparameters (Cm, Ra, Rm) in these models were optimized foreach modeled cell such that the theoretical transients followingbrief/small current steps generated by the model closely fit thecorresponding experimental transient. Details could be foundin Eyal et al. (2016). One key result from this study was that inhuman neurons, Cm is half (0.5 µF/cm2) than the “universal”value of 1 µF/cm2. In the present work, we use these six modelsas the passive skeleton onto which experimentally-constrainedsynaptic and membrane non-linearities were added.
Membrane area of the dendritic spines, which are abundantin human pyramidal cells, was incorporated globally into the 3Dreconstructed dendritic models using the factor Fspines,
Fspines =dendritic membrane area+ total spine area
dendritic membrane area(1)
The incorporation of dendritic spines into a particular dendriticbranch was implemented by multiplying Cm by Fspines anddividing Rm by Fspines as described previously (Rapp et al., 1992).Spine and shaft areas were computed using reconstructions of3D images from confocal microscopy of samples from two postmortem brains (Benavides-Piccione et al., 2013, see Figure 2
below). This resulted in an Fspines value of 1.9. Spine membranearea was incorporated into the modeled neuron only in dendriticsegments that are at a distance of at least 60µm from the soma,due to the low density of spines in more proximal branches(Benavides-Piccione et al., 2013). More details can be found inEyal et al. (2016).
Frontiers in Cellular Neuroscience | www.frontiersin.org 4 June 2018 | Volume 12 | Article 181
Eyal et al. Comprehensive Models of Human Cortical Neurons
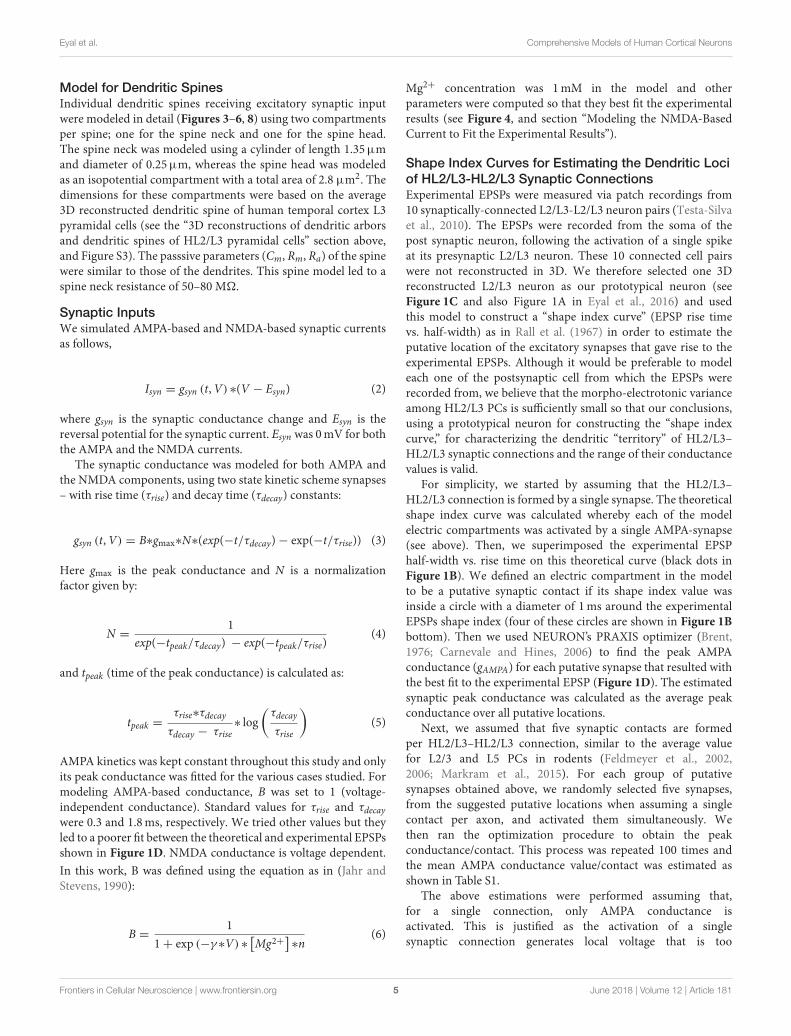
Model for Dendritic SpinesIndividual dendritic spines receiving excitatory synaptic inputwere modeled in detail (Figures 3–6, 8) using two compartmentsper spine; one for the spine neck and one for the spine head.The spine neck was modeled using a cylinder of length 1.35µmand diameter of 0.25µm, whereas the spine head was modeledas an isopotential compartment with a total area of 2.8 µm2. Thedimensions for these compartments were based on the average3D reconstructed dendritic spine of human temporal cortex L3pyramidal cells (see the “3D reconstructions of dendritic arborsand dendritic spines of HL2/L3 pyramidal cells” section above,and Figure S3). The passsive parameters (Cm, Rm, Ra) of the spinewere similar to those of the dendrites. This spine model led to aspine neck resistance of 50–80 M�.
Synaptic InputsWe simulated AMPA-based and NMDA-based synaptic currentsas follows,
Isyn = gsyn (t,V) ∗(V − Esyn) (2)
where gsyn is the synaptic conductance change and Esyn is thereversal potential for the synaptic current. Esyn was 0mV for boththe AMPA and the NMDA currents.
The synaptic conductance was modeled for both AMPA andthe NMDA components, using two state kinetic scheme synapses– with rise time (τrise) and decay time (τdecay) constants:
gsyn (t,V) = B∗gmax∗N∗(exp(−t/τdecay)− exp(−t/τrise)) (3)
Here gmax is the peak conductance and N is a normalizationfactor given by:
N =1
exp(−tpeak/τdecay) − exp(−tpeak/τrise)(4)
and tpeak (time of the peak conductance) is calculated as:
tpeak =τrise∗τdecay
τdecay − τrise∗ log
(
τdecay
τrise
)
(5)
AMPA kinetics was kept constant throughout this study and onlyits peak conductance was fitted for the various cases studied. Formodeling AMPA-based conductance, B was set to 1 (voltage-independent conductance). Standard values for τrise and τdecaywere 0.3 and 1.8ms, respectively. We tried other values but theyled to a poorer fit between the theoretical and experimental EPSPsshown in Figure 1D. NMDA conductance is voltage dependent.
In this work, B was defined using the equation as in (Jahr andStevens, 1990):
B =1
1+ exp (−γ ∗V) ∗[
Mg2+]
∗n(6)
Mg2+ concentration was 1mM in the model and otherparameters were computed so that they best fit the experimentalresults (see Figure 4, and section “Modeling the NMDA-BasedCurrent to Fit the Experimental Results”).
Shape Index Curves for Estimating the Dendritic Loci
of HL2/L3-HL2/L3 Synaptic ConnectionsExperimental EPSPs were measured via patch recordings from10 synaptically-connected L2/L3-L2/L3 neuron pairs (Testa-Silvaet al., 2010). The EPSPs were recorded from the soma of thepost synaptic neuron, following the activation of a single spikeat its presynaptic L2/L3 neuron. These 10 connected cell pairswere not reconstructed in 3D. We therefore selected one 3Dreconstructed L2/L3 neuron as our prototypical neuron (seeFigure 1C and also Figure 1A in Eyal et al., 2016) and usedthis model to construct a “shape index curve” (EPSP rise timevs. half-width) as in Rall et al. (1967) in order to estimate theputative location of the excitatory synapses that gave rise to theexperimental EPSPs. Although it would be preferable to modeleach one of the postsynaptic cell from which the EPSPs wererecorded from, we believe that the morpho-electrotonic varianceamong HL2/L3 PCs is sufficiently small so that our conclusions,using a prototypical neuron for constructing the “shape indexcurve,” for characterizing the dendritic “territory” of HL2/L3–HL2/L3 synaptic connections and the range of their conductancevalues is valid.
For simplicity, we started by assuming that the HL2/L3–HL2/L3 connection is formed by a single synapse. The theoreticalshape index curve was calculated whereby each of the modelelectric compartments was activated by a single AMPA-synapse(see above). Then, we superimposed the experimental EPSPhalf-width vs. rise time on this theoretical curve (black dots inFigure 1B). We defined an electric compartment in the modelto be a putative synaptic contact if its shape index value wasinside a circle with a diameter of 1ms around the experimentalEPSPs shape index (four of these circles are shown in Figure 1B
bottom). Then we used NEURON’s PRAXIS optimizer (Brent,1976; Carnevale and Hines, 2006) to find the peak AMPAconductance (gAMPA) for each putative synapse that resulted withthe best fit to the experimental EPSP (Figure 1D). The estimatedsynaptic peak conductance was calculated as the average peakconductance over all putative locations.
Next, we assumed that five synaptic contacts are formedper HL2/L3–HL2/L3 connection, similar to the average valuefor L2/3 and L5 PCs in rodents (Feldmeyer et al., 2002,2006; Markram et al., 2015). For each group of putativesynapses obtained above, we randomly selected five synapses,from the suggested putative locations when assuming a singlecontact per axon, and activated them simultaneously. Wethen ran the optimization procedure to obtain the peakconductance/contact. This process was repeated 100 times andthe mean AMPA conductance value/contact was estimated asshown in Table S1.
The above estimations were performed assuming that,for a single connection, only AMPA conductance isactivated. This is justified as the activation of a singlesynaptic connection generates local voltage that is too
Frontiers in Cellular Neuroscience | www.frontiersin.org 5 June 2018 | Volume 12 | Article 181
Eyal et al. Comprehensive Models of Human Cortical Neurons
small (8.6 ± 6.5mV) to activate a significant NMDARcurrent (Figure 5). This allowed us at a later point tobuild a model for the NMDA-kinetics and conductanceamplitude that is based on the results from the earlier part(see below, and Figure 4). We validated that the additionof NMDA conductances to the modeled synapses does notchange significantly the results of Figure 1, Table S1, andFigure S4.
Modeling the NMDA-Based Current to Fit the
Experimental ResultsThe process of fitting the NMDA model kinetics to theexperimental results was based on having both themorphology ofthe post-synaptic cell (Figure 4B), the somatic voltage transients(Eyal et al., 2016, Figure 1d5) and the composite EPSPs recordedfrom the soma following extracellular simulation with andwithout AMPA blockers, all from the same cell (Figure 4C). Thisallowed us to use the passive model of this cell from Eyal et al.(2016) and, on top of it, add AMPA- and NMDA- based currentssuch that the model fits the properties of extracellularly generatedsomatic EPSPs in this cell (Figure 4).
The optimization of the synaptic parameters that fit theexperimentally-recorded composite EPSP was achieved asfollows. First, between 15 and 30 synapses were randomlydistributed in a restricted part of the apical tree (near the locationof the extracellular electrode); each of the synapses havingboth NMDA and AMPA conductance. For the optimization,the NMDA peak conductance and its kinetics (τrise and τdecayin Equation 5 and the “steepness” factor γ in Equation 6), aswell as the AMPA peak conductance were free parameters. Theparameter n in Equation (6) remained constant in this work witha value of 0.28 mM-1 as found by Jahr and Stevens (1990) for anextracellular solution with 1mM magnesium concentration. Wealso tried other available models for the NMDA kinetics (Rhodes,2006; Sarid et al., 2007), but those led to a poorer fit of the data.The optimization was achieved by first fitting the model responseto the experimental EPSP in the presence of AMPA blockers.In the experiments, a competitive antagonist was used to blockthe AMPA receptors, therefore in the simulations we allowedthe model to include a small AMPA conductance (see below).This implied that, even in the presence of an AMPA blocker,a strong extracellular stimulus could activate a small APMAcurrent which, in turn, could help activate the NMDA-current,as indeed was found experimentally.
For these simulations, 60,000 seeds were used to select thenumber of synapses and their dendritic location; each one ofthem was optimized using the PRAXIS algorithm in NEURON(Brent, 1976; Carnevale and Hines, 2006). The best 20,000models, based on their fit to the data (see below), were chosenfor the next step. In this stage, we tried to fit the model withthe experimental EPSP recorded without any blockers. In eachmodel, using the result of the first stage of the fit, the synapticlocations and NMDA conductance and kinetics were set, with theonly free parameter at this stage being peak AMPA conductance.The peak AMPA conductance was constrained to be at least fivetimes larger than its peak conductance in the first stage (theblocked case). Models were sorted according to their sum root
mean square distance, RMSD, with respect to the two targetexperimental EPSPs. Different locations of the synapses andother optimization methods were also attempted; eventually theprocedure described above resulted in a set of 100 models thatbest fit the experimental EPSPs (see Figures 4, Figure S3, andTable S2).
We selected one of the best five models resulting from theabove procedure for the rest of this work. Out of best five, wechose the model with the parameters that were the closest to themean of the best 100 models (best typical). The correspondingkinetics of the model for the NMDA conductance were: τrise =
8.02ms, τdecay = 34.99ms, γ = 0.077 1mV . The conductance
values per contact were as follows: gNMDA = 1.31 nS, gAMPA =
0.73 nS and gBlocledAMPA = 0.13 nS. The values of τrise, τdecay andγ were within the range found in rodents (Sarid et al., 2007), andused by many other studies (e.g., Rhodes, 2006). It is importantto note that all the best 30 models had γ values larger than 0.0751
mV (0.078± 0.022 1mV , mean± SD, n= 30) implying a relatively
steep dependency of the NMDA-current on voltage as comparedto rodents (see below).
NMDA SpikesIn Figure 5 we modeled an NMDA spike that originatedfrom axo-spinous synapses distributed randomly along a 20µmstretch of a dendritic segment; the same modeled spine was usedin all cases see “Model for dendritic spines,” above. Synapseswere activated on the spine head membrane and the resultantvoltage was recorded in the spine head, the dendritic shaft andthe soma. In Figure 6 we computed the maximal number ofindependent NMDA spikes (maximal number of independentnon-linear dendritic subunits) that could be generated by themodeled cell. Synapses were located in the distal dendriticterminals and the number of synapses in each terminal was theminimal number required for generating a local NMDA spike,defined as such when the local voltage is larger than −40mVand lasts for at least 20ms. We found that this threshold isa good criterion for distinguishing between a brief and strongAMPA-based EPSPs and a prolonged NMDA+AMPA basedspikes (also known as plateau potentials). These NMDA spikesusually reached maximal local depolarization that is close to thereversal potential of NMDA current (0mV in the present model).NMDA spikes were defined as independent from each other ifthe peak voltage in the branch-point connecting two activatedterminals was below −40mV. The locations and the number ofthe maximal clusters that generated independent NMDA spikeswere chosen both manually (adding clusters of spinous inputs inthe most distal locations in electrotonic terms) as well as withrecursive algorithms. At the end of these procedures we couldassess the maximal number of independent NMDA spike in anygiven neuron model.
Fitting Trains of Somatic Na+ SpikesThe fit of the fully active axon-soma models was achievedusing the multiple objective optimization (MOO) method as inDruckmann et al. (2007) and Hay et al. (2011). For obtaining a fitbetween model and experimental spikes, as shown in Figure 7,at least ten repetitions of identical depolarizing step current
Frontiers in Cellular Neuroscience | www.frontiersin.org 6 June 2018 | Volume 12 | Article 181
Eyal et al. Comprehensive Models of Human Cortical Neurons
injections leading to about 10Hz firing rate were experimentallyrecorded in the cells that were later 3D reconstructed andmodeled in detailed. I-F curves were also recorded for anadditional set of 25 HL2/L3 PCs (see above). The MOOprocedure is based on deconstructing the spike properties to aset of features (see below) and using their experimental meanand standard deviation (from all experimental traces) to findthe peak conductance of a set of predefined modeled excitableion channels that best fit the experimental spike firing. Thefeatures for the MOO algorithm used in this study were: (1)Voltage base—the mean membrane voltage before the stimulus.(2) Steady state voltage—the mean voltage at the end of thestimulus. (3) Mean frequency—mean firing rate. (4) Time tofirst spike—the time in ms between the stimulus onset andthe peak of the first spike. (5) Burst Inter Spike Interval—thelength (in ms) of inter-spike interval (ISI) between the first twospikes. (6) SI coefficient of variance—defined as ISImean/ISISD.(7) Adaptation index—normalized average difference of twoconsecutive ISIs. (8) AP height—average peak voltage of thespikes. (9) AP begin voltage—the voltage at the beginning ofthe spike, defined as the membrane voltage where dV/dt crosses20 mV/ms. (10) After Hyper-Polarization Depth—the minimumvoltage between spikes. (11) After Hyper-Polarization time frompeak—the duration it takes to reach maximal hyperpolarizationfollowing the peak of the spike. (12) Spike half width—the widthof the spike in its half height. (13) The mean firing rate of thenormalized I-F curve of 25 HL2/L3 PCs (see above), for an inputthat is 75% compared with the input current with the meanfrequency in Feature #3 (Figure 7B). For example, 10 repetitionsof 700 pA to the soma of 0603_cell03 (blue morphology inFigure 7, second column in Table S3), resulted in a 10.38 ±
0.31Hz firing rate. The normalized input for the 25 cells thatlead to 10.38Hz is 1.02 (where 1.0 is the input results with10Hz). Seventy-five percent of 1.02 is 0.765. The mean frequencycorresponding to 0.765 normalized input is 3.43Hz ± 2.03,therefore this value is feature #13 for this cell. 14–17. As in feature#13, but for inputs of 125, 150, 200, and 300%, respectively. Thevalues (mean ± SD) for the different features of the six cells isprovided in Table S3. Features were extracted using the eFELlibrary in python. Equations for the various features could befound in https://github.com/BlueBrain/efel.
A short axon of 60µmwas added to the modeled cells, similarto Hay et al. (2013) and Markram et al. (2015). The parameter setfor the optimization consisted of 29 free parameters: the maximalconductance of nine ion channels, three kinetics parametersfor the sodium, two parameters for the intracellular Ca2+
concentration, all were fitted both for the soma (14 parameters)and for the axon (14 parameters). The last parameter was thereversal potential of the leak current (same value for all thecompartments in the model). The full list of parameters and theirvalues for the sixmodels is provided in Table S4. Since we still lackdendritic recordings from human cells, it might not be possible toconstrain dendritic parameters based only on somatic recordings(Shen et al., 1999) and therefore we decided to include activeparameters only in the soma and in the axon.
Optimization of the spiking activity for HL2/L3 PCs wasachieved using MOO combined with an evolutionary algorithm
under the Optimization-Framework of the Blue Brain Project(Markram et al., 2015). The optimization algorithm is explainedin details in Druckmann et al. (2007) and Hay et al. (2011).Briefly the evolutionary process starts with 1,000 randommodels(random set of parameters). In each generation, only the modelsthat are the most successful are selected to pass over to thenext generation (see below). In each generation, new modelsare generated using mutations from the successful modelsof the previous generation. The proximity of the models tothe objectives (target features) is defined by the distance, instandard deviations, between the model feature and its respectiveexperimental feature. Models are defined as successful if they arenot dominated by any other models. i.e., there is no single modelthat is more successful in all the objectives. The optimizationstopped after 500 generations and, for the purposes of this work,we took one model that survived through the last generation andhad a small distance in all the objectives.
Number of Activated Dendritic Spines Synapses Per
Somatic SpikeSynapses with both AMPA- and NMDA-based conductances,as in Figure 4, were randomly distributed over dendritic spines(Figure 8C). The spatial distribution of synapses was eitherrandom or clustered-random. In the first case, the location ofeach synapse was chosen from a uniform distribution in themodeled dendritic tree. In the second case, the locations of agroup of spatially clustered synapses was uniformly distributedover the dendritic tree; each cluster included 20 synapses locatedin the same dendritic branch all located within 20µm fromeach other. The synapses were activated synchronously and thesimulated somatic voltage was recorded. A somatic Na+ spikewas marked as such when the somatic voltage crossed a voltagethreshold of 0mV. Each experiment (different total number ofsynapses/clusters in each model) was repeated 1,000 times withdifferent seeds. To estimate the number of synapses requiredto generate a somatic/axonal Na+ spike in 50% of the cases(Figure 8B), a linear extrapolation was used for the clusteredcase.
Rat L2/3PC ModelsFor the comparison between the new models of human L2/L3neurons and existing models of rodents we used four modelsof L2/3 pyramidal cells from the rat neocortex. Three cellswere obtained from the barrel cortex (Sarid et al., 2013,models 110602A, model 130602A, and 280503A), and onemodel from the somatosensory cortex (Markram et al., 2015,model L23_PC_cADpyr229_5). All three models from Saridet al. (2013) were used to compute the EPSPs voltage fromspine activations (spine neck resistance was assumed to be 100M� (Cartailler et al., 2018). Models 110602A, 280503A, andL23_PC_cADpyr229_5 were used in the simulation of numberof independent NMDA spikes that could be generated in a ratpyramidal neuron. Model L23_PC_cADpyr229_5 was used forthe estimation of the number of excitatory synapses that wererequired to generate somatic Na+ spike in a rat L2/3 PC.
Frontiers in Cellular Neuroscience | www.frontiersin.org 7 June 2018 | Volume 12 | Article 181
Eyal et al. Comprehensive Models of Human Cortical Neurons
RESULTS
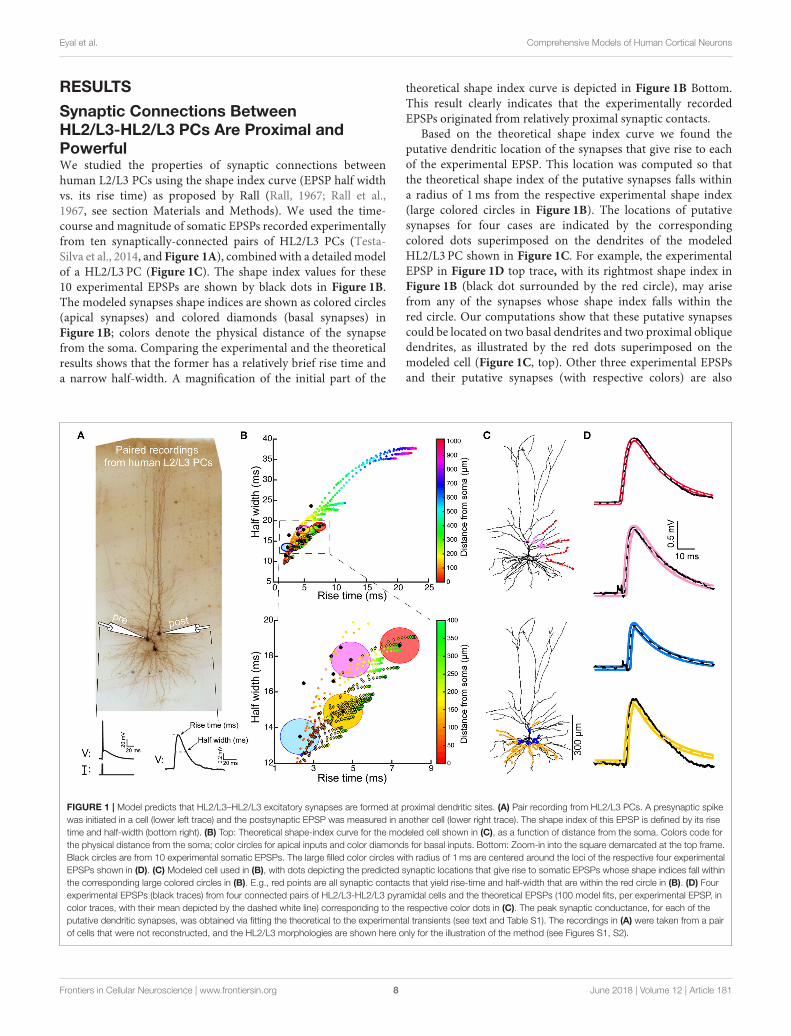
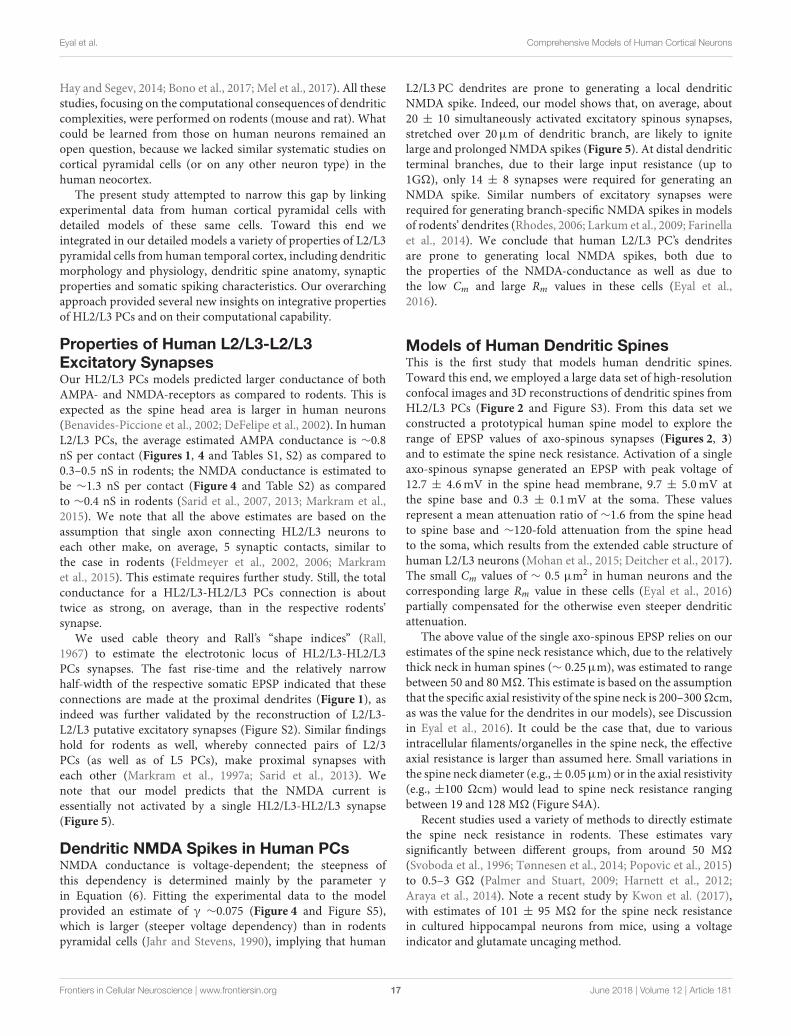
Synaptic Connections BetweenHL2/L3-HL2/L3 PCs Are Proximal andPowerfulWe studied the properties of synaptic connections betweenhuman L2/L3 PCs using the shape index curve (EPSP half widthvs. its rise time) as proposed by Rall (Rall, 1967; Rall et al.,1967, see section Materials and Methods). We used the time-course and magnitude of somatic EPSPs recorded experimentallyfrom ten synaptically-connected pairs of HL2/L3 PCs (Testa-Silva et al., 2014, and Figure 1A), combined with a detailedmodelof a HL2/L3 PC (Figure 1C). The shape index values for these10 experimental EPSPs are shown by black dots in Figure 1B.The modeled synapses shape indices are shown as colored circles(apical synapses) and colored diamonds (basal synapses) inFigure 1B; colors denote the physical distance of the synapsefrom the soma. Comparing the experimental and the theoreticalresults shows that the former has a relatively brief rise time anda narrow half-width. A magnification of the initial part of the
theoretical shape index curve is depicted in Figure 1B Bottom.This result clearly indicates that the experimentally recordedEPSPs originated from relatively proximal synaptic contacts.
Based on the theoretical shape index curve we found theputative dendritic location of the synapses that give rise to eachof the experimental EPSP. This location was computed so thatthe theoretical shape index of the putative synapses falls withina radius of 1ms from the respective experimental shape index(large colored circles in Figure 1B). The locations of putativesynapses for four cases are indicated by the correspondingcolored dots superimposed on the dendrites of the modeledHL2/L3 PC shown in Figure 1C. For example, the experimentalEPSP in Figure 1D top trace, with its rightmost shape index inFigure 1B (black dot surrounded by the red circle), may arisefrom any of the synapses whose shape index falls within thered circle. Our computations show that these putative synapsescould be located on two basal dendrites and two proximal obliquedendrites, as illustrated by the red dots superimposed on themodeled cell (Figure 1C, top). Other three experimental EPSPsand their putative synapses (with respective colors) are also
FIGURE 1 | Model predicts that HL2/L3–HL2/L3 excitatory synapses are formed at proximal dendritic sites. (A) Pair recording from HL2/L3 PCs. A presynaptic spike
was initiated in a cell (lower left trace) and the postsynaptic EPSP was measured in another cell (lower right trace). The shape index of this EPSP is defined by its rise
time and half-width (bottom right). (B) Top: Theoretical shape-index curve for the modeled cell shown in (C), as a function of distance from the soma. Colors code for
the physical distance from the soma; color circles for apical inputs and color diamonds for basal inputs. Bottom: Zoom-in into the square demarcated at the top frame.
Black circles are from 10 experimental somatic EPSPs. The large filled color circles with radius of 1ms are centered around the loci of the respective four experimental
EPSPs shown in (D). (C) Modeled cell used in (B), with dots depicting the predicted synaptic locations that give rise to somatic EPSPs whose shape indices fall within
the corresponding large colored circles in (B). E.g., red points are all synaptic contacts that yield rise-time and half-width that are within the red circle in (B). (D) Four
experimental EPSPs (black traces) from four connected pairs of HL2/L3-HL2/L3 pyramidal cells and the theoretical EPSPs (100 model fits, per experimental EPSP, in
color traces, with their mean depicted by the dashed white line) corresponding to the respective color dots in (C). The peak synaptic conductance, for each of the
putative dendritic synapses, was obtained via fitting the theoretical to the experimental transients (see text and Table S1). The recordings in (A) were taken from a pair
of cells that were not reconstructed, and the HL2/L3 morphologies are shown here only for the illustration of the method (see Figures S1, S2).
Frontiers in Cellular Neuroscience | www.frontiersin.org 8 June 2018 | Volume 12 | Article 181
Eyal et al. Comprehensive Models of Human Cortical Neurons
depicted in Figure 1. Overall, our computations suggest thatL2/L3-L2/L3 synaptic connections are within a distance of 140± 78µm from the soma.
Next, in order to estimate the magnitude and kinetics of theseHL2/L3–HL2/L3 synapses (see section Materials and Methods,Equations 2–5), we have used the modeled cell in Figure 1 tofit the full waveform of the experimental EPSPs (four EPSPsare shown in Figure 1D, black traces). The putative synapsesat the respective locations for each experimental EPSP wereactivated, and the synaptic conductance was optimized (seesectionMaterials andMethods) such that the model EPSPs (colortraces in Figure 1D) would best match the experimental EPSPs.The range of synaptic conductances and kinetics values thatfit the HL2/L3–HL2/L3 excitatory connections is provided inTable S1. Assuming five contacts per connection (see sectionMaterials and Methods), the average peak synaptic conductanceof HL2/L3–HL2/L3 connection was 0.88 ± 0.70 nS, with risetime of 0.3ms and decay time of 1.8ms. We note that this valuecharacterizes mostly the properties of AMPA-based conductance,as the neuron was recorded at hyperpolarized value (−86mV)and, thus, for a single connection the NMDA receptors wereessentially not activated (see below).
Together, these findings indicate that adjacent human L2/L3pyramidal cells form synapses with each other predominantly onthe proximal basal and oblique dendrites, similar to what wasfound in the somatosensory cortex of rodents L2/3 pyramidalcells (Sarid et al., 2007, 2013). This finding was further confirmedanatomically in Figure S2. Another prediction is that the AMPA-based conductance/contact is rather strong in these cells (0.88 ±0.70 nS) as compared to 0.3–0.5 nS in rodents (Sarid et al., 2013;Markram et al., 2015). Clearly, if more contacts are involved perconnection, then this conductance value is overestimated. Wewill need more detailed reconstructions of connected cell pairsto resolve this uncertainty (See section Discussion).
Human Dendritic Spines With SynapsesTo obtain a realistic model of a human dendritic spine, we usedhigh-resolution confocal images of 150 spines from HL3 PCs’dendrites in control post-mortem tissue from human temporalcortex obtained in autopsy (Benavides-Piccione et al., 2013,Figure 2, and see section Materials and Methods). Spines hadhead membrane area of 2.88 ± 1.37 µm2, neck length of 1.34 ±0.50 µm and spine neck diameter of 0.24 ± 0.08 µm (n = 150),Figure S3. Note that these dendritic spines are much largerthan dendritic spines in rodents’ cortical neurons (Benavides-Piccione et al., 2002). From the confocal images, we constructeda prototypical spine model with an average head membrane areaof 2.8 µm2, spine neck diameter of 0.25µm, spine neck length of1.35µm (Figure 2G), and a spine neck resistance of 50–80 M�,assuming a specific axial resistance in the spine neck of 200–300�-cm. This range of spine neck resistance is in the lower rangefound in the literature (Svoboda et al., 1996; Tønnesen et al.,2014), see Figure S4A and section Discussion.
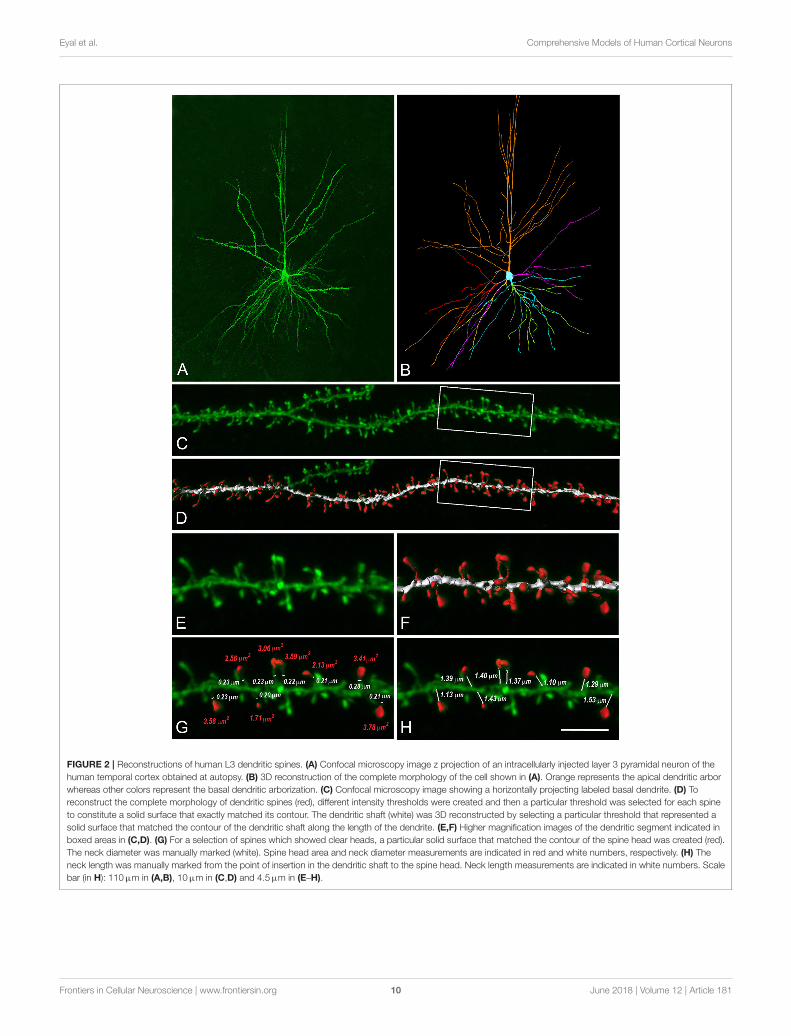
The expected effect of excitatory synapses impinging on ahuman dendritic spine was studied by the activation of an axo-spinous synapse (Figure 3A), with synaptic properties as foundin Figure 1, and observing the resultant EPSP in the spine
head, spine base and the soma. One such example is shown inFigure 3B. We repeated this simulation many times (n = 6,228),by connecting a spine model to each electrical compartmentin each of the six modeled human L2/L3 PCs (see cells inFigure 7 and also in Eyal et al., 2016), and then activated asynapse individually at each spine head. The peak EPSP valuesfor all the spines in one of these HL2/L3 models are shown inFigures 3C,D. Activation of a single spinous synapse gave riseto peak EPSP of 12.7 ± 4.6mV in the spine head membrane,which was attenuated to 9.7 ± 5.0mV at the spine base andto 0.3 ± 0.1mV at the soma. Considering each dendritic spineindividually, these values represent an attenuation ratio of 1.61± 0.93 from the spine head to spine base and 122 ± 196-folds(range of 6- to 1,812-folds) attenuation from the spine head tothe soma. This steep attenuation from the spine to the soma is theresult of the extended cable structure of human L2/L3 neurons,see (Mohan et al., 2015; Deitcher et al., 2017). Importantly, thesmall Cm values of ∼ 0.5 µF/cm2, as we have recently found inhuman neurons, partially compensated for the otherwise evenstronger attenuation. Namely, with Cm of 1 µF/cm2, a muchsteeper voltage attenuation is expected (Figure 3A in Eyal et al.,2016).
We summarize this section by noting that, locally at the spinehead, a depolarization of∼13mV is expected from an individualexcitatory synapse which, on its own, will only minimallyactivate NMDA-dependent receptors at the spine head. This localdepolarization is larger than what we computed for L2/3 ratpyramidal cells (9.9 ± 7.5mV, n = 3 cells, 2640 spines, spineneck resistance of 100 M�, models are from Sarid et al., 2013,see section Materials and Methods), due to the large synapticconductance in HL2/L3 PCs. However, because of the strongvoltage attenuation in human L2/L3 PCs dendrites, the somaticEPSP (from activation of individual spine) in HL2/L3 PCs issimilar to rat L2/3 PCs (0.3± 0.1 and 0.3± 0.2mV, respectively).
Large NMDA Currents Involved inComposite EPSPs; Implications forBranch-Specific NMDA SpikesNMDA-mediated current was shown to be critical for memoryconsolidation (Shimizu et al., 2000) as well as for computations atthe single neuron level, e.g. for shaping the orientation selectivityin the visual cortex (Smith et al., 2013) and for angular tuning inthe barrel cortex (Lavzin et al., 2012). These computations werebased on the non-linear properties of the NMDA channel. Whatare the properties of the NMDA channels in human neurons? Arehuman L2/L3 PCs likely to generate local dendritic NMDA spikessimilar to those found in rodents?
To experimentally characterize NMDA receptor-mediatedcurrents in HL2/L3 PCs, an extracellular electrode was usedfor stimulating proximal sites to the apical tree of HL2/L3PCs while recording the postsynaptic responses from thesoma (Figure 4A, and section Materials and Methods). Theextracellular stimulus gave rise to large composite somaticEPSPs (5.2 ± 1.3mV, in 3 cells, 6 different stimulation loci). Aprominent NMDA-receptor mediated component was isolatedafter blocking AMPA-, kainate- and GABAA-receptors (see
Frontiers in Cellular Neuroscience | www.frontiersin.org 9 June 2018 | Volume 12 | Article 181
Eyal et al. Comprehensive Models of Human Cortical Neurons
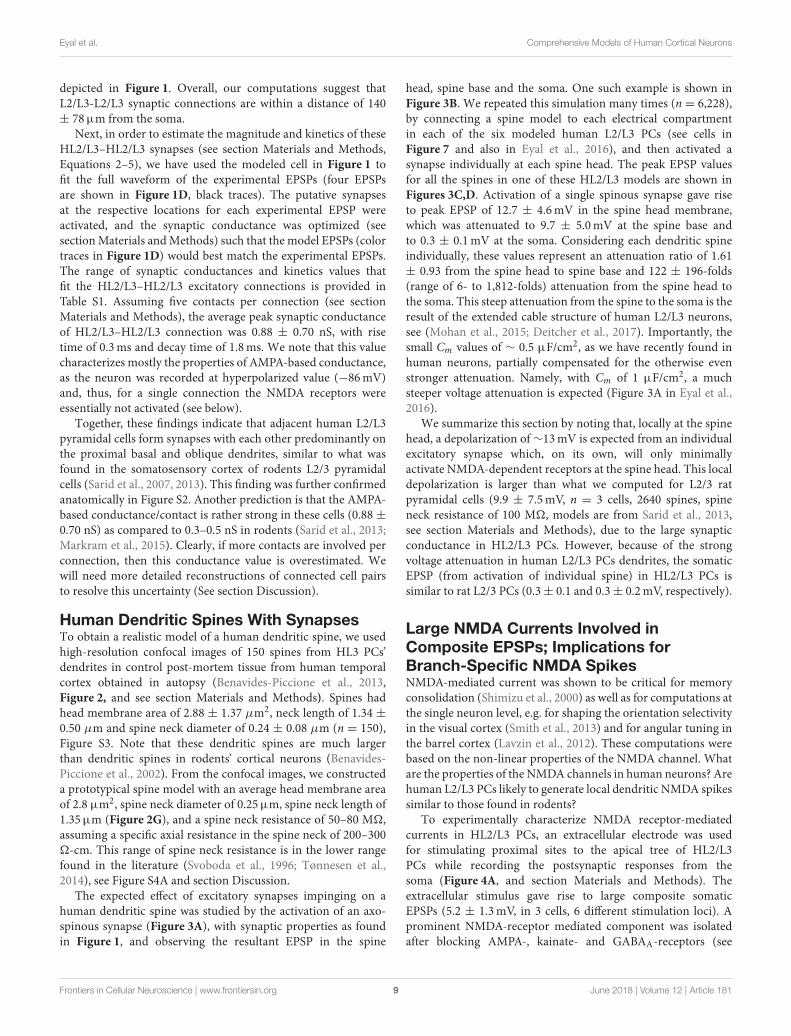
FIGURE 2 | Reconstructions of human L3 dendritic spines. (A) Confocal microscopy image z projection of an intracellularly injected layer 3 pyramidal neuron of the
human temporal cortex obtained at autopsy. (B) 3D reconstruction of the complete morphology of the cell shown in (A). Orange represents the apical dendritic arbor
whereas other colors represent the basal dendritic arborization. (C) Confocal microscopy image showing a horizontally projecting labeled basal dendrite. (D) To
reconstruct the complete morphology of dendritic spines (red), different intensity thresholds were created and then a particular threshold was selected for each spine
to constitute a solid surface that exactly matched its contour. The dendritic shaft (white) was 3D reconstructed by selecting a particular threshold that represented a
solid surface that matched the contour of the dendritic shaft along the length of the dendrite. (E,F) Higher magnification images of the dendritic segment indicated in
boxed areas in (C,D). (G) For a selection of spines which showed clear heads, a particular solid surface that matched the contour of the spine head was created (red).
The neck diameter was manually marked (white). Spine head area and neck diameter measurements are indicated in red and white numbers, respectively. (H) The
neck length was manually marked from the point of insertion in the dendritic shaft to the spine head. Neck length measurements are indicated in white numbers. Scale
bar (in H): 110µm in (A,B), 10µm in (C,D) and 4.5µm in (E–H).
Frontiers in Cellular Neuroscience | www.frontiersin.org 10 June 2018 | Volume 12 | Article 181
Eyal et al. Comprehensive Models of Human Cortical Neurons
FIGURE 3 | Modeling synaptic inputs on 3D reconstructed human L2/L3 PCs’ dendritic spines. (A) A prototypical 3D reconstructed human L3 spine, with average
dimensions as found in Figure 2. This dendritic spine was used as a target for excitatory synapses located at its head membrane; synaptic properties are as found in
Figure 1. Scale bar = 2µm. (B) Exemplar simulated EPSP in the spine head (yellow), spine base (green), and in the soma (cyan). (C) Predicted individual EPSP peak
voltage at the (yellow), spine base (green) and in the soma (cyan) for dendritic spines distributed on the modeled cell shown in Figure 1. The spines are arranged
according to the input resistance of their respective stem dendrite. Colors are as in (B); black dots depict the example shown in (B). (D) Zoom-in into (C) showing the
peak somatic EPSP.
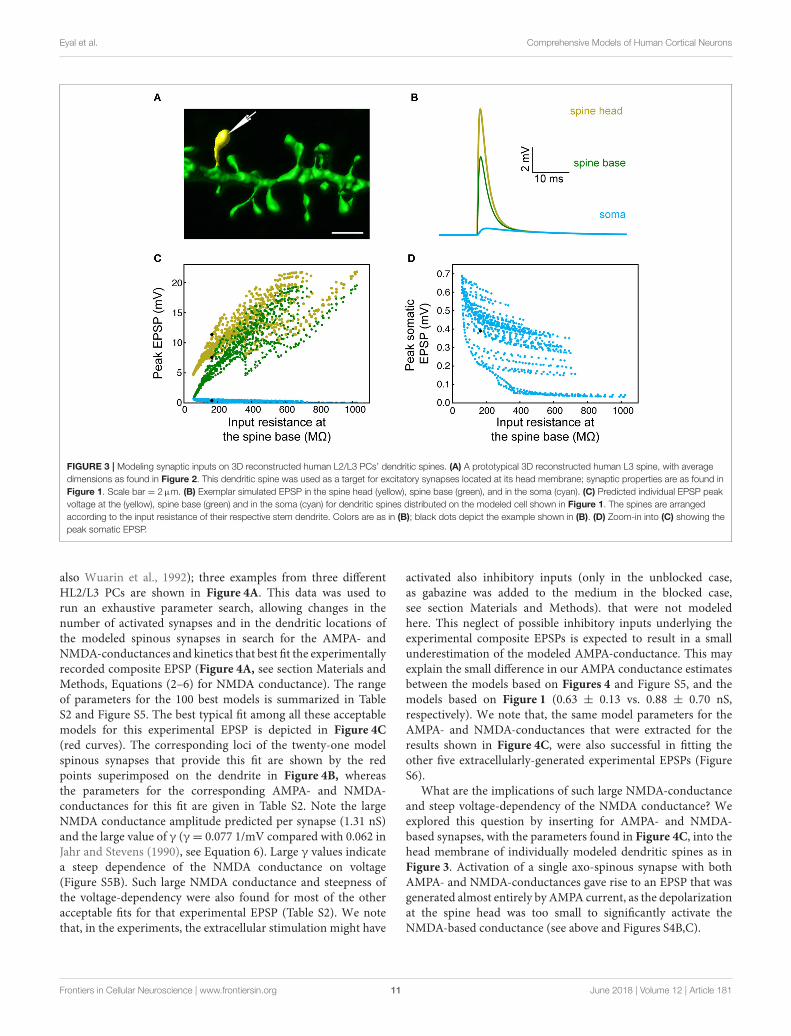
also Wuarin et al., 1992); three examples from three differentHL2/L3 PCs are shown in Figure 4A. This data was used torun an exhaustive parameter search, allowing changes in thenumber of activated synapses and in the dendritic locations ofthe modeled spinous synapses in search for the AMPA- andNMDA-conductances and kinetics that best fit the experimentallyrecorded composite EPSP (Figure 4A, see section Materials andMethods, Equations (2–6) for NMDA conductance). The rangeof parameters for the 100 best models is summarized in TableS2 and Figure S5. The best typical fit among all these acceptablemodels for this experimental EPSP is depicted in Figure 4C
(red curves). The corresponding loci of the twenty-one modelspinous synapses that provide this fit are shown by the redpoints superimposed on the dendrite in Figure 4B, whereasthe parameters for the corresponding AMPA- and NMDA-conductances for this fit are given in Table S2. Note the largeNMDA conductance amplitude predicted per synapse (1.31 nS)and the large value of γ (γ = 0.077 1/mV compared with 0.062 inJahr and Stevens (1990), see Equation 6). Large γ values indicatea steep dependence of the NMDA conductance on voltage(Figure S5B). Such large NMDA conductance and steepness ofthe voltage-dependency were also found for most of the otheracceptable fits for that experimental EPSP (Table S2). We notethat, in the experiments, the extracellular stimulation might have
activated also inhibitory inputs (only in the unblocked case,as gabazine was added to the medium in the blocked case,see section Materials and Methods). that were not modeledhere. This neglect of possible inhibitory inputs underlying theexperimental composite EPSPs is expected to result in a smallunderestimation of the modeled AMPA-conductance. This mayexplain the small difference in our AMPA conductance estimatesbetween the models based on Figures 4 and Figure S5, and themodels based on Figure 1 (0.63 ± 0.13 vs. 0.88 ± 0.70 nS,respectively). We note that, the same model parameters for theAMPA- and NMDA-conductances that were extracted for theresults shown in Figure 4C, were also successful in fitting theother five extracellularly-generated experimental EPSPs (FigureS6).
What are the implications of such large NMDA-conductanceand steep voltage-dependency of the NMDA conductance? Weexplored this question by inserting for AMPA- and NMDA-based synapses, with the parameters found in Figure 4C, into thehead membrane of individually modeled dendritic spines as inFigure 3. Activation of a single axo-spinous synapse with bothAMPA- and NMDA-conductances gave rise to an EPSP that wasgenerated almost entirely by AMPA current, as the depolarizationat the spine head was too small to significantly activate theNMDA-based conductance (see above and Figures S4B,C).
Frontiers in Cellular Neuroscience | www.frontiersin.org 11 June 2018 | Volume 12 | Article 181
Eyal et al. Comprehensive Models of Human Cortical Neurons
FIGURE 4 | NMDA-receptor based currents in human L2/L3 pyramidal cells—model fit to experiments. (A) Somatic EPSPs recorded in three HL2/L3 PCs in response
to repeated stimulation via an extracellular electrode (Istim in B), see section Materials and Methods. Light blue traces: The respective somatic EPSPs. Black traces:
NMDA-dependent EPSPs after blocking AMPA receptors with 1µM of NBQX; thick lines are the respective averages. Leftmost EPSPs were recorded from the cell
shown in (B). (B) Model prediction for the putative dendritic location and number of activated synapses (red dots) that closely fits the experimental average EPSP
shown at the left frame of (A). Synaptic model included both AMPA- and NMDA-based conductances (see section Materials and Methods and Table S2). (C) Model
response at the soma (red traces) when all 21 red synapses in (B) were activated. Top trace. EPSP with both AMPA and NMDA conductance; bottom trace, the case
in which 82% of the AMPA conductance was blocked (see section Materials and Methods). See similar fits to additional neurons in Figure S6, as well as other
accepted models in Figure S5; note the steep non-linearity of the voltage-dependency of the NMDA-current in most of the models (Figure S5B).
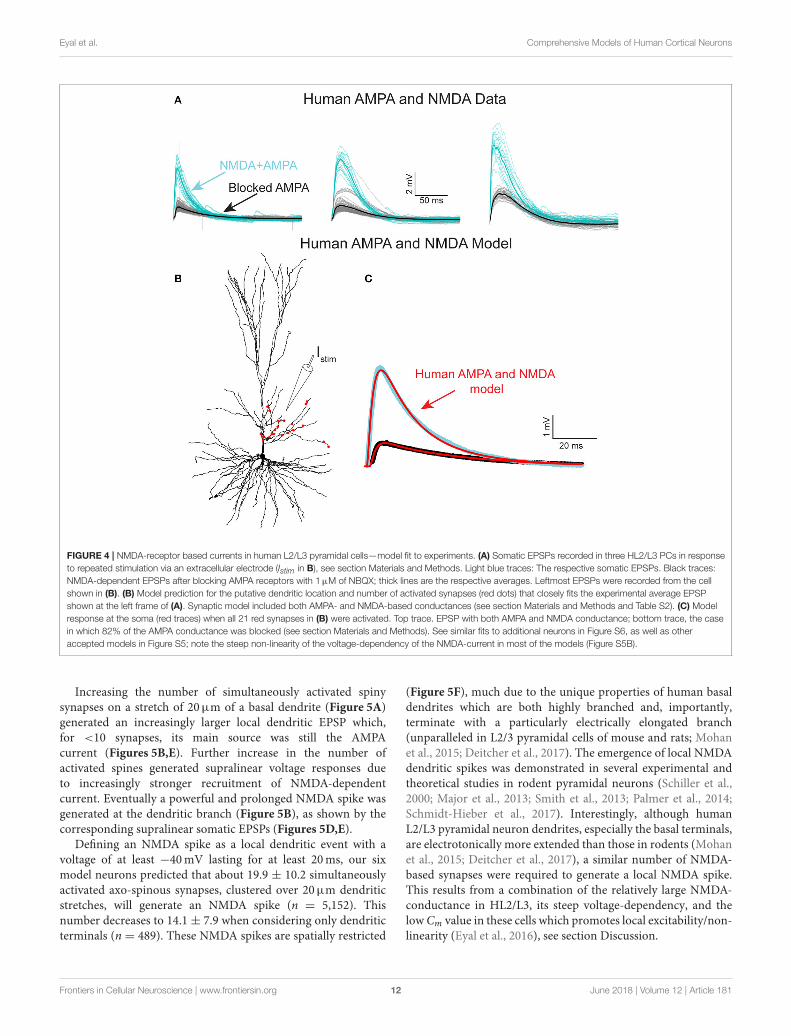
Increasing the number of simultaneously activated spinysynapses on a stretch of 20µm of a basal dendrite (Figure 5A)generated an increasingly larger local dendritic EPSP which,for <10 synapses, its main source was still the AMPAcurrent (Figures 5B,E). Further increase in the number ofactivated spines generated supralinear voltage responses dueto increasingly stronger recruitment of NMDA-dependentcurrent. Eventually a powerful and prolonged NMDA spike wasgenerated at the dendritic branch (Figure 5B), as shown by thecorresponding supralinear somatic EPSPs (Figures 5D,E).
Defining an NMDA spike as a local dendritic event with avoltage of at least −40mV lasting for at least 20ms, our sixmodel neurons predicted that about 19.9 ± 10.2 simultaneouslyactivated axo-spinous synapses, clustered over 20µm dendriticstretches, will generate an NMDA spike (n = 5,152). Thisnumber decreases to 14.1 ± 7.9 when considering only dendriticterminals (n = 489). These NMDA spikes are spatially restricted
(Figure 5F), much due to the unique properties of human basaldendrites which are both highly branched and, importantly,terminate with a particularly electrically elongated branch(unparalleled in L2/3 pyramidal cells of mouse and rats; Mohanet al., 2015; Deitcher et al., 2017). The emergence of local NMDAdendritic spikes was demonstrated in several experimental andtheoretical studies in rodent pyramidal neurons (Schiller et al.,2000; Major et al., 2013; Smith et al., 2013; Palmer et al., 2014;Schmidt-Hieber et al., 2017). Interestingly, although humanL2/L3 pyramidal neuron dendrites, especially the basal terminals,are electrotonically more extended than those in rodents (Mohanet al., 2015; Deitcher et al., 2017), a similar number of NMDA-based synapses were required to generate a local NMDA spike.This results from a combination of the relatively large NMDA-conductance in HL2/L3, its steep voltage-dependency, and thelowCm value in these cells which promotes local excitability/non-linearity (Eyal et al., 2016), see section Discussion.
Frontiers in Cellular Neuroscience | www.frontiersin.org 12 June 2018 | Volume 12 | Article 181
Eyal et al. Comprehensive Models of Human Cortical Neurons
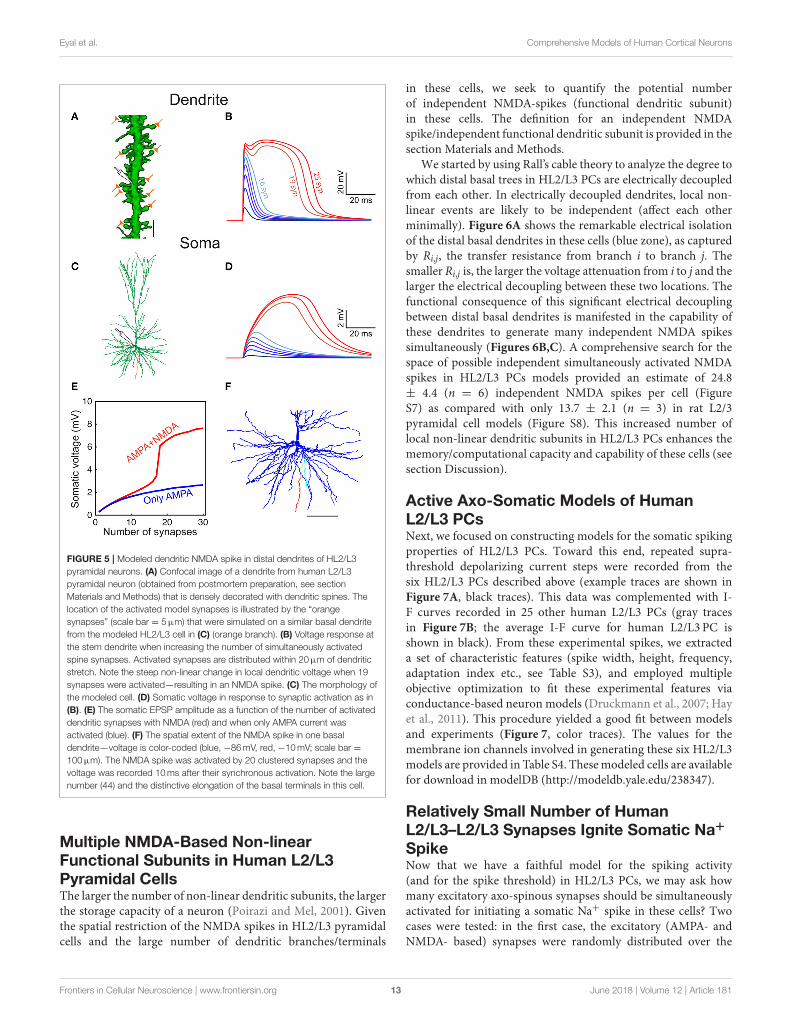
FIGURE 5 | Modeled dendritic NMDA spike in distal dendrites of HL2/L3
pyramidal neurons. (A) Confocal image of a dendrite from human L2/L3
pyramidal neuron (obtained from postmortem preparation, see section
Materials and Methods) that is densely decorated with dendritic spines. The
location of the activated model synapses is illustrated by the “orange
synapses” (scale bar = 5µm) that were simulated on a similar basal dendrite
from the modeled HL2/L3 cell in (C) (orange branch). (B) Voltage response at
the stem dendrite when increasing the number of simultaneously activated
spine synapses. Activated synapses are distributed within 20µm of dendritic
stretch. Note the steep non-linear change in local dendritic voltage when 19
synapses were activated—resulting in an NMDA spike. (C) The morphology of
the modeled cell. (D) Somatic voltage in response to synaptic activation as in
(B). (E) The somatic EPSP amplitude as a function of the number of activated
dendritic synapses with NMDA (red) and when only AMPA current was
activated (blue). (F) The spatial extent of the NMDA spike in one basal
dendrite—voltage is color-coded (blue, −86mV, red, −10mV; scale bar =
100µm). The NMDA spike was activated by 20 clustered synapses and the
voltage was recorded 10ms after their synchronous activation. Note the large
number (44) and the distinctive elongation of the basal terminals in this cell.
Multiple NMDA-Based Non-linearFunctional Subunits in Human L2/L3Pyramidal CellsThe larger the number of non-linear dendritic subunits, the largerthe storage capacity of a neuron (Poirazi and Mel, 2001). Giventhe spatial restriction of the NMDA spikes in HL2/L3 pyramidalcells and the large number of dendritic branches/terminals
in these cells, we seek to quantify the potential numberof independent NMDA-spikes (functional dendritic subunit)in these cells. The definition for an independent NMDAspike/independent functional dendritic subunit is provided in thesection Materials and Methods.
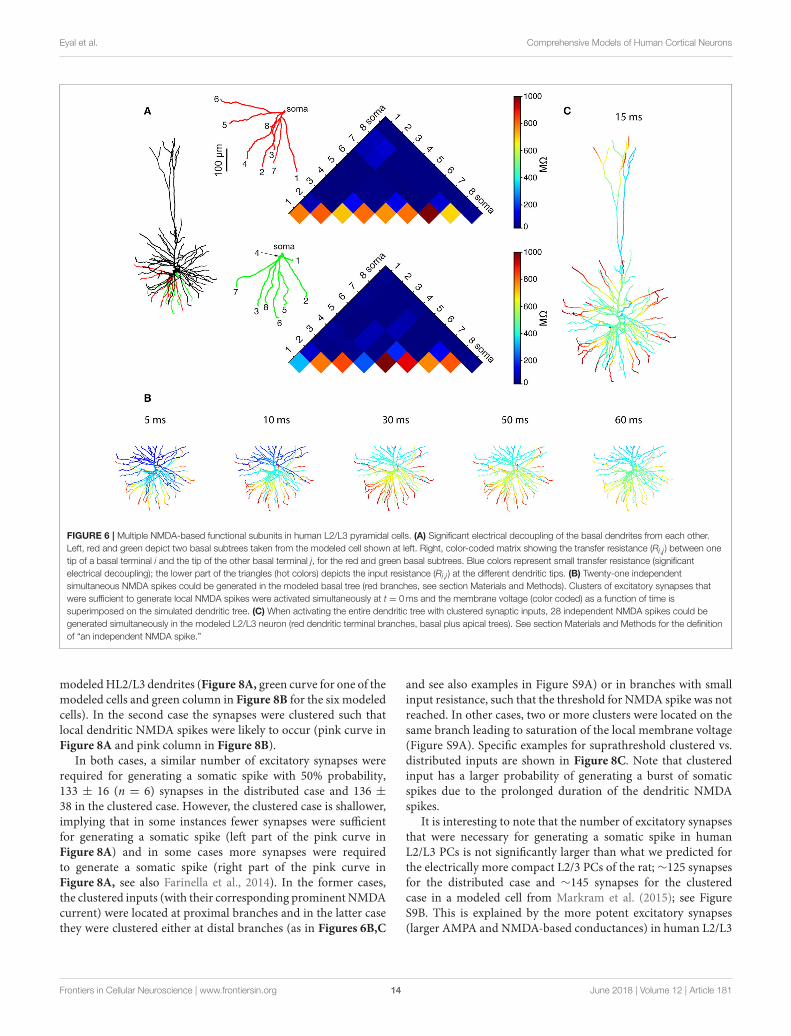
We started by using Rall’s cable theory to analyze the degree towhich distal basal trees in HL2/L3 PCs are electrically decoupledfrom each other. In electrically decoupled dendrites, local non-linear events are likely to be independent (affect each otherminimally). Figure 6A shows the remarkable electrical isolationof the distal basal dendrites in these cells (blue zone), as capturedby Ri,j, the transfer resistance from branch i to branch j. Thesmaller Ri,j is, the larger the voltage attenuation from i to j and thelarger the electrical decoupling between these two locations. Thefunctional consequence of this significant electrical decouplingbetween distal basal dendrites is manifested in the capability ofthese dendrites to generate many independent NMDA spikessimultaneously (Figures 6B,C). A comprehensive search for thespace of possible independent simultaneously activated NMDAspikes in HL2/L3 PCs models provided an estimate of 24.8± 4.4 (n = 6) independent NMDA spikes per cell (FigureS7) as compared with only 13.7 ± 2.1 (n = 3) in rat L2/3pyramidal cell models (Figure S8). This increased number oflocal non-linear dendritic subunits in HL2/L3 PCs enhances thememory/computational capacity and capability of these cells (seesection Discussion).
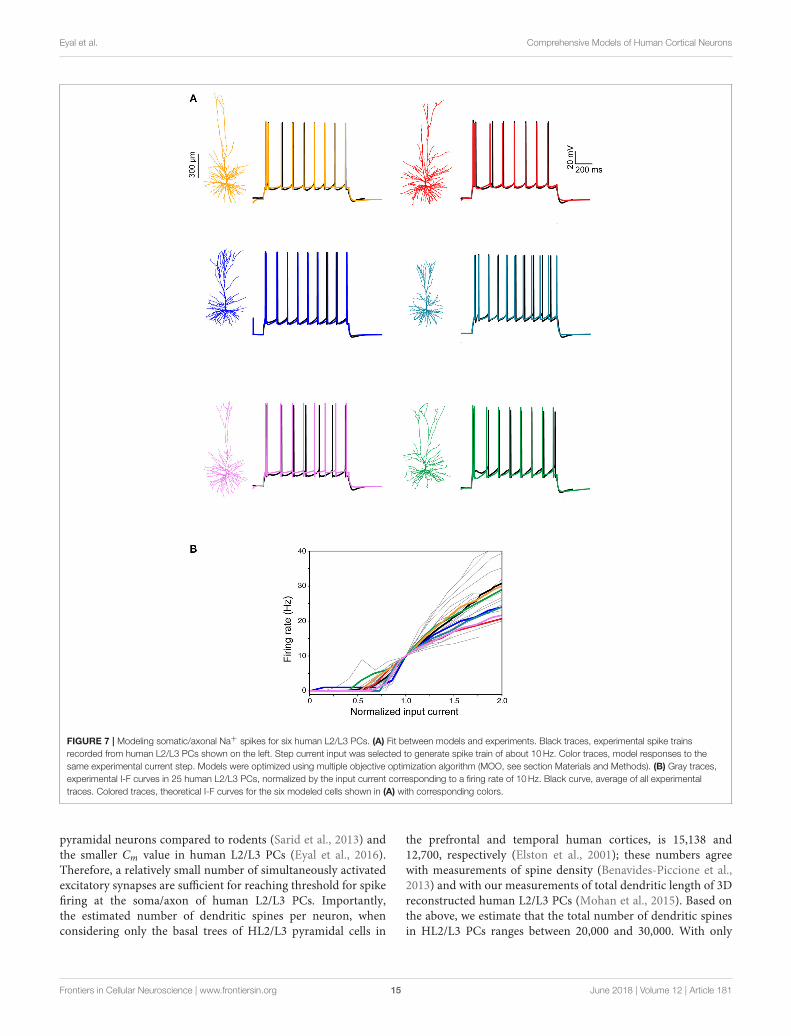
Active Axo-Somatic Models of HumanL2/L3 PCsNext, we focused on constructing models for the somatic spikingproperties of HL2/L3 PCs. Toward this end, repeated supra-threshold depolarizing current steps were recorded from thesix HL2/L3 PCs described above (example traces are shown inFigure 7A, black traces). This data was complemented with I-F curves recorded in 25 other human L2/L3 PCs (gray tracesin Figure 7B; the average I-F curve for human L2/L3 PC isshown in black). From these experimental spikes, we extracteda set of characteristic features (spike width, height, frequency,adaptation index etc., see Table S3), and employed multipleobjective optimization to fit these experimental features viaconductance-based neuron models (Druckmann et al., 2007; Hayet al., 2011). This procedure yielded a good fit between modelsand experiments (Figure 7, color traces). The values for themembrane ion channels involved in generating these six HL2/L3models are provided in Table S4. Thesemodeled cells are availablefor download in modelDB (http://modeldb.yale.edu/238347).
Relatively Small Number of HumanL2/L3–L2/L3 Synapses Ignite Somatic Na+
SpikeNow that we have a faithful model for the spiking activity(and for the spike threshold) in HL2/L3 PCs, we may ask howmany excitatory axo-spinous synapses should be simultaneouslyactivated for initiating a somatic Na+ spike in these cells? Twocases were tested: in the first case, the excitatory (AMPA- andNMDA- based) synapses were randomly distributed over the
Frontiers in Cellular Neuroscience | www.frontiersin.org 13 June 2018 | Volume 12 | Article 181
Eyal et al. Comprehensive Models of Human Cortical Neurons
FIGURE 6 | Multiple NMDA-based functional subunits in human L2/L3 pyramidal cells. (A) Significant electrical decoupling of the basal dendrites from each other.
Left, red and green depict two basal subtrees taken from the modeled cell shown at left. Right, color-coded matrix showing the transfer resistance (Ri,j ) between one
tip of a basal terminal i and the tip of the other basal terminal j, for the red and green basal subtrees. Blue colors represent small transfer resistance (significant
electrical decoupling); the lower part of the triangles (hot colors) depicts the input resistance (Ri,i ) at the different dendritic tips. (B) Twenty-one independent
simultaneous NMDA spikes could be generated in the modeled basal tree (red branches, see section Materials and Methods). Clusters of excitatory synapses that
were sufficient to generate local NMDA spikes were activated simultaneously at t = 0ms and the membrane voltage (color coded) as a function of time is
superimposed on the simulated dendritic tree. (C) When activating the entire dendritic tree with clustered synaptic inputs, 28 independent NMDA spikes could be
generated simultaneously in the modeled L2/L3 neuron (red dendritic terminal branches, basal plus apical trees). See section Materials and Methods for the definition
of “an independent NMDA spike.”
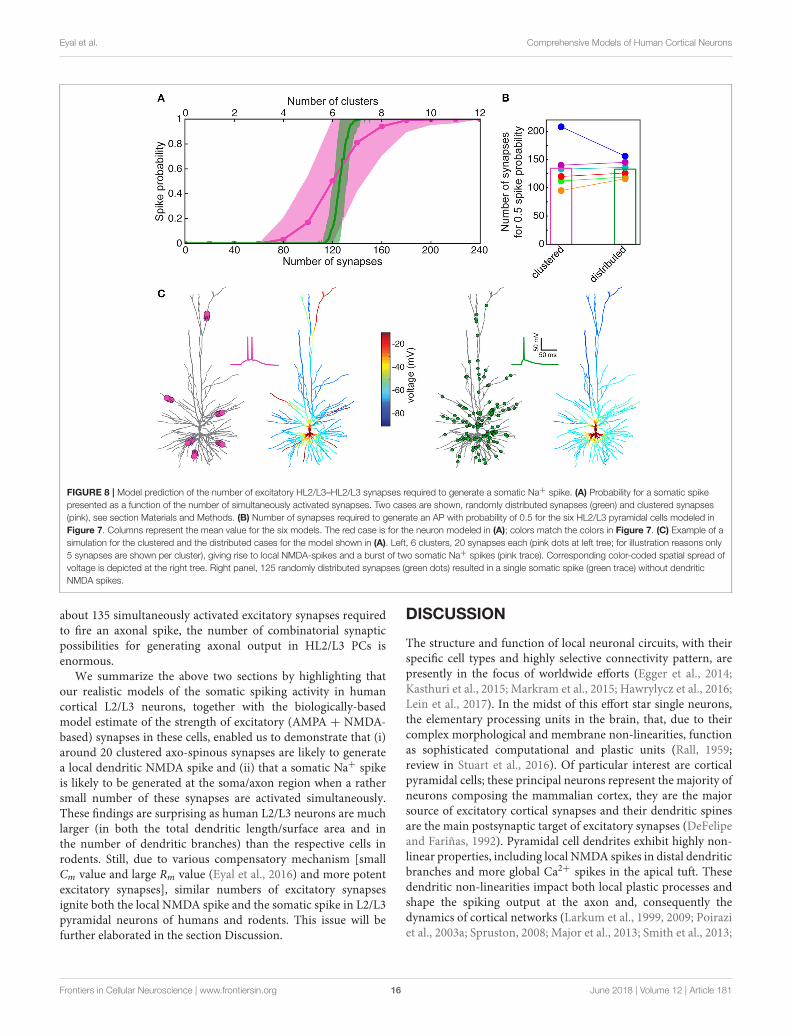
modeledHL2/L3 dendrites (Figure 8A, green curve for one of themodeled cells and green column in Figure 8B for the six modeledcells). In the second case the synapses were clustered such thatlocal dendritic NMDA spikes were likely to occur (pink curve inFigure 8A and pink column in Figure 8B).
In both cases, a similar number of excitatory synapses wererequired for generating a somatic spike with 50% probability,133 ± 16 (n = 6) synapses in the distributed case and 136 ±
38 in the clustered case. However, the clustered case is shallower,implying that in some instances fewer synapses were sufficientfor generating a somatic spike (left part of the pink curve inFigure 8A) and in some cases more synapses were requiredto generate a somatic spike (right part of the pink curve inFigure 8A, see also Farinella et al., 2014). In the former cases,the clustered inputs (with their corresponding prominent NMDAcurrent) were located at proximal branches and in the latter casethey were clustered either at distal branches (as in Figures 6B,C
and see also examples in Figure S9A) or in branches with smallinput resistance, such that the threshold for NMDA spike was notreached. In other cases, two or more clusters were located on thesame branch leading to saturation of the local membrane voltage(Figure S9A). Specific examples for suprathreshold clustered vs.distributed inputs are shown in Figure 8C. Note that clusteredinput has a larger probability of generating a burst of somaticspikes due to the prolonged duration of the dendritic NMDAspikes.
It is interesting to note that the number of excitatory synapsesthat were necessary for generating a somatic spike in humanL2/L3 PCs is not significantly larger than what we predicted forthe electrically more compact L2/3 PCs of the rat;∼125 synapsesfor the distributed case and ∼145 synapses for the clusteredcase in a modeled cell from Markram et al. (2015); see FigureS9B. This is explained by the more potent excitatory synapses(larger AMPA and NMDA-based conductances) in human L2/L3
Frontiers in Cellular Neuroscience | www.frontiersin.org 14 June 2018 | Volume 12 | Article 181
Eyal et al. Comprehensive Models of Human Cortical Neurons
FIGURE 7 | Modeling somatic/axonal Na+ spikes for six human L2/L3 PCs. (A) Fit between models and experiments. Black traces, experimental spike trains
recorded from human L2/L3 PCs shown on the left. Step current input was selected to generate spike train of about 10Hz. Color traces, model responses to the
same experimental current step. Models were optimized using multiple objective optimization algorithm (MOO, see section Materials and Methods). (B) Gray traces,
experimental I-F curves in 25 human L2/L3 PCs, normalized by the input current corresponding to a firing rate of 10Hz. Black curve, average of all experimental
traces. Colored traces, theoretical I-F curves for the six modeled cells shown in (A) with corresponding colors.
pyramidal neurons compared to rodents (Sarid et al., 2013) andthe smaller Cm value in human L2/L3 PCs (Eyal et al., 2016).Therefore, a relatively small number of simultaneously activatedexcitatory synapses are sufficient for reaching threshold for spikefiring at the soma/axon of human L2/L3 PCs. Importantly,the estimated number of dendritic spines per neuron, whenconsidering only the basal trees of HL2/L3 pyramidal cells in
the prefrontal and temporal human cortices, is 15,138 and12,700, respectively (Elston et al., 2001); these numbers agreewith measurements of spine density (Benavides-Piccione et al.,2013) and with our measurements of total dendritic length of 3Dreconstructed human L2/L3 PCs (Mohan et al., 2015). Based onthe above, we estimate that the total number of dendritic spinesin HL2/L3 PCs ranges between 20,000 and 30,000. With only
Frontiers in Cellular Neuroscience | www.frontiersin.org 15 June 2018 | Volume 12 | Article 181
Eyal et al. Comprehensive Models of Human Cortical Neurons
FIGURE 8 | Model prediction of the number of excitatory HL2/L3–HL2/L3 synapses required to generate a somatic Na+ spike. (A) Probability for a somatic spike
presented as a function of the number of simultaneously activated synapses. Two cases are shown, randomly distributed synapses (green) and clustered synapses
(pink), see section Materials and Methods. (B) Number of synapses required to generate an AP with probability of 0.5 for the six HL2/L3 pyramidal cells modeled in
Figure 7. Columns represent the mean value for the six models. The red case is for the neuron modeled in (A); colors match the colors in Figure 7. (C) Example of a
simulation for the clustered and the distributed cases for the model shown in (A). Left, 6 clusters, 20 synapses each (pink dots at left tree; for illustration reasons only
5 synapses are shown per cluster), giving rise to local NMDA-spikes and a burst of two somatic Na+ spikes (pink trace). Corresponding color-coded spatial spread of
voltage is depicted at the right tree. Right panel, 125 randomly distributed synapses (green dots) resulted in a single somatic spike (green trace) without dendritic
NMDA spikes.
about 135 simultaneously activated excitatory synapses requiredto fire an axonal spike, the number of combinatorial synapticpossibilities for generating axonal output in HL2/L3 PCs isenormous.
We summarize the above two sections by highlighting thatour realistic models of the somatic spiking activity in humancortical L2/L3 neurons, together with the biologically-basedmodel estimate of the strength of excitatory (AMPA + NMDA-based) synapses in these cells, enabled us to demonstrate that (i)around 20 clustered axo-spinous synapses are likely to generatea local dendritic NMDA spike and (ii) that a somatic Na+ spikeis likely to be generated at the soma/axon region when a rathersmall number of these synapses are activated simultaneously.These findings are surprising as human L2/L3 neurons are muchlarger (in both the total dendritic length/surface area and inthe number of dendritic branches) than the respective cells inrodents. Still, due to various compensatory mechanism [smallCm value and large Rm value (Eyal et al., 2016) and more potentexcitatory synapses], similar numbers of excitatory synapsesignite both the local NMDA spike and the somatic spike in L2/L3pyramidal neurons of humans and rodents. This issue will befurther elaborated in the section Discussion.
DISCUSSION
The structure and function of local neuronal circuits, with theirspecific cell types and highly selective connectivity pattern, arepresently in the focus of worldwide efforts (Egger et al., 2014;Kasthuri et al., 2015; Markram et al., 2015; Hawrylycz et al., 2016;Lein et al., 2017). In the midst of this effort star single neurons,the elementary processing units in the brain, that, due to theircomplex morphological and membrane non-linearities, functionas sophisticated computational and plastic units (Rall, 1959;review in Stuart et al., 2016). Of particular interest are corticalpyramidal cells; these principal neurons represent the majority ofneurons composing the mammalian cortex, they are the majorsource of excitatory cortical synapses and their dendritic spinesare the main postsynaptic target of excitatory synapses (DeFelipeand Fariñas, 1992). Pyramidal cell dendrites exhibit highly non-linear properties, including local NMDA spikes in distal dendriticbranches and more global Ca2+ spikes in the apical tuft. Thesedendritic non-linearities impact both local plastic processes andshape the spiking output at the axon and, consequently thedynamics of cortical networks (Larkum et al., 1999, 2009; Poiraziet al., 2003a; Spruston, 2008; Major et al., 2013; Smith et al., 2013;
Frontiers in Cellular Neuroscience | www.frontiersin.org 16 June 2018 | Volume 12 | Article 181
Eyal et al. Comprehensive Models of Human Cortical Neurons
Hay and Segev, 2014; Bono et al., 2017; Mel et al., 2017). All thesestudies, focusing on the computational consequences of dendriticcomplexities, were performed on rodents (mouse and rat). Whatcould be learned from those on human neurons remained anopen question, because we lacked similar systematic studies oncortical pyramidal cells (or on any other neuron type) in thehuman neocortex.
The present study attempted to narrow this gap by linkingexperimental data from human cortical pyramidal cells withdetailed models of these same cells. Toward this end weintegrated in our detailed models a variety of properties of L2/L3pyramidal cells from human temporal cortex, including dendriticmorphology and physiology, dendritic spine anatomy, synapticproperties and somatic spiking characteristics. Our overarchingapproach provided several new insights on integrative propertiesof HL2/L3 PCs and on their computational capability.
Properties of Human L2/L3-L2/L3Excitatory SynapsesOur HL2/L3 PCs models predicted larger conductance of bothAMPA- and NMDA-receptors as compared to rodents. This isexpected as the spine head area is larger in human neurons(Benavides-Piccione et al., 2002; DeFelipe et al., 2002). In humanL2/L3 PCs, the average estimated AMPA conductance is ∼0.8nS per contact (Figures 1, 4 and Tables S1, S2) as compared to0.3–0.5 nS in rodents; the NMDA conductance is estimated tobe ∼1.3 nS per contact (Figure 4 and Table S2) as comparedto ∼0.4 nS in rodents (Sarid et al., 2007, 2013; Markram et al.,2015). We note that all the above estimates are based on theassumption that single axon connecting HL2/L3 neurons toeach other make, on average, 5 synaptic contacts, similar tothe case in rodents (Feldmeyer et al., 2002, 2006; Markramet al., 2015). This estimate requires further study. Still, the totalconductance for a HL2/L3-HL2/L3 PCs connection is abouttwice as strong, on average, than in the respective rodents’synapse.
We used cable theory and Rall’s “shape indices” (Rall,1967) to estimate the electrotonic locus of HL2/L3-HL2/L3PCs synapses. The fast rise-time and the relatively narrowhalf-width of the respective somatic EPSP indicated that theseconnections are made at the proximal dendrites (Figure 1), asindeed was further validated by the reconstruction of L2/L3-L2/L3 putative excitatory synapses (Figure S2). Similar findingshold for rodents as well, whereby connected pairs of L2/3PCs (as well as of L5 PCs), make proximal synapses witheach other (Markram et al., 1997a; Sarid et al., 2013). Wenote that our model predicts that the NMDA current isessentially not activated by a single HL2/L3-HL2/L3 synapse(Figure 5).
Dendritic NMDA Spikes in Human PCsNMDA conductance is voltage-dependent; the steepness ofthis dependency is determined mainly by the parameter γ
in Equation (6). Fitting the experimental data to the modelprovided an estimate of γ ∼0.075 (Figure 4 and Figure S5),which is larger (steeper voltage dependency) than in rodentspyramidal cells (Jahr and Stevens, 1990), implying that human
L2/L3 PC dendrites are prone to generating a local dendriticNMDA spike. Indeed, our model shows that, on average, about20 ± 10 simultaneously activated excitatory spinous synapses,stretched over 20µm of dendritic branch, are likely to ignitelarge and prolonged NMDA spikes (Figure 5). At distal dendriticterminal branches, due to their large input resistance (up to1G�), only 14 ± 8 synapses were required for generating anNMDA spike. Similar numbers of excitatory synapses wererequired for generating branch-specific NMDA spikes in modelsof rodents’ dendrites (Rhodes, 2006; Larkum et al., 2009; Farinellaet al., 2014). We conclude that human L2/L3 PC’s dendritesare prone to generating local NMDA spikes, both due tothe properties of the NMDA-conductance as well as due tothe low Cm and large Rm values in these cells (Eyal et al.,2016).
Models of Human Dendritic SpinesThis is the first study that models human dendritic spines.Toward this end, we employed a large data set of high-resolutionconfocal images and 3D reconstructions of dendritic spines fromHL2/L3 PCs (Figure 2 and Figure S3). From this data set weconstructed a prototypical human spine model to explore therange of EPSP values of axo-spinous synapses (Figures 2, 3)and to estimate the spine neck resistance. Activation of a singleaxo-spinous synapse generated an EPSP with peak voltage of12.7 ± 4.6mV in the spine head membrane, 9.7 ± 5.0mV atthe spine base and 0.3 ± 0.1mV at the soma. These valuesrepresent a mean attenuation ratio of ∼1.6 from the spine headto spine base and ∼120-fold attenuation from the spine headto the soma, which results from the extended cable structure ofhuman L2/L3 neurons (Mohan et al., 2015; Deitcher et al., 2017).The small Cm values of ∼ 0.5 µm2 in human neurons and thecorresponding large Rm value in these cells (Eyal et al., 2016)partially compensated for the otherwise even steeper dendriticattenuation.
The above value of the single axo-spinous EPSP relies on ourestimates of the spine neck resistance which, due to the relativelythick neck in human spines (∼ 0.25µm), was estimated to rangebetween 50 and 80M�. This estimate is based on the assumptionthat the specific axial resistivity of the spine neck is 200–300�cm,as was the value for the dendrites in our models), see Discussionin Eyal et al., 2016). It could be the case that, due to variousintracellular filaments/organelles in the spine neck, the effectiveaxial resistance is larger than assumed here. Small variations inthe spine neck diameter (e.g.,± 0.05µm) or in the axial resistivity(e.g., ±100 �cm) would lead to spine neck resistance rangingbetween 19 and 128 M� (Figure S4A).
Recent studies used a variety of methods to directly estimatethe spine neck resistance in rodents. These estimates varysignificantly between different groups, from around 50 M�
(Svoboda et al., 1996; Tønnesen et al., 2014; Popovic et al., 2015)to 0.5–3 G� (Palmer and Stuart, 2009; Harnett et al., 2012;Araya et al., 2014). Note a recent study by Kwon et al. (2017),with estimates of 101 ± 95 M� for the spine neck resistancein cultured hippocampal neurons from mice, using a voltageindicator and glutamate uncaging method.
Frontiers in Cellular Neuroscience | www.frontiersin.org 17 June 2018 | Volume 12 | Article 181
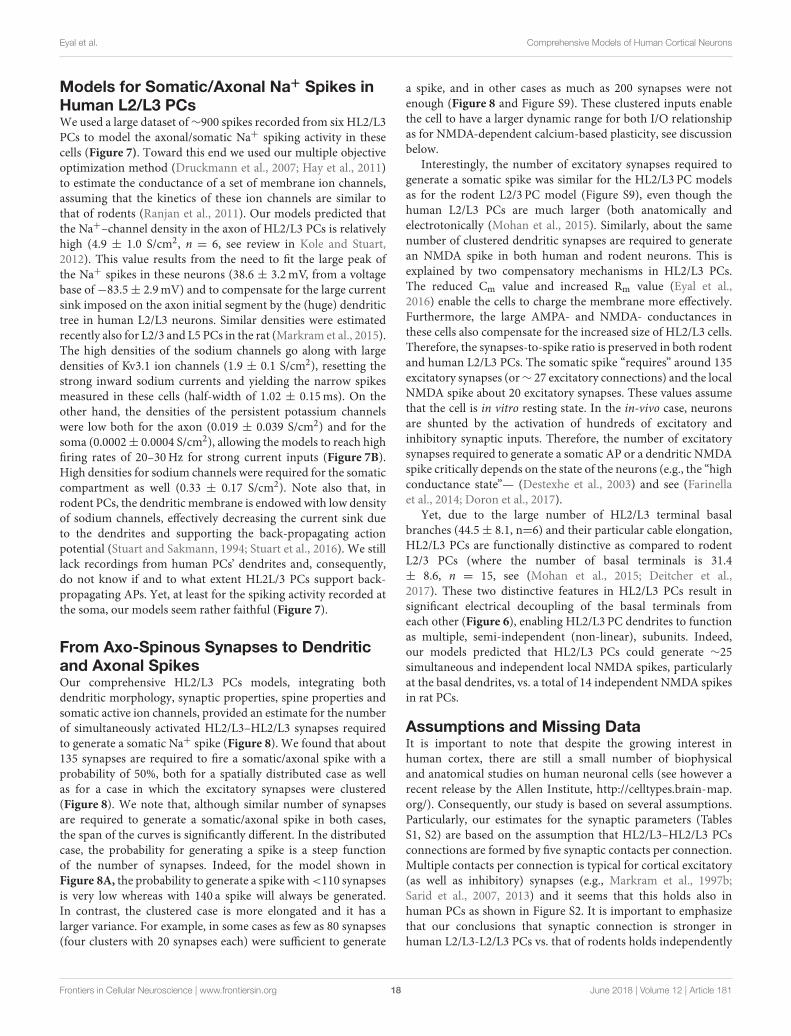
Eyal et al. Comprehensive Models of Human Cortical Neurons
Models for Somatic/Axonal Na+ Spikes inHuman L2/L3 PCsWe used a large dataset of∼900 spikes recorded from six HL2/L3PCs to model the axonal/somatic Na+ spiking activity in thesecells (Figure 7). Toward this end we used our multiple objectiveoptimization method (Druckmann et al., 2007; Hay et al., 2011)to estimate the conductance of a set of membrane ion channels,assuming that the kinetics of these ion channels are similar tothat of rodents (Ranjan et al., 2011). Our models predicted thatthe Na+–channel density in the axon of HL2/L3 PCs is relativelyhigh (4.9 ± 1.0 S/cm2, n = 6, see review in Kole and Stuart,2012). This value results from the need to fit the large peak ofthe Na+ spikes in these neurons (38.6 ± 3.2mV, from a voltagebase of−83.5± 2.9mV) and to compensate for the large currentsink imposed on the axon initial segment by the (huge) dendritictree in human L2/L3 neurons. Similar densities were estimatedrecently also for L2/3 and L5 PCs in the rat (Markram et al., 2015).The high densities of the sodium channels go along with largedensities of Kv3.1 ion channels (1.9 ± 0.1 S/cm2), resetting thestrong inward sodium currents and yielding the narrow spikesmeasured in these cells (half-width of 1.02 ± 0.15ms). On theother hand, the densities of the persistent potassium channelswere low both for the axon (0.019 ± 0.039 S/cm2) and for thesoma (0.0002± 0.0004 S/cm2), allowing the models to reach highfiring rates of 20–30Hz for strong current inputs (Figure 7B).High densities for sodium channels were required for the somaticcompartment as well (0.33 ± 0.17 S/cm2). Note also that, inrodent PCs, the dendritic membrane is endowed with low densityof sodium channels, effectively decreasing the current sink dueto the dendrites and supporting the back-propagating actionpotential (Stuart and Sakmann, 1994; Stuart et al., 2016). We stilllack recordings from human PCs’ dendrites and, consequently,do not know if and to what extent HL2L/3 PCs support back-propagating APs. Yet, at least for the spiking activity recorded atthe soma, our models seem rather faithful (Figure 7).
From Axo-Spinous Synapses to Dendriticand Axonal SpikesOur comprehensive HL2/L3 PCs models, integrating bothdendritic morphology, synaptic properties, spine properties andsomatic active ion channels, provided an estimate for the numberof simultaneously activated HL2/L3–HL2/L3 synapses requiredto generate a somatic Na+ spike (Figure 8). We found that about135 synapses are required to fire a somatic/axonal spike with aprobability of 50%, both for a spatially distributed case as wellas for a case in which the excitatory synapses were clustered(Figure 8). We note that, although similar number of synapsesare required to generate a somatic/axonal spike in both cases,the span of the curves is significantly different. In the distributedcase, the probability for generating a spike is a steep functionof the number of synapses. Indeed, for the model shown inFigure 8A, the probability to generate a spike with<110 synapsesis very low whereas with 140 a spike will always be generated.In contrast, the clustered case is more elongated and it has alarger variance. For example, in some cases as few as 80 synapses(four clusters with 20 synapses each) were sufficient to generate
a spike, and in other cases as much as 200 synapses were notenough (Figure 8 and Figure S9). These clustered inputs enablethe cell to have a larger dynamic range for both I/O relationshipas for NMDA-dependent calcium-based plasticity, see discussionbelow.
Interestingly, the number of excitatory synapses required togenerate a somatic spike was similar for the HL2/L3 PC modelsas for the rodent L2/3 PC model (Figure S9), even though thehuman L2/L3 PCs are much larger (both anatomically andelectrotonically (Mohan et al., 2015). Similarly, about the samenumber of clustered dendritic synapses are required to generatean NMDA spike in both human and rodent neurons. This isexplained by two compensatory mechanisms in HL2/L3 PCs.The reduced Cm value and increased Rm value (Eyal et al.,2016) enable the cells to charge the membrane more effectively.Furthermore, the large AMPA- and NMDA- conductances inthese cells also compensate for the increased size of HL2/L3 cells.Therefore, the synapses-to-spike ratio is preserved in both rodentand human L2/L3 PCs. The somatic spike “requires” around 135excitatory synapses (or∼ 27 excitatory connections) and the localNMDA spike about 20 excitatory synapses. These values assumethat the cell is in vitro resting state. In the in-vivo case, neuronsare shunted by the activation of hundreds of excitatory andinhibitory synaptic inputs. Therefore, the number of excitatorysynapses required to generate a somatic AP or a dendritic NMDAspike critically depends on the state of the neurons (e.g., the “highconductance state”— (Destexhe et al., 2003) and see (Farinellaet al., 2014; Doron et al., 2017).
Yet, due to the large number of HL2/L3 terminal basalbranches (44.5± 8.1, n=6) and their particular cable elongation,HL2/L3 PCs are functionally distinctive as compared to rodentL2/3 PCs (where the number of basal terminals is 31.4± 8.6, n = 15, see (Mohan et al., 2015; Deitcher et al.,2017). These two distinctive features in HL2/L3 PCs result insignificant electrical decoupling of the basal terminals fromeach other (Figure 6), enabling HL2/L3 PC dendrites to functionas multiple, semi-independent (non-linear), subunits. Indeed,our models predicted that HL2/L3 PCs could generate ∼25simultaneous and independent local NMDA spikes, particularlyat the basal dendrites, vs. a total of 14 independent NMDA spikesin rat PCs.
Assumptions and Missing DataIt is important to note that despite the growing interest inhuman cortex, there are still a small number of biophysicaland anatomical studies on human neuronal cells (see however arecent release by the Allen Institute, http://celltypes.brain-map.org/). Consequently, our study is based on several assumptions.Particularly, our estimates for the synaptic parameters (TablesS1, S2) are based on the assumption that HL2/L3–HL2/L3 PCsconnections are formed by five synaptic contacts per connection.Multiple contacts per connection is typical for cortical excitatory(as well as inhibitory) synapses (e.g., Markram et al., 1997b;Sarid et al., 2007, 2013) and it seems that this holds also inhuman PCs as shown in Figure S2. It is important to emphasizethat our conclusions that synaptic connection is stronger inhuman L2/L3-L2/L3 PCs vs. that of rodents holds independently
Frontiers in Cellular Neuroscience | www.frontiersin.org 18 June 2018 | Volume 12 | Article 181
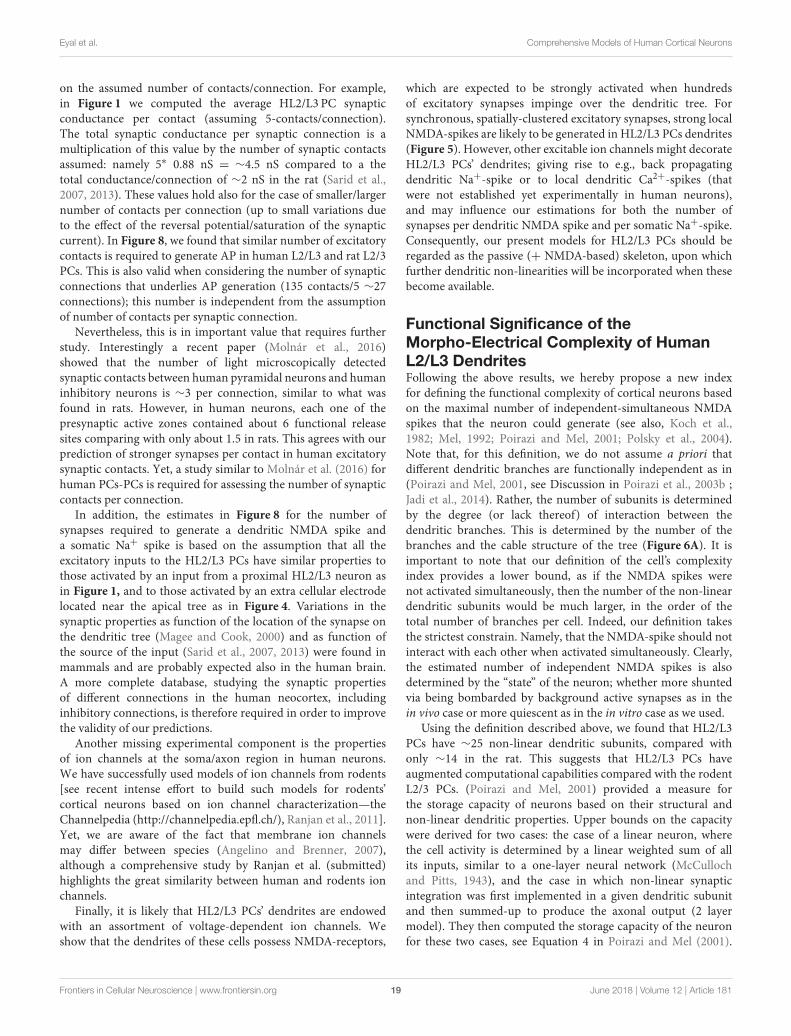
Eyal et al. Comprehensive Models of Human Cortical Neurons
on the assumed number of contacts/connection. For example,in Figure 1 we computed the average HL2/L3 PC synapticconductance per contact (assuming 5-contacts/connection).The total synaptic conductance per synaptic connection is amultiplication of this value by the number of synaptic contactsassumed: namely 5∗ 0.88 nS = ∼4.5 nS compared to a thetotal conductance/connection of ∼2 nS in the rat (Sarid et al.,2007, 2013). These values hold also for the case of smaller/largernumber of contacts per connection (up to small variations dueto the effect of the reversal potential/saturation of the synapticcurrent). In Figure 8, we found that similar number of excitatorycontacts is required to generate AP in human L2/L3 and rat L2/3PCs. This is also valid when considering the number of synapticconnections that underlies AP generation (135 contacts/5 ∼27connections); this number is independent from the assumptionof number of contacts per synaptic connection.
Nevertheless, this is in important value that requires furtherstudy. Interestingly a recent paper (Molnár et al., 2016)showed that the number of light microscopically detectedsynaptic contacts between human pyramidal neurons and humaninhibitory neurons is ∼3 per connection, similar to what wasfound in rats. However, in human neurons, each one of thepresynaptic active zones contained about 6 functional releasesites comparing with only about 1.5 in rats. This agrees with ourprediction of stronger synapses per contact in human excitatorysynaptic contacts. Yet, a study similar to Molnár et al. (2016) forhuman PCs-PCs is required for assessing the number of synapticcontacts per connection.
In addition, the estimates in Figure 8 for the number ofsynapses required to generate a dendritic NMDA spike anda somatic Na+ spike is based on the assumption that all theexcitatory inputs to the HL2/L3 PCs have similar properties tothose activated by an input from a proximal HL2/L3 neuron asin Figure 1, and to those activated by an extra cellular electrodelocated near the apical tree as in Figure 4. Variations in thesynaptic properties as function of the location of the synapse onthe dendritic tree (Magee and Cook, 2000) and as function ofthe source of the input (Sarid et al., 2007, 2013) were found inmammals and are probably expected also in the human brain.A more complete database, studying the synaptic propertiesof different connections in the human neocortex, includinginhibitory connections, is therefore required in order to improvethe validity of our predictions.
Another missing experimental component is the propertiesof ion channels at the soma/axon region in human neurons.We have successfully used models of ion channels from rodents[see recent intense effort to build such models for rodents’cortical neurons based on ion channel characterization—theChannelpedia (http://channelpedia.epfl.ch/), Ranjan et al., 2011].Yet, we are aware of the fact that membrane ion channelsmay differ between species (Angelino and Brenner, 2007),although a comprehensive study by Ranjan et al. (submitted)highlights the great similarity between human and rodents ionchannels.
Finally, it is likely that HL2/L3 PCs’ dendrites are endowedwith an assortment of voltage-dependent ion channels. Weshow that the dendrites of these cells possess NMDA-receptors,
which are expected to be strongly activated when hundredsof excitatory synapses impinge over the dendritic tree. Forsynchronous, spatially-clustered excitatory synapses, strong localNMDA-spikes are likely to be generated in HL2/L3 PCs dendrites(Figure 5). However, other excitable ion channels might decorateHL2/L3 PCs’ dendrites; giving rise to e.g., back propagatingdendritic Na+-spike or to local dendritic Ca2+-spikes (thatwere not established yet experimentally in human neurons),and may influence our estimations for both the number ofsynapses per dendritic NMDA spike and per somatic Na+-spike.Consequently, our present models for HL2/L3 PCs should beregarded as the passive (+ NMDA-based) skeleton, upon whichfurther dendritic non-linearities will be incorporated when thesebecome available.
Functional Significance of theMorpho-Electrical Complexity of HumanL2/L3 DendritesFollowing the above results, we hereby propose a new indexfor defining the functional complexity of cortical neurons basedon the maximal number of independent-simultaneous NMDAspikes that the neuron could generate (see also, Koch et al.,1982; Mel, 1992; Poirazi and Mel, 2001; Polsky et al., 2004).Note that, for this definition, we do not assume a priori thatdifferent dendritic branches are functionally independent as in(Poirazi and Mel, 2001, see Discussion in Poirazi et al., 2003b ;Jadi et al., 2014). Rather, the number of subunits is determinedby the degree (or lack thereof) of interaction between thedendritic branches. This is determined by the number of thebranches and the cable structure of the tree (Figure 6A). It isimportant to note that our definition of the cell’s complexityindex provides a lower bound, as if the NMDA spikes werenot activated simultaneously, then the number of the non-lineardendritic subunits would be much larger, in the order of thetotal number of branches per cell. Indeed, our definition takesthe strictest constrain. Namely, that the NMDA-spike should notinteract with each other when activated simultaneously. Clearly,the estimated number of independent NMDA spikes is alsodetermined by the “state” of the neuron; whether more shuntedvia being bombarded by background active synapses as in thein vivo case or more quiescent as in the in vitro case as we used.
Using the definition described above, we found that HL2/L3PCs have ∼25 non-linear dendritic subunits, compared withonly ∼14 in the rat. This suggests that HL2/L3 PCs haveaugmented computational capabilities compared with the rodentL2/3 PCs. (Poirazi and Mel, 2001) provided a measure forthe storage capacity of neurons based on their structural andnon-linear dendritic properties. Upper bounds on the capacitywere derived for two cases: the case of a linear neuron, wherethe cell activity is determined by a linear weighted sum of allits inputs, similar to a one-layer neural network (McCullochand Pitts, 1943), and the case in which non-linear synapticintegration was first implemented in a given dendritic subunitand then summed-up to produce the axonal output (2 layermodel). They then computed the storage capacity of the neuronfor these two cases, see Equation 4 in Poirazi and Mel (2001).
Frontiers in Cellular Neuroscience | www.frontiersin.org 19 June 2018 | Volume 12 | Article 181
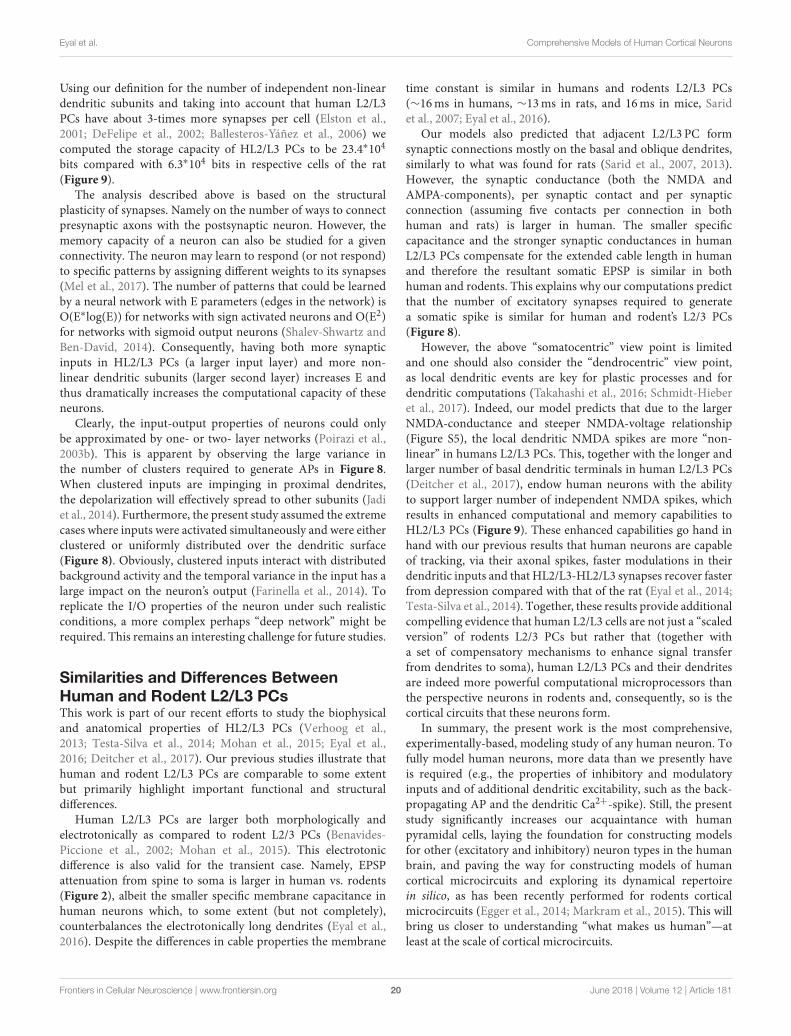
Eyal et al. Comprehensive Models of Human Cortical Neurons
Using our definition for the number of independent non-lineardendritic subunits and taking into account that human L2/L3PCs have about 3-times more synapses per cell (Elston et al.,2001; DeFelipe et al., 2002; Ballesteros-Yáñez et al., 2006) wecomputed the storage capacity of HL2/L3 PCs to be 23.4∗104
bits compared with 6.3∗104 bits in respective cells of the rat(Figure 9).
The analysis described above is based on the structuralplasticity of synapses. Namely on the number of ways to connectpresynaptic axons with the postsynaptic neuron. However, thememory capacity of a neuron can also be studied for a givenconnectivity. The neuron may learn to respond (or not respond)to specific patterns by assigning different weights to its synapses(Mel et al., 2017). The number of patterns that could be learnedby a neural network with E parameters (edges in the network) isO(E∗log(E)) for networks with sign activated neurons and O(E2)for networks with sigmoid output neurons (Shalev-Shwartz andBen-David, 2014). Consequently, having both more synapticinputs in HL2/L3 PCs (a larger input layer) and more non-linear dendritic subunits (larger second layer) increases E andthus dramatically increases the computational capacity of theseneurons.
Clearly, the input-output properties of neurons could onlybe approximated by one- or two- layer networks (Poirazi et al.,2003b). This is apparent by observing the large variance inthe number of clusters required to generate APs in Figure 8.When clustered inputs are impinging in proximal dendrites,the depolarization will effectively spread to other subunits (Jadiet al., 2014). Furthermore, the present study assumed the extremecases where inputs were activated simultaneously and were eitherclustered or uniformly distributed over the dendritic surface(Figure 8). Obviously, clustered inputs interact with distributedbackground activity and the temporal variance in the input has alarge impact on the neuron’s output (Farinella et al., 2014). Toreplicate the I/O properties of the neuron under such realisticconditions, a more complex perhaps “deep network” might berequired. This remains an interesting challenge for future studies.
Similarities and Differences BetweenHuman and Rodent L2/L3 PCsThis work is part of our recent efforts to study the biophysicaland anatomical properties of HL2/L3 PCs (Verhoog et al.,2013; Testa-Silva et al., 2014; Mohan et al., 2015; Eyal et al.,2016; Deitcher et al., 2017). Our previous studies illustrate thathuman and rodent L2/L3 PCs are comparable to some extentbut primarily highlight important functional and structuraldifferences.
Human L2/L3 PCs are larger both morphologically andelectrotonically as compared to rodent L2/3 PCs (Benavides-Piccione et al., 2002; Mohan et al., 2015). This electrotonicdifference is also valid for the transient case. Namely, EPSPattenuation from spine to soma is larger in human vs. rodents(Figure 2), albeit the smaller specific membrane capacitance inhuman neurons which, to some extent (but not completely),counterbalances the electrotonically long dendrites (Eyal et al.,2016). Despite the differences in cable properties the membrane
time constant is similar in humans and rodents L2/L3 PCs(∼16ms in humans, ∼13ms in rats, and 16ms in mice, Saridet al., 2007; Eyal et al., 2016).
Our models also predicted that adjacent L2/L3 PC formsynaptic connections mostly on the basal and oblique dendrites,similarly to what was found for rats (Sarid et al., 2007, 2013).However, the synaptic conductance (both the NMDA andAMPA-components), per synaptic contact and per synapticconnection (assuming five contacts per connection in bothhuman and rats) is larger in human. The smaller specificcapacitance and the stronger synaptic conductances in humanL2/L3 PCs compensate for the extended cable length in humanand therefore the resultant somatic EPSP is similar in bothhuman and rodents. This explains why our computations predictthat the number of excitatory synapses required to generatea somatic spike is similar for human and rodent’s L2/3 PCs(Figure 8).
However, the above “somatocentric” view point is limitedand one should also consider the “dendrocentric” view point,as local dendritic events are key for plastic processes and fordendritic computations (Takahashi et al., 2016; Schmidt-Hieberet al., 2017). Indeed, our model predicts that due to the largerNMDA-conductance and steeper NMDA-voltage relationship(Figure S5), the local dendritic NMDA spikes are more “non-linear” in humans L2/L3 PCs. This, together with the longer andlarger number of basal dendritic terminals in human L2/L3 PCs(Deitcher et al., 2017), endow human neurons with the abilityto support larger number of independent NMDA spikes, whichresults in enhanced computational and memory capabilities toHL2/L3 PCs (Figure 9). These enhanced capabilities go hand inhand with our previous results that human neurons are capableof tracking, via their axonal spikes, faster modulations in theirdendritic inputs and that HL2/L3-HL2/L3 synapses recover fasterfrom depression compared with that of the rat (Eyal et al., 2014;Testa-Silva et al., 2014). Together, these results provide additionalcompelling evidence that human L2/L3 cells are not just a “scaledversion” of rodents L2/3 PCs but rather that (together witha set of compensatory mechanisms to enhance signal transferfrom dendrites to soma), human L2/L3 PCs and their dendritesare indeed more powerful computational microprocessors thanthe perspective neurons in rodents and, consequently, so is thecortical circuits that these neurons form.
In summary, the present work is the most comprehensive,experimentally-based, modeling study of any human neuron. Tofully model human neurons, more data than we presently haveis required (e.g., the properties of inhibitory and modulatoryinputs and of additional dendritic excitability, such as the back-propagating AP and the dendritic Ca2+-spike). Still, the presentstudy significantly increases our acquaintance with humanpyramidal cells, laying the foundation for constructing modelsfor other (excitatory and inhibitory) neuron types in the humanbrain, and paving the way for constructing models of humancortical microcircuits and exploring its dynamical repertoirein silico, as has been recently performed for rodents corticalmicrocircuits (Egger et al., 2014; Markram et al., 2015). This willbring us closer to understanding “what makes us human”—atleast at the scale of cortical microcircuits.
Frontiers in Cellular Neuroscience | www.frontiersin.org 20 June 2018 | Volume 12 | Article 181
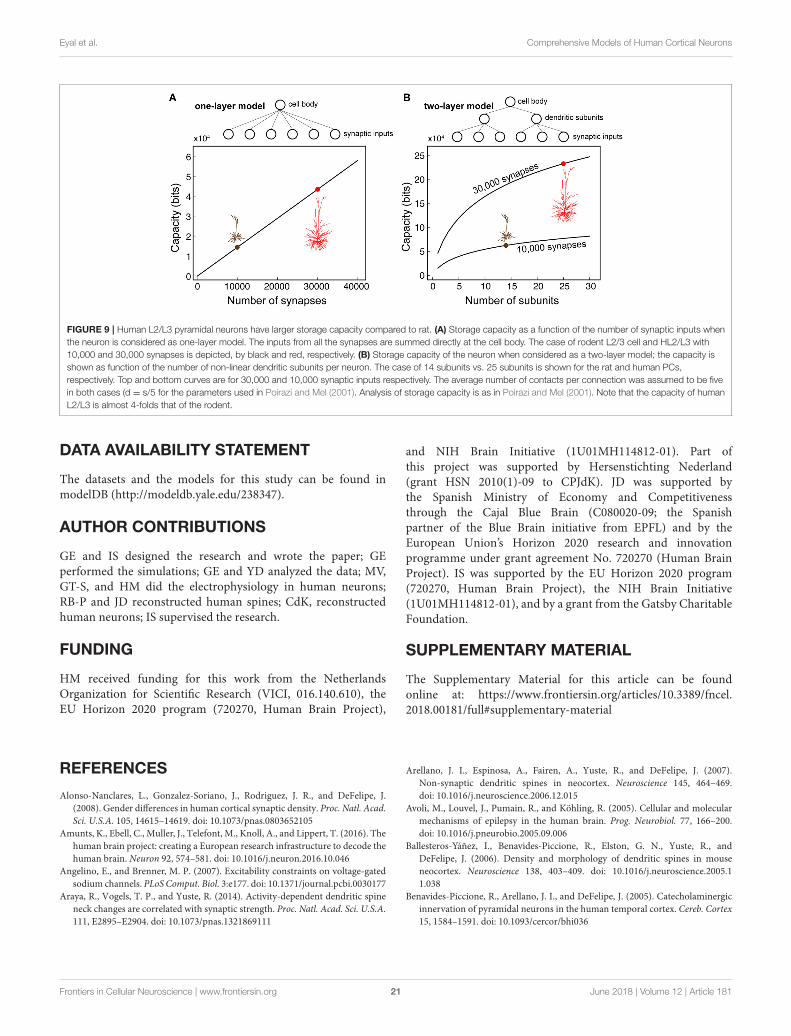
Eyal et al. Comprehensive Models of Human Cortical Neurons
FIGURE 9 | Human L2/L3 pyramidal neurons have larger storage capacity compared to rat. (A) Storage capacity as a function of the number of synaptic inputs when
the neuron is considered as one-layer model. The inputs from all the synapses are summed directly at the cell body. The case of rodent L2/3 cell and HL2/L3 with
10,000 and 30,000 synapses is depicted, by black and red, respectively. (B) Storage capacity of the neuron when considered as a two-layer model; the capacity is
shown as function of the number of non-linear dendritic subunits per neuron. The case of 14 subunits vs. 25 subunits is shown for the rat and human PCs,
respectively. Top and bottom curves are for 30,000 and 10,000 synaptic inputs respectively. The average number of contacts per connection was assumed to be five
in both cases (d = s/5 for the parameters used in Poirazi and Mel (2001). Analysis of storage capacity is as in Poirazi and Mel (2001). Note that the capacity of human
L2/L3 is almost 4-folds that of the rodent.
DATA AVAILABILITY STATEMENT
The datasets and the models for this study can be found inmodelDB (http://modeldb.yale.edu/238347).
AUTHOR CONTRIBUTIONS
GE and IS designed the research and wrote the paper; GEperformed the simulations; GE and YD analyzed the data; MV,GT-S, and HM did the electrophysiology in human neurons;RB-P and JD reconstructed human spines; CdK, reconstructedhuman neurons; IS supervised the research.
FUNDING
HM received funding for this work from the NetherlandsOrganization for Scientific Research (VICI, 016.140.610), theEU Horizon 2020 program (720270, Human Brain Project),
and NIH Brain Initiative (1U01MH114812-01). Part ofthis project was supported by Hersenstichting Nederland(grant HSN 2010(1)-09 to CPJdK). JD was supported bythe Spanish Ministry of Economy and Competitivenessthrough the Cajal Blue Brain (C080020-09; the Spanishpartner of the Blue Brain initiative from EPFL) and by theEuropean Union’s Horizon 2020 research and innovationprogramme under grant agreement No. 720270 (Human BrainProject). IS was supported by the EU Horizon 2020 program(720270, Human Brain Project), the NIH Brain Initiative(1U01MH114812-01), and by a grant from the Gatsby CharitableFoundation.
SUPPLEMENTARY MATERIAL
The Supplementary Material for this article can be foundonline at: https://www.frontiersin.org/articles/10.3389/fncel.2018.00181/full#supplementary-material
REFERENCES
Alonso-Nanclares, L., Gonzalez-Soriano, J., Rodriguez, J. R., and DeFelipe, J.(2008). Gender differences in human cortical synaptic density. Proc. Natl. Acad.Sci. U.S.A. 105, 14615–14619. doi: 10.1073/pnas.0803652105
Amunts, K., Ebell, C., Muller, J., Telefont, M., Knoll, A., and Lippert, T. (2016). Thehuman brain project: creating a European research infrastructure to decode thehuman brain. Neuron 92, 574–581. doi: 10.1016/j.neuron.2016.10.046
Angelino, E., and Brenner, M. P. (2007). Excitability constraints on voltage-gatedsodium channels. PLoS Comput. Biol. 3:e177. doi: 10.1371/journal.pcbi.0030177
Araya, R., Vogels, T. P., and Yuste, R. (2014). Activity-dependent dendritic spineneck changes are correlated with synaptic strength. Proc. Natl. Acad. Sci. U.S.A.111, E2895–E2904. doi: 10.1073/pnas.1321869111
Arellano, J. I., Espinosa, A., Fairen, A., Yuste, R., and DeFelipe, J. (2007).Non-synaptic dendritic spines in neocortex. Neuroscience 145, 464–469.doi: 10.1016/j.neuroscience.2006.12.015
Avoli, M., Louvel, J., Pumain, R., and Köhling, R. (2005). Cellular and molecularmechanisms of epilepsy in the human brain. Prog. Neurobiol. 77, 166–200.doi: 10.1016/j.pneurobio.2005.09.006
Ballesteros-Yáñez, I., Benavides-Piccione, R., Elston, G. N., Yuste, R., andDeFelipe, J. (2006). Density and morphology of dendritic spines in mouseneocortex. Neuroscience 138, 403–409. doi: 10.1016/j.neuroscience.2005.11.038
Benavides-Piccione, R., Arellano, J. I., and DeFelipe, J. (2005). Catecholaminergicinnervation of pyramidal neurons in the human temporal cortex. Cereb. Cortex15, 1584–1591. doi: 10.1093/cercor/bhi036
Frontiers in Cellular Neuroscience | www.frontiersin.org 21 June 2018 | Volume 12 | Article 181
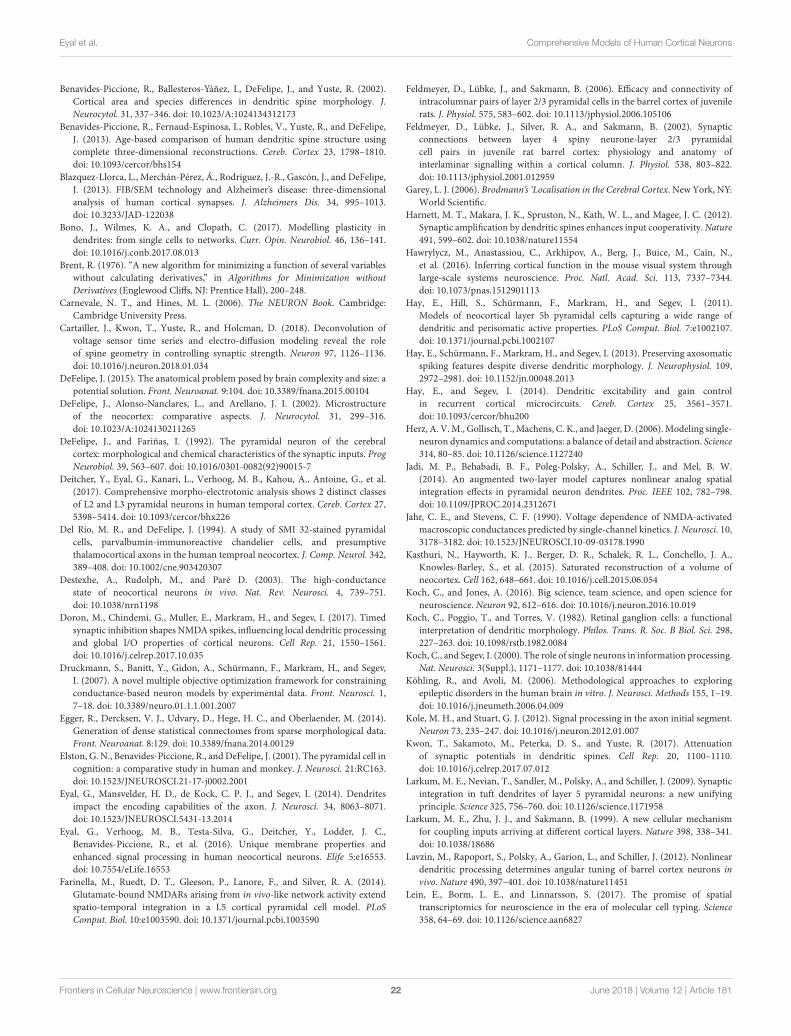
Eyal et al. Comprehensive Models of Human Cortical Neurons
Benavides-Piccione, R., Ballesteros-Yáñez, I., DeFelipe, J., and Yuste, R. (2002).Cortical area and species differences in dendritic spine morphology. J.
Neurocytol. 31, 337–346. doi: 10.1023/A:1024134312173Benavides-Piccione, R., Fernaud-Espinosa, I., Robles, V., Yuste, R., and DeFelipe,
J. (2013). Age-based comparison of human dendritic spine structure usingcomplete three-dimensional reconstructions. Cereb. Cortex 23, 1798–1810.doi: 10.1093/cercor/bhs154
Blazquez-Llorca, L., Merchán-Pérez, Á., Rodríguez, J.-R., Gascón, J., and DeFelipe,J. (2013). FIB/SEM technology and Alzheimer’s disease: three-dimensionalanalysis of human cortical synapses. J. Alzheimers Dis. 34, 995–1013.doi: 10.3233/JAD-122038
Bono, J., Wilmes, K. A., and Clopath, C. (2017). Modelling plasticity indendrites: from single cells to networks. Curr. Opin. Neurobiol. 46, 136–141.doi: 10.1016/j.conb.2017.08.013
Brent, R. (1976). “A new algorithm for minimizing a function of several variableswithout calculating derivatives,” in Algorithms for Minimization without
Derivatives (Englewood Cliffs, NJ: Prentice Hall), 200–248.Carnevale, N. T., and Hines, M. L. (2006). The NEURON Book. Cambridge:
Cambridge University Press.Cartailler, J., Kwon, T., Yuste, R., and Holcman, D. (2018). Deconvolution of
voltage sensor time series and electro-diffusion modeling reveal the roleof spine geometry in controlling synaptic strength. Neuron 97, 1126–1136.doi: 10.1016/j.neuron.2018.01.034
DeFelipe, J. (2015). The anatomical problem posed by brain complexity and size: apotential solution. Front. Neuroanat. 9:104. doi: 10.3389/fnana.2015.00104
DeFelipe, J., Alonso-Nanclares, L., and Arellano, J. I. (2002). Microstructureof the neocortex: comparative aspects. J. Neurocytol. 31, 299–316.doi: 10.1023/A:1024130211265
DeFelipe, J., and Fariñas, I. (1992). The pyramidal neuron of the cerebralcortex: morphological and chemical characteristics of the synaptic inputs. ProgNeurobiol. 39, 563–607. doi: 10.1016/0301-0082(92)90015-7
Deitcher, Y., Eyal, G., Kanari, L., Verhoog, M. B., Kahou, A., Antoine, G., et al.(2017). Comprehensive morpho-electrotonic analysis shows 2 distinct classesof L2 and L3 pyramidal neurons in human temporal cortex. Cereb. Cortex 27,5398–5414. doi: 10.1093/cercor/bhx226
Del Río, M. R., and DeFelipe, J. (1994). A study of SMI 32-stained pyramidalcells, parvalbumin-immunoreactive chandelier cells, and presumptivethalamocortical axons in the human temproal neocortex. J. Comp. Neurol. 342,389–408. doi: 10.1002/cne.903420307
Destexhe, A., Rudolph, M., and Paré D. (2003). The high-conductancestate of neocortical neurons in vivo. Nat. Rev. Neurosci. 4, 739–751.doi: 10.1038/nrn1198
Doron, M., Chindemi, G., Muller, E., Markram, H., and Segev, I. (2017). Timedsynaptic inhibition shapes NMDA spikes, influencing local dendritic processingand global I/O properties of cortical neurons. Cell Rep. 21, 1550–1561.doi: 10.1016/j.celrep.2017.10.035
Druckmann, S., Banitt, Y., Gidon, A., Schürmann, F., Markram, H., and Segev,I. (2007). A novel multiple objective optimization framework for constrainingconductance-based neuron models by experimental data. Front. Neurosci. 1,7–18. doi: 10.3389/neuro.01.1.1.001.2007
Egger, R., Dercksen, V. J., Udvary, D., Hege, H. C., and Oberlaender, M. (2014).Generation of dense statistical connectomes from sparse morphological data.Front. Neuroanat. 8:129. doi: 10.3389/fnana.2014.00129
Elston, G. N., Benavides-Piccione, R., and DeFelipe, J. (2001). The pyramidal cell incognition: a comparative study in human and monkey. J. Neurosci. 21:RC163.doi: 10.1523/JNEUROSCI.21-17-j0002.2001
Eyal, G., Mansvelder, H. D., de Kock, C. P. J., and Segev, I. (2014). Dendritesimpact the encoding capabilities of the axon. J. Neurosci. 34, 8063–8071.doi: 10.1523/JNEUROSCI.5431-13.2014
Eyal, G., Verhoog, M. B., Testa-Silva, G., Deitcher, Y., Lodder, J. C.,Benavides-Piccione, R., et al. (2016). Unique membrane properties andenhanced signal processing in human neocortical neurons. Elife 5:e16553.doi: 10.7554/eLife.16553
Farinella, M., Ruedt, D. T., Gleeson, P., Lanore, F., and Silver, R. A. (2014).Glutamate-bound NMDARs arising from in vivo-like network activity extendspatio-temporal integration in a L5 cortical pyramidal cell model. PLoS
Comput. Biol. 10:e1003590. doi: 10.1371/journal.pcbi.1003590
Feldmeyer, D., Lübke, J., and Sakmann, B. (2006). Efficacy and connectivity ofintracolumnar pairs of layer 2/3 pyramidal cells in the barrel cortex of juvenilerats. J. Physiol. 575, 583–602. doi: 10.1113/jphysiol.2006.105106
Feldmeyer, D., Lübke, J., Silver, R. A., and Sakmann, B. (2002). Synapticconnections between layer 4 spiny neurone-layer 2/3 pyramidalcell pairs in juvenile rat barrel cortex: physiology and anatomy ofinterlaminar signalling within a cortical column. J. Physiol. 538, 803–822.doi: 10.1113/jphysiol.2001.012959
Garey, L. J. (2006). Brodmann’s ‘Localisation in the Cerebral Cortex. New York, NY:World Scientific.
Harnett, M. T., Makara, J. K., Spruston, N., Kath, W. L., and Magee, J. C. (2012).Synaptic amplification by dendritic spines enhances input cooperativity.Nature491, 599–602. doi: 10.1038/nature11554
Hawrylycz, M., Anastassiou, C., Arkhipov, A., Berg, J., Buice, M., Cain, N.,et al. (2016). Inferring cortical function in the mouse visual system throughlarge-scale systems neuroscience. Proc. Natl. Acad. Sci. 113, 7337–7344.doi: 10.1073/pnas.1512901113
Hay, E., Hill, S., Schürmann, F., Markram, H., and Segev, I. (2011).Models of neocortical layer 5b pyramidal cells capturing a wide range ofdendritic and perisomatic active properties. PLoS Comput. Biol. 7:e1002107.doi: 10.1371/journal.pcbi.1002107
Hay, E., Schürmann, F., Markram, H., and Segev, I. (2013). Preserving axosomaticspiking features despite diverse dendritic morphology. J. Neurophysiol. 109,2972–2981. doi: 10.1152/jn.00048.2013
Hay, E., and Segev, I. (2014). Dendritic excitability and gain controlin recurrent cortical microcircuits. Cereb. Cortex 25, 3561–3571.doi: 10.1093/cercor/bhu200
Herz, A. V.M., Gollisch, T.,Machens, C. K., and Jaeger, D. (2006).Modeling single-neuron dynamics and computations: a balance of detail and abstraction. Science314, 80–85. doi: 10.1126/science.1127240
Jadi, M. P., Behabadi, B. F., Poleg-Polsky, A., Schiller, J., and Mel, B. W.(2014). An augmented two-layer model captures nonlinear analog spatialintegration effects in pyramidal neuron dendrites. Proc. IEEE 102, 782–798.doi: 10.1109/JPROC.2014.2312671
Jahr, C. E., and Stevens, C. F. (1990). Voltage dependence of NMDA-activatedmacroscopic conductances predicted by single-channel kinetics. J. Neurosci. 10,3178–3182. doi: 10.1523/JNEUROSCI.10-09-03178.1990
Kasthuri, N., Hayworth, K. J., Berger, D. R., Schalek, R. L., Conchello, J. A.,Knowles-Barley, S., et al. (2015). Saturated reconstruction of a volume ofneocortex. Cell 162, 648–661. doi: 10.1016/j.cell.2015.06.054
Koch, C., and Jones, A. (2016). Big science, team science, and open science forneuroscience. Neuron 92, 612–616. doi: 10.1016/j.neuron.2016.10.019
Koch, C., Poggio, T., and Torres, V. (1982). Retinal ganglion cells: a functionalinterpretation of dendritic morphology. Philos. Trans. R. Soc. B Biol. Sci. 298,227–263. doi: 10.1098/rstb.1982.0084
Koch, C., and Segev, I. (2000). The role of single neurons in information processing.Nat. Neurosci. 3(Suppl.), 1171–1177. doi: 10.1038/81444
Köhling, R., and Avoli, M. (2006). Methodological approaches to exploringepileptic disorders in the human brain in vitro. J. Neurosci. Methods 155, 1–19.doi: 10.1016/j.jneumeth.2006.04.009
Kole, M. H., and Stuart, G. J. (2012). Signal processing in the axon initial segment.Neuron 73, 235–247. doi: 10.1016/j.neuron.2012.01.007
Kwon, T., Sakamoto, M., Peterka, D. S., and Yuste, R. (2017). Attenuationof synaptic potentials in dendritic spines. Cell Rep. 20, 1100–1110.doi: 10.1016/j.celrep.2017.07.012
Larkum, M. E., Nevian, T., Sandler, M., Polsky, A., and Schiller, J. (2009). Synapticintegration in tuft dendrites of layer 5 pyramidal neurons: a new unifyingprinciple. Science 325, 756–760. doi: 10.1126/science.1171958
Larkum, M. E., Zhu, J. J., and Sakmann, B. (1999). A new cellular mechanismfor coupling inputs arriving at different cortical layers. Nature 398, 338–341.doi: 10.1038/18686
Lavzin, M., Rapoport, S., Polsky, A., Garion, L., and Schiller, J. (2012). Nonlineardendritic processing determines angular tuning of barrel cortex neurons in
vivo. Nature 490, 397–401. doi: 10.1038/nature11451Lein, E., Borm, L. E., and Linnarsson, S. (2017). The promise of spatial
transcriptomics for neuroscience in the era of molecular cell typing. Science358, 64–69. doi: 10.1126/science.aan6827
Frontiers in Cellular Neuroscience | www.frontiersin.org 22 June 2018 | Volume 12 | Article 181
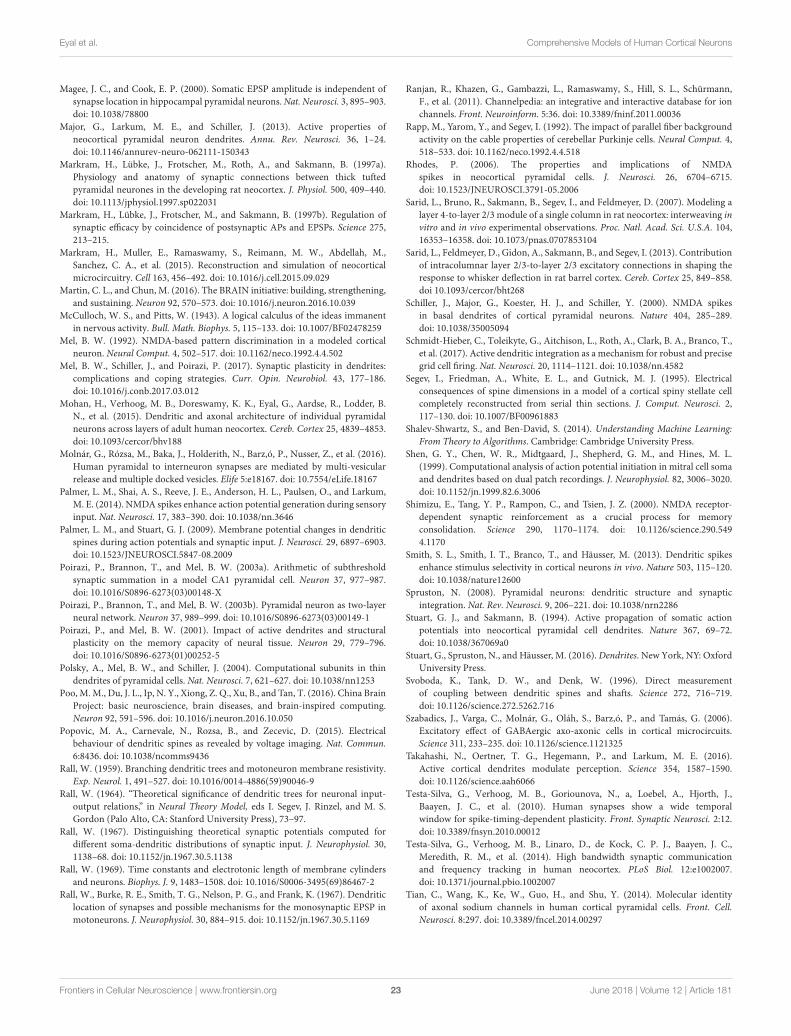
Eyal et al. Comprehensive Models of Human Cortical Neurons
Magee, J. C., and Cook, E. P. (2000). Somatic EPSP amplitude is independent ofsynapse location in hippocampal pyramidal neurons.Nat. Neurosci. 3, 895–903.doi: 10.1038/78800
Major, G., Larkum, M. E., and Schiller, J. (2013). Active properties ofneocortical pyramidal neuron dendrites. Annu. Rev. Neurosci. 36, 1–24.doi: 10.1146/annurev-neuro-062111-150343
Markram, H., Lübke, J., Frotscher, M., Roth, A., and Sakmann, B. (1997a).Physiology and anatomy of synaptic connections between thick tuftedpyramidal neurones in the developing rat neocortex. J. Physiol. 500, 409–440.doi: 10.1113/jphysiol.1997.sp022031
Markram, H., Lübke, J., Frotscher, M., and Sakmann, B. (1997b). Regulation ofsynaptic efficacy by coincidence of postsynaptic APs and EPSPs. Science 275,213–215.
Markram, H., Muller, E., Ramaswamy, S., Reimann, M. W., Abdellah, M.,Sanchez, C. A., et al. (2015). Reconstruction and simulation of neocorticalmicrocircuitry. Cell 163, 456–492. doi: 10.1016/j.cell.2015.09.029
Martin, C. L., and Chun, M. (2016). The BRAIN initiative: building, strengthening,and sustaining. Neuron 92, 570–573. doi: 10.1016/j.neuron.2016.10.039
McCulloch, W. S., and Pitts, W. (1943). A logical calculus of the ideas immanentin nervous activity. Bull. Math. Biophys. 5, 115–133. doi: 10.1007/BF02478259
Mel, B. W. (1992). NMDA-based pattern discrimination in a modeled corticalneuron. Neural Comput. 4, 502–517. doi: 10.1162/neco.1992.4.4.502
Mel, B. W., Schiller, J., and Poirazi, P. (2017). Synaptic plasticity in dendrites:complications and coping strategies. Curr. Opin. Neurobiol. 43, 177–186.doi: 10.1016/j.conb.2017.03.012
Mohan, H., Verhoog, M. B., Doreswamy, K. K., Eyal, G., Aardse, R., Lodder, B.N., et al. (2015). Dendritic and axonal architecture of individual pyramidalneurons across layers of adult human neocortex. Cereb. Cortex 25, 4839–4853.doi: 10.1093/cercor/bhv188
Molnár, G., Rózsa, M., Baka, J., Holderith, N., Barz,ó, P., Nusser, Z., et al. (2016).Human pyramidal to interneuron synapses are mediated by multi-vesicularrelease and multiple docked vesicles. Elife 5:e18167. doi: 10.7554/eLife.18167
Palmer, L. M., Shai, A. S., Reeve, J. E., Anderson, H. L., Paulsen, O., and Larkum,M. E. (2014). NMDA spikes enhance action potential generation during sensoryinput. Nat. Neurosci. 17, 383–390. doi: 10.1038/nn.3646
Palmer, L. M., and Stuart, G. J. (2009). Membrane potential changes in dendriticspines during action potentials and synaptic input. J. Neurosci. 29, 6897–6903.doi: 10.1523/JNEUROSCI.5847-08.2009
Poirazi, P., Brannon, T., and Mel, B. W. (2003a). Arithmetic of subthresholdsynaptic summation in a model CA1 pyramidal cell. Neuron 37, 977–987.doi: 10.1016/S0896-6273(03)00148-X
Poirazi, P., Brannon, T., and Mel, B. W. (2003b). Pyramidal neuron as two-layerneural network. Neuron 37, 989–999. doi: 10.1016/S0896-6273(03)00149-1
Poirazi, P., and Mel, B. W. (2001). Impact of active dendrites and structuralplasticity on the memory capacity of neural tissue. Neuron 29, 779–796.doi: 10.1016/S0896-6273(01)00252-5
Polsky, A., Mel, B. W., and Schiller, J. (2004). Computational subunits in thindendrites of pyramidal cells. Nat. Neurosci. 7, 621–627. doi: 10.1038/nn1253
Poo, M.M., Du, J. L., Ip, N. Y., Xiong, Z. Q., Xu, B., and Tan, T. (2016). China BrainProject: basic neuroscience, brain diseases, and brain-inspired computing.Neuron 92, 591–596. doi: 10.1016/j.neuron.2016.10.050
Popovic, M. A., Carnevale, N., Rozsa, B., and Zecevic, D. (2015). Electricalbehaviour of dendritic spines as revealed by voltage imaging. Nat. Commun.
6:8436. doi: 10.1038/ncomms9436Rall, W. (1959). Branching dendritic trees and motoneuron membrane resistivity.
Exp. Neurol. 1, 491–527. doi: 10.1016/0014-4886(59)90046-9Rall, W. (1964). “Theoretical significance of dendritic trees for neuronal input-
output relations,” in Neural Theory Model, eds I. Segev, J. Rinzel, and M. S.Gordon (Palo Alto, CA: Stanford University Press), 73–97.
Rall, W. (1967). Distinguishing theoretical synaptic potentials computed fordifferent soma-dendritic distributions of synaptic input. J. Neurophysiol. 30,1138–68. doi: 10.1152/jn.1967.30.5.1138
Rall, W. (1969). Time constants and electrotonic length of membrane cylindersand neurons. Biophys. J. 9, 1483–1508. doi: 10.1016/S0006-3495(69)86467-2
Rall, W., Burke, R. E., Smith, T. G., Nelson, P. G., and Frank, K. (1967). Dendriticlocation of synapses and possible mechanisms for the monosynaptic EPSP inmotoneurons. J. Neurophysiol. 30, 884–915. doi: 10.1152/jn.1967.30.5.1169
Ranjan, R., Khazen, G., Gambazzi, L., Ramaswamy, S., Hill, S. L., Schürmann,F., et al. (2011). Channelpedia: an integrative and interactive database for ionchannels. Front. Neuroinform. 5:36. doi: 10.3389/fninf.2011.00036
Rapp, M., Yarom, Y., and Segev, I. (1992). The impact of parallel fiber backgroundactivity on the cable properties of cerebellar Purkinje cells. Neural Comput. 4,518–533. doi: 10.1162/neco.1992.4.4.518
Rhodes, P. (2006). The properties and implications of NMDAspikes in neocortical pyramidal cells. J. Neurosci. 26, 6704–6715.doi: 10.1523/JNEUROSCI.3791-05.2006
Sarid, L., Bruno, R., Sakmann, B., Segev, I., and Feldmeyer, D. (2007). Modeling alayer 4-to-layer 2/3 module of a single column in rat neocortex: interweaving invitro and in vivo experimental observations. Proc. Natl. Acad. Sci. U.S.A. 104,16353–16358. doi: 10.1073/pnas.0707853104
Sarid, L., Feldmeyer, D., Gidon, A., Sakmann, B., and Segev, I. (2013). Contributionof intracolumnar layer 2/3-to-layer 2/3 excitatory connections in shaping theresponse to whisker deflection in rat barrel cortex. Cereb. Cortex 25, 849–858.doi 10.1093/cercor/bht268
Schiller, J., Major, G., Koester, H. J., and Schiller, Y. (2000). NMDA spikesin basal dendrites of cortical pyramidal neurons. Nature 404, 285–289.doi: 10.1038/35005094
Schmidt-Hieber, C., Toleikyte, G., Aitchison, L., Roth, A., Clark, B. A., Branco, T.,et al. (2017). Active dendritic integration as a mechanism for robust and precisegrid cell firing. Nat. Neurosci. 20, 1114–1121. doi: 10.1038/nn.4582
Segev, I., Friedman, A., White, E. L., and Gutnick, M. J. (1995). Electricalconsequences of spine dimensions in a model of a cortical spiny stellate cellcompletely reconstructed from serial thin sections. J. Comput. Neurosci. 2,117–130. doi: 10.1007/BF00961883
Shalev-Shwartz, S., and Ben-David, S. (2014). Understanding Machine Learning:
From Theory to Algorithms. Cambridge: Cambridge University Press.Shen, G. Y., Chen, W. R., Midtgaard, J., Shepherd, G. M., and Hines, M. L.
(1999). Computational analysis of action potential initiation in mitral cell somaand dendrites based on dual patch recordings. J. Neurophysiol. 82, 3006–3020.doi: 10.1152/jn.1999.82.6.3006
Shimizu, E., Tang, Y. P., Rampon, C., and Tsien, J. Z. (2000). NMDA receptor-dependent synaptic reinforcement as a crucial process for memoryconsolidation. Science 290, 1170–1174. doi: 10.1126/science.290.5494.1170
Smith, S. L., Smith, I. T., Branco, T., and Häusser, M. (2013). Dendritic spikesenhance stimulus selectivity in cortical neurons in vivo. Nature 503, 115–120.doi: 10.1038/nature12600
Spruston, N. (2008). Pyramidal neurons: dendritic structure and synapticintegration. Nat. Rev. Neurosci. 9, 206–221. doi: 10.1038/nrn2286
Stuart, G. J., and Sakmann, B. (1994). Active propagation of somatic actionpotentials into neocortical pyramidal cell dendrites. Nature 367, 69–72.doi: 10.1038/367069a0
Stuart, G., Spruston, N., and Häusser, M. (2016).Dendrites. New York, NY: OxfordUniversity Press.
Svoboda, K., Tank, D. W., and Denk, W. (1996). Direct measurementof coupling between dendritic spines and shafts. Science 272, 716–719.doi: 10.1126/science.272.5262.716
Szabadics, J., Varga, C., Molnár, G., Oláh, S., Barz,ó, P., and Tamás, G. (2006).Excitatory effect of GABAergic axo-axonic cells in cortical microcircuits.Science 311, 233–235. doi: 10.1126/science.1121325
Takahashi, N., Oertner, T. G., Hegemann, P., and Larkum, M. E. (2016).Active cortical dendrites modulate perception. Science 354, 1587–1590.doi: 10.1126/science.aah6066
Testa-Silva, G., Verhoog, M. B., Goriounova, N., a, Loebel, A., Hjorth, J.,Baayen, J. C., et al. (2010). Human synapses show a wide temporalwindow for spike-timing-dependent plasticity. Front. Synaptic Neurosci. 2:12.doi: 10.3389/fnsyn.2010.00012
Testa-Silva, G., Verhoog, M. B., Linaro, D., de Kock, C. P. J., Baayen, J. C.,Meredith, R. M., et al. (2014). High bandwidth synaptic communicationand frequency tracking in human neocortex. PLoS Biol. 12:e1002007.doi: 10.1371/journal.pbio.1002007
Tian, C., Wang, K., Ke, W., Guo, H., and Shu, Y. (2014). Molecular identityof axonal sodium channels in human cortical pyramidal cells. Front. Cell.Neurosci. 8:297. doi: 10.3389/fncel.2014.00297
Frontiers in Cellular Neuroscience | www.frontiersin.org 23 June 2018 | Volume 12 | Article 181
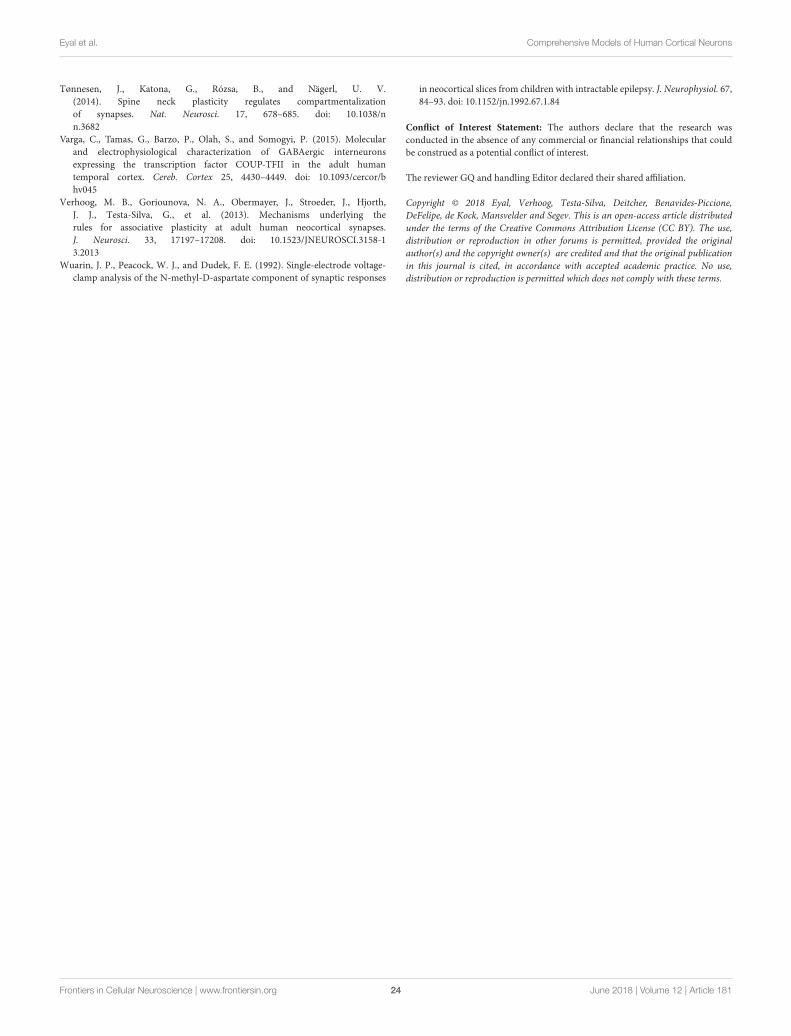
Eyal et al. Comprehensive Models of Human Cortical Neurons
Tønnesen, J., Katona, G., Rózsa, B., and Nägerl, U. V.(2014). Spine neck plasticity regulates compartmentalizationof synapses. Nat. Neurosci. 17, 678–685. doi: 10.1038/nn.3682
Varga, C., Tamas, G., Barzo, P., Olah, S., and Somogyi, P. (2015). Molecularand electrophysiological characterization of GABAergic interneuronsexpressing the transcription factor COUP-TFII in the adult humantemporal cortex. Cereb. Cortex 25, 4430–4449. doi: 10.1093/cercor/bhv045
Verhoog, M. B., Goriounova, N. A., Obermayer, J., Stroeder, J., Hjorth,J. J., Testa-Silva, G., et al. (2013). Mechanisms underlying therules for associative plasticity at adult human neocortical synapses.J. Neurosci. 33, 17197–17208. doi: 10.1523/JNEUROSCI.3158-13.2013
Wuarin, J. P., Peacock, W. J., and Dudek, F. E. (1992). Single-electrode voltage-clamp analysis of the N-methyl-D-aspartate component of synaptic responses
in neocortical slices from children with intractable epilepsy. J. Neurophysiol. 67,84–93. doi: 10.1152/jn.1992.67.1.84
Conflict of Interest Statement: The authors declare that the research wasconducted in the absence of any commercial or financial relationships that couldbe construed as a potential conflict of interest.
The reviewer GQ and handling Editor declared their shared affiliation.
Copyright © 2018 Eyal, Verhoog, Testa-Silva, Deitcher, Benavides-Piccione,
DeFelipe, de Kock, Mansvelder and Segev. This is an open-access article distributed
under the terms of the Creative Commons Attribution License (CC BY). The use,
distribution or reproduction in other forums is permitted, provided the original
author(s) and the copyright owner(s) are credited and that the original publication
in this journal is cited, in accordance with accepted academic practice. No use,
distribution or reproduction is permitted which does not comply with these terms.
Frontiers in Cellular Neuroscience | www.frontiersin.org 24 June 2018 | Volume 12 | Article 181