Embed Size (px)
Citation preview

Vol:.(1234567890)
Journal of Asset Management (2021) 22:360–375https://doi.org/10.1057/s41260-021-00228-y
ORIGINAL ARTICLE
Human capital efficiency, performance, market, and volatility timing of asian equity funds during COVID‑19 outbreak
Jamila Abaidi Hasnaoui1 · Syed Kumail Abbas Rizvi3 · Krishna Reddy2 · Nawazish Mirza1 · Bushra Naqvi3
Revised: 18 May 2021 / Accepted: 17 June 2021 / Published online: 6 July 2021 © The Author(s), under exclusive licence to Springer Nature Limited 2021
AbstractDespite its relevance for financial services, the impact of human capital efficiency on mutual fund performance has remained unexplored. In this paper, we attempt to explore this gap in the context of the outbreak of COVID-19 that provides us a unique opportunity to assess human capital’s importance during economic pressures. We employ data on 2044 equity funds across sixteen COVID-19 affected Asian countries to analyze the performance, market, and volatility timing after sorting these funds as per their human capital efficiency. Our results show that funds with better human capital efficiency outperform their counterparts that rank lower on human capital efficiency. The outperformance as measured by adjusted Sharpe and Sortino’s ratios, Jensen’s alpha, stochastic dominance, market, and volatility timing remained consistent for the pre-COVID period as well as through the outbreak during which the impact of human capital efficiency became even more significant. These findings have important strategic implications for mutual funds.
Keywords COVID-19 · Equity funds · Human capital efficiency
JEL Classification G01 · G10 · G11 · G20
Introduction
In financial services, the role of intellectual and human capital is central (Nieves and Quintana 2018). Therefore, acquisition, development, and retention of quality human resources have strategic value for the services sector (Hitt et al. 2001). The studies like Berk et al. (2010), Wang et al.
(2014), Asare et al. (2017) and Nawaz (2019), etc., have extensively assessed the impact of human capital efficiency on firms’ performance and valuation. In the case of mutual funds, the literature (for example Berk and van Binsbergen, 2015; Yi et al. 2018; Muñoz 2019) concentrates on explor-ing the relationship between managers’ skills and the funds’ performance.
Even though the skill set evolves with investment in human capital (Brixiová et al. 2020), minimal studies have attempted to explore the explicit link between investment in human capital and mutual funds’ performance. Wang and Cheng (2014) investigated the impact of managers’ train-ing profiles on performance and found a positive relation-ship. Switzer and Huang (2007) and Golec (1996) linked performance of funds with the managers’ educational characteristics. However, as noted by Stowell (2010), the educational background does not always matter for perfor-mance. Nonetheless, if prior training and education can drive performance, a firm’s continuous human capital investment will further enhance it. Hence, it is plausible that the mutual funds with higher human capital efficiency (HCE) achieved through perpetual investments will outdo their peers. Given that no prior study has linked HCE with mutual funds’
* Nawazish Mirza [email protected]
Jamila Abaidi Hasnaoui [email protected]
Syed Kumail Abbas Rizvi [email protected]
Krishna Reddy [email protected]
Bushra Naqvi [email protected]
1 Excelia Business School, La Rochelle, France2 Toi Ohomai Institute of Technology, Rotorua, New Zealand3 Lahore University of Management Sciences, Lahore,
Pakistan

361Human capital efficiency, performance, market, and volatility timing of asian equity funds…
performance, we identify this as a valid research gap. There-fore, we extend the context of mutual funds performance beyond the skill vs. luck context of Fama and French (2010), Berk and van Binsbergen (2015), Cai et al. (2018), and Gao et al. (2020) to evaluate the impact of HCE on mutual funds. Specifically, we hypothesize that funds with higher human capital efficiency should outperform their counterparts with lower human capital efficiency and vice versa.
While the link between HCE and performance should hold in general, we believe that the differentiation should become even more significant during the stressed phases. The COVID-19 outbreak provides us with a unique oppor-tunity to assess this hypothesis amidst the extreme volatility that financial markets have witnessed in recent times. Many studies have analyzed the new normal’s impact and high-lighted the changing dynamics relevant for mutual funds’ performance. Shehzad et al. (2020) noted that the volatility emanating from COVID-19 has been much significant than that of the global financial crisis of 2008. Furthermore, the contagion has increased connectedness between oil prices, stock markets, and geopolitical risk (Sharif et al. 2020).
The pandemic has also impacted gold and cryptocurren-cies (Corbet et al. 2020; Mnif et al. 2020). The consequences have been so profound that the so-called safe haven assets have also lost their diversification effectiveness (Ji et al. 2020). Therefore, the uncertainty requires participants to quickly adjust to the market movements to limit this tur-moil’s ongoing impact. Finally, some evidence supports that active investing has been beneficial in these challeng-ing times. Rizvi et al. (2020) suggested that fund managers demonstrate style drifts in response to COVID-19, while Nawazish et al. (2020a, b, c, d) documented mutual funds’ volatility timing ability. These studies also confirmed that during the COVID-19 outbreak, there had been differential in returns across various classes of funds. Furthermore, in this period, almost all funds outperformed many passive benchmarks. It is also interesting to note that while the COVID-19 episode resulted in a global rout of financial markets, Topcu and Gulal (2020) argued that the emerging markets demonstrated resilience compared to their devel-oped counterparts.
These studies highlight some essential facts that motivate the design of our research. First, the COVID-19 outbreak was akin to an economic crisis with a profound impact on portfolio management. Second, the investment dynamics during COVID-19 were significantly different from the prior periods. This warrants that any performance-related analysis of mutual funds should be staggered as pre and pandemic periods. Third, the market and volatility timing was a sav-ing grace for the mutual funds’ managers, and assessing these could reflect how they performed vis-à-vis their peers. Finally, the adverse impact was not uniform. While devel-oped markets plunged under recessionary pressures, the
emerging markets continued to resist. Therefore, we expect the emerging market funds to demonstrate a different perfor-mance profile than those domiciled in developed economies. Based on these observations, we segregate our HCE analysis for mutual funds into pre-COVID and COVID-19 outbreak periods.
This paper employs a multi-step methodology. First, the actively managed equity funds are sorted and ranked from high to low HCE. After that, we use various performance metrics, market, and volatility timing measures to assess how HCE-ranked funds have done during the sample period. Our findings suggest that funds with higher human capital efficiency outperform their counterpart in the pre-COVID period and during the outbreak. We also note the increased significance of human capital efficiency when the pandemic peaked across our sample countries. There are many con-tributions of our study. This is the preliminary study that explores the relationship between human capital efficiency and mutual funds’ performance in emerging markets. Our results reflect the need for proactive investment management during the pandemic outbreak. Therefore, market and vola-tility timing are imperative, especially when the investment landscape is as challenging as is the case with emerging markets. The rest of the paper is organized as follows. Sec-ond section presents our empirical strategy and data, results are discussed in third section, and fourth section concludes.
Empirical strategy
There is no prior study that has assessed the impact of COVID-19 on mutual funds in the Asian markets. Even in the global context, only Mirza et al. (2020a, b, c, d) and Yarovaya et al. (2021) documented the role of human capital and fund’s performance. We take this as an opportunity to evaluate the link between HCE and funds’ performance. For this cross-country analysis, we consider the countries that have reported more than 45000 cases each as of July 25, 2020 (cut-off date). Table 1 presents a list of these countries with some COVID-19 summary statistics. These seventeen countries contribute approximately 21% of the total reported cases and 11% of the global mortality. We want to note that we have to exclude Iraq from our list as the mutual funds’ data were not available. Therefore, our final list comprises sixteen Asian economies. In this list, only Iran and Kuwait reported more deaths per million population from this pan-demic (182 and 99, respectively) compared to the global average of 82.5 as of our cut-off date.
The following step is to select the mutual funds from these sixteen countries. We apply several filters to confirm the data availability and robustness of our findings. The study is limited to equity funds for which daily net asset value (NAV) and appropriate benchmarks are accessible. To

362 J. A. Hasnaoui et al.
strictly keep our geographical emphasis, we only consider funds with at least 80% investment focus within Asia. The final consideration in sample selection is the data required for human capital efficiency. Pulic (2000) and Pulic and Kolakovic (2003) conceive that human capital efficiency (HCE) is the efficacy of knowledge and skills emanating from investment in human capital (I). The knowledge and skills contribute toward the value addition (VA), and in the case of mutual funds, this should reflect better performance. Based on this, we define HCE as
Human capital investment refers to various compensa-tions that include payroll, commissions, bonuses, training, development, etc. Like the notion of economic rent, Berk and van Binsbergen (2015) defined value-added for funds as a function of gross alpha and size (assets under manage-ment). Therefore, VA is expressed as
There can be two possible issues with the specification and measurement of HCE. The compensation information of mutual funds is not always available publicly, and there-fore, the final sample criterion is to include funds for which the compensation-related data are available. Only funds that
HCE =VA
I,
VA = gross alpha × AUM
significantly invest in human capital would likely publish this information and result in self-selection bias for our sam-ple. However, the impact is limited because more than 90% of equity funds across all sample countries have dissemi-nated this information. The second issue is the impact of the size of asset management companies that results in the biased measurement of HCE. We address this by presenting results across various size sorts. Similarly, some countries like China and Iran have unique characteristics and con-straints compared to other sample countries. To demonstrate the robustness of our analysis, we will separately report the findings on funds excluding those from China and Iran.
Based on the presented criteria, our final sample com-prises 2044 equity funds from sixteen countries. To evalu-ate the relevance of HCE, we specify multiple periods. Although this study’s primary focus is during the outbreak of COVID-19, we also consider a pre-COVID period for comparison. For this, we define the COVID-19 infected period as of January 1 to Dec 31, 2020 (cut-off date for this study), while the pre-COVID duration is six months before the global outbreak, i.e., from July 1 to December 31 2019. To homogenize the sample, the NAV and assets under management are translated into the US dollar at the average prevailing exchange rate. After that, we compute HCE for each equity fund in our sample using CAPM-based alpha, investment in human capital, and assets under management as on June 30, 2019. The estimated HCE is used to rank the equity funds across five groups (20% each) from high to low. The funds’ performance, market, and volatility timing are assessed across these sorts, and we expect the funds’ ranked high on HCE to perform significantly better than those with a low rank on HCE. The sample distribution is presented in Table 2.
Given that the HCE contributes to enhancing the funds’ managers’ skill set, we expect its impact to be more pro-nounced during the pandemic outbreak. To analyze this, we break up COVID-19 period of this study into three stages. The first stage is from January 1 to March 26. During this period, the sample countries have reported an average of 1% (or less) of the cases compared to their count on the cut-off date. Stage 2 spans from March 27 to May 29, during which the tally of the cases across these sixteen countries was on average less than 15% of the total cases. The final stage is from May 30 to December 31, during which the contagion spread manifold. These three stages are illustrated in Table 3.
To control for the size factor that may influence the meas-urement of HCE, we create subsamples by segregating the sample funds into three categories based on the assets under management. The top 30% are classified as Big, Middle 40% as medium, and the bottom 30% as small funds. This would result in 613 big, 818 medium, and 613 small funds.
Table 1 Selected COVID-19 statistics
Data as on July 25th 2020
Total cases Total deaths Total cases/Mln
Total deaths/Mln
World 15,964,723 643,171 2048 82.51 India 1,339,176 31,425 970 232 Iran 286,523 15,289 3409 1823 Pakistan 271,887 5787 1229 264 Saudi Ara-
bia262,772 2672 7541 77
5 Turkey 224,252 558 2657 666 Bangladesh 221,178 2874 1342 177 Qatar 108,638 164 38,691 588 Iraq 104,711 4212 26 1059 Indonesia 97,286 4714 355 1710 China 83,784 4634 58 311 Kazakhstan 80,226 585 4269 3112 Philippines 78,412 1897 715 1713 Oman 74,858 371 14,638 7314 Kuwait 62,625 425 14,651 9915 Israel 59,475 448 6466 4916 UAE 58,249 343 5885 3517 Singapore 49,888 27 8523 5

363Human capital efficiency, performance, market, and volatility timing of asian equity funds…
Performance measures
Similar to Yarovaya et al. (2021) and Mirza et al. (2020a, b, c, d), we employ three performance measures for the HCE sorted equity funds. These include the adjusted Sharpe ratio, Sortino’s ratio, and Jensen’s alpha. Pezier and White (2006) proposed that the conventional Sharpe ratio should be adjusted for skewness and kurtosis to account for possible non-normality. Nawazish et al. (2020a, b, c, d), Rizvi et al. (2020) and Reddy et al. (2017) documented the adjusted Sharpe ratio’s relevance to evaluate funds’ performance amid high volatility. The adjusted Sharpe ratio is expressed as
with sk and kr represent skewness and kurtosis. The Sharpe ratio takes the following form
(1)Adjusted SharpeRatio = ASR = SRi
(
1 +Sk
6× SRi −
(
kr − 3
24
))
× SR2i
for which the NAV based returns (net of management fees) are estimated as
The Sortino ratio of Sortino and Price (1994) incorporates the downside risk, and as noted by Damianov and Elsayed (2020) it is instrumental in evaluating portfolio performance during periods of high volatility. The functional form of this ratio is
We complement these ratios by estimating Jensen’s alpha (Jensen 1968) for the HCE sorted funds. The alpha estimates the excess return of the funds over and above a benchmark. As noted by Gao et al. (2020) and Lemeshko and Rejnuš (2015), it is an important measure to evaluate equity funds. The (Carhart 1997) four factor-based Jensen’s alpha (α) is estimated as follows.
(2)SharpeRatio = SRi =Rit − Rf
�it
(3)Rit =NAVit − NAVit−1
NAVit−1
,
(4)
SortinoRatio =Rit − Rf
�dit, with �d representing downside deviation
(5)Ri − Rf = �i + �i
(
Rm − Rf
)
+ siSMB + hiHML + wiMOM + eit
Table 2 Sample distribution (HCE sort)
Low 2 3 4 High Total
India 43 48 47 46 42 226Iran 24 21 28 24 25 122Pakistan 28 27 27 26 27 135Saudi Arabia 32 31 34 34 35 166Turkey 21 24 20 21 23 109Bangladesh 14 15 17 13 14 73Qatar 28 27 27 25 24 131Indonesia 31 30 34 32 31 158China 51 53 52 54 53 263Kazakhstan 12 11 10 12 11 56Philippines 13 15 12 14 12 66Oman 14 13 12 12 14 65Kuwait 28 23 21 20 21 113Israel 21 20 24 20 22 107UAE 18 21 20 21 21 101Singapore 32 31 30 31 29 153Total 410 410 415 405 404 2044
Table 3 Sample periods
Stage Dates % of reported cases
Pre-COVIDJuly 1–Dec 31, 2019 Not applicable
Pandemic outbreakStage 1 Jan 1–March 26 1%Stage 2 March 27–May 29 10%Stage 3 May 30–Dec 31 100%

364 J. A. Hasnaoui et al.
We estimate this model by controlling for country and time fixed effects
Market timing
Market timing is the dynamic portfolio rebalancing in response to changing market conditions. Two prominent methodologies proposed by Treynor and Mazuy (1966) and Henriksson and Merton (1981) are widely used to assess fund managers’ market timing ability. In this paper, we use the methodology Henriksson and Merton (1981) as it is more suited for a bearish market than Treynor and Mazuy (1966) that is robust if the market movements are two-directional. The market timing assessment suggests that fund managers should increase their exposure to equities when are markets are doing well and vice versa. This tendency is captured by introducing a dummy variable of drift to Eq. 5 as follows.
Di is the dummy variable that takes a value of zero if Rm > Rf, and λi is the factor loading. A significant posi-tive λ demonstrates the market timing of funds managers. It is important to note that while an insignificant coefficient represents the absence of marketing timing, a significant negative λ implies that the manager timed the market in the wrong direction. We expect that funds with higher HCE should demonstrate superior market timing compared to those with lower HCE.
Volatility timing
Hsu and Chen (2017) and Moreira and Muir (2019) sug-gested that volatility timing is important for fund managers, and the inability to cope with volatility results in a reduc-tion of funds’ value. As COVID-19 outbreak is marked with high volatility, a holistic view on funds’ performance is not complete without assessing their response to varying vola-tility. For this, we employ Busse (1999) basic methodology as used by Shen et al. (2019) recently. The functional form is as follows
If funds are successful in volatility timing, γim should be negative. We assess performance, market, and volatil-ity timing for the entire COVID period, the three specified stages, and six months pre-COVID duration to have con-sistency in analysis. For empirical estimation, we follow an international investor perspective, and cross-country funds are combined in value-weighted global portfolios, and returns are in the equivalent of US dollars at the average exchange rate. This approach is similar to Afzal et al. (2011),
(6)Rit − Rf = �i + �it(Rm − Rf ) + �iDi + eit
(7)Rit = 𝛼i + 𝛽iREt + 𝛾im(𝜎mt − �̄�m)REt + 𝜀it, withREt = Rmt − Rft
Nawazish et al. (2013), and Mirza et al. (2020a, b, c, d). Like the Carhart factor model, we want to note that our estimates of market and volatility timing control for country and time fixed effects.
Stochastic dominance—robustness analysis
To assess the robustness of our results, we also use the sto-chastic dominance approach (SD). The SD does not assume normality of underlying returns and has been used by Vinod (2004), Wong et al. (2008) and Al-Khazali et al. (2014) for funds performance ranking. The SD is based on the prob-ability density function of returns of the two categories of funds. The returns of funds H (high HCE) and L (low HCE) are expressed as fh(x),fl(x) with cumulative distribu-tion functions (CDF) of Fh(x), Fl(x). The funds H will have first-order dominance over funds L if Fh(x)−Fl≤0 suggest-ing that funds H performance utility is better than those of funds L. The second-order SD of fund H will require ∫Fh(x)−∫Fl(x)≤0, while third-order SD for funds H will entail, if ∫∫Fh(x)−∫∫Fl(x)≤0. Finally, fourth-order domi-nance for funds H would require∫∫∫Fh(x)−∫∫∫Fl(x)≤0. We follow Vinod (2004) estimation procedure of unconventional utility theory to test for four order SD of HCE ranked funds.
Data sources
We employ multiple sources to extract the data. Our primary source for NAV and information related to investment in human capital and AUM is Morningstar. However, about 30% of our sample funds are not represented in Morningstar. For these funds, we download the data individually from their websites. The yield on treasury securities of the sam-ple countries is extracted from trading economics. For the market return, we use MSCI Asia ex Japan as the relevant benchmark. This is obtained from the website of MSCI, while SMB, HML, and MOM factors are downloaded from the Kenneth French data website.
Results and discussion
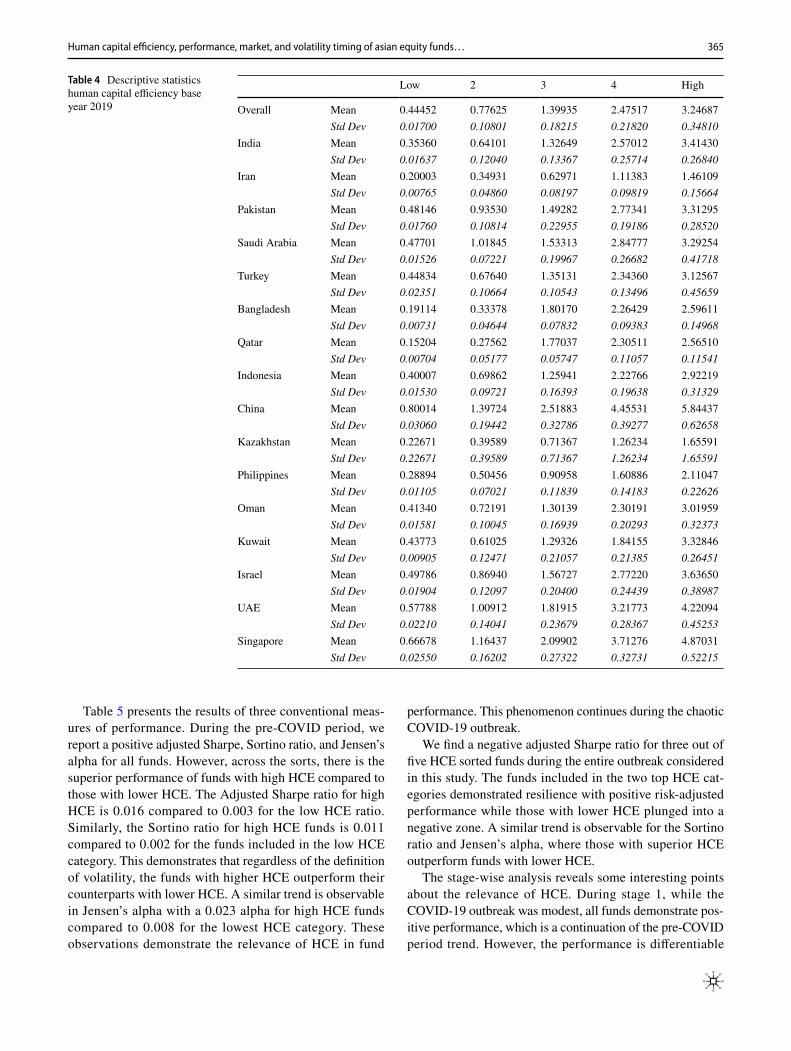
The descriptive statistics of HCE are presented in Table 4. For the entire sample, the average HCE for funds in the high category is 3.24, while those with low human capital effi-ciency have an average value of 0.44. There is some inter-esting comparison across the sixteen countries. We observe maximum HCE for Chinese funds (5.84), followed by Singa-pore (4.87) and UAE (4.22). In the lowest HCE category, we have the minimum averages from Qatar (0.15), Bangladesh (0.19), and Iran (0.20). The significant differences across high and low categories reflect the contrast in human capital efficiency across these Asian economies.
365Human capital efficiency, performance, market, and volatility timing of asian equity funds…
Table 5 presents the results of three conventional meas-ures of performance. During the pre-COVID period, we report a positive adjusted Sharpe, Sortino ratio, and Jensen’s alpha for all funds. However, across the sorts, there is the superior performance of funds with high HCE compared to those with lower HCE. The Adjusted Sharpe ratio for high HCE is 0.016 compared to 0.003 for the low HCE ratio. Similarly, the Sortino ratio for high HCE funds is 0.011 compared to 0.002 for the funds included in the low HCE category. This demonstrates that regardless of the definition of volatility, the funds with higher HCE outperform their counterparts with lower HCE. A similar trend is observable in Jensen’s alpha with a 0.023 alpha for high HCE funds compared to 0.008 for the lowest HCE category. These observations demonstrate the relevance of HCE in fund
performance. This phenomenon continues during the chaotic COVID-19 outbreak.
We find a negative adjusted Sharpe ratio for three out of five HCE sorted funds during the entire outbreak considered in this study. The funds included in the two top HCE cat-egories demonstrated resilience with positive risk-adjusted performance while those with lower HCE plunged into a negative zone. A similar trend is observable for the Sortino ratio and Jensen’s alpha, where those with superior HCE outperform funds with lower HCE.
The stage-wise analysis reveals some interesting points about the relevance of HCE. During stage 1, while the COVID-19 outbreak was modest, all funds demonstrate pos-itive performance, which is a continuation of the pre-COVID period trend. However, the performance is differentiable
Table 4 Descriptive statistics human capital efficiency base year 2019
Low 2 3 4 High
Overall Mean 0.44452 0.77625 1.39935 2.47517 3.24687Std Dev 0.01700 0.10801 0.18215 0.21820 0.34810
India Mean 0.35360 0.64101 1.32649 2.57012 3.41430Std Dev 0.01637 0.12040 0.13367 0.25714 0.26840
Iran Mean 0.20003 0.34931 0.62971 1.11383 1.46109Std Dev 0.00765 0.04860 0.08197 0.09819 0.15664
Pakistan Mean 0.48146 0.93530 1.49282 2.77341 3.31295Std Dev 0.01760 0.10814 0.22955 0.19186 0.28520
Saudi Arabia Mean 0.47701 1.01845 1.53313 2.84777 3.29254Std Dev 0.01526 0.07221 0.19967 0.26682 0.41718
Turkey Mean 0.44834 0.67640 1.35131 2.34360 3.12567Std Dev 0.02351 0.10664 0.10543 0.13496 0.45659
Bangladesh Mean 0.19114 0.33378 1.80170 2.26429 2.59611Std Dev 0.00731 0.04644 0.07832 0.09383 0.14968
Qatar Mean 0.15204 0.27562 1.77037 2.30511 2.56510Std Dev 0.00704 0.05177 0.05747 0.11057 0.11541
Indonesia Mean 0.40007 0.69862 1.25941 2.22766 2.92219Std Dev 0.01530 0.09721 0.16393 0.19638 0.31329
China Mean 0.80014 1.39724 2.51883 4.45531 5.84437Std Dev 0.03060 0.19442 0.32786 0.39277 0.62658
Kazakhstan Mean 0.22671 0.39589 0.71367 1.26234 1.65591Std Dev 0.22671 0.39589 0.71367 1.26234 1.65591
Philippines Mean 0.28894 0.50456 0.90958 1.60886 2.11047Std Dev 0.01105 0.07021 0.11839 0.14183 0.22626
Oman Mean 0.41340 0.72191 1.30139 2.30191 3.01959Std Dev 0.01581 0.10045 0.16939 0.20293 0.32373
Kuwait Mean 0.43773 0.61025 1.29326 1.84155 3.32846Std Dev 0.00905 0.12471 0.21057 0.21385 0.26451
Israel Mean 0.49786 0.86940 1.56727 2.77220 3.63650Std Dev 0.01904 0.12097 0.20400 0.24439 0.38987
UAE Mean 0.57788 1.00912 1.81915 3.21773 4.22094Std Dev 0.02210 0.14041 0.23679 0.28367 0.45253
Singapore Mean 0.66678 1.16437 2.09902 3.71276 4.87031Std Dev 0.02550 0.16202 0.27322 0.32731 0.52215

366 J. A. Hasnaoui et al.
with higher HCE funds doing better than their counterparts. This is consistent for adjusted Sharpe and Treynor ratios as well as for Jensen’s alpha. The transition to stage 2 is marked by a higher number of confirmed COVID-19 cases across our sample and has its toll on funds performance. The three mid to low HCE funds categories show adverse risk-adjusted performance, while those with higher HCE continue to demonstrate positive returns. However, it is not surprising that during stage 2, the funds included in two high HCE categories have lower albeit positive returns than stage 1. We attribute this decline to the overall market conditions, which deteriorated significantly compared to stage 1.
The results from stage 3 confirm the vital role of HCE in funds’ performance. During this stage, the total count of COVID-19 cases increase manifold, and the investing
environment experienced the worst turmoil. The only cat-egory of equity funds that endured persistence is the ones with high HCE. These results strongly favor the relevance of HCE in sustaining funds’ performance. Our results from COVID-19 specifically indicate that while HCE is relevant in general, however, during turbulent times, the importance increases manifold.
The size sorted results are shown in Tables 6, 7, and 8. Similar to the overall sample, we find the significance of HCE toward the risk-adjusted performance of funds of varying sizes. The adjusted Sharpe ratio, Sortino ratio, and Jensen’s alpha are consistently higher for high HCE funds regardless of their size. There is a persistence of this across the pre-COVID periods and during various phases of the
Table 5 Risk adjusted performance of selected funds
The estimates of Jensen’s alpha control for country and time fixed effects*At 10%, ** at 5% and *** represents significance at 1%
Adj. sharpe ratio Sortino ratio Jensen’s alpha
Pre-COVID periodLow 0.00393** 0.00278** 0.00994**2 0.00533** 0.00359** 0.00910**3 0.00586** 0.00376* 0.01536**4 0.01153** 0.00704* 0.01799**High 0.01616** 0.01180** 0.02655**COVID-19 period completeLow − 0.01915** − 0.01055** − 0.01618**2 − 0.00816** − 0.00428*** − 0.00893**3 − 0.00047** − 0.00024* 0.00816***4 0.00966** 0.00355** 0.01376***High 0.01129** 0.00608** 0.02385***Stage 1Low 0.00360** 0.00254** 0.01100***2 0.00489*** 0.00329*** 0.01007***3 0.00537** 0.00344** 0.01702**4 0.01056** 0.00645** 0.01991***High 0.01481*** 0.01081*** 0.02941***Stage 2Low − 0.04132** − 0.00653*** − 0.02229***2 − 0.02876*** − 0.00433** − 0.02565***3 − 0.01528** − 0.00219** − 0.04974***4 0.00750** 0.00102*** 0.00477***High 0.01383** 0.01198** 0.03036***Stage 3Low − 0.07747** -0.01313*** − 0.08383***2 − 0.05393** − 0.00870*** − 0.06522**3 − 0.02866** − 0.00440** − 0.05311***4 − 0.01406** − 0.00234** − 0.03472**High 0.02593** 0.02138*** 0.07764***
Table 6 Risk adjusted performance of big funds (top 30%)
Country Fixed Effects = Yes, Time Fixed Effects = Yes (Jensen’s Alpha)*At 10%, ** at 5% and *** represents significance at 1%
Adj. sharpe ratio Sortino ratio Jensen’s alpha Jensen’s alpha
Pre-COVID periodLow 0.00786** 0.00672** 0.01334**2 0.01067** 0.00869** 0.01221**3 0.01172** 0.00910* 0.02062**4 0.02306** 0.01704* 0.02414**High 0.03233** 0.02858** 0.03564**COVID-19 period completeLow − 0.02356** − 0.01156** − 0.02083**2 − 0.01004** -0.00469 − 0.01150**3 − 0.00058** − 0.00026* 0.01051***4 0.01188** 0.00389** 0.01772***High 0.01389** 0.00666** 0.03071***Stage 1Low 0.00387** 0.00264** 0.01364***2 0.00525*** 0.00341*** 0.01249***3 0.00577** 0.00357** 0.02111**4 0.01135** 0.00669** 0.02470***High 0.01592*** 0.01122**- 0.03647***Stage 2Low − 0.04682** − 0.00916*** − 0.01830***2 − 0.03259*** − 0.00607** − 0.02106***3 − 0.01732** − 0.00307** − 0.04084***4 0.00850** 0.00144*** 0.00392***High 0.01567** 0.01680** 0.02492***Stage 3Low − 0.05165** − 0.00862*** − 0.05754***2 − 0.03595** − 0.00572*** − 0.04477**3 − 0.01910** − 0.00289** − 0.03646***4 − 0.00937** − 0.00154** − 0.02383**High 0.02920** 0.02352*** 0.08510***

367Human capital efficiency, performance, market, and volatility timing of asian equity funds…
outbreak. However, the difference across HCE categories is not very profound in the pre-COVID period indicating that human capital efficiency becomes more instrumental during market chaos.
The comparative results for market timing are presented in Table 9. As seen from Panel A, during the pre-COVID period, only the funds that are included in the top two sorts of HCE exhibit market timing. Furthermore, as soon as the COVID-19 impacted the investing landscape, we observe a significant variation in the market timing ability. For the complete COVID-19 period, we continue to observe sig-nificant positive coefficients for the two higher HCE funds. However, the funds in the two lowest HCE categories, the attempt to time the market has been in the wrong direction. This is consistent for the three stages, with maximum HCE
funds being successful in market timing while those with lower human capital efficiency show negative time ability. We believe that the superior market timing ability of a high HCE fund, at least in part, also explains the robust perfor-mance dominance of these funds over those with lower HCE.
The results of market timing for various sized funds are presented in Table 10. We observe that funds in three size categories with higher HCE demonstrate better market tim-ing ability. The results are consistent throughout the different periods indicating that the relationship between HCE and funds performance is independent of the size.
Finally, the volatility timing results are presented in Table 11. Our findings are consistent with the overall rel-evance of HCE, and we observe that even during the pre-COVID period, the funds that had medium to substantial
Table 7 Risk adjusted performance of medium sized funds (mid 40%)
Country Fixed Effects = Yes, Time Fixed Effects = Yes (Jensen’s Alpha)*At 10%, ** at 5% and *** represents significance at 1%
Adj. sharpe ratio Sortino ratio Jensen’s alpha
Pre-COVID periodLow 0.01040** 0.01097** 0.01641**2 0.01412** 0.01418** 0.01503**3 0.01552** 0.01485* 0.02538**4 0.03052** 0.02781* 0.02971**High 0.04279** 0.04663** 0.04386**COVID-19 period completeLow − 0.02586** − 0.01422** − 0.03402**2 − 0.01102** − 0.00577*** − 0.01877**3 − 0.00064** − 0.00032* 0.01716***4 0.01304** 0.00479** 0.02894***High 0.01525** 0.00820** 0.05016***Stage 1Low 0.00466** 0.00346** 0.02161***2 0.00632*** 0.00447*** 0.01979***3 0.00695** 0.00468** 0.03344**4 0.01367** 0.00877** 0.03913***High 0.01916*** 0.01470*** 0.05778***Stage 2Low − 0.05982** − 0.01324*** − 0.02570***2 − 0.04165*** − 0.00878** − 0.02958***3 − 0.02213** − 0.00444** − 0.05736***4 0.01086** 0.00208*** 0.00550***High 0.02002** 0.02430** 0.03501***Stage 3Low − 0.04591** − 0.00574*** − 0.06323***2 − 0.03196** − 0.00381*** − 0.04919**3 − 0.01698** − 0.00193** − 0.04006***4 − 0.00833** − 0.00102** − 0.02619**High 0.02955** 0.02661*** 0.09352***
Table 8 Risk adjusted performance of small funds (bottom 30%)
Country Fixed Effects = Yes, Time Fixed Effects = Yes (Jensen’s Alpha)*At 10%, ** at 5% and *** represents significance at 1%
Adj. sharpe ratio Sortino ratio Jensen’s alpha
Pre-COVID periodLow 0.01377** 0.01790** 0.02020**2 0.01869** 0.02315** 0.01849**3 0.02054** 0.02423* 0.03123**4 0.04040** 0.04539* 0.03656**High 0.05664** 0.07610** 0.05398**COVID-19 period completeLow − 0.02839** − 0.01750** − 0.05555**2 − 0.01209** − 0.00710*** − 0.03066**3 − 0.00070** − 0.00039* 0.02802***4 0.01431** 0.00590** 0.04725***High 0.01673** 0.01009** 0.08191***Stage 1Low 0.00561** 0.00453** 0.03424***2 0.00761*** 0.00586*** 0.03135***3 0.00837** 0.00613** 0.05298**4 0.01646** 0.01149** 0.06199***High 0.02307*** 0.01926*** 0.09154***Stage 2Low − 0.07645** − 0.01916*** − 0.03610***2 − 0.05322*** − 0.01270** − 0.04154***3 − 0.02828** − 0.00643** − 0.08056***4 0.01387** 0.00300*** 0.00773***High 0.02559** 0.03515** 0.04917***Stage 3Low − 0.04081** − 0.00382*** − 0.06948***2 − 0.02841** − 0.00253*** − 0.05406**3 − 0.01509** − 0.00128** − 0.04403***4 − 0.00741** − 0.00068** − 0.02878**High 0.02991** 0.03011*** 0.10276***

368 J. A. Hasnaoui et al.
HCE show evidence of volatility timing. On the contrary, the funds that have low HCE show no sign of timing the vola-tility. We want to note that while it is plausible that funds with low HCE did not exhibit volatility timing during the pre-COVID period due to the absence of extreme volatility, things were very different in the last six months. Given the higher volatility during the outbreak, the funds are expected to time the volatility to remain resilient. However, for the
complete period of COVID-19 as well as the three stages, we do not find any evidence of volatility timing for funds with medium to low HCE.
On the contrary, the funds with high HCE persistently demonstrate volatility timing. In the maximum HCE cat-egory funds, the volatility timing coefficient was signifi-cant at 1% for the entire COVID-19 period and the three specified stages. These results are very interesting from
Table 9 Market timing during pre-COVID-19, complete period, Stage 1, Stage 2 and Stage 3
Country Fixed Effects = Yes, Time Fixed Effects = Yes represents significance at * at 10%, ** at 5% and ***1%
Pre-COVID COVID-19 complete period
α λ α λ
Panel ALow 0.00784** 0.00704 − 0.01002*** − 0.028***85t-stat 1.99096 1.41051 − 3.83439 − 3.805082 0.00907** 0.04259 − 0.00553*** − 0.01284***t-stat 2.12253 1.67628 − 3.64216 − 3.548033 0.01203** 0.01862 0.00505*** 0.00204t-stat 2.13031 1.15768 3.11131 1.267324 0.01389** 0.03146** 0.00852*** 0.02805***t-stat 2.02135 2.61564 4.05142 2.95732High 0.02104 0.01388*** 0.01478*** 0.02994***t-stat 1.99615 2.92200 3.00063 4.14687
Stage 1 Stage 2
α λ α λ
Panel BLow 0.00866*** − 0.02455*** − 0.01287*** − 0.02680**t-stat 2.46014 − 2.43971 − 2.43626 − 2.281362 0.01106*** − 0.01093** − 0.01480** − 0.01193**t-stat 3.15369 2.13570 − 1.99565 − 2.229393 0.01340*** 0.00174 − 0.02871*** 0.00190t-stat 2.99067 1.08091 − 3.43636 1.094434 0.01568*** 0.02387 0.00275*** 0.02606**t-stat 2.57811 1.17809 3.28874 2.24368High 0.02315*** 0.02592*** 0.01752*** 0.03489***t-stat 3.46281 3.54440 3.04278 3.33296
Stage 3
α λ
Low − 0.06009*** − 0.03162***t-stat − 2.82507 − 5.685922 − 0.04183*** − 0.01407***t-stat − 3.87510 6.339803 − 0.02223*** 0.00224t-stat − 4.16531 1.483514 − 0.01091*** 0.03075***t-stat − 3.83750 2.63040High 0.02011*** 0.04065***t-stat 3.68339 4.99048

369Human capital efficiency, performance, market, and volatility timing of asian equity funds…
Table 10 Market timing coefficient (λ) based on size sorts
Country Fixed Effects = Yes, Time Fixed Effects = Yes. represents significance at * at 10%, ** at 5% and ***1%
Pre-COVID COVID-19 complete period
Top 30% Mid 40% Bottom 30% Top 30% Mid 40% Bottom 30%
Panel ALow 0.00772 0.01022 0.00883 − 0.02344** − 0.02885*** − 0.02286t-stat 1.54577 1.04171 0.76744 − 2.09112 − 2.57457 1.012202 0.04667 0.06179 0.05337 − 0.01043** − 0.01284 − 0.01017t-stat 1.03730 0.93213 0.86124 − 2.08816 − 0.57457 − 0.811133 0.02041 0.02702 0.02334 0.00166 0.00204 0.00162t-stat 1.16870 1.07963 1.03326 1.02955 1.26757 1.004144 0.03448*** 0.04565*** 0.03943*** 0.02279*** 0.02806*** 0.02223***t-stat 2.86647 3.79508 3.27765 2.40248 2.95791 2.43163High 0.01521*** 0.02013*** 0.01739*** 0.02433 0.02995*** 0.02373***t-stat 3.20220 3.23918 3.66154 3.36885*** 4.14770 3.28570
Stage 1
Top 30% Mid 40% Bottom 30% Top 30% Mid 40% Bottom 30%
Panel BLow − 0.02695 − 0.02971 − 0.02381 − 0.02860 − 0.03153 − 0.02527t-stat − 0.67800 − 0.74749 − 0.59893 − 0.71951 − 0.79326 − 0.635612 − 0.01199 − 0.01322 − 0.01060 − 0.01273 − 0.01403 − 0.01124t-stat − 1.08132 − 1.19215 − 0.95522 − 1.14753 − 1.26515 − 1.013713 0.00191 0.00210 0.00168 0.00202 0.00223 0.00179
t-stat 1.18649 1.30810 1.04813 1.25914 1.38820 1.112314 0.02621 0.02889*** 0.02315** 0.02781*** 0.03066*** 0.02457***t-stat 1.29315 2.42577 1.99367 2.72367 2.57431 2.95175High 0.02845*** 0.03136*** 0.02513*** 0.03019*** 0.03328*** 0.02667***t-stat 3.89058 4.28936 3.43688 4.12881 4.55201 3.64733
Stage 3
Top 30% Mid 40% Bottom 30%
Low − 0.02135 − 0.02330 − 0.02589t-stat 1.22608 1.33793 1.486592 − 0.00950 − 0.01037 − 0.01152t-stat 0.90257 0.98490 1.094333 0.00151 0.00165 0.00183t-stat 0.93802 1.02359 1.137324 0.02076** 0.02266** 0.02517***t-stat 2.08882 2.27936 2.53262High 0.02216*** 0.02418*** 0.02687**t-stat 3.06936 3.34935 3.72150

370 J. A. Hasnaoui et al.
the perspective of human capital efficiency and their posi-tive impact vis-à-vis fund performance. It is worth noting that while the top HCE-ranked funds outperformed other funds in general, the significance was more critical during the turbulent period of COVID-19. Therefore, funds need to consider effective investment in human capital to ensure that their performance remains persistent during challenging periods. The results on size sorted funds are presented in Table 12 that reconfirm the findings for the complete sample.
Robustness test
The stochastic dominance results of Vinod (2004) for the four orders based on Davidson and Duclos (2000) tests and the 5% cut-off point of statistical inference (Guo et al. 2013) are presented in Table 13. The findings are tabulated in columns vs. rows. For example, Panel A contains results for pre-COVID and complete COVID periods, the intersec-tion of column 1 and row 5 represents the stochastic infer-ence of high and low HCE funds. Similarly, column 3 and row 5 show the dominance results for high vs. mid-HCE funds. The findings from stochastic dominance also con-firm our earlier results. For the pre-COVID and complete COVID periods, the high HCE category funds dominate all other funds with lower human capital efficiency. This trend remains consistent for stage-wise analysis, which shows that the high HCE funds outperformed their counterparts in the sample for the three stages of the outbreak.
To demonstrate further robustness of our performance, market, and volatility timing measures, we also report the results of Eqs. 1–7 after excluding funds domiciled in
China and Iran. The Chinese funds are unique in terms of their ownership structure that is sometimes dominated by the State and can influence the performance (Hutson et al. 2019). Similarly, the sanctions on Iran impact the investment paradigm (Ghasseminejad and Jahan-Parvar 2021) and con-sequently the funds’ performance. The results in Table 14 confirm our earlier finding, and after excluding the funds from Iran and China, the significance of HCE remains. We observe better risk-adjusted performance and superior ability to time the market, and volatility for funds with higher HCE.
Our results at large confirm the link between human cap-ital efficiency and the mutual funds’ performance. There are plausible reasons that would support this relationship, especially during the outbreak of COVID-19. The industry is experiencing slower organic growth and shrinking fees and consequently exerts pressure on the portfolio managers to perform. The market volatility is high and requires asset valuations continuously. This would need managers to make dynamic investment decisions, including exploring unchar-tered territories (Rizvi et al. 2020). They have to reposition their strategies to sail through the tighter time cycles. There-fore, the funds with higher human capital efficiency tend to perform, while those who do not focus on human capital investment are likely to struggle.
Specifically, in the context of emerging economies, these results have important implications. Given the high transaction costs, improvised market liquidity, thinly traded equities, and information asymmetries, the investing envi-ronment is challenging. On the other hand, mutual funds are essential to mobilize investments for both institutional and retail clients. Therefore, while the investing landscape
Table 11 Volatility timing during pre-COVID-19, Stage 1, Stage 2 and Stage 3 Periods
Country Fixed Effects = Yes, Time Fixed Effects = Yes represents significance at * at 10%, ** at 5% and ***1%
ϒim - pre-COVID ϒim - full period ϒim - stage 1 ϒim - stage 2 ϒim - stage 3
Low 0.01941 0.02237 0.02387 0.02632 0.02271t-stat 1.11619 1.25603 0.90476 1.36768 1.274872 0.03371 0.02757 0.02941 0.03243 0.02798t-stat 1.57345 1.25990 1.09758 1.11370 1.278803 − 0.01110** 0.05272 0.05301 0.05554 0.05351t-stat − 2.25955 1.17667 1.12718 0.74575 1.194324 − 0.01144** − 0.01163*** − 0.01252** − 0.02394** − 0.01180***t-stat − 2.04603 − 3.21976 − 2.27625 − 2.15855 − 3.26806High − 0.01284** − 0.03335*** − 0.09414*** − 0.02256*** − 0.03385***t-stat − 2.14396 − 3.32459 − 3.05626 − 3.25926 − 3.37446

371Human capital efficiency, performance, market, and volatility timing of asian equity funds…
Table 12 Volatility timing coefficient (ϒim) based on size sorts
Country Fixed Effects = Yes, Time Fixed Effects = Yes represents significance at * at 10%, ** at 5% and ***1%
Pre-COVID COVID-19 Complete Period
Top 30% Mid 40% Bottom 30% Top 30% Mid 40% Bottom 30%***
Panel ALow 0.01745 0.01869 0.02002 0.01161 0.01244 0.01333t-stat 1.00344 1.07494 1.15154 0.66783 0.71541 0.766392 0.03031 0.03247 0.03478 0.02017 0.02161 0.02315t-stat 1.41452 1.51531 1.62328 0.94141 1.00849 1.080353 − 0.00998** − 0.01069** − 0.01145** − 0.00664 − 0.00711 − 0.00762t-stat − 2.03131 − 2.17606 − 2.10255 − 1.35191 − 1.44824 − 1.399324 − 0.01028** − 0.01102** − 0.01180** − 0.00684*** − 0.00733*** − 0.00785t-stat − 1.99056 − 2.13239 − 2.28434 − 3.32080 − 2.41903 − 1.99049High − 0.01154*** − 0.01236*** − 0.01324*** − 0.00768*** − 0.00823*** − 0.00881**t-stat − 2.92831 − 3.13696 − 3.36049 − 2.94106 − 3.08853 − 2.23652
Stage 1 Stage 2
Top 30% Mid 40% Bottom 30% Top 30% Mid 40% Bottom 30%
Panel BLow 0.02332 0.02451 0.02625 0.02640 0.02904 0.03289t-stat 0.88384 0.92911 0.99518 1.37187 1.50905 1.709252 0.02873 0.03021 0.03235 0.03253 0.03578 0.04053t-stat 1.07221 1.12712 1.20727 1.11711 1.22882 1.391843 0.05178 0.05443 0.05831 0.05571 0.06128 0.06941t-stat 1.10113 1.15753 1.23984 0.74804 0.82284 0.932014 − 0.01223** − 0.01285** − 0.01377*** − 0.02401** − 0.02641** − 0.02991***t-stat − 2.22363 − 2.33753 − 2.50375 − 2.16516 − 2.38168 − 2.69765High − 0.09196*** − 0.09667*** − 0.10355*** − 0.02263*** − 0.02490*** − 0.02820***t-stat − 2.98561 − 3.13854 − 3.36172 − 3.26924 − 3.59616 − 4.07325
Stage 3
Top 30% Mid 40% Bottom 30%
Low 0.02471 0.02452 0.02648t-stat 1.38733 1.37673 1.486872 0.03045 0.03022 0.03263t-stat 1.39159 1.38097 1.491453 0.05824 0.05779 0.06241t-stat 1.29967 1.28975 1.392934 − 0.01284*** − 0.01274*** − 0.01376***t-stat − 3.55632 − 3.52917 − 3.81150High − 0.03684*** − 0.03656*** − 0.03948***t-stat − 3.67210 − 3.64407 − 3.93560

372 J. A. Hasnaoui et al.
is competitive, the managers that tend to show better per-formance have no shortage of funds flow. Consequently, if funds in emerging markets focus on investment in human resources, upskill their managers’ investment strategies, incentivize performance, it will enhance human capital effi-ciency. As evident from our results, this will lead to better performance vis-à-vis their peers.
We would like to note a caveat here. Our findings are mostly concentrated in the context of COVID-19, with a relatively little reflection on pre-COVID period. Therefore, a possible extension of this study could be to assess how the link between HCE and funds performance evolves during different market cycles.
Conclusion
The impact of human capital efficiency on services has been extensively documented in the previous literature. The same is the case for financial services, where many studies relate human capital efficiency with the performance of banking, insurance, and other non-banking institutions. However, until now, no study has attempted to link the performance of mutual funds with HCE. In this study, we try to address this gap by employing various performance, market, and volatility timing measures. While the impact of HCE should be positive in general, the stressed scenario like COVID-19 provides a further unique opportunity to assess the persis-tence of HCE during economic pressures. Our findings are
Table 13 Stochastic dominance (SD1, SD2, SD3 and SD4)
Panel A
Pre-COVID Period Complete COVID Period
Low 2 3 4 High Low 2 3 4 High
Low < < < < Low < < < <2 > < < < 2 > < < <3 > > < < 3 > > < <4 > > > < 4 > > > <High > > > > High > > > >
Panel B
Stage 1 Stage 2
Low 2 3 4 High Low 2 3 4 High
Low < < < < Low < < < <2 > < < < 2 > < < <3 > > < < 3 > > < <4 > > > < 4 > > > <High > > > > High > > > >
Stage 3
Low 2 3 4 High
Low < < < <2 > < < <3 > > < <4 > > > <High > > > >

373Human capital efficiency, performance, market, and volatility timing of asian equity funds…
derived from a comprehensive sample of equity funds from most affected Asian countries. The results suggest that funds with higher HCE demonstrated resilience during the out-break. This remained robust regardless of the performance measure used. Similarly, funds ranked better on HCE exhib-ited market and volatility timing, which remained absent for funds with lower HCE. The consistency remains even after
considering the variation in size and countries with unique investing paradigms. Our findings’ significance was higher during the COVID-19 period compared to six months before the global outbreak. This indicates that human capital effi-ciency contributes toward funds performance, and like other services, this should be an important strategic consideration for mutual funds.
Table 14: Robustness analysis on risk adjusted performance, market and volatility timing (excluding funds from China and Iran)
Country Fixed Effects = Yes, Time Fixed Effects = Yes for Jensen’s Alpha, Market and Volatility Timing***Represents significance at 1%, ** at 5% and * at 10%
Pre-COVID period
Adj. sharpe ratio Sortino ratio Jensen’s alpha Market timing (λ) Volatility timing (ϒim)
Low 0.00484*** 0.00255** 0.01089** 0.00816 0.023852 0.00656*** 0.00330* 0.00997* 0.04934 0.041433 0.00721* 0.00346** 0.01684** 0.02157 − 0.01364**4 0.01419* 0.00647* 0.01971*** 0.03645** − 0.01406***High 0.01989*** 0.01085** 0.02910* 0.01608** − 0.01578**
COVID-19 period complete
Adj. sharpe ratio Sortino ratio Jensen’s alpha Market timing (λ) Volatility timing (ϒim)
Low − 0.02357*** − 0.00970** − 0.01626*** − 0.03404*** 0.029422 − 0.01004* − 0.00394** − 0.00897*** − 0.01515** 0.036253 − 0.00058* − 0.00022* 0.00820* 0.00241 0.069334 0.01188*** 0.00327** 0.01383*** 0.03310** − 0.01529***High 0.01389*** 0.00559*** 0.02398*** 0.03533*** − 0.04386***
Stage 1
Adj. sharpe ratio Sortino ratio Jensen’s alpha Market timing (λ) Volatility timing (ϒim)
Low 0.00443** 0.00234* 0.01093** − 0.02448** 0.018352 0.00601** 0.00303** 0.01001* − 0.01089** 0.022613 0.00661** 0.00317** 0.01691*** 0.00173 0.040754 0.01300** 0.00593** 0.01979*** 0.02380 − 0.00962**High 0.01823** 0.00995** 0.02923** 0.02584** − 0.07237**
Stage 2
Adj. sharpe ratio Sortino ratio Jensen’s alpha Market timing (λ) Volatility timing (ϒim)
Low − 0.05085*** − 0.00601** − 0.01628*** − 0.03209** 0.021222 − 0.03540** − 0.00398** − 0.01874** − 0.01428 0.026153 − 0.01881* − 0.00202** − 0.03634* 0.00227 0.044784 0.00923*** 0.00094** 0.00348** 0.03121*** − 0.01930***High 0.01702*** 0.01103** 0.02218*** 0.04178*** − 0.01820***
Stage 3
Adj. sharpe ratio Sortino ratio Jensen’s alpha Market timing (λ) Volatility timing (ϒim)
Low − 0.09534** − 0.01208*** − 0.05732*** − 0.04289** 0.028272 − 0.06637*** − 0.00801*** − 0.04460** − 0.01909** 0.034833 − 0.03527** − 0.00405* − 0.03632* 0.00303 0.066624 − 0.01730** − 0.00215** − 0.02374** 0.04170*** − 0.01469**High 0.03191** 0.01967*** 0.05309*** 0.05514*** − 0.04214**

374 J. A. Hasnaoui et al.
References
Afzal, A., and N. Mirza. 2011. Size and value premium in international portfolios: evidence from 15 european countries. Czech Journal of Economics and Finance (Finance a Uver), 61(2): 173–190.
Al-Khazali, O., H.H. Lean, and A. Samet. 2014. Do Islamic stock indexes outperform conventional stock indexes? A stochastic dominance approach. Pacific Basin Finance Journal 28: 29–46. https:// doi. org/ 10. 1016/j. pacfin. 2013. 09. 003.
Asare, N., A.L. Alhassan, M.E. Asamoah, and M. Ntow-Gyamfi. 2017. Intellectual capital and profitability in an emerging insurance mar-ket. Journal of Economic and Administrative Sciences. https:// doi. org/ 10. 1108/ jeas- 06- 2016- 0016.
Berk, J.B., and J.H. van Binsbergen. 2015. Measuring skill in the mutual fund industry. Journal of Financial Economics. https:// doi. org/ 10. 1016/j. jfine co. 2015. 05. 002.
Berk, J.B., R. Stanton, and J. Zechner. 2010. Human capital, bank-ruptcy, and capital structure. Journal of Finance. https:// doi. org/ 10. 1111/j. 1540- 6261. 2010. 01556.x.
Brixiová, Z., T. Kangoye, and M. Said. 2020. Training, human capital, and gender gaps in entrepreneurial performance. Economic mode-ling 85: 367–380. https:// doi. org/ 10. 1016/j. econm od. 2019. 11. 006.
Busse, J.A. 1999. Volatility timing in mutual funds: Evidence from daily returns. Review of Financial Studies. https:// doi. org/ 10. 1093/ rfs/ 12.5. 1009.
Cai, B., T. Cheng, and C. Yan. 2018. Time-varying skills (versus luck) in U.S. active mutual funds and hedge funds. Journal of Empiri-cal Finance 49: 81–106. https:// doi. org/ 10. 1016/j. jempfi n. 2018. 09. 001.
Carhart, M.M. 1997. On persistence in mutual fund performance. Journal of Finance. https:// doi. org/ 10. 1111/j. 1540- 6261. 1997. tb038 08.x.
Corbet, S., C. Larkin, and B. Lucey. 2020. The contagion effects of the COVID-19 pandemic: Evidence from Gold and Cryptocur-rencies. Finance Research Letters. https:// doi. org/ 10. 1016/j. frl. 2020. 101554.
Damianov, D.S., and A.H. Elsayed. 2020. Does Bitcoin add value to global industry portfolios?. Economics Letters 191: 108935. https:// doi. org/ 10. 1016/j. econl et. 2019. 108935.
Davidson, R., and J.Y. Duclos. 2000. Statistical inference for stochastic dominance and for the measurement of poverty and inequality. Econometrica 68(6): 1435–1464. https:// doi. org/ 10. 1111/ 1468- 0262. 00167.
Fama, E.F. and K.R. French. 2010. Luck versus skill in the cross-sec-tion of mutual fund returns. The Journal of Finance, 65: 1915–1947. https:// doi. org/ 10. 1111/j. 1540- 6261. 2010. 01598.x.
Gao, J., N. O’Sullivan, and M. Sherman. 2020. An evaluation of Chi-nese securities investment fund performance. Quarterly Review of Economics and Finance 76: 249–259. https:// doi. org/ 10. 1016/j. qref. 2019. 08. 007.
Ghasseminejad, S., and M.R. Jahan-Parvar. 2021. The impact of finan-cial sanctions: The case of Iran. Journal of Policy Modeling. https:// doi. org/ 10. 1016/j. jpolm od. 2021. 03. 001.
Golec, J. 1996. The effects of mutual fund managers’ characteristics on their portfolio performance, risk and fees. Financial Services Review 5(2): 133–147. https:// doi. org/ 10. 1016/ s1057- 0810(96) 90006-2.
Guo, X., X. Zhu, W.K. Wong, and L. Zhu. 2013. A note on almost sto-chastic dominance. Economics Letters 121(2): 252–256. https:// doi. org/ 10. 1016/j. econl et. 2013. 08. 020.
Henriksson, R.D., and R.C. Merton. 1981. On market timing and investment performance. II. Statistical procedures for evaluating forecasting skills. The Journal of Business 54(4): 513–533. https:// doi. org/ 10. 2307/ 23527 22.
Hitt, M.A., L. Bierman, K. Shimizu, and R. Kochhar. 2001. Direct and moderating effects of human capital on strategy and
performance in professional service firms: A resource-based perspective. Academy of Management Journal. https:// doi. org/ 10. 2307/ 30693 34.
Hsu, C.C., and M.L. Chen. 2017. The timing of low-volatility strat-egy. Finance Research Letters 23: 114–120. https:// doi. org/ 10. 1016/j. frl. 2017. 05. 014.
Hutson, E., E. Laing, and M. Ye. 2019. Mutual fund ownership and foreign exchange risk in Chinese firms. Journal of International Financial Markets, Institutions and Money 60: 169–192. https:// doi. org/ 10. 1016/j. intfin. 2018. 12. 012.
Jensen, M.C. 1968. The performance of mutual funds in the period 1945–1964. The Journal of Finance. https:// doi. org/ 10. 2307/ 23254 04.
Ji, Q., D. Zhang, and Y. Zhao. 2020. Searching for safe-haven assets during the COVID-19 pandemic. International Review of Finan-cial Analysis 71: 101526. https:// doi. org/ 10. 1016/j. irfa. 2020. 101526.
Lemeshko, O., and O. Rejnuš. 2015. Performance evaluation of equity mutual funds in countries with emerging economies: Evidence from BRIC, CEE, sea and MENA regions. Procedia Economics and Finance 30: 476–486. https:// doi. org/ 10. 1016/ s2212- 5671(15) 01315-5.
Mirza, N., J.A. Hasnaoui, B. Naqvi, and S.K.A. Rizvi. 2020a. The impact of human capital efficiency on Latin American mutual funds during COVID-19 outbreak. Swiss Journal of Econom-ics and Statistics. https:// doi. org/ 10. 1186/ s41937- 020- 00066-6.
Mirza, N., A. Hasnaoui, and B. Rahat. 2020. “Credit quality and stock returns of commercial banks.” Economics Bulletin, AccessEcon 40(1): 1–17.
Mirza, Nawazish, J.A. Hasnaoui, B. Naqvi, and S.K.A. Rizvi. 2020c. The impact of human capital efficiency on Latin American mutual funds during COVID-19 outbreak. Swiss Journal of Economics and Statistics 156(1): 16. https:// doi. org/ 10. 1186/ s41937- 020- 00066-6.
Mirza, Nawazish, B. Naqvi, B. Rahat, and S.K.A. Rizvi. 2020d. Price reaction, volatility timing and funds’ performance during COVID-19. Finance Research Letters. https:// doi. org/ 10. 1016/j. frl. 2020. 101657.
Mnif, E., A. Jarboui, and K. Mouakhar. 2020. How the cryptocur-rency market has performed during COVID 19? A multifractal analysis. Finance Research Letters. https:// doi. org/ 10. 1016/j. frl. 2020. 101647.
Moreira, A., and T. Muir. 2019. Should long-term investors time volatility?. Journal of Financial Economics 131(3): 507–527. https:// doi. org/ 10. 1016/j. jfine co. 2018. 09. 011.
Muñoz, F. 2019. The ’smart money effect’ among socially responsi-ble mutual fund investors. International Review of Economics and Finance 62: 160–179. https:// doi. org/ 10. 1016/j. iref. 2019. 03. 010.
Nawaz, T. 2019. Exploring the nexus between human capital, cor-porate governance and performance: Evidence from islamic banks. Journal of Business Ethics. https:// doi. org/ 10. 1007/ s10551- 017- 3694-0.
Nawazish, M., M.S. Saeed, and K. Abbas Rizvi. 2013. The pricing of size, book to market and financial leverage in Euro stocks. Ekonomska Istrazivanja 26(2): 177–190. https:// doi. org/ 10. 1080/ 13316 77x. 2013. 11517 615.
Nieves, J., and A. Quintana. 2018. Human resource practices and inno-vation in the hotel industry: The mediating role of human capital. Tourism and Hospitality Research. https:// doi. org/ 10. 1177/ 14673 58415 624137.
Pezier, J., and A. White. 2006. The relative merits of investable hedge fund indices and of funds of hedge funds in optimal passive port-folios. ICMA Centre Discussion Papers in Finance, 1–32.

375Human capital efficiency, performance, market, and volatility timing of asian equity funds…
Pulic, A. 2000. VAIC—An accounting tool for IC management. Inter-national Journal of Technology Management. https:// doi. org/ 10. 1504/ ijtm. 2000. 002891.
Pulic, A., and M. Kolakovic. 2003. Value creation efficiency in the new economy. Global Business and Economics Review. https:// doi. org/ 10. 1504/ gber. 2003. 006201.
Reddy, K., N. Mirza, B. Naqvi, and M. Fu. 2017. Comparative risk adjusted performance of Islamic, socially responsible and con-ventional funds: Evidence from United Kingdom. Economic modeling. https:// doi. org/ 10. 1016/j. econm od. 2017. 07. 007.
Rizvi, S.K.A., N. Mirza, B. Naqvi, and B. Rahat. 2020. COVID-19 and asset management in EU: a preliminary assessment of per-formance and investment styles. Journal of Asset Management. https:// doi. org/ 10. 1057/ s41260- 020- 00172-3.
Sharif, A., C. Aloui, and L. Yarovaya. 2020. COVID-19 pandemic, oil prices, stock market, geopolitical risk and policy uncertainty nexus in the US economy: Fresh evidence from the wavelet-based approach. International Review of Financial Analysis 70: 101496. https:// doi. org/ 10. 1016/j. irfa. 2020. 101496.
Shehzad, K., L. Xiaoxing, and H. Kazouz. 2020. COVID-19’s disas-ters are perilous than global financial crisis: A rumor or fact?. Finance Research Letters. https:// doi. org/ 10. 1016/j. frl. 2020. 101669.
Shen, X., A.K. Tsui, and Z. Zhang. 2019. Volatility timing in CPF investment funds in Singapore: Do they outperform non-CPF funds?. Risks. https:// doi. org/ 10. 3390/ risks 70401 06.
Sortino, F.A., and L.N. Price. 1994. Performance measurement in a downside risk framework. The Journal of Investing. https:// doi. org/ 10. 3905/ joi.3. 3. 59.
Stowell, D.P. 2010. Investment Banking in 2008 (A). In an intro-duction to investment banks, hedge funds, and private equity (pp. 383–402). https:// doi. org/ 10. 1016/ b978-0- 12- 374503- 3. 00033-0.
Switzer, L.N., and Y. Huang. 2007. How does human capital affect the performance of small and mid-cap mutual funds?. Journal of Intellectual Capital 8(4): 666–681. https:// doi. org/ 10. 1108/ 14691 93071 08308 28.
Topcu, M., and O.S. Gulal. 2020. The impact of COVID-19 on emerging stock markets. Finance Research Letters. https:// doi. org/ 10. 1016/j. frl. 2020. 101691.
Treynor, J.L., and K.K. Mazuy. 1966. Can mutual funds outguess the market? Harvard Business Review , 44.
Vinod, H.D. 2004. Ranking mutual funds using unconventional utility theory and stochastic dominance. Journal of Empirical Finance 11(3): 353–377. https:// doi. org/ 10. 1016/j. jempfi n. 2003. 06. 002.
Wang, M.C., and M.Y. Cheng. 2014. The performance synergies between science and engineering and business management backgrounds of managers in high-tech mutual funds: Evidence from Taiwan. International Review of Economics and Finance 34: 211–229. https:// doi. org/ 10. 1016/j. iref. 2014. 07. 008.
Wang, Z., N. Wang, and H. Liang. 2014. Knowledge sharing, intel-lectual capital and firm performance. Management Decision. https:// doi. org/ 10. 1108/ MD- 02- 2013- 0064.
Wong, W.K., K.F. Phoon, and H.H. Lean. 2008. Stochastic domi-nance analysis of Asian hedge funds. Pacific Basin Finance Journal 16(3): 204–223. https:// doi. org/ 10. 1016/j. pacfin. 2007. 07. 001.
Yarovaya, L., N. Mirza, J. Abaidi, and A. Hasnaoui. 2021. Human Cap-ital efficiency and equity funds’ performance during the COVID-19 pandemic. International Review of Economics and Finance. https:// doi. org/ 10. 1016/j. iref. 2020. 09. 017.
Yi, L., Z. Liu, L. He, Z. Qin, and S. Gan. 2018. Do Chinese mutual funds time the market?. Pacific Basin Finance Journal 47: 1–19. https:// doi. org/ 10. 1016/j. pacfin. 2017. 11. 002.
Publisher’s Note Springer Nature remains neutral with regard to jurisdictional claims in published maps and institutional affiliations.
Jamila Abaidi Hasnaoui is an organizational psychologist and has diversified professional experience in the domain of Human Resource Management before starting her academic career. She obtained her PhD from the University of La Rochelle and currently associated as an Assistant Professor with Excelia Business School. Her research inter-ests mainly focus on well-being at work, psychosocial risks and their management and the role of human capital in corporate performance. Her recent papers have been published in the International Review of Finance and Economic and Swiss Journal of Economics and Statistics, among others.
Syed Kumail Abbas Rizvi is a Chartered Financial Analyst (CFA) and Certified Financial Risk Manager (FRM) by profession and is simul-taneously occupied with Academic and Corporate Institutions in the domain of Investment Analysis and Risk Management. He holds a doctoral in Financial economics from Pantheon Sorbonne (University of Paris 1). He is currently working as Professor of Finance at Lahore School of Economics. Dr. Rizvi has published several research articles in top quality journals (ABDC A and ABS 3).
Krishna Reddy is a Senior Academic in the Postgraduate Studies Team in the Faculty of Health, Education, and Environment at the Rotorua and Windermere Campuses of the Toi Ohomai Institute of Technol-ogy, New Zealand. He is also a a Visiting International Professor at the University of Münster, Münster, Germany, and a Visiting Professor at the Indian Institute of Management, Tiruchirappalli, India. Dr. Reddy’s teaching area includes Corporate Finance, Governance, Planning, Risk Management, Mergers and Acquisitions, and Bank Management. Dr. Reddy’s research areas include Corporate Governance, Corporate Finance, Financial literacy, Small Business Finance, and Portfolio Management. His has published in many high-quality reputable jour-nals like Energy Economics, Pacific-Basin Finance Journal, Economic modeling, Finance Research Letters, etc.
Nawazish Mirza is Full Professor of Finance at Excelia Business School, France. He graduated with a Ph.D. from the University of Paris Dauphine and worked in investment banking and credit ratings prior to his academic stint. His research interests include credit risk, fund man-agement, technological innovations, financial intermediation and valu-ations. He has extensive consulting experience in credit ratings, invest-ment banking and valuation of new technologies. His recent research has been published in the International Review of Economics and Finance, Economic modeling, Pacific-Basin Finance, Technological Forecasting and Social Change, Finance Research Letters, Resources Policy, Journal of Environmental Management, among others.
Bushra Naqvi is Associate Professor at Suleman Dawood School of Business, Lahore University of Management Sciences. She holds a doctorate in financial economics from Pantheon Sorbonne (University of Paris 1). Her research interests lie in the field of financial econom-ics, financial markets and energy and tourism finance. Dr. Naqvi has published several research articles in top quality journals (ABDC A and ABS 3). Dr. Naqvi also owns the charter of Financial Risk Manager (FRM) from Global Association of Risk Professionals (GARP), USA.


![Outline Human capital theory by C. Echevarriahomepage.usask.ca/~ece220/econ221/4-HC [Compatibility Mode].pdf · Human capital theory by C. Echevarria ... Human capital Human capital](https://img.dokumen.tips/doc/110x75/5ae0d5467f8b9a6e5c8df29c/outline-human-capital-theory-by-c-ece220econ2214-hc-compatibility-modepdfhuman.jpg)