Embed Size (px)
Citation preview

HUMAN CAPITAL AND THE EVALUATION OF UNIVERSITY EFFICIENCY
Pietro Giorgio Lovaglio, Giorgio Vittadini
Editor: Daniele Vidoni
EUR 23253 EN
The mission of the JRC is to provide customer-driven scientific and technical support for the conception, development, implementation and monitoring of EU policies. As a service of the European Commission, the JRC functions as a reference centre of science and technology for the Union. Close to the policy-making process, it serves the common interest of the Member States, while being independent of special interests, whether private or national. European Commission Joint Research Centre Contact information Address: Via E.Fermi, 1 Ispra (VA) Italy E-mail: [email protected] Tel.: 0332785529 Fax: 0332785733 http://www.jrc.ec.europa.eu/ http://crell.jrc.ec.europa.eu/ Legal Notice Neither the European Commission nor any person acting on behalf of the Commission is responsible for the use which might be made of this publication. A great deal of additional information on the European Union is available on the Internet. It can be accessed through the Europa server http://europa.eu/ JRC43397 EUR 23253 EN ISBN: 978-92-79-06161-5 ISSN: 1018-5593 DOI: 10.2788/68077 Luxembourg: Office for Official Publications of the European Communities © European Communities, 2008 Reproduction is authorised provided the source is acknowledged Printed in Italy
Foreword Policies for Education and Training form an important part of the EU’s Lisbon strategy. Governments see the contribution of education and training systems as vital for the achievement of the broader goals of growth, employment, social cohesion and individual well-being. As their contribution to the Lisbon Strategy, Ministers for Education adopted common objectives for the improvement of education and training systems and a work program to achieve these objectives. The program, known as the Education & Training 2010 program,1 is implemented through the open method of coordination, and indicators and benchmarks play an important monitoring role and provide support to the exchange of experiences and good practices. As recognized in the Council Conclusions “the establishment of the ‘research unit on lifelong learning’ at the Joint Research Centre in Ispra can significantly increase the Commission’s research capacity in terms of the development of new indicators”.2 The establishment of the Centre for Research on Lifelong Learning (CRELL) at the Joint Research Centre (JRC) in Ispra has therefore emerged from the need better analyze and monitor the education and training systems in Europe and their contribution to the achievement of the Lisbon goals. CRELL has started its operation at the beginning of 2005 in Ispra within the Institute for the Protection and Security of the Citizen (IPSC), Unit of Applied Statistics and Econometrics. CRELL research develops along two main streamlines:
Skills for the Knowledge Society and Greater Social Cohesion Education and training for human capital formation
The latter research strand focuses on the fact that education and training produce subsequent private benefits in terms of earnings and employment prospects. Human capital accumulation is also valuable for the society as a whole. In particular, education has sizable market benefits through its contribution to economic growth as well as non market externalities. Despite these benefits, the performance of educational and training systems varies greatly across EU countries. The evaluation of the consequences associated with current choices and designs of education and training systems is thus necessary. The research activities aim to investigate the labor market outcomes associated with human capital accumulation and to further study the internal and external efficiency of educational systems with the purpose to contribute to the current debate on how to improve the effectiveness of expenditures in education. Within this research area, the JRC-CRELL organized an international symposium “Methodological Tools for Accountability Systems in Education”, Ispra, 6-9 February, 2006. The symposium attracted eminent speakers from the US, Australia, UK, Hong Kong, Europe, the Commission, JRC, OECD and IEA and provided a high-level forum for a methodological and technical debate on the characteristics of accountability systems for education. The conclusions of the work indicate that knowledge of the social and individual factors that influence student achievement, availability of longitudinal data, existence of large scale international projects, and reliable measures of student achievement are some of the essential ingredients for producing tools for observing and sustaining the progress of European educational systems. Moreover, Multilevel modelling and Rasch analysis are the two statistical methodologies that provide most insights with respect to the foresaid mix. The following paper, by Pier Giorgio Lovaglio and Giorgio Vittadini, is one of the contributions to the workshop and focuses on the process of evaluation of the external efficiency of higher education, defined as the effect of university education on the long-term income of graduates; in particular the authors propose the use of human capital as the outcome of interest and a proper methodology to estimate it as the latent variable in the presence of reflective, formative and concomitant indicators. Finally, in the application of the methodology a comparison is made between human capital in Italy and the USA, estimated using the most recent national sample surveys on income and wealth.
Daniele Vidoni JRC-CRELL
1 Joint Interim Report of the Council and the Commission: “Education & Training 2010: the success of the Lisbon strategy hinges on urgent reforms (2004) 2 Council Conclusions of May 2005 (2005/C 141/04)

Human Capital and the Evaluation of University
Efficiency
Pietro Giorgio Lovaglio & Giorgio Vittadini
Department of Statistics, University of Bicocca-Milan
1. Human capital, the outcome of university efficiency evaluation A strong consensus emerges in accountability studies regarding the necessity of
overcoming the problem of “selection bias” (Garen, 1984), due to the non-
randomisation of individuals between treatments (different universities or university
degrees); this concerns the “coeteris paribus” evaluation process (effectiveness and
efficiency of higher education), and the adjustment of “outcome” for the effects of
individual characteristics, school or university resources and context variables linked to
the local market or geographical area (Fitz-Gibbon, 1997; Scheerens & Bosker, 1997;
Hanushek, 1997).
In order to resolve this problem, a series of studies (Bryk and Weisberg, 1977; Rogosa
et al., 1982; Rogosa & Willett, 1985; Rogosa, 1995) use growth modelling to
understand individual change, while many other authors propose multilevel models
(Goldstein, 1995). Multilevel models are used with repeated measures data, being
observations ‘nested’ within individuals, in order to accommodate the fixed effects of
treatment and time and the covariation between observations on the same subject at
different times.
The quite ample literature regarding mixed effects models, multilevel models and
models for longitudinal data offers solutions for treating data with complex hierarchical
structures, considering both individual and aggregate levels of analysis (Goldstein,
1995; Goldstein & Spiegelhalter, 1996; Verbeke & Molenberghs, 2000). Particular
features in the applications make the field of education a fertile ground for applications
based on suitable mixed-effects regression models applied to observational studies
(Copas & Eguchi, 2001; Rosenbaum, 2002; Fitz-Gibbon, 1997; Scheerens & Booker,
1997).

In the evaluation of accountability systems, a list of the most important methodological
issues would surely comprise: inference in non-linear models and mixed effects models
(McCulloch & Searle, 2000); efficiency and robustness of fixed and random effects
estimators (Neuhaus & Kalbfleisch, 1998); treatment of endogenous regressors and
omitted variable problems (Frees, 2001; Heagerty & Kurland, 2001); treatment of data
with hierarchical and/or cross-classified structures (Goldstein, 1995); modelling of
latent variables and outcome variables with presence of zeros (Tooze et al., 2002);
generalised linear models with endogeneity and selection bias (Johnson et al., 2003).
Concerning university accreditation processes, while in the last twenty years numerous
studies have analysed relative effectiveness between different agents based on outcomes
in different universities (Bryk et al., 1998; Biggeri et al., 2001; Chiandotto, 2005), there
are very few that provide an analysis of external efficiency.
The extension of external efficiency analysis is not limited by methodological problems.
In effect, it is possible to use the multilevel model in a longitudinal version with random
effects to evaluate relative impact and external efficiency in universities (Lovaglio &
Vittadini, 2006), defined as the effect of higher education on the income of university
graduates. However, as education and economics literature suggests (World Bank,
1992; OECD, 1986; Dagum & Slottje, 2000; United Nations, 2002; Wöβmann, 2003),
income does not represent the appropriate outcome for the measurement of the long-
term monetary effects of higher education. The evaluation of external efficiency should
more properly be based on human capital (HC), defined as an individual’s expected
earned income relative to the skills and abilities acquired through education (Becker,
1964), or, more precisely, that part of earned income related to skills and abilities
acquired through education. The present paper aims to furnish an initial contribution
towards this aim.
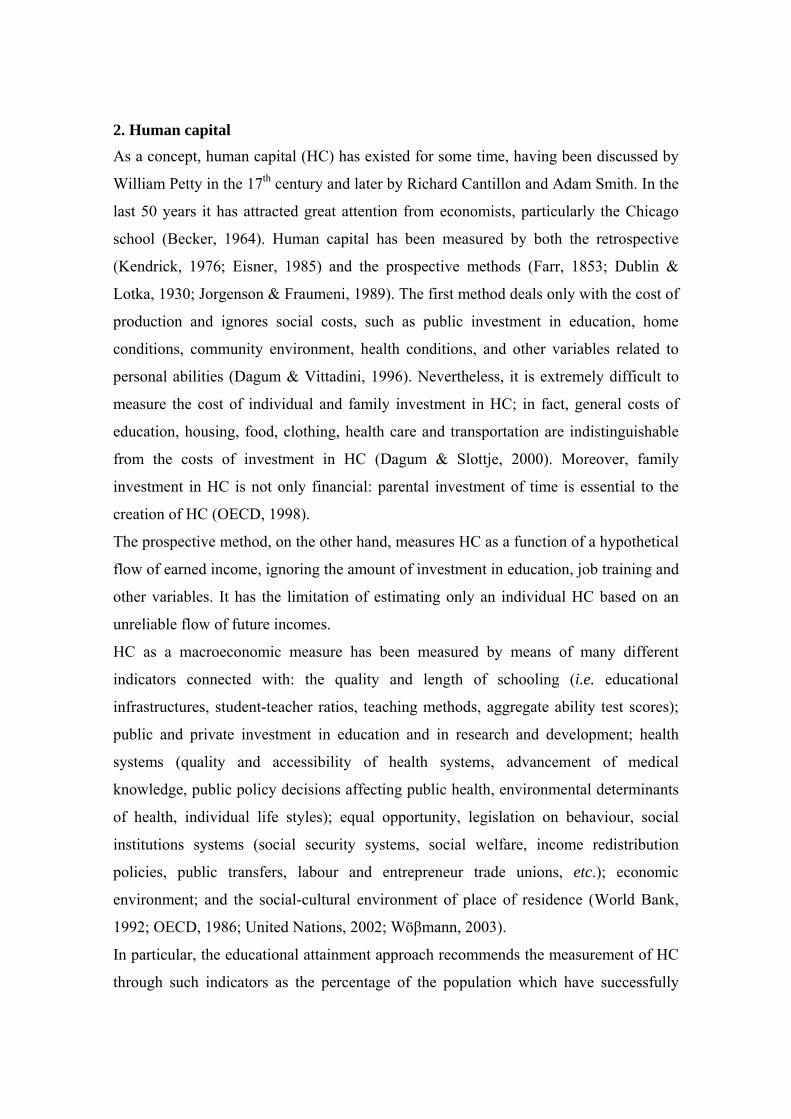
2. Human capital As a concept, human capital (HC) has existed for some time, having been discussed by
William Petty in the 17th century and later by Richard Cantillon and Adam Smith. In the
last 50 years it has attracted great attention from economists, particularly the Chicago
school (Becker, 1964). Human capital has been measured by both the retrospective
(Kendrick, 1976; Eisner, 1985) and the prospective methods (Farr, 1853; Dublin &
Lotka, 1930; Jorgenson & Fraumeni, 1989). The first method deals only with the cost of
production and ignores social costs, such as public investment in education, home
conditions, community environment, health conditions, and other variables related to
personal abilities (Dagum & Vittadini, 1996). Nevertheless, it is extremely difficult to
measure the cost of individual and family investment in HC; in fact, general costs of
education, housing, food, clothing, health care and transportation are indistinguishable
from the costs of investment in HC (Dagum & Slottje, 2000). Moreover, family
investment in HC is not only financial: parental investment of time is essential to the
creation of HC (OECD, 1998).
The prospective method, on the other hand, measures HC as a function of a hypothetical
flow of earned income, ignoring the amount of investment in education, job training and
other variables. It has the limitation of estimating only an individual HC based on an
unreliable flow of future incomes.
HC as a macroeconomic measure has been measured by means of many different
indicators connected with: the quality and length of schooling (i.e. educational
infrastructures, student-teacher ratios, teaching methods, aggregate ability test scores);
public and private investment in education and in research and development; health
systems (quality and accessibility of health systems, advancement of medical
knowledge, public policy decisions affecting public health, environmental determinants
of health, individual life styles); equal opportunity, legislation on behaviour, social
institutions systems (social security systems, social welfare, income redistribution
policies, public transfers, labour and entrepreneur trade unions, etc.); economic
environment; and the social-cultural environment of place of residence (World Bank,
1992; OECD, 1986; United Nations, 2002; Wöβmann, 2003).
In particular, the educational attainment approach recommends the measurement of HC
through such indicators as the percentage of the population which have successfully

completed various levels of formal education, adult literacy rates, school enrolment
ratios, average years of schooling or number of person school-years embodied in the
labour force (OECD, 1998; Wöβmann, 2003). Nevertheless, the most used proxies of
macroeconomic differences in the equality of educational systems (i.e. educational
infrastructure, student-teacher ratios, ratio of public spending on education to GDP,
educational expenditure per student, teachers’ salaries) are not strongly and consistently
linked to acquired cognitive skills (Hanushek, 1996; Wöβmann, 2003). Instead, it has
been claimed that not only is the quantity of education important but also the quality of
years of schooling, i.e. “the cognitive skills learned during each one of these years”
(Wöβmann, 2003). In this sense the quality ranking of schools and universities attended,
or the degree of centralisation of examinations, as well as the level of a school’s
autonomy are all strongly connected to the quality of an educational institution, and can
therefore also be used as proxies of HC.
Moreover, different skills or abilities (problem solving, self-discipline, numeracy) tested
at the end of school or university attendance are directly connected with investment in
HC and could therefore belong to formative indicators for estimating HC (Hanushek &
Kimko, 2000; Wöβmann, 2003). For this reason international agencies propose tests in
general literature (IALS, OECD) or mathematics and science (for a list see OECD,
1998; Hanushek & Kimko, 2000; Wöβmann 2003). Clearly this information is
extremely useful for estimating the macroeconomic aggregate HC.

3. Estimation of human capital The personal (household) HC is defined as the present value of a flow of earned income,
throughout an individual’s life span, generated by his/her ability, home and social
environments, and investments in education, i.e. the set of working attributes of a
person that generate a steady flow of income.
From a methodological point of view, HC is a latent variable linked by a set of
formative indicators (that define it as combination) and a set of reflective indicators
(that represent its effects).
Therefore, individual or household HC–indicators such as years of schooling must be
taken into account in order to measure HC as a latent variable (LV), even if these
indicators are not sufficient to quantify the stock of HC.
The aggregate prospective method suggests quantifying the HC stock of an individual
or a household by measuring earning power (Le et al., 2003); indeed, the rate of
earnings of university graduates compared to that of non-graduate workers does provide
a measure of the former’s HC (OECD, 1998). Thus, as the prospective method suggests,
the rate of return of earned income must be taken into account in order to measure the
effects of HC investment. In this way, the household lifelong income based on personal
income (higher post-tax earnings, extra tax earnings, capital income derived by
investment in HC (OECD, 1998) actualised by means of an adequate actuarial method
(United Nations, 2002) can be considered as proxies of the effects of investment in HC
and thus used as reflective indicators.
The method we now present for the estimation of household human capital takes
information from national surveys on household income and wealth which combine
reflective indicators (information about household income) and formative indicators,
linked to schooling, work experience, parents’ conditions (head and spouse of the
household).
Hence, let F be the nxp full rank matrix of p mean zero formative indicators and Y the
nxq matrix of q reflective indicators, substituting the measurement equation for HC (h)
from its formative indicators (1) in the reflective equation (2), describing the effect of h,
(nx1) vector, on reflective variables Y:

h=Fg+u E(u′u)=σ2h (1)
Y=hk′+W E(W′W)=diag(Θ) (2)
the reduced form (RF) becomes
Y=FΛ+ E E(e)=0 E(ee′) = Ω =σ2h kk′+Θ (3)
where Λ=gk′ is the regression parameters matrix of the reduced form (g is a px1 vector,
and k a qx1 vector) e are columns of E, where E=(uk′+W) embeds the errors of both
equations (u is a nx1 vector of errors in variables and W a nxq matrix of errors in
equations), where Ω is the RF matrix of errors covariance.
Equation (3) reveals two forms of over-identification: one typical of econometric
models regarding the reduced rank of Λ (the non-redundant elements of Λ are
expressible in a smaller number of parameters that are function of k, g) and the second,
regarding the elements of Ω (the non-redundant elements of Ω are expressible in a
smaller number of parameters that are function of σ2h, Θ, k), is typical of factor models
where the role of loadings, common and unique factors are played by k, u and W
respectively.
Bollen & Davis (1994) furnish extremely restrictive rules for examining the
identification of similar models, which, even if perfectly identified, are based on highly
restrictive assumptions regarding the unitary rank of the matrix Λ, on the strong
structure of Ω (assumed to be diagonal), and the multivariate normality assumed for Y
(Joreskog & Goldberger, 1975).
Finally, in situations of a lack of relevant observed variables for the measurement of a
LV, it is not reasonable to suppose a zero correlation between the error disturbances
(specified in the diagonal matrix Θ) and thus between multiple indicators of the same
latent variable. Hence, abandoning the hypothesis of independence between columns of
W, a new specification for Θ (unstructured) reveals that the correlations of e are no
longer modelled in a factorial way; in other words, ignoring the hypothesis of indicators
with mutually independent errors, once the disturbances between indicators are allowed
to be correlated, “nothing is gained by retaining a disturbance in the causal equation
error” (Hauser & Goldberger, 1971: 100), because it is impossible to distinguish
empirically whether the residual correlation was attributable to common disturbance u
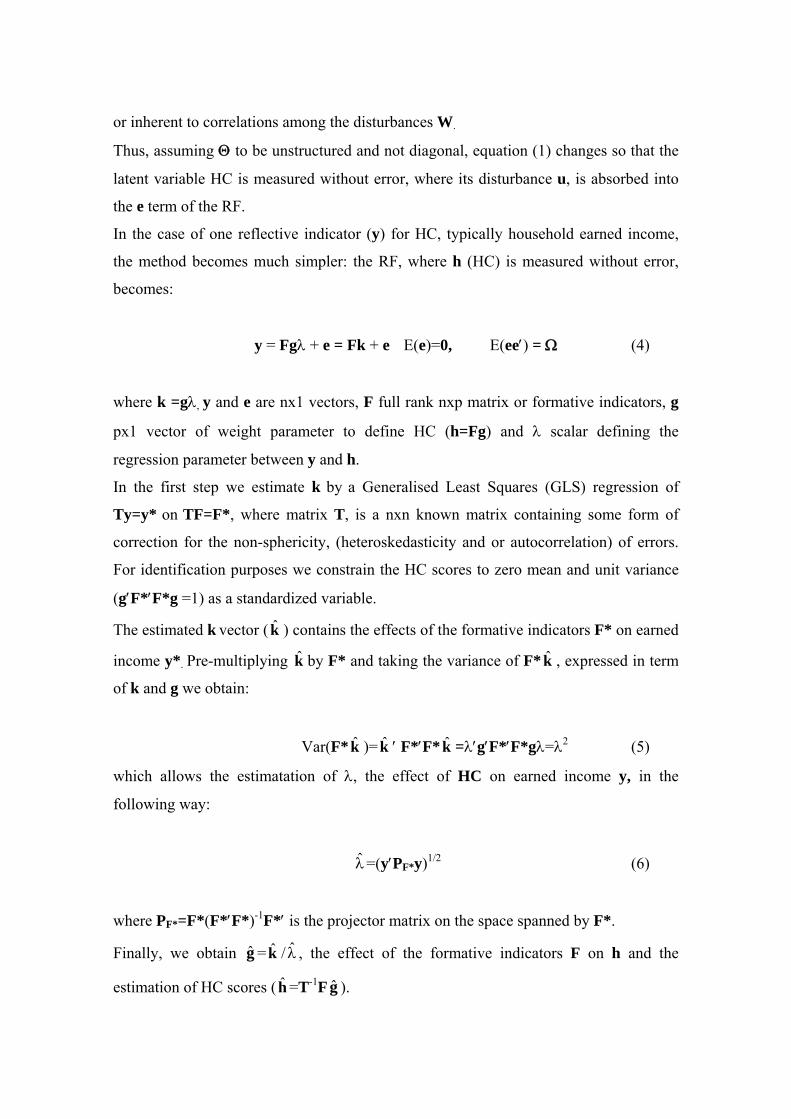
or inherent to correlations among the disturbances W.
Thus, assuming Θ to be unstructured and not diagonal, equation (1) changes so that the
latent variable HC is measured without error, where its disturbance u, is absorbed into
the e term of the RF.
In the case of one reflective indicator (y) for HC, typically household earned income,
the method becomes much simpler: the RF, where h (HC) is measured without error,
becomes:
y = Fgλ + e = Fk + e E(e)=0, E(ee′) = Ω (4)
where k =gλ, y and e are nx1 vectors, F full rank nxp matrix or formative indicators, g
px1 vector of weight parameter to define HC (h=Fg) and λ scalar defining the
regression parameter between y and h.
In the first step we estimate k by a Generalised Least Squares (GLS) regression of
Ty=y* on TF=F*, where matrix T, is a nxn known matrix containing some form of
correction for the non-sphericity, (heteroskedasticity and or autocorrelation) of errors.
For identification purposes we constrain the HC scores to zero mean and unit variance
(g′F*′F*g =1) as a standardized variable.
The estimated k vector ( ) contains the effects of the formative indicators F* on earned
income y*
k
. Pre-multiplying by F* and taking the variance of F* , expressed in term
of k and g we obtain:
k k
Var(F* k )=k ′ F*′F* =λ′g′F*′F*gλ=λˆ ˆ k 2 (5)
which allows the estimatation of λ, the effect of HC on earned income y, in the
following way:
=(y′Pλ F*y)1/2 (6)
where PF*=F*(F*′F*)-1F*′ is the projector matrix on the space spanned by F*.
Finally, we obtain =k / , the effect of the formative indicators F on h and the
estimation of HC scores ( =T
g ˆ λ
h -1F g ). ˆ
The case of mixed indicators can be resolved choosing an approach which transforms
the qualitative indicators following some optimality criteria; one of them is the
methodology of optimal scaling algorithms (ALSOS, Gifi 1981) which generalise
classical multivariate techniques, such as principal components, multiple regression,
and canonical correlation, sequentially estimating the parameter vector g and the
quantifications of categorical indicators fcj (contained in the qualitative block Fc of F)
by means of a unique algorithm, maximizing the same criteria of the statistical model.
Therefore, from the statistical point of view, the estimated value of h is that linear
combination of mixed formative indicators F that best fits the reflective indicator y. Its
estimation is consistent with well-established economic theory.
The case of a LV linked with a set of many reflective indicators is described in section
3.1 where the situation of concomitant indicators is also considered.
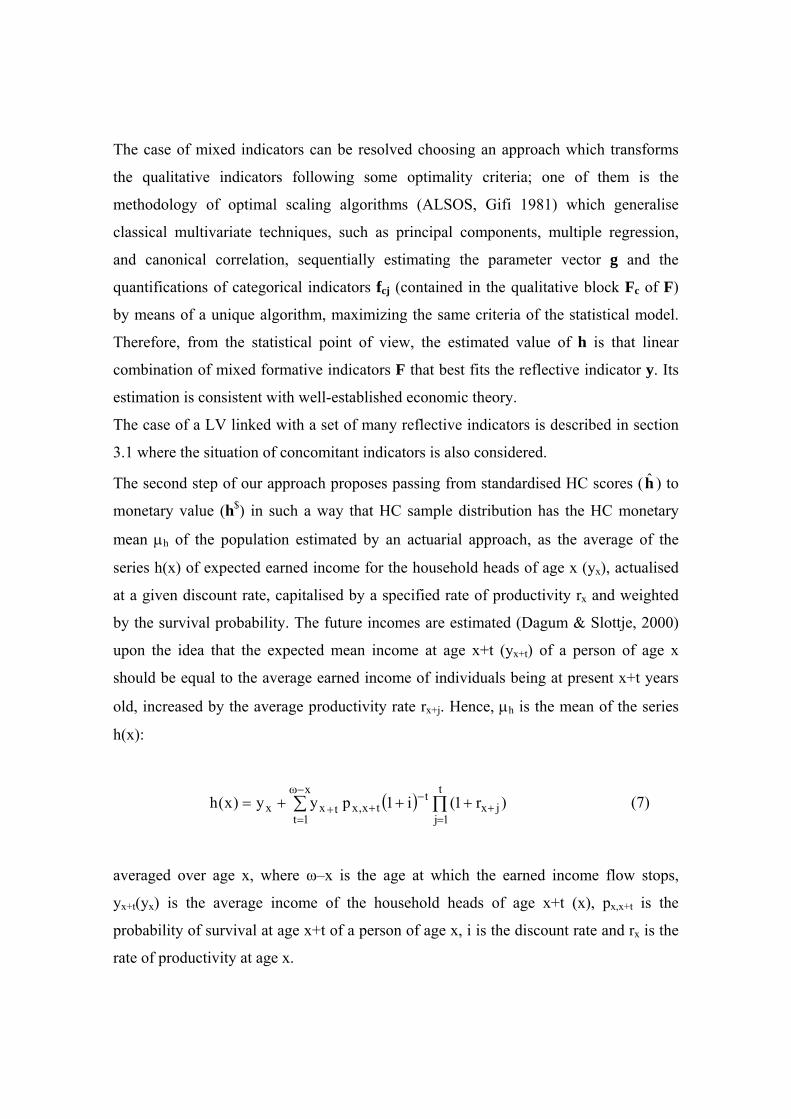
The second step of our approach proposes passing from standardised HC scores (h ) to
monetary value (h
ˆ$) in such a way that HC sample distribution has the HC monetary
mean μh of the population estimated by an actuarial approach, as the average of the
series h(x) of expected earned income for the household heads of age x (yx), actualised
at a given discount rate, capitalised by a specified rate of productivity rx and weighted
by the survival probability. The future incomes are estimated (Dagum & Slottje, 2000)
upon the idea that the expected mean income at age x+t (yx+t) of a person of age x
should be equal to the average earned income of individuals being at present x+t years
old, increased by the average productivity rate rx+j. Hence, μh is the mean of the series
h(x):
( ) ∏∑=
+−
+
−ω
=+ +++=
t
1jjx
ttx,x
x
1ttxx )r1(i1pyy)x(h (7)
averaged over age x, where ω–x is the age at which the earned income flow stops,
yx+t(yx) is the average income of the household heads of age x+t (x), px,x+t is the
probability of survival at age x+t of a person of age x, i is the discount rate and rx is the
rate of productivity at age x.
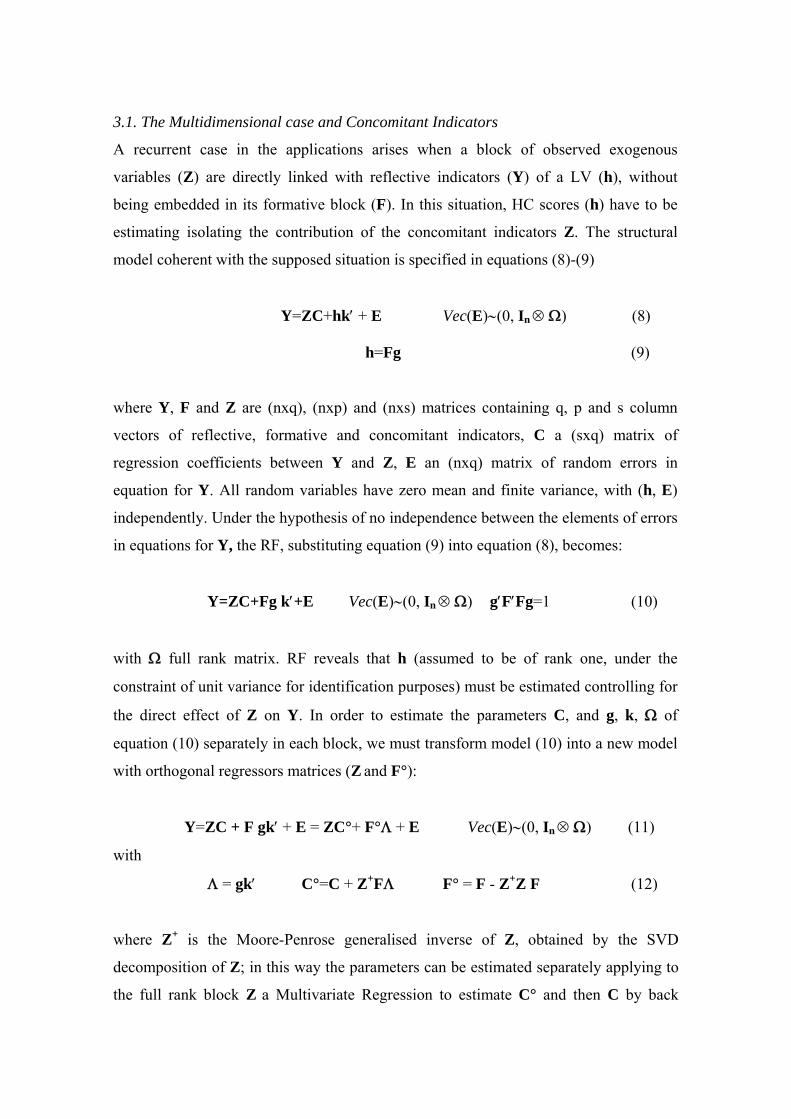
3.1. The Multidimensional case and Concomitant Indicators
A recurrent case in the applications arises when a block of observed exogenous
variables (Z) are directly linked with reflective indicators (Y) of a LV (h), without
being embedded in its formative block (F). In this situation, HC scores (h) have to be
estimating isolating the contribution of the concomitant indicators Z. The structural
model coherent with the supposed situation is specified in equations (8)-(9)
Y=ZC+hk′ + E Vec(E)∼(0, In ⊗ Ω) (8)
h=Fg (9)
where Y, F and Z are (nxq), (nxp) and (nxs) matrices containing q, p and s column
vectors of reflective, formative and concomitant indicators, C a (sxq) matrix of
regression coefficients between Y and Z, E an (nxq) matrix of random errors in
equation for Y. All random variables have zero mean and finite variance, with (h, E)
independently. Under the hypothesis of no independence between the elements of errors
in equations for Y, the RF, substituting equation (9) into equation (8), becomes:
Y=ZC+Fg k′+E Vec(E)∼(0, In ⊗ Ω) g′F′Fg=1 (10)
with Ω full rank matrix. RF reveals that h (assumed to be of rank one, under the
constraint of unit variance for identification purposes) must be estimated controlling for
the direct effect of Z on Y. In order to estimate the parameters C, and g, k, Ω of
equation (10) separately in each block, we must transform model (10) into a new model
with orthogonal regressors matrices (Z and F°):
Y=ZC + F gk′ + E = ZC°+ F°Λ + E Vec(E)∼(0, In ⊗ Ω) (11)
with
Λ = gk′ C°=C + Z+FΛ F° = F - Z+Z F (12)
where Z+ is the Moore-Penrose generalised inverse of Z, obtained by the SVD
decomposition of Z; in this way the parameters can be estimated separately applying to
the full rank block Z a Multivariate Regression to estimate C° and then C by back

transformation C = C° - Z+ FΛ, where Ω, Λ and its component g, k can be estimated by
Reduced Rank Regression methods (van der Leeden 1990) to the deficient rank block
F°. In this way we obtain the scores of HC, as the rank-one best linear combination of
formative indicators projected in the Y space (h =F° g ), net to the effects of the
concomitant indicators Z.
ˆ ˆ
4. Application: human capital in Italy in comparison with the USA Applying the method proposed to the 2000 Italian Sample Survey (Bank of Italy, 2002)
covering 8,001 households (as a representative stratified sample of 16.509 million
Italian households), we obtain the HC scores (where household earned income was
selected as the only reflective indicator) and their distribution.
For US household HC estimation we use the 2004 Survey of Consumer Finances
(Bucks et al., 2006), which contains detailed information about income, wealth and
social-demographic information on American households (over 4,500 households,
representing more than 110 million American families).
Both HC distributions are estimated supposing the same productivity varying over age
and rate of interest for the actualisation of future earnings.
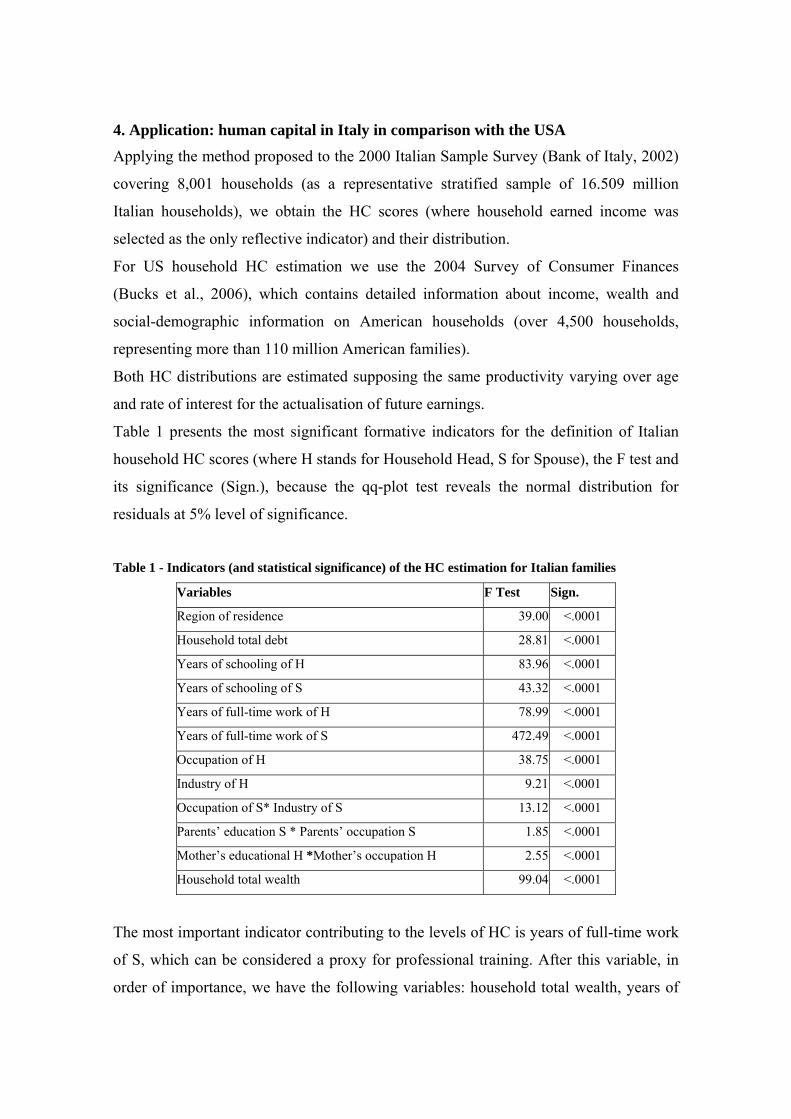
Table 1 presents the most significant formative indicators for the definition of Italian
household HC scores (where H stands for Household Head, S for Spouse), the F test and
its significance (Sign.), because the qq-plot test reveals the normal distribution for
residuals at 5% level of significance.
Table 1 - Indicators (and statistical significance) of the HC estimation for Italian families
Variables F Test Sign.
Region of residence 39.00 <.0001
Household total debt 28.81 <.0001
Years of schooling of H 83.96 <.0001
Years of schooling of S 43.32 <.0001
Years of full-time work of H 78.99 <.0001
Years of full-time work of S 472.49 <.0001
Occupation of H 38.75 <.0001
Industry of H 9.21 <.0001
Occupation of S* Industry of S 13.12 <.0001
Parents’ education S * Parents’ occupation S 1.85 <.0001
Mother’s educational H *Mother’s occupation H 2.55 <.0001
Household total wealth 99.04 <.0001
The most important indicator contributing to the levels of HC is years of full-time work
of S, which can be considered a proxy for professional training. After this variable, in
order of importance, we have the following variables: household total wealth, years of

schooling of H, years of full-time work of H, and years of schooling of S. The
significance of region of residence reveals the differences in HC distribution between
the different regions of Italy. Moreover, genetic assets in terms of job status and
education level of the parents contribute, as interactions, to the formation of HC.
Finally, in accordance with economic theory, the signs of the coefficients defining HC
(not reported here) show the important role of the northern area to the formation of
household HC, the positive role of real wealth and the negative role of total debt. Thus,
on the whole, household HC is determined more by the household head than by the
spouse, and even more by the years of full-time work than by years of schooling.
Next, applying the actuarial method with specific hypotheses (the age of entry into the
labour market is 24, the income ceases at 85, the interest rate is 8%, the productivity
rate takes as its maximum value r=3% at age 24, with a constant decrement in time until
the age of 64, when r=0, the survival probability for males is obtained from the 2001
Italian population census), the weighted distribution of HC gives a sample estimate of
the distribution of the HC for the entire population of Italian families in 2000 (Figure 1).
Figure 1: HC distribution of the Italian household heads (thousands of Euro), 2000
Table 2 presents more relevant statistics (mean, median and Gini ratio) for observed
(estimated) distributions of the household total wealth, net wealth, income, total debt

(monetary distribution of HC) for Italy and USA.
The Italian (USA) HC average for 2000 is more than ten (sixteen) times as high as the
average income and higher than the average total wealth of Italian families; moreover,
both Gini ratios show that the inequality of the HC distribution is lower than income
inequality and smaller than the total and net wealth inequality, while the inequality of
the distribution of Italian debt is higher than inequality in the USA.
Country Indicator Human capital Total income Total wealth Net wealth Total debt
ITALY Median € 101,556 € 14,771 € 99,160 € 94,770 € 0
USA Median $ 982,401 $ 34,000 $ 175,150 $ 103,050 $ 24,200
ITALY Mean € 186,493 € 17,472 € 177,207 € 170,668 € 6,538
USA Mean $ 852,533 $ 53,245 $ 577,066 $ 498,237 $ 81,638
ITALY Gini Ratio 0.522 0.353 0.628 0.631 0.920
USA Gini Ratio 0.656 0.501 0.760 0.811 0.705
Table 2 - Statistics of HC, income, wealth and debt for Italy and the USA
The comparison between the mean HC and mean total wealth is of particular
importance as an indication of the rate of employment of national HC; for the USA the
ratio is nearly 1.5, whereas in Italy the means are almost equal, demonstrating that
human capital is employed less in Italy than in the USA.
Even if the statistical significance of HC formative indicators is not reported for US
households, below are reported the principal differences between Italian and US short-
time multipliers that define the impact of formative indicators on the formation of HC
and, on the other hand, the impact of HC on the formation of household income.
In particular:
• in the USA (Italy) a one dollar (euro) increase of total debt increases (decreases)
HC by $0.136 (0.09€);
• in the USA (Italy) a one dollar (euro) increase of total wealth increases HC by
$0.035 (0.0034€);
• in the USA (Italy) the marginal increase of HC, resulting from the increase of
one year of schooling of H and S, are $27092 (512€) and $1262 (450€)
respectively;

• in the USA (Italy) a one year increase in full-time work of H increases HC by
$1673(190€);
• the income generating function (specifying for each economic unit that earned
income is a function of its stock of HC and non-human capital or wealth) shows
that in the USA (Italy) a one dollar (euro) increase of HC, net of wealth,
increases income by 0.162$ (0.05€).
Hence, US education policy seems more important than the labour market for the
increase in household HC, whereas in Italy we observe a minor contribution from
education – as regards the socio-economic status of the household, the kind of
occupation and the years of full-time work – in the accumulation process of HC (where
it is estimated that two thirds is due to work experience and only one third to education-
related human capital, Lovaglio, 2006). We deduce that the education system remains
one of the biggest resources for the economic development of the USA.

5. Conclusion The present paper aims to furnish an initial contribution towards the evaluation of the
external efficiency of an education system, using the criteria of evaluation studies on
organisations that distribute services of public utility, and in particular elaborating a
statistical methodology for human capital estimation.
Nevertheless some drawbacks remain. Firstly, even if there are many ways of measuring
the return to investment in HC (expected years of unemployment over a working
lifetime, transition probability towards better occupations or job status, health outcomes
of education, lower risk of crimes (OECD, 1998), not only it is difficult to measure
these indicators in terms of individual or household effects of investment in HC or in
macroeconomic terms, but there is also a lack of general surveys on individuals
regarding these characteristics (OECD, 1998).
Secondly, in order to use the estimation of personal or household HC for university
evaluation, we need some other information related to various skills or abilities, tested
at the end of university attendance, because directly connected with investment in HC.
In this context the information must be used as explicative variables in a multilevel
model in order to adjust the “outcome” HC in the “coeteris paribus” efficiency
evaluation process of the universities. Moreover, for the evaluation of relative efficiency
we need information regarding which university has been attended by household
components; for the impact evaluation we need information regarding the faculty
attended. However, information regarding the university and faculty attended, and test
results (ability measurement) collected from samples of students, are not generally
linked to other information regarding individuals, single households, other investment
in HC and performances in the job market (OECD, 1998, Wöβmann, 2003). Therefore,
even if it were worthwhile to employ ability measurements, they are not currently
available and hence not considered here for the estimation of household HC.
However, there are new databases useful for our aim. The development of SIS
(Statistical Information Systems), namely Information Systems built by integrating data
coming from different administrative sources – e.g., provincial employment centres,
INPS (Italian State Retirement Agency), INAIL (Italian State Workers' Medical
Insurance Agency) – provide registry, curriculum, and job information at individual
level useful for analysing the overall job marketplace. Information regarding formal

education, job training, unemployment support (e.g. retraining, subsidies), job
placement support, job duration, job-type evolution, job duration evolution, contractual
improvement and breakdown, professional development and income evolution are
available.
This information will be used in future studies of the efficiency of higher education,
connecting the estimation of HC with indicators regarding skills, abilities acquired and
university and faculty attendance.
References Banca d’Italia (2002), “I bilanci delle famiglie italiane,” Supplementi al Bollettino
Statistico, anno XII (6).
Becker, G.S. (1964), Human Capital, 2nd edn., New York: Columbia University Press.
Biggeri, L., Bini, M., Grilli, L. (2001), “The transition from university to work: a
multilevel approach to the analysis of the time to get the first job,” Journal of the Royal
Statistical Society – Series A, 162(2): 293-305.
Bollen K.A., W.R., (1994), “Causal indicator models: identification, estimation, and
testing,” University of North Carolina at Chapel Hill, Unpublished manuscript.
Bryk & Weisberg (1977), “Use of the non-equivalent control group design when
subjects are growing,” Psychological Bulletin, 84: 950–962.
Bryk A.S., Thum Y.M., Easton J.Q., Luppescu, S. (1998), “Assessing school academic
productivity: the case of Chicago school reform,” Social Psychology of Education, 2:
103–142.
Bucks, B.K., Kennickell, A.B. And Moore, K.B. (2006), “Recent changes in U.S.
family finances: evidence from the 2001 and 2004 survey of consumer finances,”
Federal Reserve Bulletin, 92: A1–A38.
Chiandotto, B. (2005), “Laureati a cinque anni dal conseguimento del titolo: un’analisi
multilivello,” in Simulazione dell’applicazione dell’indicatore “Capitale Umano” per
la valutazione dell’efficacia dei corsi di laurea, Gruppo di lavoro Alma Laurea-Crisp.
Copas, J., Eguchi, S. (2001), “Local sensitivity approximations for selectivity bias,”
Journal of the Royal Statistical Society, Series B, 63: 871–895.
Dagum, C, Vittadini, G. (1996), “Human capital measurement and distribution,”
Proceedings of the 156th Meeting of the American Statistical Association, Business and
Economic Statistics Section: 194-199.
Dagum, C., Slottje, D.J. (2000), “A new method to estimate the level and distribution of
the household human capital with applications,” Journal of Structural Change and
Economic Dynamics, 11: 67–94.
Dublin L.I., Lotka, A. (1930), The Money Value of Man, New York: Ronald Press.
Eisner, R. (1985), “The total incomes system of accounts,” Survey of Current Business,
65(1): 24–48.
Farr, W. (1853), “Equitable Taxation of Property,” Journal of the Royal Statistical
Society, XVI: 1–45.
Fitz-Gibbon, C.T. (1997), The value-added national project: final report. Feasibility
studies for a national system of value-added indicators, Hayes, Middlesex: SCAA
Publication.
Frees, E.W. (2001), “Omitted variables in longitudinal data models,” The Canadian
Journal of Statistics, 29: 573–595.
Garen J. (1984), “The returns to schooling: a selectivity bias approach with a continuous
choice variable,” Econometrica, 52: 23–54.
Gifi, A. (1981), Non-linear multivariate analysis, The Netherlands: Department of Data
Theory, University of Leiden.
Goldstein, H. (1995), Multilevel statistical models, 2nd edn, London: Edward Arnold.
Goldstein, H., Spiegelhalter, D. J. (1996), “League table and their limitations: statistical
issues in comparisons of institutional performances (with discussion),” Journal of the
Royal Statistical Society – Series A, 159: 385–443.
Hanushek, E.A. (1996), “Measuring Investment in Education,” The Journal of
Economic Perspectives, 10: 4: 9–30.
Hanushek, E.A. (1997), “Assessing the Effects of School Resources on Economic
Performance,” Education Evaluation and Policy Analysis, 19(2): 141–164.
Hanushek, E.R., Kimbo, D.D. (2000), “Schooling, Labour-Force Quality, and the
Growth of Nations,” American Economic Review, 90(5):1184–1208.
Heagerty, P.J., Kurland, B.F. (2001), “Misspecified maximum likelihood estimates and
generalised linear mixed models,” Biometrika, 88: 973–985.
Johnson, E., Dominici, F., Griswold, M., Zeger, S.L. (2003), “Disease cases and their
medical costs attributable to smoking: an analysis of the national medical expenditure
survey. Journal of Econometrics,” 112: 135-151.

Jöreskog, K.G. and Goldberger, A.S. (1975), “Estimation of a model with multiple
indicators and multiple causes of a single latent variable,” J. Amer. Statist. Assoc., 70,
351: 631–9.
Jorgenson, D.W., Fraumeni, B.M. (1989), ”The accumulation of human and non-human
capital, 1948-84,” in Lipsey, R.E., Stone Tice, H. (eds), The Measurement of Saving,
Investment, and Wealth, Chicago: University of Chicago Press, 52: 227–82.
Kendrick, J.W. (1976), The Formation and Stocks of Total Capital, New York:
Columbia University Press.
Le, T., Gibson, J. and Oxley, L. (2003), “Cost- and income-based measures of human
capital,” J. Econ. Surveys, 17(3): 271–305.
Lovaglio, P.G. (2005), “Efficacia relativa e di impatto di iniziative nell’ambito dei
servizi alla persona di pubblica utilità,” Statistica, 1–19.
Lovaglio, P.G. (2006), “The estimation of educational and working-experience human
capital from two sets of observed indicators,” Statistica ed Applicazioni, in press.
Lovaglio, P.G.. Vittadini, G. (2006), “Human capital growth for university educational
evaluation,” in Fabbris, L. (ed.), Effectiveness of University Education in Italy:
Employability, Competences, Human Capital, Springer Verlag, 355–366.
McCulloch, C. E., Searle, R.E. (2000), Generalized, Linear, and Mixed Models, New
York: J. Wiley.
Neuhaus, J. M., Kalbfleisch, J. D. (1998), “Between- and within-cluster covariate
effects in the analysis of clustered data,” Biometrics, 54: 638–645.
OECD (1986), Living Conditions in OECD Countries: A Compendium of Social
Indicators, Paris: Centre for International Research and Innovation.
OECD (1998), Human Capital Investment: An International Comparison, Paris: Centre
for International Research and Innovation.
Rogosa, D.R., Brand D., Zimowski M. (1982), “A growth curve approach to the
measurement of change,” Psychological Bulletin, 90: 726–748.
Rogosa, D.R., Willett J. B. (1985), “Understanding correlates of change by modelling
individual differences in growth,” Psychometrika, 50: 203–228.
Rogosa, D.R., (1995), “Myths and methods: ‘Myths about Longitudinal Research’ plus
Supplemental Questions,” in Gottman, J.M. (ed.), The Analysis of Change, New York:
LEA, 3–66.
Rosenbaum, P. (2002), Observational Studies, New York: Springer Verlag.
Scheerens, J., Bosker, R.J. (1997), The Foundations of Educational Effectiveness,
Oxford: Pergamon Press.
Tooze, J.A., Grunwald, G. K., Jones, R.H. (2002), “Analysis of repeated measures data
with clumping at zero,” Statistical Methods in Medical Research, 11: 341-355.
Van der Leeden, E. (1990)‚ “Reduced Rank Regression,” DSWO, the Netherlands.
Verbeke, G., Molenberghs, G. (2000), Linear Mixed Models for Longitudinal Data,
New York: Sprinter Verlag.
United Nations (2002), Human Development Report 2000: Human Rights and Human
Development, New York: Oxford University Press.
World Bank (1992), World Development Report, Oxford: Oxford University Press.
Wöβmann, L. (2003), “Specifying human capital,” Journal of Economic Surveys, 17(3):
239–270.

European Commission EUR 23253 EN – Joint Research Centre Title: Human Capital and the Evaluation of University Efficiency Authors: Pietro Giorgio Lovaglio, Giorgio Vittadini Luxembourg: Office for Official Publications of the European Communities 2008 – 20 pp. – 21 x 29.7 cm EUR – Scientific and Technical Research series – ISSN 1018-5593 ISBN 978-92-79-06161-5 Abstract This paper focuses on the process of evaluation of the external efficiency of higher education, defined as the effect of university education on the long-term income of graduates; in particular we propose the use of human capital as the outcome of interest and a proper methodology to estimate it as the latent variable in the presence of reflective, formative and concomitant indicators. Finally, in the application of the methodology a comparison is made between human capital in Italy and the USA, estimated using the most recent national sample surveys on income and wealth. Keywords: external efficiency, human capital, multilevel models

The mission of the JRC is to provide customer-driven scientific and technical supportfor the conception, development, implementation and monitoring of EU policies. As a service of the European Commission, the JRC functions as a reference centre of science and technology for the Union. Close to the policy-making process, it serves the common interest of the Member States, while being independent of special interests, whether private or national.
LB
-NA
-23253-EN-C