Embed Size (px)
Citation preview
Human Capital, Capital Structure, and Employee Pay: An Empirical Analysis
Thomas J. Chemmanur*
Yingmei Cheng**
Tianming Zhang***
November 2012
*Professor of Finance, Carroll School of Management, Boston College, 440 Fulton Hall, Chestnut Hill, MA 02467. E-mail: [email protected]. Phone: (617) 552-3980. Fax: (617) 552-0431. **Bank of America Associate Professor of Finance, College of Business, Florida State University, Tallahassee, FL 32306. E-mail: [email protected]. Phone: (850) 644-7869. ***Assistant Professor of Accounting, College of Business, Florida State University, Tallahassee, FL 32306. E-mail: [email protected].
For helpful comments and discussions, we thank Bing He, Zacharias Sautner, John Graham, and participants in conference presentations at the AAA Northeast Region Meeting (Best Paper Award), the CRSP Forum at the University of Chicago, the Financial Management Association Meetings, the Financial Management Association European Meetings, the Western Finance Association Meetings, and the American Finance Association Meetings. Special thanks to an anonymous referee and the editor, Bill Schwert, for helpful comments and suggestions that greatly improved the paper. We also appreciate comments and suggestions from seminar participants at the University of Massachusetts at Amherst, the University of Texas at Arlington, Boston College, Florida State University, Qinghua University, and. Zhejiang Business University.

Human Capital, Capital Structure, and Employee Pay:
An Empirical Analysis
ABSTRACT
The theoretical models of Titman (1984) and Berk, Stanton, and Zechner (2010) suggest that indirect bankruptcy costs arising from human capital risk may be an important factor limiting firms’ use of debt despite the corporate tax benefits associated with it. In this paper, we test the predictions of these models by studying the effect of leverage on labor costs. We conduct our analysis using two different measures of labor costs: CEO compensation and average employee pay. Our analysis of CEO compensation indicates that leverage has a significantly positive impact on CEOs’ cash, equity-based, and total compensation. To correctly identify causality, we analyze the compensation of new CEOs who are hired from outside the firm, and find that the compensation of such CEOs is positively related to prior-year firm leverage. Our analysis of average employee pay indicates that leverage has a positive and significant impact on average employee pay in OLS and instrumental variable regressions, and in a Heckman two-step analysis. We show that, for the median firm, the incremental total labor expenses associated with an increase in leverage are large enough to offset the incremental tax benefits of debt. Our analysis is robust to a number of additional tests, including those that compare the relationship between leverage and employee pay across technology and non-technology firms (where employees can be expected to suffer from different levels of human capital risk). Overall, our analysis provides empirical support for the theoretical prediction that labor costs play an important role in limiting the use of debt in corporate capital structures.

1. Introduction The tradeoff theory of capital structure points to bankruptcy costs as the main reason why firms
in many industries do not take on higher levels of leverage to take advantage of the corporate tax
saving benefits of debt. However, there is considerable empirical evidence indicating that the
magnitude of direct bankruptcy costs is too low to be a sufficient disincentive preventing firms from
taking on higher levels of debt. Some authors have therefore suggested indirect bankruptcy costs as
a solution to the puzzle of the observed “underleveraging” of firms in many industries. In an
important paper, Titman (1984) develops a model in which a firm’s liquidation decision is causally
linked to its bankruptcy status. He argues that customers, workers, and suppliers of firms that
produce unique or specialized products are likely to suffer high costs in the event of liquidation. In
particular, in a setting where employees have firm-specific human capital, the fact that bankruptcy
can impose significant costs on employees (by reducing the value of their human capital) can
significantly affect firms’ capital structures.1 Formalizing Titman’s (1984) arguments, Berk, Stanton,
and Zechner (2010) develop a model incorporating the idea that human capital costs associated with
financial distress and bankruptcy may be large enough to be a disincentive for firms to issue debt.
The objective of this paper is to empirically analyze, for the first time in the literature, whether
human capital costs are indeed an important determinant of the capital structure of firms as
postulated by the above theoretical literature. We do this by examining the relation between the
observed capital structures of firms and the compensation of their CEOs, as well as the relation
between observed capital structures and the average wages of their work forces: while we use CEO
compensation to measure the pay of a “critical” employee, we use the average employee wage to
measure the compensation of a “collective” employee. In the model of Berk, Stanton, and Zechner
(2010), referred to as BSZ (2010) from now on, each firm faces a risk-averse employee and risk-
neutral investors. In the optimal labor contract between firms and employees, a firm with higher
leverage pays a higher wage to its employee to compensate him for the expected bankruptcy costs
1 For an excellent review of empirical research on capital structure, see Parsons and Titman (2008).

2
that will be borne by the employee, since the employee is unable to fully insure his human capital
risk. Firms will therefore choose not to increase leverage beyond the point where the marginal tax
benefits of debt are offset by the incremental labor costs associated with higher levels of debt. The
empirical implication here is that, in the cross section, firms with higher leverage will be associated
with higher employee pay.2 We will test this prediction (“the Titman-BSZ prediction” from now on)
in our empirical analysis. We will also study whether the magnitude of the additional compensation
associated with an increase in leverage is large enough to at least partially explain the
“underleveraging” of firms.
In contrast to the above theories that focus on the ex ante relationship between leverage and
employee pay, Perotti and Spier (1993) focus on the ex post effect of leverage on employee pay.3 In
particular, they argue that firms are able to use leverage strategically when current profits are low
and future investment is necessary to guarantee full payment of the union’s claim (wages). By
retiring equity through a junior debt issue, shareholders can credibly threaten not to undertake
valuable new investments unless the union agrees to wage reductions. The implication of the above
argument is that, under suitable conditions, firms with high leverage will be associated with lower
employee pay.
The above ex post relationship between leverage and employee pay implied by the model of
Perotti and Spier (1993), however, is not inconsistent with the ex ante relationship between the same
variables in the Titman-BSZ prediction. As Perotti and Spier (1993) point out in their paper, if
workers anticipate that equity holders may attempt to use higher leverage to negotiate their wages
downward ex post, they will demand higher expected wages ex ante to compensate them for bearing
this risk. Perotti and Spier (1993) also point out that a firm will not be able to use leverage as a
bargaining tool to reduce employee wages if their profits from existing assets are large (i.e., the firm
2 The models of Jaggia and Thakor (1994) and Berkovitch, Israel, and Spiegel (2000) also have somewhat similar predictions. 3 Several other papers make similar arguments: see, e.g., Baldwin (1983), Bronars and Deere (1991), Perotti and Spier (1993), Dasgupta and Sengupta (1993), Hennessy and Livdan (2009), and Brown, Fee, and Thomas (2009).
3
does not face a significant probability of financial distress). We make use of the latter results from
Perotti and Spier (1993) to empirically disentangle the ex ante effects suggested by the Titman-BSZ
prediction from the ex post effects suggested by Perotti and Spier (1993). We accomplish this by
splitting our sample between firms approaching financial-distress (“distressed” firms) and those that
do not face a significant probability of distress (“safe” firms).
We find that the debt ratio of a firm positively affects the magnitude of its CEO compensation.
Firms with higher leverage pay their CEOs more, in terms of total compensation, cash pay, and
equity-based pay. In our OLS regressions, an increase in market leverage by one standard deviation
is associated with an increase of more than 8% in CEO total compensation, a magnitude that is
economically significant. We recognize that unobserved CEO characteristics may influence firm
leverage as well as CEO pay, so that the direction of causality may be ambiguous. For example,
CEOs who have had more interaction with the board (and therefore have more influence) may have
greater ability to affect their own pay and at the same time choose the firm’s leverage level as well.
In order to address this issue, we study the relationship between the first-year compensation of
newly appointed CEOs who are hired from outside and firm leverage in the year prior to their
appointment. Clearly, newly appointed CEOs who are hired from outside should have no influence
on the firm’s leverage in the year prior to their appointment. We show that, even in the case of new
CEOs hired from the outside, compensation is positively related to leverage.
We also find that leverage has a positive and significant impact on average employee pay.
Further, the incremental labor expenses associated with an increase in leverage are large enough to
offset all of the incremental tax benefits arising from such an increase. For a firm with median
values of leverage, average employee pay, total labor expenses, and total debt, if the market
leverage ratio increases by one standard deviation, total labor expenses increase by $14.01 million,
holding the number of employees constant. Assuming 6% as the average return on debt in our
sample from 1992-2006 and assuming a tax rate of 35%, the tax benefits of debt increase by $5.09
million, smaller than the increase in total labor expenses of $14.01 million. This supports the

4
hypothesis that the incremental labor costs associated with an increase in leverage are economically
significant and large enough in magnitude to limit the use of debt.
One potential concern with our baseline analysis is the endogeneity of leverage. In particular,
the assets of a given firm may be such that they can support a high level of leverage (for example,
the proportion of tangible assets may be high) and may also require highly paid employees to
operate these assets, thus generating a positive correlation between leverage and employee pay. To
deal with this potential endogeneity problem, we employ an instrumental variable, namely, the
marginal corporate tax rate, to generate an exogenous variation in leverage: the theoretical literature
in corporate finance suggests that the tax benefit of debt will be positively related to a firm’s
marginal tax rate, thus resulting in a positive correlation between a firm’s marginal tax rate and its
leverage ratio. The empirical literature also supports the above view (see, e.g., Leary and Roberts,
2010). At the same time, there is no theoretical or empirical literature indicating that the marginal
corporate tax rate will directly affect employee pay. Using the marginal corporate tax rate as the
instrument, we study the relationship between leverage and average employee pay in a two-stage
least square (2SLS) regression framework. The results of the above analysis confirm that, even after
accounting for the potential endogeneity of leverage, firms with a higher level of leverage are
associated with a higher level of average employee pay. 4
Using the sample of manufacturing firms in the US over 1974-1982, Titman and Wessels
(1988) find that firms with more specialized labor have lower debt ratios. Since more specialized
workers are paid more, this suggests a negative relation between leverage and wages. If labor
specialization is related to both leverage and employee pay, the omission of labor specialization
from the regression of employee pay may cause a bias in the estimated coefficient of leverage. We
address this issue by examining the quits rate, the percentage of the industry’s total work force that
voluntarily left their jobs in the sample years. Following Titman and Wessels (1988), we use quits
4 However, the instrumental variable that we use for leverage, the marginal tax rate, has some limitations. We discuss these limitations in the concluding section of this paper (Section 8).

5
rate as our proxy for labor specialization: a lower quits rate corresponds to greater labor
specialization. We find that the quits rate is negatively correlated with average employee pay,
consistent with the notion that more specialized workers are paid more. However, we find that the
correlation between leverage and the quits rate is not statistically significant. Furthermore, in our
multivariate regression of average employee pay where the quits rate is included as an explanatory
variable, the quits rate is insignificant, and the coefficient of leverage remains positive and
significant.
As discussed earlier, we also empirically disentangle the ex ante relationship between leverage
and employee pay from the ex post effects suggested by Perotti and Spier (1993). To accomplish
this, we split our sample based on each firm’s Altman’s Z-score and study safe and distressed firms
separately. Consistent with the Titman-BSZ prediction, the relationship between leverage and
average employee pay is positive and significant in the sample of safe firms. On the other hand, the
coefficient of leverage is negative in the distressed sample, but not statistically significant. This
suggests that, while the ex ante relationship between leverage and employee pay suggested by
Titman-BSZ prediction dominates in our entire sample and in the subsample of safe firms, in
distressed firms the ex-post relationship postulated by Perotti and Spier (1993) may partially or fully
offset the above effect of firms compensating employees for their human capital risk due to higher
leverage. This is not surprising, since it is precisely in distressed firms that we expect the ability of
firms to use leverage as a bargaining tool with employees to be the strongest (as pointed out by
Perotti and Spier, 1993).
Labor expenses, which we use to compute average employee pay, are missing for a number of
firms in the COMPUSTAT database. This creates a potential sample-selection bias if firms
selectively decide whether or not to report this information. To adjust for this potential selection
bias, we adopt a Heckman (1979) two-step analysis. Our results are robust to the Heckman
procedure: the second stage of our Heckman two-step analysis indicates that, even after controlling
for potential sample selection, leverage has a positive effect on average employee pay.

6
Employee “entrenchment” is an important element in the model of BSZ (2010). Entrenchment
in their model means that employees are unable to fully insure their human capital risk. BSZ (2010)
argue that employee entrenchment is the reason why an employee demands a higher wage from a
firm with higher leverage. This allows us to conduct yet another test of the Titman-BSZ prediction:
we expect to observe a stronger effect of leverage on labor costs when the employee is more
entrenched. To empirically test the effect of employee entrenchment on the leverage-wage relation,
we examine technology versus non-technology firms. Existing evidence (e.g., Anderson, Banker,
and Ravindran, 2000) suggests that employees in non-technology firms are more entrenched than in
technology firms (in the sense that the potential reduction in employees’ human capital if their firm
goes bankrupt is greater). Given this, the impact of leverage on employee compensation in non-
technology firms may be expected to be greater than in technology firms. We therefore split our
sample between technology and non-technology firms and conduct our analysis separately on these
two subsamples.
We find that the influence of leverage on the cash, equity-based, and total compensation of
CEOs is positive and significant in non-technology firms. In technology firms, leverage affects the
cash pay of CEOs, but it does not have significant effects on their total or equity-based
compensation. The leverage ratio also has a positive and significant effect on average employee pay
in non-technology firms, but not in technology firms. Thus, the effect of leverage on CEO
compensation as well as on average employee pay is greater for non-technology firms than for
technology firms, consistent with the Titman-BSZ prediction.
Our paper is related to the empirical literature examining the notion that leverage may serve as
a bargaining tool for firms against labor and may thereby have a “disciplining effect” on labor: see,
e.g., Benmelech, Bergman, and Enriquez (2009), who show that airlines in financial distress obtain
wage concessions from employees whose pension plans are underfunded; Matsa (2010), who
documents that firms characterized by greater union bargaining power use greater leverage; and
Hanka (1998), who documents that firms using higher levels of debt reduce employment more often

7
and use more part time or seasonal employees. Our empirical results do not necessarily contradict
those of the above literature: as pointed out by Perotti and Spier (1993), the disciplining effect of
debt on labor will be greater in firms with a significant chance of financial distress, and can co-exist
with employees demanding greater wages ex ante (to induce them to join firms with greater
leverage ratios). These greater wages may be required not only to compensate employees for the
potential loss of their human capital in the event that the firm goes bankrupt (as suggested by
Titman (1984) and BSZ (2010)), but also for the potential reduction in wages or other benefits
arising from their lower bargaining power ex post if the firm enters financial distress subsequent to
their joining it. The fact that the positive relationship we document between leverage ratios and
employee pay arises mostly from the subsample of safe firms (where the disciplining effects of debt
on the employment relationship is likely to be the least), suggests that both the above effects may
be operating in employee-firm relationships in practice.5
Our paper contributes to the literature by showing, for the first time, that leverage has a
positive impact on employee compensation (as measured by either CEO compensation or average
employee pay), and that, at the existing median debt level, the incremental labor costs associated
with an increase in leverage are sufficient to offset the incremental tax benefits of debt. Our study
helps to establish the importance of labor costs in capital structure decisions, and thus advance our
understanding of the determinants of corporate leverage. Finally, ours is the first paper that
explicitly analyzes the relation between executive compensation and capital structure: while there is
a large prior literature on executive compensation (see, e.g., Frydman and Jenter (2010) for a
review), to the best of our knowledge, no prior paper has conducted such an analysis.
The rest of this paper is organized as follows. Section 2 reviews the relevant theory in more
detail and develops testable hypotheses. Section 3 describes our data and sample selection
5 Our paper is also broadly related to the large literature studying the factors that may contribute to the apparent underleveraging of firms: see, e.g., Graham and Tucker (2006), who find that tax sheltering activities help to explain the low debt ratio of the firms in their sample. The literature on the role of human capital in asset pricing is also indirectly related: see, e.g., Fama and Schwert (1977).

8
procedures. Section 4 presents our empirical analysis of the relation between capital structure and
CEO compensation. Section 5 presents our empirical analysis of the relation between capital
structure and average employee pay. Section 6 compares our empirical results for technology
versus non-technology firms. Section 7 presents some additional robustness tests. Section 8
summarizes our results, discusses the limitations of our instrumental variable analysis, and
concludes.
2. Development of Hypotheses
Titman (1984) develops a model in which a firm’s liquidation decision is causally linked to its
bankruptcy status. He argues that, customers, workers, and suppliers of firms that produce unique or
specialized products are likely to suffer high costs in the event of liquidation. In particular, in a
setting where employees have firm-specific human capital, the fact that bankruptcy can impose
significant costs on employees (through reducing the value of their human capital) can significantly
affect firms’ capital structures. The model of BSZ (2010) formalizes the above arguments of
Titman (1984). In their model, each firm has only one employee, who is risk averse; investors in the
firm are risk neutral. The employee is averse to bearing his own human capital risk. It is also
assumed that the firm operates in competitive capital and labor markets. If the firm is in financial
distress, the employee has to take a pay cut to ensure full repayment of debt. Further, if the firm is
forced into bankruptcy, the employee may be terminated. Therefore, the employee faces substantial
costs in the event of financial distress and bankruptcy. Because a higher debt level implies a higher
probability of bankruptcy and the employee is unable to insure fully his human capital risk, firms
with higher leverage have to pay, in equilibrium, a higher wage to the employee to compensate him
for the expected bankruptcy costs borne by him.
We make use of two measures of labor costs to test the above theories: CEO compensation and
average employee pay. CEO compensation measures the pay of the most important employee. In the
model of BSZ (2010), there is only one employee per firm. A company’s CEO plays a critical role

9
in affecting corporate performance, and his productivity is more difficult to evaluate than that of
lower level employees. Therefore, the single employee in the model of BSZ (2010) might be best
interpreted as the CEO in empirical tests. Average employee pay measures the compensation of a
“collective” employee. Since average employee pay is calculated as total labor expenses divided by
the number of employees, we are able to use this measure to directly derive the marginal impact of
leverage on total labor expenses and therefore to compare the marginal effect of debt on labor costs
with the incremental tax benefits of debt.
Based on the implications of the above theoretical models and using the test variables
discussed above, we have the following testable hypotheses.
Hypothesis 1: Firms with higher leverage will incur larger CEO compensation.
Hypothesis 2: Firms with higher leverage will incur larger average employee pay.
Hypothesis 3: At the existing debt level, the additional labor costs associated with an increase
in leverage are large enough to offset the incremental tax benefits of debt.
Perotti and Spier (1993) argue that labor unions will bargain less aggressively and may be
more willing to take pay cuts if highly levered firms run a greater risk of bankruptcy. Although their
model implies that workers, ex ante, will demand a higher expected wage in compensation for
bearing the above risk (Proposition IV of their paper), another empirical implication of their theory
is that, ex post, there will be a negative correlation between leverage and wage when a firm faces
substantial financial distress. Thus we have the following testable hypothesis:
Hypothesis 4: Firms with higher leverage will incur lower average employee pay when they
are in financial distress.
One important element of the model of BSZ (2010) is the degree of “job entrenchment”.
Different from the same term used in the literature on corporate governance, entrenchment in this
context means the degree to which employees are able to insure their human capital risk (lower their
ability to insure, greater the extent of entrenchment). Job entrenchment in this sense is the reason
why the employee demands a higher pay from a firm with higher leverage in BSZ (2010). To

10
empirically study the impact of employee job entrenchment on the leverage-wage relation, we
examine technology versus non-technology firms. There is evidence suggesting that employees in
non-technology firms are more entrenched compared to those in technology firms.6 Given this, we
expect leverage to have a stronger impact on labor costs in non-technology firms than in technology
firms. This yields our fifth testable hypothesis:
Hypothesis 5: The effect of leverage on CEO compensation as well as on average employee
pay will be greater in non-technology firms than in technology firms.
3. Data and Summary Statistics
3.1. Sample of CEO compensation
We gather information on CEO pay from the Execucomp database. It provides detailed
information on the compensation of the top five executives of S&P 1,500 firms since 1992. We
focus on the CEOs. We merge Execucomp with the COMPUSTAT Industrial Annual Database
from 1992 to 2006. We delete firms with non-positive book value of equity and exclude financial
and utilities companies. 17,173 firm-year observations satisfy these criteria. 14,891 observations
have all the necessary information to be included in our OLS regressions of CEO compensation.
During our sample period (1992-2006), there are 1,952 new CEOs. To determine whether a
new CEO is an outside hire, we use the following two-step procedure. First, we search for his
previous employer in the Execucomp database. If his prior employer is not the same as the current
firm, then he is an outside hire. Second, if we cannot identify his previous employer in the
Execucomp database (Execucomp only reports information on the top five executives in S&P 1,500
firms), we search the Lexis-Nexis Academic Universe by the name of the executive and of the
6 Anderson, Banker, and Ravindran (2000) document that the demand for executives and other critical employees in technology firms is intense, leading to higher employee turnovers than in non-technology firms. Ittner, Lambert, and Larcker (2003), using proprietary compensation survey data, find that technology firms rank “employee retention objectives” as the most important goal of their equity grant program. Overall, this evidence indicates that employees in technology firms will suffer a lower loss of human capital if their firms enter financial distress compared to those in non-technology firms.

11
company to determine whether he is hired from outside or promoted from inside.7 We identify 373
outside hires using this methodology.
3.2. Sample of average employee pay
We use information from the COMPUSTAT Industrial Annual database between 1992 and
2006 to study the impact of leverage on average employee pay.8 We exclude financial and utilities
companies, and we exclude firms with less than 100 employees. We also drop firms with non-
positive book values of equity. We calculate average employee pay as total labor expenses divided
by the number of employees. COMPUSTAT provides “labor and related expenses” (data item 42)
and the number of employees (data item 29). According to the COMPUSTAT data manual, data
item 42 includes salaries and wages, pension costs, payroll taxes, incentive compensation, profit
sharing, and other benefit plans. Data item 42 thus represents a firm’s total labor expenses. This
suits our purpose, since we need to estimate the impact of leverage on total labor costs. About 10%
of firms recorded in the COMPUSTAT have valid information on data item 42. This may introduce
a sample-selection bias and we discuss how we control for this in Section 5. There are 5,269 firm-
year observations that have the necessary information to be included in our OLS regression of
average employee pay.
3.3. Other data sources
We obtain quits rates from the database of Job Openings and Labor Turnover Survey (JOLTS)
on the website of the U.S. Bureau of Labor Statistics. The quits rate is the number of quits
(voluntary separations) during the entire year as a percent of annual average employment. The data
is available at the industry level from 2001. The industry classification is based on the North
American Industry Classification System (NAICS). The appendix reports annual quits rates by
industry and year.
7 Lexis-Nexis Academic Universe provides comprehensive information contained in major U.S and world publications (including Wall Street Journal, New York Times, The Washington Post, USA Today, among many others), SEC filings, news wire services, web publications, TV and radio broadcast transcripts, major company profiles and reports, court cases, law reviews, and even blogs. 8 This ensures that our samples of CEO compensation and employee pay cover the same time period.

12
Corporate governance may play a role in CEO compensation, and it may also matter in
determining average employee pay.9 Therefore, we examine whether corporate governance is a
factor in determining average employee pay and CEO compensation. We use the “G-Index”
constructed by Gompers, Ishii, and Metrick (2003) as a measure of corporate governance. They
compute the G-Index using a total of 24 possible antitakeover provisions. The data source is the
Investor Responsibility Research Center (IRRC) database, which provides annual information on
corporate antitakeover provisions for the years 1990, 1993, 1995, 1998, 2000, 2002, 2004, 2006,
and 2008. We fill in observations in the missing years using information from the most recent year:
for example, we use information from 2004 for year 2005. A greater value of the G-Index
corresponds to weaker shareholder rights and stronger managerial power.
Throughout our empirical analysis of both CEO compensation and average employee pay, all
dollar amounts are adjusted to 1992 dollars using the Consumer Price Index (CPI).10 We use the
Fama-French 48-industry classification to categorize firms into their respective industries (the
classification is obtained from Kenneth French’s website).11
4. Empirical Tests and Results on Capital Structure and CEO compensation
In this section, we describe our empirical tests of the impact of leverage on the magnitude of
CEO compensation. We start with OLS regressions of CEO compensation in the whole sample. We
then perform additional tests to identify causality: to accomplish this, we examine the impact of
leverage in the prior year on the compensation of newly appointed CEOs who are hired from
outside.
4.1. Summary statistics
In Table 1, we present summary statistics for the variables used in our analysis of CEO
compensation. Execucomp provides two measures of total compensation: one includes the value of
9 Cronqvist et al. (2009) find that CEOs with more control pay their workers more. 10 CPI data is taken from the website of the Bureau of Labor Statistics: http://www.bls.gov/cpi/. 11 http://mba.tuck.dartmouth.edu/pages/faculty/ken.french/data_library.html
13
the options granted while the other includes the value of options exercised. We use the total
compensation including the value of options exercised in our analysis. The results remain
qualitatively the same when the value of options granted is considered. Cash compensation is the
sum of salary and bonus, as provided by Execucomp. We compute equity-based compensation as
the total compensation minus salary, bonus, other annual pay, and LTIP (Long-term Incentive Plan).
The most common forms of equity-based compensation are stock options and restricted stocks.
Market capitalization is computed as the stock price multiplied by the number of shares outstanding
at the end of a fiscal year. Market-to-book ratio is the market capitalization divided by the book
value of equity. All continuous variables except leverage are winsorized at the 1st and 99th
percentiles. 12
Leverage is the variable of interest. We measure leverage in four ways: the market leverage, as
used widely in the literature (e.g., Leary and Roberts, 2010), is computed as the total debt divided
by the sum of total debt and market value of equity; the book leverage, also used commonly in the
literature, is computed as the total debt divided by the sum of total debt and book value of equity.
Total debt is the sum of long-term debt and debt in current liabilities (data 9 plus data 34). Debt in
current liabilities (data 34) includes notes payable (data 206) and debt due in 1 year (data 44).
Welch (2011) argues that the liabilities that are non-financial debt should not be included in the
computation of leverage ratio. We follow Welch (2011) and introduce two additional measures of
leverage, which we refer to as “alternative market leverage” and “alternative book leverage”
respectively. We calculate “alternative market leverage” as: (total long-term debt + debt due in 1
year)/(total long-term debt + debt due in 1 year + market value of equity); and calculate “alternative
book leverage” as: (total long-term debt + debt due in 1 year)/(total long-term debt + debt due in 1
year + book value of equity).13 Due to space limitations, we report results only from our analysis
12 Another way to identify outliers is by employing Hadi’s (1992, 1994) procedure. The exclusion of outliers does not affect the results of our multivariate analysis. 13 We thank an anonymous referee for bringing Welch (2011) to our attention and for suggesting that we also report our analysis using these two alternative measures of market and book leverage, respectively.

14
using market leverage, alternative market leverage, and alternative book leverage. However, results
from our analysis using book leverage are available upon request.
CEOs’ cash compensation (salary plus bonus) has a mean of $972,330 and a median of
$736,490, with a 1% cutoff of $109,090 and 99% cutoff of $4.531 million. The equity-based
compensation has a larger mean but a smaller median than the cash compensation. The reason is
that equity-based pay has a wider range across firms than cash pay, and some CEOs have extremely
large equity-based pay. For example, the 99% cutoff of equity-based compensation is about $27
million, while the 1% cutoff is only $12,500. We use the natural log of the compensation variables
in our multivariate regression of CEO compensation to reduce the potential impact of outliers. The
one-year return to shareholders (including dividends), a measure of firm performance, has a median
of 10.33%.
Insert Table 1 here
Turning to CEO characteristics, the median CEO age is 65, and the median length of CEO
tenure is 4 years. Only 2% of the CEOs in our sample are female. 64% of the CEOs also serve as
Chairman of the board. The G-index has a mean of 9.26 and a median of 9.
4.2. OLS regressions
In our reduced form analysis, we model CEO compensation as the following:
.,,8,7,6,5
,4,3,2,10,
tititititi
tititititi
MALEChairTenureAge
RETMTBLeverageSizeCEOPay
(1)
Here CEOPayi,t is the CEO compensation of firm i in year t and it is measured in three ways: cash,
equity-based, and total compensation. Sizei,t is the natural log of market capitalization of firm i as of
year t. We expect Sizei,t to be a positive and significant determinant of CEO compensation. As
Murphy (1999) has pointed out, the best-documented stylized fact regarding CEO pay is that CEO
pay is higher in larger firms. tiLeverage , is the leverage ratio of firm i as of year t. If firms with
higher leverage pay a higher wage to their CEOs, 2 would be positive. tiMTB , is the market-to-

15
book ratio of firm i as of year t, which is used as a proxy for firms’ growth opportunities. tiRET , is
the return to shareholders of firm i in year t, a popular measure of the performance of firm i in year
t. The existing literature documents a positive relation between CEO pay and firm performance.14
Hence, we expect 4 to be positive. In addition, we control for individual CEO characteristics that
may affect CEO compensation. tiAge , is the age of the CEO of firm i as of year t;
tiTenure , is the
number of years the executive has acted as the CEO in firm i prior to year t; tiChair , is one if the
CEO is also the Chairman, and zero otherwise; tiMALE , is one if the CEO is male, and zero
otherwise. We include year dummies to control for time-specific variation in CEO pay. As
documented by the literature, CEO compensation has increased tremendously during the past few
decades. We include industry dummies due to the significant variation in CEO pay across
industries.
In Table 2, we report the estimated coefficients and standard errors obtained from the OLS
regression of Equation (1). The standard errors are clustered by firm. Estimation results from using
market leverage, alternative market leverage, and alternative book leverage are reported in Panel A,
Panel B, and Panel C, respectively. Columns 1-3 in each panel exclude the G-Index, while columns
4-6 in each panel include the G-Index. Including the G-index in the regression reduces the sample
size. Firm size has a positive impact on all three measures of CEO compensation. A larger firm pays
its CEO, on average, more than a smaller firm does, which is consistent with the literature. A higher
one-year return to shareholders is associated with greater CEO pay. This is consistent with the
positive relation between CEO pay and firm performance as documented by the literature.
On average, an older CEO earns a larger pay. Being the Chairman has a positive and
significant effect on CEO compensation. Gender does not have a significant effect on CEO pay.
The coefficient on CEO tenure is not significant in the regression of total and cash compensation,
14 Murphy (1999) provides a comprehensive review of the relation between firm performance and CEO compensation.

16
but is negative and significant (at the 5% level) in that of equity-based compensation. Market-to-
book ratio is not significant in the regressions of total compensation, but it is negative in the
regression of cash pay and is positive in that of equity-based compensation. This suggests that
growth firms pay less cash but more stock-based compensation to their CEOs than value firms.
Insert Table 2 here
The leverage ratio has a positive and significant effect on cash, equity-based, and total
compensations. According to Column (1) of Panel A, if market leverage goes up by one standard
deviation (0.19, as reported in Table 1), the natural log of CEO total compensation increases by
0.19*0.42 = 0.080, which translates to more than 8.3% increase in total pay. Therefore, if we start at
the median total CEO compensation of $1.20 million, the total CEO pay increases by about
$100,000, an economically significant amount. If market leverage increases by one standard
deviation, 0.19, the CEO’s cash pay goes up by more than 12% and the CEO’s equity-based pay
goes up by more than 8%. In summary, the effect of leverage on CEO compensation is
economically as well as statistically significant.
The G-Index is a positive and significant factor in determining CEOs’ cash, equity-based, and
total pay, suggesting that stronger managerial power is associated with greater CEO compensation.
Leverage continues to have a positive and significant effect on CEO compensation in the presence
of the G-Index.
We also estimate Equation (1) by year, in the spirit of Fama and Macbeth (1973). Table 3
reports the coefficient of leverage in the regression of CEO compensation for every year between
1992 and 2006. The coefficients of all three measures of leverage in the regression of CEOs’ total
pay and cash pay are positive in all of the 15 years. The coefficient of alternative book leverage is
positive in the regression of CEOs’ equity-based pay in 13 out of 15 years, while the other two
measures of leverage have a positive coefficient in the regression of CEOs’ equity-based pay in 14
out of 15 years.
Insert Table 3 here

17
4.3. New CEOs hired from outside
It is possible that some unobservable and thus uncontrolled CEO characteristics affect both
leverage and compensation in the same direction, thus resulting in the positive coefficient of
leverage in the OLS regression of CEO compensation. For example, CEOs who have had more
interaction with the board (and therefore have more influence) may have greater ability to affect
their own pay and at the same time choose the firm’s leverage level as well.
To address potential concerns regarding causality, we study the subset of newly appointed
CEOs who are hired from outside. We examine how the first-year compensation of these new CEOs
is affected by firm leverage in the year prior to their appointment. CEOs hired from outside should
have no influence on their firms’ capital structure in the year prior to their appointment, so that this
is a clean test of the relationship between leverage and CEO compensation, allowing us to deal with
the potential causality problem discussed above.
We model the relationship between the first-year compensation of newly appointed CEOs hired
from outside and the leverage ratio in the year prior to their appointment as follows:
.,,7,6,5,4
1,31,21,10,
tititititi
titititi
MALEChairAgeRET
MTBLeverageSizeCEOPay
(2)
In Equation (2), firm size, leverage, and market-to-book ratio are computed as of the fiscal year
prior to the appointment of the new CEO. CEO tenure is omitted from Equation (2), since we
estimate Equation (4) on the sample of newly appointed CEOs hired from outside (all of them have
zero tenure, by definition). Titman (1984) and BSZ (2010) predict that a firm with higher leverage
will pay its employees more. In the case of a newly hired CEO, he will demand and obtain a higher
pay from a firm with higher leverage. Therefore, we expect 2 to be positive.
In Table 4, we present the coefficients and standard errors obtained from estimating Equation
(2) on the subset of newly appointed CEOs who are hired from outside. Firm size is a strong factor
in determining the pay of newly appointed CEOs (cash, equity-based, and total compensation). The
coefficient on the market-to-book ratio is negative and significant in all three types of
18
compensation, suggesting that growth firms pay their new CEOs less than value firms do. The
coefficient of stock return during the first year of a new CEO is positive and significant in the
regression of equity-based compensation. CEO age has a negative effect on equity-based
compensation, different from what we see in Table 2. This is due to the differences between the
underlying samples. In Table 2, the same CEO in the same firm appears in multiple years, and the
pay often increases with the CEO’s age. In Table 4, all the CEOs are newly hired from outside and
the compensation information is based on their first-year pay only. The negative coefficient on
CEO age in the regression of equity-based compensation suggests that a younger newly hired CEO,
in his first year, earns more equity-based pay than an older newly hired CEO, after controlling for
other factors.
Insert Table 4 here
The variable of interest is the leverage ratio. The coefficient on leverage is positive and
significant in the regressions of all three forms of compensation for the newly hired CEOs, for all
three measures of the leverage ratio. The impact of leverage on CEO compensation is also
economically significant: a one standard deviation increase in market leverage corresponds to an
19% increase in cash pay, a 27% increase in equity-based pay, and an 18% increase in the total
compensation of a new CEO.
The results in Table (2)-(4) demonstrate that leverage has a strong and positive effect on the
level of CEO compensation, supporting Hypothesis 1. Firms with higher leverage incur a greater
amount of CEO compensation, which is consistent with the Titman-BSZ prediction discussed
above.
5. Empirical Tests and Results on Capital Structure and Average Employee Pay
In this section, we present results on the effect of leverage on average employee pay. In the
multivariate analysis, we start with OLS regressions. We then utilize instrumental variable
regressions of average employee pay to address potential concerns about the endogeneity of
19
leverage. Finally, we deal with a potential sample selection problem using a Heckman (1979) two-
step analysis.
5.1. Summary statistics
Table 5 provides the summary statistics of the variables used in our analysis of average
employee pay. Average employee pay is computed as labor expenses (data item 42) divided by the
number of employees (data item 29). Leverage is the total debt divided by the sum of total debt and
the book value of equity. Market capitalization is the stock price multiplied by the number of shares
outstanding as of the fiscal year end. We compute average sales per employee by dividing the
amount of total sales (data item 12) by the number of employees (data item 29). Market-to-book
ratio is the market capitalization divided by the book value of equity. Physical capital intensity is
computed as gross property, plant, and equipment scaled by total assets (data item 6). All
continuous variables except leverage are winsorized at the 1st and 99th percentiles.
The mean (median) of average employee pay is $32,760 ($32,000). The 1% cutoff is $1,490,
and the 99% cutoff is $95,580. Market capitalization has a wide range, from $2.08 million (the 1%
cutoff) to $82,827 million (the 99% cutoff). To reduce the potential influence of outliers, we use
the log of average employee pay and the log of market capitalization in our analysis. The mean of
sales per employee is about $166,260. The market-to-book ratio has a mean of 2.94 and a median
of 2.06. On average, the gross amount of property, plant, and equipment is about 69% of total
assets.
Insert Table 5 here
5.2. OLS regressions
Our objective here is to estimate the effect of leverage on average employee pay. In our
reduced form analysis (the base case), we use the following specification:
tititititititi PCIMTBAvgSaleLeverageSizeAEP ,,5,4,3,2,10, . (3)

20
Here AEPi,t is the natural log of average employee pay of firm i in fiscal year t. tiSize , is the log of
market capitalization of firm i at the end of year t. Prior empirical studies have documented that
larger firms tend to pay higher wages to their employees than smaller firms, so we expect 1 to be
positive. tiAvgSale ,
is the sales per employee. We use tiAvgSale ,
to directly measure the
productivity of the average employee of firm i in year t, and we expect 3 to be positive.
MTBi,t is the market-to-book ratio of firm i as of year t. We control for the market-to-book
ratio, as it is a common proxy for a firm’s growth opportunity. PCIi,t is the physical capital intensity
of firm i as of year t. We include the measure of physical capital intensity for two reasons: first,
capital intensive firms tend to be more productive (Cronqvist et al., 2009); second, BSZ (2010)
predict a positive correlation between physical capital intensity and employee wage. We include the
year dummies to control for the aggregate variation in employee pay. We also include the industry
dummies because there is a great deal of heterogeneity in pay practices across industries. The effect
of leverage on average employee pay is of particular interest. If firms of higher leverage pay their
employees more, 2 will be positive.
Panel A of Table 6 presents the estimated coefficients and standard errors obtained from the
OLS regression of Equation (3) for all firms. The standard errors are clustered by firm and are also
robust to heteroskedasticity. Larger firms pay their employees more, consistent with the literature
(e.g., Brown and Medoff, 1989). Average sales per employee affects average employee pay
positively, consistent with our expectation, since sales per employee is a measure of employee
productivity. Neither physical capital intensity nor the market-to-book ratio has a significant impact
on average employee pay. Most importantly, after controlling for other factors, the leverage ratio
has a positive effect on average employee pay. The coefficients on all three leverage ratios are
positive and significant at the 1% or 5% level. This supports Hypothesis 2. We find that the G-Index
is not a statistically significant factor in determining average employee pay. Further, even in the

21
presence of the G-Index, leverage is a positive and significant determinant of average employee
pay.
Insert Table 6 here
We now examine the subset of financially distressed versus safe firms. Since its introduction
by Altman (1968), the Z-score has been used for the prediction of bankruptcy. Following the
original formula, we compute the Z-score as follows:
Z = 1.2T1 + 1.4T2 + 3.3T3 + .6T4 + T5. (4)
Here T1 = working capital / total assets, where working capital is computed as current assets
minus current liabilities; T2 = retained earnings / total assets; T3 = earnings before interest and taxes
/ total assets; T4 = market value of equity / book value of total liabilities; T5 = sales/ total assets. A
lower Z-score corresponds to a greater probability of bankruptcy: firms with a Z-score above 2.99
are considered to be safe, while those a Z-score of 1.8 or lower considered to be distressed, and
those with Z scores in between the above two threshold values considered to be in the “grey” zone.
Panel B of Table 6 reports the results from estimating Equation (3) on the two subsets:
distressed firms and safe firms. When firms are financially distressed, average employee pay is not
significantly related to leverage; when firms are safe, average employee pay increases with
leverage. In summary, the evidence supporting Hypothesis 4 is weak or nonexistent. This indicates
that while the ex ante relationship between leverage and employee pay suggested by Titman-BSZ
prediction dominates in our entire sample and in the subsample of safe firms, in distressed firms the
ex-post relationship postulated by Perotti and Spier (1993) may partially or fully offset the above
effect of firms compensating employees for the reduction in the value of their human capital due to
higher leverage.
In Panel C, we include the quits rate in the OLS estimation. Column 1 includes the quits rate
only. The coefficient is significant and negative, suggesting that more specialized labor gets paid
more. Column 2 adds industry and year fixed effects to the regression, and the coefficient of quits
rate becomes insignificant. This is not surprising, given that the annual quits rate is measured at the
22
industry level. In columns 3-5, the coefficient of quits rate remains insignificant, but that of all three
leverage ratios is still positive and statistically significant.
As a robustness test, we also estimate Equation (3) by year, in the spirit of Fama and Macbeth
(1973). Table 7 reports the estimated coefficient on leverage in every year during 1992-2006. The
coefficient on market leverage ranges from -0.02 to 0.66, and is positive in 13 out of 15 years. Its
mean is 0.22, statistically larger than zero. The impact of leverage is somewhat weaker prior to year
2000 than after year 2000. To understand why, we examine the percentage of non-technology firms
by year. We find that the percentage of non-technology firms is below sample mean in 5 out of 9
years during 1992-2000 while the percentage of non-technology firms is below sample mean in only
2 out of 6 years during 2001-2006. As we document later, the effect of leverage on average
employee pay is stronger in non-technology firms, so that the smaller coefficients on leverage prior
to the year 2000 may be due to the lower fraction of non-technology firms prior to year 2000.
Insert Table 7 here
5.3. Instrumental variable regressions
As we discussed in the introduction, the assets of a given firm may be such that they can
support a high level of leverage (for example, the proportion of tangible assets may be high) and
may also require highly paid employees to operate these assets, thus generating a positive
correlation between leverage and employee pay. To deal with this potential endogeneity problem,
we employ an instrument variable, namely, the marginal corporate tax rate, to generate an
exogenous variation in leverage. A valid instrumental variable (IV) for leverage needs to satisfy two
conditions: it is correlated with the leverage ratio (the validity requirement), but is uncorrelated with
the residual in the regression of employee pay (the exclusion restriction). The instrument we use,
namely, the marginal corporate tax rate, satisfies both requirements. The theoretical literature in
corporate finance indicates that the tax benefit of debt will be positively related to a firm’s marginal
tax rate, thus resulting in a positive correlation between a firm’s marginal tax rate and its leverage
ratio. The empirical literature supports the above view (for example, Leary and Roberts, 2010). At

23
the same time, there is no theoretical or empirical literature indicating that the marginal corporate
tax rate will directly affect average employee pay.
Following Graham, Lemmon, and Schallheim (1998), we use the marginal tax rates based on
income before interest is deducted (MTRB), from the database of marginal tax rates provided by
John Graham (for more details, see Graham, 1996a and Graham, 1996b). When examining the
effect of firms’ leverage on bond ratings, Molina (2005) also uses marginal tax rate as an instrument
for leverage. We implement the instrumental variable regressions by using the 2SLS (two-stage
least squares) procedure in STATA (Wooldridge, 2002). In the first stage, leverage is regressed onto
the instrumental variable and control variables; in the second stage, average employee pay is
regressed onto the instrumented leverage and control variables. The first stage regression
specification is given by:
.)/()/( ,,7,6,5,4,3,2,10, tititititititititi TAEBITSTDTAEBITPCIMTBAvgsaleSizeMTRBLeverage (5)
The second stage regression specification is given by:
.)/()/( ,,7,6,5,4,3,2,10, tititititititititi TAEBITSTDTAEBITPCIMTBAvgSaleLeverageSizeAEP (6)
MTRB is the marginal tax rate based on income before interest is deducted. EBIT/TA is
earnings before depreciation, interest, and taxes divided by total assets, and STD (EBIT/TA) is the
standard deviation of EBIT/TA in the past five years. The results from the above instrumental
variable regression are presented in Table 8. In the first stage analysis (leverage is the dependent
variable), marginal tax rate is an important determinant of debt ratio, significant at the 1% level. In
their survey of the weak-instrument literature, Stock et al. (2002) develop benchmarks for the
necessary magnitude of the F-statistic. When the number of instruments is 1, 2, 3, 5, and 10, the
suggested critical F-values are 8.96, 11.59, 12.83, 15.09, and 20.88, respectively. If the first-stage
partial F-statistic falls below these critical values, the instruments are considered to be weak and
inference problems are potentially serious. The partial F-statistics of our instrument in the
regressions of all three leverage ratios are above the critical value of 8.96. The results in the first
24
stage and the partial F-test confirm that the marginal tax rate is a strong instrument (i.e., it satisfies
the validity requirement).
Insert Table 8 here
In the second stage analysis, firm size and average sales per employee are positive and
significant determinants of the average employee pay, consistent with the results from our OLS
regressions presented in Table 6. More importantly, we find from our second stage regression that,
even after accounting for the potential endogeneity of leverage, leverage continues to be a positive
and significant determinant of average employee pay.
Note that in the first-stage regression of alternative book leverage, the market to book ratio has
a positive co-efficient, which seems to contradict the negative relation between leverage and the
market to book documented in the existing literature. However, Chen and Zhao (2006) show that the
negative relation that has been documented between book leverage and market to book ratio is
driven by a few small firms with very large market-to-book ratios. In particular, they note that a
positive relation between market-to-book and leverage holds for 88% of all firms, accounting for
more than 95% of the total market capitalization. 15
5.4. Missing data on labor expenses: a Heckman (1979) two-step analysis
As we have mentioned earlier, labor expenses are missing for a number of firms in
COMPUSTAT. This creates a potential sample selection bias, if firms selectively decide whether or
not to report labor expense information. To control for this potential sample selection bias, we adopt
a Heckman (1979) two-step analysis in this section.
In the first step, we estimate a probit model of whether or not a firm reports labor expenses.
The dependent variable is one if the data on labor expenses is non-missing, and zero otherwise; the
independent variables include the dummies of the firm’s listing exchange, in addition to the original
control variables in the regression of average employee pay. The listing exchange is the identifying
15 The review article by Parsons and Titman (2008) has a detailed discussion of papers studying the relation between leverage and the market to book ratio, including the paper by Chen and Zhao (2006). They suggest caution when using and interpreting market to book ratios in leverage specifications.

25
variable: we assume that firms on different exchanges have different reporting behavior (the results
in the first-step probit analysis confirm this assumption), while exchange listing does not affect the
reported average employee pay (to verify this condition, we add the dummies of exchange listing to
the OLS regression of average employee pay, and find that they are jointly insignificant, with an F-
statisitc of 1.29 and p-value of 0.28). In the second step, we examine the effect of leverage on
average employee pay. The inverse Mills ratio (Lambda) derived from the selection model is
included in the second step as a regressor, and all other independent variables are as specified in
Equation (3).
Insert Table 9
The estimated coefficients and standard errors are reported in Table 9. From the estimation of
the selection model in the first step, we observe that larger firms with higher leverage, lower sales
per employee, lower market-to-book ratio, and higher physical capital intensity are more likely to
report labor expenses. The exchange dummies are jointly significant. In the second step, the
coefficients on firm size and average sales per employee are positive and significant. More
importantly, the impact of leverage on average employee pay remains positive and significant after
we control for the potential sample-selection bias.
The Heckman two-step procedure produces consistent estimation of parameters. The
coefficient on the inverse Mills ratio is statistically distinguishable from zero and negatively signed,
suggesting that the unobserved factors that make reporting of labor expenses more likely tend to be
associated with lower average employee pay.
5.5. A comparison of the incremental costs and benefits of leverage
Both our OLS and instrumental variable regressions provide evidence supporting Hypothesis 2.
Based on the results presented in Panel A of Table 6, we now compute the incremental tax benefits
and labor costs associated with an increase in leverage. For a firm with the median values of the
leverage ratio, average employee pay, total labor expenses, and total debt, if the market leverage
ratio increases by 0.23 (one standard deviation of leverage in the sample in Panel A of Table 6), the

26
natural log of average employee pay will increase by 0.23*0.23=0.0529. Starting at the median level
of average employee pay of $32.00 (in thousands), average employee pay then becomes $33.79 (in
thousands), an increase of 5.60%. The median total labor expenses is about $250 million, so the
increase in total labor expenses is about 250*5.60%= $14.01 million, assuming that the number of
employees does not change.
The return on corporate bonds depends on various factors such as interest rate, credit rating,
and time to maturity, so that we can only use an average interest rate for our calculation of the tax
benefits of debt. We use 6% as the average rate of return on corporate bonds in our sample from
1992-2006.16 The median level of debt is about $120 million in our sample. Starting from the
median leverage ratio of 0.20, the level of debt goes up by 202% when we increase market leverage
ratio by 0.23 (one standard deviation), holding everything else constant. If we assume a marginal
tax rate of 35%, which is the median corporate marginal tax rate as computed by John Graham
(Graham, 1996a and Graham, 1996b), interest expenses will increase by $120*202%*0.06 = $14.54
million, and the tax benefits of debt would increase by 14.54*0.35 = $5.09 million, which is smaller
than the increase in total labor expenses ($14.01 million). The above calculation shows that the
additional labor costs associated with an increase of one standard deviation in the leverage ratio
offsets all of the incremental tax benefits associated with the leverage increase.
We repeat the above calculation by increasing the market leverage ratio from the median level
of 0.20 all the way to 0.68, an increase of more than two standard deviations. Figure 1 plots the
changes in total labor expenses and the tax benefits of debt as the leverage ratio goes up. The graph
shows that the additional labor expenses offset all of the incremental tax benefits of debt even when
the leverage ratio is increased by as much as two standard deviations.
Insert Figure 1 here
16 We believe that 6% is a reasonable estimate. The compounded annual return for long-term U.S government bonds has averaged less than 3% during the past four decades, and we assume that corporate bonds, on average, have a 3% premium over long-term U.S government bonds.

27
The above analysis demonstrates that the incremental labor costs associated with an increase in
leverage are economically significant. Further, these incremental labor costs are greater than the
additional tax benefits of debt associated with a wide range of changes in the leverage ratio.
Therefore, the above results support our hypotheses 2 and 3. Overall, this evidence is consistent
with the Titman-BSZ prediction, i.e., risk-averse employees demand greater compensation from
firms with higher leverage, and such indirect costs of bankruptcy are economically large enough to
limit the use of debt by these firms.
6. Technology firms versus non-technology firms
We now study CEO compensation and average employee pay in two subsets of our sample:
technology firms versus non-technology firms. The definition of technology firms and non-
technology firms follows that in Anderson, Banker, and Ravindran (2000), Ittner, Lambert, and
Larcker (2003), and Murphy (2003). Technology firms are defined as companies in the computer,
software, internet, telecommunications, or networking fields. Non-technology firms are firms with
SIC codes less than 4000 not otherwise categorized as technology firms.17 We examine whether the
effect of leverage on employee pay is different between technology and non-technology firms since
employees in non-technology firms are more entrenched than in technology firms (in the sense
discussed in Section 2), so that we expect the effect of leverage on employee pay in non-technology
firms to be greater than that in technology firms (consistent with Hypothesis 5).
6.1. CEO compensation in technology versus non-technology firms
We first examine CEO compensation in technology versus non- technology firms. In Table 10,
we compare CEO compensation and various explanatory variables across technology and non-
17 Technology firms are defined as companies with primary SIC designations of 3570 (Computer and Office Equipment), 3571 (Electronic Computers), 3572 (Computer Storage Devices), 3576 (Computer Communication Equipment), 3577 (Computer Peripheral Equipment), 3661 (Telephone & Telegraph Apparatus), 3674 (Semiconductor and Related Devices), 4812 (Wireless Telecommunication), 4813 (Telecommunication), 5045 (Computers and Software Wholesalers), 5961 (Electronic Mail-Order Houses), 7370 (Computer Programming, Data Processing), 7371 (Computer Programming Service), 7372 (Prepackaged Software), and 7373 (Computer Integrated Systems Design). Non-technology firms are firms with SIC codes less than 4000 not otherwise categorized as technology firms.

28
technology firms. The mean of total compensation for CEOs in technology firms is greater than that
in non-technology firms, but the median is smaller for CEOs in technology firms. Although CEOs
in technology firms receive less cash compensation than CEOs in non-technology firms, the former
have a greater mean of equity compensation than the latter, consistent with Anderson, Banker, and
Ravindran (2000), Ittner, Lambert, and Larcker (2003), and Murphy (2003). Technology firms have
lower leverage than non-technology firms. Further, CEOs in technology firms are younger than
CEOs in non-technology firms. Finally, CEOs in technology firms are less likely to serve as the
Chairmen of the board and are more likely to be female than those in non-technology firms.
Insert Table 10 here
Panel A of Table 11 reports the results from OLS regressions of CEO compensation for non-
technology firms. Firm size is positively related to all three types of compensation: cash, equity-
based, and total compensation. Market-to-book ratio is negatively related to cash compensation, but
positively related to equity-based pay. One-year return is positive and significant in the regressions
of all three measures of CEO compensation. CEO age is positive and significant in the regression of
total and equity-based compensation. Serving as the Chairman of the board increases the CEO’s
cash, equity-based, and total compensation. The leverage ratio has a positive and significant effect
on CEOs’ cash, equity-based, and total compensation, for all three measures of leverage.
Panel B of Table 11 presents the regression results for technology firms. Size and CEO age are
positive and significant determinants of all three types of compensation. One-year return has
positive and significant influences on total and cash compensation. A higher market-to-book ratio is
associated with a lower cash pay. Leverage has a positive and significant effect on cash
compensation, but not on equity-based or total compensation.
Insert Table 11 here
We use a Wald test to examine whether the coefficient of leverage is statistically different
across the two groups. The value of chi-square is 22.40 (10.89) with a p-value of 0.0000 (0.0010)
for the regression of total compensation (equity-based compensation) on market leverage, and the
29
value of chi-square is 1.24 with a p-value of 0.26 for the regression of cash compensation on market
leverage. The Wald tests suggest that the effect of leverage on total and equity-based CEO
compensation is different between technology and non-technology firms, although the effect of
leverage on CEO cash compensation is not statistically different between the two groups. Overall,
the effect of leverage on CEO compensation is greater for non-technology firms than for technology
firms, consistent with our hypothesis 5, thus providing further support for the Titman-BSZ
prediction.
6.2. Average employee pay in technology versus non-technology firms
In Table 12, we analyze the effect of leverage on average employee pay in technology versus
non-technology firms. Consistent with the existing literature, technology firms have lower physical
capital intensity and lower leverage ratio than non-technology firms. Technology firms are also
smaller than non-technology firms, and they have smaller sales per employee than non-technology
firms. The mean of average employee pay is not significantly different between the two groups, but
the median of average employee pay is greater for non-technology firms. It is worth noting that,
although the mean leverage ratio in technology firms is low, the cross-sectional variation of
leverage ratio is still large, e.g., alternative book leverage ranges from 0 to 0.90 with a standard
deviation of 0.21 (not tabulated). Similar to the sample in Table 10, the technology firms in Table
12 also have lower leverage than non-technology firms. Different from Table 10, an average
technology firm in Table 12 is significantly smaller than an average non-technology firm. The
reason is that Table 10 and Table 12 contain different samples: Table 12 has 2,101 non-technology
and 298 technology observations due to the missing information on “labor and related expenses”
(data item 42) in COMPUSTAT, while Table 10 has 8,527 non-technology and 2,345 technology
observations from S&P 1,500 firms.
Insert Table 12 here
Table 13 presents the coefficients and standard errors obtained from our OLS regressions of
average employee pay for non-technology and technology firms. We find that the leverage ratio has
30
a positive and significant effect on average employee pay for non-technology firms. For technology
firms, the coefficient on leverage is not statistically significant. We use a Wald test to examine
whether the coefficient on leverage is statistically different across the two groups. Wald tests
suggest that alternative market and book leverage ratios have differential effects on average
employee pay in technology versus non-technology firms.
Insert Table 13 here
The results in this section demonstrate that leverage has a greater effect on both CEO
compensation and average employee pay for non-technology firms than for technology firms,
consistent with our Hypothesis 5. This is because employees in non-technology firms are more
entrenched than those in technology firms. Faced with a greater degree of entrenchment, employees
or CEOs in non-technology firms are more “fearful” of a potential bankruptcy. Therefore, in
equilibrium, their compensation is more sensitive to their firm’s leverage ratio.
7. Additional robustness tests
7.1. Issues relating to the use of panel data and the use of alternative measures
In our empirical analysis, we use panel data sets, with a significant number of firms appearing
in multiple years. When we estimate a linear model on panel data, the standard OLS assumption of
independence among the observations is very likely violated. Therefore, we need to consider both a
firm effect and a time effect in our regressions. As defined by Petersen (2009), the firm effect refers
to the correlation within the same firm across different years, and the time effect is the cross-
sectional correlation among different firms in the same year. Petersen (2009) compares different
approaches in estimating standard errors using financial panel data. He finds that, in the presence of
a firm effect only, clustering by firms generates unbiased estimates of standard errors. In the
presence of both firm and time effects, clustering by firms after including time dummies yields
unbiased estimates of standard errors.
31
Consistent with Petersen (2009), we find that the standard errors of the estimated coefficients
are significantly smaller if we do not cluster them by firm. The difference in standard errors
strongly indicates the existence of a firm effect. We control for both firm and time effects in our
empirical analysis. In our multivariate regressions, we include year dummy variables and cluster
the standard errors by the firm. The standard errors are also robust to heteroskedasticity. Another
way to control for both firm and time effects would be clustering by both year and firm. As a
robustness test, we repeat our analysis by adopting such an approach and find that the results are
very similar to those we have reported in earlier sections.
In our multivariate analysis of average employee pay, we do not include operating income
volatility as one of the independent variables. Its computation requires five years of data, which
reduces our sample size. As a robustness test, we now include this variable in our analysis, and find
that our results remain qualitatively the same, and that the coefficient of operating income volatility
is insignificant. Further, in our analysis of CEO pay, we have been using the total compensation
including the value of options exercised. Our results remain qualitatively the same if, as another
robustness test, the total compensation including the value of options granted (rather than options
exercised) is used in the above analysis.
7.2. Leverage and the Z-score
An important assumption underlying the Titman (1984) and the BSZ (2010) models is that
higher leverage is associated with a greater probability of bankruptcy, resulting in firms with higher
leverage having to compensate employees for the effect of this increased probability of bankruptcy
on their human capital. Consequently, to further understand the role of leverage on labor costs, we
examine the correlation of leverage with the Altman Z-score, which is a measure of a firm’s
bankruptcy probability. In the sample of average employee pay, the Pearson correlation coefficient
between the Z-score and alternative book leverage is -0.54; in the sample of CEO compensation, the
Pearson correlation coefficient between the Z-score and alternative book leverage is -0.47. As an
additional robustness test, we replace leverage with the Altman Z-score in our regressions, and find

32
that the Z-score has a negative and significant impact on average employee pay (at the 1% level).
The Z-score also affects the cash and total compensation of CEOs negatively and significantly,
although the effect of the Z-score on CEOs’ equity-based pay is not significant. These results are
available upon request.
The results of the above robustness tests confirm that leverage and bankruptcy probability are
positively correlated, and that the probability of bankruptcy indeed affects both average employee
pay and CEO compensation. They add additional support to the idea that the prospect of bankruptcy
has an important influence on the human capital costs incurred by firms.
8. Conclusion
Given the potentially large tax benefits of debt, why do firms adopt a low level of leverage?
The existing literature has shown that direct bankruptcy costs are not large enough to justify the
empirically observed low leverage ratios of firms. Titman (1984) and Berk, Stanton, and Zechner
(2010) argue theoretically that a particular form of indirect bankruptcy cost, namely, the incremental
employee pay associated with an increase in debt, is large enough to prevent firms from increasing
their leverage ratios. In this paper, we empirically test this prediction. Specifically, we answer the
following questions: First, does higher leverage result in greater employee compensation? Second,
are the additional labor costs associated with higher leverage large enough to offset the incremental
tax benefits of debt?
We conduct our empirical analysis using two measures of employee compensation: the
magnitude of CEO compensation and average employee pay. We find that the effect of leverage on
the magnitude of CEO compensation is economically and statistically significant. For the whole
sample, leverage has a positive effect on cash, equity-based, and total compensation of CEOs in our
multivariate regressions. To establish causality, we also study the relationship between the
compensation of newly appointed CEOs who are hired from outside and firm leverage in the year
before their appointment. We find that leverage has a significant effect on the magnitude of the

33
compensation of a new CEO. An increase of one standard deviation in leverage corresponds to a
19% increase in the total compensation of a new CEO.
In both OLS and instrumental variable regressions, we find that leverage also influences
average employee pay positively and significantly. Further, we show that, for a firm with the
median level of leverage, the incremental tax benefits arising from increased leverage are offset by
the additional labor costs associated with such an increase. The effect of leverage on average
employee pay is positive and significant for financially safe firms, but the impact is insignificant for
financially distressed firms. We also find that, while leverage has a positive and significant
influence on CEOs’ cash, equity-based, and total compensation in non-technology firms, it does not
have a significant influence on CEOs’ total or equity-based compensation in technology firms. The
effect of the leverage ratio on average employee pay is also greater in non-technology firms than in
technology firms. Since employees in non-technology firms can be viewed as more entrenched (in
the sense of BSZ, 2010), this provides additional support for the Titman-BSZ prediction.
Our instrumental variable analysis to control for the endogeneity of leverage has some
limitations. In particular, one potential criticism of the instrument we use, namely, the marginal tax
rate, is that the independent variation in this variable can arise only from past losses and relatively
recent investments with investment tax credits, both of which could independently influence wages.
However, even though the marginal tax rate may be an imperfect instrument, it allows us to address
the endogeneity of leverage to a significant degree, in the absence of a natural experiment that may
have allowed us to account for the potential endogeneity of leverage unambiguously.
References
Altman, E. I., 1968, Financial ratios, discriminant analysis and the prediction of corporate bankruptcy. Journal of Finance, 189–209.
Anderson, M., R. Banker, and S. Ravindran, 2000, Executive compensation in the information
technology industry. Management Science 46, 530-547.

34
Baldwin, C.Y., 1983, Productivity and labor unions: An application of the theory of self-enforcing contracts. Journal of Business 56, 155-185.
Benmelech, E., N. K. Bergman, and R. Enriquez, 2009, Negotiating with labor under financial distress. Working paper, Harvard University.
Berk, J. R. Stanton, and J. Zechner, 2010, Human capital, bankruptcy and capital structure. Journal
of Finance 65, 891-925.
Berkovitch, E., R. Israel, and Y. Spiegel, 2000, Managerial compensation and capital structure. Journal of Economics & Management Strategy 9, 549–584.
Bronars, S. G., and D. R. Deere, 1991, The threat of unionization, the use of debt, and the
preservation of shareholder wealth. Quarterly Journal of Economics 106, 231-254. Brown, D. T., E. Fee and S. Thomas, 2009, Financial leverage and bargaining power with suppliers:
Evidence from leveraged buyouts. Journal of Corporate Finance 15, 196-211. Brown, C., and J. Medoff, 1989, The employer size-wage effect. Journal of Political Economy 97,
1027-1059. Chen, L. and X. Zhao, 2006, On the relation between the market-to-book ratio, growth
opportunities, and leverage ratio. Finance Research Letters 3, 253–266. Cronqvist, H., F. Heyman, M. Nilsson, H. Svaleryd, and J. Vlachos, 2009, Do entrenched managers
pay their workers more? Journal of Finance 64, 309-339. Dasgupta, S., and K. Sengupta, 1993, Sunk investment, bargaining and choice of capital structure.
International Economic Review 34, 203-220. Fama, E., and K.R. French, 2002, Testing trade-off and pecking-order predictions about dividends
and debt. Review of Financial Studies 15, 1-33. Fama, E., and J. MacBeth, 1973, Risk, return, and equilibrium: Empirical tests. Journal of Political
Economy 81, 607-636. Fama, E., and W. Schwert, 1977, Human capital and capital market equilibrium. Journal of
Financial Economics 4, 95-125. Frydman, C., and D. Jenter, 2010, CEO Compensation. MIT LFE Working Paper. Gompers, P., J. Ishii, and A. Metrick, 2003, Corporate governance and equity prices. Quarterly
Journal of Economics 118, 107–155. Graham, J. R., 1996a, Debt and the marginal tax rate. Journal of Financial Economics 41, 41-73. Graham, J. R., 1996b, Proxies for the corporate marginal tax rate. Journal of Financial Economics
42, 187-221. Graham, John R., Michael L. Lemmon, and James S. Schallheim, 1998, Debt, leases, taxes, and the
endogeneity of corporate tax status. Journal of Finance 53, 131-162.

35
Graham, J. R., and A. L. Tucker, 2006, Tax shelters and corporate debt policy. Journal of Financial
Economics 81, 563-594.
Hadi, A. S., 1992, Identifying multiple outliers in multivariate data. Journal of the Royal Statistical Society, Series B54, 761-771.
Hadi, A. S., 1994, A modification of a method for the detection of outliers in multivariate samples.
Journal of the Royal Statistical Society, Series B56, 393-396. Hanka, G., 1998, Debt and the terms of employment. Journal of Financial Economics 48, 245-282. Heckman, J., 1979, Sample selection bias as a specification error. Econometrica 47, 153-161. Hennessy, C., and D. Livdan, 2009, Debt, bargaining and credibility in firm-supplier relationships.
Journal of Financial Economics 93, 382-399. Hovakimian, A., A. Kayhan, and S. Titman, 2012, Are corporate default probabilities consistent
with the static trade-off theory? Review of Financial Studies 25, 315-340. Ittner, C. D., R.A. Lambert, and D.F. Larcker, 2003, The structure and performance consequences
of equity grants to employees of new economy firms. Journal of Accounting and Economics 34, 89-127.
Jaggia, P., and A. V. Thakor, 1994, Firm-specific human capital and optimal capital structure.
International Economic Review 35, 283-308.
Leary, M., and M. Roberts, 2010, The pecking order, debt capacity, and information asymmetry. Journal of Financial Economics 95, 332-355.
Matsa, D., 2010, Capital structure as a strategic variable: Evidence from collective bargaining. Journal of Finance 65, 1197-1232.
Molina, C. A., 2005, Are firms underleveraged? An examination of the effect of leverage on default probabilities. Journal of Finance 60, 1427-1459.
Murphy, K., 1999, Executive compensation. Orley Ashenfelter and David Card (eds.), Handbook of
Labor Economics, Vol. 3, North Holland. Murphy, K., 2003, Stock-based pay in new economy firms. Journal of Accounting & Economics 34,
129-147. Parsons, C., and S. Titman, 2008, Empirical capital structure: A review. Foundations and Trends in
Finance 3, 1-93.
Perotti, E. C., and K. E. Spier, 1993, Capital structure as a bargaining tool: The role of leverage in contract renegotiation. American Economic Review 83, 1131-1141.
Petersen, M., 2009, Estimating standard errors in finance panel data sets: comparing approaches.
Review of Financial Studies 22, 435-480.

36
Stock, J.H., Wright, J.H., and M. Yogo, 2002, A survey of weak instruments and weak identification in generalized method of moments. Journal of Business & Economics Statistics 20, 518–529.
Titman, S., 1984, The effect of capital structure on a firm’s liquidation decision. Journal of
Financial Economics 13, 137-51. Titman, S., and R. Wessels, 1988, The determinants of capital structure choice. Journal of Finance
43, 1-19. Welch, I., 2011, Two common problems in capital structure research: the financial-debt-to-assets
ratio and issuing activity versus leverage changes. International Review of Finance 11, 1-17. Wooldridge, J.M., 2002, Econometric analysis of cross section and panel data. MIT Press,
Cambridge.
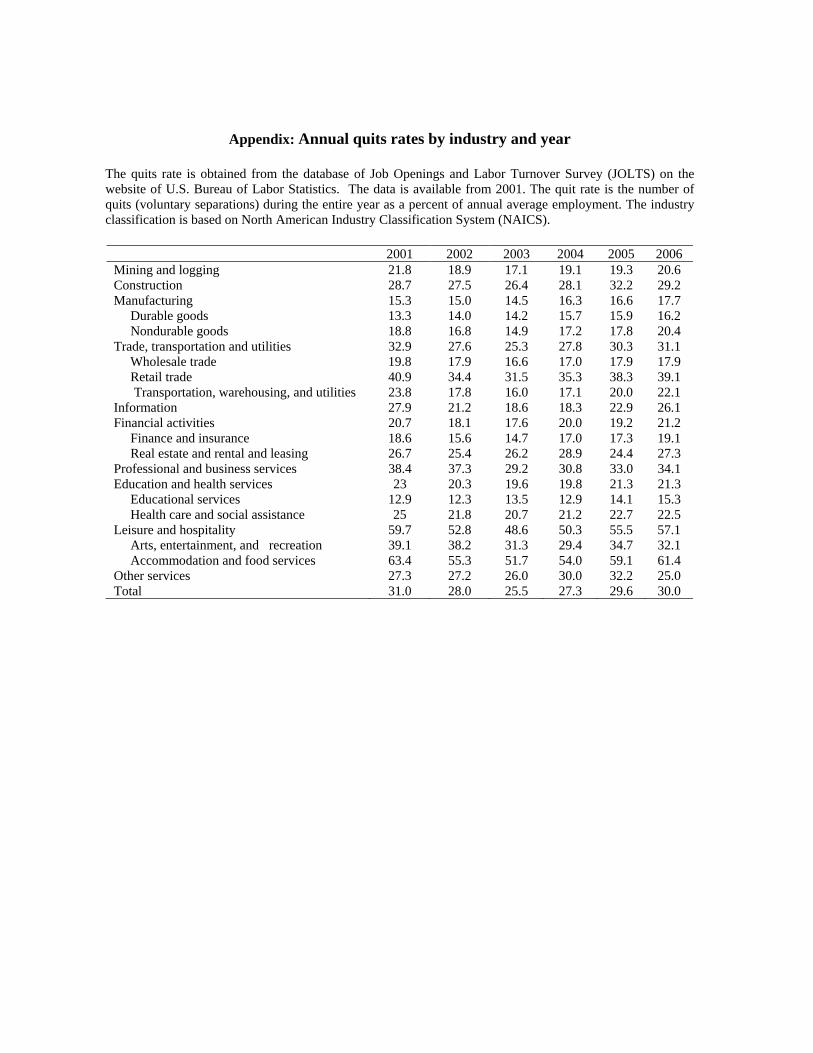
Appendix: Annual quits rates by industry and year
The quits rate is obtained from the database of Job Openings and Labor Turnover Survey (JOLTS) on the website of U.S. Bureau of Labor Statistics. The data is available from 2001. The quit rate is the number of quits (voluntary separations) during the entire year as a percent of annual average employment. The industry classification is based on North American Industry Classification System (NAICS).
2001 2002 2003 2004 2005 2006 Mining and logging 21.8 18.9 17.1 19.1 19.3 20.6 Construction 28.7 27.5 26.4 28.1 32.2 29.2 Manufacturing 15.3 15.0 14.5 16.3 16.6 17.7 Durable goods 13.3 14.0 14.2 15.7 15.9 16.2 Nondurable goods 18.8 16.8 14.9 17.2 17.8 20.4 Trade, transportation and utilities 32.9 27.6 25.3 27.8 30.3 31.1 Wholesale trade 19.8 17.9 16.6 17.0 17.9 17.9 Retail trade 40.9 34.4 31.5 35.3 38.3 39.1
Transportation, warehousing, and utilities 23.8 17.8 16.0 17.1 20.0 22.1 Information 27.9 21.2 18.6 18.3 22.9 26.1 Financial activities 20.7 18.1 17.6 20.0 19.2 21.2 Finance and insurance 18.6 15.6 14.7 17.0 17.3 19.1 Real estate and rental and leasing 26.7 25.4 26.2 28.9 24.4 27.3 Professional and business services 38.4 37.3 29.2 30.8 33.0 34.1 Education and health services 23 20.3 19.6 19.8 21.3 21.3 Educational services 12.9 12.3 13.5 12.9 14.1 15.3 Health care and social assistance 25 21.8 20.7 21.2 22.7 22.5 Leisure and hospitality 59.7 52.8 48.6 50.3 55.5 57.1 Arts, entertainment, and recreation 39.1 38.2 31.3 29.4 34.7 32.1 Accommodation and food services 63.4 55.3 51.7 54.0 59.1 61.4 Other services 27.3 27.2 26.0 30.0 32.2 25.0 Total 31.0 28.0 25.5 27.3 29.6 30.0

Table 1: Summary statistics of variables used in the analysis of CEO compensation
This table summarizes the variables used in the analysis of CEO compensation. Cash (salary plus bonus) and total compensations are provided by Execucomp. We compute equity-based compensation as the total compensation minus salary, bonus, other annual pay, and long-term incentive plan. Market leverage is computed as (debts in current liabilities + long-term debt)/( debts in current liabilities + long-term debt + market value of equity). Alternative market leverage is computed as (debts due in 1 year + long-term debt)/( debts due in 1 year + long-term debt + market value of equity). Alternative book leverage is computed as (debts due in 1 year + long-term debt)/( debts due in 1 year + long-term debt + book value of equity). Market capitalization is computed as the stock price multiplied by the number of shares outstanding as of the end of a fiscal year. Market-to-book ratio is the market capitalization divided by the book value of equity. All continuous variables except leverage are winsorized at the 1st and 99th percentiles. All dollar amounts are adjusted to 1992 dollars using the consumer price index (CPI).
N Mean Median Std. Dev. 1% cutoff 99%
cutoff
Cash (Salary + bonus) (in thousands)
14,891 972.33 736.49 789.83 109.09 4,531
Equity-based compensation (in thousands)
14,891 1,715.02 189.99 4,131.79 12.5 26,656
Total compensation including options exercised (in thousands)
14,891 2,809.71 1,201.47 4,739.57 158 32,099
Market leverage 14,891 0.19 0.14 0.19 0 0.80
Alternative market leverage 14,891 0.18 0.12 0.19 0 0.79
Alternative book leverage 14,891 0.28 0.28 0.23 0 0.88 Market capitalization (in millions)
14,891 4,762.54 916.74 17,368 28.59 78,204
Market-to-book ratio 14,891 3.42 2.45 3.25 0.45 21 One-year return to shareholders (%)
14,891 17.84 10.33 54.41 -77.55 249
CEO age 14,891 65.01 65 8.75 45 86 CEO tenure (Years as CEO in the firm)
14,891 6.38 4 7.30 0 35
CEO is male 14,891 0.98 1 0.12 0 1
CEO is also the Chairman 14,891 0.64 1 0.48 0 1
G-index 11,527 9.26 9.0 2.70 4 15

Table 2: Ordinary least square regressions of CEO compensation
This table reports the coefficients and standard errors obtained from OLS estimation of the following model of CEO compensation:
.,,8,7,6,5
,4,3,2,10,
tititititi
tititititi
MALEChairTenureAge
RETMTBLeverageSizeCEOPay
CEOPayi,t is measured in three ways: the log of CEO total compensation, the log of CEO cash compensation (salary plus bonus), and the log of equity-based compensation. Sizei,t is the log of market capitalization of firm i as of year t.
tiLeverage , is the leverage ratio of firm i as of year t. Market leverage is computed as (debts in current liabilities + long-
term debt)/( debts in current liabilities + long-term debt + market value of equity). Alternative market leverage is computed as (debts due in 1 year + long-term debt)/( debts due in 1 year + long-term debt + market value of equity). Alternative book leverage is computed as (debts due in 1 year + long-term debt)/( debts due in 1 year + long-term debt + book value of equity).
tiMTB , is the market-to-book ratio of firm i as of year t. RETi,t is the return to the shareholders of firm i in year t.
Agei,t is the age of the CEO of firm i as of year t; Tenurei,t is the number of years the executive has been acting as CEO in firm i prior to year t; Chairi,t is one if the CEO is also the Chairman, and zero otherwise; MALEi,t is one if the CEO of firm i as of year t is male, and zero otherwise. Numbers in the parentheses are the standard errors. The standard errors are clustered by firm and are also robust to heteroskedasticity. Regressions in Panel A use market leverage, regressions in Panel B use alternative market leverage, and regressions in Panel C use alternative book leverage.
Panel A: Market Leverage
Log of (total
compensation) (1)
Log of (cash compensation)
(2)
Log of (equity-based
compensation) (3)
Log of (total compensation)
(4)
Log of (cash compensation)
(5)
Log of (equity-based compensation)
(6)
Market leverage 0.42*** (0.07)
0.59*** (0.05)
0.42** (0.18)
0.43*** (0.07)
0.55*** (0.06)
0.45** (0.20)
Firm size 0.41*** (0.01)
0.29*** (0.01)
0.66*** (0.03)
0.41*** (0.01)
0.28*** (0.01)
0.66*** (0.03)
Market-to-book ratio
0.006 (0.005)
-0.02*** (0.003)
0.023** (0.010)
0.011** (0.005)
-0.01** (0.004)
0.02** (0.01)
One-year return to shareholders (%)
0.001*** (0.0002)
0.001*** (0.0001)
0.002*** (0.0004)
0.002*** (0.0002)
0.001*** (0.0001)
0.003*** (0.001)
CEO age 0.006*** (0.002)
0.006*** (0.001)
0.018*** (0.005)
0.006*** (0.002)
0.004** (0.002)
0.019*** (0.005)
CEO tenure -0.002 (0.003)
-0.002 (0.002)
-0.015** (0.006)
0.001 (0.003)
-0.001 (0.002)
-0.01 (0.01)
CEO is also the Chairman
0.18*** (0.03)
0.14*** (0.02)
0.24*** (0.07)
0.18*** (0.03)
0.14*** (0.02)
0.24*** (0.07)
CEO is male -0.05 (0.13)
-0.09 (0.08)
-0.32 (0.31)
-0.07 (0.13)
-0.07 (0.09)
-0.49 (0.31)
G-Index -- -- -- 0.02*** (0.005)
0.02*** (0.004)
0.05*** (0.01)
Year effects Yes Yes Yes Yes Yes Yes Industry effects Yes Yes Yes Yes Yes Yes
Intercept 3.15*** (0.23)
3.73*** (0.21)
-1.57** (0.62)
2.91*** (0.31)
3.68*** (0.30)
-1.86** (0.74)
Number of observations
14,891 14,891 14,891 11,527 11,527 11,527
R-squared 0.42 0.49 0.23 0.43 0.47 0.24 ***, **, *: indicate significance at the 1%, 5%, and 10% levels, respectively.

Panel B: Alternative Market Leverage
Log of (total
compensation) (1)
Log of (cash compensation)
(2)
Log of (equity-based compensation)
(3)
Log of (total compensation)
(4)
Log of (cash compensation)
(5)
Log of (equity-based compensation)
(6)
Alternative market leverage
0.41*** (0.07)
0.58*** (0.05)
0.40** (0.18)
0.43*** (0.08)
0.54*** (0.06)
0.45** (0.20)
Firm size 0.41*** (0.01)
0.29*** (0.01)
0.66*** (0.03)
0.41*** (0.01)
0.28*** (0.01)
0.66*** (0.03)
Market-to-book ratio 0.006
(0.005) -0.02*** (0.003)
0.023** (0.010)
0.011** (0.005)
-0.01*** (0.003)
0.02** (0.01)
One-year return to shareholders (%)
0.001*** (0.0002)
0.001*** (0.0001)
0.002*** (0.0004)
0.002*** (0.0002)
0.001*** (0.0001)
0.003*** (0.001)
CEO age 0.006*** (0.002)
0.006*** (0.001)
0.018*** (0.005)
0.006*** (0.002)
0.004** (0.002)
0.018*** (0.005)
CEO tenure -0.002 (0.003)
-0.003 (0.002)
-0.015** (0.006)
0.001 (0.003)
-0.001 (0.002)
-0.01 (0.01)
CEO is also the Chairman
0.18*** (0.03)
0.15*** (0.02)
0.24*** (0.07)
0.18*** (0.03)
0.14*** (0.02)
0.25*** (0.07)
CEO is male -0.04 (0.13)
-0.09 (0.08)
-0.32 (0.31)
-0.07 (0.13)
-0.07 (0.09)
-0.49 (0.31)
G-Index -- -- -- 0.02*** (0.005)
0.02*** (0.004)
0.05*** (0.01)
Year effects Yes Yes Yes Yes Yes Yes Industry effects Yes Yes Yes Yes Yes Yes
Intercept 3.16*** (0.23)
3.74*** (0.21)
-1.56** (0.62)
2.92*** (0.31)
3.69*** (0.30)
-1.85** (0.74)
Number of observations
14,891 14,891 14,891 11,527 11,527 11,527
R-squared 0.42 0.49 0.23 0.43 0.47 0.24 ***, **, *: indicate significance at the 1%, 5%, and 10% levels, respectively.
Panel C: Alternative Book Leverage
Log of (total
compensation) (1)
Log of (cash compensation)
(2)
Log of (equity-based compensation)
(3)
Log of (total compensation)
(4)
Log of (cash compensation)
(5)
Log of (equity-based compensation)
(6) Alternative book leverage
0.25*** (0.06)
0.49*** (0.04)
0.29** (0.15)
0.26*** (0.07)
0.44*** (0.05)
0.34** (0.17)
Firm size 0.40*** (0.01)
0.28*** (0.01)
0.65*** (0.02)
0.40*** (0.01)
0.27*** (0.01)
0.65*** (0.03)
Market-to-book ratio
-0.0002 (0.005)
-0.03*** (0.003)
0.01 (0.01)
0.005 (0.006)
-0.02*** (0.004)
0.01 (0.01)
One-year return to shareholders (%)
0.001*** (0.0002)
0.001*** (0.0001)
0.002*** (0.0004)
0.002*** (0.0002)
0.001*** (0.0001)
0.002*** (0.0005)
CEO age 0.006*** (0.002)
0.005*** (0.001)
0.018*** (0.005)
0.006*** (0.002)
0.004** (0.002)
0.02*** (0.005)
CEO tenure -0.002 (0.002)
-0.002 (0.002)
-0.014** (0.006)
0.001 (0.003)
-0.001 (0.002)
-0.01 (0.01)
CEO is also the Chairman
0.18*** (0.03)
0.14*** (0.02)
0.24*** (0.07)
0.18*** (0.03)
0.14*** (0.02)
0.24*** (0.07)
CEO is male -0.04 (0.13)
-0.09 (0.08)
-0.32 (0.31)
-0.07 (0.13)
-0.07 (0.09)
-0.48 (0.31)
G-Index -- -- -- 0.02*** (0.005)
0.02*** (0.004)
0.05*** (0.01)
Year effects Yes Yes Yes Yes Yes Yes Industry effects Yes Yes Yes Yes Yes Yes
Intercept 3.23*** (0.22)
3.83*** (0.20)
-1.49** (0.62)
3.02*** (0.29)
3.80*** (0.29)
-1.76** (0.74)
Number of observations
14,891 14,891 14,891 11,527 11,527 11,527
R-squared 0.42 0.52 0.23 0.43 0.47 0.24 ***, **, *: indicate significance at the 1%, 5%, and 10% levels, respectively.

Table 3: Fama-MacBeth analysis of CEO compensation
This table reports the coefficient of leverage obtained from OLS regression of CEO pay in each fiscal year during 1992-2006:
.,,8,7,6,5
,4,3,2,10,
tititititi
tititititi
MALEChairTenureAge
RETMTBLeverageSizeCEOPay
CEOPayi,t is measured in three ways: the log of CEO total compensation, the log of CEO cash compensation (salary plus bonus), and the log of equity-based compensation. Sizei,t is the log of market capitalization of firm i as of year t.
tiLeverage , is the leverage ratio of firm i as of year t. Market leverage is computed as (debts in current
liabilities + long-term debt)/( debts in current liabilities + long-term debt + market value of equity). Alternative market leverage is computed as (debts due in 1 year + long-term debt)/( debts due in 1 year + long-term debt + market value of equity). Alternative book leverage is computed as (debts due in 1 year + long-term debt)/( debts due in 1 year + long-term debt + book value of equity).
tiMTB , is the market-to-book ratio of firm i as of year t. RETi,t is the return to the shareholders of firm i in year t. Agei,t is the
age of the CEO of firm i as of year t; Tenurei,t is the number of years the executive has been acting as CEO in firm i prior to year t; Chairi,t is one if the CEO is also the Chairman, and zero otherwise; MALEi,t is one if the CEO of firm i as of year t is male, and zero otherwise.
Year
Log of (total compensation)
Log of (cash compensation)
Log of (equity-based
compensation)
Log of (total compensation)
Log of (cash compensation)
Log of (equity-based
compensation)
Log of (total compensation)
Log of (cash compensation)
Log of (equity-based
compensation)
Market leverage Alternative market leverage Alternative book leverage 1992 0.43 0.63 0.004 0.35 0.62 -0.04 0.41 0.52 0.35 1993 0.19 0.47 -0.03 0.23 0.46 0.06 0.17 0.37 0.04 1994 0.42 0.50 0.69 0.45 0.53 0.72 0.35 0.42 0.66 1995 0.55 0.50 0.98 0.58 0.51 1.03 0.40 0.41 0.69 1996 0.55 0.55 0.69 0.54 0.45 0.65 0.44 0.55 0.57 1997 0.59 0.68 0.37 0.55 0.65 0.29 0.30 0.49 0.10 1998 0.54 0.58 0.64 0.48 0.52 0.67 0.23 0.47 0.16 1999 0.55 0.52 0.77 0.52 0.48 0.77 0.30 0.50 0.38 2000 0.35 0.58 0.24 0.36 0.57 0.25 0.04 0.48 -0.15 2001 0.45 0.68 0.01 0.46 0.67 0.01 0.33 0.57 0.25 2002 0.41 0.54 0.47 0.40 0.52 0.48 0.36 0.51 0.67 2003 0.39 0.60 0.30 0.38 0.63 0.19 0.19 0.44 0.28 2004 0.45 0.61 0.92 0.44 0.60 0.89 0.19 0.41 0.40 2005 0.65 0.85 1.22 0.62 0.84 1.18 0.47 0.67 0.99 2006 0.41 0.34 0.08 0.44 0.34 0.02 0.24 0.27 -0.17
1992-2006:Mean (t-stat)
0.46 (15.73)
0.58 (19.39)
0.49 (4.84)
0.45 (17.33)
0.56 (18.48)
0.48 (4.65)
0.29 (9.69)
0.47 (19.55)
0.35 (4.11)

Table 4: Ordinary least square regressions of the compensation of newly-appointed CEOs who are hired from outside
This table presents the coefficients and standard errors obtained from estimation of the following model of CEO compensation on the sample of newly-appointed CEOs who are hired from outside:
.,,7,6,5,4
1,31,21,10,
tititititi
titititi
MALEChairAgeRET
MTBLeverageSizeCEOPay
CEOPayi,t is measured in three ways: the natural log of total compensation, the natural log of cash compensation (salary plus bonus), and the natural log of equity-based compensation of the newly appointed CEO of firm i in year t who is hired from outside. Sizei,t-1 is the log of market capitalization of firm i in year t-1; Leveragei,t-1 is the leverage ratio of firm i in year t-1; Market leverage is computed as (debts in current liabilities + long-term debt)/( debts in current liabilities + long-term debt + market value of equity). Alternative market leverage is computed as (debts due in 1 year + long-term debt)/( debts due in 1 year + long-term debt + market value of equity). Alternative book leverage is computed as (debts due in 1 year + long-term debt)/( debts due in 1 year + long-term debt + book value of equity). MTBi,t-1 is the market-to-book ratio of firm i in year t-1; RETi,t is the return to the shareholders of firm i in year t; Agei,t is the age of the CEO of firm i as of year t; Chairi,t is one if the CEO is also the Chairman of firm i in year t, and zero otherwise; MALEi,t is one if the CEO of firm i as of year t is male, and zero otherwise. The numbers in parentheses are the standard errors. The standard errors are robust to heteroskedasticity and are clustered by firm.
Log of (total compensation)
Log of (cash compensation)
Log of (equity-based compensation)
Log of (total compensation)
Log of (cash compensation)
Log of (equity-based compensation)
Log of (total compensation)
Log of (cash compensation)
Log of (equity-based compensation)
Market leverage
0.75** (0.30)
0.81*** (0.25)
1.11*** (0.41)
-- -- -- -- -- --
Altenative market
leverage -- -- --
0.64** (0.31)
0.71*** (0.26)
0.97** (0.42)
-- -- --
Alternative book
leverage -- -- -- -- -- --
0.62** (0.30)
0.62*** (0.23)
0.92** (0.41)
Firm size 0.50*** (0.04)
0.34*** (0.03)
0.62*** (0.06)
0.50*** (0.04)
0.34*** (0.03)
0.62*** (0.06)
0.49*** (0.03)
0.33*** (0.03)
0.60*** (0.06)
Market-to-book ratio
-0.07*** (0.02)
-0.04** (0.02)
-0.12*** (0.03)
-0.07*** (0.02)
-0.04** (0.02)
-0.13*** (0.03)
-0.08*** (0.02)
-0.05*** (0.01)
-0.14*** (0.03)
One-year return to
shareholders (%)
0.002** (0.001)
0.0015* (0.0009)
0.004*** (0.001)
0.002** (0.001)
0.0015* (0.0009)
0.004*** (0.001)
0.0021 (0.0012)
0.0015* (0.0009)
0.005*** (0.001)
CEO age -0.01 (0.01)
-0.01 (0.01)
-0.021* (0.011)
-0.01 (0.01)
-0.01 (0.01)
-0.021* (0.011)
-0.01 (0.01)
-0.01 (0.01)
-0.021* (0.011)
CEO is also the
Chairman
0.01 (0.13)
-0.01 (0.10)
0.09 (0.18)
0.02 (0.13)
-0.01 (0.10)
0.10 (0.18)
0.02 (0.13)
0.001 (0.10)
0.10 (0.19)
CEO is male -0.15 (0.63)
-0.09 (0.35)
-0.33 (0.90)
-0.15 (0.64)
-0.10 (0.37)
-0.33 (0.92)
-0.17 (0.64)
-0.13 (0.38)
-0.36 (0.91)
Year effects Yes Yes Yes Yes Yes Yes Yes Yes Yes Industry effects
Yes Yes Yes Yes Yes Yes Yes Yes Yes
Intercept 4.67*** (0.96)
4.79*** (0.59)
3.38** (1.44)
4.78*** (0.97)
4.90*** (0.60)
3.54** (1.45)
4.93*** (0.98)
5.10*** (0.61)
3.77** (1.46)
Number of observations
373 373 373 373 373 373 373 373 373
R-squared 0.49 0.47 0.50 0.49 0.47 0.50 0.49 0.47 0.50 ***, **: indicate significance at the 1% and 5% levels, respectively.

Table 5: Summary statistics of variables used in the analysis of average employee pay
This table summarizes the variables used in the analysis of average employee pay. Average employee pay is computed as labor expenses (data 42) divided by the number of employees (data 29). Market leverage is computed as (debts in current liabilities + long-term debt)/( debts in current liabilities + long-term debt + market value of equity). Alternative market leverage is computed as (debts due in 1 year + long-term debt)/( debts due in 1 year + long-term debt + market value of equity). Alternative book leverage is computed as (debts due in 1 year + long-term debt)/( debts due in 1 year + long-term debt + book value of equity). Market capitalization is the stock price multiplied by the number of shares outstanding as of the fiscal year end. Average sales per employee is the amount of total sales (data 12) divided by the number of employees. Market-to-book ratio is the market capitalization divided by the book value of equity. Physical capital intensity is computed as gross property, plant, and equipment scaled by total assets. Marginal tax rate (MTRB) is the marginal tax rate based on income before the deduction of interest expenses. All continuous variables except leverage are winsorized at the 1st and 99th percentiles. All dollar amounts are adjusted to 1992 dollars using the consumer price index (CPI).
Number of
observations Mean Median
Standard deviation
1% cutoff
99% cutoff
Average Employee Pay (in thousands)
5,269 32.76 32.00 19.76 1.49 95.58
Market leverage 5,269 0.25 0.20 0.23 0 0.91 Alternative market leverage 5,269 0.25 0.17 0.22 0 0.90 Alternative book leverage 5,269 0.33 0.31 0.24 0 0.93 Market capitalization (in millions)
5,269 5,226 590 13,035 2.08 82,827
Average sales per employee (in thousands)
5,269 166.26 111.76 198.41 12.74 1,253
Market-to-book ratio 5,269 2.94 2.06 3.30 0.28 20.54 Physical capital intensity 5,269 0.69 0.67 0.40 0.04 1.76 GIndex 1,326 9.22 9.0 2.61 4 15 Marginal tax rate (MTRB) 2,902 0.31 0.35 0.09 0 0.38

Table 6: Ordinary least square regressions of average employee pay
This table presents the coefficients and standard errors obtained from the OLS regression of the following model of average employee pay:
tititititititi PCIMTBAvgSaleLeverageSizeAEP ,,5,4,3,2,10, ,
where AEPi,t is the log of average employee pay of firm i in fiscal year t, and it is calculated as the log of the total labor expenses (data 42) divided by the number of employees (data 29); Sizei,t is the log of market capitalization of firm i in year t; Leveragei,t is the leverage ratio of firm i in year t. Market leverage is computed as (debts in current liabilities + long-term debt)/( debts in current liabilities + long-term debt + market value of equity). Alternative market leverage is computed as (debts due in 1 year + long-term debt)/( debts due in 1 year + long-term debt + market value of equity). Alternative book leverage is computed as (debts due in 1 year + long-term debt)/( debts due in 1 year + long-term debt + book value of equity). AvgSalei,t is the average sales per employee, i.e., the amount of total sales divided by the number of employees; MTBi,t is the market-to-book ratio of firm i in year t; and PCIi,t is the physical capital intensity of firm i in year t, computed as gross property, plant, and equipment scaled by total assets. Numbers in the parentheses are the standard errors. The standard errors are robust to heteroskedasticity and are clustered by firm. In Panel A, we examine all firms. In Panel B, we study financially safe and distressed firms separately. In Panel C, we add quits rates to the regressions. ***, **, and *: indicates significance at the 1%, 5%, and 10% level, respectively.
Panel A: All firms All firms All firms All firms All firms All firms All firms
Column 1 2 3 4 5 6
Market leverage 0.23*** (0.08)
-- -- 0.28*** (0.09)
-- --
Alternative market leverage
-- 0.29** (0.08)
-- -- 0.28*** (0.10)
--
Alternative book leverage
-- -- 0.22*** (0.07)
-- -- 0.21** (0.09)
Firm size 0.08*** (0.01)
0.08*** (0.01)
0.07*** (0.01)
0.04** (0.02)
0.04** (0.02)
0.030* (0.017)
Average sales per employee (in thousands)
0.001*** (0.0002)
0.001*** (0.0001)
0.001*** (0.0001)
0.001*** (0.0002)
0.001*** (0.0002)
0.001*** (0.0002)
Market-to-book ratio
-0.003 (0.003)
-0.003 (0.004)
-0.008** (0.004)
-0.002 (0.005)
-0.002 (0.005)
-0.008 (0.006)
Physical capital intensity
0.05 (0.06)
0.04 (0.06)
0.04 (0.06)
0.001 (0.09)
-0.002 (0.09)
-0.02 (0.09)
GIndex -- -- -- 0.01
(0.01) 0.01
(0.01) 0.01
(0.01) Year effects Yes Yes Yes Yes Yes Yes Industry effects Yes Yes Yes Yes Yes Yes
Intercept 1.53*** (0.07)
1.53*** (0.06)
1.57*** (0.06)
2.88*** (0.18)
2.89*** (0.18)
2.94*** (0.18)
Number of observations
5,269 5,269 5,269 1,326 1,326 1,326
R-squared 0.52 0.52 0.52 0.77 0.77 0.77 ***, **, *: indicate significance at the 1%, 5%, and 10% levels, respectively.

Panel B: Safe versus distressed firms
Distressed
firms Distressed
firms Distressed
firms Safe firms Safe firms Safe firms
Column 1 2 3 4 5 6
Market leverage 0.01
(0.12) -- --
0.22** (0.10)
-- --
Alternative market leverage
-- 0.15
(0.11) -- --
0.32*** (0.11)
--
Alternative book leverage
-- -- 0.004 (0.10)
-- -- 0.17** (0.07)
Firm size 0.08*** (0.01)
0.08*** (0.01)
0.08*** (0.01)
0.07*** (0.01)
0.07*** (0.01)
0.07*** (0.01)
Average sales per employee (in thousands)
0.002*** (0.0003)
0.002*** (0.0003)
0.002*** (0.0003)
0.001*** (0.0001)
0.001*** (0.0001)
0.001*** (0.0001)
Market-to-book ratio
0.002 (0.005)
0.003 (0.005)
0.002 (0.006)
-0.006* (0.004)
-0.006* (0.004)
-0.009** (0.004)
Physical capital intensity
-0.07 (0.07)
-0.07 (0.07)
-0.07 (0.07)
-0.01 (0.05)
-0.02 (0.05)
-0.02 (0.05)
Year effects Yes Yes Yes Yes Yes Yes Industry effects Yes Yes Yes Yes Yes Yes
Intercept 2.16*** (0.17)
2.09*** (0.16)
2.17*** (0.16)
2.48*** (0.11)
2.49*** (0.11)
2.50*** (0.11)
Number of observations
977 977 977 2,197 2,197 2,197
R-squared 0.56 0.56 0.56 0.55 0.55 0.55
Panel C: Quits rates All firms All firms All firms All firms All firms
Column 1 2 3 4 5
Market leverage -- -- 0.43*** (0.13)
-- --
Alternative market leverage
-- -- -- 0.55*** (0.13)
--
Alternative book leverage
-- -- -- -- 0.44*** (0.11)
Firm size -- -- 0.09*** (0.02)
0.09*** (0.02)
0.08*** (0.02)
Average sales per employee (in thousands)
-- -- 0.001*** (0.0002)
0.001*** (0.0002)
0.001*** (0.0002)
Market-to-book ratio
-- -- 0.002
(0.007) 0.002
(0.007) -0.001 (0.008)
Physical capital intensity
-- -- -0.02 (0.09)
-0.03 (0.09)
-0.04 (0.09)
Quits rate -0.026***
(0.002) 0.002
(0.008) 0.01
(0.01) 0.01
(0.01) 0.01
(0.01) Year effects -- Yes Yes Yes Yes Industry effects -- Yes Yes Yes Yes
Intercept 3.88*** (0.07)
1.73*** (0.23)
1.07*** (0.25)
1.06*** (0.24)
1.17*** (0.24)
Number of observations
1,993 1,993 1,993 1,993 1,993
R-squared 0.16 0.37 0.49 0.49 0.49 ***, **, *: indicate significance at the 1%, 5%, and 10% levels, respectively.

Table 7: Fama-MacBeth analysis of average employee pay
This table reports the coefficient on leverage obtained from the OLS regression of average employee pay for each fiscal year in 1992-2006:
tititititititi PCIMTBAvgSaleLeverageSizeAEP ,,5,4,3,2,10, ,
where AEPi,t is the log of average employee pay of firm i in fiscal year t, and it is calculated as the log of the total labor expenses (data 42) divided by the number of employees (data 29); Sizei,t is the log of market capitalization of firm i in year t; Market leverage is computed as (debts in current liabilities + long-term debt)/( debts in current liabilities + long-term debt + market value of equity). Alternative market leverage is computed as (debts due in 1 year + long-term debt)/( debts due in 1 year + long-term debt + market value of equity). Alternative book leverage is computed as (debts due in 1 year + long-term debt)/( debts due in 1 year + long-term debt + book value of equity). AvgSalei,t is the average sales per employee, i.e., the amount of total sales divided by the number of employees; MTBi,t is the market-to-book ratio of firm i in year t; and PCIi,t is the physical capital intensity of firm i in year t, computed as gross property, plant, and equipment scaled by total assets.
Year
From the regression of log of average employee pay
From the regression of log of average employee pay
From the regression of log of average employee pay
Market leverage
Alternative market
leverage
Alternative book leverage 1992 0.16 0.09 0.07 1993 0.10 0.06 0.04 1994 0.06 0.11 -0.004 1995 0.28 0.26 0.17 1996 0.01 0.02 -0.02 1997 0.12 0.07 0.09 1998 -0.01 -0.04 -0.05 1999 -0.02 0.12 0.10 2000 0.18 0.24 0.24 2001 0.08 0.22 0.26 2002 0.29 0.40 0.35 2003 0.66 0.76 0.52 2004 0.43 0.67 0.49 2005 0.36 0.49 0.32 2006 0.62 0.60 0.39
1992-2006: Mean (t-stat)
0.22 (3.96)
0.27 (4.14)
0.20 (4.12)

Table 8: Instrumental variable regressions of average employee pay
This table presents the coefficients and standard errors obtained from the two-stage instrumental variable regression:
,)/()/( ,,7,6,5,4,3,2,10, tititititititititi TAEBITSTDTAEBITPCIMTBAvgsaleSizeMTRBLeverage
.)/()/( ,,7,6,5,4,3,2,10, tititititititititi TAEBITSTDTAEBITPCIMTBAvgSaleLeverageSizeAEP Leveragei,t in the second stage is instrumented by marginal tax rate based on income before interest expense has been deducted (MTRB). EBIT/TA is earnings before depreciation, interest, and taxes divided by total assets, and STD (EBIT/TA) is the standard deviation of EBIT/TA in the past five years. Market leverage is computed as (debts in current liabilities + long-term debt)/( debts in current liabilities + long-term debt + market value of equity). Alternative market leverage is computed as (debts due in 1 year + long-term debt)/( debts due in 1 year + long-term debt + market value of equity). Alternative book leverage is computed as (debts due in 1 year + long-term debt)/( debts due in 1 year + long-term debt + book value of equity). Numbers in the parentheses are the standard errors. The standard errors are robust to heteroskedasticity and are clustered by firm.
First stage: Leverage is the dependent variable
Variable Market leverage Alternative market
leverage Alternative book
leverage
Marginal tax rate (MTRB) 0.11*** (0.04)
0.14*** (0.04)
0.20*** (0.05)
Firm size -0.019***
(0.002) -0.016***
(0.002) -0.0002 (0.002)
Average sales per employee 0.00002
(0.00002) 0.00002
(0.00002) -0.00001 (0.00003)
Market-to-book ratio -0.005***
(0.001) -0.005***
(0.001) 0.018*** (0.001)
Physical capital intensity 0.101*** (0.015)
0.122*** (0.015)
0.152*** (0.018)
EBIT/TA -0.80***
(0.05) -0.76***
(0.05) -0.96***
(0.06)
STD(EBIT/TA) 0.01
(0.01) 0.01
(0.01) 0.01
(0.02) Year effects Yes Yes Yes Industry effects Yes Yes Yes
Intercept 0.38*** (0.04)
0.29*** (0.04)
0.19*** (0.04)
Number of observations 2,902 2,902 2,902 R-squared 0.34 0.32 0.24 Partial F-test of MTRB: F-statistic (p-value)
12.26 (0.0005)
10.62 (0.0011)
14.98 (0.0001)
Second stage: Average employee pay is the dependent variable
Variable Average employee pay Average employee
pay Average employee
pay
Market leverage (instrumented) 2.77* (1.49)
-- --
Alternative market leverage (instrumented)
-- 2.15** (1.02)
--
Alternative book leverage (instrumented)
-- -- 1.56** (0.70)
Firm size 0.13*** (0.03)
0.11*** (0.02)
0.07*** (0.01)
Average sales per employee 0.001*** (0.0001)
0.001*** (0.0001)
0.001*** (0.0001)
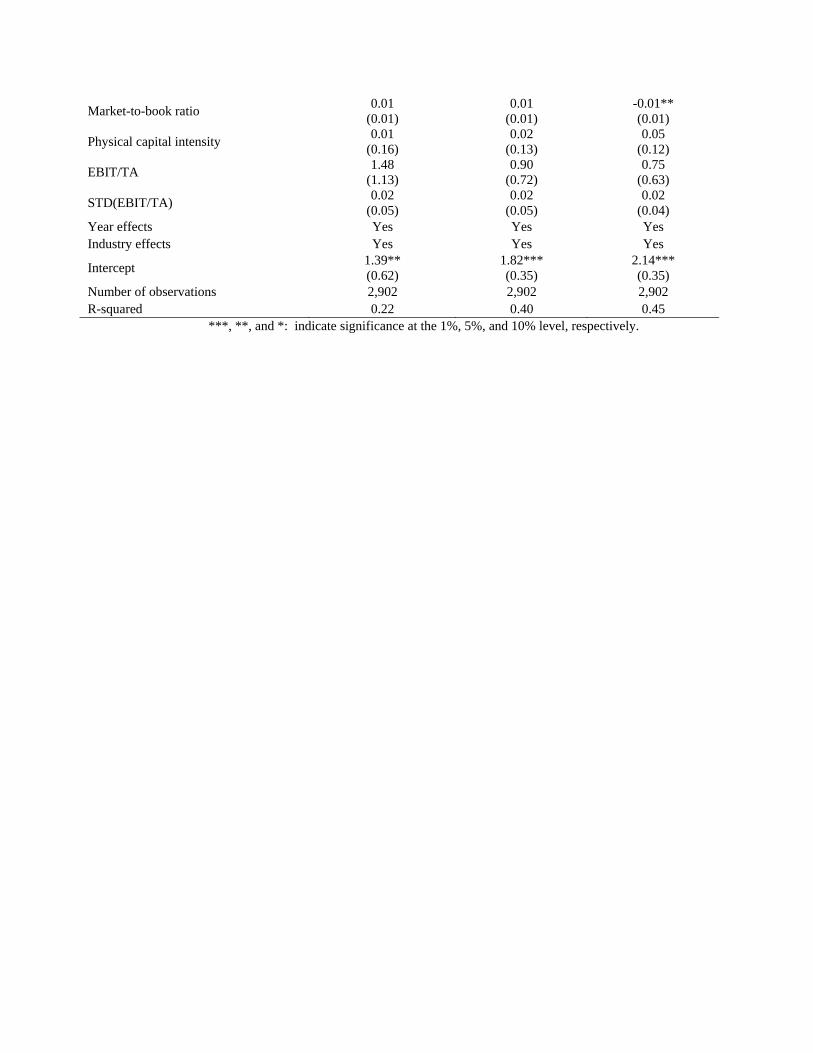
Market-to-book ratio 0.01
(0.01) 0.01
(0.01) -0.01** (0.01)
Physical capital intensity 0.01
(0.16) 0.02
(0.13) 0.05
(0.12)
EBIT/TA 1.48
(1.13) 0.90
(0.72) 0.75
(0.63)
STD(EBIT/TA) 0.02
(0.05) 0.02
(0.05) 0.02
(0.04) Year effects Yes Yes Yes Industry effects Yes Yes Yes
Intercept 1.39** (0.62)
1.82*** (0.35)
2.14*** (0.35)
Number of observations 2,902 2,902 2,902 R-squared 0.22 0.40 0.45
***, **, and *: indicate significance at the 1%, 5%, and 10% level, respectively.

Table 9: Heckman two-step analysis of average employee pay
This table reports the coefficients and standard errors obtained from a Heckman two-step analysis of average employee pay. In the first step, we estimate a probit model of whether a firm reports labor expenses. The dependent variable is one if the data on labor expenses is non-missing, and zero otherwise; the independent variables include the dummies of the firm’s listing exchange, in addition to other firm characteristics. In the second step, we examine the impact of leverage on average employee pay. The inverse mills ratio (Lambda) derived from the selection model is included in the second step as a regressor. Numbers in the parentheses are the standard errors. The standard errors are robust to heteroskedasticity and are clustered by firm. Market leverage is computed as (debts in current liabilities + long-term debt)/( debts in current liabilities + long-term debt + market value of equity). Alternative market leverage is computed as (debt due in 1 year + long-term debt)/( debt due in 1 year + long-term debt + market value of equity). Alternative book leverage is computed as (debts due in 1 year + long-term debt)/( debts due in 1 year + long-term debt + book value of equity).
First stage: Probit model of firms reporting information on labor expenses
Variable Coefficient
(Standard error) Coefficient
(Standard error) Coefficient
(Standard error)
Firm size 0.26*** (0.01)
0.26*** (0.01)
0.26*** (0.01)
Market-to-book ratio -0.03*** (0.003)
-0.03*** (0.003)
-0.03*** (0.003)
Market leverage 0.30*** (0.05)
-- --
Alternative market leverage -- 0.15*** (0.05)
--
Alternative book leverage -- -- 0.12*** (0.04)
Average sales per employee -0.0004***
(0.0001) -0.0004***
(0.0001) -0.0004***
(0.0001)
Physical capital intensity 0.48*** (0.03)
0.49*** (0.03)
0.49*** (0.03)
Exchange dummies Jointly significant Jointly significant Jointly significant Year effects Yes Yes Yes Industry effects Yes Yes Yes
Second stage: Average employee pay is the dependent variable
Variable Coefficient
(Standard error) Coefficient
(Standard error) Coefficient
(Standard error)
Market leverage 0.20*** (0.04)
-- --
Alternative market leverage -- 0.27*** (0.04)
--
Alternative book leverage -- -- 0.20*** (0.04)
Firm size 0.08*** (0.004)
0.08*** (0.004)
0.07*** (0.004)
Average sales per employee 0.001*** (0.0001)
0.001*** (0.0001)
0.001*** (0.0001)
Market-to-book ratio -0.003 (0.003)
-0.002 (0.003)
-0.008** (0.003)
Physical capital intensity 0.047* (0.027)
0.037 (0.027)
0.037 (0.027)
Year effects Yes Yes Yes Industry effects Yes Yes Yes Intercept 1.56*** 1.55*** 1.59***

(0.33) (0.33) (0.33)
Inverse mills ratio (Lambda) -0.044***
(0.012) -0.043***
(0.012) -0.045***
(0.012) Number of observations 49,357 49,357 49,357 Censored observations 44,088 44,088 44,088 Uncensored observations 5,269 5,269 5,269 Wald chi-square (p-value)
5,653.61 (0.0000)
5,688.90 (0.0000)
5,644.72 (0.0000)
***, **: indicates significance at the 1% and 5% level respectively.
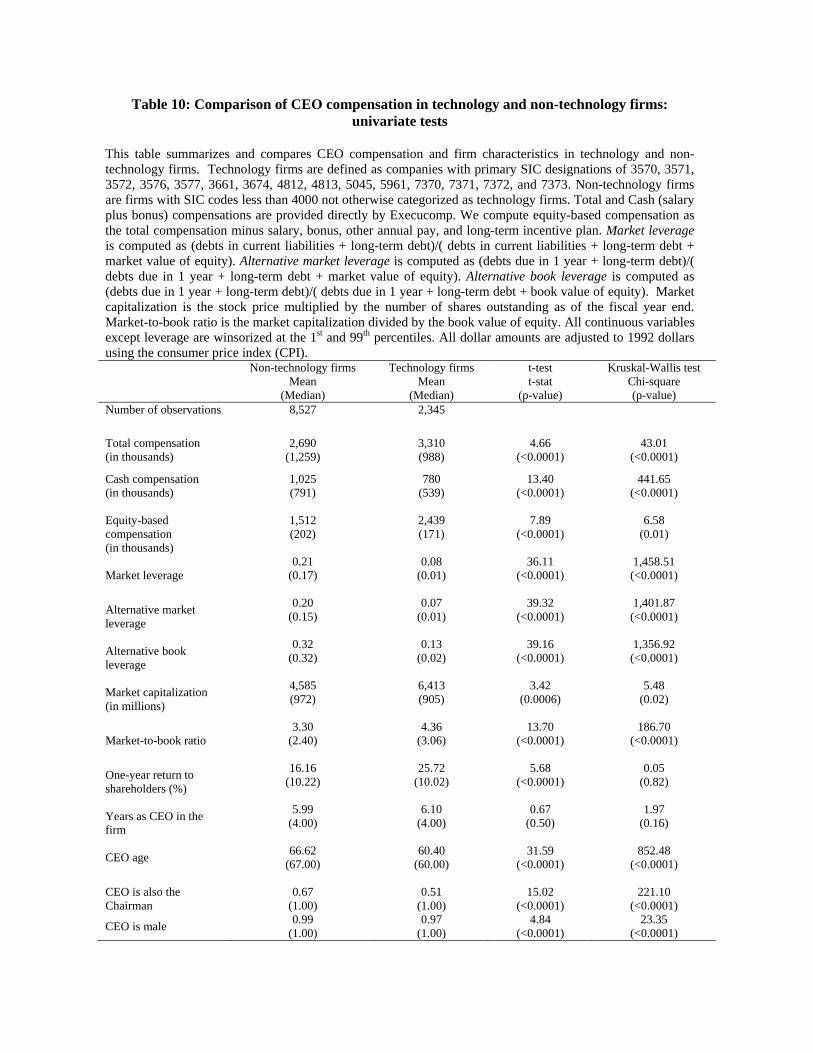
Table 10: Comparison of CEO compensation in technology and non-technology firms: univariate tests
This table summarizes and compares CEO compensation and firm characteristics in technology and non-technology firms. Technology firms are defined as companies with primary SIC designations of 3570, 3571, 3572, 3576, 3577, 3661, 3674, 4812, 4813, 5045, 5961, 7370, 7371, 7372, and 7373. Non-technology firms are firms with SIC codes less than 4000 not otherwise categorized as technology firms. Total and Cash (salary plus bonus) compensations are provided directly by Execucomp. We compute equity-based compensation as the total compensation minus salary, bonus, other annual pay, and long-term incentive plan. Market leverage is computed as (debts in current liabilities + long-term debt)/( debts in current liabilities + long-term debt + market value of equity). Alternative market leverage is computed as (debts due in 1 year + long-term debt)/( debts due in 1 year + long-term debt + market value of equity). Alternative book leverage is computed as (debts due in 1 year + long-term debt)/( debts due in 1 year + long-term debt + book value of equity). Market capitalization is the stock price multiplied by the number of shares outstanding as of the fiscal year end. Market-to-book ratio is the market capitalization divided by the book value of equity. All continuous variables except leverage are winsorized at the 1st and 99th percentiles. All dollar amounts are adjusted to 1992 dollars using the consumer price index (CPI). Non-technology firms
Mean (Median)
Technology firms Mean
(Median)
t-test t-stat
(p-value)
Kruskal-Wallis test Chi-square (p-value)
Number of observations 8,527
2,345
Total compensation (in thousands)
2,690 (1,259)
3,310 (988)
4.66 (<0.0001)
43.01 (<0.0001)
Cash compensation (in thousands)
1,025 (791)
780 (539)
13.40 (<0.0001)
441.65 (<0.0001)
Equity-based compensation (in thousands)
1,512 (202)
2,439 (171)
7.89 (<0.0001)
6.58 (0.01)
Market leverage 0.21
(0.17)
0.08 (0.01)
36.11 (<0.0001)
1,458.51 (<0.0001)
Alternative market leverage
0.20 (0.15)
0.07 (0.01)
39.32 (<0.0001)
1,401.87 (<0.0001)
Alternative book leverage
0.32 (0.32)
0.13 (0.02)
39.16 (<0.0001)
1,356.92 (<0.0001)
Market capitalization (in millions)
4,585 (972)
6,413 (905)
3.42 (0.0006)
5.48 (0.02)
Market-to-book ratio 3.30
(2.40)
4.36 (3.06)
13.70 (<0.0001)
186.70 (<0.0001)
One-year return to shareholders (%)
16.16 (10.22)
25.72 (10.02)
5.68 (<0.0001)
0.05 (0.82)
Years as CEO in the firm
5.99 (4.00)
6.10 (4.00)
0.67 (0.50)
1.97 (0.16)
CEO age
66.62 (67.00)
60.40 (60.00)
31.59 (<0.0001)
852.48 (<0.0001)
CEO is also the Chairman
0.67 (1.00)
0.51 (1.00)
15.02 (<0.0001)
221.10 (<0.0001)
CEO is male 0.99
(1.00) 0.97
(1.00) 4.84
(<0.0001) 23.35
(<0.0001)

Table 11: OLS regressions of CEO compensation in technology and non-technology firms
Panel A and Panel B report the estimated coefficients and standard errors obtained from OLS regressions of CEO compensation in technology and non-technology firms, respectively.
.,,8,7,6,5
,4,3,2,10,
tititititi
tititititi
MALEChairTenureAge
RETMTBLeverageSizeCEOPay
Market leverage is computed as (debts in current liabilities + long-term debt)/( debts in current liabilities + long-term debt + market value of equity). Alternative market leverage is computed as (debts due in 1 year + long-term debt)/( debts due in 1 year + long-term debt + market value of equity). Alternative book leverage is computed as (debts due in 1 year + long-term debt)/( debts due in 1 year + long-term debt + book value of equity). The numbers in the parentheses are the standard errors. The standard errors are robust to heteroskedasticity and are clustered by firm. We use Wald test to examine whether the coefficient on leverage is statistically different in the regressions of the two groups. Panel A: CEO compensation in non-technology firms
Log of (total
compensation) (1)
Log of (cash compensation)
(2)
Log of (equity-based compensation)
(3)
Log of (total compensation)
(4)
Log of (cash compensation)
(5)
Log of (equity-based compensation)
(6)
Log of (total compensation)
(7)
Log of (cash compensation)
(8)
Log of (equity-based compensation)
(9)
Market leverage
0.51*** (0.09)
0.61*** (0.07)
0.51*** (0.23)
-- -- -- -- -- --
Alternative market leverage
-- -- -- 0.51*** (0.09)
0.61*** (0.07)
0.53** (0.23)
-- -- --
Alternative book leverage
-- -- -- -- -- -- 0.30*** (0.08)
0.46*** (0.05)
0.37** (0.19)
Firm size 0.41*** (0.01)
0.31*** (0.01)
0.64*** (0.03)
0.41*** (0.01)
0.31*** (0.01)
0.65*** (0.03)
0.40*** (0.01)
0.30*** (0.01)
0.64*** (0.03)
Market-to-book ratio
0.013** (0.005)
-0.01*** (0.003)
0.04*** (0.01)
0.010** (0.005)
-0.01*** (0.003)
0.04*** (0.01)
0.005 (0.005)
-0.02*** (0.003)
0.028** (0.013)
One-year return to shareholders (%)
0.001*** (0.0002)
0.001*** (0.0001)
0.002*** (0.0006)
0.001*** (0.0002)
0.001*** (0.0001)
0.002*** (0.0006)
0.001*** (0.0002)
0.001*** (0.0001)
0.002*** (0.0006)
Years as CEO in the firm
0.004 (0.003)
0.003 (0.002)
-0.01 (0.01)
0.004 (0.003)
0.003 (0.002)
-0.01 (0.01)
0.003 (0.003)
0.003 (0.002)
-0.01 (0.01)
CEO age 0.005** (0.002)
0.002 (0.002)
0.017*** (0.006)
0.005** (0.002)
0.002 (0.002)
0.017*** (0.006)
0.005** (0.002)
0.002 (0.002)
0.017*** (0.006)
CEO is also the Chairman
0.20*** (0.03)
0.16*** (0.02)
0.26*** (0.08)
0.21*** (0.03)
0.16*** (0.02)
0.26*** (0.08)
0.21*** (0.03)
0.16*** (0.02)
0.26*** (0.08)
CEO is male
0.02 (0.18)
-0.003 (0.14)
-0.06 (0.42)
0.02 (0.18)
-0.004 (0.14)
-0.06 (0.42)
0.03 (0.19)
-0.001 (0.14)
-0.06 (0.42)
Year effects Yes Yes Yes Yes Yes Yes Yes Yes Yes Industry effects
Yes Yes Yes Yes Yes Yes Yes Yes Yes
Intercept 2.97*** (0.27)
3.62*** (0.23)
-1.71** (0.71)
2.97*** (0.27)
3.62*** (0.23)
-1.72** (0.72)
3.07*** (0.27)
3.72*** (0.23)
-1.62** (0.71)
Number of observations
8,527 8,527 8,527 8,527 8,527 8,527 8,527 8,527 8,527
R-squared 0.50 0.56 0.27 0.50 0.56 0.27 0.49 0.56 0.27 ***, and **: indicate significance at the 1% and 5% levels, respectively.
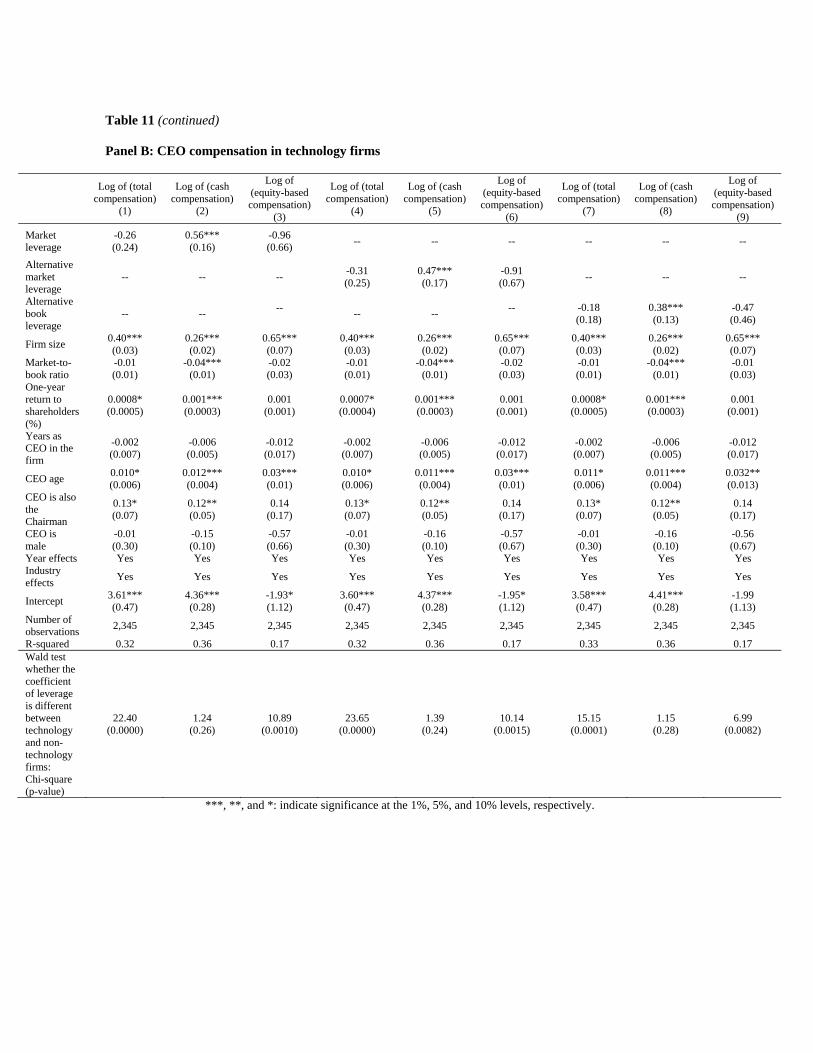
Table 11 (continued) Panel B: CEO compensation in technology firms
Log of (total
compensation) (1)
Log of (cash compensation)
(2)
Log of (equity-based compensation)
(3)
Log of (total compensation)
(4)
Log of (cash compensation)
(5)
Log of (equity-based compensation)
(6)
Log of (total compensation)
(7)
Log of (cash compensation)
(8)
Log of (equity-based compensation)
(9)
Market leverage
-0.26 (0.24)
0.56*** (0.16)
-0.96 (0.66)
-- -- -- -- -- --
Alternative market leverage
-- -- -- -0.31 (0.25)
0.47*** (0.17)
-0.91 (0.67)
-- -- --
Alternative book leverage
-- -- --
-- -- --
-0.18 (0.18)
0.38*** (0.13)
-0.47 (0.46)
Firm size 0.40*** (0.03)
0.26*** (0.02)
0.65*** (0.07)
0.40*** (0.03)
0.26*** (0.02)
0.65*** (0.07)
0.40*** (0.03)
0.26*** (0.02)
0.65*** (0.07)
Market-to-book ratio
-0.01 (0.01)
-0.04*** (0.01)
-0.02 (0.03)
-0.01 (0.01)
-0.04*** (0.01)
-0.02 (0.03)
-0.01 (0.01)
-0.04*** (0.01)
-0.01 (0.03)
One-year return to shareholders (%)
0.0008* (0.0005)
0.001*** (0.0003)
0.001 (0.001)
0.0007* (0.0004)
0.001*** (0.0003)
0.001 (0.001)
0.0008* (0.0005)
0.001*** (0.0003)
0.001 (0.001)
Years as CEO in the firm
-0.002 (0.007)
-0.006 (0.005)
-0.012 (0.017)
-0.002 (0.007)
-0.006 (0.005)
-0.012 (0.017)
-0.002 (0.007)
-0.006 (0.005)
-0.012 (0.017)
CEO age 0.010* (0.006)
0.012*** (0.004)
0.03*** (0.01)
0.010* (0.006)
0.011*** (0.004)
0.03*** (0.01)
0.011* (0.006)
0.011*** (0.004)
0.032** (0.013)
CEO is also the Chairman
0.13* (0.07)
0.12** (0.05)
0.14 (0.17)
0.13* (0.07)
0.12** (0.05)
0.14 (0.17)
0.13* (0.07)
0.12** (0.05)
0.14 (0.17)
CEO is male
-0.01 (0.30)
-0.15 (0.10)
-0.57 (0.66)
-0.01 (0.30)
-0.16 (0.10)
-0.57 (0.67)
-0.01 (0.30)
-0.16 (0.10)
-0.56 (0.67)
Year effects Yes Yes Yes Yes Yes Yes Yes Yes Yes Industry effects
Yes Yes Yes Yes Yes Yes Yes Yes Yes
Intercept 3.61*** (0.47)
4.36*** (0.28)
-1.93* (1.12)
3.60*** (0.47)
4.37*** (0.28)
-1.95* (1.12)
3.58*** (0.47)
4.41*** (0.28)
-1.99 (1.13)
Number of observations
2,345 2,345 2,345 2,345 2,345 2,345 2,345 2,345 2,345
R-squared 0.32 0.36 0.17 0.32 0.36 0.17 0.33 0.36 0.17 Wald test whether the coefficient of leverage is different between technology and non-technology firms: Chi-square (p-value)
22.40 (0.0000)
1.24 (0.26)
10.89 (0.0010)
23.65 (0.0000)
1.39 (0.24)
10.14 (0.0015)
15.15 (0.0001)
1.15 (0.28)
6.99 (0.0082)
***, **, and *: indicate significance at the 1%, 5%, and 10% levels, respectively.

Table 12: Comparison of average employee pay in technology and non-technology firms: univariate tests
This table summarizes and compares average employee pay and financial characteristics in technology and non-technology firms. Technology firms are defined as companies with primary SIC designations of 3570, 3571, 3572, 3576, 3577, 3661, 3674, 4812, 4813, 5045, 5961, 7370, 7371, 7372, and 7373. Non-technology firms are firms with SIC codes less than 4000 not otherwise categorized as technology firms. Average employee pay is computed as labor expenses (data 42) divided by the number of employees (data 29). Market leverage is computed as (debts in current liabilities + long-term debt)/( debts in current liabilities + long-term debt + market value of equity). Alternative market leverage is computed as (debts due in 1 year + long-term debt)/( debts due in 1 year + long-term debt + market value of equity). Alternative book leverage is computed as (debts due in 1 year + long-term debt)/( debts due in 1 year + long-term debt + book value of equity). Market capitalization is the stock price multiplied by the number of shares outstanding as of the fiscal year end. Average sales per employee is the amount of total sales (data 12) divided by the number of employees (data 29). Market-to-book ratio is the market capitalization divided by the book value of equity. Physical capital intensity is computed as gross property, plant, and equipment scaled by total assets. All continuous variables except leverage are winsorized at the 1st and 99th percentiles. All dollar amounts are adjusted to 1992 dollars using the consumer price index (CPI).
Non-technology firms Mean
(Median)
Technology firms Mean
(Median)
t-test t-stat
(p-value)
Kruskal-Wallis test
Chi-square (p-value)
Number of observations
2,101 298
Average employee pay (in thousands)
39.20 (40.01)
36.87 (34.56)
1.55 (0.12)
8.62 (0.003)
Market leverage
0.23 (0.19)
0.11 (0.17)
10.35 (<0.0001)
186.79 (<0.0001)
Alternative market leverage
0.20 (0.16)
0.09 (0.01)
12.96 (<0.0001)
210.78 (<0.0001)
Alternative book leverage
0.33 (0.32)
0.14 (0.03)
14.62 (<0.0001)
231.97 (<0.0001)
Market capitalization (in millions)
10,298 (2,631)
2,303 (187)
15.17 (<0.0001)
202.47 (<0.0001)
Average sales per employee (in thousands)
235.11 (174.55)
152.51 (130.40)
9.72 (<0.0001)
60.53 (<0.0001)
Market-to-book ratio 3.17 (2.24)
3.41 (2.16)
0.99 (0.32)
1.02 (0.31)
Physical capital intensity
0.72 (0.67)
0.34 (0.25)
20.16 (<0.0001)
306.41 (<0.0001)
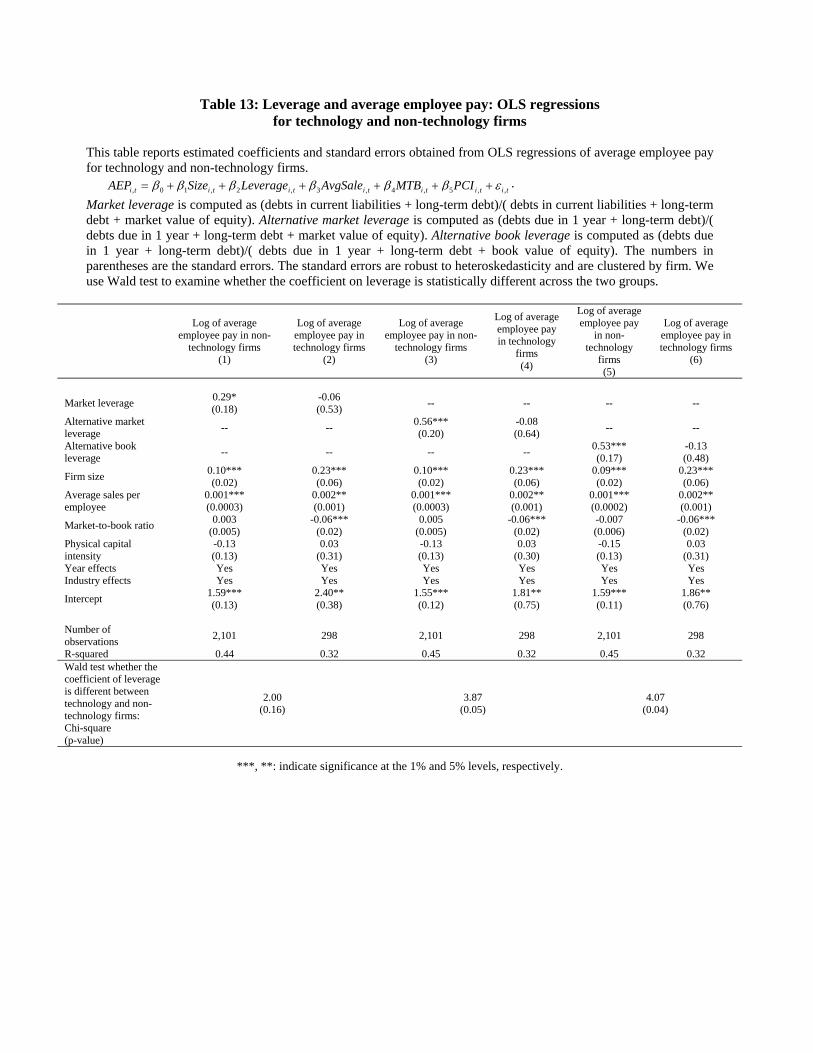
Table 13: Leverage and average employee pay: OLS regressions for technology and non-technology firms
This table reports estimated coefficients and standard errors obtained from OLS regressions of average employee pay for technology and non-technology firms.
tititititititi PCIMTBAvgSaleLeverageSizeAEP ,,5,4,3,2,10, .
Market leverage is computed as (debts in current liabilities + long-term debt)/( debts in current liabilities + long-term debt + market value of equity). Alternative market leverage is computed as (debts due in 1 year + long-term debt)/( debts due in 1 year + long-term debt + market value of equity). Alternative book leverage is computed as (debts due in 1 year + long-term debt)/( debts due in 1 year + long-term debt + book value of equity). The numbers in parentheses are the standard errors. The standard errors are robust to heteroskedasticity and are clustered by firm. We use Wald test to examine whether the coefficient on leverage is statistically different across the two groups.
Log of average
employee pay in non-technology firms
(1)
Log of average employee pay in technology firms
(2)
Log of average employee pay in non-
technology firms (3)
Log of average employee pay in technology
firms (4)
Log of average employee pay
in non-technology
firms (5)
Log of average employee pay in technology firms
(6)
Market leverage 0.29* (0.18)
-0.06 (0.53)
-- -- -- --
Alternative market leverage
-- -- 0.56*** (0.20)
-0.08 (0.64)
-- --
Alternative book leverage
-- -- -- -- 0.53*** (0.17)
-0.13 (0.48)
Firm size 0.10*** (0.02)
0.23*** (0.06)
0.10*** (0.02)
0.23*** (0.06)
0.09*** (0.02)
0.23*** (0.06)
Average sales per employee
0.001*** (0.0003)
0.002** (0.001)
0.001*** (0.0003)
0.002** (0.001)
0.001*** (0.0002)
0.002** (0.001)
Market-to-book ratio 0.003
(0.005) -0.06***
(0.02) 0.005
(0.005) -0.06***
(0.02) -0.007 (0.006)
-0.06*** (0.02)
Physical capital intensity
-0.13 (0.13)
0.03 (0.31)
-0.13 (0.13)
0.03 (0.30)
-0.15 (0.13)
0.03 (0.31)
Year effects Yes Yes Yes Yes Yes Yes Industry effects Yes Yes Yes Yes Yes Yes
Intercept 1.59*** (0.13)
2.40** (0.38)
1.55*** (0.12)
1.81** (0.75)
1.59*** (0.11)
1.86** (0.76)
Number of observations
2,101
298
2,101
298
2,101
298
R-squared 0.44 0.32 0.45 0.32 0.45 0.32 Wald test whether the coefficient of leverage is different between technology and non-technology firms: Chi-square (p-value)
2.00 (0.16)
3.87 (0.05)
4.07 (0.04)
***, **: indicate significance at the 1% and 5% levels, respectively.

Figure 1: Changes in total labor expenses and tax benefit of debt as leverage increases
This graph plots the changes in total labor expenses and tax benefit of debt for a firm with median values of leverage ratio, average employee pay, total labor expenses, and total debt in the sample of Panel A, Table 6. We start with the median value of market leverage, 0.20, and increase it by 0.48 (more than two standard deviations), by increments of 0.04.