Embed Size (px)
Citation preview

HSIL Ltd
ENAM Securities Direct 24th February 2012
ENAM DIRECT EQUITY RESEARCH
CO
MP
AN
Y R
EP
OR
T
For private circulation only
The Leadership Continues… HSIL, promoted by Mr. R.K Somany in 1960, has interests in Building products with 40% market share (Sanitaryware, Faucet, Tiles & Wellness Products) and Container Glass with 22% market share and leadership in Southern region of the country. Investment Rationale
Market leadership across segments: enjoys 40% market share in sanitaryware biz with strong regional presence (North & South India). Container Glass biz. enjoys 74% market share in South India (largest consumer of Spirits/soft drinks), (22% in India catering to high growth user industries (FMCG, Spirit , Pharma).
Capex - The only option to tap incremental demand: Current util. levels – Sanitaryware & Faucet (>100%) and Container glass (>90%). HSIL has lined up a capex of Rs 600 cr over FY12-FY14. In Sanitaryware biz. (capex - Rs 200cr) capacity to expand by 40% to 5 mn. pcs. With a mix of brown field (Haryana & AP) & green field project (Gujarat). Company is set to capture high growth western & northern region. Faucet biz. (capex - Rs 100 cr) to grow over 8x in revenues by FY15 (manufactured faucet revenue - Rs 30 cr in FY11) with 6x capacity expansion (> 2.2x asset turnover) from 0.5 mn. pcs. Capacity of container glass biz. (capex - Rs 300 cr) increased by 42% (Feb 12) at 1,600 tpd expected to boost topline & improve profitability. We expect capex would generate rev. in excess of Rs 800 cr (asset turnover - 1.3x–1.4x) in FY 15 with operating margin between 20%-21% from 18.5% in FY11.
Volume growth in premium products to boost quality earnings: Company is expected to compete with MNC’s with its premium products that contribute 44% value wise with just 22% volume (op. margin - 23%-24%); mid range brand contributes 72% in volume terms and 50% value (op. margin - 18%-19%). Going ahead volume growth in premium segment is expected to boost profitability.
Competitive advantage: With high operational efficiency + Strong distribution strength (14,000 retailers’ 1,550 distributors & 21 depots) HSIL’s products are 15%-20% economical than its competitors especially the international brands like TOTO, Kohler, Duravit etc. Strategically located plants reduce lead distance – an edge over competitors.
Superior return ratio profile: reduced dependence on outsourced goods; financial leverage – particularly in the Faucet and Container glass segment to improve ROCE (~100 bps in FY13 from 18.2% in FY11) and ROE’s (~150 bps in FY13 from 19.6% in FY11) for the company due to high asset turnover nature of these businesses. Also manufacturing facilities (incl. new) are in close proximity to consumption centres and regions from where it sources raw material derives savings on logistics.
Outlook & Valuations: Considering the robust track record & enormous potential to deliver future growth, we believe HSIL is on a high growth trajectory where profitability is expected to grow over 30% CAGR (FY11-13). Looking at the growth prospects and return ratio profile for all businesses we have valued HSIL on 10x FY13E EPS (12x FY12E EPS) to arrive at a target price of Rs 195, implying a potential upside of 34% from CMP of Rs 146. We initiate coverage with a BUY rating.
CMP (Rs) 146 Target price (Rs) 195 Potential upside 34%
Stock data
No. of shares (cr) 6.60 FV (Rs) 2
Market cap (Rs cr) 964
52 Wk Hi/low (Rs) 245.8/116.5
Avg. daily vol.* (Shrs) 1,41,829
BSE Code 500187
NSE Code HSIL
Bloomberg code HSI IN
Reuters Code HSNT.BO * 6 monthly average
Shareholding (%)
Dec-11 QoQ Chg
Promoter 51.57 0.18
FIIs 22.57 0.29
MFs / UTI 2.29 0.08
Banks / FIs 0.03 0.00
Others* 23.54 (0.55)
* Includes 8.8% stake of Handerson (PE) via HPC (Mauritius) Ltd. Price performance
5000
10000
15000
20000
25000
Feb-11 Apr-11 Jun-11 Aug-11 Oct-11 Dec-11 Feb-12
40
80
120
160
200
240
280
BSE_SENSEX HSIL Ltd Source: Cline, ENAM Direct Research
Vinay Bhandari [email protected]
Financial summary (Consolidated)
Y/E Mar Sales (Rs Cr)
Adj. PAT (Rs Cr)
Consensus (EPS - Rs)
EPS (Rs)
Change (YoY %)
P/E (x)
RoE* (%)
RoCE* (%)
EV/EBITDA (x)
DPS (Rs)
2010 804 39 - 7.1 12 20.7 25.0 14.5 9.0 2.0 2011 1,079 73 - 11.1 47 13.2 19.6 18.2 6.6 2.5 2012E 1,349 106 16.2 16.0 37 9.1 20.5 19.0 6.1 3.4
2013E 1,595 128 20.3 19.5 21 7.5 21.1 19.3 5.0 4.1
Source: Company, ENAM Direct Research; Note – ROE & ROCE adjusted for Business Reconstruction Reserve (Ref Appendix)
BUY

24th February 2012 ENAM Securities Direct 2
HSIL Ltd
COMPANY OVERVIEW
HSIL was established by Mr. R.K Somany in 1960, as Hindusthan Twyfords Ltd., a joint
venture with Twyfords Ltd., UK, to explore vitreous china sanitaryware market in India.
Later, company forayed into container glass business with acquisition of Associated Glass
Industries Ltd. in 1981.
Over the past 50 years, management has strategically expanded through organic and
inorganic route, with prime focus on market penetration and brand recognition.
Today HSIL is the leader and enjoys a 40% market share in Sanitaryware business and 2nd
largest in the Container glass business with 22% domestic market share.
HSIL sells goods under major brands such as ‘Hindware Italian Collection’, ‘Hindware
Art’ and ‘Hindware’. In Dec.11, HSIL launched a new luxury Sanitaryware Brand “Queo”
Key Events
Year Events
1960 Est. Hindustan Twyfords Ltd – Launched Chinese Vitreous first time in India
1981 Forayed in Container Glass – Acquired Associated Glass Industries Ltd
1989 Acquired Krishna Ceramics – South India
1999 Acquired Raasi Ceramics – expansion in sanitaryware business
2008 Launched EVOK – Exclusive retail chain for Kitchen & Sanitaryware
2009 Commissioned Glass Furnace Capacity – 425 TPD
2010 Acquired Barwood , UK Acquired Chrome Plated Fitting facility in Rajasthan QIP – Raised Rs 150 cr
2011 Acquired Garden Polymers Private Limited (Pet bottles)
Source: Company

24th February 2012 ENAM Securities Direct 3
HSIL Ltd
HSIL - BUSINESS OVERVIEW
HSIL (Net Rev : Rs 1095 cr)
Building Products(Net Rev : Rs 497 cr)
Accessories
PVC Cisterns, Fittings &
Seat Covers
Faucets
Wellness
Bathtubs, Showers Enclosures, Whirlpools
Kitchen Appliances
Sinks, Chimneys & Hobs,Cook Tops
Tiles
Sanitary Ware
Wash Basin,
Bidets, Water Closet,
Urinals, Sinks.
*Faucets
Manufactured (75%) Outsourced (25%)
Ventilator Fans
Hind
war
eHi
ndw
are
Art
Hind
war
eIta
lian
QUE
O
Container Glass(Net Rev : Rs 549 cr)
Bottles
Soft Drinks, Beer/ Personal care, Pharma..,
FMCG.,
Jar and Chemicals Jar
Manufactured (100%)
*PET Bottles
Pharma.,FMCG.,
Personal care*Acquired Garden Polymers in 2011
*Acquired Faucet biz.of Havells ltd in 2010.
EVOK
Exclusive retail chain for home interior
Kitchen & Sanitaryware
Retail Business & others(Net Rev : Rs 49cr)
Source: Company, ENAM Direct Research HSIL Revenue Mix – FY 11 HSIL’s EBIT Mix – FY 11
48%
52%
Building Product Container Glass
56%
44%
Building Product Container Glass
Source: Company, ENAM Direct Research

24th February 2012 ENAM Securities Direct 4
HSIL Ltd
Revenue Mix – Geography wise
Building Products Division Container Glass Division
16%
15%
31%
38%
East West North South
6%
25%
7%52%
10%
East West North South Exports
Source: Company, ENAM Direct Research HSIL - Growth Path
0
200
400
600
800
1000
FY2006 FY2007 FY2008 FY2009 FY2010 FY2011
Am
ount
(Rs
Crs
)
Revenue EBITDA PAT
Net Revenue grew 22% ; Operating & Net Profits 24% CAGR
Source: Company, ENAM Direct Research
24th February 2012 ENAM Securities Direct 5
HSIL Ltd
BUILDING PRODUCT – INDUSTRY OVERVIEW Sanitaryware Industry
Indian Sanitaryware industry estimated at Rs 2,000 cr, is growing at over 15%, Organized
market which accounts for 60% share is growing by 16% CAGR. The market is ranked 2nd
largest by volume in the Asia Pacific region and accounts for 8% of global production.
Coverage of sanitation in India is just 40%, well below global average. In fact only 25%-
30% of the rural India has access to proper sanitation facilities.
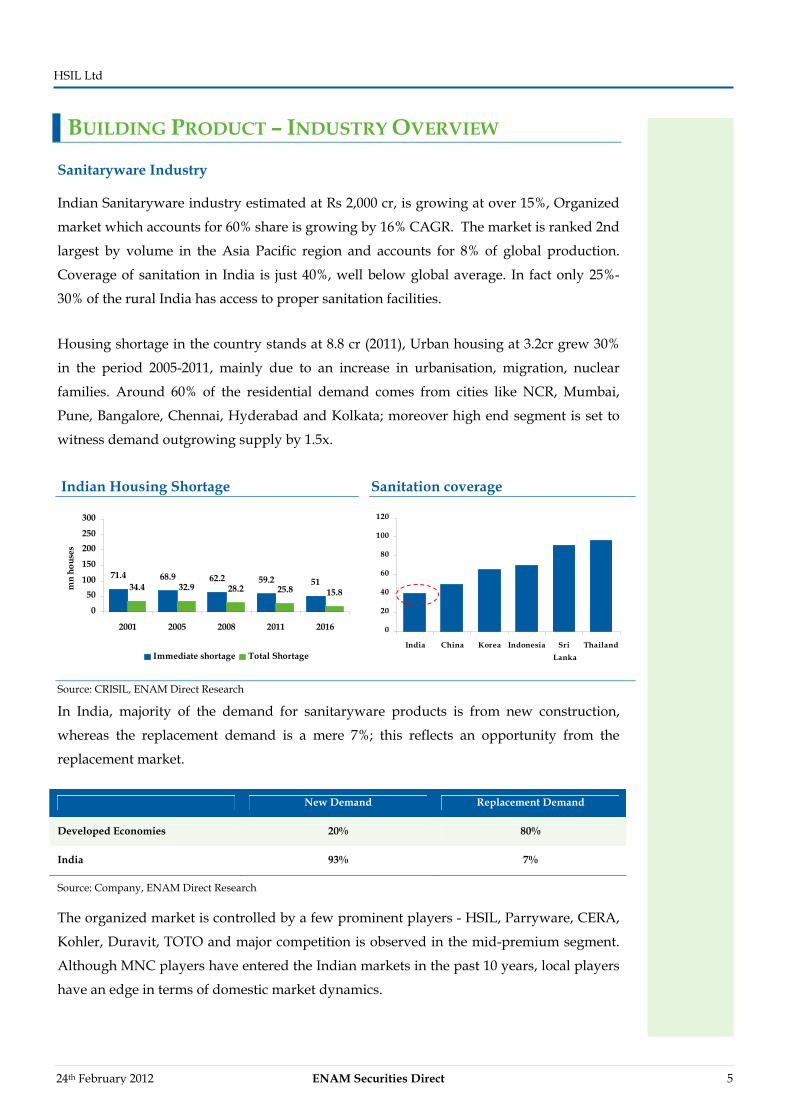
Housing shortage in the country stands at 8.8 cr (2011), Urban housing at 3.2cr grew 30%
in the period 2005-2011, mainly due to an increase in urbanisation, migration, nuclear
families. Around 60% of the residential demand comes from cities like NCR, Mumbai,
Pune, Bangalore, Chennai, Hyderabad and Kolkata; moreover high end segment is set to
witness demand outgrowing supply by 1.5x.
Indian Housing Shortage Sanitation coverage
71.4 68.9 62.2 59.2 5134.4 32.9 28.2 25.8 15.8
0
50100
150
200250
300
2001 2005 2008 2011 2016
mn
hous
es
Immediate shortage Total Shortage
0
20
40
60
80
100
120
India China Korea Indonesia Sri Lanka
Thailand
Source: CRISIL, ENAM Direct Research
In India, majority of the demand for sanitaryware products is from new construction,
whereas the replacement demand is a mere 7%; this reflects an opportunity from the
replacement market.
New Demand Replacement Demand
Developed Economies 20% 80%
India 93% 7%
Source: Company, ENAM Direct Research
The organized market is controlled by a few prominent players - HSIL, Parryware, CERA,
Kohler, Duravit, TOTO and major competition is observed in the mid-premium segment.
Although MNC players have entered the Indian markets in the past 10 years, local players
have an edge in terms of domestic market dynamics.

24th February 2012 ENAM Securities Direct 6
HSIL Ltd
Faucet industry
Indian market for Faucet is estimated at Rs 3,800 cr, with the organized market at 45%,
growing over 14% CAGR in the past 5 years. Market is dominated by few large players
only like Jaguar, Marc, Parry, ESS ESS, HSIL etc., which shows an opportunity for these
players to grab the pie of this market.
Tile Industry
Tiles are segmented into wall tiles (42%), floor tiles(46%), vitrified tiles and porcelain
tiles(12%) ; Entry of Vitrified tiles has steered the industry and now is the fastest growing
in the segment. The key growth drivers for India's consumption are healthy GDP growth,
rising income levels, increasing urbanisation, growing middle-class, a younger population
with exposure to lifestyle trends in developed economies and growth of the consuming
sectors. This shows a potential for growth of ceramic tiles in India.
Kitchen Appliances
Kitchen industry is at a nascent stage in India. The trend of modular kitchens is catching
up in India. There is no large established player with a national footprint and a strong
brand and distribution network in this industry. As a result, there are a number of small
time players / carpenters operating in this industry with limited scale of operations. The
industry is growing at a healthy rate of over 30% per annum. Given the huge opportunity
in this area, many prominent players like Godrej, T.T.K Prestige, Home Town etc. have
entered in this space.

24th February 2012 ENAM Securities Direct 7
HSIL Ltd
HSIL - BUILDING PRODUCT DIVISION Sanitaryware
HSIL is the largest player in the country with a 40% share in the organized sanitaryware
market. We believe the company would benefit from robust demand derived by huge
shortage in the residential housing segment. A strong top-of-the-mind brand recall and
introduction of new products has continuously helped HSIL to sustain its leadership
position and increase revenue. A strong retail network aids timely product deliveries and
an efficient after sales service helps sustain brand leadership.
HSIL manufactures a wide range of ceramic products, at 2 strategically placed facilities: -
Bahadurgurh, Haryana and Bibinagar, Andhra Pradesh through which it caters to strong
demand areas:
North – Delhi, Gurgaon, Punjab, Rajasthan, Uttar Pradesh
West – Gujarat Madhya Pradesh, Maharashtra
South – Karnataka and Andhra Pradesh
Faucet
HSIL is one of the leading suppliers of faucet in the country; company acquired faucet
division of Havells Ltd. in the year 2010, and currently manufactures 0.5 mn. pcs at
Bhiwadi, Rajasthan. The rationale of this is to strengthen the product portfolio to cater to
the mid-premium category of customers. `Hindware’, & `Benelave’ (earlier Crabtree -
Havells), & new brand Queo are the brands under which faucets are sold.
Expansion Plans
To meet the robust demand in the building product segment, the company is undertaking
brown field and green-field expansions in the sanitary and faucets businesses. HSIL is
increasing sanitary capacity to 5.0mn pcs from its current 3.5mn pcs (already increased 0.7
mn. pcs in October 2011) and faucets capacity by 6x to 3mn pcs. Company has earmarked
Rs 300 cr for these expansions.

24th February 2012 ENAM Securities Direct 8
HSIL Ltd
Allied Products - Tiles, Kitchen Appliances, Wellness products & others
HSIL entered the tile business in July 2010 through outsourcing. Nearly 45% of the tiles
business is held by the organized segment. Hindware focuses on the mid and high-end
segments under Hindware Italian brand; tiles comprising of elegant, fine quality glaze
vitrified, double charge varieties and full body vitrified tiles made using chroma
technology.
HSIL ventured into kitchen appliance and wellness market to tap the huge potential in
the domestic markets which is growing over 30% CAGR. Company is into high end
product range - Microwave, Chimney, Built in Ovens, etc. In wellness products company
caters to the niche market by offering steam room, bathtub, shower enclosure and panels
under Hindware Italian brand, which is largely outsourced.
In FY11 the building product division has grown over 33% YoY, with net revenues at
~ Rs 497 cr & EBIT margins of ~22%.
Building Product Division – Past Performance
21% 19% 16% 17% 22%20%
0
100
200
300
400
500
600
FY2006 FY2007 FY2008 FY2009 FY2010 FY2011
Financial Year
Am
ount
(Rs
Crs
)
0%
20%
40%
60%
80%
100%
120%
Revenue EBIT Margin (%) Capacity Utilization (%)
Source: Company, ENAM Direct Research Building Products
Source: Company, ENAM Direct Research

24th February 2012 ENAM Securities Direct 9
HSIL Ltd
CONTAINER GLASS DIVISION - OVERVIEW
Container Glass Industry - A consumption Story
The Indian Glass industry has transformed from a mere cottage industry in 1980’s to one
of the largest globally, with Container glass industry forming a large chunk at Rs 3,800 cr
growing over 11% p.a. Glass packaging and containers for the food industry are major
demand drivers of container glass. The liquor and pharmaceutical industries are other
major users of container glass. Liquor, Pharma and F&B industries are expected to grow at
CAGR of 10%, 14% and 17% respectively over FY11-FY13E. We believe strong growth in
the user industries will lead to further demand in the container glass segment.
Glass industry
Glass Industry Usage
Container Glass packaging for food, drinks, perfumes, pharma.
Specialty Optics, electronics, lighting, engineering etc
Flat Architectural and automotive applications
Fibre Reinforcement material in polymers.
Glass industry forms 12% of the total packaging industry which is driven by FMCG foods
& beverages, spirits, pharmaceuticals, with each of the user industry growing over GDP
growth. Indian glass container market is estimated at Rs 3,800 cr growing at 10%-12% p.a.
Packaging Industry – Value
12%
18%
22%
17%
8%
14%
6%
3%
Glass Labels Caps & Closure Rigid Plastics
Flexible Packaging Printed Cartons Metal Cans Others
Source: Company, CRISIL

24th February 2012 ENAM Securities Direct 10
HSIL Ltd
Container Glass industry is a capital intensive business with high entry barrier. The
market is controlled by players like HSIL, Hindusthan National Glass and Piramal Glass
and a few small players.
User Industry - Volume Mix (%) User Industry - Value Mix (%)
28%
32%10%
15%
16% 0.2%
Liquor Beer Pharma Food Soft Drink Others
26%
29%11%
15%
19% 0.2%
Liquor Beer Pharma Food Soft Drink Others
Source: Company, CRISIL

24th February 2012 ENAM Securities Direct 11
HSIL Ltd
HSIL – GLASS DIVISION
HSIL is the 2nd largest container glass manufacturer in India with 22% market share, and
largest in South India with 74% market share. The division mainly manufactures bottles
used in pharma, food & beverages, and personal care segments, spirits, in the 2 Plants in
Andhra Pradesh with a combined annual capacity of 1,600 tpd (added 475 tpd in Feb 2012
which is under trial run production and expected to get commercial from 2nd week of
April 12). 52% of the revenues are generated from South India being the largest consumer
of spirits and 25% from West India; amongst the user industries spirits contribute 60% of
revenues whereas Food, Beverages and Pharma contribute 40%.
Glass Division – FY 2012
Plant Capacity (TPD)
Capacity (Pcs - cr)
Sanathnagar, AP 650 106.8
Bhongir,AP 950 156.0
Total 1,600 262.8
Region Share User Industry Share
South 52% Spirits 60%
West 25% Beverages 21%
North 7% Pharma 11%
East 6% Food 8%
Exports 10% Total 100% Source: Company, CRISIL
In FY11, container glass division has grown over 24% YoY, with net revenues at ~ Rs 549 cr
& EBIT margins of over 15%.
Container Glass Division – Past Performance
8% 9% 7% 11% 11% 15%
0
100
200
300
400
500
600
FY2006 FY2007 FY2008 FY2009 FY2010 FY2011
0%
20%
40%
60%
80%
100%
Revenue EBIT Margin (%) Capacity Utilization (%)
Source: Company, ENAM Direct Research

24th February 2012 ENAM Securities Direct 12
HSIL Ltd
Expansion Plans
To meet the robust demand in the container glass business, the company has undertaken a
brown field expansion plan at the Bhongir facility. Company has already increased 42% of
its capacity (added 475 tpd in Feb 2012 which is under trial run production and expected
to get commercial from 2nd week of April 12) to 1,600 tpd and has an early mover
advantage in the Southern region of the country. Company has deployed Rs 300 cr for
these expansions.
Container Glass
Source: Company, ENAM Direct Research

24th February 2012 ENAM Securities Direct 13
HSIL Ltd
INVESTMENT RATIONALE Market leadership across segments: An early mover advantage
Sanitaryware
HSIL is the largest player with a 40% market share in the sanitaryware industry, clearly
enjoying benefits of first mover advantage (presence of 50 years). Market leadership has
strengthened consistently in the past 10 years, from 32% in 2002, to 40% FY11; this is
despite of severe competition in the organized and unorganized (Chinese players) market,
and entry of foreign players. HSIL generates ~70% of sales from North & South region
where it already has a strong presence, however East & West regions contribute to ~30%;
this provides significant geographical risk diversification. Management has preferred
inorganic route for expansion not only in India (Krishna ceramic, Raasi ceramic) but also
overseas acquisition (Barwood UK) to cater to the huge replacement market abroad.
Indian Sanitaryware Industry – Presence of Prominent Players
HSIL
Cera
RocaTotoKohlerDuravit
Bahadurgarh
Bibinagar
Greenfield Expansion Vadodara
JhagadiaKadi
Anand
Ranipet, Vellore
Perundurai
Alwar
HSIL
Cera
RocaTotoKohlerDuravit
Bahadurgarh
Bibinagar
Greenfield Expansion Vadodara
JhagadiaKadi
Anand
Ranipet, Vellore
Perundurai
Alwar
Source: Company, ENAM Direct Research

24th February 2012 ENAM Securities Direct 14
HSIL Ltd
Container Glass
HSIL enjoys 74% of the South Indian market with an installed capacity of 1,600 tpd (added
475 tpd in Feb 2012 which is under trial run production and expected to get commercial
from 2nd week of April 12) in Sanathnagar and Bhongir, Andhra Pradesh. These facilities
are strategically located near user industries which make the products price competitive
primarily due to a significant saving in freight cost. Andhra Pradesh is the largest
consumer of beer; soft drinks, liquor, and majority of the liquor manufacturers are located
in South, and thus the fits aptly in the chain (manufacturer to consumer). The company
generates 52% revenues from South India and 60% from beer/liquor. HSIL has grown
its institutional clients to 530 in various user industries through - value addition to products, technology up gradation and strong focus on designing. Strong product mix
(600+), addition of premium products has resulted into significant increase in volume
growth (FY11 15%). The company is favourably positioned to pass on the raw material
prices to customers at a short notice, due to the size of operation and price
competitiveness.
Timely capex to tap incremental demand
HSIL is incurring a capex of Rs 600 cr over the next 3 years; we estimate that the company
has the ability to generate over Rs 800 cr revenues (asset turnover 1.3x-1.4x) with capex in
Sanitaryware, Faucet and Container Glass businesses.
Sanitaryware
HSIL generated revenues at 18% CAGR over the past 5 years, with above 100% utilization
levels. In order to capture the robust incremental demand coming from the real estate
industry company is undergoing a capex of Rs 200 cr in Sanitaryware and Rs 100 cr in the
Faucet division.
Sanitaryware division capacity will expand by 40% by FY14 taking the total capacity to 5
mn. pcs from current of 3.5 mn. pcs. Through sizable capex the company would be able to
capture the high growth areas in the western region as well as strengthen the leadership
further in North & South regions which currently contribute 70% to the revenues.
Moreover going forward the company is poised to capture demand coming from TIER 2, 3
Business Division Capex (Rs Cr)
Asset turnover (x)
Potential Revenue (Rs Cr)
Sanitaryware 200 1.1 240
Faucet 100 2.2 220
Container Glass 300 1.1 360
Total 600 1.3 800

24th February 2012 ENAM Securities Direct 15
HSIL Ltd
and semi urban regions where housing growth has been at levels higher than the metros.
Currently, the western region contributes 15% to the revenues, Gujarat being the state with
highest GDP growth is a lucrative market for large players. HSIL’s market share in Gujarat
is expected to increase with the Green field project at Jhagadia. The land is spread over 55
acres and is strategically placed with benefits of proximity to NH48 and Hazira Port (100
km).
HSIL acquired the faucet business of Havells in 2010 for Rs 17 cr with a capacity of 0.3 mn.
pcs at Bhiwadi. This has marked a significant change in the business model - from
outsourcing to manufacturing. Company is undergoing a capex of Rs 100 cr which would
expect to increase its revenue by 8 x (Rs 30 cr in FY11 thru manufacturing) and capacity by
6x to 3 mn. pcs from current 0.5 mn. pcs, post which management targets to become the
2nd largest producer in the country. Faucet is an ROE accretive business venture with an
asset turnover of over 2.2x & operating margins between 15-16%. Expansion in the faucet
business would augment top-line and enhance margins as share of outsourced products is
expected to come down. We expect this segment to generate revenues to the tune of Rs 240
cr with 15% operating margins in FY13.
Plant/Capacity (Sanitary+Faucet) (Mn. Pcs)
Capex (Rs Cr)
FY11 FY12 FY13 FY14
Sanitaryware – Total Capacity 200 2.8 3.5 3.8 5
Bahadurgarh , Haryana 1.5 - 0.3(SEPT 12) -
Bibinagar , AP 1.3 0.7(OCT11) -
Jhagadia ,Gujarat 1.2 (SEP13)
Faucet – Total Capacity 100 0.3 0.5 2 3
-Bhiwadi,Rajasthan 0.3 0.2(AUG11) 1.5(DEC12) 1(JUN13)
Source: Company, ENAM Direct Research

24th February 2012 ENAM Securities Direct 16
HSIL Ltd
Container Glass
HSIL has a capacity of 1,600 tpd (added 475 tpd in Feb 2012 which is under trial run
production and expected to get commercial from 2nd week of April 12), a YoY increase of
42%. The rationale behind incurring the capex is to cater to the high growth user industries
where demand for container glass has outpaced supply. Current capacity is tapped at 90%
in both plants. Company is having first mover advantage as HNG has also announced a
capex but its capacity would be coming at a later stage than HSIL’s, hence would be
advantageous in tracing the industry demand.
Source: Company, ENAM Direct Research
Return Ratio profile to improve over 100 bps
We believe the new capex and ventures would improve the operating profitability and return ratio profile for the company underpinned by:
1) Reduced dependence on outsourced goods: In FY 2011, from the total revenues of
Rs 517 cr from the building product division, HSIL has derived ~Rs 130 cr from
outsourcing of which Faucet division itself contributes Rs 50 cr (> 38% to the
overall outsourcing revenues). We expect this would decline post capex.
2) Power and Fuel cost: The company expects to secure gas supply in Sanathnagar
(Andhra Pradesh) from May-June 12’ which will reduce power and fuel cost;
management has indicated savings of ~Rs 4-5 cr annually thereafter.
3) Financial leverage: particularly in the Faucet and Container glass segment to
improve ROE’s for the company due to high asset turnover nature of these
businesses.
Overall we believe that all these initiatives taken by the management could improve the
overall ROCE and ROE for the business by over 100bps in FY 2014.
Plant/Capacity (Container Glass) (TPD) Capex (Rs Cr)
FY11 FY12
Container Glass – Total Capacity 300 1,125 1,600
- Sanathnagar, AP 650 650
- Bhongir, AP 475 950

24th February 2012 ENAM Securities Direct 17
HSIL Ltd
Introduction of premium products = Change in product mix = Increased quality earnings & profitability
One of the key strategies of HSIL is to change product mix in line with the global trends to serve the customers with world-class designs and quality.
HSIL, has moved up in the value chain over the past decade with introduction of premium products under the brands Hindware Art, Hindware Italian, Benelave(Faucet). This has resulted into significant increase in average realizations. Premium products contribute 49% value wise with just 25% volume (op. margin - 23%-24%); whereas share of Hindware, which caters to the mid segment, is 72% in volume terms and 50% value terms (op. margin - 18%-19%) and Raasi 3% volume, 1% value.
Product Categories
Category Price Range (Rs) HSIL Brand Competitor Brand
Luxury 15,000-1,00,000 Queo Kohler, Duravit, Villeroy & Boch, Roca
Premium* 5,000-20,000 Hindware Italian Collection,
Hindware Art Amercian Standard, Toto, Parry, Kohler, Roca
Standard 375-5,300 Hindware Parry, Cera
Basic 250-2,000 Hindware Parry, Cera, Neycer
Low End 200-550 Rassi Johnson Pedder, Classica, Neycer
Source: Company, ENAM Direct Research; * Hindware Italian collection also deals in products over Rs 2,00,000.
Sanitaryware (ex. Faucet) – Product wise volume and value mix
72%
25%
3%
50% 49%
1%0
1020304050607080
Hindware (Mid Range)
Hindware Art & Italian (Premium range)
Rassi (Low Range)
Volume Value
18-19% 23%-24% 12%-13%
Operating margin
72%
25%
3%
50% 49%
1%0
1020304050607080
Hindware (Mid Range)
Hindware Art & Italian (Premium range)
Rassi (Low Range)
Volume Value
18-19% 23%-24% 12%-13%
Operating margin
Source: Company, ENAM Direct Research
HSIL, acquired Barwood, a UK based ceramic co, to introduce premium products like wellness, faucet, water closet etc into India primarily to position these products against international players, where growth reported is ~20%+. HSIL’S strong distribution network in not only TIER 1, 2 but semi urban TIER2,3 cities is a major advantage over new competitors resulting into larger volumes.

24th February 2012 ENAM Securities Direct 18
HSIL Ltd
Retail (B2C) to push growth & margins
HSIL, in 2008, ventured into the home interiors market, with the launch of EVOK, a one stop shop for kitchen and home interiors with a range of more than 12,500 interior products under one roof.
HSIL is set to capture the Rs 3,600 cr organized market (6% of Rs 60,000 cr market) with the brand EVOK, co. expects to benefit immensely with the strategy of locating stores in the heart-of-the-city as sales in this space are convenience driven, moreover EVOK also enjoys an early mover advantage in this segment.
EVOK operates 15 stores in metros, TIER I & II cities with revenues of Rs 35 cr in FY11 & an EBITDA loss of Rs 8 cr. Company expected to generate revenues to the extent of Rs 80 cr in FY12. Also, of the total 15 stores – 10 are already at EBITDA break even levels. Management expects to attain break even across stores once it crosses 25 stores which is expected to be operational by FY 2014.
HSIL’s product display centers
Format No. Location Details Future Plans
Evok 15 Gurgaon Faridabad, Delhi, Ghaziabad,
One stop Shop for Home Interiors, high end bath and
kitchen products.
Pan India, with 4/5 stores per year
Lacasa 2 Kochi , Mumbai Exclusive co. owned showroom 3 stores per year
Source: Company
EVOK are company owned stores built on lease land model with an approx. size of 10,000-
12,000 sq.ft. HSIL plans to open 4-5 mega stores every year with a target of 50 stores.
Investment per store is capped at Rs 1 cr/store with an inventory of ~Rs 30 lakh.
Apart from EVOK all other stores like Hindware Arcades, Boutiques, Shop-in Shop are
dealer/distributors owned where company does not have any investments.
Competitive advantage
PAN - INDIA distribution network is an evident edge over peers; company can leverage
over its network (50 year old) to sell new products in the market without much of an effort
compared to new players. Moreover HSIL’s manufacturing facilities in proximity to
consumption centres and raw material sourcing regions is another benefit - one of the
sanitary plants is located in Bahadurgarh, Haryana and it procures raw material from
mines in Rajasthan and Gujarat. On an overall comparative basis, across categories,
products of HSIL tend to be 15%-20% economical than its competitors especially the
international brands like TOTO, Kohler, Duravit etc.

24th February 2012 ENAM Securities Direct 19
HSIL Ltd
RISKS
Decline in Real Estate demand
Risk: Demand for sanitaryware is driven by the real estate industry, requirement of residential apartments, malls, generates huge volumes, any slowdown or sluggishness in the real estate market can hamper growth going forward.
Competition in Premium Products
Risk: In Sanitaryware division, premium products under Hindware Art & Italian, contribute 49% to topline, with a volume of 25%, recently global majors Kohler, Duravit, Roca, have set up facilities in Gujarat with large capacities. In mid-segment also these players are trying to increase their market share. Therefore, going forward we believe that narrowing price differential and increasing competition in mid-segment may create an impact on HSIL, pulling the customers towards major brands.
Chinese Products – on shelves of small retailers
Risk: We visited small retailers in various locations and found that portfolio of products comprised of both organized and unorganized (mainly - Chinese sanitaryware), reason being unorganized players give higher margins to distributors and products are also cheaper. This is a major threat to HSIL as the segment is price sensitive.
Power & Fuel cost could pull down margins
Risk: Power & Fuel Cost comprises of 23-25% of raw material costs, container glass plants are based on dual firing technology which can run on both natural gas and LSHS/FO. Currently due to non availability of gas HSIL uses more of high cost fuel, which has been inflating with high crude prices, overall cost of power from grid has also seen some increase. A significant increase in Power and Fuel can pull down the operating margins going forward.
Rise in Soda Ash prices
Risk: Soda Ash is a major constituent (30%-33%) of raw material for container glass; recently chemical companies have been raising the prices due to increasing energy costs.
Foray into Retail
Risk: HSIL plans to invest Rs 20 - 25 cr in large format store chain - EVOK over the next 3-4 years. As these stores are capital intensive and entail higher operating cost, we believe if the company incurs a large amount of capex in the retail venture then it might block the capital which could put stress on Balance sheet.

24th February 2012 ENAM Securities Direct 20
HSIL Ltd
VALUATIONS & OUTLOOK
HSIL’s revenue has grown 22% CAGR over FY07-11, backed by huge future demand and
potential, we have estimated similar growth over FY11-13 resulting in revenues of Rs 1,595
in FY13E. We have also considered an improvement in EBITDA margin by over 150 bps
during the same period which would result in EBITDA of Rs 325 cr in FY13E. We expect
adjusted net profit to be at Rs 128 cr in FY13E vs Rs 73 cr in FY11.
Considering the robust track record and enormous potential to deliver future growth, we
believe HSIL is on a high growth trajectory where profitability is expected to grow over
30% CAGR (FY11-13). Looking at the future growth prospects and return ratio profile for
both businesses we have valued HSIL on 10x FY13E EPS (12x FY12E EPS) to arrive at a
target price of Rs 195, which is its average forward PE band, implying a potential upside of
34% from CMP of Rs 146. We initiate coverage with a BUY rating.
HSIL - PE (x) band
0
5
10
15
20
25
Apr
-07
Aug
-07
Nov
-07
Mar
-08
Jul-0
8
Nov
-08
Mar
-09
Jul-0
9
Oct
-09
Feb-
10
Jun-
10
Oct
-10
Feb-
11
Jun-
11
Oct
-11
Feb-
12
PE (x
)
PE Mean +1 STD Dev. -1 STD Dev.
Source: ENAM Direct Research

24th February 2012 ENAM Securities Direct 21
HSIL Ltd
PEER GROUP VALUATION Valuation
Building Products Glass Division
Company HSIL Ltd
Cera Sanitaryware
Somany Ceramics
Kajaria Ceramics
Hind. Nat. Glass
Piramal Glass Ltd
Price INR 146 210 36 140 190 109
M-cap (Rs Cr) 964 265 130 1031 1660 881
FY11/CY10 1079 243 711 952 1543 1226
FY12e/CY11e 1349 292 - 1243 1723 1316 Sales (Rs Cr)
FY13e/CY12e 1595 344 - 1475 2403 1473
FY11/CY10 202 49 66 149 268 285
FY12e/CY11e 262 52 - 191 470 295 EBITDA (Rs Cr)
FY13e/CY12e 325 60 - 235 655 338
FY11/CY10 19 20 9 16 17 23
FY12e/CY11e 19 18 - 15 27 22 EBITDA Margin (%)
FY13e/CY12e 20 17 - 16 27 23
FY11/CY10 73 27 23 61 86 93
FY12e/CY11e 106 30 - 79 212 97 PAT (Rs Cr)
FY13e/CY12e 128 35 - 108 299 130
FY11/CY10 11.0 21.0 6.8 8.2 9.9 11.6
FY12e/CY11e 16.0 24.0 - 10.8 29.2 12 EPS (Rs)
FY13e/CY12e 19.5 27.8 - 14.7 41.1 16
FY11/CY10 101.8 88.2 29.7 30.2 133.5 36
FY12e/CY11e 114.5 109.9 - 38.7 168.4 43 BV/Sh (Rs)
FY13e/CY12e 129.8 134.8 - 51.0 199.1 55.0
FY11/CY10 13.2 10.0 5.6 17.0 18.3 9.4
FY12e/CY11e 9.1 8.7 - 13.0 6.5 9.1 P/E (x)
FY13e/CY12e 7.5 7.5 - 9.6 4.8 6.7
FY11/CY10 1.4 2.4 1.3 4.6 1.4 3.0
FY12e/CY11e 1.3 1.9 - 3.6 1.2 2.6 P/BV (x)
FY13e/CY12e 1.1 1.6 - 2.7 1.0 2.0
FY11/CY10 6.6 4.1 5.1 5.6 9.6 6.1
FY12e/CY11e 6.1 - 4.5 6.8 6.4 5.7 EV/EBITDA (x)
FY13e/CY12e 5.0 - 3.8 5.5 3.6 4.7
FY11/CY10 19.6 26.5 25.6 - 5.3 34.3
FY12e/CY11e 20.5 - 20.3 31.5 6.3 28.9 RoE (%)
FY13e/CY12e 21.1 - 23.3 34.3 10.0 31.6
ROCE (%) FY11/CY10 18.2 22.3 15.6 - 5.7 12.6 Net Debt/Equity FY11/CY10 0.6 0.0 2.1 1.3 0.6 2.6
Source: Bloomberg, ENAM Direct Research

24th February 2012 ENAM Securities Direct 22
HSIL Ltd
FINANCIALS (CONSOLIDATED) Profit & Loss Statement (Rs Cr)
Y/E Mar 2010 2011 2012E 2013E Net sales 804 1,079 1,349 1,595 Other operating income 8 13 18 20 Total income 812 1,092 1,367 1,615 Material Cost 238 329 408 482 Employee Cost 81 123 148 167 Other Manufacturing Cost 243 301 374 435 Contribution (%) 31 31 32 33 Advt/Sales/Distrn O/H 110 137 174 206 Operating Profit 141 202 262 325 Other income 2 2 5 6 PBIDT 143 205 267 331 Depreciation 50 55 64 76 Interest 40 36 46 71 Pre-tax profit 52 113 157 183 Tax provision 13 40 52 55 Adjusted PAT 39 73 106 128 E/o income / (Expense) 5 4 0 0 Reported PAT 44 77 106 128
Balance sheet (Rs Cr)
Source: Company, ENAM Direct Research
Y/E Mar 2010 2011 2012E 2013E
Total assets 1,014 1,151 1,530 1,661
Gross block 1,036 1,098 1,448 1,598
Net fixed assets 768 812 1,098 1,172
CWIP 8 56 25 25
Investments 12 36 46 51
Working cap. (excl cash) 202 219 303 361
Cash / Bank balance 25 28 58 52
Capital employed 1,014 1,151 1,530 1,661
Equity capital 11 13 13 13
Reserves 456 659 742 844
Borrowings 493 406 700 725
Others 54 73 74 79

24th February 2012 ENAM Securities Direct 23
HSIL Ltd
Key ratios (%)
Y/E Mar 2010 2011 2012E 2013E
Sales growth 31 34 25 18
OPM 17 19 19 20
Operating profit growth 59 44 29 24
COGS / Net sales 69 69 68 67
Overheads/Net sales 13 13 13 13
Depreciation / G. block 6 5 5 5
Net sales / Gr block (x) 1.0 1.0 1.1 1.0
RoCE* 14.5 18.2 19.0 19.3
Debt / equity (x) 1.1 0.6 0.9 0.8
Effective tax rate 25 35 33 30
RoE* 25.0 19.6 20.5 21.1
Payout ratio (Div/NP) 25 21 21 21
EPS (Rs) 7 11 16 19
EPS Growth (%) 12 47 37 21
CEPS (Rs) 16 19 26 31
DPS (Rs) 2.0 2.5 3.4 4.1
Source: Company, ENAM Direct Research; Note - ROE & ROCE adjusted for Business Reconstruction Reserve (Ref Appendix)
Cash flow (Rs Cr)
Y/E Mar 2010 2011 2012E 2013E Sources 155 183 438 208 Cash profit 94 157 169 205 (-) Dividends 9 11 22 27 Retained earnings 85 146 147 178 Issue of equity 0 145 0 0 Borrowings 67 (115) 294 25 Others 3 6 (4) 5 Applications 155 183 438 208 Capital expenditure 91 109 319 150 Investments 1 47 10 5 Net current assets 111 13 74 50 Change in cash (49) 14 35 3 Source: Company, ENAM Direct Research
24th February 2012 ENAM Securities Direct 24
HSIL Ltd
APPENDIX Business Reconstruction Reserve (BRR)
Under a scheme of arrangement in accordance with Sections 391-394 of The Companies
Act, 1956 (‘the scheme”) certain immovable properties in the form of Land and Buildings
have been reinstated at their respective fair values. The amount of such revaluation was Rs
235 cr, out of which company has written-off Rs 37 cr on account of old non-recoverable
receivables, inventories and fixed assets. Of the remaining 198 cr, Rs 98 cr has been
transferred to a separate reserve account titled as “Business Reconstruction Reserve” &
Rs 100 cr has been transferred to General Reserve.
In addition, any or all of the immovable properties in the form of Land and Buildings, as
the Company considers relevant and appropriate upto March 31, 2012, may further be
reinstated at their respective fair values as determined by recognized valuers, with the
consequent adjustments (debit/credit) on account of such revaluation being reflected in
the “Business Reconstruction Reserve Account” of the company.
Currently BRR is a part of Reserve and Surplus. Since this has not been generated through
the operation of the company we have excluded the amount of Rs 198 cr while arriving at
the ROE and ROCE.
Permissible uses of Business reconstruction reserve are as follows
a) Write-off of old non-recoverable receivables, advances, old non-moving & slow moving
inventory, any other unrealizable assets, whether fixed or current; b) Impairment,
amortization of assets / investments/ intangible; c) M2M adjustment on derivative
instruments; f) Diminution in value of investment, equity and/or preference; d) Expenses
which may be incurred during process of acquisition of overseas/ Indian company or its
shares or assets (including all kinds of fees and financing charges and debt & capital
raising expenses in India or abroad) which may or may not materialize and which cannot
be otherwise capitalized to the cost of investments by the company including impairment
of goodwill arising on any acquisition; h) excess depreciation on account of revaluation of
fixed assets and diminution in value of immoveable properties; and All the expenses /
costs incurred in carrying out and implementing this Scheme.

24th February 2012 ENAM Securities Direct 25
HSIL Ltd
CONFLICT OF INTEREST DISCLOSURE
We, at ENAM, are committed to providing the most honest and transparent advice to our clients. However, given thenature of the capital markets, from time to time we are faced with situations that could give rise to potential conflict ofinterest. In order to provide complete transparency to our clients, before we make any recommendations, we arecommitted to making a disclosure of our interest and any potential conflict IN ADVANCE so that the interests of ourclients are safe- guarded at all times. In light of this policy, we have instituted what we believe to be the mostcomprehensive disclosure policy among leading investment Banks/brokerages in the world so that our clients may make an informed judgment about our recommendations. Thefollowing disclosures are intended to keep you informed before you make any decision- in addition, we will be happyto provide information in response to specific queries that our clients may seek from us. Disclosure of interest statement (As of 17th February 2012) 1. Analyst ownership of the stock No 2. Firm ownership of the stock No 3. Directors ownership of the stock No 4. MBD Relationship No 5. Broking relationship No We are committed to providing completely independent and transparent recommendations to help our clients reach a better decision.
This document has been prepared by Enam Securities Direct Private Limited – Privileged Client Group. Affiliates of Enam Securities Direct Private Limited focused on Institutional Equities may have issued other reports that are inconsistent with and reach different conclusion from the information presented in this report. The views and opinions expressed in this document may or may not match or may be contrary with the views, estimates, rating and target price of the Affiliates research report. The report and information contained herein is strictly confidential and meant solely for the selected recipient and may not be altered in any way, transmitted to, copied or distributed, in part or in whole, to any other person or to the media or reproduced in any form, without prior written consent. This report and information herein is solely for informational purpose and may not be used or considered as an offer document or solicitation of offer to buy or sell or subscribe for securities or other financial instruments. Nothing in this report constitutes investment, legal, accounting and tax advice or a representation that any investment or strategy is suitable or appropriate to your specific circumstances. The securities discussed and opinions expressed in this report may not be suitable for all investors, who must make their own investment decisions, based on their own investment objectives, financial positions and needs of specific recipient. This may not be taken in substitution for the exercise of independent judgement by any recipient. Each recipient of this document should make such investigations as it deems necessary to arrive at an independent evaluation of an investment in the securities of companies referred to in this document (including the merits and risks involved), and should consult its own advisors to determine the merits and risks of such an investment. The investment discussed or views expressed may not be suitable for all investors. Certain transactions -including those involving futures, options and other derivatives as well as non investment grade securities - involve substantial risk and are not suitable for all investors. Enam Securities Direct Private Limited has not independently verified all the information given in this document. Accordingly, no representation or warranty, express or implied, is made as to the accuracy, completeness or fairness of the information and opinions contained in this document. The Disclosures of Interest Statement incorporated in this document is provided solely to enhance the transparency and should not be treated as endorsement of the views expressed in the report. This information is subject to change without any prior notice. The Company reserves the right to make modifications and alternations to this statement as may be required from time to time without any prior approval. Enam Securities Direct Private Limited, its affiliates, their directors and the employees may from time to time, effect or have effected an own account transaction in, or deal as principal or agent in or for the securities mentioned in this document. They may perform or seek to perform investment banking or other services for, or solicit investment banking or other business from, any company referred to in this report. Each of these entities functions as a separate, distinct and independent of each other. The recipient should take this into account before interpreting the document. This report has been prepared on the basis of information that is already available in publicly accessible media or developed through analysis of ENAM Securities Direct Private Limited. The views expressed are those of the analyst and the Company may or may not subscribe to all the views expressed therein. This document is being supplied to you solely for your information and may not be reproduced, redistributed or passed on, directly or indirectly, to any other person or published, copied, in whole or in part, for any purpose. Neither this document nor any copy of it may be taken or transmitted into the United State (to U.S. Persons), Canada, or Japan or distributed, directly or indirectly, in the United States or Canada or distributed or redistributed in Japan or to any resident thereof. This report is not directed or intended for distribution to, or use by, any person or entity who is a citizen or resident of or located in any locality, state, country or other jurisdiction, where such distribution, publication, availability or use would be contrary to law, regulation or which would subject Enam Securities Direct Private Limited to any registration or licensing requirement within such jurisdiction. The securities described herein may or may not be eligible for sale in all jurisdictions or to certain category of investors. Persons in whose possession this document may come are required to inform themselves of and to observe such restriction. Neither the Firm, not its directors, employees, agents or representatives shall be liable for any damages whether direct or indirect, incidental, special or consequential including lost revenue or lost profits that may arise from or in connection with the use of the information.
Copyright in this document vests exclusively with ENAM Securities Direct Private Limited.
ENAM Securities Direct Pvt. Ltd
201, Laxmi Towers, 'A' Wing, Bandra-Kurla Complex, Bandra East, Mumbai - 400 051. Board: 6680 3600 Helpline: 6680 ENAM Fax : 6680 3700
Website: www.enam.com Email: [email protected]