Embed Size (px)
Citation preview

SNAME 5-5B WSD 0: Comparison with SNAME 5-5A LRFD and the
SNAME 5-5A North Sea Annex
Prepared by PAFA Consulting Limitedfor the Health and Safety Executive
OFFSHORE TECHNOLOGY REPORT
2001/001

SNAME 5-5B WSD 0: Comparison with SNAME 5-5A LRFD and the
SNAME 5-5A North Sea Annex
T FriezePAFA Consulting Limited
Hoser House105 Uxbridge Road
HamptonMiddlesexTW12 1BN

© Crown copyright 2001Applications for reproduction should be made in writing to:Copyright Unit, Her Majesty’s Stationery Office,St Clements House, 2-16 Colegate, Norwich NR3 1BQ
First published 2001
ISBN 0 7176 1980 X
All rights reserved. No part of this publication may bereproduced, stored in a retrieval system, or transmittedin any form or by any means (electronic, mechanical,photocopying, recording or otherwise) without the priorwritten permission of the copyright owner.
This report is made available by the Health and SafetyExecutive as part of a series of reports of work which hasbeen supported by funds provided by the Executive.Neither the Executive, nor the contractors concernedassume any liability for the reports nor do theynecessarily reflect the views or policy of the Executive.

(i)
CONTENTS
1. Introduction 11.1 Background 11.2 Objectives 11.3 Report Layout 1
2. Basic Design Data 32.1 Description of the Jack-Up Platform 32.2 Material Properties 32.3 Water Levels 42.4 Environmental Data 42.5 Soils Data 42.6 Marine Growth 4
3. Loading Conditions 53.1 Load Cases 53.2 Load Combinations 6
4. FE Model and Analysis Procedure 94.1 General Approach 94.2 Detailed Leg Model 94.3 Hull Model 94.4 Modelling of Guides 94.5 Modelling of the Jacking System 104.6 Spudcan and Foundation Modelling 104.7 Airgap 104.8 Mass Distribution and Hull Sag 114.9 Hydrodynamic Properties 114.10 Buoyancy 11
5. Critique of the Assessment Practices 135.1 Review of 5-5B Practice for Consistency and Accuracy 135.2 Review of NSA for Consistency and Accuracy 175.3 Foundation Assessment - 5-5A vs 5-5B 18
6. Analysis Results and Discussion 236.1 Natural Frequencies 236.2 Base Shear and Overturning Moment 236.3 Member Strength Checks for Storm Loading 236.4 Load Factor Application to Load Effects or Load Patterns 256.5 Preload 256.6 Overturning Check 256.7 Foundation Utilisation 266.8 Summary of Results 30
7. Comparison of 5-5A and 5-5B Allowable Stresses and Implied Safety Factors 317.1 Basis of Comparison 317.2 Axial Compression 317.3 Bending 347.4 Combined Compression and Bending 397.5 Implied Safety Factors 43

(ii)
8. Basis of 5-5A Jack-Up Reliability Analysis 458.1 Background 458.2 Review 458.3 Summary 57
9. Conclusions 619.1 Conclusions 61
REFERENCES 65
TABLES
FIGURES

1
1. INTRODUCTION
1.1 BACKGROUND
This project relates to the document titled “Practice for Site Specific Assessment of MobileJack-Up Units – Working Stress Design (WSD)”(1). The issue status of this document isreported First Edition – May 1999, although within the document it is referred to as both Rev 0,September 1999 and Rev 0, October 1999. In the remainder of this report, this document isreferred to as 5-5B.
This document offers a working stress design approach to the Site Specific Assessment ofMobile Jack-Up Units as an alternative to the Load and Resistance Factor Design (LRFD)approach adopted in the SNAME Bulletin 5-5 Guidelines and Bulletin 5-5A RecommendedPractice for Site Specific Assessment of Mobile Jack-Up Units(2).
In addition, reference is made to the application of SNAME Bulletins 5-5 and 5-5A to the NorthSea as reflected in the North Sea Annex to Bulletin 5-5A(3).
1.2 OBJECTIVES
The main objectives of this study were to compare the response and performance of a typicaljack-up rig deployed in the North Sea when initially assessed in accordance with the proposedSNAME WSD Practice (5-5B), and then reassessed to both the existing SNAME LRFD Practice(5-5A) and to the North Sea Annex to SNAME Bulletin 5-5A (NSA).
The jack-up platform considered in this project was the Marathon LeTourneau 116C. Thisplatform was employed at a typical southern/central North Sea location selected on the basis ofwater depth and the availability of suitable environmental and soils data. The assessments wereperformed on the basis of ‘real’ location-specific data, provided by Shell Expro. This ensuredthat the results were particularly pertinent to the North Sea and were consistent with earlierwork. Dynamic loading was treated in a quasi-static manner and the maximum spudcan fixitywas determined on the basis of specific soil parameters.
A secondary objective of this study was to determine the basis of the reliability analysis andcalibration process performed during the Joint Industry Study (JIS) that led to the partial loadand resistance factor format contained within the existing LRFD 5-5A Recommended Practice.
1.3 REPORT LAYOUT
The report is formatted as follows. Section 2 contains basic design data for the 116C, includinga general description of the jack-up platform and water levels, environmental data and soils dataat the selected North Sea location. Design load cases are presented in Section 3. This sectiondescribes the platform weight and centre of gravity summaries for fixed, variable and live loads.Description of the computer model and the analysis procedure are given in Section 4. Allaspects of the leg, hull, the leg-hull connection and the foundation modelling are discussed.
Section 5 presents a detailed critique of 5-5A, 5-5B and NSA practices. They are reviewed forconsistency and accuracy. Analysis results are presented in Section 6, covering naturalfrequency, displacements, base shears and overturning moments and member utilisation ratiosfor each assessment procedure considered. In Section 7, 5-5A and 5-5B strength formulationshave been compared and discussed on a one-to-one basis, accounting for all appropriate factors.Section 8 presents a review of the jack-up reliability analysis and partial factor determinationwork performed by Noble Denton Consultancy Services (NDCS) in connection with the JointIndustry Study (JIS) on Jack-Up Assessment Methods. Conclusions are given in Section 9,followed by references, tables and figures.

2

3
2. BASIC DESIGN DATA
2.1 DESCRIPTION OF THE JACK-UP PLATFORM
The jack-up unit selected was the LeTourneau 116C class, modified for operation in the NorthSea. It is an independent 3-leg self-elevating jack-up with cantilever drilling capability, seeFigures 1 and 2. The rig dimensions are overall hull length 74.1m, hull width 62.8m and hulldepth 7.9m. The forward-aft leg spacing is 39.3m and between port-starboard leg centres43.3m.
The legs are of the 4-chord lattice type. Leg rack chords are of the unopposed pinion type on apitch point spacing of 9.14m. LeTourneau have confirmed that for operation in the North Sea,the 116C unit would have two rounds of leg removed since the unit is unable to work in waterdepths that would utilise the full leg length. The total length of the reduced leg, including 7.3mof spudcan, is 104.6m. The “standard” 116C chord cross section is reinforced with 4” x 1” flatbar attached to each side of the rack plate. This reinforcement extends from approximately33.4m above tip of can (TOC) to the top of the leg. In addition to this reinforcement, many116C units operating in the North Sea are also fitted with 12” x 1½” flat bar reinforcementattached to the side plates – see Figure 3. For this project, the chords of the lower sections ofleg (from TOC to 33.4m above TOC) were considered unreinforced, and those in the uppersections of the legs were considered reinforced.
The bay height is 3.4m and each bay comprises K-bracing from 324 mm diameter x 19.1 mmthickness tubulars. Horizontal bracing and span breakers at each level are 324 mm diameter x19.1 mm thickness and are 229 mm diameter x 9.5 mm thickness, respectively. In the lowerbays of the legs, the wall thickness of the horizontal and diagonal members is increased to 25.4mm.
The spudcan diameter is 14.0 m across flats.
The jack-up is designed to support the in-service environmental loads and gross maximumdrilling condition deck loads under the loading conditions specified in Section 3. Temporaryloading to which the structure is subjected during transportation was not considered in thisstudy.
2.2 MATERIAL PROPERTIES
All components of the chord are made from steel with a minimum yield strength of 483 MPa,with the exception of the rack plate, which has a minimum yield strength of 586 MPa. Theultimate tensile strengths are 552 MPa and 689 MPa, respectively.
The K-braces, horizontals and span breakers are constructed from steel with a minimum yieldstrength of 586 MPa. The ultimate tensile strength is 552 MPa.
Other steel properties were assumed as follows:
Young’s modulus E = 200,000 MPaShear modulus G = 80,000 MPaDensity ρ = 7,850 kg/m3
Poisson’s ratio ν = 0.3
The density of seawater was taken to be 1025 kg/m3. For wind load calculations, the density ofair was taken as 1.22 kg/m3.

4
2.3 WATER LEVELS
Shell Expro provided site-specific data for the 50-year individual and 100-year individualconditions. The site is located in the northern sector of the southern North Sea. The waterlevels used in the analyses are shown in Table 1.
2.4 ENVIRONMENTAL DATA
For the selected site, Shell Expro provided site-specific metocean data for the 50-yearindividual, 100-year individual and the 100-year joint probability conditions. These data, asused in the analysis, are given in Table 2.
The metocean data are all year non-directional data. 5-5A recommends that 50-year returnperiod extremes for wave, current and wind environment be used in the assessment, and theseextremes be assumed to occur simultaneously. The NSA recommends the use of 100-year jointprobability data, instead of the individual 50-year extremes.
For wind velocity, the 1-minute (individual criteria) value is based on a gust factor of 1.18applied to the 1-hour value. For the joint probability case, the appropriate 1-hour wind speedwill be less (10% to 15% is considered to be a reasonable assumption) than the individual 1-hour value. The appropriate gust factor to be used for the joint probability value will be site andrig specific and is calculated using the technique presented in the commentary of the NSA, andwill typically be less than 15%. Therefore, in the absence of joint probability data, the 1-hourindividual wind velocity may be used as a representative value for extreme event jointprobability calculations.
The values of current velocity were converted into a current profile using Table 3. Currentblockage factor was calculated in accordance with the requirements of 5-5A. Using theparameters for equivalent leg diameter, equivalent leg drag coefficient and face width of the leg,a current blockage factor of 0.77 was applied to the current velocity.
2.5 SOILS DATA
For the selected site, the stiffness of the footings was based on an assumed undrained shearstrength of soil beneath the footings of 200 kPa and a G/Su ratio of 50. A reduced value of 60kPa was assumed for the undrained shear strength in the horizontal direction. Poisson’s ratiosfor clay and sand were taken as 0.5 and 0.3, respectively. Vertical, horizontal and rotationalspring stiffness values were calculated as 532MN/m, 106MN/m and 15684MNm/rad,respectively.
The soil profile below the mudline was taken from borehole records and is shown in Table 4.
2.6 MARINE GROWTH
In the absence of site-specific data, to allow for extra wave and current loading caused by thepresence of marine growth, an increase of 12.5 mm in the radii of tubulars was used for allmembers below MWL +2m.

5
3. LOADING CONDITIONS
3.1 LOAD CASES
This section defines the loads considered for the assessment of the jack-up members andfoundations. Loading conditions related to extreme storm and preload were considered in thisassessment, covering:
• Dead loads including buoyancy• Variable loads• Extreme wave and current loads (50-year individual or 100-year joint probabilities)*
• Extreme wind loads (50-year 1-minute or 100-year 1-hour)*
• Inertial loads• P-∆ effects
* dependent on whether the analysis is in accordance with 5-5A, 5-5B or the NSA.
3.1.1 Dead Loads
LeTourneau supplied data regarding the hull basic weight, stationary fixed weight, cantileverload and leg and spudcan weights as excerpts from a typical 116C Operating Manual. Thecentre of gravity for each weight component was also provided. The data are reproduced inTable 5. The weights of the legs reflect the fact that two rounds of leg have been removed fromthe top of each leg section. In accordance with the Operating Manual, the cantilever assemblywas taken to be in the normal stowed position.
3.1.2 Variable Loads
The maximum variable load is 16.4 MN, taken from excerpts from a typical 116C OperatingManual. In accordance with information supplied by LeTourneau, under storm conditions,variable load was evenly distributed to the three legs. The longitudinal centre of gravity (LCG)and transverse centre of gravity (TCG) were calculated such that each leg was loaded equally.
3.1.3 Extreme Wave and Current Loads
The wave loads on the jack-up were calculated in accordance with Section 4 of 5-5A. Sevenwave directions were considered, as shown in Figure 4. Examination of this figure indicatesthat wave directions from 0 degrees through to 180 degrees were investigated. This isacceptable because the unit has longitudinal symmetry and the wave data were non-directional.In order to ensure that maximum loads were captured, each wave was stepped through thestructure using a 15-degree phase angle.
A wave reduction factor of 1.60/1.86 was applied to the wave heights noted in Table 2, toaccount for wave kinematics. For the location water depth, maximum wave height and period,Stream Function wave theory was applicable.
Current loads were applied in conjunction with wave loading. Details of the adopted currentvelocity and profile are given in Section 2.4. The profile was stretched and compressed, suchthat the surface component was constant.
Wave and current forces were calculated using Morison’s equation, using the vectorial sum ofthe wave particle velocity and the current velocity, normal to the member axis. Account wastaken of the increase in effective diameter due to the presence of marine growth. In accordancewith 5-5A, marine growth was not applied to the teeth of the racks and protruding guidesurfaces of chords.
6
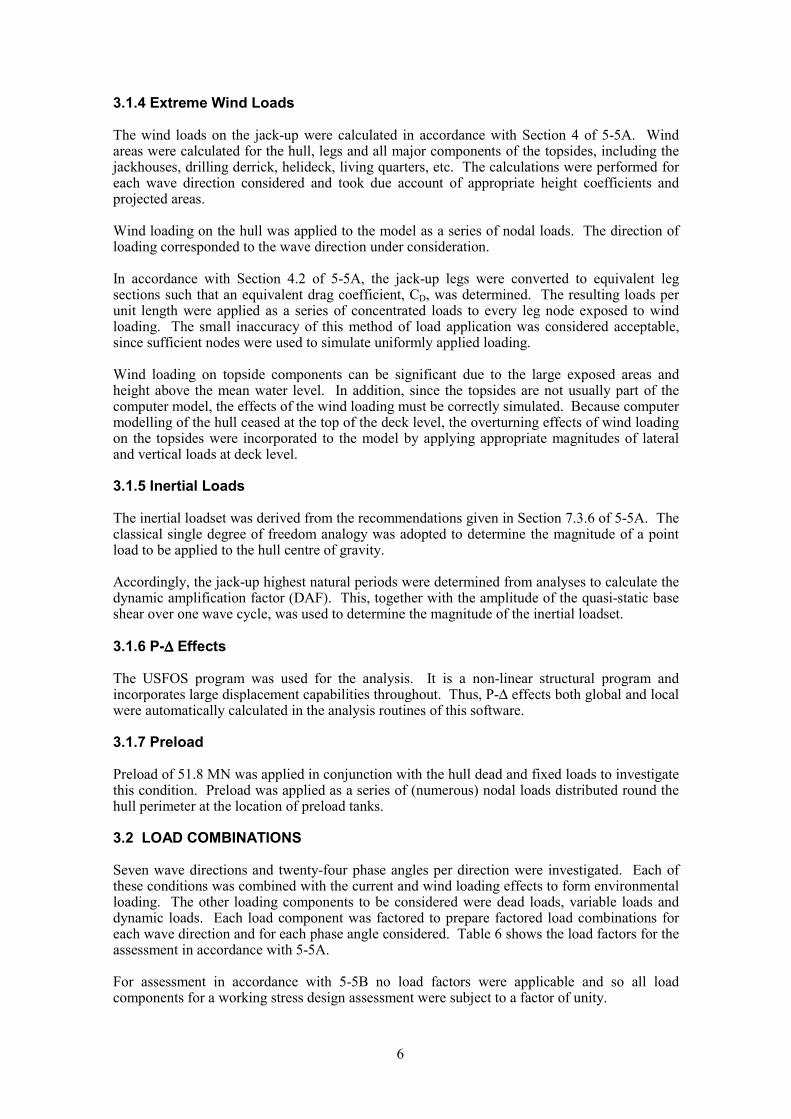
3.1.4 Extreme Wind Loads
The wind loads on the jack-up were calculated in accordance with Section 4 of 5-5A. Windareas were calculated for the hull, legs and all major components of the topsides, including thejackhouses, drilling derrick, helideck, living quarters, etc. The calculations were performed foreach wave direction considered and took due account of appropriate height coefficients andprojected areas.
Wind loading on the hull was applied to the model as a series of nodal loads. The direction ofloading corresponded to the wave direction under consideration.
In accordance with Section 4.2 of 5-5A, the jack-up legs were converted to equivalent legsections such that an equivalent drag coefficient, CD, was determined. The resulting loads perunit length were applied as a series of concentrated loads to every leg node exposed to windloading. The small inaccuracy of this method of load application was considered acceptable,since sufficient nodes were used to simulate uniformly applied loading.
Wind loading on topside components can be significant due to the large exposed areas andheight above the mean water level. In addition, since the topsides are not usually part of thecomputer model, the effects of the wind loading must be correctly simulated. Because computermodelling of the hull ceased at the top of the deck level, the overturning effects of wind loadingon the topsides were incorporated to the model by applying appropriate magnitudes of lateraland vertical loads at deck level.
3.1.5 Inertial Loads
The inertial loadset was derived from the recommendations given in Section 7.3.6 of 5-5A. Theclassical single degree of freedom analogy was adopted to determine the magnitude of a pointload to be applied to the hull centre of gravity.
Accordingly, the jack-up highest natural periods were determined from analyses to calculate thedynamic amplification factor (DAF). This, together with the amplitude of the quasi-static baseshear over one wave cycle, was used to determine the magnitude of the inertial loadset.
3.1.6 P-∆∆∆∆ Effects
The USFOS program was used for the analysis. It is a non-linear structural program andincorporates large displacement capabilities throughout. Thus, P-∆ effects both global and localwere automatically calculated in the analysis routines of this software.
3.1.7 Preload
Preload of 51.8 MN was applied in conjunction with the hull dead and fixed loads to investigatethis condition. Preload was applied as a series of (numerous) nodal loads distributed round thehull perimeter at the location of preload tanks.
3.2 LOAD COMBINATIONS
Seven wave directions and twenty-four phase angles per direction were investigated. Each ofthese conditions was combined with the current and wind loading effects to form environmentalloading. The other loading components to be considered were dead loads, variable loads anddynamic loads. Each load component was factored to prepare factored load combinations foreach wave direction and for each phase angle considered. Table 6 shows the load factors for theassessment in accordance with 5-5A.
For assessment in accordance with 5-5B no load factors were applicable and so all loadcomponents for a working stress design assessment were subject to a factor of unity.

7
Overturning moment checks were performed according to Section 8.2 of 5-5A. In Section 3.2.2of this Practice, it is stated that for checks requiring minimum elevated weight, 50% of thevariable load may be applied. For overturning checks the corresponding factor, γ2, was thereforeset to 0.5.

8

9
4. FE MODEL AND ANALYSIS PROCEDURE
4.1 GENERAL APPROACH
A fully detailed finite element (FE) model of legs and hull/leg connections was prepared inaccordance with guidance given in 5-5A. The hull was represented by plate elements to capturethe stiffness of the main decks and bulkheads.
The design concept of the 116C unit is such that it has a fixed jacking system and unopposedpinions, but no fixation system. The absence of a fixation system means that there will besignificant local chord bending moments between bracing nodes when chord/guide contactoccurs. As the pinions are unopposed, local chord bending moments will arise due to thehorizontal pinion load component (due to the pressure angle of the rack/pinion). The verticalpinion load acts at a position offset from the chord neutral axis and will, therefore, generatelocal chord bending moments.
The details of the hull/leg connection are critical in ensuring accurate capture of the chord andbrace member utilisation ratios in the vicinity of the guides, and appropriate emphasis wasplaced on this aspect of the modelling.
Figures 5 shows an isometric view of the full finite element model.
4.2 DETAILED LEG MODEL
All leg members were modelled using standard USFOS beam elements. The elements werecapable of capturing geometric non-linearity due to large displacements. By default they alsoallowed plastic hinges to develop at nodes and at midspan but this non-linear capability was notrequired, and was suppressed. The model incorporated all main members in each bay. Themembers representing the spudcan were included in the model.
Chord section properties were calculated as a function of the guide plate, rack plate and sideplate and were assigned general beam properties. As noted earlier, the standard 116C chord isreinforced with 1” x 4” flat bar attached to each side of the rack plate extending fromapproximately 33.4m above tip of can (TOC) to the top of the leg. Many 116C units operatingin the North Sea are also fitted with 1½ ” x 12” flat bar reinforcement attached to the side plates.This reinforcement was included in the model, effectively changing the chord into two separategroups – unreinforced and reinforced.
The braces were modelled as tubular members, their section properties and buoyancy wereautomatically calculated by USFOS. Horizontal and diagonal bracing of the 116C unit intersectthe chord at its neutral axis. Offsets were not modelled because gusset plates to the tubularmembers were not included in the structural model. However, the effects of gusset plates on thehydrodynamic properties of the leg were included. Figure 6 shows the detailed leg model.
4.3 HULL MODEL
The main decks and bulkheads of the hull were modelled using 4-noded shell elements. Anequivalent shell thickness was calculated for the deck of the hull taking into accountlongitudinal and transverse stiffening. The main bulkheads were identified and an effectiveshell thickness calculated. Figure 7 shows the layout of the bulkheads isolated from the deck.
4.4 MODELLING OF GUIDES
Non-linear spring elements with a capacity to carry shear were used to model the guides. Theelements allowed explicit definition of their force-displacement relationship. By defining “soft”

10
and “stiff” sections on the elements’ P-∆ curve it was possible to accurately model the gapsexisting in the upper and lower guide shoes. From Figure 8a it is seen that the leg chord wasattached to three non-linear springs in order to allow sliding from front to back and from side toside within the guide shoe. The non-linear springs were in turn connected to coincident stiffbeam members, representing the guide shoe that connected to the hull. The chord was free toslide vertically within the guide shoe. The stiff beam members were given an axial stiffnessapproximately 100 times the stiffness of a chord. This is consistent with the recommendedapproach in 5-5A that states the guides should be relatively stiff, with freedom introduced bymeans of gaps. The depth of the upper and lower guides was taken into account by using adouble prong connection at both the upper and the lower guide. Figure 8b shows a line diagramof the guide arrangement.
4.5 MODELLING OF THE JACKING SYSTEM
Figure 9 shows a line diagram of the rack, pinion and gear unit case. Each pinion was modelledby two non-linear spring elements. Both elements were given a nominal low stiffness intension, in order to achieve numerical stability. The upper pinion element was given a linearcompressive stiffness of 174 MN/m, based on data received from LeTourneau. Defining aregion of low stiffness in the material properties for the lower non-linear spring included thebacklash of three millimetres. The pinions were inclined at a pressure angle of 25o, the rack wasoffset from the chord centroid and the gear unit case was offset from the edge of the yoke. It isimportant to include these details to correctly capture the line of action of the forces andassociated moments. The gear unit case was modelled as a box section with properties based onits construction. Similarly, the associated bracing was modelled as I-sections and orientatedcorrectly. Figure 10 shows the gear unit case, bracing and upper guide.
4.6 SPUDCAN AND FOUNDATION MODELLING
Typical soils data from the selected site was used to determine the values for parameters used inmodelling the spudcan fixity. Calculations showed that it was reasonable to assume a legpenetration of 3.0 m. The vertical, lateral and rotational stiffnesses of the soil were calculatedbased on the undrained shear strength of 200 kPa and a G/Su ratio of 50. By using “spring toground” elements it was possible to apply vertical, lateral and rotational stiffness values to thenode at the tip of each spudcan. The spudcans were modelled as beams, with a stiffness ofapproximately 100 times the stiffness of the chord.
4.7 AIRGAP
An airgap of 16.52 m (measured from the nominal LAT to the underside of the hull) wascalculated in accordance with 5-5A Section 3.7.5. It is defined as the sum of the distance of theextreme still water level above LAT, the extreme wave crest height and 1.5 m clearance.
In 5-5A it is recommended that two positions of the lower guide relative to the chord should beinvestigated, one at a node and the other at midspan of a leg bay. The FE model hull waselevated above the minimum airgap until the first node on the chord was located at the centre ofthe lower guide shoe. A second FE model was generated with the hull elevated further so thatthe centre of the lower guide shoe was located at the midspan of a bay.
The NSA requires airgap to be calculated using the more critical of 100-year return periodindividual maximum wave, taken with a clearance of 1.5 m, and 10,000-year return periodindividual extreme wave, taken with no clearance. In the case under investigation, the latter wascritical. The airgap of the second FE model, with guide shoe located at midspan of a baysatisfied the 10,000-year criteria and so this model was used to investigate the NSArequirements.

11
4.8 MASS DISTRIBUTION AND HULL SAG
The densities of the leg and the spudcan elements were adjusted such that the required weightsand centres of gravity were achieved. However, the hull was modelled with shell elements thathad no density input parameters. In order to achieve the correct inertial effects it was necessaryto distribute nodal masses to the decks and bulkheads. These were distributed such that the totalmass and location of centre of gravity for the hull dead and variable load and for the cantileverload were achieved.
The effect of hull sagging due to an accurate distribution of hull masses was determined to betoo onerous a condition with respect to bending moments generated at the guides. In 5-5A, it isstated that in practice these effects would not be fully realised due to the details of the jackingsystem. The Commentary to 5-5A Section 5.3.3 recommends that between 25% and 75% of thehull mass be re-located adjacent to the legs, such that hull sagging was reduced. Accordingly,50% of nodal mass was re-located adjacent to the connections to the legs.
4.9 HYDRODYNAMIC PROPERTIES
Hydrodynamic coefficients were applied to brace members in accordance with Section 4.7.2 of5-5A. Values of CD = 0.65 and CM = 2.0 were used for brace members above MWL + 2 m.Below this elevation, CD was taken as 1.0 and CM as 1.8. Marine growth of 12.5 mm wasapplied to the brace members located between MWL +2m and mudline. An allowance wasmade for the drag force resulting from the gusset plates by calculating an increase to thehydrodynamic diameter of the horizontal bracing.
For the chord section, values of CD and CM are dependent on direction. These were calculatedaccording to Section 4.7.5 of 5-5A. Marine growth was not applied to the teeth of the racks andprotruding guide surfaces of chords.
4.10 BUOYANCY
Buoyancy was automatically included for all tubular members that were “wet” at the solutiontime. It was necessary to apply chord buoyancy manually. This was achieved by utilisingbuoyancy elements. The diameter of the spherical shaped buoyancy elements was calculated togive the same internal dry volume per metre as that of the chord.

12

13
5. CRITIQUE OF THE ASSESSMENT PRACTICES
5.1 REVIEW OF 5-5B PRACTICE FOR CONSISTENCY AND ACCURACY
It is proposed that a Working Stress Design approach be offered as an alternative to the existingLoad and Resistance Factor Design approach adopted within the SNAME Bulletin 5-5Guidelines and Bulletin 5-5A Recommended Practice for Site Specific Assessment of MobileJack-up Units.
This section reports on a critical review undertaken of the document “Practice for Site SpecificAssessment of Mobile Jack-up Units – Working Stress Design (WSD)”, First Edition, May1999, hereafter referred to as 5-5B. The review has been performed for accuracy and uniformityof 5-5B with respect to the following source documents:
• ‘Recommended Practice for Planning, Designing and Constructing Fixed OffshorePlatforms – Working Stress Design RP 2A-WSD’, Twentieth Edition (hereafter referred toas RP 2A-WSD)
• ‘Manual of Steel Construction, Allowable Stress Design’ Ninth Edition (hereafter referredto as AISC 9th Edition)
Consistency is also checked with:
• ‘SNAME Recommended Practice for Site Specific Assessment of Mobile Jack-up Units’,Revision 1 (hereafter referred to as 5-5A)
The review includes typographical errors, section layout, clarifications, corrections andtechnical consistency with other documents. The findings are presented in the order in whichthey appear in the document and are cross-referenced using page, section and equation numbers.
1. The issue status of 5-5B is reported First Edition – May 1999, although within the documentit is referred to as both Rev 0, September 1999 and Rev 0, October 1999.
2. Section 1.2.1 The current guideline references ….(typographical)
3. Contents -Step 3, Displacement check through to 8.7 Structure Condition Assessment arenot included in this document, and it is assumed that these remain unchanged from 5-5A.
4. Page 1 Section 8 – Horizontal deflections (Section 8.4), ……… – The condition of the unit(Section 8.7). are not contained in this document and are assumed to be the same as in 5-5A.
5. Page 1 ….. allowable unity check …….. calculated unity check …… are not correct phrases.Unity check is defined as actual stress divided by allowable stress, and for codecompliance, this ratio should be less than or equal to unity. These phrases should bedeleted.
6. Page 1 …… recognised standard such as API RP 2A sections 2.3.6 c4 and 2.c.6e. The latterof these sections should read 2.3.6e.
In 5-5B, this is the first time that API RP 2A is mentioned, so it is necessary to clarify theversion and whether LRFD or WSD. It is noted that this is in fact done on the followingpage in Section 8.1.1.1.
7. Page 3 Figure 8.1 the flowchart commences with Member Strength Assessment usingFactored Loads. There are no factored loads.

14
8. Page 4 Section 8.1.2.1 a) i) The limits for R/t are in error and should read:
R/t > 1650/Fy or R/t > 30 {Metric: 11375/Fy}
Table B5.1 of AISC 9th Edition and Section 3.2.2a of RP 2A-WSD present the tubularlimits in terms of the diameter to thickness ratio (D/t). It is clear that the error has resultedfrom converting the D/t ratio to a radius to thickness (R/t) ratio.
9. In Section 8.1.2.2 5-5B states Typically all the components forming parts of chord sectionsmay be regarded as stiffened. It is not clear why the outstands of the back plate componentshould be treated as stiffened along both edges, as opposed to stiffened along one edgeonly. Similarly, the rack component ought to be considered as stiffened along one edgeonly. It is noted that this clause also appears in the 5-5A.
10. Page 6 Section 8.1.4.1a in the Note states that when local element P-Delta effects areincluded in a three dimensional analysis of the entire jack-up, the Euler modification inH1-1 may be assumed equal to 1.0 for chord elements only. Other elements shall includethe Euler modification unless independent analysis is used to demonstrate that local nodeto node Euler effects have been included in the element load level.
A similar clause is given in 5-5A Section 8.1.4.5 ii). Here it is stated that where theindividual member loads are determined from a second order analysis, ie the equilibriumconditions were formulated on the elastically deformed structure so that local P-∆ loadswere also included in the analysis B = 1.0, where
In the latter case, Cm is also set to unity, provided the conditions are satisfied. However, 5-
5B permits only the Euler modification to be set to unity. Furthermore, this code clearlystates that this is permitted for chord sections only. For all other elements the Eulermodification must generally be included. This disparity gives rise to an inconsistentapproach between the two practices.
11. Page 6 Section 8.1.4.1a 2). In the definition of Fb and F’e ksi units are specified. Metric
units may also be used to determine these parameters so ksi should be deleted.
12. Page 6 Axial Tension and Bending Prismatic Section. This section has been positionedwithin Section 8.1.4.1a Axial Compression and Bending Prismatic Sections. It would beclearer to move this section to after Equation (3.3.1-4) on the following page, or provide aseparate section number to Axial Tension and Bending.
13. Page 7 Note: Where tubular elements are uses(d) as ….(typographical).
This note also permits the Euler amplification to be set to unity under the same conditionsdiscussed in item 10, above. The arguments of 10 apply equally here.
14. Section 8.1.4.2 Allowable Axial Strength of a …. Replace ‘strength’ with ‘stress’. Also, theword tensile should have a leading capital and the ‘t’ in Ft should be a subscript.
15. Section 8.1.4.3 In the title, the ‘a’ in Fa should be a subscript.
16. Section 8.1.4.3 iii) Change 11,380 to 11,375 for consistency with Section 8.1.2.1 iii).
����
�−
=
E
U
m
PP
CB
1

15
17. Section 8.1.4.3 iv) The limit for R/t is in error and should read:
18. Page 10 Section 8.1.4.3b) 2) 2. Inelastic local Buckling Stress. The equation given here(API 3.2.2-4) is fundamentally flawed in that it is not correctly non-dimensionalised. Toachieve this, Fy and D/t need to be combined in a manner not dissimilar to that found in thecorresponding equation (see 3.2.3-1) on page 13 of FyD / Et. This has been done morerigorously for the local buckling check in the proposed ISO fixed steel structuresformulations. Here the equations are given as:
where Fxc is as given by API 3.2.2-3.
Further, in equation API 3.2.2-4, the subscript to the variable preceding the “=” should inboth cases be “xc” not “xe”.
19. 8.1.4.4 In the second paragraph, reference is made to the need to include global P-∆ effectsand to account for local loading in order to correctly determine moments. To this shouldbe added local P-∆ effects.
20. Page 11 Section 8.1.4.5 Equation H1-3 has an error, an additional “l”, and the term shouldread F’
e. Therefore the equation ought to be:
21. 8.1.4.5 ii) This refers to a second order analysis in which local P-∆ loads are included inthe analysis. This section on compression is not consistent with the correspondingparagraph on tension. A weakness was noted in 19. with respect to the requirements fortension. A similar weakness exists here in that it refers to local P-∆ loads but not localloading. In both cases, global and local P-∆ effects as well as local loading are all to beincluded.
22. Page 12 Section 8.1.4.6 The limiting equation for lateral torsional buckling is incorrect. Itshould read:
Similarly in the metric equivalent, the square root should be applied only to the numerator.
23. Page 12, 2nd sentence under Check: Local buckling Insert “, the” between “control” and“allowable”.
24. In the second paragraph to this section, the need to differentiate between ‘flange’ and ‘web’elements is indicated. Descriptions follow as to how this might be applied, for example, tosplit tubular flanges and tear drop chords. The problem with this is that the descriptionsonly relate to bending about one axis (the major axis). It is also necessary to considerminor axis bending at which case, the webs and flanges interchange. Such distinctionwould be necessary if the slenderness (b/t) was to be limited on the grounds of which stress
30/ ≤tR
911.1F/FforFxe
911.1F/F170.0forF)F/F274.0047.1(
170.0F/FforFF
xey
xeyyxey
xeyyxc
>=
≤<−=
≤=
2
2'
)/(2312
bbe rKl
EF π=
pyb M
JArL 25860/ ≤

16
pattern the component was subjected. For example, a web subjected to shear only willnormally have a different slenderness limit to one subjected only to flexure. The limits onslenderness that follow are not limited on this basis, but on the basis that they form part ofconventional hybrid girders. This is discussed below but the chords of jack-up legs are notconventional hybrid girders.
25. Page 13 Section 8.1.4.6 a ii) The metric version of the equation is incorrect. It should read:
although of course the parentheses are unnecessary.
26. Page 13, The limitation given under 8.1.4.6a) Compact Sections iii) For rectangularcomponents of d ≤ 6w seems meaningless. Firstly, ‘d’ and ‘w’ are ill-defined. In any case,components supported on one or two edges are already covered by the preceding provisionsii) and i) respectively. Unless the need for this is fully justified it should be omitted.
27. Page 13, b Noncompact Sections ii). The definition here specifically refers to Fywj = webcomponent yield stress. This definition arises through the use of a code aimed atconventional hybrid girders, ie, I sections in which the yield stress of the web is notablyless than that of the flange. The limitation aims to inhibit local torsional buckling of theflange (if symmetrical it rotates about its longitudinal connection with the web). Theability to rotate is governed by the weaker yield stress of the two components, here the webfor major axis bending. However, for minor axis bending, when the flanges and webs areinterchanged, the new web is restrained by the weaker flange so that the relevantrequirement should be a function of the ‘flange component yield stress’.
This set of limitations requires careful clarification.
28. In Figure 8.2 location of stress points are shown. For the teardrop chord, additional checksought to be made at the side plate at their connection to the rack, if the yield strength of theside plates is less than the yield strength of the rack. Further, attention should be drawnwithin the relevant provisions, H1-2, H1-3, H2-1, about the need to conduct the checks atthe stress points indicated.
29. None of the proposed WSD formulations make allowance for the presence of hydrostaticpressure, in keeping with 5-5A. This presumably is justified on the grounds that, inpractice, the D/t of all jack-up tubulars are small enough for pressure to have little or noinfluence on their design. Components with D/t up to 300 are permitted in bending,however, and their design will be affected by pressure. API RP 2A-LRFD strengthformulations indicate that under pressure alone, the following limiting water depths apply,given D/t:
D/t Water depth (m)
60 167
80 70.5
100 36.1
These limits have been determined for unfactored loads and resistances. Smaller depthsclearly apply once partial factors are introduced. A statement is required concerningconsideration of hydrostatic pressure.
30. Pages 15 and 16 Section 8.2.3 At two locations within this section it is noted that factoredloads are used. There are no factored loads in 5-5B.
( )yiii Ftb /170/ ≤
17
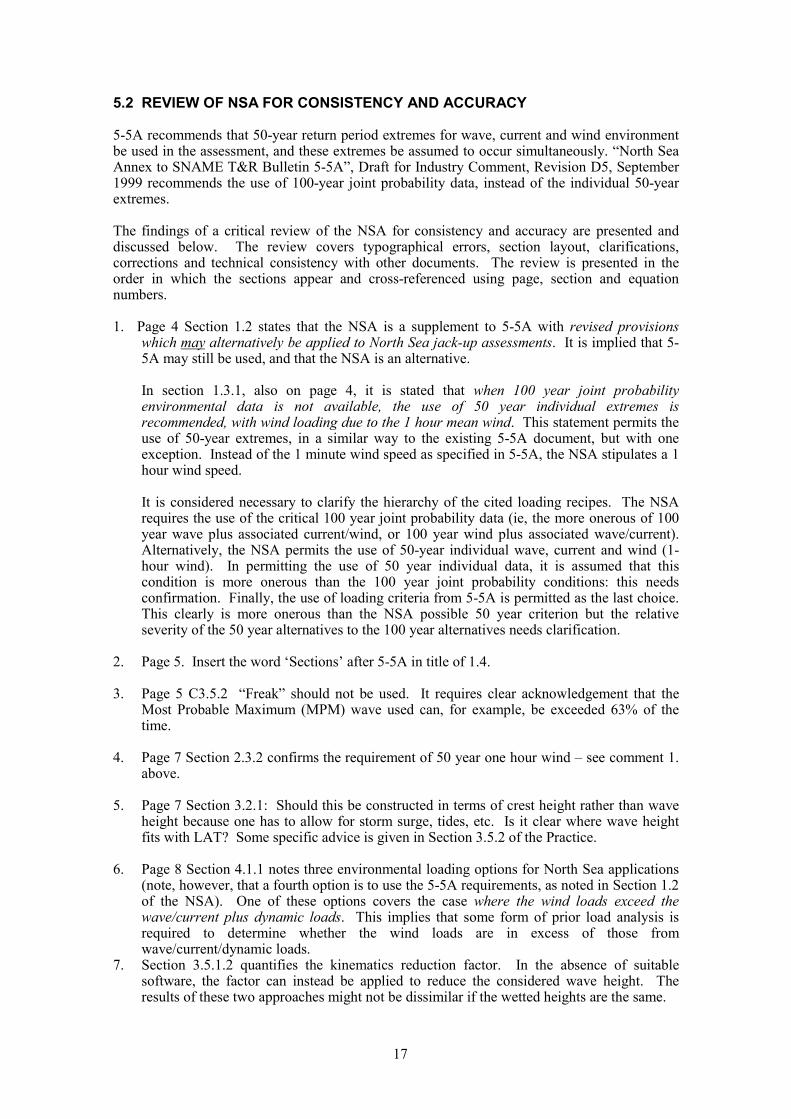
5.2 REVIEW OF NSA FOR CONSISTENCY AND ACCURACY
5-5A recommends that 50-year return period extremes for wave, current and wind environmentbe used in the assessment, and these extremes be assumed to occur simultaneously. “North SeaAnnex to SNAME T&R Bulletin 5-5A”, Draft for Industry Comment, Revision D5, September1999 recommends the use of 100-year joint probability data, instead of the individual 50-yearextremes.
The findings of a critical review of the NSA for consistency and accuracy are presented anddiscussed below. The review covers typographical errors, section layout, clarifications,corrections and technical consistency with other documents. The review is presented in theorder in which the sections appear and cross-referenced using page, section and equationnumbers.
1. Page 4 Section 1.2 states that the NSA is a supplement to 5-5A with revised provisionswhich may alternatively be applied to North Sea jack-up assessments. It is implied that 5-5A may still be used, and that the NSA is an alternative.
In section 1.3.1, also on page 4, it is stated that when 100 year joint probabilityenvironmental data is not available, the use of 50 year individual extremes isrecommended, with wind loading due to the 1 hour mean wind. This statement permits theuse of 50-year extremes, in a similar way to the existing 5-5A document, but with oneexception. Instead of the 1 minute wind speed as specified in 5-5A, the NSA stipulates a 1hour wind speed.
It is considered necessary to clarify the hierarchy of the cited loading recipes. The NSArequires the use of the critical 100 year joint probability data (ie, the more onerous of 100year wave plus associated current/wind, or 100 year wind plus associated wave/current).Alternatively, the NSA permits the use of 50-year individual wave, current and wind (1-hour wind). In permitting the use of 50 year individual data, it is assumed that thiscondition is more onerous than the 100 year joint probability conditions: this needsconfirmation. Finally, the use of loading criteria from 5-5A is permitted as the last choice.This clearly is more onerous than the NSA possible 50 year criterion but the relativeseverity of the 50 year alternatives to the 100 year alternatives needs clarification.
2. Page 5. Insert the word ‘Sections’ after 5-5A in title of 1.4.
3. Page 5 C3.5.2 “Freak” should not be used. It requires clear acknowledgement that theMost Probable Maximum (MPM) wave used can, for example, be exceeded 63% of thetime.
4. Page 7 Section 2.3.2 confirms the requirement of 50 year one hour wind – see comment 1.above.
5. Page 7 Section 3.2.1: Should this be constructed in terms of crest height rather than waveheight because one has to allow for storm surge, tides, etc. Is it clear where wave heightfits with LAT? Some specific advice is given in Section 3.5.2 of the Practice.
6. Page 8 Section 4.1.1 notes three environmental loading options for North Sea applications(note, however, that a fourth option is to use the 5-5A requirements, as noted in Section 1.2of the NSA). One of these options covers the case where the wind loads exceed thewave/current plus dynamic loads. This implies that some form of prior load analysis isrequired to determine whether the wind loads are in excess of those fromwave/current/dynamic loads.
7. Section 3.5.1.2 quantifies the kinematics reduction factor. In the absence of suitablesoftware, the factor can instead be applied to reduce the considered wave height. Theresults of these two approaches might not be dissimilar if the wetted heights are the same.

18
8. Page 12 Section 3.5.2 refers to 5-5A Section 4.4.1 for determining an appropriate wavetheory for the determination of the wave crest elevation. It is noted that Figure 4.1 of 5-5Ahas an error in one of the y-axis value (0.05 should read 0.005).
9. Page 12 Section 3.5.2 presents a relationship between the 10000-year Hsrp and the 100-yearHsrp. A factor of 1.31 is quoted. This factor has been confirmed by using the formulationsgiven in Table 11.8 of the, now superseded, UK Department of Energy ‘OffshoreInstallations: Guidance on design, construction and certification’, Fourth Edition.
5.3 FOUNDATION ASSESSMENT – 5-5A VS 5-5B
In both Bulletins 5-5A (LRFD) and 5-5B (WSD), foundations analysis are referenced in twoSections:
Section 6 describes Calculation Methods – Geotechnical Engineering,Section 8.3 describes Foundation Assessment Criteria.
In Rev 0 of the 5-5B code, changes from the 5-5A assessment practice are proposed in Sections8.3.1 to 8.3.3, while no amendments are proposed to any part of Section 6, Section 8.3.4 Step 3– Displacement check, or Section 8.3.5 Punch-through.
Sections 8.3.1 to 8.3.3 cover the following aspects of foundation assessment:Section 8.3.1 Step 1 - Preload and Sliding ChecksSection 8.3.2 Step 2a - Capacity Check - pinned foundationSection 8.3.3 Step 2b - Capacity Check - with foundation fixity
Details of the differences between the 5-5A and 5-5B codes are detailed and discussed inSection 5.3.2 of this report.
5.3.1 Foundation Assessment Methodology
Prior to describing the differences between the two versions of the jack-up code, it is necessaryto review the approach adopted for assessing foundation integrity.
There are three areas of geotechnical concern. Of these three areas, only the second area: jack-up foundation stability after preloading differs between the 2 versions of the code and will beconsidered further.
5.3.1.1 Prediction of Footing Penetrations During Preloading
The assessment of spudcan load/penetration behaviour generally follows three steps:
• Model the spudcan.
• Compute the vertical bearing capacity of the footing at various depths below the seabedusing closed form bearing capacity solutions and plot as a curve.
• Enter the vertical bearing capacity versus footing penetration curve with specifiedmaximum preload and read off the predicted footing penetration.
5.3.1.2 Jack-up Foundation Stability After Preloading
The overall foundation stability is generally assessed using a phased method with three stepsincreasing in order of complexity. The process describing the relationship between these stepsand the acceptability of the foundation stability are related in accordance with a flowchart(Figure 6.9), reproduced as Figure 11 of this report.

19
• Preload and sliding check.The foundation capacity check is based on the preloading capability. Sliding of the windwardleg is also checked using loads from pinned footing analysis.
• Bearing capacity check.Step 2a, Bearing capacity check based on resultant loading, assuming a pinned footing. Alsocheck sliding.Step 2b, Bearing capacity check including rotational, vertical and translational foundationstiffness.
• Displacement check.The displacement check requires the calculation of the displacements associated with anoverload situation arising from Step 2b.
Any higher level check need only be performed if the lower level check fails to meet theacceptance criteria associated with all of these steps.
5.3.1.3 Other Aspects of Jack-up Foundation Performance During or After Preload
The following items are briefly summarised:• Leaning instability• Footprint considerations• Scour• Seafloor instability• Shallow gas• Spudcan – pile interaction
5.3.2 Differences between the 5-5A and 5-5B Jack-up Codes
The following differences are specified between the 5-5A and 5-5B versions of the Jack-upcode. These differences are expressed in terms of what has been removed from the 5-5Aedition.
All differences between the versions of the code relate to the load and resistance factors applied.The basic equations and analysis methodology for determining the applied loads and strengths isidentical between the two versions of the code. Consequently, for any individual check therelationship between the 5-5A and 5-5B codes is relatively simple. However, because of thestepwise nature of the assessment and the number of parameters involved, it is extremelydifficult to quantify the overall difference between versions of the code except on a case-by-casebasis.
Note. For load factors the following relationship is always employed:γ1 . Dead load + γ2 . Live load + γ3 . (Environmental load + γ4 . Inertia load)
It should also be noted that the value of γ3 = 1.25 reported in the 5-5A version of the code to beprovisional has been applied in all cases.
5.3.2.1 Step 1a: Preload Check
Section 8.3.1.2Removal of load factors from vertical leg reaction, QV (γ1 = γ2 = γ4 = 1.0, γ3 = 1.25)
Section 8.3.1.3Removal of resistance factor for foundation capacity, ϕP = 0.90

20
The effect of removing these factors is illustrated in Figure 12. It should be noted that on theleeward leg it is assumed that the vertical forces due to environmental effects always act in thesame (compressive) manner as the forces due to dead and live loads.
It can be seen that where there is no environmental or inertial load (E + Dn = 0, 0% on the x-axis), the 5-5A version is 1.00/0.90 = 11% more conservative than the 5-5B version of the codedue to the inclusion of this resistance factor. This percentage could theoretically increase to amaximum of 1.25/0.90 = 39% for no dead and live load (100% on the x-axis).
5.3.2.2 Step 1b: Sliding Resistance – Windward Leg(s)
Section 8.3.1.5Removal of load factors from horizontal leg reaction, QH (γ3 = 1.25, γ4 = 1.0)in association with QV (γ1 = γ2 = γ4 = 1.0, γ3 = 1.25)Removal of resistance factor for horizontal foundation capacity:ϕHfc = 0.80 effective stress – sand drainedϕHfc = 0.64 total stress – clay undrained
The effect of removing these factors is illustrated on Figure 13. It should be noted that on thewindward leg it is always assumed that the vertical forces due to environmental & inertial (E +Dn) effects always act in the opposite (tensile) manner to the forces due to dead and live loads.It can be seen that there is a non-linear relationship between the proportion of E + Dn loadingand the degree of conservatism.
For a sand foundation, where there is no E + Dn load in the vertical direction (0% on the x-axis), the 5-5A version is 1.25/0.80 = 56% more conservative than the 5-5B version of the code.The 1.25 in this case relates to the relative increase in the horizontal load, QH = 1.25 x (HE +1.00.HDn), which applies to all QH values irrespective of the percentage horizontal E + Dn load.The equivalent degree of conservatism for clay soils for no environmental or inertial load in thevertical direction is 1.25/0.64 = 95%.
For the case where the E + Dn load is 40% of the total absolute load on the windward leg, thispercentage would increase to 213% in sand and 291% in clay soil. The curve tends to infinityas the (D + L) – (E + Dn) =0, i.e. at –50% E + Dn. Although these percentage differencesappear large, they reflect the fact that the tensile environmental & inertia forces are becomingequivalent to the compressive dead and live loads, giving a combined total load tending to zero.
e.g. VD = 25 MNVL = 5 MNVE = -15 MNVDn = -5 MN
Qv_5-5A = 25 + 5 + 1.25 x ((-15) + (-5)) = 5.0Qv_5-5B = 25 + 5 + (-15) + (-5) = 10.0
DnE40%50MN20MN
VVVVVV
DnELD
DnE +−=−=+++
+
0.8)sand(in3.130.8x0.5
1.25WSDLRFD:QinDifference H === ϕ

21
5.3.2.3 Step 2a: Capacity Check – Pinned Foundation
Section 8.3.2.1Removal of load factors from leg reaction vector, QVH (γ1 = γ2 = γ4 = 1.0, γ3 = 1.25)
Section 8.3.2.2Removal of resistance factor for foundation capacity,ϕVH = 0.90 maximum bearing area not mobilisedϕVH = 0.85 penetration sufficient to mobilise maximum bearing area
The effect of removing these factors is illustrated on Figure 14. As for Step 1a, the leeward legit is assumed that the vertical forces due to E + Dn effects always act in the same (compressive)manner as the forces due to dead and live loads.
Where the maximum bearing area is not mobilised and where there is no environmental orinertial load, the 5-5A version is 1.00/0.90 = 11% more conservative than the 5-5B version ofthe code due to the inclusion of a resistance factor. The equivalent degree of conservatismwhere the bearing area is mobilised is 1.00/0.85 = 18%.
This percentage theoretically increases to a maximum of 1.25/0.90 = 39% for bearing area notfully mobilised and 1.25/0.85 = 47% for bearing area mobilised, for no dead and live load(100% on the x-axis).
5.3.2.4 Step 2b: Capacity Check – with Foundation Fixity
Section 8.3.3.1Removal of load factors from leg reaction vector, including the associated can moment,QVHM (γ1 = γ2 = γ4 = 1.0, γ3 = 1.25).
The effect of removing these factors is illustrated on Figure 15. Capacity checks need to beperformed on both the leeward and windward legs. Consequently, Figure 15 shows theenvironmental & inertial loads as both a negative and positive percentage of the total loads inthe range –40% to 100%. As for Step 1b, the ratio tends to infinity at E + Dn = -50%, of totalload, QVHM = 0, so this region has not been plotted on Figure 15.
Where there is no E + Dn load, the 5-5A version gives identical assessment to the 5-5B code.However, the 5-5A code is more conservative than the 5-5B code up to a maximum of 25% forthe theoretical case of no dead and live load (100% on the x-axis). For uplift E + Dn on awindward leg the 5-5B code is more conservative by a 100% at –40% on the x-axis.
It should be noted that if this check is satisfactory, the engineer is also required to check theleeward leg in accordance with Step 2a and the windward leg in accordance with Step 1b. Inthese code checks the horizontal and vertical reactions would be based on the Step 2bfoundation model, i.e. assuming moment fixity with elastic vertical and horizontal springs.
5.3.2.5 Step 3: Displacement Check
While the text in Section 8.3.4 of the code relating to Step 3 – displacement checking, isidentical in the two versions, reference is made to factored loads. Therefore, there is an implicitdifference between the codes with the 5-5A version including load factors (γ1 = γ2 = γ4 = 1.0, γ3= 1.25). Consequently, the difference between 5-5A and 5-5B versions would be the same asthat illustrated on Figure 15.
5.3.2.6 Discussion
It can be seen from the above sections that for specified proportions of Environmental + Inertialload it is relatively easy to determine the percentage difference between the two versions of the

22
jack-up code. The one area of potential confusion being associated with the high percentagedifferences between the codes on the windward leg(s) as the proportion of Environmental +Inertial load approaches 50% and the total load approaches zero.
Therefore, for a specific foundation model, it is relatively easy to follow the path through thethree steps to verify the acceptability of the foundation stability after preload, as illustrated onFigure 11. This path is summarised on Table 7.
However, because of the large number of variables in both load and resistance and the stepstaken towards foundation verification, it is difficult to combine these differences at each step toobtain an overall generalised description of the difference between the two versions of the code.
Such a comparison could be achieved by performing Monte-Carlo simulations for a range ofpossible loads, jack-up platform types and soil conditions. This exercise would require aninvestigation into the range and frequency of such variables so that appropriate probabilitydistributions can be attributed to each variable. Due to the considerable effort required toadequately describe these distributions, such an exercise is considered to be outside the scope ofthe current project.
5.3.3 Conclusions
A comparison between the 5-5A and 5-5B versions for the jack-up code has been performedwith regard to verifying the acceptability of the foundations.
The only difference in the 5-5B version of the code from the 5-5A version is the removal of theload and resistance factors. Since these factors are ≥ 1.0 on the loads and ≤ 1.0 on the resistanceterms the 5-5A will always be more conservative than the 5-5B code for loads acting in thesame direction. For the situation where the environmental and inertial loads are acting in theopposite sense to the dead and live loads the situation becomes more complex as the load factorof 1.25 on the environmental and inertial loads can lead to a reduction in the total load. In suchinstances the 5-5B code can be more conservative than the 5-5A code, depending upon theresistance factor applied.
The analysis procedure covers several steps of increasing complexity in the foundation modelwith these steps employing different loads (e.g. horizontal, vertical, and the load vector with andwithout the associated can moment). Differences between the codes are relatively easy toquantify at each step. However, the large number of variables in both load and resistance, andthe uncertainty in the number of steps taken towards foundation verification, make it difficult togeneralise these differences to obtain an overall description of the difference between the twoversions of the code. This could be achieved by performing a Monte-Carlo analysis, althoughsuch an exercise would require considerable effort to determine appropriate probabilitydistributions to the numerous variables.

23
6. ANALYSIS RESULTS AND DISCUSSION
6.1 NATURAL FREQUENCIES
The highest natural periods were determined as 8.3 s, 8.2 s and 6.8 s for sway, surge and yaw,respectively. The corresponding mode shapes are given in Figures 16 to 18. The natural periodof 8.3 s resulted in a single degree of freedom dynamic amplification factor (DAF) of 1.50. A7% critical damping was used in the calculation of the dynamic amplification factor.
6.2 BASE SHEAR AND OVERTURNING MOMENT
Loading due to wave, current, wind and inertial loadset results in base shear. For assessment to5-5A, 5-5B and the NSA, Table 8 presents the total factored (no factors applied to assessment inaccordance with 5-5B) base shear magnitude for 60 degree wave direction. Also given in thetable are the individual components that make up the total base shear. Not surprisingly, wave +current represent the largest component.
Table 8 also presents the magnitude of total overturning moment for the selected direction.
6.3 MEMBER STRENGTH CHECKS FOR STORM LOADING
Member strength checks were performed in accordance with the requirements of 5-5A and 5-5B(the NSA checks were in line with 5-5A). The leg members of the unit were separated intogroups as follows: reinforced chord, unreinforced chord, horizontal tubular, diagonal tubular,span breaker, horizontal tubular with increased wall thickness and diagonal tubular withincreased wall thickness. The last two groups represent members in the lower bays of the legs,where the tube wall thickness for these members is increased from 19.1 mm to 25.4 mm.
Member sizes for each group were as follows:
Reinforced chord see Figure 3Unreinforced chord see Figure 3Horizontal tubular 324 mm diameter x 19.1 mm wtDiagonal tubular 324 mm diameter x 19.1 mm wtSpan breaker 229 mm diameter x 9.5 mm wtHorizontal tubular lower bays 324 mm diameter x 25.4 mm wtDiagonal tubular lower bays 324 mm diameter x 25.4 mm wt
The structural analysis software used in this study was a non-linear large displacement package,and took into account the global and local P-∆ loads. Therefore in line with the 5-5A practice,the coefficient B, which accounts for the load reduction factor (Cm) and the Euler amplification,was set to unity. In the working stress design practice 5-5B, a similar clause permits setting theEuler amplification to unity, but not Cm. For a consistent comparison in this study, Cm for allmembers was also set to unity. In the various checks for compactness, no tube members wereclassed slender.
The chord elastic and plastic section properties were determined using standard techniques.Account was taken of the different yield strength of the rack components. In 5-5A it is statedthat all components for a chord may be assumed to be stiffened along both edges. However, thiswas considered inappropriate for outstands of the guide plate and for the rack component. Forthese components slenderness checks were based on b/t limits for a component stiffened alongone edge only. Both 5-5A and 5-5B include this statement, and therefore consistency wasmaintained.

24
For the reinforced chord, in addition to conducting local buckling checks for each component,for the stiffened side plates it was considered prudent to check the combined section comprisingside plate and side plate reinforcement for local buckling. To perform this check, an equivalentplate thickness was calculated on the basis of equivalent second moment of area and thebuckling formulations for stiffened plates. This resulted in an equivalent plate thickness of 40.9mm.
The code check formulations for each assessment were prepared for tube and chord sections.Where appropriate, load and resistance factors were applied in accordance with the practicerequirements. In particular, for working stress design checks, a one-third increase in allowablestresses was incorporated for the storm load combinations.
Every leg element was code checked for each combination. Every wave direction wasconsidered together with the phase angle for a full wave cycle. For each assessment, codechecks were made for the position of the lower guide adjacent to the leg node and for the lowerguide at midspan of the chord section. The variations noted above resulted in a very largenumber of code check results. The critical utilisation ratios (UR) were identified for each majorgroup and these are reported in Tables 9 to 11. Table 9 covers the results for 5-5A, Table 10 for5-5B. The tables also present the ratio of maximum UR for lower guide at midspan to the URfor lower guide at midspan. The results for the NSA are presented in Table 11. In the case ofthe NSA, only the analysis related to the lower guide adjacent to midspan was conducted, basedon the results of the earlier work.
The results for checks to 5-5A (Table 9) show that the maximum UR for the reinforced chord, inthe region of the lower guide, is 1.86, considerably in excess of unity. Table 9 also indicates thatall other element groups exhibit maximum URs below unity. It is evident that the position ofthe lower guide in relation to the chord section can make a difference of up to 6% in UR. Insome cases the midspan location is critical, in others, the node position. Therefore, both need tobe checked for an accurate assessment of the structure. Figures 19 and 20 show the locations ofthe critical members in each group, for the lower guide position adjacent to the chord node andadjacent to the chord midspan, respectively.
Results for assessment to the working stress design practice, 5-5B, are presented in Table 10.Examination of the results in this table shows a similar pattern to the results for 5-5A althoughthe largest utilisations are marginally lower than for 5-5A. The midspan to node results ratiosare similar to those for 5-5A with the largest variation amounting to 7%.
The North Sea Annex results are presented in Table 11. A comparison between the 5-5A andthe NSA results shows that the 100 year joint probability environmental loading specified in theNSA results in, on average, a 5% reduction in UR compared to the LRFD assessment procedureof 5-5A.
In the case of 5-5A and NSA, chord stress checks have been performed for a number ofvariations of the value of η, the exponent for biaxial bending.==In the case of 5-5A, η = 1 hasbeen used as the default value, resulting in a maximum UR of 1.86. By exploiting theinformation presented in the Commentary to 5-5A, a minimum value for η of 1.45 can be used.This leads to a reduced UR of 1.50. From the Recommended Practice, a procedure fordetermining a more accurate value for η is provided. Following this procedure leads to an ηvalue of 2.25, and a corresponding maximum UR of 1.27. A similar pattern of reducing UR isapparent when the NSA is used.
It is noted that values of η increasingly greater than unity lead to dramatic reductions inutilisation. For the present 5-5A case, increasing η from 1.0 to 2.25 leads to a reduction inutilisation from 1.86 to 1.27, equivalent to some 32%.
For the reinforced chord checks to 5-5B, using the yield value for the rack, which coincides withthe minimum section modulus, and following the instruction given in Figure 8.2 of 5-5B to

25
check the stress at the extreme rack fibre (ignoring the teeth) leads to a UR value of 1.74. Thecorresponding UR for the unreinforced chord is 0.74.
Clearly, the effects of η on the maximum UR are significant for those chord members subjectedto high bending moments. It is known that significant bending occurs in the leg sectionsparticularly close to the lower guides. Accurate determination of η is important since an under-estimation leads to an unnecessarily conservative utilisation ratio, whilst an over-estimationquickly leads to non-conservative utilisation ratios.
Table 12 presents the comparisons of maximum URs for each group of members. Examinationof the results of this table show that in general, the working stress design assessment procedureleads to UR some 10% lower than the LRFD assessment procedure.
6.4 LOAD FACTOR APPLICATION TO LOAD EFFECTS OR LOAD PATTERNS
In this context, load effects are defined as the internal member forces arising from the analysis.Load patterns are defined as load sets to be applied to the analysis. It is not clear from 5-5Awhether load factors are to be applied to load effects or load patterns. The impression is that thefactors are applied to load effects (reference Commentary to 5-5A Section C8.0.1). However,this contrary to normal LRFD practice and is considered incorrect. Significant differences in thedistribution of permanent, variable and environmental load effects can be expected whenunfactored load patterns are applied compared with when factored load patterns are applied tothe structural model. These differences are a direct result of the non-linearities in response.
The method of application of load factors was investigated during the early stages of the study,using environmental data valid at the time. During the course of the project, minor amendmentswere made to the environmental data. However, the comparison of load effects and loadpatterns was not repeated for the revised loading, since the principles and the conclusionsremain unchanged. Maximum member utilisation ratios for the comparison of application ofload factors to load effects and load patterns are presented in Table 13. This comparison wasmade for the case of assessment to 5-5A only, and for the condition where the lower guideswere adjacent to the chord midspan. One wave direction (30 degrees) was examined. Theresults clearly indicate a large variance between the two methods of load factor application.Load factors applied to load effects give member URs significantly lower than the case wherethe load factors are applied to the load patterns.
6.5 PRELOAD
The results of maximum URs are presented in Table 14. It is seen that the maximum URs areconsiderably lower than those obtained from storm load analysis, since there is little or noloading from the environment. Assessment to 5-5B was performed to the basic allowablestresses, without the one-third increase permitted when storm loading is considered.
6.6 OVERTURNING CHECK
Overturning moment checks were performed in accordance with each of the assessmentprocedures. The checks for 5-5A indicate that, after application of the appropriate load andresistance factors, the critical overturning moment exceeds the sum of the stabilising momentsby a factor of 1.93. The equivalent checks in accordance with NSA, result in a factor of 1.84.
For overturning stability, 5-5B states that the ratio of the sum of the stabilising moments to thesum of critical overturning moments must exceed 1.1. For direct comparison with 5-5A andNSA, the results of the WSD overturning check lead to a factor of 1.57.
26
6.7 FOUNDATION UTILISATION
6.7.1 General
The structural analysis of the 116C jack-up has been performed assuming moment fixity withelastic vertical and horizontal springs. According to Section 6 of 5-5A, such an analysis is notnecessary if a more simple pinned connection gave capacity and sliding utilisations, for theappropriate legs, of less than unity. For the purpose of this study, it is assumed that thisrequirement was not met and, consequently, Step 2b of the foundation analysis procedure isapplied, see Section 5.3.2.4.
Step 2b requires the following checks to be performed and shown to be satisfactory for thefoundation to be considered acceptable:• Bearing capacity check of the leeward leg;• Sliding check of the windward leg(s);• Yield surface check.
In this Section, reference is made to 5-5A and 5-5B. The NSA is not discussed separately sincethe code check requirements follow those of 5-5A in terms of the partial safety factors applied.However, it should be noted that the NSA does give slightly different loads to 5-5A (see Section3) and a more detailed procedure for performing such an assessment, including several items forconsideration that are not specified in 5-5A. For example, the location should be checked toensure that it is not prone to scour and thus the assumed fixity is assured. Such considerationsare considered to be beyond the scope of this study. The objective of the NSA is to supplementthe existing provisions of 5-5A with the revised provisions, which may alternatively be appliedto the North Sea jack-up assessments.6.7.2 Bearing Capacity Check of the Leeward Leg
The largest bearing capacity relates to maximising downward force from both the hull andenvironmental loads. From the structural analysis, the largest unfactored loads for a leeward legrelate to the maximum feasible hull weight combined with environmental loads coming from the0° direction, i.e. the bow leg is the leeward leg.
The unfactored (5-5B) and factored (5-5A) loads on the bow leg are as follows (note load factor= 1.25 for E + Dn loads in 5-5A code):
Horizontal loads 5-5B 5-5A Dead + Live Load HD+L = 0.112 MN = 0.112 MNEnvironmental + Inertial Load HE+Dn = 6.629 MN = 8.286 MN
Vertical loadsDead + Live Load VD+L = 30.10 MN = 30.10 MNEnvironmental + Inertial Load VE+Dn = 18.62 MN = 23.28 MN
Total loadsHorizontal Load QH = 6.741 MN = 8.426 MNVertical Load QV = 48.72 MN = 53.38 MNVector Load QVH = 49.18 MN = 54.03 MN
i.e. the Environmental + Inertial Load comprises around 37% of the total load and the vectorload QVH is around 10% larger in the 5-5A version of the code than in the 5-5B version.
From the soil data supplied by Shell(4), from the structural drawings and assuming a spudcanpenetration of 3m, the following variables are defined:
Soil = undrained clay type

27
Undrained cohesive shear stress Cu = 0.200 MPa Rotational + VerticalUndrained cohesive shear stress Cu = 0.060 MPa HorizontalIt is assumed that there is no variation of Cu with soil depth.
Mudline to max. spudcan bearing area D = 0.00 mEffective overburden pressure at depth D po' = 0.00 MPaEffective spudcan diameter B = 14.02 mCross-section area of bearing area in contact A = 154.38 m²Spudcan laterally projected effective area As = 14.38 m
Vector Cu based on load ratio V:H Cu = 0.18 MPa (both codes)Bearing capacity factor Nc = 5.14Bearing capacity shape factor sc = 1.19Bearing capacity depth factor dc = 1.00
Equations linking the vectorial capacity (FVH), the horizontal capacity (FH) and the verticalcapacity (FV), are as follows:
FVH = A.(Cu.Nc.sc.dc.(1-1.5FH*/(Nc.A.Cu)))FH = FH* +As(Cuo + Cul)FV = √(FVH
2-FH2)
But the ratio of FV to FH should be the same as that for QV to QH
Solving these formulations give the bearing capacity envelope presented in Figure 21. Thefollowing loads and capacities are specified on this figure:
Still water load SWL = 30.10 MN
5-5B Vectorial load QVH_5-5B = 48.72 MN5-5B Vectorial capacity FVH_5-5B = 146.8 MN5-5B Utilisation factor UFVH_5-5B = 0.332
5-5A Vectorial load QVH_5-5A = 53.38 MN5-5A Vectorial capacity FVH_5-5A = 121.5 MN5-5A Utilisation factor UFVH_5-5A = 0.439
Nb. The 5-5A resistance factor for foundation penetration sufficient to mobilise maximumbearing area ϕhfc = 0.85.
Consequently, for the maximum leeward leg bearing capacity, both the 5-5B and 5-5A codeshave utilisations less that 1.00.
Thus the ratio of the utilisation factors is: 5-5A(LRFD)/5-5B(WSD) = 0.439/0.332 = 32%. Thisis in-line with expectations for environmental load being around 40% of the total load, seeFigure 14.
6.7.3 Sliding Capacity Check of the Windward Leg(S)
The largest sliding capacity relates to minimising the downward force from the hull andmaximising uplift on the leg due to environmental loads. These vertical loads should becombined with the maximum horizontal load due to environmental conditions. From thestructural analysis, the largest unfactored loads for a windward leg relate to the environmentalloads coming from the 60° direction, i.e. the starboard leg is the windward leg.
The unfactored (5-5B) and factored (5-5A) loads on the bow leg are as follows:

28
Horizontal loads 5-5B 5-5A Environmental + Inertial Load HE+Dn = 7.812 MN = 9.765 MN
Vertical loadsDead + Live Load VD+L = 27.22 MN = 27.22 MNEnvironmental + Inertial Load VE+Dn = -27.03 MN = -33.78 MN
Total loads (note load factor = 1.25 for E + Dn loads in 5-5A code)Horizontal Load QH = 7.812 MN = 9.765 MNVertical Load QV = 0.190 MN = -6.568 MNVector Load QVH = 7.814 MN = 11.768 MN
i.e. the Environmental + Inertial Load comprises over -50% of the total load, therefore there isan overall uplift on the starboard windward leg for this loadcase. This is particularly significantfor the 5-5A code where the 25% increase in environmental load leads to a 650% larger uplift,QV , than the 5-5B version.
It should be noted that uplift on this leg for this loadcase would lead to a failure in the jack-upoverturning moment (OTM) check. Consequently, under such circumstances, the foundationcheck would not be undertaken.
The key variables are as for the capacity check above with:Vector Cu based on load ratio V:H Cu = 0.063 MPa (5-5B)Vector Cu based on load ratio V:H Cu = 0.116 MPa (5-5A)
Effective overburden pressure due to back-flow F0' = 0.00 MPaSubmerged unit weight of soil g' = 0.01 MPa (Assumed)Volume of soil displaced V = 94.40 m3
The horizontal sliding capacity is given by:FH = A.Cul +As(Cuo + Cul)
On this basis:FH = 11.60 MN for Cu = 0.063 MPa (5-5B)FH = 21.30 MN for Cu = 0.116 MPa (5-5A)
The Go-By document associated with Bulletin 5-5A, includes limits for the application of theabove formula based on values of FVH and Qu (this may be a mis-typing of Qv). However, thedocument then applies a different range of applicability in the described example. No referenceto this limit is made in Section 6 of either 5-5A or 5-5B. The results of this analysis should betreated with caution as the starboard leg is described to be in a state of uplift while significanthorizontal force is applied to the leg.
Overall, including the 5-5A resistance factor for foundation sliding in undrained clay soil ϕfc =0.64, the utilisation factors due to sliding are as follows.
5-5B Horizontal load QH_5-5B = 7.812 MN5-5B Horizontal capacity FH_5-5B = 11.60 MN5-5B Utilisation factor UFH_5-5B = 0.674
5-5A Horizontal load QH_5-5A = 9.765 MN5-5A Horizontal capacity FH_5-5A = 13.63 MN5-5A Utilisation factor UFH_5-5A = 0.716
Consequently, for the maximum leeward leg bearing capacity, both the 5-5B and 5-5A codeshave utilisations less that 1.00. The 5-5A code has a utilisation factor 0.861/0.696 = 6% largerthan the 5-5B code. This value is less than predicted for an environmental load of around –50%of the total load, due the different values of undrained cohesive shear strength (Cu) that were

29
adopted. This was not expected to vary between the analyses and only does so due to havingdifferent values in the Shell soil report for the vertical and horizontal directions.
6.7.4 Yield Surface Check
The yield surface check is based on an iterative procedure that considers the combinations ofvertical, horizontal and overturning moment forces at each spudcan. These force combinations,factored in the 5-5A version of the code, are compared to the yield surface as determined fromthe yield interaction equation given in Section 6.3.4 of the SNAME Bulletins.
For extreme wave analyses it is anticipated that the forces will lie outside the yield surface andthis will require repeated analyses at reduced rotational stiffness. Failure of any spudcan isindicated if the moment is reduced to zero, yet the force combination still lies outside the yieldsurface.
Further loadcases will need to be analysed to determine preload forces and yield interactionforces, prior to performing the iterative assessment of the yield surface. Initial indicationssuggest that the difference between the forces determined from the 5-5B and 5-5A versions ofthe code will be minimal. In addition, it does not appear that any resistance factors are appliedto the capacities FVHM, FHM and FM, employed in the assessment.
Consequently, it is considered that there will be minimal difference between the 5-5A and 5-5Bversions of the jack-up codes for the yield surface check.
6.7.5 Conclusions
For the 116C jack-up, foundation checks have been performed under extreme wave loadingconditions, in accordance with Bulletin 5-5A and 5-5B. The North Sea Annex to Bulletin 5-5Afollows that for the main Bulletin, with some further aspects of the design to be considered.These additional items, such as the possibility of scour, do not affect the basic code checksrequired.
For the maximum 50-year wave loading on the jack-up, it was shown that the bearing capacityof the leeward leg was satisfactory to meet the maximum design loads. The utilisation of theleeward (Bow) leg being less than 50% irrespective of the code used. However, as previouslyestimated in Section 5.3.2.3 of this report, the 5-5A code yields a utilisation factor 32% largerthan for the equivalent 5-5B code, based on the environmental load contributing around 40% ofthe total load. The bearing capacity envelope has been described and the load and resistancevalues plotted accordingly, see Figure 21.
The sliding check on the windward (starboard) leg gave higher utilisations than the bearingcheck for the maximum wave loading combined with minimum hull weight. In fact, for bothfactored and unfactored loads, the uplift on the leg due to environmental loads exceeds thestructural weight contribution on this leg. It should be noted that a foundation check would notnormally be performed in such a case where there is uplift on a leg and the overturning momentcheck indicates a significant over-utilisation. Therefore, concern is expressed as to the validityof the quoted formulae and utilisations quoted for this scenario. The 5-5A code gave autilisation around 6% larger than the equivalent utilisation from the 5-5B code. This differencebeing less than previously anticipated (see Section 5.3.2.2), due to a significant variation in thevalue of the undrained cohesive shear strength (Cu) that was applied to each assessment. Thisparameter was not expected to vary between the codes and does so due to having significantlydifferent horizontal and vertical components according to the supplied data from Shell.
A full yield surface check was not performed in this study. This check requires an iterativeassessment of all spudcans to be performed and the combined vertical, horizontal andoverturning moment forces to be compared to the yield surface. The rotational stiffness of eachspudcan was adjusted following each iteration. It is anticipated that the 5-5A and 5-5B versions

30
of the code will give identical yield surfaces, with only slightly increased loads for the 5-5Aversion of the code.
6.8 SUMMARY OF RESULTS
A summary of results for the assessments conducted in accordance with 5-5A, 5-5B and theNSA is presented in Table 15. For the chord stress checks, these have been expanded toinclude, in the case of 5-5A and NSA, more appropriate values of η and, in the case of 5-5B,other interpretations of how and where stress checks have been performed.
In the case of 5-5A, η = 1 has been used as the default value. By exploiting the informationpresented in the Commentary to 5-5A, a minimum value for η of 1.45 can be used. From theRP, a procedure for determining a more accurate value for η is provided. Following thisprocedure leads to an η value of 2.25. The corresponding reductions in utilisation are listed forboth 5-5A and NSA. Values of η increasingly greater than unity lead to dramatic reductions inutilisation. For the present 5-5A case, increasing η from 1.0 to 2.25 leads to a reduction inutilisation from 1.86 to 1.27, equivalent to some 32%. Similar improvements occur with theNSA.
For 5-5B, using the yield value for the rack, which coincides with the minimum sectionmodulus, and following the instruction given in Figure 8.2 of 5-5B to check the stress at theextreme rack fibre (ignoring the teeth) leads to the listed value of 1.74.=

31
7. COMPARISON OF 5-5A AND 5-5B ALLOWABLE STRESSESAND IMPLIED SAFETY FACTORS
7.1 BASIS OF COMPARISON
The strength formulations provided in 5-5A and 5-5B have been compared on a one-to-onebasis covering axial compression alone, bending alone and combined axial compression andbending. The comparisons are presented and discussed in the following sub-sections. Thecomparisons are conducted accounting for all appropriate factors, ie, load and resistance factorsin the case of 5-5A and the one-third increase in the case of 5-5B. Where equation numbers aregiven in 5-5A and 5-5B, these are repeated here.
7.2 AXIAL COMPRESSION
7.2.1 5-5A Tubular sections
Sections in compression are assumed on a cross-sectional basis to be compact, noncompact orslender. Compact and noncompact sections are subject to the same cross-sectional slendernesscriteria and their compressive strength is defined similarly.
For tubular sections, the limit on slenderness (R/t) for compact and noncompact sections is11380/Fy, ie, D/t ≤ 22,760/Fy. The upper applicable limit for slender tubulars is R/t < 44,815/Fy,ie, D/t <89,630/Fy.
For 5-5A, the equations used to determine overall axial compressive (column) strength are thosedenoted A-B5-11 and A-B5-13, ie,
Fcr = Q (0.658Qλc²) Fyeff for λc √Q ≤ 1.5 [Eq. A-B5-11]
Fcr = Q (0.877/λc²) Fyeff for λc √Q > 1.5 [Eq. A-B5-13]
where λc = (Kl/rπ) √(Fyeff /E)
K = effective length factor taken as 1.0 for rack chord members and 0.8 for K-bracesand span breakers
l = unbraced lengthr = radius of gyrationFyeff = smaller of minimum specified yield stress or 5/6 of ultimate tensile strengthE = elastic modulus for which the recommended value is 200,000 MPa
and where Q is determined according to the slenderness of the cross-section and, for a tubular,takes the values
Q = 1 for R/t ≤ 11,375/Fy
= 3790/[Fy (R/t)] + 2/3 for 11,375/Fy < R/t < 44,815/Fy [A-B5-9]
in which R is the outer radius of the tubular and t the tubular wall thickness.
7.2.2 5-5A Prismatic sections
For prismatic sections, the slenderness limits are defined by the width to thickness ratio b/t ofthe rectangular element under consideration and whether the element is supported on one or twoedges, ie, along the sides of the element parallel to the direction of the stress. The following

32
summarises the criteria for these two types of elements in which Fr is defined as residual stressfor which a value of 114 MPa is to be assumed.
b/t slenderness limits for rectangular elements of prismatic sections
Slenderness range Stiffened along two edges Stiffened along one edgeCompact and Noncompact 625/√(Fy - Fr) 250/√Fy
Fr = residual stress to be taken as 114 MPa
The source of the residual stress is presumably welding and its effects are independent of thethickness of the welded elements or of the size of the weld. Although these limits are exactly inline with those given in the source document, AISC LRFD, the basis and application here isquestioned on several fronts. Firstly, as the level of residual stress increases, so does the b/tlimit. Effectively then, as more welding is applied to an element, the more robust it becomesbecause where it might have been classified as slender it can, after more welding, be describedas noncompact. This is contrary to the behaviour of plate panels subjected to welding in thattheir stiffness when compressed decreases roughly in proportion to the amount of welding andthey may also suffer a loss in strength. Secondly, the level of welding residual stress isindependent of the size of the weld and of the thickness of the welded elements. The magnitudeof welding residual stresses demonstrates an almost linear relationship with the weld size whichis often a function of the thicknesses of the elements being welded but not necessarily.
In AISC LRFD, for elements stiffened on two edges, cover plates are included in thedescription. It would be helpful if the same description was included in 5-5A so that the platesused to reinforce at least two main elements of typical chords which are the side plates and racksof tear drop chord sections were clearly included. Admittedly, cover plates in AISC LRFDterms are normally applied to flanges. For rack chords, in 5-5A parlance, they are applied towebs. Nevertheless, they serve the same function in relation to webs as cover plates do toflanges.
In the case of rack chord sections, Q for use in [Eq. A-B5-11] and [Eq. A-B5-13] is taken asunity for compact and noncompact cross-sections or determined in accordance with 5-5Aclauses 8.1.4.3 b) i) or ii) for slender cross-sections.
For use in the axial -bending interaction equation, the above stresses are converted to forces (Pn)by simple multiplication by the cross-sectional area A.
7.2.3 5-5B Tubular sections
The definitions on cross-sectional slenderness in 5-5B follow the general lines of 5-5A in thatcompact and noncompact sections are dealt with via the same set of equations and only slendersections receive independent treatment.
For tubular sections, the R/t limit for compact and noncompact sections based on AISC LRFD is11,380/Fy, ie, D/t ≤ 22,760/Fy. For a yield stress of 587 MPa, the R/t = 19.4, ie, D/t = 38.8.However, the succeeding compressive strength formulations for tubulars are based on API RP2A-WSD for which the corresponding R/t ratio is 30 (and not 120 as printed), ie, D/t = 60. Thismajor difference between the AISC LRFD and AP RP-2A limitations is a consequence of APRP-2A retaining a formula for tubular local buckling compressive strength that is not properlynon-dimensionalised. The equation (API 3.2.2-4) is given below from which it is seen that thecontrolling parameter is D/t. It should at least be FyD/Et as adopted in the corresponding APRP-2A formulation for bending or, more generally, Fy/Fxe where Fxe is the local elastic bucklingcriterion for tubular sections.
In the following table, a comparison is presented between the 5-5A and 5-5B slendernesslimitations indicating, in the case of 5-5B, the source of the two sets of limitations.

33
Comparison of 5-5A and 5-5B D/t slenderness limits fortubular sections for a yield stress of 587 MPa
5-5BSlenderness range 5-5A AISC LRFD API RP 2ACompact & Noncompact 38.8 38.8 60
For 5-5B, the equations used to determine overall axial compressive (column) strength are thosedenoted [E2-1] and [E2-2], ie,
[E2-1]
[E2-2]where Cc = √(2π² E/Fye)
K = effective length factor taken as 1.0 for rack chord members and 0.8 for K-bracesand span breakers
l = unbraced lengthr = radius of gyrationFye = smaller of minimum specified yield stress Fy or 5/6 of ultimate tensile strengthE = elastic modulus for which the recommended value is 200,000 MPa.
In the case of tubulars, Fye is the smallest of the values of the nominal yield stress, the elasticlocal buckling stress Fxe or the inelastic local buckling stress Fxc. The buckling stresses aredefined as follows:
Fxe = 2CE t/D for D/t ≤ 60 (API 3.2.2-3)
Fxc = Fy for D/t ≤ 60(API 3.2.2-4)
= Fy [1.64 - 0.23 (D/t)1/4] for D/t > 60
where D = outer diametert = tubular wall thicknessC = elastic critical buckling coefficient for which a value of 0.3 is recommended to
consequences of initial geometric deformations that lie within the limitsspecified in API RP 2B.
These definitions for tubular sections apply across the range of cross-sectional slenderness,namely, compact, noncompact and slender.
7.2.4 5-5B Prismatic sections
The criteria on cross-sectional slenderness are tabulated below.
b/t slenderness limits for rectangular elements of prismatic sections
Slenderness range Stiffened along two edges Stiffened along one edgeCompact and Noncompact 625/√Fy 250/√Fy
c
cc
yec
a CrKlfor
CrKl
CrKl
FC
rKl
F ≤−+
���
�−
= /
8)/(
8/3
35
2)/(1
3
3
2
2
c2
2
a Cr/Klfor)r/Kl(23
E12F >π
=

34
These are compared below with the corresponding criteria in 5-5A for a yield stress of 460 MParemembering that for 5-5A for elements supported on two edges a residual stress of 114 MPa isrelevant.
Comparison of 5-5A and 5-5B b/t slenderness limits for rectangular elementsof prismatic sections for a yield stress of 460 MPa
Stiffened along two edges Stiffened along one edgeSlenderness range5-5A 5-5B 5-5A 5-5B
Compact & noncompact 33.6 29.1 11.7 11.7
As noted above, the presence of residual stresses allows more slender elements to be treated ascompact than is otherwise the case.
Compact and noncompact prismatic members are designed for overall compression using thesame equations as for tubular sections, ie, [E2-1] and [E2-2]. No specific information isprovided for prismatic members comprised of slender elements. For elements subjected tobending, the recommendation is not to use such sections. [The wording of the relevant text -Section 8.1.4.6c) - does not in fact say this but it appears to be the intent of the text.]
7.3 BENDING
7.3.1 5-5A Tubular sections
Sections in bending are assumed on a cross-sectional basis to be compact, noncompact orslender.
Compact sections are permitted to reach their full plastic moment capacity. For tubularsections, this requires the D/t ratio to be less than 14,270/Fy. [Note that the printed equation forthe limit λp is incorrect, the “≤” sign should be replaced by “=”. This same error also appears inthe Imperial version of the equation, in the Note to 8.1.4.6 a), and in the equivalent equation fornoncompact section 8.1.4.6 b), both in the SI and Imperial versions.] In the present work, fullplastic moment capacity has been determined using the expression:
Mp = Fy [D3 - (D - 2t)3]/6
The approximation Fy D2t gives very similar results provided D is taken as the mean diameter ofthe tubular.
Noncompact sections are allowed to reach yield but not the full plastic moment capacity.Tubulars with D/t ratios up to 61,850/Fy but beyond the compact limit are defined asnoncompact. The equation defining the moment capacity of noncompact sections is
Mn = {2068/(R/t) + Fy} S
where S is the elastic section modulus.
Note that the equation as printed is defined as Mr, ie, the noncompact section limiting bucklingmoment which, by implication is inserted into [Eq. A-F1.3] which is
[Eq. A-F1.3]
���
��
���
−−
−−=pr
prppn MMMM
λλλλ
)(

35
in which λ defines the slenderness of the element. For tubulars, λ = 2R/t; the definition of λ forrectangular elements is discussed below. This substitution is to determine Mn on a proportionalbasis between Mp and Mr. However, in the case of tubulars, this is incorrect as a check with thesource document AISC LRFD Table A-F1.1 note (f) confirms. Figure 22 plots the correctmoment capacity versus the incorrect one from which it can be seen that, fortunately, the error isnot that significant. The maximum error is 9.1% when D/t = 60. There is no discrepancy in therange D/t less than λp. when the fully plastic moment capacity prevails.
For slender sections, the moment capacity is limited by the local buckling stress of thecompressed ‘face’ of the tubular. This is given by
Fcr = 33,610/(R/t) MPa
exactly as in AISC LRFD. The moment capacity is found by multiplying this expression by thesection modulus of the tubular. That this equation provides a smooth transition with thenoncompact criterion can be appreciated from Figure 22 where the plots can be seen to extendbeyond λr
7.3.2 5-5A Prismatic sections
Compact and noncompact sections are expected to satisfy a lateral torsional buckling criterion.If they do not, they are classified as slender.
For prismatic sections, the slenderness limits are defined by the width to thickness ratio (b/t = λ)of the rectangular element under consideration and whether the element is supported on one ortwo edges, ie, along the sides of the element parallel to the direction of the stress. The followingsummarises the criteria for these two types of elements in which Fyw is defined as the yieldstress of the web.
b/t slenderness limits for rectangular elements of prismatic sections
Slenderness range Stiffened along two edges Stiffened along one edgeCompact λp 500/√Fy 170/√Fy
Noncompact λr 625/√(Fy - Fr) 278/√(Fyw - Fr)Fr = residual stress to be taken as 114 MPa
Two aspects about these limits are immediately apparent. Firstly, the slenderness limits fornoncompact sections are a function of the level of residual stress present. Secondly, thecriterion for noncompactness for the element stiffened along one edge is a function of the yieldstress of the web.
The first of these issues was addressed earlier. In relation to the criterion for noncompactnessfor the element stiffened along one edge, which is a function of the yield stress of the web, thiswas implemented in AISC LRFD for application to flanges of hybrid girders. Hybrid girdersare girders constructed with webs of lower yield stress than that of the flange. The reason forthe criterion being developed as a function of the yield stress of the web, although the elementunder consideration is a flange element, is that the restraint being sought is a rotational restraintof the flange. This is to inhibit local torsional buckling of the flange with respect to its line ofconnection to the web. It is the properties of the web that control this degree of restraint so it isthe value of web yield stress that is of relevance as far as the criterion is concerned.
In the context of tear drop chords, both the rack and the side plates are described as webs (see 5-5A Section 8.1.4.6 Check: Local buckling). In this application, it is clear which yield stress isof relevance provided one knows the reason for the selection of the yield stress in the first place.However, for a designer not necessarily fully conversant with local buckling requirements, itmay not be obvious which value to choose.

36
The preceding discussion has been confined to major axis bending in respect of the rack and theside plates being identified as webs. For minor axis bending, however, these elementseffectively become ‘flanges’ and the back plates ‘webs’. As far as the rack is concerned, theyield stress of the back plates is the relevant value of yield stress to insert in the equation underdiscussion. Such a selection is unlikely to arise from the definitions currently extant in 5-5A.The criterion needs to be rewritten in a form that refers to any element supported on one edge asthe choice of the yield stress being the lower of the two connected elements.
However, even more care is required in rewriting such a criterion. Consider the back plate of atear drop chord under major axis bending. The back plate has two (albeit small) outstandswhich, by definition, are elements that are supported on one edge. If the yield stress of the sideplates is smaller than that of the back plate, the yield stress of the side plate would not be thevalue to insert in this criterion. The reason for this is that the back plate extends beyond the sideplate with a thickness equal to that of the outstand. The restraint on local torsional buckling iscontrolled by the stiffness of all the elements restraining the outstand. Even for a very weakside plate, the middle portion of the back plate will restrain the outstand so that the yield stressof the side plate is of no relevance in the context of this criterion.
As an element, the back plate serves to highlight major weaknesses in the definitions providedfor local buckling checks in 5-5A. This can be traced back to the source document AISC LRFDwhich does not deal at all with an element created by extending an element supported on twoedges beyond the line of the supports. These ‘cantilever’ elements are potentially likely tosuffer the same type of local torsional buckling as flanges of I and channel sections. However,the rotational restraint provided via the internal section of the base plate and the connection tothe side plate is substantially stiffer than that provided by traditional webs to the flanges of I andchannel sections. Thus, these cantilever elements of the tear drop chord can be subject to morerelaxed requirements than the flanges of I and channel sections.
Some of the problems with the above definitions on element slenderness become more apparentwhen the equations for determining the moment capacity of noncompact sections areconsidered. These have been extracted directly from AISC LRFD and allow for both major axisand minor axis bending. The equations are as follows:
major axis bending:
Mr = (Fywj - Fr) S (flange buckling)
Mr = Re Fyfj S (web buckling)
minor axis bending:
Mr = Fyfj S (flange buckling)
where S = minimum section modulus for the plane under considerationMr = limiting buckling moment of the sectionFywj = web component yield stressFr = residual stress (to be taken as 114 MPa)Re = a hybrid girder reduction factorFyf = flange component yield stress
These equations have been extracted directly from AISC LRFD in which they are designated asappropriate for channels and doubly and singly symmetric hybrid I girders subjected to majoraxis bending or channels and doubly symmetric I girders subjected to minor axis bending.Almost by definition, they do not apply to tear drop chords but, of more relevance, is theinappropriateness of applying them to such sections for the following reasons:

37
i) under major axis bending, with the rack (a web) in compression, what value of Fyfjshould be used when considering the rack
ii) under major axis bending, with the rack in tension, is the rack to be checked for possibletension yield when ‘flange buckling’ of the back plate is being addressed. Forasymmetric sections such as the tear drop chord, the neutral axis is normally closer tothe back plate than to the rack. The longer lever arm to the extreme fibre of the rackcompared with that applicable to the back plate generates higher stresses in the rackthan in the back plate. Thus, it is possible for yield of the rack to precede buckling ofthe back plate. Of course, the back plate may not in fact be undergoing flange buckling,it may be compact enough to yield before buckling in which case tensile yielding of therack could clearly occur. On the other hand, the definition for S, the section modulus, isas the “minimum” for the “plane of bending under consideration”. This tends to ensurethe design is safe but it may be unnecessarily conservative as the following resultsindicate.
For the reinforced chord section of the 116C, the elastic moduli for major axis bendingare:
rack chord: 1.395 x 107 mm3
back plate: 2.000 x 107 mm3
The minimum value of S is therefore 1.395 x 107 mm3.
Effective yield stresses are, based on the minimum of the nominal value of yield stressand 5/6 times the ultimate tensile strength,
rack chord: 574.2 MPaback and side plates: 460.0 MPa.
Substituting into the major axis bending flange buckling criteria above in which Fr =114 MPa gives for the back plate
Mr = (460.0 - 114) 1.395 x 107 = 4.827 x 10⁹ Nmm.
By inspection, this is the smallest Mr that will be determined because the back plate isthe only ‘flange’ element, the yield stresses everywhere else are at the same as that ofthe back plate or greater, and Re can be taken as unity.
However, if the moment capacity of the section was to be more rationally determined,the following set of calculations would be conducted.
For the back plate, flange buckling governs, so using the relevant back plate properties
Mr = (460.0 - 114) 2.000 x 107 = 6.920 x 10⁹ Nmm.
For the rack, only web buckling is applicable for which, according to the abovecriterion, a flange yield stress should be used. No flange is attached to the rack toinhibit local torsional buckling but the side plates serve the same purpose. The yieldstress of the side plates should thus be used in the equation so that
Mr = 460.0 x 1.395 x 107 = 6.417 x 10⁹ Nmm.
The lesser of these is the latter, ie, 6.417 x 10⁹ Nmm, which can now be compareddirectly with the moment capacity determined above in accordance with the 5-5Aprovisions of 4.827 x 10⁹ Nmm. This has resulted in an under-estimate of the correctvalue of Mr of the rack chord of some 33%. This is significant but its impact on the

38
flexural capacity of the chord Mn will be reduced because the slenderness of the chordelements are not at their limit λr for which Mr is only applicable. Nevertheless, theresult reflects a serious weakness in the calculation procedure implicit in the 5-5Amethodology.
The flexural capacity of slender prismatic cross-sections is determined via equations extracteddirectly from AISC LRFD. However, these appear to only apply to channels and doubly andsingly symmetric I-shaped beams subjected to major axis bending and to channels and doublysymmetric I-shaped beams subjected to minor axis bending. This does not seem to include T-sections which, from the perspective of the rack of a tear drop chord, the chord section mostclosely resembles. This issue is being promoted for further discussion and needs to beconsidered in more detail.
7.3.3 5-5B Tubular sections
The requirements given in the WSD broadly follow those of 5-5A but they differ in detail.
For tubular sections, the cross-sectional slenderness limits are 2R/t ≤ 10,300/Fy for compactsections and 2R/t ≤ 300 for noncompact sections. The following table compares the two sets ofrequirements for a yield stress of 587 MPa.
Comparison of 5-5A and 5-5B D/t slenderness limits fortubular sections for a yield stress of 587 MPa
Slenderness range 5-5A 5-5BCompact 24.3 17.5
Noncompact 105.4 300
The limits on slenderness differ significantly between the two sets of requirements although thaton compactness may be of more relevance.
In 5-5B, the bending capacity of sections is expressed in terms of stresses rather than in terms ofmoments as adopted in 5-5A. Stresses are to be preferred since they are independent ofsectional dimensions. For compact sections, bending stress is limited to 0.75 Fy. Fornoncompact sections, the bending stress is defined by a bilinear relationship involving a non-dimensional cross-sectional slenderness parameter Fy D/Et as follows:
2R/t ≤ 20,680/Fy
Fb = [0.84 - 1.74 Fy D/Et] Fy
2R/t ≤ 300
Fb = [0.72 - 0.58 Fy D/Et] Fy
These have been extracted directly from API RP 2A-WSD.
7.3.4 5-5B Prismatic sections
The cross-sectional slenderness limits for rectangular elements are:
b/t slenderness limits for rectangular elements of prismatic sections
Slenderness range Stiffened along two edges Stiffened along one edgeCompact λp 500/√Fy 170/√Fy*
Noncompact λr 625/√Fy 249/√Fyw* the printed version is 65/√Fy exactly as for the Imperial version and thus needs correction

39
These are identical to the 5-5A requirements in respect of compact elements but differ in respectof the noncompact elements mainly through the omission of the residual stress term. Thecriterion for noncompactness for elements stiffened along one edge is, as in 5-5A, expressed interms of the yield stress of the web. This is, as discussed above, not appropriate.
The following table compares the two sets of requirements for a yield stress of 460 MPa.
Comparison of 5-5A and 5-5B b/t slenderness limits for rectangular elementsof prismatic sections for a yield stress of 460 MPa
Stiffened along two edges Stiffened along one edgeSlenderness range5-5A 5-5B 5-5A 5-5B
Compact 23.3 23.3 7.9 7.9Noncompact 33.6 29.1 14.9 11.6
As noted above, the requirements are identical in respect of slenderness limits for compactelements but the 5-5A requirements for noncompactness are more relaxed than those of 5-5B.
For both major and minor axis bending, the stress limits are:
compact sections: Fb = 0.66 Fy
noncompact sections: Fb = 0.6 Fy
In determining the moment capacity of sections including hybrid sections, 5-5B requires“standard techniques shall be applied to obtain a section modulus based on individualcomponents”. A little more direction is needed here because, although no reference is madehere to Figure 8.2 which contains directions as to the “stress points to be checked”, thesedirections are inadequate except for cross-sections composed of one material. If the side platesin Figure 8.2 are of lower yield stress than that of the rack, in principle it is necessary to checkthe stress in the side plate at the point of its connection to the rack.
This more fundamental approach adopted in 5-5B for the determination of relevant bendingsection properties is preferred to that of 5-5A. 5-5A applies formulae developed for channel andI-section girders (including hybrid girders) to cross-sections for which their application at leastneeds confirmation and seems to do so, as discussed above, unnecessarily conservatively.
7.4 COMBINED COMPRESSION AND BENDING
7.4.1 Tubular sections
The interaction equations between axial compression (and tension) and bending in 5-5A are
for Pu/φaPn > 0.2
[Eq. H1-1a]
else
0.198
1
≤�
��
�
�
�
���
��
�
+��
�
+ηηη
φφφ nyb
uey
nxb
uex
na
u
MM
MM
PP

40
[Eq. H1-1b]
where Pu = applied axial load (this is found under factored loading conditions)Muex, Muey = effective bending moments in the x, y planes to be determined in
accordance with 5-5A Section 8.1.4.4 (for tension) and 8.1.4.5 (forcompression) (these are found under factored loading conditions)
φa = axial load resistance factor = 0.85 for compression and 0.90 for tensionφb = bending resistance factor = 0.90η = exponent for biaxial bending dependent upon the cross-section geometry
and taking the following values:i) for tubulars η = 2.0ii) for doubly symmetric open sections η = 1.0iii) for all other geometries η to be determined in accordance with
the analysis described in 5-5A Section 8.1.4.7 but 1.0. In lieuof an analysis, η = 1.0 may be used.
The methods by which the effective bending moments are determined (Section 8.1.4.4 fortension and 8.1.4.5 for compression) depend upon the sophistication of the structural analysis.If it is linear, then allowance needs to be made for second-order non-linear (P-∆) effects, bothglobal and local, and for the local loading of tubular members. These allowances are wellestablished in structural codes for local P-∆ effects and local loading effects. However, they areless well known in relation to global P-∆ effects. Provided both non-linear and local lateralloading aspects are included in the structural analysis, the moments determined from theanalysis can be used directly.
The above equations are based on the equivalent equations in AISC LRFD generalised throughthe use of the η exponent to deal, through the same equation, with the different ways bendingmoments in different types of structural cross-sections are combined. The η exponent methodappears to be effective although the present authors have not had sufficient experience in, forexample, determining values of η in accordance with the procedure given in 5-5A Section8.1.4.7.
To effect comparisons between requirements for tubulars subjected to bending, there is no needto consider biaxial moment loading because the same result is realised whether the moments arecombined before insertion into uniaxial versions of the above equations or directly into theequations as presented.
The interaction equations between axial compression and bending in 5-5B are
(3.3.1-1)
(3.3.1-2)
0.1M
MM
MP2
P1
nyb
uey
nxb
uex
na
u ≤�
��
�
�
�
���
��
�
φ+�
�
�
φ+
φ
ηηη
0.1F
Ff
1
ffC
Ff
b'e
a
2by
2bxm
a
a ≤�
��
�
�−
++
0.16.0
22
≤+
+b
bybx
y
a
Fff
Ff

41
When fa/Fa ≤ 0.15, the above equations may be replaced by
(3.3.1-3)
If different Cm and Fe’ values apply in the x and y planes, then (3.3.1-1) has to be modified to
(3.3.1-4)
5-5B notes in Section 8.1.4.1b that when “local element P-Delta effects” (it is assumed it ismeant to say global) are included in a structural analysis of an entire jack-up, the Eulermodifications in the above equations may be taken as unity for chord elements only. Further,that if the local P-∆ effects are included in the local member response, the Euler amplificationmay be set to unity for the corresponding members. No advice is given as to how to treat Cm.For the present assessment, in keeping with 5-5A, Cm has been taken as unity when applying theabove 5-5B equations.
Figure 23 presents a comparison between the 5-5A and 5-5B requirements for the axialcompressive stress capacities for tubulars as a function of length to diameter (L/D) ratio whensubjected to purely environmental loading conditions. These capacities are, in the case of 5-5A,the loads before the load factors are applied whilst, in the case of 5-5B, they include the one-third increase in allowable stresses permitted in the presence of environmental loading. For 5-5A, the load factor was taken as 1.25. The D/t of the plotted tubular is 12.8 and its effectiveyield stress Fye is 574.2 MPa, the minimum of the nominal value of yield stress of 587 MPa and5/6 of the ultimate tensile strength of 689 MPa.
The range of L/Ds included in the figure encompasses those values relevant for tubularmembers of the legs of the 116C. These are indicated in the figure covering the horizontal anddiagonal braces and the span breakers. The corresponding L/D values are 13.0 for thehorizontals, 16.8 for the diagonals and 26.2 for the span breakers. In keeping with therecommendations of both sets of requirements, an effective length factor K of 0.8 was used inall cases. The 5-5B requirements can be seen to provide significantly enhanced capacitythroughout the L/D range. In the case of the 116C components, the differences are 14% for thehorizontals, 15% for the diagonals and 19% for the span breakers. This can be appreciated inmore detail through an examination of the equations in question.
Consider a 116C diagonal 324 mm φ x 19.1 mm wall thickness spanning 5443 mm having anominal value of yield stress of 587 MPa and an ultimate tensile strength of 689 MPa. The L/Dis 16.8, the D/t is 17.0, and the effective yield stress Fye is 574.2 MPa. For a K of 0.8, the valueof λc in 5-5A is 0.688. The value of Cc in 5-5B is 82.9 which can be found by exploiting therelationship between the slenderness terms used in the two sets of requirements which can beshown to be λc/√2 = (Kl/r)/Cc.
From a cross-sectional slenderness viewpoint, the section is compact so that for 5-5A Q = 1.From [Eq. A-B5-11], Fcr = 0.820 Fye which, after introducing a load factor of 1.25 and aresistance factor of 0.85, leads to a compressive capacity of (0.85/1.25) 0.820 Fye = 0.558 Fye.
0.122
≤+
+b
bybx
a
a
Fff
Ff
0.1F
Ff
1
fC
Ff
1
fC
Ff
b
2
'ye
a
bymy
2
'ex
a
bxmx
a
a ≤
�
�����
�
�
−+
������
�����
�
�
−
+

42
For 5-5B, from equation [E2-1], the basic strength is 0.882 Fye (from the numerator) whilst thesafety factor (the denominator) is 1.834. Allowing for the one-third increase underenvironmental loading conditions, the compressive capacity is (4/3) 0.882 Fye/1.834 = 0.641 Fye.
The ratio of 5-5B to 5-5A compressive capacities is 0.641/0.558 = 1.15 which coincides withthe value found above from Figure 23. From these results, it is seen that the source of thedifference is as follows:
• basic strength curve 5-5B to 5-5A is 0.882/0.820 = 1.076• load and resistance factors 5-5B to 5-5A is [(4/3)/1.834]/[0.85/1.25] = [1/1.376]/[1/1.474] =
1.069.
Figure 24 presents a comparison between the 5-5A and 5-5B requirements for the bendingcapacities for tubulars as a function of diameter to thickness ratio (D/t) ratio when subjected topurely environmental loading conditions. The range of D/ts included in the figure encompassesthose values relevant for tubular members of the legs of the 116C plus a value of 40 forcomparison purposes.. The 116C D/ts are indicated in the figure, the corresponding valuesbeing 12.8 and 17.0 for the diagonals, 17.0 for the horizontals and 24.2 for the span breakers.For this loading condition, the two sets of requirements lead to very similar results although5-5B is seen to be marginally bigger than 5-5A.
The origin of the differences can be found through examination of the diagonal consideredabove when subjected to pure bending under environmental loading conditions. The section iscompact in accordance with both sets of requirements. For 5-5A, the section can achieve fullplastic moment capacity, ie, Mn = Z Fye where Z is the plastic section modulus. Introducing therelevant load and resistance factors, the unfactored moment capacity = (0.9/1.25) ZFye.Converting this to an equivalent stress by dividing by the elastic section modulus S gives(0.9/1.25) (Z/S) Fye. For this section, Z/S = 1.349 so that the allowable equivalent bendingstress = 0.971 Fye.
For 5-5B, the basic allowable bending stress = 0.75 Fye which can be increased by one-third inthe presence of environmental loading conditions. The allowable bending stress is thus Fye.Both this and the corresponding 5-5A value are seen to coincide with the values plotted inFigure 24 given the effective yield stress is 574.2 MPa. The source of the difference betweenthe pair of results is as follows:
• basic strength curve 5-5B to 5-5A is 0.75/1.349 = 0.556• load and resistance factors 5-5B to 5-5A is [(4/3)]/[0.9/1.25] = [1/0.75]/[1/1.389] = 1.852.
The comparison between the two sets of requirements over the full range of combinedcompression and bending is presented in Figure 25. It can be seen to cover four D/t ratios, thoserelevant for the 116C tubular diagonals, horizontals and span breakers as well as a D/t of 40 forcomparative purposes, and seven L/D ratios. The L/D ratios extend reasonably uniformly overthe range up to the maximum applicable to that of the span breakers. To help distinguish thecurves relating to the L/D ratios relevant in the present assessment, these are shown in bold.
In the left hand set of diagrams, which relate to 5-5A, the bilinear relationship implicit in thepair of equations [Eq. H1-1a and b] can be clearly seen. That the two sections of the curve arebasically linear is a consequence of the structural analysis being fully non-linear so that theEuler amplification term is set to unity. Similarly for the 5-5B equations (3.3.1-1) and (3.3.1-2)where, because both the Cm and Euler terms are equal to unity, equation (3.3.1-1) governs at alloccasions. This arises because Fa in equation (3.3.1-1) is always less than or equal to 0.6 Fy,both of course being increased by one-third in the presence of environmental loading conditions.
For a practical range of tubular geometries, which in the context of Figure 25 is all theconsidered geometries with L/D ratios in excess of 8.5, the average ratio of 5-5B to 5-5Aallowable stresses is 1.06. The maximum ratio is 1.19 whilst the minimum is 1.0.

43
7.4.2 Prismatic sections
Figure 26 presents a comparison between the 5-5A and 5-5B requirements for axial compressivecapacities of compact prismatic sections. The geometry used was that for the reinforced rackchord of the 116C under consideration. Capacity is plotted against λc as defined in 5-5A. Aneffective length factor K of 1.0 was used as recommended in both 5-5A and 5-5B for leg chords.
From the figure, it can be seen that 5-5B produces the greater capacity. This averages nearly17% across the plotted slenderness range, ranging from 13.8% to 20.2%. This can be confirmedin a similar manner to that demonstrated above. For the reinforced chord section, using a lengthof 2680 mm (the 116C nodal spacing is 3408 mm) and taking K = 1.0, λc = 0.25. For 5-5A, [EqA-B5-11] gives for Q = 1, Fcr = 0.974 Fyeff. Introducing the load factor of 1.25 and resistancefactor of 0.85 , the capacity is (0.85/1.25) 0.974 Fyeff = 0.662 Fyeff. For 5-5B, equation [E2-1],the basic strength is 0.984 Fye and the safety factor (denominator) is 1.732. Incorporating theone-third increase gives a compressive capacity of (4/3) 0.984Fye/1.732 = 0.757 Fye.
The ratio of 5-5B to 5-5A compressive capacities is 0.757/0.662 = 1.14, exactly as demonstratedin Figure 26.
A comparison between the 5-5A and 5-5B bending capacities is presented in Figure 27. Theyare plotted as a function of b/t, the slenderness ratio of the side plate. The variation wasachieved by changing the side plate thickness. The change in slope in the 5-5A plot indicatesthe transition from compact to noncompact cross-sections. In the case of 5-5B, the transition ismarked by a step in the plot. The right hand truncation of both plots coincides with thetransition between noncompact and slender cross-sections.
In the compact range, the 5-5A capacities are 48% greater than the 5-5B capacities. This ismainly a consequence of permitting plastic moments to develop via the 5-5A formulationswhereas the 5-5B formulations are based on a first yield limit. This is demonstrated in thefollowing for a compact section.
Repeating the assessment described above for tubular sections, the unfactored 5-5A momentcapacity for a compact prismatic section is (0.9/1.25) Z Fye. Dividing by S to determine anequivalent bending stress produces (0.9/1.25)(Z/S)Fye. For this section (minor axis bending wasexamined), Z/S = 1.81 so the allowable bending stress = 1.30 Fye. For 5-5B the allowablebending stress is 0.66 Fy or 0.88 Fy after allowing for the one-third increase.
For this case, taking Fy as 460 MPa, the allowable stresses are 598 MPa and 404.8 MPa for5-5A and 5-5B respectively, as plotted in Figure 27. The 5-5A to 5-5B bending capacity ratio isthus 598/404.8 = 1.48 as noted above.
The comparison between the two sets of requirements over the full range of combinedcompression and bending for a compact cross-section is presented in Figure 28. Threeslendernesses are portrayed, λc = 0, 0.5 and 1.0. The left hand plots relate to 5-5A and the righthand ones to 5-5B. The enhanced 5-5A bending strengths are obvious at low axial stress levelsbut direct comparisons at higher axial stress levels are less clear as different axial stresses havebeen used in each case. Notwithstanding, a measure of the difference can be found bysubstituting the permissible values of axial and both bending stresses obtained from 5-5A intothe 5-5B equations and evaluating the utilisation ratios. For the full range of geometriesillustrated in Figure 28, the average ratio is 1.35, the maximum and minimum being 1.78 and0.91 respectively. For values of λc up to 0.5, ie, 0, 0.25 and 0.5, the corresponding values are1.36, 1.78 and 0.92.
7.5 IMPLIED SAFETY FACTORS
To complete the comparison between 5-5A and 5-5B, Table 16 has been prepared whichcompares directly the extreme environmental loading safety factors implicit in the two

44
documents for most of the structural, stability and foundation limit states addressed in Section 8of 5-5A.
The 5-5A safety factors are simply determined by combining the corresponding load andresistance factors. For example, for cross-sections subjected to compression the load factor is1.25 and the resistance factor 0.85. The safety factor listed in the table is found from 1.25/0.85= 1.47.
The 5-5B factor is found by taking the allowable stress, enhancing it by the one-third increase,and determining the margin with respect to yield or component strength if less than yield. Thusfor columns of zero slenderness, the basic allowable stress is Fy/(5/3) = 0.6 Fy. Incorporatingthe one-third increase gives (4/3) x 0.6 Fy = 0.8 Fys leading to a safety factor of 1/0.8 = 1.25.
When considering preload and foundation capacity, the proportion of gravity load toenvironmental load has also been considered. Safety factors are given for the two extremes, ie,zero environmental load and zero gravity load, as well as for a ratio of environmental to gravityload of 2/3 a typical ratio in the present case.
In all cases, the 5-5A factors exceed those of 5-5B, and by a significant margin for many ofthem. On this simple basis, the major differences appear inappropriate. However, the adequacyor not of a safety factor cannot be assessed in the absence of knowledge of the degree ofconservatisms with all aspects of the assessment. In the comparisons presented in Figures 25and 28, for example, in connection with the allowable stresses in tubular and prismatic sectionbeam-columns, account was taken of the different strength formulations. However, in neithercase was the accuracy of either formulation checked against test or other appropriate data. Inthe case of foundation checks, no differences exist between the basic formulations butdifferences do exist between the load combinations under which the checks are effected. Inprinciple, the 5-5A checks are conducted using environment load analysis results that include a1.25 factor on loads induced by environmental forces. Because these are amplified by largedeflection effects, they will be more onerous than a simple ratio of results from analysesexcluding the 1.25 factor would suggest.
In seeking to determine the relative adequacy of the safety implicit in 5-5A and 5-5B, a numberof important factors need to be taken into account. Some of these have been independentlyaddressed as described in the next section. However, some of these are only considered inrelative terms whereas a degree of ‘absoluteness’ is required to properly determine safety levels.In addition, structural redundancy does not seem to have been addressed at all. In the widercontext, strong indicators of the adequacy of implied safety levels are the industry’s experienceand society’s expectations. An appropriate balance of these is always required.

45
8. BASIS OF 5-5A JACK-UP RELIABILITY ANALYSIS
8.1 BACKGROUND
This section presents a review of the jack-up reliability analysis and partial factor determinationwork performed by Noble Denton Consultancy Services (NDCS) in connection with the JointIndustry Study (JIS) on Jack-Up Assessment Methods. The results of the work were reported ina series of documents published from 1991 to 1993. The documents are reviewed below inchronological order with respect to their date of publication.
8.2 REVIEW
Noble Denton Consultancy Services Ltd, “Jack-Up Assessment Criteria. Interim Scope ofWork Items 1.1 to 1.4 on Reliability Analysis”, L15323/NDCS/RVA, Rev 2, 4th March1991(5)
Reference 5 appears to be the first report by NDCS on this topic. The work was set in motionby the JIS Assessment Criteria Sub-Committee in recognition of the uncertainties associatedwith both information on, and analysis methodologies of, jack-ups.
Chapter 4 introduced the subject of reliability analysis, choosing to avoid the use of the “highlyemotive” phrase ‘notional target failure probability’ by instead referring to ‘notional targetreliability’ and ‘probability of limit state exceedance’. A simple steel beam example was usedto demonstrate the derivation of safety index and the corresponding probability of exceedance ofa specific limit state. The relationship between central safety factor and β was given andillustrated for a range of central factors and loading and resistance uncertainties. (Here the term‘uncertainties’ refers specifically to the variability in the loading and resistance variables asmeasured by standard deviation or coefficient of variation COV.) The inconsistent reliabilitiesthat arise from a deterministic design approach when the uncertainty in the loading varies butthe overall safety factor remains constant was illustrated.
The use of reliability analysis in code development to reduce the scatter of risks associated withthe design process without the designer having to evaluate the specific risks was noted.
Target reliabilities were discussed in Chapter 5. The results of a survey of relevant offshore andonshore code development activities and of appropriate standards were tabulated. The βrelevant for offshore component application ranged from 2.1 to 3.7 all appropriate for a 20-yearreturn period. The consolidated view was that a component β of 3.0 was an appropriate annualvalue. A survey of historical data of offshore structural failures was summarised noting thedifficulty in interpreting the information in a structural design context. The correspondingannual β ranged from 2.3 to 3.5.
The approach recommended was to determine appropriate jack-up component reliabilities fromthe analysis of three exemplary jack-ups acknowledging that a annual component reliability of 3was expected.
Chapter 6 summarised the results of a deterministic sensitivity study found by varying the valueof each of the appropriate input variables by ± 10% in connection with a Marathon LeTourneau116C. The impacts of the factor of safety against overturning, on the maximum value ofpreload and on the maximum moment at the lower guide in the leeward leg were examined.The expected levels of variability for each of the studied variables were then taken intoconsideration leading to a finding that the most important (ordered) variables were:
• wave height• drag coefficient
46
• wave period• current velocity• wind velocity.
Chapter 7 defined the four limit states on which the reliability analysis would proceed. Theywere:
• structural utilisation of legs and supporting structure• factor of safety against overturning• preload requirements• factor of safety against leg sliding.
The standard models and methodologies by which the reliability analysis was to be effectedwere described in a step by step manner. They involved equivalent leg models for determiningequivalent leg drag loading, a detailed leg only model for determining equivalent leg structuralproperties, and a detailed leg model with supporting structure for checking hull-leg interactionand for quantifying stiffnesses between the legs and the guides and pinions allowing for gapsand offsets. The output of these models was used as input to an equivalent leg large deflectionFE time-domain analysis model so that in principle it included appropriate leg, hull and leg-hullinteraction stiffnesses.
Chapter 8 identified the jack-ups units proposed for analysis to be:
• Marathon LeTourneau 116C• Friede and Goldman L780 Mod 5• Friede and Goldman L780 Mod 6.
The water depth (chart datum), tide and surge, airgap (from chart datum), maximum waveheight and current and wind velocities for use in the analyses of the three units were listedtogether with the factors of safety determined from the standard analyses and methodologiesprescribed in Chapter 7. At first sight, the factors of safety appear too low in several instances.They were claimed to be acceptable following a consideration of metocean directional data, adetailed foundation study, and rig orientation. Part of the reason for the selection of the Mod VI(Galaxy) was that it was to be monitored during in-place operations and that, should such databecome available, it was expected to be helpful in defining modelling uncertainties.
The probability density functions to be adopted in the reliability analysis were listed for:
• the basic (loading) variables determined in Chapter 6• those further (loading) variables identified in this chapter as of potential importance
(“secondary variables”)• yield stress (“special variable”).
These were determined from a literature survey, the sources of which were identified. Fixitywas also identified as a special variable but, at this stage of the work, only pinned foundationswere considered.
The means and COVs of the basic loading variables were determined using the UK Departmentof Energy Guidance Notes. However, the methods by which COVs, which cannot bedetermined directly from the Guidance Notes, were quantified were not described.
The means and COVs of interest are listed in Table 17. Some of the COVs seem inappropriate,for example, 13% for the annual extreme significant wave height and up to 53% for the tidalcurrent. Wind speed and wind driven current were indicated to be conditional on significantwave height. Wave period was also to be conditional on wave height but to have its owndistribution.

47
The value of COV proposed for yield stress was not listed.
Noble Denton Consultancy Services Ltd, “Jack-Up Assessment Criteria. Statement ofVariable Selection”, L15670/NDCS/RVA, Rev 0, 12th September 1991(6)
Reference 6 aimed to provide a basis by which the variables and their distribution parameters tobe used in the reliability analysis were determined. All of the relevant metocean variables werediscussed. Joint probability of wind/wave/current and collinearity was dealt with by splittingthe current into wind-driven and tidal components. Wind and wind-driven current wereassumed correlated with the seastate whilst the tidal component was considered as anindependent variable. The one-minute wind speed was taken as a function of significant waveheight Hs and location water depth. No gust was allowed for. Significant wave height annualmaxima were assumed Gumbel distributed. Wave period was conditional on the seastate andboth its mean and standard deviation were linear functions of √Hs. The JONSWAP spectrumwas adopted and spreading was ignored.
Wind-driven current was taken as a constant proportion of wind speed whilst the tidal currentwas an independent variable determined from location specific data. A Wheeler-like definitionof current stretching was adopted. Horizontal water particle velocities were assumed accuratelydetermined from wave harmonics whilst vertical water particle velocities were ignored. Surfaceroughness was accounted for in the choice of drag coefficient and marine growth through anincrease in member dimensions. Anodes, etc, were accounted for through the choice of dragcoefficient. The drag coefficient was based on NDCS practice and its variability in accordancewith the literature survey. Nothing was stated in relation to the inertia coefficient. Shieldingand vortex shedding were assumed covered by the selected drag coefficient parameters.
Self weight was assumed deterministic whilst the variable load (ballast, drilling consumablesand live load) took the average, i.e., 75%, of the extremes used in practice of 100% when it actstogether with the environmental forces and leg strength has to be considered and 50% whenvariable load opposes environmental forces and overturning is to be checked. Buoyancy wastaken as deterministic.
At this stage, pinned conditions were adopted so soil variability was ignored and penetrationwas taken from its deterministic calculation.
For yield stress, the distribution parameters were adopted relevant to the grade of steel.Ultimate tensile strength was not explicitly considered but was assumed to be addressed in theLRFD strength checks. Geometric variability was ignored.
Uncertainties arising from FE model layout and analysis errors, jackhouse stiffnesses, hull-leginteraction stiffnesses, clamping and guide modelling and P-∆ effects were ignored. Withrespect to uncertainties in the dynamic simulation, regular versus irregular waves, simulationtime and selection and extrapolation to extremes, irregular time domain analysis was judged asmost appropriate, a simulation time of 3 hours was indicated to be necessary to achieve stabilityin the 3rd and 4th moments (of the distribution), the peak was found according to Winterstein andthus uncertainty in the extreme value was explicitly accounted for. Morison’s equation wastaken to give a deterministic estimation of wave/current forces: this is believed to be non-conservative. Damping was assumed to be accounted for through the relative velocityformulation adopted in the analysis. Possibly important aspects that were ignored included legnon-verticality and sag due to hull self-weight.
On stress analysis issues, variability in Euler and local plate buckling, joint punching shear andprincipal stress checks was ignored. The appropriateness of punching shear as a joint strengthcheck was questioned and, given more appropriate joint strength checks, these are known todemonstrate a degree of variability. Further, since triangular chords not infrequently have sideplates that fail the compactness check and, therefore, are controlled by buckling, thedeterministic approach to plate buckling was also questioned.

48
To help in the selection of the variables to be incorporated within the reliability analysis, each ofthe variables considered was assigned two weightings, one to reflect its significance in relationto jack-up behaviour and the other to reflect its likely level of uncertainty. The weightingfactors were based on the findings reported in Reference 5 together with those determined in thepreparation of Reference 6. The subjective nature of this process was recognised by the authors.The weightings varied from 0 to 10 in increasing order of importance and, when listed, thosewhere the total was more than 50 were highlighted. The assigned values of some of theweightings are questioned by this review.
Although some of the variables received combined weighting of more than 50, the lack ofappropriate information to adequately define them was concluded as a just reason for ignoringthem at this point in time. The reliability analysis was thus concluded to be concerned withwave height, drag coefficient, current, wave period, randomness of the dynamic simulation ofextremes, and yield stress.
Noble Denton Consultancy Services Ltd, “Jack-Up Reliability Study. Procedural andInput Study - Draft 1”, 19th September 1991(7)
In Reference 7, a brief review was presented of existing LRFD codes and how these could beexploited in the present application. The list of reviewed codes seemed limited in the sense thatonly the completed codes themselves were apparently reviewed, but not the correspondingbackground documents. Perhaps not surprisingly, the review was concerned with offshorecodes only. However, since much of the UK practice in limit state codes was pioneered withBS5400, it is a little surprising that this at least was not included. Reference was made in thetext and in a comparison table to API-LRFD-NS. However, this document was not cited in thelist of reviewed documents.
The load factors were categorised in accordance with the API RP 2A-LRFD groupings, asfollows:
D1 dead load due to self-weight of structure, permanently mounted equipment and otherfixtures, hydrostatic and buoyancy forces.
D2 Loads due to equipment moveable between one mode of operation and another or whichcan be removed from the platform but otherwise remains constant for long periods oftime.
L1 Loads due to weights of consumables and fluids in pipes and tanks.L2 Loads due to short duration operations such as drilling, crane lifting, helicopter
landings, etc, but which are not expected to occur during extreme environmentalconditions.
W Static component of extreme environmental loading.Dn Inertial component of dynamic response.E Seismic loading.
A summary table was presented listing the load factors adopted in the reviewed documents.Only one of the considered documents related to jack-ups and, as a consequence, was the onlydocument that provided for load factors covering preload and overturning conditions. Foroverturning, the need to consider load factors significantly less than unity was noted. API-LRFD-NS was noted for its large factor on W of 1.85.
A further table summarised the resistance factors adopted by the various codes for tension,compression and bending only. A brief summary was presented of the main strengthformulations for compression, and combined compression and bending. However, nocomparisons were presented between the different formulations.
The need to take care when exploiting the reviewed safety formats was noted because of theirrelevance for jacket structures in which dynamic effects were not normally of real interest. Theneed to use AISC LRFD in order to handle non-tubular sections was noted despite a preference

49
for API LRFD because of its specific application to offshore structures. A particular preferencewas recorded for using the API LRFD approach to dealing with combined axial and bendingloadings (cosine interaction) instead of the linear form implicit in AISC LRFD. Thisunfortunately failed to recognise the importance of the beam-column equation in controlling, inparticular, tubular member design as confirmed in a recent study for UK HSE(8).
The report concluded that because the strength formulations would not be addressed as part ofthe described study, the resistance factors associated with the strength formulations proposed foradoption from API LRFD and AISC LRFD would be unchanged.
Noble Denton Consultancy Services Ltd, “Jack-Up Assessment Criteria. ReliabilityAnalysis of M116C in 55 m Water Depth, F&G Mod V in 97 m Water Depth, F&G ModVI in 118 m Water Depth Operating in the North Sea”, L15709/NDCS/RVA, Rev 2, 27th
February 1992(9)
Reference 9 presented a comprehensive review of the work done to determine the load factors.It began with a useful summary of reliability analysis fundamentals. This included a glossaryand definitions of limit state, safety margin, basic variables, response surface, safety index(reliability index), sensitivity factors, design point values, and partial safety factors. These wereexplained in the context of a mean Level II reliability analysis. This is helpful but the advancedLevel II reliability analysis (FORM) adopted in the work is not explained anywhere. Someexamples were given to demonstrate some of the principles including safety index derivationand the relation between safety index and central safety factor. The central safety factor is theratio of the means of the resistance and loading distributions. This form of safety factor wasnoted, quite rightly, to be of little use in design.
The jack-up units selected for the reliability assessment and partial factor derivation were listedas:
• Marathon LeTourneau 116C in 55 m of water• Friede & Goldman Mod V in 97 m of water• Friede & Goldman Mod VI in 118 m of water.
Particulars for each of these units were listed in Chapter 5 together with the values of thevariables used in the deterministic assessment. In the deterministic study, 50% of the variableload was used when considering overturning and 100% when considering preload and strengthunity checks. Pinned spudcans were also assumed. The values of the variables listed includedthe 50-year return period metocean conditions together with the results of existing analyses thatidentified the critical headings and safety factors with respect to overturning, preload and stressexceedance, and natural periods in sway, surge and yaw. Some of the 50-year return periodvalues listed did not coincide with those presented in Reference 5 and summarised in Table 17:no explanation was given for the changes. The safety factors were based on the most probablemaximum (MPM) value for each of the corresponding check conditions: these are summarisedin Table 18.
From the table, it can be seen that the safety factors are generally reasonable except for thoserelating to preload for which the margin differs little from unity and, in one case, appearsunacceptable.
Not very helpfully, MPM was not defined anywhere despite the fact that much simpler andperhaps more complex parameters were defined as noted above. Notwithstanding, a procedurewas described in Appendix F by which the MPM value from a time domain simulation could bederived. It was based on the Winterstein 1988 method for transforming a non-linear, non-Gaussian and finite bandwidth process into a solvable probability function via a Hermitepolynomial fit.

50
The reliability analyses of the three units were described in detail in Chapters 6, 7 and 8 withdetails in three appendices. The topics covered were:
• detailed reliability analysis methodology• reliability analysis methodology validation• the application of LRFD codes for jack-ups.
Four basic loading variables were considered in the analyses. They were significant waveheight, peak period, tidal current, and drag coefficient-diameter. Four of the six variables notedin Reference 6 were required for inclusion in the reliability analysis. In the reliability analysesfor overturning, 75% of the variable load was adopted. However, no uncertainty was assignedto this load or any other gravity loads.
The approach adopted was, using the jack-up model, to conduct sufficient reliability analyses inthe potential failure space for the jack-up so that a response surface for β as a function of thebasic variables could be created. Having done this, the response surface could be furtherinvestigated using the reliability analysis rather than performing further reliability analyses onthe model itself. The surface then had to be de-conditioned so as to eliminate the dependency ofthe surface on other than the most important variable, namely, significant wave height. Oncethis process was achieved, the partial factor on loading was evaluated. This was repeated foreach limit state - see Table 18 - and a range of appropriate load partial factors. Included in thereliability assessment of the overturning limit state was consideration of the limit state forlifting/sliding of the windward leg.
Chapter 9 summarised the reliability analysis results, both in tabular and graphical forms.Average safety factors were determined given a reference β of 2.5 and 3.0 and then the spreadof reliabilities given these average safety factors was described. There is a concentration on thepartial factors attributable to each of the basic variables, which is of little use when only thefactor on environmental loading is of real interest. For each limit state, the discussion thenconcentrated on the impact of a β of 2.5 for which the average safety factors were 1.27 foroverturning (reported as 1.31 in the Executive Summary and Conclusions), 1.17 for preload, and1.19 for strength utilisation check. A reliability index of 2.5 was then compared with the resultsof the API LRFD deliberations from which it was concluded that it is broadly similar to thefindings of the API study. The study concluded that on the basis of the reported work thepresent findings could be carried forward to the next phase of work. Further, the lack ofsensitivity to tidal current and peak period suggested that both of these could be treated asdeterministic.
In the reliability analysis of overturning and preload, no uncertainty is attached to the resistanceside of the equation. These analyses, therefore, do not provide “probability of failure” estimatesbut only “probability of exceedance” estimates. In the case of overturning of the 116C, from thereported results, it is possible to exploit a mean level 2 reliability analysis to examine the impactof the introduction of an uncertainty to the resistance side of the equation, ie, to the rightingmovement RM. Further, the impact of different safety factors can them be examined.
The reported results for the 116C are:
Safety Factor Safety Index(SF) (β)
1.33 (25*) 2.31 (33)1.59 (Fig .E-1) 2.74 (Fig E-1)
*page or figure number of report where value is listed or can be extracted.

51
The form of the mean level 2 reliability analysis adopted is
( )2OTM
2RM
mm
VV
OTMRMln
+=β (8.1)
where OTM is the overturning moment, m indicates the mode of the distribution and V iscoefficient of variation.
The design (d) values of RM and OTM are related to the modes by
dRMm RMXRM = (8.2a)
dOTMm OTMXOTM = (8.2b)where X is defined as bias.
The design values are used to determine the safety factor so
SF = dd OTMRM (8.3)Introducing (8.2) and (8.3) into (8.1)
( )2OTM
2RM
OTMRM
VV
XXSFln
+=β (8.4)
Introducing the pairs of values for SF and β listed above into (8.4) and adopting XRM = 1, sincevalue of RM is reportedly appropriate, and VRM = 0 (an assumption in the reported work), leadsto XOTM = 0.510 and VOTM = 0.415. The results indicate that the MPM is just over half the valueused in design and that the total uncertainty associated with loading is relatively large.
If 50% of the variable load had been used in the reliability analysis rather than 75%, the rightingmoment would have been factored by 0.945. Treating this as a bias, ie, XRM = 0.945, andintroducing an uncertainty of 10% on the estimation of restoring moment, ie, VRM = 0.10, (8.4)gives β = 2.11. If the safety factor adopted in 5-5B of 1.1 (Table 16) is adopted instead, β =1.67 corresponding to a probability of failure (not now exceedance since RM is random) of 4.7x 10⁻².
However, because in the reliability analyses, the RM was determined using 75% of the variableload, strictly the value of the safety factor should be similarly determined. Thus, the safetyfactors listed above should be factored by 1/0.945. This results in, from resolving (8.4), XOTM =0.537 and VOTM = 0.417. β for the 50% variable load RM remains at 2.17 and 2.11 for VRM of0.0 and 0.10 whilst, for the 5-5B safety factor of 1.1, it reduces to 1.54.
The 116C stress exceedance limit state reliability analysis can be examined in a similar manner.Based on a safety factor of 1.32 (from page 25 of the report), using the results for ηξ of 1.0 and1.5 of β of 2.13 and 3.09 respectively (see page 45), and assuming initially that ξ isdeterministic, as in the report, then XUC the bias associated with the loading, is found as 0.537and the associated uncertainty VUC as 0.422. These are quite similar to the values found foroverturning.
If, as considered in the report, ξ is assigned random values of Xξ = 1.19 and Vξ = 0.129 (=0.154/1.19 on page 46 of the report), then β is found as 2.43 which can be compared with valueof 2.41 reported on page 47 of the report.
When assessing the β values for stress exceedance, it is important to note that the AISCequation as adopted in the report included the AISC resistance factors of 0.85 for compressionand 0.9 for flexure – see page 130 of the report. However, it is unlikely that these resistancefactors can be inferred as effectively increasing the ‘safety factor’ associated with the calculated

52
β because the bias used for ξ of 1.19 is considered too large to merely reflect the bias of the testdata with respect to the adopted AISC strength equation. The 1.19 is likely to include most ifnot all of the safety inherent in these resistance factors which can be estimated as the average oftheir inverses, namely, 0.5 (1/0.85 + 1/0.9) = 1.14.
On the other hand, the report indicates (see page 138) that, of the two governing equations listedon page 130, only the first was incorporated within reliability assessment because of theproblem of selecting an appropriate condition when the axial load rather was 0.2. Thus, inprinciple, members that were dominated by bending were taken to be stronger than should havebeen the case, leading to over-estimates of their safety indices.
One of the reported conclusions was that the damping due to fluid-structure interaction wassome 6% of critical. This was taken to indicate soil fixity was highly sensitive to this parameter.It is not clear that this issue was addressed in this particular report.
Noble Denton Consultancy Services Ltd, “Jack-Up Assessment Criteria. ExecutiveSummary and Conclusions of L15709/NDCS/RVA, Rev 2, 27th February 1992”(10)
This reference appeared to be a fuller Executive Summary and Conclusions to Report L15709than that which appeared in the report itself.
Noble Denton Consultancy Services Ltd, “Jack-Up Assessment Criteria: Status Summaryon Stage 2 of Reliability Analysis”, 24 August 1992 (Preliminary)(11)
The work documented in Reference 11 was reportedly based on the 11th Draft of the RP (i.e.,Recommended Practice). This is the first time that the version of the RP draft being consideredin any of the reported work has been clearly identified. This version of the report was also‘preliminary’ which is clearly reflected in the quality of some of the work and in itscompleteness.The input data used for each jack-up in Stage 2 was summarised in Attachment 1 of the report.Unfortunately, it was only input and did not include a summary of results as presented inChapter 5 of Reference 9. Attachment 1 also included input data for a Marathon LeTourneauGorilla but without any introduction or other comment in the main text.
Chapter 2 presented a summary of the differences between the results of the Stage 2 work (thisreport) and of those of Stage 1 as presented in References 9 and 10. The differences, apparentlymainly related to the 116C OTM (overturning moment), are summarised here and commentedupon in turn.
(a) Mean OTM increased by about 22% due to increased wind area.
The wind areas were apparently increased in Stage 2 but by nearly 29%, 1832 m2
compared with 1424 m2. However, the 1-minute mean wind speed was reduced from 40m/s to 29 m/s. Since wind forces are a function of (velocity)2, the wind force has in factreduced by the ratio
1832 x 292/1425 x 402 = 0.676.
This is a reduction of 32.4% which is in total contradiction to the above conclusion.
Further, it was not just the wind loading that had changed. For Stage 1, the surfacecurrent considered was 0.9 m/s whereas for Stage 2 it was 0.69 m/s, the result ofapplying a current blockage factor of 0.77 to the Stage 1 values. Also, the percentage ofcritical damping used in the analysis had increased from 2% at Stage 1 to 4% at Stage 2.This decreased the single degree-of-freedom (SDOF) dynamic amplification factor

53
(DAF) leading to a smaller inertial load set. In addition, the equivalent drag loadingCdD on the leg had altered. For Stage 1, a value of 10.2 m was used whereas, for Stage2, two values were considered, 9.43 in the absence of marine growth and 11.42 withmarine growth. The net effect of this change is difficult to estimate but it may, for thevalues used, not make a significant difference to the OTM. However, the changes incurrent loading and in the inertial load set lead to a reduced OTM, again raisingquestions about the source of claimed increase in OTM. No other parameters appear tohave changed. The natural frequencies are the same so no changes in mass nor in fixityhave occurred.
(b) The standard deviations of the Stage 1 and Stage 2 responses were within 0.3%.
This seems to be borne out by the computerised output (O/P) presented in Attachment 2.
(c) The reliability (safety) index β conditioned on seastate had decreased from 1.45 at Stage 1to 1.04 at Stage 2. It was considered that this was partly due to the increased mean and partlydue to the increase in dynamics in the RP.
In the O/P in Attachment 2, five safety index values were listed. The quoted numbersrelated to the “finite peak of peaks” values: no explanation was given for selecting thisvalue as distinct from any of the others.
The justification for the decrease in β as due partly to the increase in OTM is not, as wasexamined above, consistent with the input parameters. As for the effects of dynamics inthe RP, this cannot be even considered let alone compared in the absence of relevantdocumentation.
(d) The assessment safety factor on OTM decreased from 1.33 to 1.22.
Again, it is unclear as to how the OTM has increased that would lead to a reduced safetyfactor. Further, the presented calculations in Attachment 2 appear to be in error. Thiscan be readily seen by inserting in (a) of Sheet No. 1 of 2 the values for MPMax (OTM-RM) from the second page of O/P instead of the values from the first page of O/P thathas been done in the presented calculations.
(e) The final safety index decreased from 2.31 to 2.06.
The basis for this is not given nor is it consistent with the documented input as notedabove.
(f) Calculations showed that the use of the factored Hs as recommended in the RP decreased βby 0.35. The increased mean also contributed to a reduction in β of 0.10. However, theseeffects were offset by increased critical damping (from 2 to 4%) and reduced CdD whencompared to the design point value of CdD in Stage 1. Thus the discrepancy was reduced to0.25 on final β.
The use of a factor on Hs is presumably, as indicated in the Attachment, to account forthe fact that a ‘stochastic analysis’ is being performed. Such analyses employ linearwave theory and therefore under-estimate crest heights compared with Stokes V andsimilar theories. The basis for the adopted factor of 1.07 is not given.
The second sentence of (f) refers to an increase in the mean. The basis for this isunclear because no indications are reported concerning, for example, additional storm

54
surge or any other parameters that might lead to an increase in the mean sea level asconsidered in the Stage 2 analysis.
Because of the lack of, and uncertainty in, the input parameters adopted in the analysis,the effects on the final β cannot be estimated.
The final observation on Stage 1 versus Stage 2 concerned the Friede & Goldman Mod VIOTM. This apparently showed an increase in the safety factor from 1.23 to 1.54. Three reasonswere given two of which were confirmed by the presented information, namely, reduced windarea and increased damping. The third was that the RM (restoring moment) had been calculatedusing 75% of the variable load. Whilst this may be justified in this particular case, it is notconsistent with the assumptions made elsewhere where 50% of the variable load is normallyadopted in OTM calculations.
Chapter 3 addressed the question of which of two criteria to use when deciding whether to adoptthe relative velocity form of Morison’s equation or not. This does not seem to be tackledrationally. Both were rewritten to be consistent with the other following which the similaritybetween one and that used by NPD was noted with interest. Irrespective, the relative form wasused in all Stage 2 analyses, seemingly whether the criteria were satisfied or not. (The relativeform of the Morison equation was adopted in the Stage 1 work.)
Chapter 4 simply presented the results (in Attachment 3) for the three rigs at four locations andfor three limit states ostensibly in both ‘graphical and tabular form’: only the plots (β versussafety factors) were contained in the report. The fourth location purportedly referred to a 116Clocated in 65 m of water. However, input details were presented in Attachment 1 for a MLTGorilla in 106.7 M of water but not for a 116C in 65m.
The reasons for including this extra location are unknown, but of some concern. Havingincreased the water depth by 10 m, the presented plots indicated (where they can be interpreted)that the safety index increased by at least 0.2 and up to 0.4. It can only be concluded that theinput data for the 116C in 65 m is significantly different from that of the 116C in 55m.
Chapter 5 addressed the question of storm loading parameters in the Gulf of Mexico (GOM)compared with those adopted in the remainder of the analysis which related to the North Sea(NS). Sets of 10-year and 100-year return period values for both wind and wave were listedtogether with their corresponding annual means and COVs: the source(s) of the data was notgiven. The average COV on waves increased from 13% for the NS to 27% for the GOM. TheCOV on GOM wind averaged 0.51.
Because the COV on GOM wave height almost doubled, the mean value adopted in thereliability assessment had to be reduced to compensate: the basis for this was not described.The results were simply presented in graphical form of β versus safety factor but were notdiscussed in any way and still demonstrated that the 116C in 65 m of water was more reliablethan when it was in 55 m.
Chapter 6 examined the sensitivity of time domain solutions to the size of the time step used inthe analysis. The question was posed as to whether the RP recommendation of using the smallerof the zero-upcrossing period Tz or the natural period Tm both divided by 20 could be relaxed.The answer was given in terms that both 0.25 s and 0.5 s time steps gave similar results so that a0.5 s time step could be adopted. The choice of 0.25 s was made on the basis that it wasapproximately 1/20 of the smallest natural period determined over all the rig/water depthcombinations. The choice of 0.5 s was NDCS standard practice.

55
The result confirmed the finding reported in Appendix C of Reference 9. However, it did notseem to lead to a conclusion that the RP requirement of the smaller of Tz/20 or Tm/20 could berelaxed.
Chapter 7 presented some brief conclusions and Chapter 8 a procedure for calibration involvingthe use of different partial load factors on the static and dynamic components of environmentalloading.
Chapter 9 referred to the use of the SDOF approach presented in the 11th Draft of the RP to dealwith dynamic effects and a comparison between results obtained using the approach anddetailed analysis that was presented in an attachment to the report. No assessment waspresented.
The final Chapter described four methods by which the calibration procedure summarised inChapter 8 could be exploited. Results for two of these methods were presented and described.
Noble Denton Consultancy Services Ltd, “Jack-Up Assessment Criteria (Stage 2).Reliability Analysis of 116C in 55 m Water Depth, F&G Mod V in 97 m Water Depth,F&G Mod VI in 118 m Water Depth and 116C in 65 m Water Depth in the ElevatedCondition”, Report No: L16268/NDCS/RVA Rev No 1 dated 8 January 1993(12)
This document reported completion of the Stage 2 reliability analysis work. As such, it updatedthe preliminary Stage 2 results presented in Reference 11.
The introduction to reliability analysis presented in Reference 9 was repeated in full. Theparticulars of the considered rigs were presented but in an expanded format compared with thatadopted in the earlier reference. In the case of the 116C, the source of the error in Reference 11referred to above could be identified. The 1-minute mean wind speed adopted in Stage 2 was infact the same as that for Stage 1, i.e., 40 m/s. The main reason for the 116C in 65 m water depthbeing “safer” than when in 55 m water depth, as noted above, was identified. The maximumwave height considered was 15.6 m instead of 18.4 m. Also, a reduced 1-minute mean windspeed was used 35.6 m/s compared to 40 m/s.
The Stage 1 and 2 results were compared. The deterministic safety factors were broadly similar.The exceptions were that the stress check for the 116C in 55 m water depth was reduced by 14%whilst the overturning stability for the F&G Mod VI was increased by 25%. These differenceswere more or less reflected in the reported safety indices.
The increased variability in the Gulf of Mexico environment was noted to lead to a “flattening”of the corresponding safety index versus safety factor curves. The consequential challenge forimproving safety levels in such conditions compared with those areas of smaller variability, i.e.,the North Sea, was noted.
The relatively small changes in safety indices realised between Stages 1 and 2 were notedexcept in the case of stress checks where the introduction of leg inclination moments led to a 5%reduction.
The SDOF approach briefly described in Reference 11 was presented in detail. The resultsindicated that the RP was not precise enough in defining the parameters to be used in such anassessment and that this had to be addressed.
Similarly the calibration methodology introduced in Reference 11 was presented in more detail.The results were presented and discussed concentrating on the approach whereby target safetyindices were determined based upon the average achieved for each limit state. The determined

56
target reliabilities fell in the range 1.5 to 2.65. Partial factors were determined and resultingindices compared for a single factor and separate static and dynamic factors. Relatively largedynamic factors were determined (1.35 to 2.2) remembering in the safety format adopted thatthese are multiplied by the static factor (1.20 to 1.25) to obtain the total factor on the dynamiccomponent of loading.
The factors were noted to be load effect factors, i.e., they were applied after an analysis. This isinconsistent with other LRFD practice.
Joint Industry Jack-Up Committee, “Summary of the Invitation Meeting of 11th, 12th
March 1993 at Noble Denton’s Offices in London” (including attachments)(13)
The document summarised the results of detailed assessments undertaken by the contractor as aresult of a number of questions concerning the results reported to that time that had been raisedat a meeting about one month earlier. The questions related to:
• differences in the determined dynamic load component between the RP’s SDOF anddetailed time domain analyses.
• the trend of the dynamic load component from the detailed time domain analyses.• regular wave and SDOF load component results both of which conflicted with those of other
studies.
The investigations led to improvements by:
• using 3 hour rather than 1 hour time series in time domain simulations.• adopting an improvement to the Winterstein method that matched “exact” results and
reduced MPM values by up to 15%. It resulted in a reduced static component and anincreased DAF. Safety indices were apparently little affected.
• the conflicts with other results seemed largely a result of different inputs and assumptions.• a consequence of the change in the proportion of static to dynamic load components was a
reduction in the dynamic load partial factor. A value of unity was recommended.
Jack-Up Site Assessment Procedures-Establishment of an International TechnicalGuideline. Meeting of 4th May 1993 at Marriott Astrodome Hotel, Houston(14)
This document was a set of minutes of the meeting.
The results of the progress to date leading to the production of a Guideline, RP, Commentary,and ‘Go-By’ Document were summarised by a number of participants: the presented overheadtransparencies were attached to the minutes. Maintenance of the documentation was to behandled by a new SNAME Offshore Committee following publication by SNAME.
Noble Denton Consultancy Services, “Jack-Up Assessment Criteria. Executive Summaryand Conditions of Stage 2 Work”, Report No. L16593/NDCS/RVA Rev 1, dated 4 August1993(15)
The document represented the summary and conclusions contained in Reference 12 updated toaccount for the changes described in Reference 13. There appears to be an error in the safetyindex value listed for Preload in the table in paragraph 1.9.
The use of a single partial factor (of 1.25) was recommended which, although it did not realisethe smallest spread in reliabilities, it did lead to spreads that were apparently small in absolute

57
terms. It was argued that the usefulness and reduced risk of using a single factor more thanoutweighed the increased reliability spread.
The safety formats proposed for each of the considered limit states (overturning, preload andstress) were summarised.
No attempt was made here to repeat the mean level 2 reliability analysis assessment reportedabove when discussing Reference 9. The reason for this is that not all of the details necessaryfor such an exercise are included in Reference 15. The exercise could have been conducted inconnection with Reference 12 but, as noted above, the results therein have been corrected andnot all the relevant details are presented in the later document.
Notwithstanding, the same weaknesses recorded in relation to Reference 9 still exist. Thus, inrelation to overturning and preload, the treating of the resistance terms as deterministic impliesthat the resulting safety indices only relate to probability of exceedance and not probability offailure. Thus the plots shown in Figures 1 and 2 of the report need to be lowered. The extent ofthis reduction is, in the case of overturning of the 116C, equivalent to a decrease in β of some0.2.
Jack-Up Site Assessment Procedures. Establishment of an International TechnicalGuideline Seminar of 23rd September, 1993 at City University, London(16)
andJoint Industry Project. “Jack-Up Site Assessment Procedures – Establishment of anInternational Recommended Practice”. Seminar(17)
These documents contained the minutes and copies of overheads for the Seminar. The materialappeared to be an expanded version of that contained in Reference 14.
In the presentation on Structural Modelling, it was noted that the load factors were to apply toload effects and not loads.
8.3 SUMMARY
A survey of previous offshore component reliability studies demonstrated a range of β of 2.1 to3.7 on a 20-year return period exposure basis. A β of 3.0 was concluded to be an appropriateannual component reliability.
A deterministic loading sensitivity study on a Marathon LeTourneau 116C found it mostsensitive to wave height, drag coefficient, wave period, current velocity and wind velocity.
The jack-ups used in the study were the 116C (55 m water depth) plus the Friede and GoldmanL780 Mods 5 (97 m water depth) and 6 (118 m water depth). The results of deterministicanalyses for these units at their chosen locations were reported. They exploited equivalent legmodels to determine drag loading, and leg, hull and leg-hull interaction stiffness properties forinput to a large deflection time-domain equivalent leg model. Spudcan fixity was ignoredduring the early phases. Some of the resulting safety factors appeared to be too low.
The probability density functions adopted for the random variables were listed based on theresults of a literature survey. Coefficients of variation for these loading parameters werereportedly determined from HSE Guidance. It is not clear how this was done and furtherexplanation is required. Some of the values seem inappropriate.
Wind and wind-driven current were assumed correlated with the seastate whilst the tidal currentwas treated independently. The one-minute wind speed was a function of significant waveheight. Wave period was conditional on seastate with both its mean and standard deviationlinear functions of √Hs. The JONSWAP spectrum was adopted and spreading ignored.

58
Wave particle kinematics and related coefficients were treated in a standard linear mannerconsistent with the time-domain solutions that were effected. Inertia loading appeared to beignored. A value of 75% of the variable load was used as a ‘mean’ for this loading.Uncertainties associated with FE modelling and analysis and P-∆ effects were ignored.
A second parameter sensitivity study involving weightings on the expected influence on jack-upresponse and on the likely level of inherent uncertainty led to an unsatisfactory conclusionregarding the choice of variables to be included in the reliability analysis. The basic list ofrandom variables was unchanged except for the addition of yield stress.
The safety format proposed for use was similar to that adopted in the API LRFD study.Because the resistance formulations to be used were unchanged from their source documents,API LRFD and AISC LRFD, the resistance factors existing therein were adopted unaltered. Theabsence of any consideration as to the accuracy or otherwise of the strength formulations is ofconcern.
When considering variable loading for the reliability analysis, 75% was used. Some 50-yearreturn period values used in the reliability analysis differed from those concluded initially asappropriate. The MPM value of each of overturning, preload and unity check was used as thedesign value of response. A response surface was generated for each failure mode as a functionof the loading variables and their products. The surfaces were simplified to facilitatecomputation seemingly without significant loss of accuracy. A review of the safety indexfindings and comparisons with the API LRFD findings led to the conclusion that β = 2.5 was anappropriate target.
Some of the presented Stage 2 preliminary results were in error or lacked adequate reporting.Certain errors have been readily identified by reference to later work. A fourth rig, a 116C in 65m water depth, was included in the Stage 2 assessment.
An extension of the work to encompass GOM environments was included simply by modifyingthe mean and COV of the environmental loading uncertainty. The choice of time step wasexamined but not satisfactorily resolved.
The Stage 2 results were ostensibly similar to those of Stage 1. This finding lacks transparencybecause it is only during Stage 2 that the draft version of the RP being used was identified (11th
Draft) and changes to previous drafts were not reported. Further, the critical damping wasincreased from 2% to 4%, and a factor of 1.07 was adopted to account for the use of a stochasticanalysis. In later Stage 2 work, a review of results led to modifications to the method ofdetermination of MPM values resulting in smaller quasi-static components and increased DAFs.A consequence of this was a considerably reduced partial factor on the dynamic component ofloading compared with the Stage 1 findings.
Both the Stage 1 and 2 reliability assessments relating to overturning and preload suffer fromtreating the resistance term as deterministic. The presented results thus relate only to probabilityof exceedance and real safety indices have been over-estimated. The extent of this has beendetermined to be equivalent to a reduction in β of 0.2 in the case of overturning of the 116C. Ithas been further shown, using a mean level 2 reliability analysis, that the safety factor onoverturning of 1.1 in 5.5 B corresponds to a safety index for the 116C of some 1.54 equivalentto a probability of failure of 6 x 10⁻².
The final recommendation on partial factors was unity for the dynamic component and 1.25 forthe total environmental loading. The final values were noted not to produce the smallest spreadof reliabilities. However, the ease of use and reduced risk from adopting a single partial factorfor all limit states apparently outweighed the increase in spread that was apparently notsignificant in absolute terms.

59
The load partial factors were noted in at least two separate documents to apply to load effectsand not to loads.

60

61
9. CONCLUSIONS
9.1 CONCLUSIONS
9.1.1 Comparison of Analysis Results
A Marathon LeTourneau 116C was subjected to site specific assessments in accordance withcurrent SNAME (LRFD) practice, denoted 5-5A, a working stress design (WSD) alternative,denoted 5-5B, and a North Sea Annex to 5-5A that exploits 100-year joint probabilityenvironmental load events in place of the combined 50-year return period extremes explicit in 5-5A. The unit was positioned in the North Sea in 59 m water depth and subjected toenvironmental parameters determined from data provided by Shell Expro. A quasi-staticstructural analysis approach was adopted to determine member forces. Spudcan fixity wasconsidered on the basis of the 5-5A provisions determined for soil information also provided byShell Expro.
A detailed leg and hull finite element model was constructed for the analysis. Pinion-inducedloading is of importance in the 116C: the offsets associated with these were accuratelymodelled. The guides were also correctly represented using non-linear springs, the lower guidebeing located at the two positions of concern, ie, the brace-rack chord intersection and mid-waybetween these nodes. The structural analysis package included both global and local largedeflection (P-∆) effects.
The natural periods were determined as 8.3 s in sway, 8.2 s in surge and 6.8 s in yaw.
Maximum member utilisation ratios (UR) were generally found with the guide mid waybetween nodes. The maximum values were in the reinforced chords just below the lower guideswhere URs of the order of 1.8 were recorded. These largest values arose when using 5-5A forthe checks. The leg diagonals and the leg horizontals within the depth of the hull were the nextmost heavily utilised groups with maximum URs around 0.85. The maximum recorded UR forthe unreinforced chord was 0.75. The least utilised member groups were the increased thicknesshorizontals and the span breakers, with URs of 0.5 and 0.3, respectively.
The 5-5B URs averaged some 10% less than those found using 5-5A. The NSA checks were onaverage 5% less than those found using 5-5A.
When load factors are applied to load effects following an analysis rather than to loads prior toeffecting an analysis, significantly smaller URs result. Preload URs were low. None of thepractices (5-5A, 5-5B and the NSA) satisfied the overturning check by considerable margins.
The soil bearing capacity URs were found to be less than 0.5, although the 5-5B UR was over20% larger than the 5-5B value. Similar differences were found in relation to the sliding checkbut the larger UR here was 0.72. Uplift was occurring at the leg in question but, while neither5-5A nor 5-5B suggest this condition is outside their range of applicability, such a condition willfail the overturning moment check.
9.1.2 Critique of Proposed 5-5B Practice
The proposed WSD alternative to the SNAME LRFD requirements was critically reviewed forconsistency with its base documents accuracy, both technical and editorial.
Many editorial errors were found: these have been identified. A considerable number oftechnical issues have been raised. The important ones are:

62
• For a non-linear analysis, 5-5A sets the Cm beam-column parameter to unity. 5-5B providesno guidance as to its appropriate value.
• The adopted tubular local buckling check is based on API RP 2A. This is flawed in that ithas not been properly non-dimensionalised. A well-documented accurate alternative isproposed.
• The use of a definition on slenderness for rectangular elements supported on one edge thatinvolves the web yield stress is questioned since it does not seem to apply to some rackchord configurations.
• The locations at which stress checks need to be performed on a tear drop chord section areinadequate because they overlook the possibility that the section may be composed ofelements having different yield stresses.
• The use or not of load factors in the foundations checks can be expected to generate verylarge differences in utilisations. This is particularly the situation when the environmentaland inertial loads are large compared to the dead and live loads. Utilisations to 5-5A willalways be greater than those to 5-5B provided the environmental and inertial loads areacting in the same direction (compressive) as the dead and live loads.
A review of NSA has shown:
• The relative severities of the permitted metocean parameter combinations (100-year returnjoint probabilities, 50-year return combination of extremes) needs demonstrating.
• The equivalence of a kinematics reduction factor applied to wave height instead of to waveparticle kinematics needs confirmation in view of the likely significant difference in wettedstructure.
9.1.3 Comparison of 5-5A and 5-5B Allowable Stresses and Implied SafetyFactors
A one-to-one comparison of allowable axial compression, bending and combined compressionand bending stresses has been conducted. Findings from this are:
• In 5-5A, the use of definitions on slenderness for rectangular elements supported on one ortwo edges that involve a measure of residual stress leads to inconsistent definitions in that aslender element may be classified one class more compact than a more stocky element.
• Cover plates should be added to the group of elements supported on two sides included inthe 5-5A and 5-5B definitions in order to formalise their use as stiffening elements of somerack chord cross-sections.
• The definition on slenderness for axial compressed tubulars adopted in 5-5B is totallyinconsistent with corresponding definitions found elsewhere for reasons noted above.
• The definition for the moment capacity of noncompact tubular sections given in 5-5A is inerror. The maximum error is demonstrated to be some 9% around the range of D/t =60.
• Some of the definitions for slenderness in both 5-5A and 5-5B are in terms of the web yieldstress. This is not necessarily appropriate for rack chord sections because the definition hasbeen extracted from those relevant to hybrid I-girders. It is an important issue since some ofthe definitions relate to the local buckling of elements supported on one edge, the bucklingof which can be quite catastrophic. Relevant requirements must be derived with caution andrecognise that rack chord sections cannot be necessarily equated to hybrid I-girders in allrespects.
• Exploitation of the hybrid I-girder analogy is carried further by 5-5A to include thedefinition of bending strength. The immediate application to some rack chord sections isquestioned particularly as they may ignore the onset of tensile yield since asymmetry of thecross-section is not treated adequately. On the other hand, the requirement to use theminimum section modulus irrespective of direction of bending leads to an under-estimation

63
by some 33% of the 116C’s leg chord section. This inconsistent treatment needsrationalisation.
• The slenderness limits for noncompactness in the presence of bending are significantly moregenerous under 5-5A than under 5-5B. This is a direct result of including a residual stressterm in the 5-5A definition, the consequences of which were anticipated above.
• The more fundamental approach adopted in 5-5B for the determination of bending strengthrather than trying to adapt existing formulations for hybrid I-girders as adopted in 5-5A is tobe strongly preferred since it provides for a direct opportunity to check the safety of thecross-section. Notwithstanding, more information is needed than provided in 5-5B and itsstructural checks extended to account fully for plastic capacities if its approach is to providethe appropriate balance in jack-up assessment between safety and economy.
• A comparison of allowable axial compressive stresses for typical 116C tubular sectionsdemonstrates that the 5-5B requirements range from 14 to 19% greater. This isdemonstrated to be approximately equally due to differences in the basic strength curve andin the safety factors, ie, the load and resistance factors in the case of 5-5A and the one-thirdincrease in the case of 5-5B coupled with a typical WSD safety factor. Similar benefits arefound for 116C rack chord cross-sections.
• In the case of bending of tubulars, the differences are only marginally in favour of 5-5B.This arises from a much lower basic strength curve in 5-5B being offset by the effects ofsafety factors. In contrast, rack chord cross-sections benefit from being designed to 5-5A byup to 48% for compact sections. This is a direct consequence of allowing plastic momentsto fully develop in prismatic sections and accounting correctly for their interaction.
• Under combined compression and bending, over a practical range of geometries, theaverage allowable 5-5B stress is 1.06 times that of 5-5A. The maximum ratio is 1.19 whilstthe minimum is 1.0. For rack chord cross-sections, the 5-5A allowable stresses average1.36 times the 5-5B average value with individual values varying from 0.92 to 1.78.
A simple comparison between 5-5A and 5-5B safety factors under extreme environmentalconditions is presented. All of the 5-5A factors are larger than their 5-5B counterparts,frequently by a significant margin. The need to account fully for the inherent parameteruncertainties in any assessment is noted if the adequacy of the implicit safety margins is to bedetermined. The absence of any evaluation of redundancy in such an assessment is noted.
9.1.4 Basis of 5-5A Reliability Analysis
The considered reliability analyses work was performed in two stages.
In Stage 1, a survey of previous offshore reliability analysis and partial factor derivation workwas concluded to demonstrate that a β of 3.0 represented an appropriate annual target index.However, as a result of studies on three jack-up units, this was reduced to 2.5. The three unitsinvolved were a Marathon LeTourneau 116C and Friede and Goldman L780 Mods 5 and 6. Thewater depths selected for the analyses were 55 m, 97 m and 118 m respectively.
The basic random variables selected for consideration were wave height, wave periodconditional on seastate, wind speed correlated with seastate, tidal current with the wind-drivencomponent correlated with seastate, leg (simplified) drag loading and an unspecified LRFDcode check equation. Modelling uncertainties of all descriptions were ignored.
The analysis proceeded on the basis of the Most Probable Maximum (MPM) value foroverturning, sliding, preload and UR in a 3-hour storm. Non-Gaussian responses wereconverted to near-Gaussian responses through Winterstein’s Hermite polynomial transformationprocess. Approximations were used in the derivation of some of the relevant parameters: thesewere not necessarily transparent.

64
β was determined using a response surface approach, the response surface being defined interms of the random loading variables and their cross-products. A conditioning process wasused to reduce the complexity of the surfaces. Again it is not clear how this was implemented.When considering overturning and preload, the resistance term in the reliability equation wastreated as deterministic. The resulting β therefore represents probability of exceedance and notprobability of failure. In the case of overturning of the 116C, the reliability index correspondingto failure was determined using a mean level of 2 analysis to be 0.2 less than the representedvalue. Using the 5-5B safety factor on overturning suggests the corresponding failureprobability is some 6x10⁻² per annum. In the case of the structural reliability assessment, onlyone of the two controlling equations on beam-column strength has been used. This willoverestimate the reliability of members dominated by bending: the extent of this has not beenquestioned.
The Stage 2 work included a 116C in 65 m of water but with reduced wave heights. Anextension included the Gulf of Mexico environment on a simplistic basis. The determinedreliabilities in Stage 2 were reportedly similar to those of Stage 1: this is not readily apparent inthe light of the changes made to the analyses between the two stages.
In at least two of the considered documents, it is recorded that the load factors be applied to loadeffects, not loads. This is contrary to traditional limit state (LRFD) practice.

65
REFERENCES
1. IADCPractice for Site Specific Assessment of Mobile Jack-up Units – Working Stress Design(WSD)First Edition, May 1999
2. SNAMERecommended Practice for Site Specific Assessment of Mobile Jack-up UnitsT&R 5-5A, Revision 1, May 1997
3. SNAMENorth Sea Annex to SNAME T&R Bulletin 5-5A – Draft for Industry CommentRevision D5, September 1999
4. SHELL EXPROMetocean Data for Selected North Sea FieldsDecember, 1999
5. NOBLE DENTON CONSULTANCY SERVICES LTDJack-Up Assessment Criteria. Interim Scope of Work Items 1.1 to 1.4 on ReliabilityAnalysisL15323/NDCS/RVA, Rev 2, 4th March 1991
6. NOBLE DENTON CONSULTANCY SERVICES LTDJack-Up Assessment Criteria. Statement of Variable SelectionL15670/NDCS/RVA, Rev 0, 12th September 1991
7. NOBLE DENTON CONSULTANCY SERVICES LTDJack-Up Reliability Study. Procedural and Input Study - Draft 119th September 1991
8. P A F A CONSULTING ENGINEERSImplications for the Assessment of Existing Fixed Steel Structures of Proposed ISO13819-2 Member Strength FormulationsC031-002-R Rev 1, February 2000
9. NOBLE DENTON CONSULTANCY SERVICES LTDJack-Up Assessment Criteria. Reliability Analysis of M116C in 55 m Water Depth, F&GMod V in 97 m Water Depth, F&G Mod VI in 118 m Water Depth Operating in the NorthSeaL15709/NDCS/RVA, Rev 2, 27th February 1992
10. NOBLE DENTON CONSULTANCY SERVICES LTDJack-Up Assessment Criteria. Executive Summary and Conclusions of L15709/NDCS/RVA,Rev 2 27th February 1992
11. NOBLE DENTON CONSULTANCY SERVICES LTDJack-Up Assessment Criteria: Status Summary on Stage 2 of Reliability Analysis24 August 1992 (Preliminary)
12. NOBLE DENTON CONSULTANCY SERVICES LTDJack-Up Assessment Criteria (Stage 2). Reliability Analysis of M116C in 55 m WaterDepth, F&G Mod V in 97 m Water Depth, F&G Mod VI in 118 m Water Depth and M116Cin 65 m Water Depth in the Elevated Condition

66
Report No: L16268/NDCS/RVA Rev No 1 dated 8 January 1993
13. JOINT INDUSTRY JACK-UP COMMITTEESummary of the Invitation Meeting of 11th, 12th, March 1993 at Noble Denton’s Offices inLondon(including attachments).
14. JACK-UP SITE ASSESSMENT PROCEDURESEstablishment of an International Technical GuidelineMeeting of 4th May 1993 at Marriott Astrodome Hotel, Houston
15. NOBLE DENTON CONSULTANCY SERVICESJack-Up Assessment Criteria. Executive Summary and Conditions of Stage 2 WorkReport No. L16593/NDCS/RVA Rev 1, dated 4 August 1993
16. JACK-UP SITE ASSESSMENT PROCEDURESEstablishment of an International Technical GuidelineMinutes of Seminar of 23rd September, 1993 at City University, London
17. JOINT INDUSTRY PROJECTJack-Up Site Assessment Procedures – Establishment of an International RecommendedPracticeSeminar, City University, London, 23rd September, 1993

Table 1Water levels at selected site
50-year individual 100-yearindividual
Nominal LAT (m) 59 59Storm surge (m) 1.53 1.60Tidal rise MHWS (m) 2.49 2.49Max SWL ref. LAT (m) 4.02 4.09Crest elevation (m) not available 11.2Total water level(max SWL + Crest elevation) (m) 15.3
Table 2Environmental data for selected site
50-yearindividual
100-yearindividual 100-year joint
Wind velocity at 10m heightV (1-hour) (m/s) 33.5 34.5V (1-min) (m/s) 39.5 40.7
see discussionin Section 2.4
Wave height and periodHs (m) 10.6 10.8Tz (central) (s) 11.1 11.2Hmax (m) 18.6 19.0Tmax (central) (s) 14.2 14.3
Current velocityDepth-mean velocity (m/s) 0.95 0.99 0.56Surface current velocity (m/s) 1.02 1.06 0.60
Table 3Current velocity profile
Proportional heightabove sea-bed
Ratio of velocity todepth-mean velocity
1.00d 1.070.75d 1.070.50d 1.070.25d 0.970.15d 0.900.05d 0.770.01d 0.61

Table 4Soil profile
Depth below mudline Description0.0 to 2.7m very soft CLAY
2.7m to 7.5m sandy CLAY Su = 200 kPa> 7.5m medium dense SAND
Table 5Dead load summary
Description of Loading Weight (MN) LCG (m) TCG (m)Hull basic and fixed load 42.7 42.82 0.24
Cantilever assembly 8.1 60.23 -0.29Bow leg and spudcan 8.7 18.29 0.00Port leg and spudcan 8.7 57.61 -21.64
Starboard leg and spudcan 8.7 57.61 21.64Total 76.9 45.23 0.10
LCG is measured aft of hull bow and TCG is measured off the centrelineof the hull, taken as positive towards starboard.
Table 6Load factors for assessment in accordance
with 5-5A and NSA
LimitState
Dead Loads
(D)γ1
Variable Loads
(L)γ2
EnvironmentalLoads
(E)γ3
DynamicLoads(Dn)
γ4ULS 1.0 1.0 1.25 1.0
The factored load vector Q = γ1 D + γ2 L + γ3 (E + γ4 Dn)
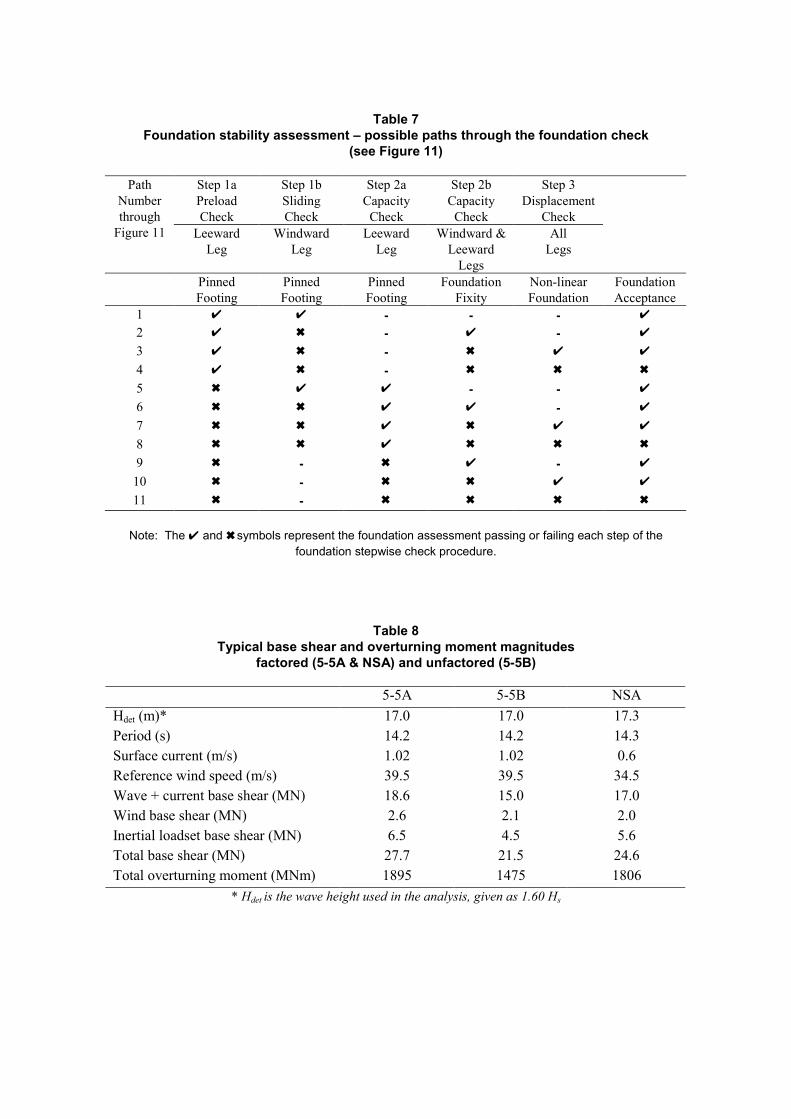
Table 7Foundation stability assessment – possible paths through the foundation check
(see Figure 11)
Step 1a Step 1b Step 2a Step 2b Step 3PreloadCheck
SlidingCheck
CapacityCheck
CapacityCheck
DisplacementCheck
PathNumberthrough
Figure 11 LeewardLeg
WindwardLeg
LeewardLeg
Windward &Leeward
Legs
AllLegs
PinnedFooting
PinnedFooting
PinnedFooting
FoundationFixity
Non-linearFoundation
FoundationAcceptance
1 ✔ ✔ - - - ✔
2 ✔ ✖ - ✔ - ✔
3 ✔ ✖ - ✖ ✔ ✔
4 ✔ ✖ - ✖ ✖ ✖
5 ✖ ✔ ✔ - - ✔
6 ✖ ✖ ✔ ✔ - ✔
7 ✖ ✖ ✔ ✖ ✔ ✔
8 ✖ ✖ ✔ ✖ ✖ ✖
9 ✖ - ✖ ✔ - ✔
10 ✖ - ✖ ✖ ✔ ✔
11 ✖ - ✖ ✖ ✖ ✖
Note: The ✔ and ✖ symbols represent the foundation assessment passing or failing each step of thefoundation stepwise check procedure.
Table 8Typical base shear and overturning moment magnitudes
factored (5-5A & NSA) and unfactored (5-5B)
5-5A 5-5B NSAHdet (m)* 17.0 17.0 17.3Period (s) 14.2 14.2 14.3Surface current (m/s) 1.02 1.02 0.6Reference wind speed (m/s) 39.5 39.5 34.5Wave + current base shear (MN) 18.6 15.0 17.0Wind base shear (MN) 2.6 2.1 2.0Inertial loadset base shear (MN) 6.5 4.5 5.6Total base shear (MN) 27.7 21.5 24.6Total overturning moment (MNm) 1895 1475 1806
* Hdet is the wave height used in the analysis, given as 1.60 Hs

Table 9Maximum member utilisation ratios for 5-5A
Guide at node Guide at midspan
GroupWave
Direction(deg)
ElementMaxUR
WaveDirection
(deg)Element
MaxUR
Midspan UR/Node UR
Reinforcedchord (η=1.00) 60 98 1.76 60 2209 1.86 1.06
Reinforcedchord (η=1.45) 60 98 1.41 60 2209 1.50 1.06
Reinforcedchord (η=2.25) 60 98 1.22 60 2209 1.27 1.04
Unreinforcedchord 30 150 0.80 30 150 0.75 0.94
Horizontal 30 195 0.92 0 187 0.87 0.95
Span breaker 60 656 0.30 60 654 0.31 1.03
Diagonal 30 402 0.80 0 402 0.84 1.05
Increased thk.Horizontal 30 2066 0.47 0 2081 0.47 1.00
Increased thk.diagonal 30 2105 0.79 30 2105 0.74 0.94
Table 10Maximum member utilisation ratios for 5-5B
Guide at node Guide at midspan
GroupWave
Direction(deg)
ElementMaxUR
WaveDirection
(deg)Element
MaxUR
Midspan UR/Node UR
Reinforcedchord, rack 30 98 1.63 30 2209 1.74 1.07
Reinforcedchord, guide 30 102 1.13 30 2208 1.13 1.00
Unreinforcedchord, rack 30 150 0.75 30 150 0.74 0.99
Unreinforcedchord, guide 30 150 0.75 30 150 0.74 0.99
Horizontal 30 195 0.85 30 195 0.84 0.99
Span breaker 60 654 0.25 60 654 0.25 1.00
Diagonal 30 402 0.70 30 402 0.75 1.07
Increased thk.Horizontal 30 2066 0.44 30 2066 0.45 1.02
Increased thk.diagonal 30 2105 0.73 30 2105 0.74 1.01

Table 11Maximum member utilisation ratios for the NSA
Guide at node Guide at midspan
GroupWave
Direction(deg)
ElementMaxUR
WaveDirection
(deg)Element
MaxUR
Midspan UR/Node UR
Reinforcedchord (η=1.00) * 60 2209 1.64
Reinforcedchord (η=1.45) * 60 2209 1.31
Reinforcedchord (η=2.25) * 60 2209 1.13
Unreinforcedchord * 30 150 0.73
Horizontal * 0 187 0.88
Span breaker * 60 654 0.28
Diagonal * 0 402 0.85
Increased thk.Horizontal * 0 2081 0.45
Increased thk.diagonal * 30 2105 0.71
*Note that guide at node analysis was not performed for the North Sea Annex in view of the results for 5-5A and 5-5B
Table 12Member utilisation ratio comparisons
Group Guide at node Guide at midspan5-5B/5-5A NSA/5-5A 5-5B/5-5A NSA/5-5A
Reinforced chord rack (η = 1.00) 0.93 * 0.94 0.88Unreinforced rack chord 0.94 * 0.99 0.97
Horizontal 0.92 * 0.97 1.01Span breaker 0.83 * 0.81 0.90
Diagonal 0.88 * 0.89 1.01Increased thk. horizontal 0.94 0.96 0.96Increased thk. diagonal 0.92 * 1.00 0.96
*NSA analysis only performed for guide at midspan position

Table 13Comparison of utilisation ratios for load factors
applied to load effects and to load patterns
GroupLoad pattern
URLoad effect
URReinforced chord (η=1.00) 1.91 1.26Reinforced chord (η=1.45) 1.52 1.09Reinforced chord (η=2.25) 1.27 0.99Unreinforced Chord 0.90 0.53Horizontal 1.00 0.92Span breaker 0.56 0.46Diagonal 1.02 0.82Increased thickness horizontal 0.61 0.57Increased thickness diagonal 1.08 0.98
Table 14Maximum utilisation ratios for preload condition
5-5A 5-5BGroup UR Element UR ElementReinforced chord(η=1.00)
0.37 1405 0.59 1405
Reinforced chord(η=1.45)
0.45 1405 -
Reinforced chord(η=2.25)
0.57 1405 -
Unreinforced Chord 0.41 821 0.60 821Horizontal 0.12 1543 0.30 1544Span breaker 0.09 2140 0.16 2141Diagonal 0.07 1750 0.11 1750Increased thicknesshorizontal 0.12 2080 0.23 2080
Increased thicknessdiagonal 0.08 2137 0.17 2137

Table 15Summary of results
5-5A 5-5B NSA
Hdet (m) * 17.0 17.0 17.3Period (s) 14.2 14.2 14.3Surface current (m/s) 1.02 1.02 0.6Reference wind speed (m/s) 39.5 39.5 34.5Factored wave + current base shear (MN) ** 18.6 15.0 17.0Factored wind base shear (MN) ** 2.6 2.1 2.0Factored inertial loadset base shear (MN) ** 6.5 4.5 5.6Factored total base shear (MN) ** 27.7 21.5 24.6Corresponding factored overturning moment(MNm) **
1895 1475 1806
1.86 (η=1.00) 1.74 (rack) 1.64 (η=1.00)1.50 (η=1.45) 1.13 (guide) 1.31 (η=1.45)
Max UR reinforced chord
1.27 (η=2.25) - 1.13 (η=2.25)Max UR unreinforced chord 0.75 0.74 0.73Max UR horizontal 0.87 0.84 0.88Max UR span breaker 0.31 0.25 0.28Max UR diagonal 0.84 0.75 0.85Max UR increased thickness horizontal 0.47 0.45 0.45Max UR increased thickness diagonal 0.74 0.74 0.71Max UR reinforced chord – preload # 0.37 0.59 -Max UR unreinforced chord – preload # 0.41 0.60 -Max UR horizontal – preload # 0.12 0.30 -Max UR span breaker – preload # 0.09 0.16 -Max UR diagonal – preload # 0.07 0.11 -Max UR increased thickness horizontal –preload #
0.12 0.23 -
Max UR increased thickness diagonal –preload #
0.08 0.17 -
Bearing capacity leeward leg, UR 0.44 0.33 -Sliding capacity windward leg, UR 0.72 0.67 -Overturning check ## 1.93 1.57 1.84
* Hdet is the wave height used in the analysis, given as 1.60Hs** Load factors are applicable to 5-5A only
# One third increase in allowable stresses not used for preload conditions in 5-5B checks## As the basic equation used in the overturning stability check for 5-5B is based on the reciprocal
of the equation used in 5-5A, the reciprocal of the utilisation for 5-5B is reported for consistency

Table 16Comparisons of 5-5A and 5-5B safety factors under extreme environmental loading
Criterion Condition 5-5A 5-5BBending dominated Compact I-section
Compact tubular1.391.39
1.301.35
Structural Strength
Axial dominated(compact section)
Short columnLong column (λ = 1)
1.471.47
1.251.42
Overturningmoment
Displacement effects treated as reduction instabilising moment
1.32 1.10
Preload Leeward leg GL onlyEL only
EL/GL = 2/3
1.111.391.22
1.001.001.00
Sliding Windward leg Sand/drainedClay/undrained
1.56*1.95*
1.001.00
Maximum bearingarea not mobilised
(φ== 0.90)
GL onlyEL only
EL/GL = 2/3
1.111.391.22
1.001.001.00
Capacity check -Pinned foundation
Maximum bearingarea mobilised
(φ== 0.85)
GL onlyEL only
EL/GL = 2/3
1.181.471.29
1.001.001.00
GL = Gravity loads, EL = Environmental loads* minimum values since effect of load factors on vertical loads has not been ignored.
This will lead to reduced horizontal foundation capacity
Table 17Determined distribution parameters for the important basic variables
Basic variable Distributionparameter
MarathonLeTourneau 116C
Friede &Goldman Mod V
Friede &Goldman Mod VI
Significant waveheight (annual)
MeanCOV
8.05 m13%
10.5 m13%
11.6 m13%
Wind speed 1 hourmean (annual)
MeanCOV
27.7 m/s13%
27.7 m/s13%
28.5 m/s13%
Tidal current Mean 0.17 0.15 0.14COV 53% 43% 24%
Random wave drag Mean 10.2 m 4.90 m 6.35 mcoefficient (CdD) COV 20% 20% 20%
Table 18Factors of safety for considered units under loading conditions relevant
for reliability analysis
Jack-up Unit Overturning moment Preload Strength unity checkMarathon LeTourneau 116C 1.33 0.97 1.32Friede & Goldman Mod V 1.29 1.00 1.08Friede & Goldman Mod VI 1.23 1.06 1.33

Figure 1Jack-up layout

104.632m
Tip of can
Figure 2Isometric of jack-up
XYZ

Figure 3Reinforced and unreinforced chord
Figure 4Wave directions used in analysis
Guide plate711 x 51
Rack plate213 x 127
(Fy = 586 MPa) Side plate466 x 19
Notes:1. All dimensions in mm2. Fy = 483 MPa, unless noted
(a) Unreinforced
(b) Reinforced
Guide plate711 x 51
Rack plate213 x 127
(Fy = 586 MPa) Side plate466 x 19
Side plate reinforcement305 x 38
Rack plate reinforcement102 x 25
CLX
Y
PORT
STBD
BOW0°
90°
150°30°
60°
180°
120°
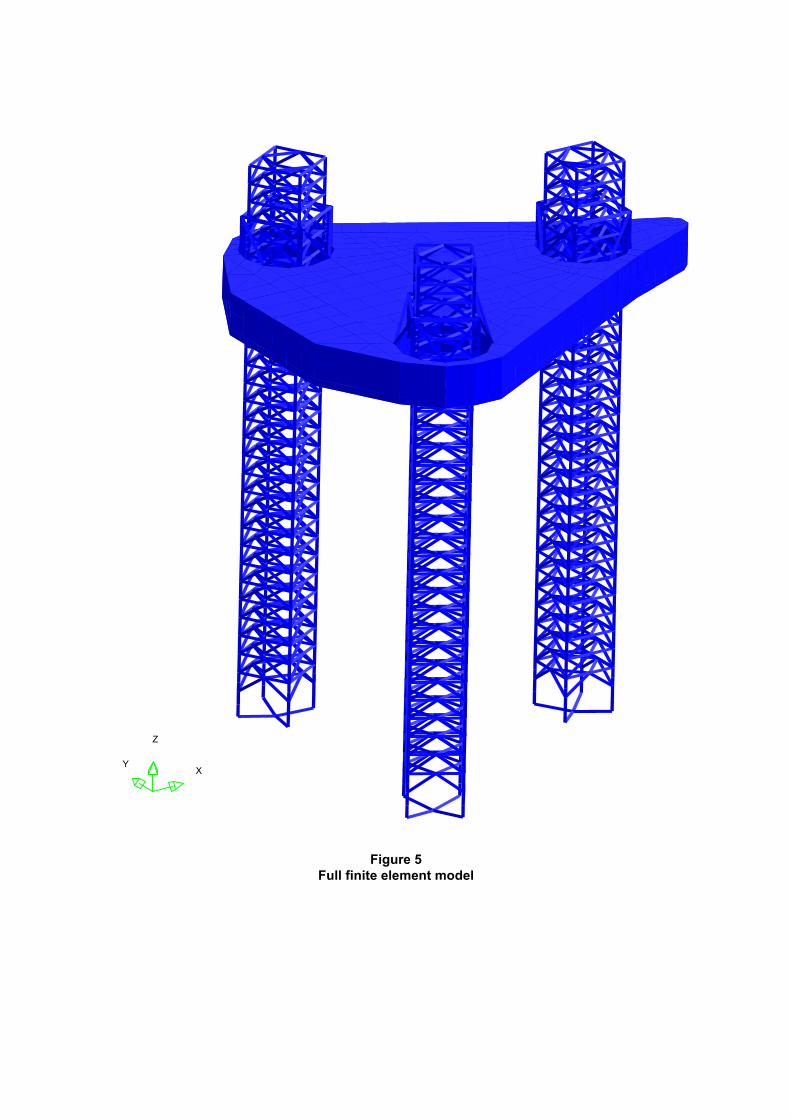
Figure 5Full finite element model
XY
Z

Figure 6Detailed leg model
XY
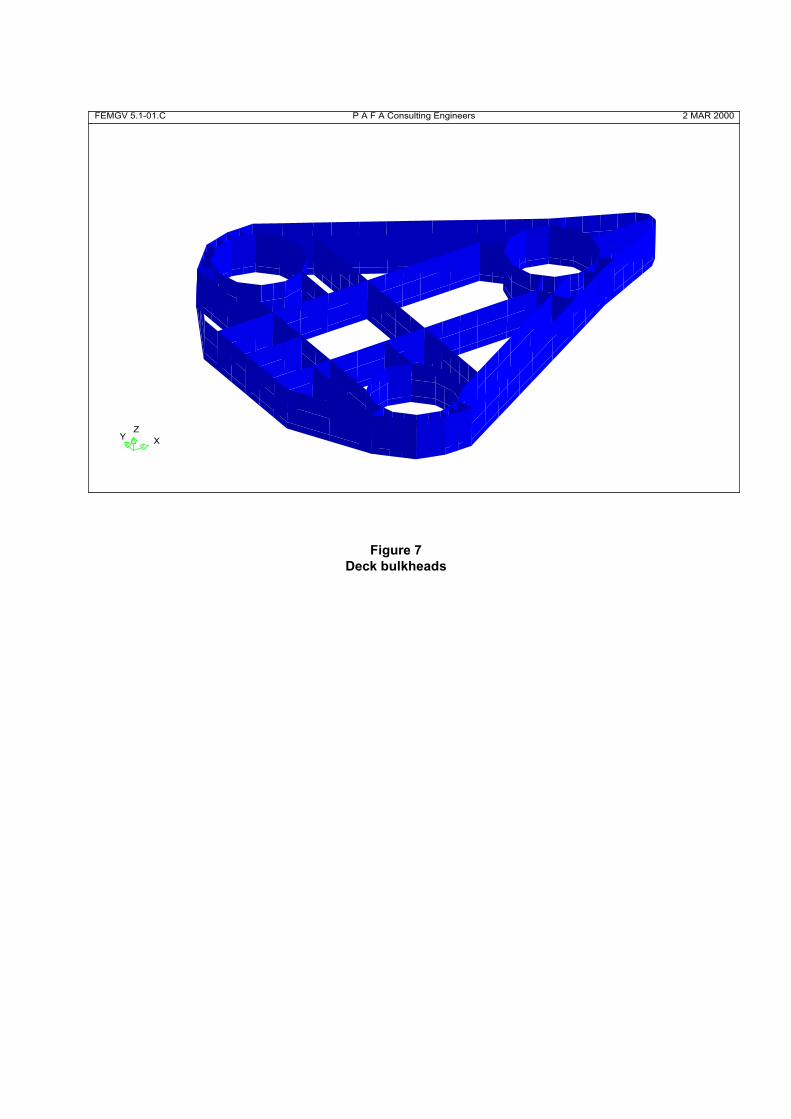
Figure 7Deck bulkheads
XYZ
FEMGV 5.1-01.C 2 MAR 2000P A F A Consulting Engineers

Figure 8aConnection point for guide arrangement
Figure 8bConnection point for guide arrangement
2
Nonlinearspringelements
Yoke
Chordcentroid
Indicatesconnection betweennonlinear springsand “stiff beam”elements
Stiff beamelements
Upperguide
Lowerguide
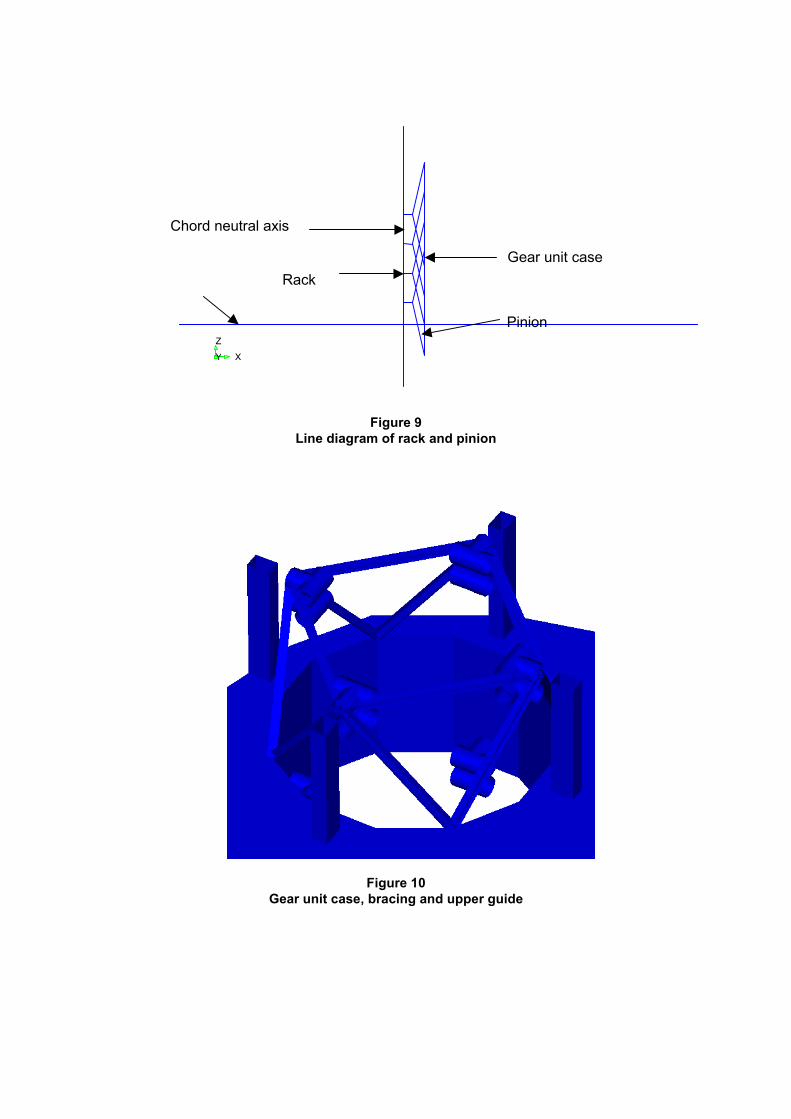
Figure 9Line diagram of rack and pinion
Figure 10Gear unit case, bracing and upper gu
XY
Z
Gear unit case
Chord neutral axis
Rack
Pinion
ide

Figure 11Foundation stability assessment flow diagram

Figure 12Step 1a: Preload check of the leeward leg - pinned foundation
Figure 13Step 1b: Sliding check of the windward leg - pinned foundation
0.0
0.5
1.0
1.5
2.0
2.5
3.0
0% 20% 40% 60% 80% 100%
Percentage of Vertical Load from Environmental & Dynamic Loads
LRFD
/WSD
0 .0
0 .5
1 .0
1 .5
2 .0
2 .5
3 .0
-4 0 % -3 5 % -3 0 % -2 5 % -2 0 % -1 5 % -1 0 % -5 % 0 %
P e rc e n ta g e o f V e r t ic a l L o a d f ro m E n v iro n m e n ta l & D y n a m ic L o a d s
LRFD
/WSD
c la y
s a n d

Figure 14Step 2a : Capacity check of the leeward leg pinned fixity
Figure 15Step 2b : Capacity check of the leeward and windward leg foundation fixity
0.0
0.5
1.0
1.5
2.0
2.5
3.0
0% 20% 40% 60% 80% 100%Percentage of Vector of Vertical and Horizontal Leg Loads
from Environmental & Dynamic Loads
LRFD
/WSD
Max. bearingarea not
mobilised
Max. bearingarea mobilised
0.0
0.5
1.0
1.5
2.0
2.5
3.0
-40% -20% 0% 20% 40% 60% 80% 100%
Percentage of Vector of Vertical and Horizontal Leg Loadsand Spudcan Moment from Environmental & Dynamic Loads
LRFD
/WSD

Figure 16Jack-up eigenvalues, period = 8.27 seconds

Figure 17Jack-up eigenvalues, period = 8.15 seconds

Figure 18Jack-up eigenvalues, period = 6.81 seconds

Figure 19U
tilisation ratios for lower guide adjacent to leg chord node
1502083
2104
98150
195
656
403
20832104
98
195
656
403
1
23
FEMGV 5.1-01.C3 MAR 2000
P A F A Consulting Engineers

Figure 20U
tilisation ratios for lower guide adjacent to leg chord m
idspan
2209
150
187
654
403
20832104
406
2115
2209
187
654
403
406
150
2083
21042115
1
23
FEM
GV
5.1-01.C3 M
AR
2000P
A F A
Consulting E
ngineers

Figure 21Bearing capacity envelope for leeward (bow) leg – wave from 0°
0
20
40
60
80
100
120
140
160
180
0 10 20 30 40 50 60 70
Horizontal Load (MN)
Ver
tical
Loa
d (M
N)
FVH_WSD = 146.8 MN
FVH_LRFD = 121.6 MN
SWL = 30.1 MN
QVH_LRFD = 54.0 MNQVH_WSD = 49.2 MN
Unfactored capacity
Factored capacity

Figure 22Comparison of 5-5A correct and incorrect tubular Mn moment capacities
Figure 23Comparison of 5-5A and 5-5B tubular column axial compression capacities
0.E+00
2.E+09
4.E+09
6.E+09
8.E+09
1.E+10
0 25 50 75 100 125 150 175
Correct MnIncorrect Mn
D/t
Mn (Nmm)
λr
λp
0
100
200
300
400
500
0 5 10 15 20 25 30
5-5A5-5B
fa (N/mm²)
L/D
HorizontalDiagonal
Span breakerD/t = 12.8 Fye = 574.2 MPa

Figure 24Comparison of 5-5A and 5-5B tubular bending capacities
0
100
200
300
400
500
600
0 10 20 30 40 50
5-5A5-5B
fb (N/mm²)
D/t
Horizontal Span breakerDiagonal

Figure 25Comparison of 5-5A and 5-5B tubular column compression and bending interaction
capacities following a full non-linear structural analysis and assuming K = 0.8

Figure 26Comparison of 5-5A and 5-5B prismatic column compression
capacities for compact sections
Figure 27Comparison of 5-5A and 5-5B prismatic section
bending capacities for compact/noncompact sections
0
100
200
300
400
0.00 0.50 1.00 1.50 2.00
5-5A5-5B
fa (N/mm²)
λ
Fy = 460 MPa
0
100
200
300
400
500
600
0 7 14 21 28 35
5-5A5-5B
fb (N/mm²)
b/t

Figure 28Comparison of 5-5A and 5-5B prismatic column compression and bending interaction
capacities for compact sections following a full non-linear structural analysis andassuming K = 1.0

Printed and published by the Health and Safety ExecutiveC0.5 3/01

OTO 2001/001
£20.00 9 780717 619801
ISBN 0-7176-1980-X