Embed Size (px)
Citation preview

1
TWSE Code 5871
May 24 , 2017
HSBC Taiwan Executive Forum

Disclaimer
This presentation contains forward-looking statements concerning the financial condition, results
of operations and businesses of Chailease Holding Company Limited (the "Company"). All
statements other than statements of historical fact are, or may be deemed to be, forward-looking
statements. Forward-looking statements are statements of future expectations that are based on
management’s current expectations and assumptions and involve known and unknown risks and
uncertainties that could cause actual results, performance or events to differ materially from those
expressed or implied in these statements. Forward-looking statements include, among other
things, statements concerning the potential exposure of the Company to market risks and
statements expressing management’s expectations, beliefs, estimates, forecasts, projections and
assumptions. These forward-looking statements are identified by their use of terms and phrases
such as ‘‘anticipate’’, ‘‘believe’’, ‘‘could’’, ‘‘estimate’’, ‘‘expect’’, ‘‘intend’’, ‘‘may’’, ‘‘plan’’,
‘‘objectives’’, ‘‘outlook’’, ‘‘probably’’, ‘‘project’’, ‘‘will’’, ‘‘seek’’, ‘‘target’’, ‘‘risks’’, ‘‘goals’’,
‘‘should’’ and similar terms and phrases. There are a number of factors that could affect the
future operations of the Company and could cause those results to differ materially from those
expressed in the forward-looking statements included in this document. All forward-looking
statements contained in this document are expressly qualified in their entirety by the cautionary
statements contained or referred to herein. Readers should not place undue reliance on forward-
looking statements. Each forward-looking statement speaks only as of the date of this
presentation. Neither the Company nor any of its subsidiaries undertake any obligation to publicly
update or revise any forward-looking statement as a result of new information, future events or
other information. In light of these risks, results could differ materially from those stated, implied
or inferred from the forward-looking statements contained in this presentation .
2

Agenda
Business Review
1Q2017 Performance Review
Segment Review
Q&A
Appendix
Company Overview
3

Chailease Holding Co., LTD.
■ Leading Taiwan-based Finance Company.
■Over 40 Years of Experience & In-depth Knowledge Of SME Financing.
■ Prudent Risk Management with Proved Track Records.
■ Positioned As a Multi Financing Service Provider To SMEs.
■ Taiwan Serves As a Product And HR Development Center.
■ Steadily Increases Sources Of Non-interest Income.
4

Leading Taiwan-based SME Finance Company with Focus on Greater China and Emerging Asia
Commenced operations in 2005 with national
leasing license
Focus on capital leasing and expanding into
factoring and trade financing
~11,000 clients (90% are local enterprises)
37 offices nationwide and 690 sales personnel
PRC
Taiwan
40 years of operating track record since 1977
Leading market position in leasing and
installment sales
Full SME financing platform
Diversified SME-focused customer base with
over 20,000 corporate clients
13 offices and over 1,200 sales personnel
Thailand
Commenced operations in 1989
Focus on automobile installment
sales, equipment leasing and
factoring
10 offices in key commercial hubs
Vietnam
Commenced operations in 2007
Focus on capital leasing
3 offices in Hanoi, HCMC and Cantho
Notes
Unless otherwise indicated, all figures are as of Dec. 31, 2016
1. Others include assets from our U.S. and Vietnam operations as well as those of the holding companies; the Company is engaged in commercial real estate financing in the U.S. (Los Angeles) and focuses mainly on asset
management and risk control since the subprime crisis
5

Agenda
Business Review
1Q 2017 Performance Review
Segment Review
Q&A
Appendix
Company Overview
6

Customized SME Financing Solutions and
New and Innovative Products
■Chailease has presence
in 13 locations in Taiwan
– Covers all the major
commercial centers
■More than 2,000
personnel as at Dec. 31,
2016
■45% of total contract
value of new leasing and
installment sales
contracts among TLA
members in 2015 in
Taiwan
Hsinchu
Kaohsiung
Tainan
Changhwa
Ilan
Taichung
Taipei Taoyuan
New Taipei
Hsinchung
Chungli
Chiayi
1977
1980
1986
1989
1995
2011
2012
Leasing Installment sales
International factoring
Automobile installment sales
Domestic factoring
Direct financing
Automobile leasing
Car rental
ESCO financing
Insurance brokerage
2006
Extensive Distribution Network
Market Leader in the Taiwan Leasing Industry
2003
Aircraft financing
2013
7
Hualian
2014
Solar project

Well Positioned to Capture the Significant Growth Potential in the PRC
Extensive Footprint across Major
Industrial & Commercial Hubs in PRC(2)
Source Company
PRC Strategy
8
Expand presence gradually from coastal
regions to inland cities
Broaden industry exposure
Expand product offerings and enter niche
financing businesses
1
2
3
4 Further strengthen risk and human resources
management
Newly added branches for 2017:
Taizhou and Dongguan

Strategic Alliances with major banks to
ensure sufficient funding to support growth
Offshore Funding
Medium-Term Note
Continue to diversify sources of funding
and lower funding cost
• Bank Loans
• Commercial Papers
• Corp Bonds
• TWSE Listing
• Securitization
Taiwan PRC
Adequate and Diverse Funding to Support Business Growth
9

Effective Credit Risk Management System and Risk Pricing Mechanism
Credit Policy
■ Enforcement of the credit grading and scoring system
■ Performance review tied to asset quality
Effective Credit Review and Approval Process to Ensure Adequate Return Risk Exposure
1
Review Application Documents
• Whether the application has any element falling into the blacklist
• Whether all the required documents are in order
• Any need to request other documents
Credit Rating and Approval
• Proceed within the scope of authorisation
3 Confirmation and Approval
Initial Application 2
Discussion Between Business Department and Credit Department
Case Assignment
• The management of credit department assigns the application to a credit officer
• Discuss and clarify the structure of the application and identify issues
On-Site Visit
Analyse credit data
Decide the credit amount and financing terms
Appraisal
Prepare credit analysis reports
Credit rating and scoring, and applying the risk model
• On-site credit investigation to reduce the possibility of misjudgment
• Face-to-face credit investigation to verify the accuracy of information provided or to supplement information
Information Gathering and Analysis
Credit Approval Process
Credit Review and Decision Process
■ Standardized operating procedure of credit evaluation
■ Segregation of sales and credit appraisal functions
■ Streamlined credit approval process
10

■ Develop various credit risk
management models based on the
use of credit rating system
■ Integrate qualitative and
quantitative client information to
quantify a client’s creditworthiness
and provide an early earning
mechanism with regard to its
overall risk exposure
■ The IRB approach consists of:
Comprehensive Credit Risk Model Increases the Accuracy of Assessment
Internal Rating Based (“IRB”) Approach Model Structure Model Application
Credit Risk
Management Model
(Quantification)
Credit Rating System
(Expertise/
Quantification)
■ Built according to actual SME
samples
■ Financial and non-financial factors
included
■ Constructed using diversified statistical
methods
■ Suitable for SME risk assessment
■ Periodical review to ensure adequacy
of the model
■ Estimate and quantify the risk
(EAD*PD)
■ Provide the basis for underwriting and
financing terms structuring (e.g. adjust
financing terms or make credit
enhancement)
■ Calculate the expected loss and
provide allowance for impairment
losses
Expected
Loss
Exposure
At
Default
Probabi-
lity of
Default
Loss
Given
Default = x x
The Company Calculates
Probability of Default for Each
Rating Level Based on the
Risk Assessment Model
Input Output
Scoring
Materials
■ Default assessment
■ Default point
■ Probability of
default
1 Enhance risk management capability with a standardized and tested methodology
2 Enhance accuracy of risk assessment and credit exposure
3 Reduce potential loss
Effective Credit Risk Management System and Risk Pricing Mechanism (Cont’d)
11

Agenda
Business Review
1Q 2017 Performance Review
Segment Review
Q&A
Appendix
Company Overview
12

Consolidated loan portfolio growth in line with the target, on
a local currency basis.
Operational efficiency further increased.
China asset quality remains on an improving trend.
1Q2017 YOY QOQ
Consolidated 6% -1%
Taiwan 10% 2%
China -4%(RMB7%) -5%(RMB0%)
ASEAN 10% 0%
Management Highlights
13

Unit: NT$ million
Source: unaudited financial statements Excludes US securitization asset
QOQ -1%
Total Portfolio Consolidated
14

Exclude sales revenue and service fee from securitization Source: unaudited financial statements
Loan Yield & COF Consolidated
15

Unit: NT$ million
Source: unaudited financial statements Exclude US securitization asset, sales revenue and service fee from securitization
Fee Income Consolidated
16

Source: unaudited financial statements
Revenue Consolidated
17
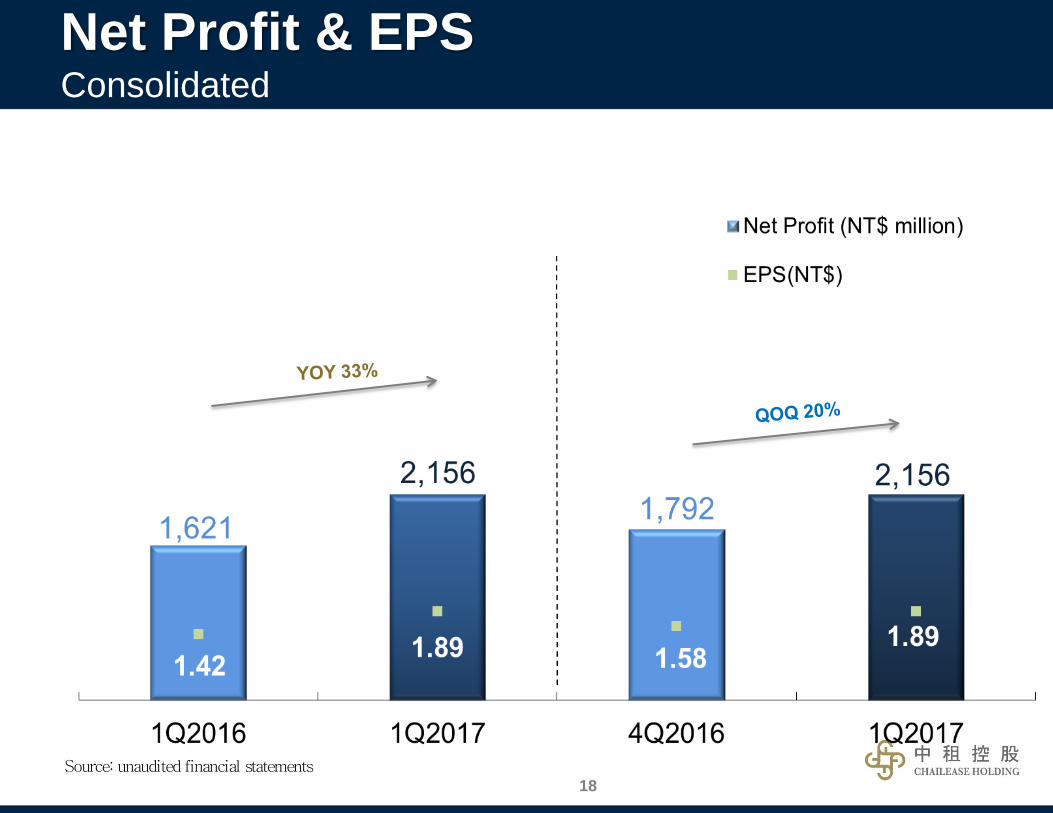
Source: unaudited financial statements
Net Profit & EPS Consolidated
18

Cost to Income Ratio=Opex excludes impairment losses on receivables / Gross profit from operation Source: unaudited financial statements
Cost to Income Asset to Equity
Cost to Income & Asset to Equity Consolidated
19

ROA ROE
Source: unaudited financial statements
ROA & ROE Consolidated
20

Delinquency Allowance
Definitions of delinquencies:
• Check payments: overdue more than 7 days
• Equipment leasing with non-check payments: overdue more than 30 days
• Automobile installment sales in Thailand: overdue more than 90 days
Source: unaudited financial statements Excludes US securitization asset
Asset Quality Consolidated
21

Agenda
Segment Review
1Q 2017 Performance Review
Business Review
Q&A
Appendix
Company Overview
22

Unit: NT$ million
Source: unaudited financial statements
Total Loans & Receivables Taiwan
23

Source: unaudited financial statements Excludes sales revenue and service fee from securitization
Loan Yield & COF Taiwan
24

Unit: NT$ million
Source: unaudited financial statement Exclude sales revenue and service fee from securitization
Fee Income Taiwan
25

Unit: NT$ million
Source: unaudited financial statements
Revenue Taiwan
26

Unit: NT$ million
Source: unaudited financial statements
Net Profit Taiwan
27
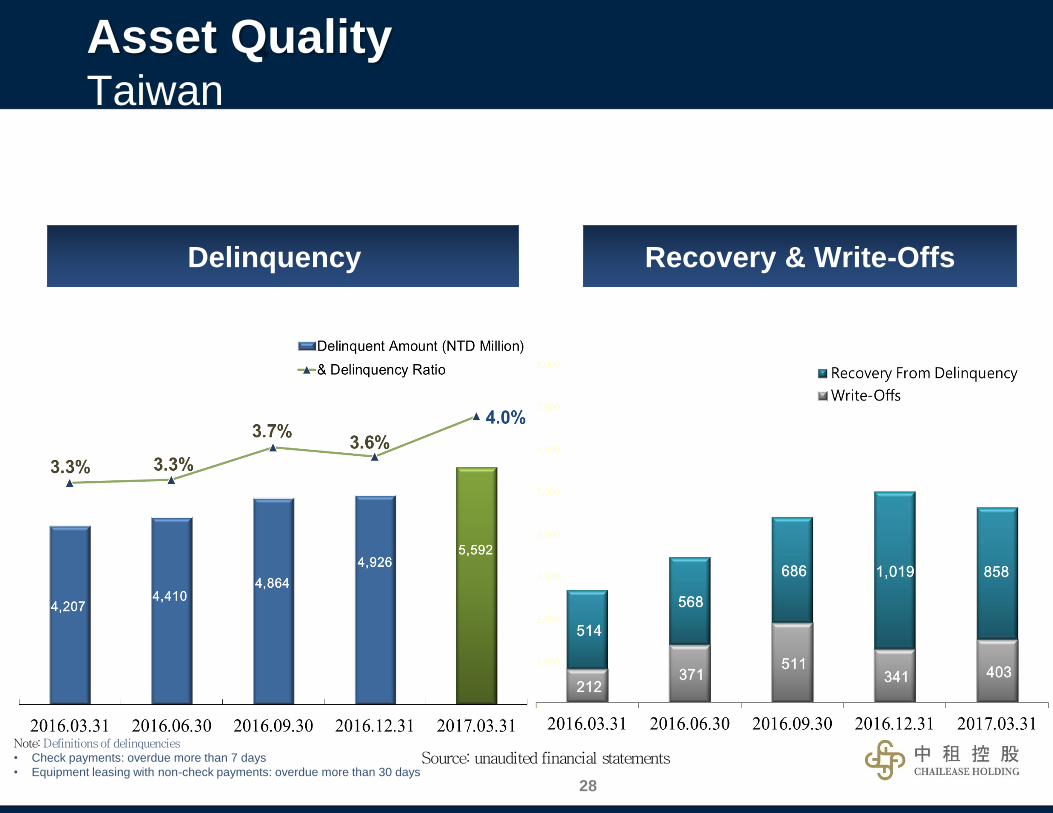
Delinquency Recovery & Write-Offs
Note: Definitions of delinquencies • Check payments: overdue more than 7 days
• Equipment leasing with non-check payments: overdue more than 30 days Source: unaudited financial statements
Asset Quality Taiwan
28

Note: Definitions of delinquencies • Check payments: overdue more than 7 days
• Equipment leasing with non-check payments: overdue more than 30 days Source: unaudited financial statements
Asset Quality-Allowance
Taiwan
29

Unit: NT$ million
YOY -4% (RMB 7%)
Source: unaudited financial statements
QOQ -5% (RMB 0%)
Total Loans & Receivables China
30

Source: unaudited financial statements Loan yield excludes sales revenue
Loan Yield & COF China
31

Unit: NT$ million
Source: unaudited financial statement
Fee Income China
32

Unit: NT$ million
Source: unaudited financial statements
YOY 4%
Revenue China
33

Unit: NT$ million
Source: unaudited financial statements
Revenue Breakdown China
34

Net Profit China
Unit: NT$ million
Source: unaudited financial statements
35

Asset Quality China
Delinquency Recovery & Write-Offs
Definitions of delinquencies • Check payments: overdue more than 7 days
• Equipment leasing with non-check payments: overdue more than 30 days
Source: unaudited financial statements
36

Definitions of delinquencies • Check payments: overdue more than 7 days
• Equipment leasing with non-check payments: overdue more than 30 days
Source: unaudited financial statements
Asset Quality-Allowance
China
37

Total Portfolio ASEAN (Thailand, Vietnam, Malaysia and
Cambodia) Unit: NT$ million
Source: unaudited financial statements
38
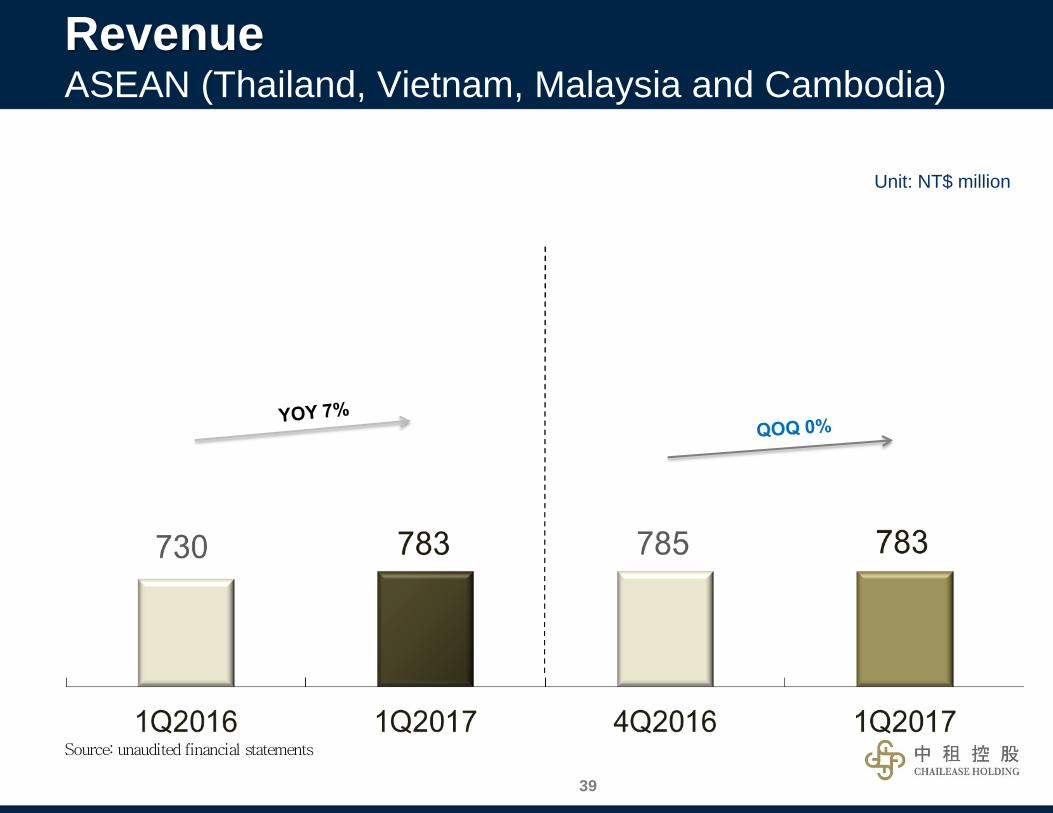
Revenue ASEAN (Thailand, Vietnam, Malaysia and Cambodia)
Unit: NT$ million
Source: unaudited financial statements
39

Net Profit ASEAN (Thailand, Vietnam, Malaysia and Cambodia)
Unit: NT$ million
Source: unaudited financial statements
QOQ -8%
40

Agenda
Management Highlight
1Q 2017 Performance Review
Segment Review
Q&A
Company Overview
42
Appendix

Source: unaudited financial statements
(NTD'000) 2017.3.31 2016.3.31 YOY(%) 2016.12.31 QOQ(%)
Cash and cash equivalents 12,836,133 11,910,953 8 12,936,615 (1)
Total fund and investments 9,386,127 13,158,534 (29) 9,640,059 (3)
Gross loans and receivables 273,557,933 256,925,654 6 273,045,833 0
Total unearned charges and interests (25,381,906) (21,862,312) 16 (23,361,043) 9
Total allowance (8,486,521) (7,526,838) 13 (8,502,229) 0
Loans and receivables-net 239,689,506 227,536,504 5 241,182,559 (1)
Other receivables 3,646,577 3,566,300 2 3,315,724 10
Property, plant and equipment 10,095,475 9,931,587 2 10,336,214 0
Other assets 7,638,541 7,623,651 0 8,672,287 (12)
Total Assets 283,292,359 273,727,529 3 286,083,458 (1)
Interest bearing loans and borrowings
188,165,067 181,385,845 4 190,940,836 (1)
Corporate bonds payable 14,658,780 14,707,717 0 14,950,708 (2)
Other Liabilities 37,791,653 36,051,166 5 38,683,686 (2)
Total liabilities 240,615,500 232,144,728 4 244,575,230 (2)
Common stock 11,392,300 11,392,300 0 11,392,300 0
Total equity attributable to equity holders
40,371,573 39,345,717 3 39,310,443 3
Minority interests 2,305,286 2,237,084 3 2,197,785 5
Total equity 42,676,859 41,582,801 3 41,508,228 3
Consolidated Balance Sheet Summary
43

Source: unaudited financial statements
(NTD'000) 1Q 2017 1Q 2016 YOY(%) 1Q 2017 4Q 2016 QOQ(%)
Sales revenue 1,641,904 1,485,359 11 1,641,904 1,978,712 (17)
Interest income 5,655,922 5,422,624 4 5,655,922 5,634,480 0
Rental revenue 774,268 688,067 13 774,268 762,505 2
Fee and commission income 1,100,641 1,023,457 8 1,100,641 1,463,889 (25)
Other operating revenue 198,316 152,093 30 198,316 194,992 2
Total operating revenue 9,371,051 8,771,600 7 9,371,051 10,034,577 (7)
Cost of goods sold 1,425,289 1,328,761 7 1,425,289 1,662,746 (14)
Interest expense 1,163,172 1,220,137 (5) 1,163,172 1,153,817 1
Cost of rental revenue 612,209 475,835 29 612,209 541,363 13
Other operating costs 264,473 222,641 19 264,473 346,465 (24)
Total operating costs 3,465,143 3,247,374 7 3,465,143 3,704,391 (6)
Gross margin 5,905,908 5,524,226 7 5,905,908 6,330,186 (7)
Employee compensation and benefits
1,261,173 1,261,173 0 1,261,173 1,109,129 14
Impairment loss on loans, notes and receivables
1,220,072 1,189,590 3 1,220,072 1,769,962 (31)
Other operating expense 790,721 902,878 (12) 790,721 1,135,292 (30)
Total operating expenses 3,271,965 3,353,641 (2) 3,271,965 4,014,383 (18)
Other operating gain and loss 48,085 29,275 64 48,085 50,901 (6)
Total non-operationg revenue and expense
298,084 99,074 201 298,084 76,061 292
Profit before taxation 2,980,112 2,298,934 30 2,980,112 2,442,765 22
Income tax expense 741,613 595,317 25 741,613 568,497 30
Profit from continuing operations 2,238,499 1,703,617 31 2,238,499 1,874,268 19
Profit attributable to equity holders 2,156,444 1,621,126 33 2,156,444 1,792,477 20
Consolidated Income Statement Summary
44

2015 Top 5 2016 Top 5
Wholesale Living Consumption Goods
Real Estate
Agriculture, Forestry, Fishing and Mining Wholesale Durables And Industrial Products
Wholesale Durables And Industrial Products
Construction Aviation and Shipping
Aviation and Shipping
Wholesale Living Consumption Goods
Source: Company, by Outstanding Principal
Real Estate
Industry Exposure
Taiwan
45

Source: Company, by Outstanding Principal
2015 Top 5 2016 Top 5
Metalworking Activities And Manufacture of Other
Fabricated Metal Products
Manufacture of Plastics Products
Manufacture of Machinery and Equipment
Manufacture of Motor Vehicles and Parts
Manufacture of Food Products
Manufacture of Paper and Paper Products
Manufacture of Food Products
Metalworking Activities And Manufacture of Other
Fabricated Metal Products
Manufacture of Plastics Products
Manufacture of Motor Vehicles and Parts
Industry Exposure
China
46