Embed Size (px)
Citation preview

Original Research Paper
HPLC–DAD Method for Investigating Pantoprazole for its Stress-DependentDegradation by Photolysis and Oxidation
Mohammad Al Bratty1, Neelaveni Thangavel1, Ramalingam Peraman2*, Vinod Kumar3,Padmanabha Reddy3, Krishna Veni Nagappan4 and Hassan Al Hazmi1
1
Department of Pharmaceutical Chemistry, Faculty of Pharmacy, Jazan University, Jazan, P.O. Box 114, KSA 451422
RERDS-Centre for Pharmaceutical Research, Raghavendra Institute of Pharmaceutical Education and Research Campus,Anantapuramu, Andhra Pradesh, India 515721
3
Department of Pharmaceutical Analysis, Raghavendra Institute of Pharmaceutical Education and Research – Autonomous,Anantapuramu, Andhra Pradesh, India 515721.
4
Department of Pharmaceutical Analysis, JSS College of Pharmacy, Ooty [A Constituent College – JSS Academy of HigherEducation & Research], The Nilgiris, Tamil Nadu, India 643001.
Received: 14 Sep 2019; accepted: 03 Dec 2019
*Author forRaghavendrapus, AnantapuPhone: +91 9
DOI: 10.155
© 2019 The
This is an(https://creatpurposes, pr
A reversed-phased high-performance liquid chromatography–diode-array detection (HPLC–DAD) method has beendeveloped for investigating the stress-dependent degradation of pantoprazole (PTZ) by a photolytic and oxidativemechanism. The developed method separated PTZ from its degradation products on a C18 column with a mobilephase consisted of methanol and water (60:40, v/v; pH 3.0) at a flow rate of 1 mL/min. The linear regression coeffi-cient of 0.9995 was obtained for a concentration range from 5 to 25 μg/mL. The % relative standard deviation forrepeatability and intermediate precision were below 0.5% and 1.5%, respectively, while the sensitivity of themethod was demonstrated by a limit of detection value of 0.25 μg/mL. The stress sample analyses for PTZ resultsrevealed the formation of a total of 18 degradation products, and out of them, 9 degradation products were commonfor both photolytic and oxidative degradations. Further, the oxidation by azobisisobutyronitrile produced the highestnumber of degradation products (11 impurities), 3 of which are more hydrophobic than PTZ. In photolytic degrada-tion, 8 and 7 degradation products were observed with UV radiation and sunlight exposure, respectively. Further-more, the degradation of pantoprazole sodium injection formulation was carried out under the same stressconditions, and it revealed the formation of 3 common impurities under both stress conditions, but other impuritieswere not detected in the formulations. Finally, 3 common impurities formed in formulations of PTZ injections, viz.,sulfone, N-oxide, and N-oxide sulfone impurities, were identified by spike analyses.
Keywords: RP-HPLC, pantoprazole, photolytic, oxidative, stability indicating
1. Introduction
Controlling degradation impurities in pharmaceuticalproducts is still a challenging task among the pharmaceuticalscientists. The International Conference on Harmonization(ICH)-recommended forced degradation procedure is used toidentify the potential degradation products, which are formedduring stress degradation, but actually formed in a drug sub-stance or in its product under long-term storage or under ac-celerated storage conditions [1]. This information helpsscientists for designing appropriate measures to minimize theexpected impurities in the life cycle of drug products. Stresstesting (forced degradation study) has become an importantfundamental regulatory requirement for drug development andapproval process [2]. It provides evidence regarding the im-pact of various environmental factors on the quality of drugsubstances or drug products in real-time and is the scientificbasis to recommend the storage condition and package tech-nology for a dosage form [3]. In pharmaceutical analytical re-search, the design of stress conditions is the crucial and the
correspondence: RERDS-Centre for Pharmaceutical Research,Institute of Pharmaceutical Education and Research [RIPER] Cam-ramu, Andhra Pradesh, India 515721; [email protected];581294478.
6/1326.2019.00709
Author(s)
open-access article distributed under the terms of the Creativivecommons.org/licenses/by-nc/4.0/), which permits unrestrictedovided the original author and source are credited, a link to the
preliminary step in conducting stability studies for drugproduct, because it reveals the intrinsic mechanism of drugdecomposition, along with the information pertaining to %degradation and number of impurities, which are expected inthe life cycle of the drug product [4]. In the literature, wecould see that forced degradation studies were conductedusing one chemical reagent or one stress inducer in each typeof stress condition including acid and base hydrolyses, oxida-tion, and photolysis. It's our opinion that the degradation studywith a single stress inducer or stress agent for each stress maynot reveal the complete degradation profile of a drug sub-stance, because the intrinsic pathway of chemical decomposi-tion depends on the type of catalyst or reagent or stressinducer used. As per the ICH Q1 guidelines, photolytic degra-dation is very important in stress studies for drug substance,which concludes the need for conducting a photo-stabilitystudy for their formulations. We felt that unlike the reportedand existing routine stress study procedure, there is a need forconducting a forced degradation study for a drug substanceusing different stress inducers under each stress condition.The result of this type of study will reveal the complete stressdegradation profile of a drug substance, along with the infor-mation on stress-dependent or stress-specific degradationproducts for a drug substance or products.
Acta Chromatographica 32(2020)4, 247–255
First published online: 19 February 2020
e Commons Attribution-NonCommercial 4.0 International Licenseuse, distribution, and reproduction in any medium for non-commercialCC License is provided, and changes - if any - are indicated.
Unauthenticated | Downloaded 02/20/22 01:46 PM UTC

Figure 1. Chemical structure of pantoprazole and its sulfone and N-oxide impurities
Degradation Studies on Pantoprazole by HPLC–DAD
It is well known that the knowledge of photolytic and oxi-dative degradation of a drug substance or a drug product isvery essential for defining the storage condition and packagingtechnology. In this study, pantoprazole (PTZ) was chosen asan exemplar drug in this study (Figure 1) due to its instabilityunder light and oxygen. PTZ is a proton pump inhibitor,chemically known as 5-(difluoromethoxy)-2- [[(3, 4dimethoxy-2-pyridinyl) methyl] sulfinyl] – 1H-benzimidazole(Figure 1). It is available as a delayed-release tablet (40 mgand 20 mg), injectable powder, and oral suspension for thetreatment of conditions like ulcer, oesophagitis, and heartburn,difficulty in swallowing, persistent cough, and esophagus can-cer. The literature revealed the various analytical reports basedon UV spectrophotometry [5–7], high-performance liquidchromatography (HPLC) [8–10], liquid chromatography–tan-dem mass spectrometry (LC–MS/MS) [11–13], high-perfor-mance thin-layer chromatography (HPTLC) [14, 15], andvoltammetry [16] methods are available for the assay of PTZin pharmaceutical dosage forms and in biological fluids. Inconnection with forced degradation studies, few stability-indi-cating HPLC methods [5, 17, 18] have been reported for thedetermination of PTZ in the presence of degradation products.Among these studies, Gupta et al. [17] reported 5 impuritiesfrom oxidative degradation but had not carried out photolysis.There are methods on the identification of process impurities[18] and degradation products [19] for PTZ by reversed-phaseHPLC (RP-HPLC) methods. Besides, several analytical stud-ies are available for PTZ in the literature, but those methodsare not realistic and logically unacceptable, and they lack anyone or the other stability-indicating method requirements, suchas the following: a) complete degradation profile, b) appropri-ateness of stress employed, c) specificity, d) acceptable systemsuitability parameters, e) incomplete validation, and f) risk ofmethod failure.
In connection with the stability studies on pantoprazole for-mulations, it was evident that EDTA free pantoprazole injec-tions are unstable. For this reason, several preformulationinvestigations have been conducted to enhance the stability ofpantoprazole including sodium salt formation, enteric coating,packaging technology, nano-formulation and lyophilisation.However, the lyophilized pantoprazole sodium injection dem-onstrated acceptable stability data when compared to the PTZdrug substance. Therefore, the analytical research on thestability of pantoprazole still is continuing interest [20–23].Consequently, the objective of this study was focused onestablishing a stress-dependent degradation profile of PTZusing oxidative and photolytic degradations. This approach
248
would be beneficial for choosing an appropriate stress inducerin stability testing protocol and also affords complete data onstress-dependent degradation profile of the drug. Thus, in thiswork, we employed 4 oxidative and 3 photolytic stress condi-tions under controlled atmosphere to pantoprazole substanceand its pantoprazole sodium injection formulation. At the endof the stress sample analyses, we also attempted to identifythe major impurities detected in formulation by spike analysis.
2. Experimental
2.1. Materials and Methods. Pantoprazole (PTZ) referencedrug (99.98%) was kindly provided as a gift sample byWalksman Salman Pharmaceuticals Pvt. Ltd., Anantapur, AP(India). Pantoprazole sodium injection powder formulationwas purchased from the local community pharmacy throughresearch authorization letter. HPLC-grade solvents and AR-grade reagents were procured from Merck, Mumbai, India.
2.2. Equipment. The HPLC analyses for methoddevelopment process, forced degradation studies, and methodvalidation were performed on an Agilent LC 1200 systemequipped with a binary pump plus, a Rheodyne injector(20 μL), and a photodiode-array detector (PDA). The signalwas monitored using Ezchrome Elite software at differentwavelengths using 3D mixed view. PTZ was separated on anInertsil ODS C18 column (250 mm × 4.6 mm i.d., 5-μmparticle size). Validated micropipette and the glasswares usedwere calibrated to fulfill the requirement for class A-type asper the Indian Pharmacopeia. The light source used in thephoto-stability study was calibrated with quinine actinometryas per the ICH Q1B guidelines.
2.3. Optimization of Chromatographic Conditions.Initially, the LC system was checked for its performancequalification. Then, the mobile phase was prepared accordingto the requirement of the LC technique, which involveddegassing and filtration for each method trial. The contents ofthe mobile phase and samples were filtered through a 0.45-μm membrane filter and degassed using a sonication processbefore analysis. The PTZ at 15 μg/mL was used in themethod development process. The initial method optimizationprocedure has begun with 10% aqueous with pH 3.5 and 90%methanol. The retention was about 3.9 min; thus, the retentionbehavior of PTZ on the C18 column was assured. Therefore,the experimental trials were continued by varying the %aqueous and pH to achieve acceptable retention time(>8 min), tailing factor (<2.0), and theoretical plate (>3000).The various experimental trials performed in the optimization
Unauthenticated | Downloaded 02/20/22 01:46 PM UTC

Table 1. Optimization of RP-HPLC method condition for the study ofstress-dependent degradation of pantoprazole
S. No. Mobile phasecomposition
pH Retention time(tR) in min
Tailingfactor
Theoreticalplates
1 Methanol–water(80:20, v/v)
3.5 3.967 1.3101 2852
2 Methanol–water(70:30, v/v)
3.5 5.593 1.5312 4774
3 Methanol–water(65:35, v/v)
3.0 7.380 1.2650 4862
4 Methanol–water(60:40, v/v)
3.0 10.373 1.2540 4852
M.A. Bratty et al.
process are shown in Table 1. The system suitability parametersof the developed method are shown in Table 2. Thus, theoptimized mobile phase consisted of methanol and water at aratio of 60:40 (v/v) and was eluted at a flow rate of 1 mL/minand at an ambient column temperature. The photodiode arraydetection (PDA) wavelength was set to 290 nm for PTZ fordetections (Figure 2) and 230, 245, 254, 310, and 330 nm forstress samples. However, the PDA-3D mixed view programwas used in the monitoring of UVabsorbing impurities.
Table 2. Optimized conditions and SST parameters for the developedRP-HPLC method for PTZ
S. No. Parameters Description/results
1 Chromatographic column Inertsil ODS C18 column2 Column description 250 mm × 4.6 mm i.d., 5 μm3 Column temperature Ambient4 % Aqueous 40% (pH 3.0 with OPA)5 Organic phase Methanol6 Flow rate 1.0 mL/min7 Detection 289 nm (PDA)8 Run time 20 min9 Injection volume 20 μL10 Injection mode Manual11 Elution mode Isocratic12 Retention time 10.3 ± 0.1 min13 Resolution More than 514 Repeatability 0.45 (% RSD)15 Theoretical plates >4500
Figure 2. Optimized chromatogram of pantoprazole on C18 column at 290 n
2.4. Preparation of Calibration Standards of PTZ. Tenmilligrams of PTZ was accurately weighed and dissolved in10 mL of HPLC-grade methanol and made up to the volumewith water to get primary stock (1000 μg/mL). From these,respective aliquots were diluted using the mobile phase toachieve different concentrations of 5, 10, 15, 20, and 25 μg/mL (Calibration Standard solutions). All standards wereinjected under the optimized chromatographic conditions intriplicate, and the mean value was used to construct thelinearity plot. The regression coefficient was used to validatethe concentration range, and the regression equation was usedto quantify PTZ (Table 3).
2.5. Stress Degradation Studies of PTZ. The degradationof the PTZ drug substance was performed under variousoxidative and photolytic stress conditions at roomtemperature. Each degradation study is detailed in thefollowing section. Degradation was induced to a PTZ drugsubstance at a concentration of 1000 μg/mL. The suitablealiquot was made up to the volume 10 mL to get a test sampleconcentration of 15 μg/mL. The overlay of chromatograms ofblank, control, and test stress sample injections was used toidentify the formed degradation product. The % degradationwas calculated based on peak areas of the degraded PTZsample and PTZ standard (Control). The % degradation of15–20% was considered as the endpoint for sample analyses.Results of degradation data of PTZ for all stress conditionswere consolidated and are shown in Table 3.
2.6. Stress Degradation Studies of Pantoprazole SodiumInjection. Degradation study for PTZ sodium injectionpowder was carried out under the same conditions as adoptedfor the PTZ drug substance. The PTZ injection powder wasappropriately weighed and used to prepare a concentration of1000 μg/mL with suitable stress inducers. At the end of stressduration, the suitable aliquot was diluted to the volume of10 mL to achieve a concentration of 15 μg/mL. Theimpurities detected in the chromatogram for the PTZ injectionformulation are presented in Table 3.
2.7. Oxidative Stress Degradation. The oxidative stressdegradation study was carried out using different oxidative
m
249
Unauthenticated | Downloaded 02/20/22 01:46 PM UTC
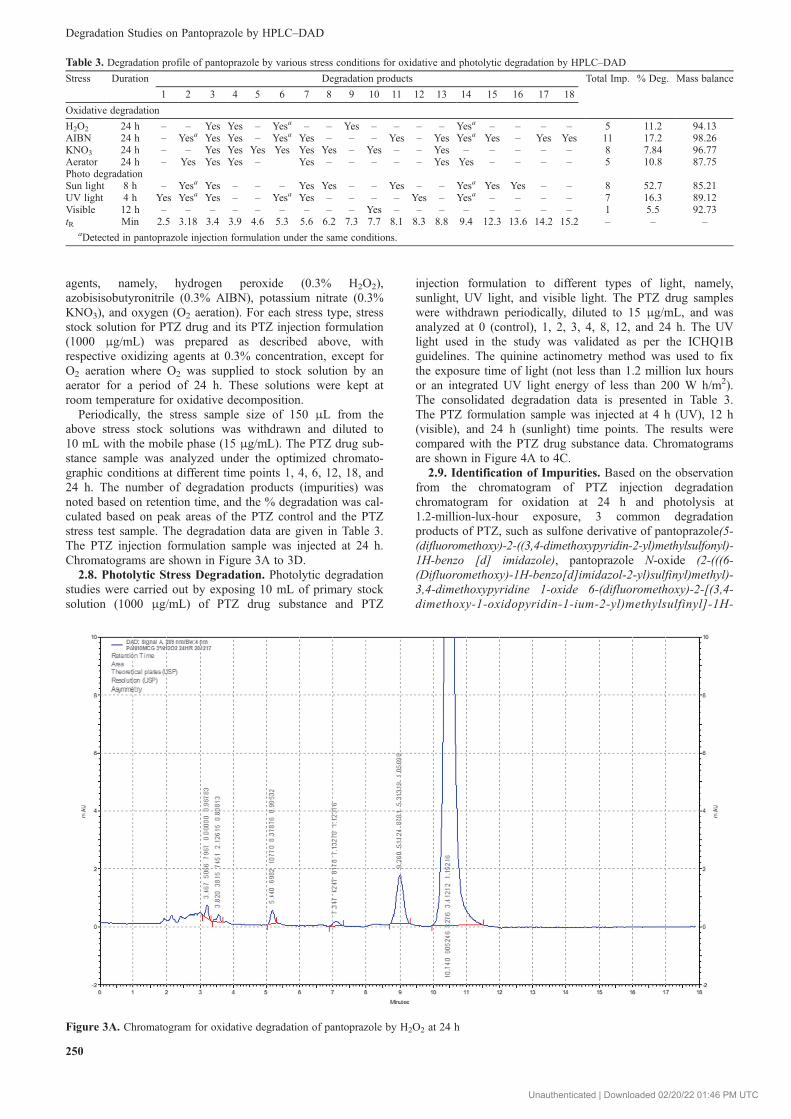
Table 3. Degradation profile of pantoprazole by various stress conditions for oxidative and photolytic degradation by HPLC–DAD
Stress Duration Degradation products Total Imp. % Deg. Mass balance
1 2 3 4 5 6 7 8 9 10 11 12 13 14 15 16 17 18
Oxidative degradation
H2O2 24 h – – Yes Yes – Yesa – – Yes – – – – Yesa – – – – 5 11.2 94.13AIBN 24 h – Yesa Yes Yes – Yesa Yes – – – Yes – Yes Yesa Yes – Yes Yes 11 17.2 98.26KNO3 24 h – – Yes Yes Yes Yes Yes Yes – Yes – – Yes – – – – – 8 7.84 96.77Aerator 24 h – Yes Yes Yes – Yes – – – – – Yes Yes – – – – 5 10.8 87.75Photo degradationSun light 8 h – Yesa Yes – – – Yes Yes – – Yes – – Yesa Yes Yes – – 8 52.7 85.21UV light 4 h Yes Yesa Yes – – Yesa Yes – – – – Yes – Yesa – – – – 7 16.3 89.12Visible 12 h – – – – – – – – – Yes – – – – – – – – 1 5.5 92.73tR Min 2.5 3.18 3.4 3.9 4.6 5.3 5.6 6.2 7.3 7.7 8.1 8.3 8.8 9.4 12.3 13.6 14.2 15.2 – – –
aDetected in pantoprazole injection formulation under the same conditions.
Degradation Studies on Pantoprazole by HPLC–DAD
agents, namely, hydrogen peroxide (0.3% H2O2),azobisisobutyronitrile (0.3% AIBN), potassium nitrate (0.3%KNO3), and oxygen (O2 aeration). For each stress type, stressstock solution for PTZ drug and its PTZ injection formulation(1000 μg/mL) was prepared as described above, withrespective oxidizing agents at 0.3% concentration, except forO2 aeration where O2 was supplied to stock solution by anaerator for a period of 24 h. These solutions were kept atroom temperature for oxidative decomposition.
Periodically, the stress sample size of 150 μL from theabove stress stock solutions was withdrawn and diluted to10 mL with the mobile phase (15 μg/mL). The PTZ drug sub-stance sample was analyzed under the optimized chromato-graphic conditions at different time points 1, 4, 6, 12, 18, and24 h. The number of degradation products (impurities) wasnoted based on retention time, and the % degradation was cal-culated based on peak areas of the PTZ control and the PTZstress test sample. The degradation data are given in Table 3.The PTZ injection formulation sample was injected at 24 h.Chromatograms are shown in Figure 3A to 3D.
2.8. Photolytic Stress Degradation. Photolytic degradationstudies were carried out by exposing 10 mL of primary stocksolution (1000 μg/mL) of PTZ drug substance and PTZ
Figure 3A. Chromatogram for oxidative degradation of pantoprazole by H2
250
injection formulation to different types of light, namely,sunlight, UV light, and visible light. The PTZ drug sampleswere withdrawn periodically, diluted to 15 μg/mL, and wasanalyzed at 0 (control), 1, 2, 3, 4, 8, 12, and 24 h. The UVlight used in the study was validated as per the ICHQ1Bguidelines. The quinine actinometry method was used to fixthe exposure time of light (not less than 1.2 million lux hoursor an integrated UV light energy of less than 200 W h/m2).The consolidated degradation data is presented in Table 3.The PTZ formulation sample was injected at 4 h (UV), 12 h(visible), and 24 h (sunlight) time points. The results werecompared with the PTZ drug substance data. Chromatogramsare shown in Figure 4A to 4C.
2.9. Identification of Impurities. Based on the observationfrom the chromatogram of PTZ injection degradationchromatogram for oxidation at 24 h and photolysis at1.2-million-lux-hour exposure, 3 common degradationproducts of PTZ, such as sulfone derivative of pantoprazole(5-(difluoromethoxy)-2-((3,4-dimethoxypyridin-2-yl)methylsulfonyl)-1H-benzo [d] imidazole), pantoprazole N-oxide (2-(((6-(Difluoromethoxy)-1H-benzo[d]imidazol-2-yl)sulfinyl)methyl)-3,4-dimethoxypyridine 1-oxide 6-(difluoromethoxy)-2-[(3,4-dimethoxy-1-oxidopyridin-1-ium-2-yl)methylsulfinyl]-1H-
O2 at 24 h
Unauthenticated | Downloaded 02/20/22 01:46 PM UTC

Figure 3B. Chromatogram for oxidative degradation of pantoprazole by AIBN at 24 h
M.A. Bratty et al.
benzimidazole), and N-oxide of sulfone derivatives (2-(((6-(Difluoromethoxy)-1H-benzo[d]imidazol-2-yl)sulfonyl)methyl)-3,4-dimethoxypyridine 1-oxide 6-(difluoromethoxy)-2-[(3,4-dimethoxy-1-oxidopyridin-1-ium-2-yl)methylsulfinyl]-1H-
Figure 3C. Chromatogram for oxidative degradation of pantoprazole by KN
benzimidazole), were identified by a spike method (Figure 1).In this spike procedure, 0.1 mL of the 1 μg/mL solution ofthese impurities was added to stress product samples of bothphotolytic and oxidative degradation. Then, the spiked stress
O3 at 24 h
251
Unauthenticated | Downloaded 02/20/22 01:46 PM UTC

Figure 3D. Chromatogram for oxidative degradation of pantoprazole under oxygen aeration at 24 h
Degradation Studies on Pantoprazole by HPLC–DAD
samples were analyzed along with the control stress sample.The peak height of impurity peaks and PDA–UV spectrum ofknown impurity was used to identify the impurities.
2.10. Method Validation. The developed method wasvalidated as per the ICH Q2 guidelines [2] for variousparameters including specificity, linearity, precision, accuracy,limit of detection (LOD), limit of quantification (LOQ), androbustness. Results are shown in Table 4. The LOD and LOQ
Figure 4A. Chromatogram for photolytic degradation of pantoprazole under
252
parameters were included in the validation to demonstrate themethod sensitivity.
3. Results and Discussion
3.1. Method Optimization. The objectives of this RP-HPLC method were to determine PTZ in the presence of itsdegradation products under various stress conditions with
sunlight at 12 h
Unauthenticated | Downloaded 02/20/22 01:46 PM UTC

Figure 4B. Chromatogram for photolytic degradation of pantoprazole under UV light at 4 h
M.A. Bratty et al.
acceptable specificity, accuracy, and precision as per the ICH.The chemical structure of PTZ and its common degradationproducts are shown in Figure 1. The structural features andsolubility profile of PTZ satisfied the choice of analyticaltechnique and reversed mode of liquid chromatography. In the
Figure 4C. Chromatogram for photolytic degradation of pantoprazole under
method development process, the ODS C18 column wasemployed as the stationary phase, while diode array detection(DAD) was chosen to monitor PTZ and its degradationproduct elution in a range of wavelength between 230 and330 nm, but the PTZ quantification was based on detection at
a visible lamp at 8 h
253
Unauthenticated | Downloaded 02/20/22 01:46 PM UTC

Table 4. Results of analytical method validation for the developed RP-HPLC method for PTZ
Parameters Results Acceptance criteria
Specificity Pass (Peak purity >99%) No co-elution / PassLinearity 5–25 μg/mL (r2: 0.9995) >0.999 / PassIntermediate precision 10 μg/mL: 1.11% (RSD) <2% / Pass
15 μg/mL: 1.23% (RSD) <2% / Pass20 μg/mL: 1.18% (RSD) <2% / Pass
Repeatability (RSD) 10 μg/mL: 0.59% <2% / Pass15 μg/mL: 0.50% <2% / Pass20 μg/mL: 0.49% <2% / Pass
Accuracy80% level 98.9% 98–102% / Pass100% level 99.3% 98–102% / Pass120% level 101.7% 98–102% / PassLOD 0.025 μg/mL Not definedLOQ 0.0825 μg/mL Not definedRobustness% Organic (±3%) 1.22% (RSD) <2% / RobustpH (±0.2) 1.69% (RSD) <2% / RobustFlow rate (±0.1 mL) 1.22% (RSD) <2% / Robust
Degradation Studies on Pantoprazole by HPLC–DAD
290 nm. The method optimization trials were performed witha mixture of methanol and water as the mobile phase atincreasing contents of aqueous phase, i.e., 80:20, 70:30,65:35, and 60:40 (v/v; Table 1). The pH buffering was done at3.0 and 3.5 with an ortho-phosphoric acid (OPA) buffer. Theflow rate was controlled at 1 mL/min. During this methoddevelopment stage, we found that there was a persistentincrease in the retention of PTZ with the increase in %aqueous composition. The effect of pH was negligible on theretention of PTZ, but there was a moderate effect on thetailing of PTZ peak at pH 3.5. Thus, the pH was reduced to3.0 to minimize the tailing factor for PTZ peak. Theoptimized method was tested for stressed samples forresolution (>2) of PTZ from impurities and demonstrated itsspecificity to PTZ in the presence of all possible degradationproducts of PTZ. Thus, the optimized condition eluted thePTZ at 10.3 ± 0.1 min with acceptable system suitabilityparameters as shown in Figure 2 and Table 2. The resolutionbetween PTZ and other impurities was more than 2, and thepeak purity was more than 99%. Thus, the method wasoptimized to use in the stress degradation study of PTZ undervarious stress conditions. Finally, this method was validatedas per the ICH Q2 guidelines (ICH, 2003).
3.2. Oxidative Degradation Studies. Oxidativedegradation of PTZ drug substance and its injection powderformulation was performed using 4 stress conditions such as0.3% H2O2, 0.3% AIBN, 0.3% KNO3, and O2 aeration in thesolution state. After 24 h of stress period, 15 impurities wererecorded in oxidative degradation of the PTZ drug substance.In detail, PTZ recorded 11 impurities with AIBN stress and 5impurities with hydrogen peroxide stress. The potassiumnitrate degraded the PTZ to produce 8 impurities. The %degradation of PTZ for AIBN stress was 17.2% and 11.2% forH2O2, stress. The AIBN degraded the PTZ relatively more ascompared to other stress conditions. Comparing the effect ofpotassium nitrate with oxygen aeration, potassium nitrateinduced more impurities than oxygen supply; nevertheless, the% degradation was in a reverse phenomenon. Among allstress conditions, 2 common impurities were found, i.e.,impurity 3 (3.4 min) and impurity 4 (3.9 min). There aremany stress reagent specific impurities formed; they areimpurity 9 (for hydrogen peroxide) as observed in Figure 3A,impurity 11, 15, 17, 18 (for AIBN) as in Figure 3B, andimpurity 5 and 10 (for potassium nitrate) as in Figure 3C.Impurities produced after 24 h of oxygen aeration is shown inFigure 3D. The retention time of each impurity is shown inTable 3. At 24 h, PTZ injection stressed sample showed the
254
impurities in peroxide (impurity 6 and 14) and AIBN(impurity 2, 6, and 14) stressed samples. The other stressagents KNO3 and oxygen aeration did not produce anyimpurities in the PTZ injection formulation at 24 h.
3.3. Photolytic Degradation. The photolytic degradation ofPTZ drug substance and its injection powder formulation wascarried out using sunlight, UV, and visible light in solutionstate. The percentage of degradation and impurity data werecompiled at 1.2 million lux hours of light exposure. For PTZdrug substance, the comparative data showed the formation of11 degradation products. Among the stress conditionsemployed, UV light produced more impurities (8 degradationproducts), then followed by sunlight (7 degradation products)at 1.2 million-lux-hour exposure duration. The visible lightirradiation showed only one impurity (at 12 h). Interestingly,there are only 4 degradation products (impurity 2, 3, 7, and14), which were common between sunlight (8 h) and UV lightexposure (4 h); further, it was noted that sunlight producedthe highest degradation of 52.7% compared to the UV lightexposure (16.2%). The degradation products, impurity8 (6.2 min), impurity 11 (8.1 min), impurity 15 (12.3 min),and impurity 16 (13.6 min) are sunlight specific, as shown inFigure 4B, whereas, impurity 1 (2.5 min), impurity 6(5.3 min), and impurity 12 (8.3) are UV-light specific, asshown in Figure 4A. The impurity produced by visible light at7.7 min (impurity 10), shown in Figure 4C, was similar to theoxidation product produced in potassium nitrate stress. Thedetailed degradation data including mass balances arepresented in Table 3. At the end of the 1.2 million-hourexposure, PTZ injection stressed sample produced impuritiesin sunlight (impurity 2 and 14) and UV light (impurity 2, 6,and 14) stressed samples, whilst the visible light irradiationdid not induce degradation.
3.4. Identification of Impurities. Table 3 shows that thereare 3 degradation products (impurity 1, 12, and 16) specific tophotolysis and 6 degradation products (impurity 4, 5, 9, 13,17, and 18) specific to oxidation. We noted that there was asignificant difference in the % degradation and number ofimpurities formed in different stresses employed. Based on theinformation obtained from the degradation data of PTZ and itsPTZ injections, there were 3 impurities of drug products,namely, sulfone derivative of pantoprazole (impurity 14 at9.4 min), pantoprazole N-oxide (impurity 6 at 5.3 min), andN-oxide of sulfone derivatives (impurity 2 at 3.1 min)identified by a spike method. These impurities were addedto the stress sample at 1 μg/mL concentration. The identifiedimpurities were common in both photolytic and oxidativedegradation. It was noted that N-oxide of sulfone derivatives(impurity 2 at 3.1 min) was found only with AIBN-inducedoxidation but not with hydrogen peroxide at the 24th hour.The pantoprazole N-oxide was found with UV light exposurebut not with sunlight exposure. It was observed that theabove three impurities were detected in pantoprazole injectionformulation under the same stress conditions. The reason forthe low level of impurities may be due to its sodium saltform, which has already supported by the report by Ronald FDonnelly [19]. Thus, our study concurs the earlier [19] reportthat sodium salt of pantoprazole reduced the susceptibility ofpantoprazole from intense degradation.
3.5. Validation of the Method. The developed RP-HPLCmethod was validated for all validation parameters as perthe ICH Q2 guidelines, including specificity, linearity,repeatability, intermediate precision, accuracy, the limit ofdetection, the limit of quantification, and robustness test. ThePTZ solution of 15 μg/mL was used throughout the methodvalidation to ensure the system suitability (SST). Thespecificity of the method was verified by using stress sample
Unauthenticated | Downloaded 02/20/22 01:46 PM UTC

M.A. Bratty et al.
analyses. The method was found to be specific for PTZ with aresolution of more than 2 from impurity 14 and impurity 15.Further, the DAD signal at 290 nm showed an acceptablepeak purity of >99% and satisfied the purity threshold andpurity angle criteria. The linearity of the method was testedfor the concentration range from 5 to 25 μg/mL. The value ofcorrelation coefficient (r2) was 0.9995 (y = 69,489x + 20,257),indicating the acceptable quantification limit. Precision andaccuracy were studied at 15 μg/mL. The %RSD values forrepeatability (n = 9; intra-day precision) and intermediateprecision (n = 3; inter-day precision) were < 0.6%and < 1.5%, respectively. This indicated that the method washighly precise. The accuracy of the method was tested by arecovery study at 80%, 100%, and 120% levels using aplacebo mixture and PTZ injection formulation. Therespective % accuracy values for these levels were 98.9%,99.3%, and 101.7%. Thus, concerning the acceptance criteria(Table 4), the developed method was highly accurate andprecise. As per the ICHQ2, though the LOD and LOQparameters are not needed for assay procedure, the respectivevalues were still calculated to assess the sensitivity of themethod, and it was found that the LOD of 0.25 μg/mL andthe LOQ of 0.825 μg/mL indicated high method sensitivity.The robustness of the developed method was tested for 3critical method parameters, such as a change in flow rate(±0.1 mL/min), mobile phase composition (±2%), and pH(±0.2). The retention time and peak area were used methodresponses to assess the robustness of the method. Robustnesstests revealed that the method was robust for the entire testedmethod variable within the test range. It was noted that theeffect of pH on method precision was considerably affectedby the increased %RSD to 1.69% for precision (should be lessthan 2%), but the retention time was less affected. Thisindicated that the pH of the mobile phase should beconsidered as the most important method variable whileperforming analysis for PTZ. Overall, the developed methodpassed the validation criteria as per the ICHQ2 guidelines.
4. Conclusion
The developed method has demonstrated a total of 18 impu-rities as degradation products of pantoprazole under variousstress inducers belonging to oxidative and photolytic degrada-tions. It was concluded that there are significant differencesobserved in % degradation and the number of impuritiesformed in different stress conditions employed. Thus, 3 degra-dation products (impurity 1, 12, and 16) can be concluded asspecific to photolysis, whereas 6 degradation products (impu-rity 4, 5, 9, 13, 17, and 18) were specific to oxidation. Theother identified impurities were common impurities of both
photolytic and oxidative degradation. Three impurities of drugproducts, namely, sulfone derivative of pantoprazole (impurity14 at 9.4 min), pantoprazole N-oxide (impurity 6 at 5.3 min),and N-oxide of sulfone derivatives (impurity 2 at 3.1 min),were detected.
5. Conflict of Interest
Authors convey no conflict of interest.
Acknowledgments. The authors wish to thank WalksmanSalesman Pharmaceutical Private Limited, Anantapur forproviding the pantoprazole gift sample for this study. Authorsare thankful to Ms. Mounika Bai for support in DST-FISTfacility of Raghavendra Institute of Pharmaceutical Educationand Research, Anantapur, AP, India.
References
1. FDA Guidance for Industry, INDs for Phase II and III Studies –Chemistry, Manufacturing, and Controls Information, Food and DrugAdministration, Available from: 2003.
2. International Conference on Harmonization, ICH Q2 Guidelines,Available from: http://www.fda.gov/downloads/RegulatoryInformation/Guidances/ucm128204.pdf, 2003.
3. Reynolds, D. W.; Facchine, K. L.; Mullaney, J. F. Pharm. Technol.2002, 26, 48.
4. Brummer, H. Life Sci. Technol. Bull. 2011, 1, 1.5. Gupta, K. R.; Chawla, R. B.; Wadodkar, S. G. Orbital: Electron. J.
Chem. 2010, 2, 181.6. Wahbi, A. M.; Abde Razak, O.; Gazy, A. A.; Mahgoub, A.; Moneeb,
M. S. J. Pharm. Biomed. Anal. 2002, 30, 1133.7. Syed, A.; Syeda, A. Indian J. Pharm. Sci. 2008, 70, 507.8. Prasanna, R. B.; Kirankumar, R. N. Int. J. ChemTech Res. 2009, 1, 195.9. Letica, J.; Markovic Zirojevic, S. J.; Nikolic, K.; Agbaba, D. J. AOAC
Int. 2010, 93, 1121.10. Ramakrishna, N. V. S.; Vishwottam, K. N.; Wishu, S.; Koteshwara, M.
J. Chromatogr. B: Anal. Technol. Biomed. Life Sci. 2005, 822, 326.11. Li, Y.; Ding, M. J.; Ma, J.; Wang, S.; Wu, X. L.; Xu, H. J.; Lu, Z. Y.;
Zou, J. J.; Fan, H. W.; Zhou, X. M. Eur. J. Drug Metab. Pharmacokinet. 2011,35, 147.
12. Dotsikas, Y.; Apostolou, C.; Soumelas, S.; Kolocouri, F.; Ziaka, A.;Kousoulos, C.; Loukas, Y. L. J. AOAC Int. 2010, 93, 1129.
13. Challa, B. R.; Boddu, B. R.; Awen, B. Z.; Chandu, B. R.; Bannoth,C. K.; Khagga, M.; Kanala, K.; Shaik, R. J. Chromatogr. B: Anal. Technol.Biomed. Life Sci. 2010, 878, 1499.
14. Patel, B. H.; Suhagia, B. N.; Patel, M. M.; Patel, J. R. J. AOAC Int.2007, 90, 142.
15. Deepak Bageshwar, V.; Khanvilkar, V. K. J. Pharm. Anal. 2011, 1, 275.16. Radi, A. J. Pharm. Biomed. Anal. 2003, 33, 687.17. Krishna, R. G.; Rajesh, B. C.; Sudhir, G. W. Orbital: Electron. J.
Chem. 2010, 2, 209.18. Reddy, G. M.; Bhaskar, B. V.; Reddy, P. P.; Ashok, S.; Sudhakar, P.;
Babu, J. M.; Vyas, K.; Mukkanti, K. J. Pharm. Biomed. Anal. 2007, 45, 201.19. Ronald, F. D.; Can. J. Hosp. Pharm. 2011, 64, 192.20. Walker, S.; Iazzetta, J.; Law, S. Can. J. Hosp. Pharm. 2009, 62,135.21. Walker, S. E.; Iazzetta, J.; Law, S. Can. J. Hosp. Pharm. 2005, 58, S34.22. Carpenter, J. F.; McNulty, M. A.; Dusci, L. J.; Ilett, K. F. J. Pharm.
Technol. 2006, 22, 95.23. Johnson, C. E. Am. J. Health-Syst. Pharm. 2005, 62, 2410.
255
Unauthenticated | Downloaded 02/20/22 01:46 PM UTC