Embed Size (px)
Citation preview

Errata
Title & Document Type:
Manual Part Number:
Revision Date:
HP References in this Manual This manual may contain references to HP or Hewlett-Packard. Please note that Hewlett-Packard's former test and measurement, semiconductor products and chemical analysis businesses are now part of Agilent Technologies. We have made no changes to this manual copy. The HP XXXX referred to in this document is now the Agilent XXXX. For example, model number HP8648A is now model number Agilent 8648A.
About this Manual We’ve added this manual to the Agilent website in an effort to help you support your product. This manual provides the best information we could find. It may be incomplete or contain dated information, and the scan quality may not be ideal. If we find a better copy in the future, we will add it to the Agilent website.
Support for Your Product Agilent no longer sells or supports this product. You will find any other available product information on the Agilent Test & Measurement website:
www.tm.agilent.com Search for the model number of this product, and the resulting product page will guide you to any available information. Our service centers may be able to perform calibration if no repair parts are needed, but no other support from Agilent is available.

Programmer’s Guide
HP 8590 E-Series and L-SeriesSpectrum Analyzers and
HP 8591C Cable TV Analyzer
Did HEWLETTPACKARD
HP Part No. 08590-90235 Supersedes: 5962-5023Printed in USA June 1995

Notice.
The information contained in this document is subject to change without notice.
Hewlett-Packard makes no warranty of any kind with regard to this material, includingbut not limited to, the implied warranties of merchantability and fitness for a particularpurpose. Hewlett-Packard shall not be liable for errors contained herein or for incidental orconsequential damages in connection with the furnishing, performance, or use of this material.
@ Copyright Hewlett-Packard Company 1992, 1993, 1994, 1995All Rights Reserved. Reproduction, adaptation, or translation without prior written permissionis prohibited, except as allowed under the copyright laws.1400 Fountaingrove Parkway, Santa Rosa CA, 95403-1799, USA

CertificationHewlett-Packard Company certifies that this product met its published specifications at thetime of shipment from the factory. Hewlett-Packard further certifies that its calibrationmeasurements are traceable to the United States National Institute of Standards andTechnology, to the extent allowed by the Institute’s calibration facility, and to the calibrationfacilities of other International Standards Organization members.
Regulatory InformationThe Calibration Guide shipped with your instrument contains the regulatory information.
WarrantyThis Hewlett-Packard instrument product is warranted against defects in material andworkmanship for a period of one year from date of shipment. During the warranty period,Hewlett-Packard Company will, at its option, either repair or replace products which prove tobe defective.
For warranty service or repair, this product must be returned to a service facility designated byHewlett-Packard. Buyer shall prepay shipping charges to Hewlett-Packard and Hewlett-Packardshall pay shipping charges to return the product to Buyer. However, Buyer shall pay allshipping charges, duties, and taxes for products returned to Hewlett-Packard from anothercountry.
Hewlett-Packard warrants that its software and firmware designated by Hewlett-Packard foruse with an instrument will execute its programming instructions when properly installed onthat instrument. Hewlett-Packard does not warrant that the operation of the instrument, orsoftware, or firmware will be uninterrupted or error-free.
LIMITATION OF WARRANTY
The foregoing warranty shall not apply to defects resulting from improper or inadequatemaintenance by Buyer, Buyer-supplied software or interfacing, unauthorized modification ormisuse, operation outside of the environmental specifications for the product, or impropersite preparation or maintenance.
NO OTHER WARRANTY IS EXPRESSED OR IMPLIED. HEWLETT-PACKARD SPECIFICALLYDISCLAIMS THE IMPLIED WARRANTIES OF MERCHANTABILITY AND FITNESS FOR APARTICULAR PURPOSE.
EXCLUSIVE REMEDIES
THE REMEDIES PROVIDED HEREIN ARE BUYER’S SOLE AND EXCLUSIVE REMEDIES.HEWLETT-PACKARD SHALL NOT BE LIABLE FOR ANY DIRECT, INDIRECT, SPECIAL,INCIDENTAL, OR CONSEQUENTIAL DAMAGES, WHETHER BASED ON CONTRACT, TORT,OR ANY OTHER LEGAL THEORY.
. . .III

AssistanceProduct maintenance agreements and other customer assistance agreements are available forHewlett-Rzckard products. For any assistance, contact your nearest Hewlett-Rzckard Sales andService Office.
Safety NotesThe following safety notes are used throughout this manual. Familiarize yourself with each ofthe notes and its meaning before operating this instrument.
Caution Caution denotes a hazard. It calls attention to a procedure that, if notcorrectly performed or adhered to, would result in damage to or destructionof the instrument. Do not proceed beyond a caution sign until the indicatedconditions are fully understood and met.
Warning Warning denotes a hazard. It calls attention to a procedure which, if notcorrectly performed or adhered to, could result in injury or loss of life.Do not proceed beyond a warning note until the indicated conditions arefully understood and met.
Instruction The instruction documentation symbol. The product is marked with thisManual symbol when it is necessary for the user to refer to the instruction in the
manual.
iv

General Safety Considerations
Caution Before switching on this instrument, make sure that the line voltage selectorswitch is set to the voltage of the power supply and the correct fuse isinstalled.
Warning This is a Safety Class I product (provided with a protective earthingground incorporated in the power cord). The mains plug shall only beinserted in a socket outlet provided with a protective earth contact. Anyinterruption of the protective conductor, inside or outside the instrument,is likely to make the instrument dangerous. Intentional interruption isprohibited.
Warning The opening of covers or removal of parts is likely to expose dangerousvoltages. Disconnect the instrument from all voltage sources while it isbeing opened.
Warning The power cord is connected to internal capacitors that may remain livefor 10 seconds after disconnecting the plug from its power supply.
Warning These servicing instructions are for use by qualified personnel only.To avoid electrical shock, do not perform any servicing unless you arequalified to do so.
V

How to Use This Guide
This guide uses the following conventions:Front-Panel Key] This represents a key physically located on the instrument.
Sof tkq” This indicates a “softkey,” a key whose label is determined by the instrument’sfirmware.
Screen Text This indicates text displayed on the instrument’s screen.
vi

HP 8590 D-Series and E-Series Spectrum AnalyzerDocumentation DescriptionIn addition to the programmer’s guide, the following guides are shipped with your spectrumanalyzer:
The Calibration Guide for your Spectrum Analyzer
w Tells you how to test your spectrum analyzer to determine if the spectrum analyzer meetsits specifications.
HP 8590 E-Series and L-Series Spectrum Analyzer User’s Guide
n Tells you how to make measurements with your spectrum analyzer.n Describes the spectrum analyzer features.n Tells you what to do in case of a failure.
HP 8590 E-Series and L.-Series Spectrum Analyzer Quick Reference Guide
w Describes how to make a simple measurement with your spectrum analyzer.n Briefly describes the spectrum analyzer functions.w Lists all the programming commands.
HP 8591C Cable TV Analyzer Documentation DescriptionIn addition to the programmer’s guide, the following guides are shipped with your cable TVanalyzer:
HP 8590 E-Series Spectrum Analyzers and HP 8591 C Cable TV Analyzer Calibration Guide
w Tells you how to test your spectrum analyzer to determine if the spectrum analyzer meetsits specifications.
HP 8591C Cable TV Analyzer User’s Guides
Cable TV Measurementsw Tells you how to make cable TV measurements with your analyzer.w Describes the cable TV analyzer mode features.
Spectrum Analyzer Referencew Tells you how to make measurements using the spectrum analyzer mode.w Describes the spectrum analyzer mode features.n Tells you what to do in case of a failure.
HP 8591C Cable TV Analyzer Getting Started and Quick Reference Guide
w Describes how to make a simple measurement with your spectrum analyzer.w Briefly describes the cable TV and spectrum analyzer functions.w Provides a quick reference for cable TV and spectrum analyzer softkeys.
vii

Contents
1. Preparing for UseWhat You’ll Learn in This Chapter . . . . . . . . . . . . . . . . . . . . . .
Connecting Your Spectrum Analyzer to a Computer . . . . . . . . . . . . .Configuring Your Computer System . . . . . . . . . . . . . . . . . . . . .Connecting the Computer to the Spectrum Analyzer . . . . . . . . . . . . .
For the HP-IB Interface . . . . . . . . . . . . . . . . . . . . . . . . .For the RS-232 Interface . . . . . . . . . . . . . . . . . . . . . . . . .
The Test Program . . . . . . . . . . . . . . . . . . . . . . . . . . . . .HP-IB Connections for the HP 9000 Series 200 Technical Computers . . . . . . .
Equipment . . . . . . . . . . . . . . . . . . . . . . . . . . . . . . . .Interconnection Instructions . . . . . . . . . . . . . . . . . . . . . . . .Test Program . . . . . . . . . . . . . . . . . . . . . . . . . . . . . . .
HP-IB Connections for the HP 9000 Series 300 Technical Computers . . . . . . .Equipment . . . . . . . . . . . . . . . . . . . . . . . . . . . . . . . .Interconnection Instructions . . . . . . . . . . . . . . . . . . . . . . . .Test Program . . . . . . . . . . . . . . . . . . . . . . . . . . . . . . .
HP-IB Connections for the HP Vectra Personal Computer . . . . . . . . . . . .Equipment . . . . . . . . . . . . . . . . . . . . . . . . . . . . . . . .Interconnection Instructions . . . . . . . . . . . . . . . . . . . . . . . .Test Program . . . . . . . . . . . . . . . . . . . . . . . . . . . . . . .
RS-232 Connections for the HP Vectra or IBM PC/AT Personal Computer . . . .Equipment . . . . . . . . . . . . . . . . . . . . . . . . . . . . . . . .Interconnection Instructions . . . . . . . . . . . . . . . . . . . . . . . .Test Program . . . . . . . . . . . . . . . . . . . . . . . . . . . . . . .
Printing or Plotting . . . . . . . . . . . . . . . . . . . . . . . . . . . . .Printing Using an HP-IB Interface . . . . . . . . . . . . . . . . . . . . . .
Equipment . . . . . . . . . . . . . . . . . . . . . . . . . . . . . . .Interconnection and Printing Instructions . . . . . . . . . . . . . . . . . .Plotting Using an HP-IB Interface . . . . . . . . . . . . . . . . . . . . . .
Equipment . . . . . . . . . . . . . . . . . . . . . . . . . . . . . . .Interconnection and Plotting Instructions . . . . . . . . . . . . . . . . . .Printing Using an RS-232 Interface . . . . . . . . . . . . . . . . . . . . .
Equipment . . . . . . . . . . . . . . . . . . . . . . . . . . . . . . .Interconnection and Printing Instructions . . . . . . . . . . . . . . . . . .Plotting Using an RS-232 Interface . . . . . . . . . . . . . . . . . . . . .
Equipment . . . . . . . . . . . . . . . . . . . . . . . . . . . . . . .Interconnection and Plotting Instructions . . . . . . . . . . . . . . . . . .Printing after Plotting or Plotting after Printing . . . . . . . . . . . . . . .Printing Using a Parallel Interface . . . . . . . . . . . . . . . . . . . . .
Equipment . . . . . . . . . . . . . . . . . . . . . . . . . . . . . . .Interconnection and Printing Instructions . . . . . . . . . . . . . . . . . .Plotting to an HP LaserJet Printer . . . . . . . . . . . . . . . . . . . . .
Equipment . . . . . . . . . . . . . . . . . . . . . . . . . . . . . . .Interconnection and Plotting Instructions . . . . . . . . . . . . . . . . . .Printing after Plotting or Plotting after Printing . . . . . . . . . . . . . . .
If There Is a Problem . . . . . . . . . . . . . . . . . . . . . . . . . . . .
l-ll-ll-ll-2l-2l-2l-2l-3l-3l-3l-41-51-51-5l-6l-7l-7l-71-8l-9l-9l-9
l-10l-11l-11l-11l-111-141-141-141-161-161-161-181-181-181-19l-20l-20l-20l-22l-22l-22l-23l-24
Contents-l

2. Writing a ProgramWhat You’ll Learn in This Chapter . . . . . . . . . . . . . . . . . . . . . . 2-lWriting Your First Program . . . . . . . . . . . . . . . . . . . . . . . . . . 2-2
Composing the Program . . . . . . . . . . . . . . . . . . . . . . . . . . 2-2Program Example for the HP-IB Interface . . . . . . . . . . . . . . . . . . 2-2Program Example for the RS-232 Interface . . . . . . . . . . . . . . . . . 2-3
Modifying the Program . . . . . . . . . . . . . . . . . . . . . . . . . . . . 2-4Program Example for the HP-IB Interface . . . . . . . . . . . . . . . . . . 2-4Program Example for the RS-232 Interface . . . . . . . . . . . . . . . . . 2-5
Enhancing the Program with Variables . . . . . . . . . . . . . . . . . . . . 2-6Program Example for the HP-IB Interface . . . . . . . . . . . . . . . . . . 2-6Program Example for the RS-232 Interface . . . . . . . . . . . . . . . . . 2-7
Getting Information from the Spectrum Analyzer . . . . . . . . . . . . . . . 2-8Program Example for the HP-IB Interface . . . . . . . . . . . . . . . . . . 2-8Program Example for the RS-232 Interface . . . . . . . . . . . . . . . . . 2-9
Programming Guidelines . . . . . . . . . . . . . . . . . . . . . . . . . . . 2-10
3. Programming TopicsWhat You’ll Learn in This Chapter . . . . . . . . . . . . . . . . . . . . . . 3-lControlling Trace Data with a Computer . . . . . . . . . . . . . . . . . . . 3-2
Reading Trace Data . . . . . . . . . . . . . . . . . . . . . . . . . . . . 3-2Program Example for the HP-IB Interface . . . . . . . . . . . . . . . . . . 3-2Program Example for the RS-232 Interface . . . . . . . . . . . . . . . . . 3-3
Saving Trace Data . . . . . . . . . . . . . . . . . . . . . . . . . . . . . . 3-4Program Example for the RS-232 Interface . . . . . . . . . . . . . . . . . 3-5
Reading Trace Data from a Computer Disk . . . . . . . . . . . . . . . . . . 3-6Program Example for the HP-IB Interface . . . . . . . . . . . . . . . . . . 3-6Program Example for the RS-232 Interface . . . . . . . . . . . . . . . . . 3-6
Saving and Recalling Instrument States . . . . . . . . . . . . . . . . . . . . 3-7Saving the Spectrum Analyzer’s State . . . . . . . . . . . . . . . . . . . . 3-7Program Example for the HP-IB Interface . . . . . . . . . . . . . . . . . . 3-8Program Example for the RS-232 Interface . . . . . . . . . . . . . . . . . 3-10
Returning the Spectrum Analyzer to its Former State . . . . . . . . . . . . . 3-12Program Example for the HP-IB Interface . . . . . . . . . . . . . . . . . . 3-12Program Example for the RS-232 Interface . . . . . . . . . . . . . . . . . 3-13
Measuring Harmonic Distortion . . . . . . . . . . . . . . . . . . . . . . . . 3-15Program Example for the HP-IB Interface . . . . . . . . . . . . . . . . . . 3-15Program Example for the RS-232 Interface . . . . . . . . . . . . . . . . . 3-18
Different Formats for Trace Data Transfers . . . . . . . . . . . . . . . . . . 3-20P Formatt . . . . . . . . . . . . . . . . . . . . . . . . . . . . . . . . . 3-20
Example of Using the P Format . . . . . . . . . . . . . . . . . . . . . . 3-21B Format . . . . . . . . . . . . . . . . . . . . . . . . . . . . . . . . . 3-22
Example of Using the B Format . . . . . . . . . . . . . . . . . . . . . . 3-22A-Block Format . . . . . . . . . . . . . . . . . . . . . . . . . . . . . . 3-24
Example of Using the A-Block Format . . . . . . . . . . . . . . . . . . . 3-24I-Block Format . . . . . . . . . . . . . . . . . . . . . . . . . . . . . . . 3-25
Example of Using the I-Block Format . . . . . . . . . . . . . . . . . . . 3-25M Formatt . . . . . . . . . . . . . . . . . . . . . . . . . . . . . . . . . 3-26
Example of Using the M Format . . . . . . . . . . . . . . . . . . . . . 3-27
Contents-2

4. Creating and Using Downloadable ProgramsWhat You’ll Learn in This Chapter . . . . . . . . . . . . . . . . . . . . . . 4-l
WhatisaDLP? . . . . . . . . . . . . . . . . . . . . . . . . . . . . . . 4-lWhyUseaDLP?. . . . . . . . . . . . . . . . . . . . . . . . . . . . . . 4-l
Creating a DLP . . . . . . . . . . . . . . . . . . . . . . . . . . . . . . . 4-2‘Ib Use a User-Defined Function within a DLP . . . . . . . . . . . . . . . . 4-3
Example . . . . . . . . . . . . . . . . . . . . . . . . . . . . . . . . 4-3To Use a User-Defined Variable within a DLP . . . . . . . . . . . . . . . . 4-4
Example . . . . . . . . . . . . . . . . . . . . . . . . . . . . . . . . 4-4To Use a User-Defined Trace within a DLP . . . . . . . . . . . . . . . . . . 4-5
Example . . . . . . . 4-5To Enter Values’into a*DLP 1 : 1 1 1 1 1 1 1 : 1 1 1 1 1 1 1 : . . . . . . . 4-6
Example . . . . . . . . . . . . . . . . . . . . . . . . . . . . . . . . 4-6To Enter Values into a DLP by Using a Softkey . . . . . . . . . . . . . . . 4-6
Example . . . . . . . . . . . . . . . . . . . . . . . . . . . . . . . . 4-6To Create a Modular DLP . . . . . . . . . . . . . . . . . . . . . . . . . . 4-7
Example . . . . . . . . . . . . . . . . . . . . . . . . . . . . . . . . 4-7Executing a DLP . . . . . . . . . . . . . . . . . . . . . . . . . . . . . . . 4-9
To Execute a DLP by Using a Softkey . . . . . . . . . . . . . . . . . . . . 4-9Example . . . . . . . . . . . . . . . . . . . . . . . . . . . . . . . . 4-9
To Execute the DLP within a Program . . . . . . . . . . . . . . . . . . . 4-9Example . . . . . . . . . . . . . . . . . . . . . . . . . . . . . . . . 4-9
StoringDLPsonaRAMCard . . . . . . . . . . . . . . . . . . . . . . . . . 4-10‘IbStoreDLPsonaRAMCard . . . . . . . . . . . . . . . . . . . . . . . 4-10
Example . . . . . . . . . . . . . . . . . . . . . . . . . . . . . . . . 4-10To Load DLPs from a Memory Card into Analyzer Memory . . . . . . . . . . 4-11
Example . . . . . . . . . . . . . . . . . . . . . . . . . . . . . . . . 4-11Determining the Amount of Memory Needed for a DLP . . . . . . . . . . . . 4-12
‘lb Determine Available Analyzer Memory . . . . . . . . . . . . . . . . . . 4-12Example . . . . . . . . . . . . . . . . . . . . . . . . . . . . . . . . 4-12
To Determine the Amount of Space on a RAM Card . . . . . . . . . . . . . 4-12Example . . . . . . . . . . . . . . . . . . . . . . . . . . . . . . . . 4-13
To Delete a DLP from Spectrum Analyzer Memory . . . . . . . . . . . . . . 4-14Example . . . . . . . . . . . . . . . 4-14
To Erase the DLP’frbm a RAM’&rd : : : : : : . . . . . . . . . . . . . . . 4-14Example . . . . . . . . . . . . . . . . . . . . . . . . . . . . . . . . 4-14
Using the DLP Editor . . . . . . . . . . . . . . . . . . . . . . . . . . . . 4-15To Connect the External Keyboard to the Spectrum Analyzer . . . . . . . . . 4-15‘lb Access the DLP Editor . . . . . . . . . . . . . . . . . . . . . . . . . . 4-16‘IbCreateaDLP . . . . . . . . . . . . . . . . . . . . . . . . . . . . . . 4-17To Modify the DLP . . . . . . . . . . . . . . . . . . . . . . . . . . . . . 4-18To Modify a Catalog Item . . . . . . . . . . . . . . . . . . . . . . . . . . 4-19
DLP Programming Guidelines . . . . . . . . . . . . . . . . . . . . . . . . . 4-20To Make the DLP More Readable . . . . . . . . . . . . . . . . . . . . . . 4-20ToFindProblemsinaDLP . . . . . . . . . . . . . . . . . . . . . . . . . 4-20

5. Programming CommandsWhat You’ll Learn in This Chapter . . . . . . . . . . . . . . . . . . . . . .Syntax Conventions . . . . . . . . . . . . . . . . . . . . . . . . . . . . .
ABORT Abort . . . . . . . . . . . . . . . . . . . . . . . . . . . . . . .ABS Absolute . . . . . . . . . . . . . . . . . . . . . . . . . . . . . . .ACP Adjacent Channel Power . . . . . . . . . . . . . . . . . . . . . . . .ACPBW Channel Bandwidth . . . . . . . . . . . . . . . . . . . . . . . .ACPCONTM Continuous Sweep Measurement . . . . . . . . . . . . . . . .ACPE Adjacent Channel Power Extended . . . . . . . . . . . . . . . . . .ACPGR Adjacent Channel Power Graph On or Off . . . . . . . . . . . . . .ACPGRAPH Compute the Adjacent Channel Power Graph . . . . . . . . . .ACPMK Adjacent Channel Power Marker On or Off. . . . . . . . . . . . . .ACPPAR ACP Manual or Auto . . . . . . . . . . . . . . . . . . . . . . .ACPSNGLM Single Sweep Measurement . . . . . . . . . . . . . . . . . . .ACPSP Channel Spacing . . . . . . . . . . . . . . . . . . . . . . . . . .ACTDEF Active Function Definition . . . . . . . . . . . . . . . . . . . . .ACTVF Active Function . . . . . . . . . . . . . . . . . . . . . . . . . .ADD Add . . . . . . . . . . . . . . . . . . . . . . . . . . . . . . . . .AMB Trace A Minus Trace B . . . . . . . . . . . . . . . . . . . . . . . .AMBPL Trace A Minus Trace B Plus Display Line . . . . . . . . . . . . . .AMPCOR Amplitude Correction . . . . . . . . . . . . . . . . . . . . . . .AMPLEN Amplitude Correction Length . . . . . . . . . . . . . . . . . . .ANLGPLUS Analog Plus . . . . . . . . . . . . . . . . . . . . . . . . . .ANNOT Annotation . . . . . . . . . . . . . . . . . . . . . . . . . . . .APB Trace A Plus Trace B . . . . . . . . . . . . . . . . . . . . . . . . .AT Attenuation . . . . . . . . . . . . . . . . . . . . . . . . . . . . . .AUNITS Amplitude Units . . . . . . . . . . . . . . . . . . . . . . . . . .AUTO Auto Couple . . . . . . . . . . . . . . . . . . . . . . . . . . . . .AVG Average . . . . . . . . . . . . . . . . . . . . . . . . . . . . . . .AXB Exchange Trace A and Trace B . . . . . . . . . . . . . . . . . . . .BAUDRATE Baud Rate of Spectrum Analyzer . . . . . . . . . . . . . . . .BITBit . . . . . . . . . . . . . . . . . . . . . . . . . . . . . . . . . .BITF Bit Flag . . . . . . . . . . . . . . . . . . . . . . . . . . . . . . .BLANK Blank Trace . . . . . . . . . . . . . . . . . . . . . . . . . . . .BML Trace B Minus Display Line . . . . . . . . . . . . . . . . . . . . . .BTC Transfer Trace B to Trace C . . . . . . . . . . . . . . . . . . . . . .BXC Trace B Exchange Trace C . . . . . . . . . . . . . . . . . . . . . . .CAL Calibration . . . . . . . . . . . . . . . . . . . . . . . . . . . . . .CAT Catalog . . . . . . . . . . . . . . . . . . . . . . . . . . . . . . . .CF Center Frequency . . . . . . . . . . . . . . . . . . . . . . . . . . .CHP Channel Power . . . . . . . . . . . . . . . . . . . . . . . . . . . .CHPGR Channel Power Graph On or Off . . . . . . . . . . . . . . . . . . .CLRAVG Clear Average . . . . . . . . . . . . . . . . . . . . . . . . . . .CLRBOX Clear Box . . . . . . . . . . . . . . . . . . . . . . . . . . . .CLRDSP Clear Display . . . . . . . . . . . . . . . . . . . . . . . . . . .CLRW Clear Write . . . . . . . . . . . . . . . . . . . . . . . . . . . . .CLS Clear Status Byte . . . . . . . . . . . . . . . . . . . . . . . . . . .CMDERRQ Command Error Query . . . . . . . . . . . . . . . . . . . . .CNF Confidence Test . . . . . . . . . . . . . . . . . . . . . . . . . . . .CNTLA Auxiliary Interface Control Line A . . . . . . . . . . . . . . . . .CNTLB Auxiliary Interface Control Line B . . . . . . . . . . . . . . . . . .CNTLC Auxiliary Interface Control Line C . . . . . . . . . . . . . . . . . .CNTLD Auxiliary Interface Control Line D . . . . . . . . . . . . . . . . .CNTLI Auxiliary Interface Control Line Input . . . . . . . . . . . . . . . .COMBComb . . . . . . . . . . . . . . . . . . . . . . . . . . . . . . . .
5-l5-2
5-295-315-335-355-375-385-405-425-435-445-465-475-495-545-555-575-605-625-645-655-675-685-695-715-725-735-755-765-785-805-825-835-845-855-865-895-935-955-975-985-99
5-1015-1025-1035-1045-1055-1065-1075-1085-1095-1105-111
Contents-4

COMPRESS Compress Trace . . . . . . . . . . . . . . . . . . . . . . . .CONCAT Concatenate . . . . . . . . . . . . . . . . . . . . . . . . . . .CONTS Continuous Sweep . . . . . . . . . . . . . . . . . . . . . . . . .CORREK Correction Factors On . . . . . . . . . . . . . . . . . . . . . . .COUPLE Couple . . . . . . . . . . . . . . . . . . . . . . . . . . . . . .CRTHPOS Horizontal Position of CRT Display . . . . . . . . . . . . . . . .CRTVPOS Vertical Position of CRT Display . . . . . . . . . . . . . . . . . .CTA Convert to Absolute Units . . . . . . . . . . . . . . . . . . . . . . .CTM Convert to Measurement Units . . . . . . . . . . . . . . . . . . . .DA Display Address . . . . . . . . . . . . . . . . . . . . . . . . . . . .DATEMODE Date Mode . . . . . . . . . . . . . . . . . . . . . . . . . .DEMOD Demodulation . . . . . . . . . . . . . . . . . . . . . . . . . . .DET Detection Mode . . . . . . . . . . . . . . . . . . . . . . . . . . . .DISPOSE Dispose . . . . . . . . . . . . . . . . . . . . . . . . . . . . .DIV Divide . . . . . . . . . . . . . . . . . . . . . . . . . . . . . . . .DL Display Line . . . . . . . . . . . . . . . . . . . . . . . . . . . . . .DN Down . . . . . . . . . . . . . . . . . . . . . . . . . . . . . . . . .DONE Done . . . . . . . . . . . . . . . . . . . . . . . . . . . . . . . .DOTDENS Dot Density . . . . . . . . . . . . . . . . . . . . . . . . . . .DRAWBOX Draw Box . . . . . . . . . . . . . . . . . . . . . . . . . . .DSPLY Display . . . . . . . . . . . . . . . . . . . . . . . . . . . . . . .DT Define Terminator . . . . . . . . . . . . . . . . . . . . . . . . . . .EE Enable Entry . . . . . . . . . . . . . . . . . . . . . . . . . . . . .EK Enable Knob . . . . . . . . . . . . . . . . . . . . . . . . . . . . . .ENTER Enter From HP-IB . . . . . . . . . . . . . . . . . . . . . . . . .EP Enter Parameter Function . . . . . . . . . . . . . . . . . . . . . . .ERASE Erase . . . . . . . . . . . . . . . . . . . . . . . . . . . . . . .EXP Exponent. . . . . . . . . . . . . . . . . . . . . . . . . . . . . . .FA Start Frequency . . . . . . . . . . . . . . . . . . . . . . . . . . . .FB Stop Frequency . . . . . . . . . . . . . . . . . . . . . . . . . . . .FFT Fast Fourier Transform . . . . . . . . . . . . . . . . . . . . . . . .FFTAUTO Marker to Auto FFT . . . . . . . . . . . . . . . . . . . . . . .FFTCLIP FFl’ Signal Clipped . . . . . . . . . . . . . . . . . . . . . . . .FFTCONTS FFT Continuous Sweep . . . . . . . . . . . . . . . . . . . . .FFTMKR FFT Markers . . . . . . . . . . . . . . . . . . . . . . . . . . .FFTMM FFT Marker to Midscreen . . . . . . . . . . . . . . . . . . . . . .FFTMS FFT Marker to FFT Stop Frequency . . . . . . . . . . . . . . . . .FFTOFFFFTOff . . . . . . . . . . . . . . . . . . . . . . . . . . . . . .FFTPCTAM FFT Percent Amplitude Modulation . . . . . . . . . . . . . . .FFTPCTAMR FFT Percent Amplitude Modulation Readout . . . . . . . . . .FFTSNGLS FFT Single Sweep . . . . . . . . . . . . . . . . . . . . . . . .FFTSTAT FFT Status . . . . . . . . . . . . . . . . . . . . . . . . . . . .FFTSTOP FFT Stop Frequency . . . . . . . . . . . . . . . . . . . . . . .FMGAIN FM Gain . . . . . . . . . . . . . . . . . . . . . . . . . . . . .FOFFSET Frequency Offset . . . . . . . . . . . . . . . . . . . . . . . . .FORMAT Format Card . . . . . . . . . . . . . . . . . . . . . . . . . . .FS Full Span. . . . . . . . . . . . . . . . . . . . . . . . . . . . . . . .FUNCDEF Define Function . . . . . . . . . . . . . . . . . . . . . . . . .GATEGate . . . . . . . . . . . . . . . . . . . . . . . . . . . . . . . .GATECTL Gate Control . . . . . . . . . . . . . . . . . . . . . . . . . . .GC Gate Preset . . . . . . . . . . . . . . . . . . . . . . . . . . . . . .GD Gate Delay. . . . . . . . . . . . . . . . . . . . . . . . . . . . . . .GDRVCLPAR Clear Pulse Parameters . . . . . . . . . . . . . . . . . . . .GDRVGDEL Gate Delay for the Frequency Window . . . . . . . . . . . . .GDRVGLEN Gate Length for the Frequency and Time Windows . . . . . . .
5-1125-1145-1165-1175-1185-1195-1205-1215-1235-1245-1275-1285-1295-1315-1335-1355-1375-1385-1405-1415-1435-1455-1465-1485-1495-1515-1525-1535-1565-1585-1605-1645-1665-1675-1685-1695-1705-1715-1725-1735-1745-1765-1775-1795-1805-1825-1835-1845-1865-1875-1885-1895-1905-1915-193
Contents-5

GDRVGT Window Gate Control . . . . . . . . . . . . . . . . . . . . . . . 5-194GDRVGTIM Gate Trigger to Marker Position for the Time Window . . . . . . 5-196GDRVPRI Pulse Repetition Interval . . . . . . . . . . . . . . . . . . . . . 5-198GDRVPWID Pulse Width . . . . . . . . . . . . . . . . . . . . . . . . . . 5-200GDRVRBW Couple Resolution Bandwidth to Pulse Width . . . . . . . . . . . 5-202GDRVREFE Enter Reference Edge . . . . . . . . . . . . . . . . . . . . . 5-204GDRVST Couple Sweep Time to Pulse Repetition Interval . . . . . . . . . . 5-206GDRVSWAP Update the Time or Frequency Window . . . . . . . . . . . . . 5-208GDRVSWDE Delay Sweep for Time Window . . . . . . . . . . . . . . . . . 5-209GDRVSWP Sweep Time for the Time Window . . . . . . . . . . . . . . . . 5-211GDRVUTIL Gate Utility . . . . . . . . . . . . . . . . . . . . . . . . . . 5-213GDRVVBW Couple Video Bandwidth to Gate Length . . . . . . . . . . . . . 5-215GETPLOT Get Plot . . . . . . . . . . . . . . . . . . . . . . . . . . . . . 5-217GETPRNT Get Print . . . . . . . . . . . . . . . . . . . . . . . . . . . . 5-219GL Gate Length . . . . . . . . . . . . . . . . . . . . . . . . . . . . . . 5-221GP Gate Polarity . . . . . . . . . . . . . . . . . . . . . . . . . . . . . . 5-222GRGraph . . . . . . . . . . . . . . . . . . . . . . . . . . . . . . . . . 5-223GRAT Graticule . . . . . . . . . . . . . . . . . . . . . . . . . . . . . . 5-224HAVE Have . . . . . . . . . . . . . . . . . . . . . . . . . . . . . . . . 5-225HD Hold Data Entry . . . . . . . . . . . . . . . . . . . . . . . . . . . . 5-228HN Harmonic Number . . . . . . . . . . . . . . . . . . . . . . . . . . . 5-229HNLOCK Harmonic Number Lock . . . . . . . . . . . . . . . . . . . . . . 5-230HNUNLK Unlock Harmonic Number . . . . . . . . . . . . . . . . . . . . 5-233IBInputB. . . . . . . . . . . . . . . . . . . . . . . . . . . . . . . . . 5-234ID Identify . . . . . . . . . . . . . . . . . . . . . . . . . . . . . . . . 5-235IF THEN ELSE ENDIF If Then Else Endif . . . . . . . . . . . . . . . . . . 5-236INT Integer . . . . . . . . . . . . . . . . . . . . . . . . . . . . . . . . 5-239INZ Input Impedance . . . . . . . . . . . . . . . . . . . . . . . . . . . 5-241IP Instrument Preset . . . . . . . . . . . . . . . . . . . . . . . . . . . . 5-242KEYCLR Key Clear. . . . . . . . . . . . . . . . . . . . . . . . . . . . . 5-246KEYCMD Key Command . . . . . . . . . . . . . . . . . . . . . . . . . . 5-247KEYDEF User-Defined Key Definition . . . . . . . . . . . . . . . . . . . . 5-251KEYENH Key Enhance. . . . . . . . . . . . . . . . . . . . . . . . . . . 5-255KEYEXC Key Execute . . . . . . . . . . . . . . . . . . . . . . . . . . . 5-260KEYLBL Key Label . . . . . . . . . . . . . . . . . . . . . . . . . . . . 5-261LBLabel . . . . . . . . . . . . . . . . . . . . . . . . . . . . . . . . . 5-263LF Base Band Instrument Preset . . . . . . . . . . . . . . . . . . . . . . 5-267LG Logarithmic Scale . . . . . . . . . . . . . . . . . . . . . . . . . . . 5-268LIMIDEL Delete Limit-Line ‘lhble . . . . . . . . . . . . . . . . . . . . . . 5-269LIMIDISP Limit Line Display . . . . . . . . . . . . . . . . . . . . . . . . . 5-270LIMIFAIL Limits Failed . . . . . . . . . . . . . . . . . . . . . . . . . . . 5-272LIMIFT Select Frequency or Time Limit Line . . . . . . . . . . . . . . . . 5-274LIMIHI Upper Limit . . . . . . . . . . . . . . . . . . . . . . . . . . . . 5-275LIMILINE Limit Lines . . . . . . . . . . . . . . . . . . . . . . . . . . . 5-276LIMILO Lower Limit . . . . . . . . . . . . . . . . . . . . . . . . . . . . 5-279LIMIMIRROR Mirror Limit Line . . . . . . . . . . . . . . . . . . . . . . . 5-280LIMIMODE Limit-Line Entry Mode . . . . . . . . . . . . . . . . . . . . . 5-281LIMIREL Relative Limit Lines . . . . . . . . . . . . . . . . . . . . . . . 5-283LIMISEG Enter Limit-Line Segment for Frequency . . . . . . . . . . . . . . 5-285LIMISEGT Enter Limit-Line Segment for Sweep Time . . . . . . . . . . . . 5-288LIMITEST Enable Limit Line Testing . . . . . . . . . . . . . . . . . . . . 5-291LINFILL Line Fill . . . . . . . . . . . . . . . . . . . . . . . . . . . . . 5-293LN Linear Scale . . . . . . . . . . . . . . . . . . . . . . . . . . . . . . 5-295LOAD Load . . . . . . . . . . . . . . . . . . . . . . . . . . . . . . . . 5-296LOG Logarithm . . . . . . . . . . . . . . . . . . . . . . . . . . . . . . 5-298
Contents.6

LSPAN Last Span . . . . . . . . . . . . . . . . . . . . . . . . . . . . .MDS Measurement Data Size . . . . . . . . . . . . . . . . . . . . . . . .MDU Measurement Data Units . . . . . . . . . . . . . . . . . . . . . . .MEAN Trace Mean . . . . . . . . . . . . . . . . . . . . . . . . . . . . .MEANTH Trace Mean Above Threshold . . . . . . . . . . . . . . . . . . .MEASOFF Measurement Off . . . . . . . . . . . . . . . . . . . . . . . .MEASURE Measure Mode . . . . . . . . . . . . . . . . . . . . . . . . .MEM Memory Available . . . . . . . . . . . . . . . . . . . . . . . . . .MENU Menu . . . . . . . . . . . . . . . . . . . . . . . . . . . . . . .MERGE Merge Two Traces . . . . . . . . . . . . . . . . . . . . . . . . .MF Marker Frequency Output . . . . . . . . . . . . . . . . . . . . . . .MIN Minimum . . . . . . . . . . . . . . . . . . . . . . . . . . . . . . .MINH Minimum Hold . . . . . . . . . . . . . . . . . . . . . . . . . . . .MINPOS Minimum Position . . . . . . . . . . . . . . . . . . . . . . . . .MIRROR Mirror Image . . . . . . . . . . . . . . . . . . . . . . . . . . .MKA Marker Amplitude . . . . . . . . . . . . . . . . . . . . . . . . . .MKACT Activate Marker . . . . . . . . . . . . . . . . . . . . . . . . . .MKACTV Marker As the Active Function . . . . . . . . . . . . . . . . . .MKBW Marker Bandwidth . . . . . . . . . . . . . . . . . . . . . . . . .MKCF Marker to Center Frequency . . . . . . . . . . . . . . . . . . . . .MKCONT Marker Continue . . . . . . . . . . . . . . . . . . . . . . . . .MKD Marker Delta. . . . . . . . . . . . . . . . . . . . . . . . . . . . .MKDLMODE Marker Delta Display Line Mode . . . . . . . . . . . . . . . .MKF Marker Frequency . . . . . . . . . . . . . . . . . . . . . . . . . .MKFC Marker Counter . . . . . . . . . . . . . . . . . . . . . . . . . . .MKFCR Marker Counter Resolution . . . . . . . . . . . . . . . . . . . . .MKMIN Marker Minimum . . . . . . . . . . . . . . . . . . . . . . . . . .MKN Marker Normal . . . . . . . . . . . . . . . . . . . . . . . . . . . .MKNOISE Marker Noise . . . . . . . . . . . . . . . . . . . . . . . . . .MKOFF Marker Off . . . . . . . . . . . . . . . . . . . . . . . . . . . .MKP Marker Position . . . . . . . . . . . . . . . . . . . . . . . . . . . .MKPAUSE Marker Pause . . . . . . . . . . . . . . . . . . . . . . . . . .MKPK Marker Peak . . . . . . . . . . . . . . . . . . . . . . . . . . . .MKPX Marker Peak Excursion . . . . . . . . . . . . . . . . . . . . . . .MKREAD Marker Readout . . . . . . . . . . . . . . . . . . . . . . . . .MKRL Marker to Reference Level . . . . . . . . . . . . . . . . . . . . . .MKSP Marker to Span . . . . . . . . . . . . . . . . . . . . . . . . . . .MKSS Marker to Step Size . . . . . . . . . . . . . . . . . . . . . . . . .MKSTOP Marker Stop . . . . . . . . . . . . . . . . . . . . . . . . . . .MKTBL Marker %ble . . . . . . . . . . . . . . . . . . . . . . . . . . .MKTRACE Marker Trace . . . . . . . . . . . . . . . . . . . . . . . . . .MKTRACK Marker Track . . . . . . . . . . . . . . . . . . . . . . . . . .MKTYPE Marker Type . . . . . . . . . . . . . . . . . . . . . . . . . . .ML Mixer Level . . . . . . . . . . . . . . . . . . . . . . . . . . . . . .MOD Modulo . . . . . . . . . . . . . . . . . . . . . . . . . . . . . . .MODE Mode . . . . . . . . . . . . . . . . . . . . . . . . . . . . . . . .MOV Move . . . . . . . . . . . . . . . . . . . . . . . . . . . . . . . .MPY Multiply . . . . . . . . . . . . . . . . . . . . . . . . . . . . . . .MS1 Mass Storage Is . . . . . . . . . . . . . . . . . . . . . . . . . . . .MXM Maximum . . . . . . . . . . . . . . . . . . . . . . . . . . . . . .MXMH Maximum Hold . . . . . . . . . . . . . . . . . . . . . . . . . . .M4 Marker Zoom. . . . . . . . . . . . . . . . . . . . . . . . . . . . . .NDB Number of dB . . . . . . . . . . . . . . . . . . . . . . . . . . . .NDBPNT N dB PointsNDBPNTR N dB Points Bandwidth’ : : : 1 : : : : : : : : : : : : : : : : :
5-3015-3025-3045-3065-3075-3095-3105-3125-3135-3155-3175-3195-32 15-3225-3235-3255-3275-3285-3295-3305-3315-3325-3345-3365-3385-3395-3415-3425-3445-3465-3475-3495-3515-3525-3545-3565-3575-3585-3595-3605-3625-3635-3645-3655-3675-3695-3705-3725-3745-3755-3775-3785-3805-3815-383
Contents-7

NRL Normalized Reference Level . . . . . . . . . . . . . . . . . . . . . . 5-384OA Output Active Function Value . . . . . . . . . . . . . . . . . . . . . . 5-386OBW Occupied Bandwidth . . . . . . . . . . . . . . . . . . . . . . . . . 5-387OBWPCT Occupied Bandwidth Percent . . . . . . . . . . . . . . . . . . . 5-389OL Output Learn String . . . . . . . . . . . . . . . . . . . . . . . . . . 5-390ONCYCLE On Cycle . . . . . . . . . . . . . . . . . . . . . . . . . . . . 5-391ONDELAY On Delay . . . . . . . . . . . . . . . . . . . . . . . . . . . . 5-393ONEOS On End of Sweep . . . . . . . . . . . . . . . . . . . . . . . . . 5-395ONMKR On Marker . . . . . . . . . . . . . . . . . . . . . . . . . . . . 5-397ONMKRU On Marker Update . . . . . . . . . . . . . . . . . . . . . . . . 5-399ONPWRUP On Power Up . . . . . . . . . . . . . . . . . . . . . . . . . . 5-401ONSRQ On Service Request . . . . . . . . . . . . . . . . . . . . . . . . . 5-402ONSWP On Sweep . . . . . . . . . . . . . . . . . . . . . . . . . . . . . 5-404ONTIME On Time . . . . . . . . . . . . . . . . . . . . . . . . . . . . . 5-406OP Output Parameter . . . . . . . . . . . . . . . . . . . . . . . . . . . 5-408OUTPUT Output to Remote Port or Parallel Port . . . . . . . . . . . . . . . 5-409PA Plot Absolute . . . . . . . . . . . . . . . . . . . . . . . . . . . . . 5-412PARSTAT Parallel Status . . . . . . . . . . . . . . . . . . . . . . . . . . 5-414PCTAM Percent AM . . . . . . . . . . . . . . . . . . . . . . . . . . . . 5-416PCTAMR Percent AM Response . . . . . . . . . . . . . . . . . . . . . . . 5-418PDPenDown.. . . . . . . . . . . . . . . . . . . . . . . . . . . . . . 5-419PDA Probability Distribution of Amplitude . . . . . . . . . . . . . . . . . 5-420PDF Probability Distribution of Frequency . . . . . . . . . . . . . . . . . 5-422PEAKS Peaks . . . . . . . . . . . . . . . . . . . . . . . . . . . . . . . 5-424PKDLMODE Peak Table Delta Display Line Mode . . . . . . . . . . . . . . 5-428PKPOS Peak Position . . . . . . . . . . . . . . . . . . . . . . . . . . . . 5-430PKRES Peak Result . . . . . . . . . . . . . . . . . . . . . . . . . . . . 5-43 1PKSORT Peak Sort . . . . . . . . . . . . . . . . . . . . . . . . . . . . . 5-433PKTBL Peak ‘Iable . . . . . . . . . . . . . . . . . . . . . . . . . . . . . 5-434PKZMOK Peak Zoom Okay . . . . . . . . . . . . . . . . . . . . . . . . . 5-436PKZOOM Peak Zoom . . . . . . . . . . . . . . . . . . . . . . . . . . . . 5-437PLOT Plot . . . . . . . . . . . . . . . . . . . . . . . . . . . . . . . . . 5-439PLTPRT Plot Port . . . . . . . . . . . . . . . . . . . . . . . . . . . . . 5-441POWERON Power-On State . . . . . . . . . . . . . . . . . . . . . . . . . 5-442PP Preselector Peak . . . . . . . . . . . . . . . . . . . . . . . . . . . . 5-443PR Plot Relative . . . . . . . . . . . . . . . . . . . . . . . . . . . . . . 5-444PREAMPG External Preamplifier Gain . . . . . . . . . . . . . . . . . . . 5-445PREFX Prefix . . . . . . . . . . . . . . . . . . . . . . . . . . . . . . . 5-446PRINT Print . . . . . . . . . . . . . . . . . . . . . . . . . . . . . . . . 5-447PRNTADRS Print Address . . . . . . . . . . . . . . . . . . . . . . . . . 5-449PRNPRT Print Port . . . . . . . . . . . . . . . . . . . . . . . . . . . . . 5-450PSTATE Protect State . . . . . . . . . . . . . . . . . . . . . . . . . . . 5-451PUPenUp . . . . . . . . . . . . . . . . . . . . . . . . . . . . . . . . 5-452PURGE Purge File . . . . . . . . . . . . . . . . . . . . . . . . . . . . . 5-453PWRBW Power Bandwidth . . . . . . . . . . . . . . . . . . . . . . . . . 5-454PWRUPTIME Power Up Time . . . . . . . . . . . . . . . . . . . . . . . . 5-456RB Resolution Bandwidth . . . . . . . . . . . . . . . . . . . . . . . . . 5-457RCLS Recall State . . . . . . . . . . . . . . . . . . . . . . . . . . . . . 5-459RCLT Recall Trace . . . . . . . . . . . . . . . . . . . . . . . . . . . . . 5-460RELHPIB Release HP-IB . . . . . . . . . . . . . . . . . . . . . . . . . . 5-462REPEAT UNTIL Repeat Until . . . . . . . . . . . . . . . . . . . . . . . . 5-463RESETRL Reset Reference Level . . . . . . . . . . . . . . . . . . . . . . 5-465RETURN Return . . . . . . . . . . . . . . . . . . . . . . . . . . . . . . 5-466REV Revision . . . . . . . . . . . . . . . . . . . . . . . . . . . . . . . 5-467RL Reference Level . . . . . . . . . . . . . . . . . . . . . . . . . . . . 5-468
Contents.8

RLPOS Reference-Level Position . . . . . . . . . . . . . . . . . . . . . .RMS Root Mean Square Value . . . . . . . . . . . . . . . . . . . . . . . .ROFFSET Reference Level Offset . . . . . . . . . . . . . . . . . . . . . .RQS Service Request Mask . . . . . . . . . . . . . . . . . . . . . . . . .SAVEMENU Save Menu . . . . . . . . . . . . . . . . . . . . . . . . . .SAVES Save State . . . . . . . . . . . . . . . . . . . . . . . . . . . . .SAVET Save Trace . . . . . . . . . . . . . . . . . . . . . . . . . . . . .SAVRCLF Save or Recall Flag . . . . . . . . . . . . . . . . . . . . . . . .SAVRCLN Save or Recall Number . . . . . . . . . . . . . . . . . . . . . .SAVRCLW Save or Recall Data . . . . . . . . . . . . . . . . . . . . . . .SEGDEL Segment Delete . . . . . . . . . . . . . . . . . . . . . . . . . .SENTER Segment Entry for Frequency Limit Lines . . . . . . . . . . . . .SENTERT Segment Entry for Sweep Time Limit Lines . . . . . . . . . . . .SER Serial Number . . . . . . . . . . . . . . . . . . . . . . . . . . . .SETDATE Set Date . . . . . . . . . . . . . . . . . . . . . . . . . . . . .SETTIME Set Time . . . . . . . . . . . . . . . . . . . . . . . . . . . . .SMOOTH Smooth Trace . . . . . . . . . . . . . . . . . . . . . . . . . .SNGLS Single Sweep . . . . . . . . . . . . . . . . . . . . . . . . . . . .SPSpan . . . . . . . . . . . . . . . . . . . . . . . . . . . . . . . . . .SPEAKER Speaker . . . . . . . . . . . . . . . . . . . . . . . . . . . . .SPZOOM Span Zoom . . . . . . . . . . . . . . . . . . . . . . . . . . . .SQLCH Squelch . . . . . . . . . . . . . . . . . . . . . . . . . . . . . .SQR Square Root. . . . . . . . . . . . . . . . . . . . . . . . . . . . . .SRCALC Source Leveling Control . . . . . . . . . . . . . . . . . . . . . .SRCAT Source Attenuator . . . . . . . . . . . . . . . . . . . . . . . . .SRCNORM Source Normalization . . . . . . . . . . . . . . . . . . . . . .SRCPOFS Source Power Offset . . . . . . . . . . . . . . : . . . . . . . .SRCPSTP Source Power-Level Step Size . . . . . . . . . . . . . . . . . . .SRCPSWP Source Power Sweep . . . . . . . . . . . . . . . . . . . . . . .SRCPWR Source Power . . . . . . . . . . . . . . . . . . . . . . . . . . .SRCTK Source Tracking . . . . . . . . . . . . . . . . . . . . . . . . . .SRCTKPK Source Tracking Peak . . . . . . . . . . . . . . . . . . . . . .SRQ Force Service Request . . . . . . . . . . . . . . . . . . . . . . . . .SS Center Frequency Step Size . . . . . . . . . . . . . . . . . . . . . . .ST Sweep Time . . . . . . . . . . . . . . . . . . . . . . . . . . . . . .STB Status Byte Query . . . . . . . . . . . . . . . . . . . . . . . . . . .STDEV Standard Deviation of Trace Amplitudes . . . . . . . . . . . . . . .STOR Store . . . . . . . . . . . . . . . . . . . . . . . . . . . . . . . .SUB Subtract . . . . . . . . . . . . . . . . . . . . . . . . . . . . . . .SUM Sum of Trace Amplitudes . . . . . . . . . . . . . . . . . . . . . . .SUMSQR Sum of Squared Trace Amplitudes . . . . . . . . . . . . . . . . .SWPCPL Sweep Couple . . . . . . . . . . . . . . . . . . . . . . . . . .SYNCMODE Synchronize Mode . . . . . . . . . . . . . . . . . . . . . . .TA Transfer A . . . . . . . . . . . . . . . . . . . . . . . . . . . . . . .TB Transfer B . . . . . . . . . . . . . . . . . . . . . . . . . . . . . . .TDF Trace Data Format . . . . . . . . . . . . . . . . . . . . . . . . . .TEXT TextTH Threshold
. . . . . . . . . . . . . . . . . . . . . . . . . . . . . . .
. . . . . . . . . . . . . . . . . . . . . . . . . . . . . . .TIMEDATE Time Date . . . . . . . . . . . . . . . . . . . . . . . . . . .TIMEDSP Time Display . . . . . . . . . . . . . . . . . . . . . . . . . . .TITLE Title . . . . . . . . . . . . . . . . . . . . . . . . . . . . . . . .TM Trigger Mode . . . . . . . . . . . . . . . . . . . . . . . . . . . . .TO1 Third-Order Intermodulation Measurement . . . . . . . . . . . . . . .TOIR Third-Order Intermodulation Response . . . . . . . . . . . . . . . . .TRA/TRB/TRC Trace Data Input and Output . . . . . . . . . . . . . . . . .
5-4705-4715-4725-4735-4755-4765-4775-4795-4805-4825-4835-4855-4885-4915-4925-4935-4945-4965-4975-4995-5005-5015-5025-5045-5065-5085-5105-5115-5135-5155-5175-5195-5205-5245-5265-5285-5295-5315-5345-5365-5375-5385-5405-5425-5435-5445-5495-5505-5515-5525-5535-5545-5565-5585-559
Contents-9

Figures
l-l. Connecting the HP 9000 Series 200 Computer to the Spectrum Analyzer . . .l-2. Connecting the HP 9000 Series 300 Computer to the Spectrum Analyzer . . .l-3. Connecting the HP Vectra Personal Computer to the Spectrum Analyzer . . .l-4. Connecting the Personal Computer to the Spectrum Analyzer . . . . . . . . .3-l. Measurement Unit Range and Trace Amplitudes . . . . . . . . . . . . . . .4-l. Determining the Number of Records . . . . . . . . . . . . . . . . . . . .4-2. Connecting the External Keyboard to the Spectrum Analyzer . . . . . . . . .4-3. Accessing the DLP Editor . . . . . . . . . . . . . . . . . . . . . . . . .4-4. Entering a DLP . . . . . . . . . . . . . . . . . . . . . . . . . . . . . .4-5. Selecting a Catalog Item . . . . . . . . . . . . . . . . . . . . . . . . . .5-l. Command Syntax Figure . . . . . . . . . . . . . . . . . . . . . . . . . .5-2. Using the CLRBOX Command . . . . . . . . . . . . . . . . . . . . . . . .5-3. Using the DRAWBOX Command . . . . . . . . . . . . . . . . . . . . . . .5-4. Harming Filter Window . . . . . . . . . . . . . . . . . . . . . . . . . .5-5. Uniform Filter Window . . . . . . . . . . . . . . . . . . . . . . . . . .5-6. Flat Top Filter Window . . . . . . . . . . . . . . . . . . . . . . . . . . .5-7. Using the MENU Command . . . . . . . . . . . . . . . . . . . . . . . . .5-8. Display Units . . . . . . . . . . . . . . . . . . . . . . . . . . . . . . .5-9. Frequency and Amplitude of the Peaks . . . . . . . . . . . . . . . . . . .B-l. HP-IB Connector . . . . . . . . . . . . . . . . . . . . . . . . . . . . . .C-l. RS-232 Connector . . . . . . . . . . . . . . . . . . . . . . . . . . . . .C-2. HP 245426 25-pin to g-pin Full Handshaking Connection . . . . . . . . . . .C-3. HP 24542U g-pin to g-pin Full Handshaking Connection . . . . . . . . . . .C-4. 25-pin to g-pin 3-Wire Connection . . . . . . . . . . . . . . . . . . . . .C-5. g-pin to g-pin 3-Wire Connection . . . . . . . . . . . . . . . . . . . . . .C-6. 25-pin to g-pin ThinkJet Printer Connection . . . . . . . . . . . . . . . . .C-7. HP C2932A g-pin to g-pin LaserJet Printer Connection . . . . . . . . . . . .C-8. 25-pin to g-pin Modem Connection . . . . . . . . . . . . . . . . . . . . .C-9. HP-GL Plotter Connection . . . . . . . . . . . . . . . . . . . . . . . . .
l-3l-5l-7l-9
3-264-134-154-164-174-19
5-25-99
5-1415-1625-1635-1635-3145-4135-426
B-lC-lc-3c-3c-3c-4c-4c-5C-6C-6
Contents-l 1
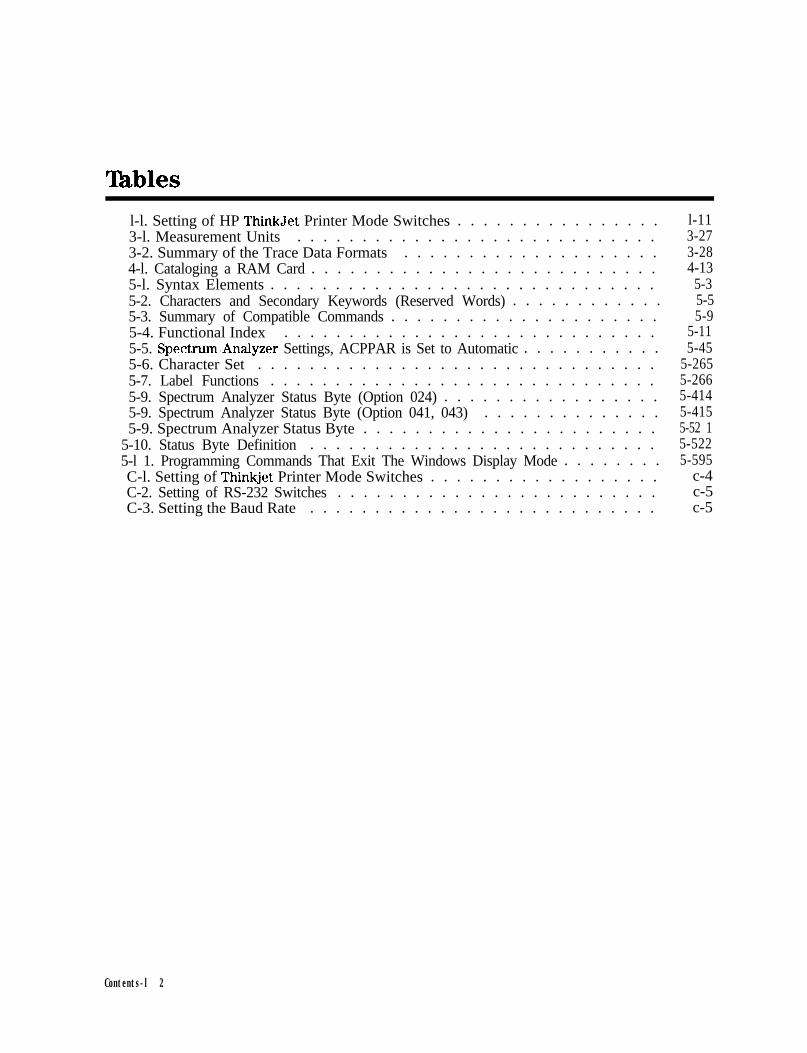
Xhbles
l-l. Setting of HP ThinkJet Printer Mode Switches . . . . . . . . . . . . . . . .3-l. Measurement Units . . . . . . . . . . . . . . . . . . . . . . . . . . . .3-2. Summary of the Trace Data Formats . . . . . . . . . . . . . . . . . . . .4-l. Cataloging a RAM Card . . . . . . . . . . . . . . . . . . . . . . . . . . .5-l. Syntax Elements . . . . . . . . . . . . . . . . . . . . . . . . . . . . . .5-2. Characters and Secondary Keywords (Reserved Words) . . . . . . . . . . . .5-3. Summary of Compatible Commands . . . . . . . . . . . . . . . . . . . . .5-4. Functional Index . . . . . . . . . . . . . . . . . . . . . . . . . . . . .5-5. Spectrum,AnaIyzer Settings, ACPPAR is Set to Automatic . . . . . . . . . . .5-6. Character Set . . . . . . . . . . . . . . . . . . . . . . . . . . . . . . .5-7. Label Functions . . . . . . . . . . . . . . . . . . . . . . . . . . . . . .5-9. Spectrum Analyzer Status Byte (Option 024) . . . . . . . . . . . . . . . . .5-9. Spectrum Analyzer Status Byte (Option 041, 043) . . . . . . . . . . . . . .5-9. Spectrum Analyzer Status Byte . . . . . . . . . . . . . . . . . . . . . . .
5-10. Status Byte Definition . . . . . . . . . . . . . . . . . . . . . . . . . . .5-l 1. Programming Commands That Exit The Windows Display Mode . . . . . . . .C-l. Setting of Thinkjet Printer Mode Switches . . . . . . . . . . . . . . . . . .C-2. Setting of RS-232 Switches . . . . . . . . . . . . . . . . . . . . . . . . .C-3. Setting the Baud Rate . . . . . . . . . . . . . . . . . . . . . . . . . . .
l-113-273-284-13
5-35-55-9
5-115-45
5-2655-2665-4145-4155-52 15-5225-595
c-4c-5c-5
Contents-l 2

1Preparing for Use
What You’ll Learn in This ChapterThis chapter tells you how to connect a computer to your spectrum analyzer via theHewlett-Packard Interface Bus (HP-IB) or the RS-232 Interface and how to connect a printeror a plotter. The remainder of the chapter covers procedures to follow if a problem isencountered.
Connecting Your Spectrum Analyzer to a ComputerThe spectrum analyzer works with many popular computers. However, the steps required toconnect your spectrum analyzer to a specific computer depend on the computer you are using.Before turning to the interconnection instructions for your computer, please read the followinggeneral information.
Configuring Your Computer SystemEvery computer system has a specific configuration. Your system configuration might includea printer, external disk drive, or plotter. Whenever you add another piece of equipment (forexample, your spectrum analyzer), you may need to reconfigure your computer system so thatthe computer knows where and how to send information to the newly added device.
Some computers do not require configuring when a spectrum analyzer is connected; othersrequire a simple modification. The most common modification is changing the configurationinformation stored on the computer’s operating system disk. A few computers require theinsertion of an add-on board, or “card.” Refer to your computer documentation if your systemneeds these modifications.
All of the test programs for HP-IB and RS-232 interfaces are written using the BASIC languageof the computer under consideration. If you have never entered or run a BASIC program, referto your computer documentation.
Preparing for Use l-1

Connecting the Computer to the Spectrum Analyzer
For the HP-IB InterfaceRefer to Appendix B for a detailed description of the HP-IB interface.
Appendix B contains instructions for connecting the spectrum analyzer’s HP-IB interface toeither an HP 9000 Series 200, or a Series 300 computer, or to an HP Vectra PC equipped withan HP 82300B BASIC Language Processor. If your computer is not listed, but it supports anHP-IB interface, there is a good possibility that it can be connected to the spectrum analyzer.Consult your computer documentation to determine how to connect external devices on thebus.
For the BS-232 InterfaceRefer to Appendix C for a detailed description of the RS-232 interface.
Appendix C contains instructions for connecting the spectrum analyzer’s RS-232 interface toan HP Vectra PC or IBM PC/AT or compatible computers. If your computer is not listed, but itsupports a standard RS-232 interface, there is a good possibility that the spectrum analyzer maybe connected to the computer. Consult your computer documentation to determine how toconnect external devices to your computer’s RS-232 connector.
There are two types of RS-232 devices: data terminal equipment (DTE) and datacommunication equipment (DCE). Types of DTE devices include display terminals. DCEequipment includes modems and, generally, other computer RS-232 devices. The spectrumanalyzer RS-232 port is the DTE-type. Connections from the computer (DCE) to the spectrumanalyzer (DTE) are shown in Appendix C.
The Test ProgramTo test the system configuration, a simple test program is provided for each computer listed.After you have connected your computer and spectrum analyzer, you should enter and runthe test program on your computer to make sure the computer is sending instructions to thespectrum analyzer through the interface cable. If the interface is working and the program isentered correctly, a statement is displayed on the computer screen.
Note The listed computer and spectrum analyzer equipment includes the minimumcomponents necessary to establish communication between your spectrumanalyzer and computer. If you are using application software, check with yoursoftware supplier for specific computer hardware and memory requirements.
Note Using an interface cable other than the one listed with your computer’sinterconnection instructions may prevent proper communication between thespectrum analyzer and computer.
Pressing f-1 removes the spectrum analyzer from remote mode and enables front-panelcontrol.
l-2 Preparing for Use

HP-IB Connections for the HP 9000 Series 200 TechnicalComputers
Equipmentn HP 9816, 9826, or 9836 Series 200 technical computer
w HP 8590 Series spectrum analyzer with Option 041
n HP 10833 (or equivalent) HP-IB cable
Interconnection InstructionsConnect the spectrum analyzer to the computer using the HP-IB cable. Figure l-l shows anHP 9836 computer connected to the spectrum analyzer.
Figure l-l. Connecting the HP 9000 Series 200 Computer to the Spectrum Analyzer
Preparing for Use l-3
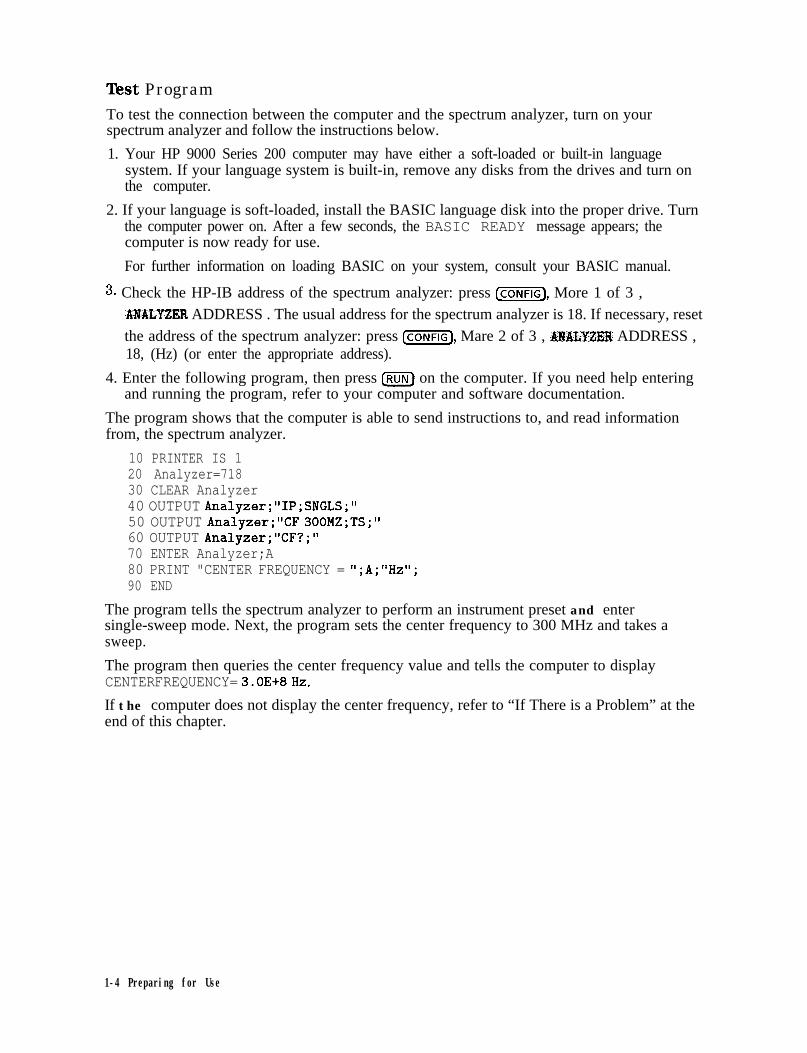
Test ProgramTo test the connection between the computer and the spectrum analyzer, turn on yourspectrum analyzer and follow the instructions below.
1. Your HP 9000 Series 200 computer may have either a soft-loaded or built-in languagesystem. If your language system is built-in, remove any disks from the drives and turn onthe computer.
2. If your language is soft-loaded, install the BASIC language disk into the proper drive. Turnthe computer power on. After a few seconds, the BASIC READY message appears; thecomputer is now ready for use.
For further information on loading BASIC on your system, consult your BASIC manual.
8. Check the HP-IB address of the spectrum analyzer: press @ZiZ], More 1 of 3 ,ANALYZER ADDRESS . The usual address for the spectrum analyzer is 18. If necessary, resetthe address of the spectrum analyzer: press L-1, Mare 2 of 3 , A??ALYZElt ADDRESS ,18, (Hz) (or enter the appropriate address).
4. Enter the following program, then press IRUN) on the computer. If you need help enteringand running the program, refer to your computer and software documentation.
The program shows that the computer is able to send instructions to, and read informationfrom, the spectrum analyzer.
10 PRINTER IS 120 Analyzer=71830 CLEAR Analyzer40 OUTPUT Analyzer;"IP;SNGLS;"50 OUTPUT Analyzer;"CF 300MZ;TS;"60 OUTPUT Analyzer;"CF?;"70 ENTER Analyzer;A80 PRINT "CENTER FREQUENCY = ";A;"Hz";90 END
The program tells the spectrum analyzer to perform an instrument preset and entersingle-sweep mode. Next, the program sets the center frequency to 300 MHz and takes asweep.
The program then queries the center frequency value and tells the computer to displayCENTERFREQUENCY= 3.OE+8Hz.
If the computer does not display the center frequency, refer to “If There is a Problem” at theend of this chapter.
1-4 Preparing for Use
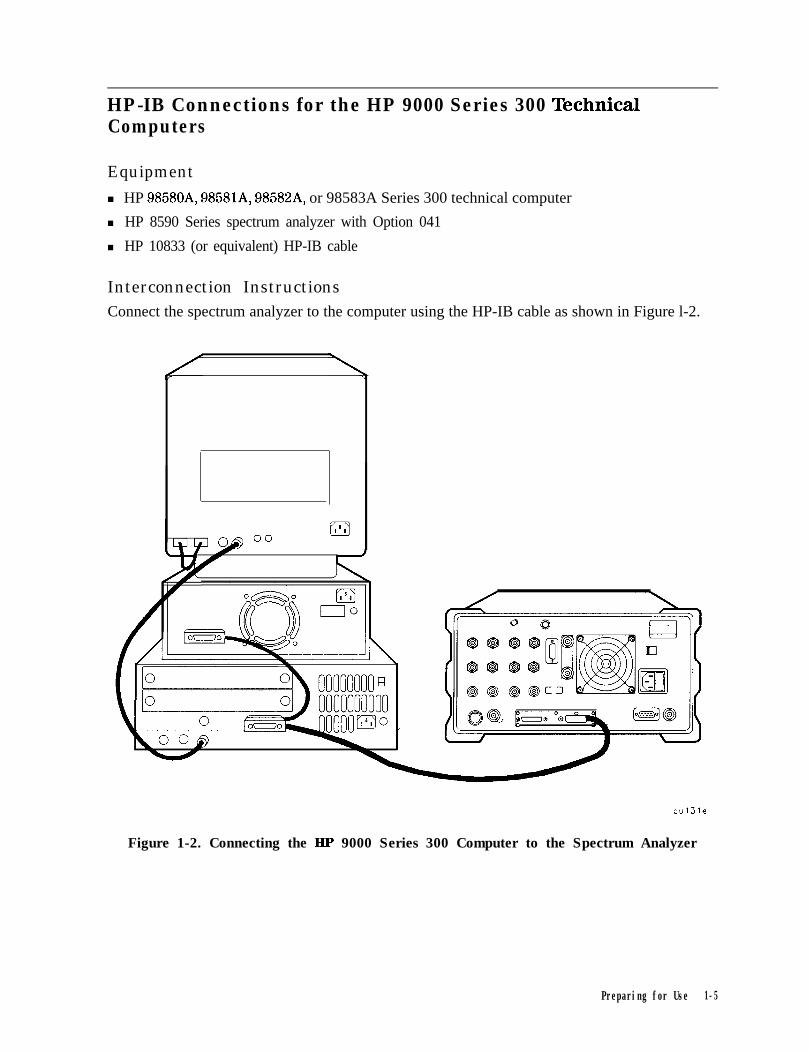
HP-IB Connections for the HP 9000 Series 300 TechnicalComputers
Equipment
n HP 98580A, 98581A, 98582A, or 98583A Series 300 technical computer
n HP 8590 Series spectrum analyzer with Option 041
n HP 10833 (or equivalent) HP-IB cable
Interconnection InstructionsConnect the spectrum analyzer to the computer using the HP-IB cable as shown in Figure l-2.
cul3le
Figure 1-2. Connecting the HP 9000 Series 300 Computer to the Spectrum Analyzer
Preparing for Use 1-5

Test ProgramTo test the connection between the computer and the spectrum analyzer, turn on yourspectrum analyzer and follow the instructions below.
1. Your HP 9000 Series 300 computer may have either a soft-loaded or built-in languagesystem. If your language system is built-in, remove any disks from the drives and turn onthe computer.
2. If your language is soft-loaded, install the BASIC language disk into the proper drive. Turnthe computer power on. After a few seconds, the BASIC READY message appears; thecomputer is now ready for use.
For further information on loading BASIC on your system, consult your BASIC manual.
Check the HP-IB address of the spectrum analyzer: press @K@, More 1 of 3 ,ANALYZER ADDRESS . The usual address for the spectrum analyzer is 18. If necessary, reset
the address of the spectrum analyzer: press (ml, More 1 of 3 , ANALYZER ADDRESS ,1Hz) (or enter the appropriate address).
4. Enter the following program, then press IRUN) on the computer. If you need help enteringand running the program, refer to your computer and software documentation.
The program shows that the computer is able to send instructions to, and read informationfrom, the spectrum analyzer.
10 PRINTER IS 120 Analyzer=71830 CLEAR Analyzer40 OUTPUT Analyzer ; ; SNGLS ; ”50 OUTPUT Analyzer ; “CF 300MZ ; TS ; ”60 OUTPUT Analyzer ; “CF? ; I’70 ENTER Analyzer;A80 PRINT “CENTER FREQUENCY = ;A; “Hz” ;90 END
The program tells the spectrum analyzer to perform an instrument preset and entersingle-sweep mode. Next, the program sets the center frequency to 300 MHz and takes asweep.
CENTERFREQUENCY= 3.OE+8Hz.
If the computer does not display the center frequency, refer to “If There is a Problem” at theend of this chapter.
1-6 Preparing for Use

HP-IB Connections for the HP Vectra Personal Computer
Equipment
w HP Vectra personal computer, with option HP 82300B, the HP BASIC Language Processor
n HP 8590 Series spectrum analyzer with Option 041
n HP 10833 (or equivalent) HP-IB cable
Interconnection InstructionsConnect the spectrum analyzer to the computer using the HP-IB cable as shown in Figure l-3.
/ \
cul30e
Figure 1-3. Connecting the HP Vectra Personal Computer to the Spectrum Analyzer
Preparing for Use l-7

Test ProgramTo test the connection between the computer and the spectrum analyzer, turn on yourspectrum analyzer and follow the instructions below.
1. Refer to the HP 82300 Language Processor documentation to install the language processorboard in your computer and load the BASIC programming language into your computer.
2. Check the HP-IB address of the spectrum analyzer: press Cm], More I of 3 ,ANALYZER ADDRESS . The usual address for the spectrum analyzer is 18. If necessary, reset
the address of the spectrum analyzer: press [CONFIG), Mare 1 of 3 , ANALYZER ADDRESS ,18 IHz) (or enter the appropriate address).
3. Enter the following program, then press (KjJ on the computer. If you need help enteringand running the program, refer to your computer and software documentation.
The program shows that the computer is able to send instructions to, and read informationfrom, the spectrum analyzer.
10 PRINTER IS 120 Analyzer=71830 CLEAR Analyzer40 OUTPUT Analyzer ; “IP ; SNGLS ; ”50 OUTPUT Analyzer;"CF 3OOMZ;TS;"60 OUTPUT Analyzer;"CF?;"70 ENTER Analyzer;A80 PRINT "CENTER FREQUENCY = ";A;"Hz";90 END
The program tells the spectrum analyzer to perform an instrument preset and entersingle-sweep mode. Next, the program sets the center frequency to 300 MHz and takes asweep. The program then queries the center frequency value and tells the computer to displayCENTERFREQUENCY= 3.OE+8 Hz.
If the computer does not display the center frequency, refer to “If There is a Problem” at theend of this chapter.
l-8 Preparing for Use

RS-232 Connections for the HP Vectra or IBM PC/AT PersonalComputer
Equipment
n HP Vectra or IBM PC/AT personal computer
n HP 8590 Series spectrum analyzer with Option 043
w
n HP 24542U g-pin to g-pin RS-232 cable for computers with a g-pin female RS-232 port
Note Refer to Appendix C for information on wiring cables.
Interconnection Instructions
1. Connect the spectrum analyzer to the computer using the RS-232 cable as shown inFigure l-4.
\
cu129e
Figure 1-4. Connecting the Personal Computer to the Spectrum Analyzer
2. Turn on the spectrum analyzer and the computer.
Preparing for Use 1.9

Test ProgramThe program shown below is written to work with computers using BASICA (version 2.0or later) or GW BASIC. To test the interconnection, first load the BASIC language for yourcomputer and specify a communications buffer of 4096 bytes. Use the following command:
BASICA/C:4096
Set the spectrum analyzer baud rate to 9600, to match the baud rate set up for the computerport in the test program. In line 20, the “9600” indicates 9600 baud for the computer port.Press the following keys to set the baud rate: c-1, More 1 of 3 , BAUD RATE , 9600, (Hz).
Enter the following test program. The program shows that the computer is able to sendinstructions to, and read information from, the spectrum analyzer.
10 'File = TESTPGM20 OPEN "COMl:9600,N,8,1" AS #l30 PRINT #l,"IP;"40 PRINT #l,"SNGLS;"50 PRINT #l,"CF 300MZ;TS;"60 PRINT #l,"CF?;"70 INPUT #l,CENTER80 PRINT,"CENTER FREQ = ";CENTER;"Hz"90 END
When you have entered the program, type:
SAVE "TESTPGM"
When you are ready to run the program, turn on the spectrum analyzer and run your program.
The program tells the spectrum analyzer to perform an instrument preset and enter singlesweep mode. Next, the program sets the center frequency to 300 MHz and takes a sweep.The program then queries the center frequency value and tells the computer to displayCENTERFREQUENCY= 3.OE+8Hz.
If the computer does not display the center frequency, refer to “If There is a Problem” at theend of this chapter.
l-10 Preparing for Use

Printing or PlottingYou may wish to obtain a permanent record of data displayed on the spectrum analyzer screen.This can be done using the lcopvl key of the spectrum analyzer, and a printer or plotter.
Note The HP 7470A plotter does not support 2 plots per page. If you use anHP 7470A plotter with an HP 8590 Series spectrum analyzer, you can select oneplot per page or four plots per page, but not 2 plots per page.
Printing Using an HP-IB Interface
Equipmentw HP 8590 Series spectrum analyzer equipped with Option 041
n HP 10833 (or equivalent) HP-IB cable
w Printer with HP-IB Interface, choose one of the following:
•I HP 2225 ThinkJet
q HP 3630A PaintJet
q HP 500 Series* DeskJet
q HP 310* Portable DeskJet
q HP LaserJet
q MX-80 Epson
q LQ-570 Epson
* Some models support color printing
Interconnection and Printing Instructions
1. Turn off the printer and the spectrum analyzer.
2. Connect the printer to the spectrum analyzer using the HP-IB cable. The HP ThinkJetprinter’s mode switches must be set correctly for use with the spectrum analyzer. Refer to‘Iable l-l for the correct settings.
able l-l. Setting of HP ThinkJet Printer Mode Switches
Setting
down
down
u pdown
down
UPdown
down
Comments
Printer performs a carriage return only.
Printer performs a line feed only.
Sets the printer to skip paper perforations
Sets the printer for a paper length of 11 inches.
Sets the printer to HP MODE.
Sets the printer to USASCII.
Preparing for Use l-1 1

Note Because HP-IB cables can be connected together, more than one instrument cancommunicate on the HP-IB. This means that both a printer and a plotter canbe connected to the spectrum analyzer (using two HP-IB cables). Each devicemust have its own HP-IB address.
Note Because the spectrum analyzer cannot print with two controllers (the computerand the spectrum analyzer) connected, the computer must be disconnectedfrom the HP-IB. In most cases, it is sufficient to simply turn the computer OFF.
3.
4.
5.
6.
Turn on the spectrum analyzer and printer.
On the spectrum analyzer, press @Gi?Q Print Conf fg , <Pm Port Cmfig ,PRlrl PORT HP13 PAR (so that HPIB is underlined).
The printer usually resides at the first device address. To enter address 1 for the printer,press PRIlVTER ADDRESS , 1,1Hz).
Select the configuration for your printer by pressing the appropriate key. Note that thesoftkey is activated when the key title is underlined.
Set Colr Printer
Set 3&W P r i n t e r
Press this key to print in color if the spectrum analyzer is connectedto a Hewlett-Packard color printer, then select the appropriateprinter.
Selecting any Hewlett-Packard printer results in three printouts perpage prior to formfeeding the page.
One printout per page can be achieved by manually formfeedingeach printout.
Press this key to print in black and white, then press one of thefollowing keys to select the appropriate printer mode.
. Press HP B&W PRINTER if the spectrum analyzer is connected to aHewlett-Packard printer.
Selecting any Hewlett-Packard printer results in three printoutsper page prior to formfeeding the page.
One printout per page can be achieved by manually formfeedingeach printout.
. Press BP B&W DJ540 if the spectrum analyzer is connected to aHewlett-Packard DeskJet 540 printer.
l-12 Preparing for Use

. Press RF MX80 SML LAG if the spectrum analyzer is connected toa MX-80 Epson or other compatible g-pin print-head printer.
Pressing this key to underline SML will print two printouts to a labels if desired. See step 7
Pressing this key to underline LRG will print only one printout to asoftkey
. Press RF LfJ57G SML LRG if the spectrum analyzer is connected toa LQ-570 Epson or other compatible 24-pin print-head printer.
Pressing this key to underline SML will print two printouts to apage and will print softkey labels if desired. See step 7
Pressing this key to underline LRG will print only one printout to apage and will not print the softkey labels.
softkey labels to be printed with the spectrum analyzer display printout,press PRT MEW ON OFF so that ON is underlined. Note that this function does not workwhen EF MX80 SML LRG or El? Lq570 SML LRG are pressed to underline LRG.
8. Press Previous Menu, CDPY DEV PRMT PLT (PRNT should be underlined), then IcoPv].
Preparing for Use l-13

Plotting Using an HP-IB Interface
Note The HP 7470A plotter does not support 2 plots per page. If you use anHP 7470A plotter with an HP 8590 Series spectrum analyzer, you can select oneplot per page or four plots per page, but not 2 plots per page.
Equipmentw HP 8590 Series spectrum analyzer with Option 041.
w HP 10833 (or equivalent) HP-IB cable.
n Any of the following plotters:
q HP 7440A ColorPro plotter with HP-IB
q HP 7445A plotter with HP-IB
q HP 7550A/B plotter with HP-IB
Interconnection and Plotting Instructions
1. Turn off the plotter and the spectrum analyzer.
2. Connect the plotter to the spectrum analyzer using the HP-IB cable.
Note Because HP-IB cables can be connected together, more than one instrument cancommunicate on the HP-IB. This means that both a printer and a plotter canbe connected to the spectrum analyzer (using two HP-IB cables). Each devicemust have its own HP-IB address.
Note Because the spectrum analyzer cannot plot with two controllers (the computerand the spectrum analyzer) connected, the computer must be disconnectedfrom the HP-IB.
3. Turn on the spectrum analyzer and the plotter.
4. On the spectrum analyzer, press @%FiZj, Plot Canf ig , Plt Port GonSig ,PLT PDRT HPIB PAR (so that HPIB is underlined).
5. The plotter usually resides at the fifth device address. To set the plotter address, pressPLUTTRR ADDRESS , 5, (Hz), to enter the address 5 for the plotter.
1-14 Preparing for Use
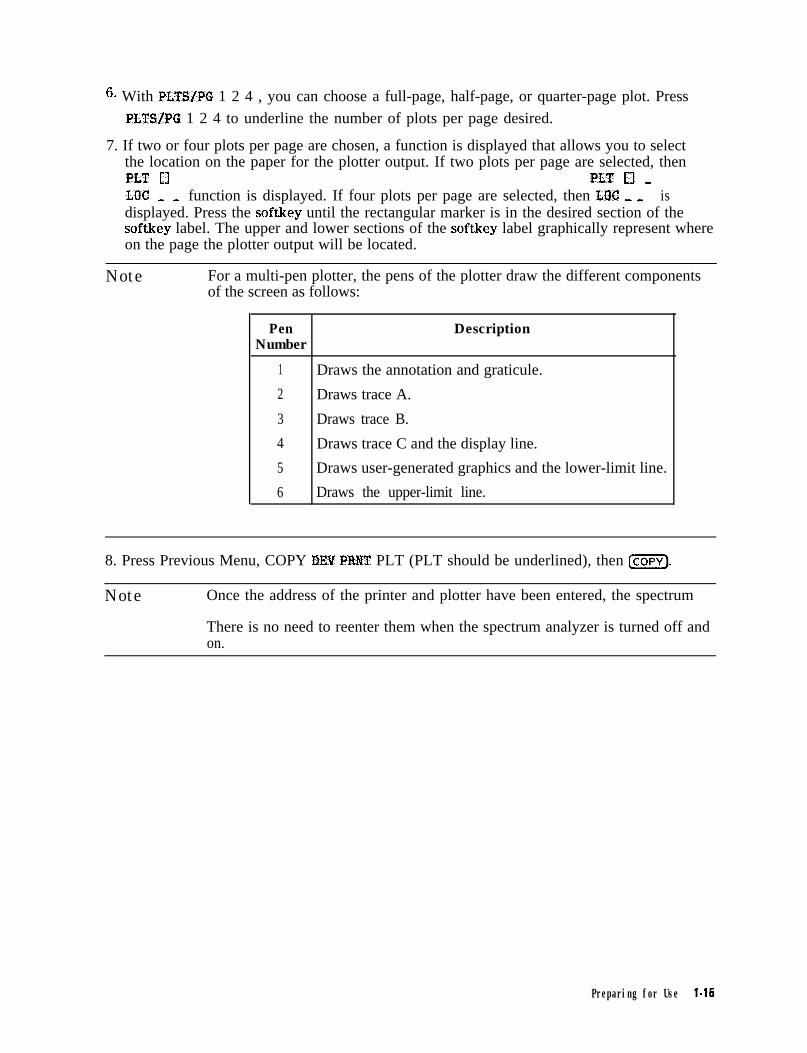
6. With PLTS/PG 1 2 4 , you can choose a full-page, half-page, or quarter-page plot. Press
PLTS/PC 1 2 4 to underline the number of plots per page desired.
7. If two or four plots per page are chosen, a function is displayed that allows you to selectthe location on the paper for the plotter output. If two plots per page are selected, thenPLT Cl PLT [I _Lac _ _ function is displayed. If four plots per page are selected, then LOC _ _ isdisplayed. Press the softkey until the rectangular marker is in the desired section of thesoftkey label. The upper and lower sections of the softkey label graphically represent whereon the page the plotter output will be located.
Note For a multi-pen plotter, the pens of the plotter draw the different componentsof the screen as follows:
Pen DescriptionNumber
1 Draws the annotation and graticule.
2 Draws trace A.
3 Draws trace B.
4 Draws trace C and the display line.
5 Draws user-generated graphics and the lower-limit line.
6 Draws the upper-limit line.
8. Press Previous Menu, COPY PINT PLT (PLT should be underlined), then Icopvl.
Note Once the address of the printer and plotter have been entered, the spectrum
There is no need to reenter them when the spectrum analyzer is turned off andon.
Preparing for Use l-15

Printing Using an RS-232 Interface
Equipmentw HP 8590 Series spectrum analyzer with Option 043.
w One of the following cables:
q HP 245426 g-pin to 25-pin RS-232 cable
q HP 24542U g-pin (f) to g-pin (f) RS-232 cable
•I HP C2932A g-pin (f) to g-pin (m) RS-232 cable (for use with LaserJet 4P and 4Plus)
n Printer with RS-232 Interface, choose one of the following:
•I HP 500 Series* DeskJet
q HP 2225 ThinkJet
q HP 3630A PaintJet
q MX-80 Epson
q LQ-570 Epson
q HP LaserJet
* Some models support color printing
Interconnection and Printing Instructions
1. Turn off the spectrum analyzer and the printer.
Note The RS-232 interface allows only one device (either the printer or the plotter)to be connected to the spectrum analyzer. Refer to the Appendix C for moreinformation on RS-232 protocol and cable wiring.
2. Connect the printer using an RS-232 cable.
3. Turn on the spectrum analyzer and printer.
4. Press (j-1, Print Cunfig , Pm Pdrt Gunfig , PRI? PORT SER PAR (so that SER isunderlined).
5. To set the baud rate to 9600 baud, press BAUD RATE, 9600, (Hz). lb set the baud rate to1200 baud, press: BAUD RATE, 1200, @.
Note Some of the programs in this manual utilize 1200 baud. If your system uses theRS-232 handshake lines, you can use 9600 baud for all of the programs.
6. Press (ZF@, Print Config.
1-16 Preparing for Use

7. Select the configuration for your printer by pressing the appropriate key. Note that thesoftkey is activated when the key title is underlined.
Set Colr Printer Press this key to print in color if the spectrum analyzer is connectedto a Hewlett-Packard color printer, then select the appropriateprinter.
Selecting any Hewlett-Packard printer results in three printouts perpage prior to formfeeding the page.
One printout per page can be achieved by manually formfeedingeach printout.
Set 3tW Printer Press this key to print in black and white, then press one of thefollowing keys to select the appropriate printer mode.
. Press HP B%W PRINTER if the spectrum analyzer is connected to aHewlett-Packard printer.
Selecting any Hewlett-Packard printer results in three printoutsper page prior to formfeeding the page.
One printout per page can be achieved by manually formfeedingeach printout.
. Press RP R%W DJ540 if the spectrum analyzer is connected to aHewlett-Packard DeskJet 540 printer.
. Press EP MX80 SML LRG if the spectrum analyzer is connected toa MX-80 Epson or other compatible g-pin print-head printer.
Pressing this key to underline SML will print two printouts to apage and will print softkey labels if desired. See step 8.
Pressing this key to underline LRG will print only one printout to apage and will not print the softkey labels.
. Press EP Lq570 SML LRG if the spectrum analyzer is connected toa LQ-570 Epson or other compatible 24-pin print-head printer.
Pressing this key to underline SML will print two printouts to apage and will print softkey labels if desired. See step 8.
Pressing this key to underline LRG will print only one printout to apage and will not print the softkey labels.
8. If you want the softkey labels to be printed with the spectrum analyzer display printout,press PRT MEMU GM OFF so that ON is underlined. Note that this function does not workwhen KP MX80 LRG or EP Lq570 LRG is pressed.
g. Press Previous Menu, COPY DEV PRMT PLT (PRNT should be underlined), then m.
Preparing for Use l-1 7

Plotting Using an RS-232 Interface
Equipmentn HP 8590 Series spectrum analyzer with Option 043.
n HP 245426 9-25 pin RS-232 cable
n HP C2932A 9-9 pin RS-232 cable (for use with LaserJet 4P and 4Plus)
n Any of the following Plotters:
q HP 7440A ColorPro plotter with an RS-232 interface.
q HP 7445A plotter with an RS-232 interface.
q HP 7550A/E? plotter with an RS-232 interface.
Interconnection and Plotting Instructions
1. Turn off the spectrum analyzer.
Note The RS-232 interface allows only one device (either the printer or the plotter)to be connected to the spectrum analyzer. Refer to the Programmer’s Guide formore information on RS-232 protocol and cable wiring.
2. Connect the plotter using an RS-232 cable.
3. Turn on the spectrum analyzer and the plotter.
4. Press (j-J,underlined).
Plot &dig, Pit Port Config, PLT PORT SER PAR (so that SER is
5. lb set the baud rate to 1200 baud, press: BAUD RATE, 1200, [Hz).
& Press CCONFIG], Plot &&kg. You can choose a full-page, half-page, or quarter-page plotwith the PLTSIPC 1 2 4 softkey. Press PLTS/PG 1 2 4 to underline the number of plotsper page desired.
7. If two or four plots per page are chosen, a function is displayed that allows you to selectthe location on the paper of the plotter output. If two plots per page are selected, thenPLT Cl PLT U _LOC - - function is displayed. If four plots per page are selected, then LOC _ _ isdisplayed. Press the softkey until the rectangular marker is in the desired section of thesoftkey label. The upper and lower sections of the softkey label graphically represent whereon the page the plotter output will be located.
l-18 Preparing for Use

Note For a multi-pen plotter, the pens of the plotter draw the different componentsof the screen as follows:
Description
Draws the annotation and graticule.
Draws trace A.
Draws trace B.
Draws trace C and the display line.
Draws user-generated graphics and the lower-limit line.
Draws the upper-limit line.
8. Press Previous Menu, COPY DEV PRMT PLT (so that PLT is underlined), then Icopvl.
Printing after Plotting or Plotting after Printing
Pressing lcopvl without changing COPY PRNT PLT produces the function last entered (aprint or a plot).
. To print after doing a plot, press @5iKJ, COPY DEV PRRT PLT (so that PRNT is underlined),then [copvl.
. To plot after printing, press @GiKJ COPY DEV PRNT PLT (so that PLT is underlined), and[copvl.
Preparing for Use 1-19

Printing Using a Parallel Interface
Equipment
w HP 8590 Series spectrum analyzer equipped with Option 041 or 043.
n HP C295OA parallel printer cable.
n Printer with parallel interface, choose one of the following:
q HP 310* Portable DeskJet
q HP 3630A PaintJet
II HP 500 Series* DeskJet
•1 HP LaserJet
q LQ-570 Epson
q MX-80 Epson
* Some models support color printing
Interconnection and Printing Instructions
1.
2.
3.
4.
5.
Turn off the printer and the spectrum analyzer.
Connect the printer to the spectrum analyzer using the parallel printer cable.
Turn on the spectrum analyzer and printer.
On the spectrum analyzer, press @GFiFJ, Print Cmfig, Pm Port &Wig ,PRN PORT HPfB PAR (for Option 041, so that PAR is underlined) or PRN PORT SER PAR (forOption 043, so that PAR is underlined).
Select the configuration for your printer by pressing the appropriate key. Note that thesoftkey is activated when the key title is underlined.
Set Colr Prirrter Press this key to print in color if the spectrum analyzer is connectedto a Hewlett-Packard color printer, then select the appropriateprinter.
Selecting any Hewlett-Packard printer results in three printouts perpage prior to formfeeding the page.
One printout per page can be achieved by manually formfeedingeach printout.
l-20 Preparing for Use

Set B%W Printer Press this key to print in black and white, then press one of thefollowing keys to select the appropriate printer mode.
. Press HP B%W PRINTER if the spectrum analyzer is connected to aHewlett-Packard printer.
Selecting any Hewlett-Packard printer results in three printoutsper page prior to formfeeding the page.
One printout per page can be achieved by manually formfeedingeach printout.
n Press I@ B%W DJS40 if the spectrum analyzer is connected to aHewlett-Packard DeskJet 540 printer.
. Press EP MX8D SML LRG if the spectrum analyzer is connected toa MX-80 Epson or other compatible g-pin print-head printer.
Pressing this key to underline SML will print two printouts to apage and will print softkey labels if desired. See step 7
Pressing this key to underline LRG will print only one printout to apage and will not print the softkey labels.
n Press RF LQ570 SML LRG if the spectrum analyzer is connected toa LQ-570 Epson or other compatible 24-pin print-head printer.
Pressing this key to underline SML will print two printouts to apage and will print softkey labels if desired. See step 7
Pressing this key to underline LRG will print only one printout to apage and will not print the softkey labels.
6. If you want the softkey labels to be printed with the spectrum analyzer display printout,press PRT MEMU ON OFF so that ON is underlined. Note that this function does not workwhen EP MX8G SML LRG or EF LQ570 SML LRG are pressed to underline LRG.
7. Press Previous Menu, CDPY DEV PRNT PLT (PRNT should be underlined), then IcoPv].
Preparing for Use 1-21

Plotting to an HP LaserJet Printer
Equipment
w HP 8590 Series spectrum analyzer with RS-232 or Parallel Interface
w HP 245426 g-pin to 25-pin RS-232 cable
n HP C2932A g-pin (f) to g-pin (m) RS-232 cable (for use with LaserJet 4P and 4Plus)
n HP C2950A parallel printer cable
w Any of the following HP LaserJets:
q HP LaserJet III
q HP LaserJet IIIP
•I HP LaserJet 4
q HP LaserJet 4L
q HP LaserJet 4P
q HP LaserJet 4Plus
Interconnection and Plotting Instructions
1. Turn off the spectrum analyzer.
Note The RS-232 or parallel interface allow only one device (either the printer or theplotter) to be connected to the spectrum analyzer. Refer to the Programmer’sGuide for more information on protocol and cable wiring.
2. Connect the HP LaserJet to the analyzer.
3. Turn on the analyzer and the HP LaserJet printer.
4. Press [ZKZ].
5. Press CDPY DEV PlXNT PLT so that PLT is underlined.
6. Press (-1, Plot Config . You can choose a full-page, half-page, or quarter-page plotwith the PLTSjPG 1 2 4 softkey. Press PLTS/PG 1 2 4 to underline the number of plotsper page desired.
7. If two or four plots per page are chosen, a function is displayed that allows you to selectthe location on the paper of the plotter output. If two plots per page are selected, thenPLT Cl PLT c3 _LOC - - function is displayed. If four plots per page are selected, then LOC I I isdisplayed. Press the softkey until the rectangular marker is in the desired section of thesoftkey label. The upper and lower sections of the softkey label graphically represent whereon the page the plotter output will be located.
8. Press PLT->L.JT ON OFF so that ON is underlined.
9. Then press Icopv).
l-22 Preparing for Use

Printing after Plotting or Plotting after Printing
Pressing [copvl without changing COPY DEV PRNT PLT produces the function last entered (aprint or a plot).
w To print after doing a plot, press (CONFIG), COPY DEV PRNT PLT (so that PRNT is underlined),then IcoPv].
n To plot after printing, press (W), COPY DEV PRNT PLT (so that PLT is underlined), andIcoPv].
Preparing for Use 1-23

If There Is a ProblemThis section offers suggestions to help get your computer and spectrum analyzer working as asystem. The test programs provided in this chapter let you know if the connection between thecomputer and the spectrum analyzer interconnection is working properly.
If the test program does not run, try the following suggestions:
1. You may need to modify the program syntax to work with your computer. Refer to yourBASIC manual for correct syntax.
2. The program must be executed correctly. Refer to your computer manual for informationabout program execution.
3. Check your program for errors.
If the test program runs on the computer, but the spectrum analyzer does not respond, try thefollowing suggestions:
1.
2.
3.
4.
5.
6.
Make sure the spectrum analyzer is turned on. If the spectrum analyzer has power, thegreen indicator light above the line switch is on.
Make sure the interface cable is connected securely. Check the interface cable for defects.Make sure the correct cable is used.
If you are using an HP-IB interface, the spectrum analyzer must be set to the correct addresssetting. Press (??%KJ More 1 of 3 , ANALYZER ADDRESS .
If you are using the RS-232 interface, check the spectrum analyzer baud rate. Refer toAppendix C for information about setting the baud rate on the spectrum analyzer.
If a program in user memory is suspected of causing problems, use (ZZiZ], More 1 of 3 ,Dispose User Mem , ERASE DLP MEM , ERASE DLP MEM . (ERASE DLP MEM requires adouble key press.) ERASE DLP MEM erases all user programs, variables, personalities (whichare usually in the form of downloadable programs), and user-defined traces that are inspectrum analyzer memory.
If you wish to reset the spectrum analyzer configuration to the state it was in when it wasoriginally shipped from the factory, use DEFAULT COfFfG . To access I&FAULT CONFfG ,press C-1, More 1 of 3, DEFAULT GOEFIG , DEFAULT CONFIG . (DEFAULT CONFIGrequires a double key press.)
If you suspect your computer is causing the problems, check it by running a program that youknow works. If your system still has problems, contact the sales and service office nearest you.Your salesperson will either be able to help solve the problem or refer you to someone who can.
l-24 Preparing for Use

2Writing a Program
What You’ll Learn in This ChapterThis chapter introduces spectrum analyzer programming. The first section of this chapter,“Writing Your First Program, n helps you write your first spectrum analyzer program andintroduces programming fundamentals. The second section, “Getting Information from theSpectrum Analyzer, n shows how to get data out of the spectrum analyzer. A summary at theend of this chapter reviews the programming guidelines introduced.
If the computer is not connected to the spectrum analyzer, follow the instructions in Chapter 1,“Preparing for Use. ”
A general knowledge of the BASIC programming language and the spectrum analyzer isrecommended before reading this chapter. Refer to your software documentation manuals formore information about BASIC. For reference, Chapter 5 of this manual provides spectrumanalyzer commands in alphabetical order.
Note All programming examples in this chapter for the HP-IB interface are writtenin HP BASIC 4.0, using an HP 9000 Series 200 computer. For the RS-232interface, examples are written in GW BASIC, using an HP Vectra personalcomputer or compatible controller.
Writing a Program 2-l

Writing Your First ProgramWhen the spectrum analyzer has been connected to a computer via HP-IB or RS-232 interface,the computer can be used to send instructions to the spectrum analyzer. These instructions tellthe spectrum analyzer such things as frequency span, resolution bandwidth, and sweep mode.If a properly selected sequence of instructions is sent to the spectrum analyzer, a measurementis made. Sequences of coded instructions are called programs.
Composing the. ProgramMost spectrum analyzer programs contain several common statements, or “commands,” thataddress the spectrum analyzer, preset it, and select its sweep mode. As an example, we willwrite a short program that executes only these common commands.
The following programs are for the HP-IB and the RS-232 interfaces. Note the quotation marksthat contain spectrum analyzer commands in each line. Also note the semicolons at the end ofeach line, inserted at the end of each set of spectrum analyzer commands within the quotationmarks. Using semicolons makes programs easier to read, prevents command misinterpretation,and is recommended by IEEE Standard 728.
Note In commands where quotation marks occur, the computer recognizes data ascharacter data and not BASIC programming language commands.
Program Example for the HP-IB Interface05 !File: "IBPROGl"
20 CLEAR Analyzer30 OUTPUT Analyzer;"IP;"40 OUTPUT Analyzer;"SNGLS;TS;"50 LOCAL 760 END
Line 10 of our program assigns a variable called “Analyzer” to our spectrum analyzer at address718. This instruction is followed by the HP BASIC CLEAR command, which resets the spectrumanalyzer on the HP-IB. With these two program lines, we have set up a clear communicationpath between the computer and the spectrum analyzer.
Line 30 introduces the instrument preset (IP) command, which corresponds to the keyon the spectrum analyzer. The IP command sets all of the analog parameters of the spectrum
Note All softkey functions on the spectrum analyzer have correspondingprogramming commands. As you continue programming, you will learn thecommand names that correspond to the front-panel keys and softkeys.
Line 40 activates the single-sweep mode. Most remotely controlled measurements requirecontrol of the sweep. Once SNGLS has activated the single-sweep mode, take sweep (TS)starts and completes one full sweep. TS maintains absolute control over the sweep, which isnecessary for accurate computer data transfer and reduced program execution time.
Before we end the program, we return the spectrum analyzer to front-panel control with line50, LOCAL 7. The LOCAL command corresponds to the (LOCAL) key on the front panelof the spectrum analyzer. (LOCAL 7 commands everything on the bus to go to local mode.)
2-2 Writing a Program

Finally, in line 60, we end the program with the END command. (If you forget to include theEND command, the computer will give an error message.)
Enter the program lines, press (RUN) on the computer, and watch the spectrum analyzer displayas it completes each instruction.
Program Example for the RS-232 Interface10 'File = 232PROGl20 OPEN "COMl: 9600,N,8,1" AS #130 PRINT #1 "IP*"40 PRINT #l:"SNkLS;TS;"50 END
Line 20 of the program opens the RS-232 COMl: line, identifies it as #l, and sets the RS-232parameters as follows:
9600 baudno parity8 bits/character1 stop bit
Line 30 of the program introduces the instrument preset (IP) command, which corresponds tothe [PRESET) key on the spectrum analyzer. The IP command sets all of the analog parametersof the spectrum analyzer to known values and provides a good starting point for everymeasurement.
Note All softkey functions on the spectrum analyzer have correspondingprogramming commands. As you continue programming, you will learn thecommand names that correspond to the front-panel keys and softkeys.
Line 40 activates the single-sweep mode. Most remotely controlled measurements requirecontrol of the sweep. Once SNGLS has activated the single-sweep mode, take sweep (TS) startsand completes one full sweep. The TS command maintains absolute control over the sweep,which is necessary for accurate computer data transfer and reduced program execution time.Finally, in line 50, end the program with the END command.
Make sure that the spectrum analyzer baud rate is 9600 via the BAUII RATE softkey. Enter theprogram lines, then press (RUN) on the computer. Watch the spectrum analyzer display as itcompletes each instruction.
Note When using an HP 9000 Series 200 or 300 computer, END commands arenecessary. Refer to your BASIC manual to determine END statementrequirements for your specific computer.
Writing a Program 2-3

Modifying the ProgramRemote operation of the spectrum analyzer is similar to manual operation. Remotemeasurements are executed by commands that correspond to front-panel keys and softkeys.
The first chapter in the spectrum analyzer operating manual shows you how to make a simplemeasurement using the calibration signal. We can add instructions to our program so that itwill make the same measurement. (Because the manual process closely resembles that ofthe program, you may want to review the chapter entitled “Making a Measurement” in theHP 8590 E-Series and L.-S&es Spectrum Analyzers User’s Guide.)
By inserting a few lines into the initial program, we can set functions such as the centerfrequency and span, and we can activate a marker to find a signal’s frequency and amplitude.
Program Example for the HP-IB InterfaceFirst, we set the center frequency to 300 MHz. The CF command corresponds to the centerfrequency function, CEnTER FREQ . (All spectrum analyzer commands, such as CF, aredescribed in Chapter 5.)
Insert the following program line between lines 40 and 50:
41 OUTPUT Analyzer;"CF 300MZ;"
Next, we set the span to 200 MHz with the SP command. Add the following program line:
42 OUTPUT. Analyzer;"SP 200MZ;"
Because we are controlling the sweep, we must update the spectrum analyzer display screenwith the following program line:
43 OUTPUT Ana1yzer;"T.S;"
When the program is executed, the spectrum analyzer takes one full sweep before executingline 41. Line 41 changes the center frequency to 300 MHz, and line 42 changes the span to200 MHz.
Enter the following program line to place a marker at the highest peak on the trace with aMKPK HI command:
44 OUTPUT Analyzer:"MKPK HI;"
The completed program is shown below:
05 !File: "IBPROG2"10 Analyzer=71820 CLEAR Analyzer30 OUTPUT Analyzer;"IP;"40 OUTPUT Analyzer;"SNGLS;TS;"41 OUTPUT Analyzer;"CF 300MZ;”42 OUTPUT Analyzer;"SP 200MZ;"43 OUTPUT Analyzer;"TS;"44 OUTPUT Analyzer;"MKPK HI;"50 LOCAL 760 END
Run the program to make the measurement. Watch the spectrum analyzer display as itcompletes each instruction. Notice that the program executes the instructions faster than ispossible from the front panel.
2-4 Writing a Program

When a certain measurement is repeated often, a computer program can save time. Inaddition, the computer is less likely to make an error than an operator manually entering thesame instructions from the front panel.
Program Example for the RS-232 InterfaceFirst, we set the center frequency to 300 MHz. The CF command corresponds to the centerfrequency function, Cm FREQ . (All spectrum analyzer commands, such as CF, aredescribed in Chapter 5.)
Insert the following program lines between lines 40 and 50 of the previous program.
41 PRINT #l,"CF 300MZ;"
Next, set the span to 200 MHz with the SP command. Add the following program line:
42 PRINT #l,"SP 200MZ;"
Because we are controlling the sweep, we must update the spectrum analyzer display with thefollowing program line:
43 PRINT #l,"TS;"
When the program is executed, the spectrum analyzer takes one full sweep before executingline 41. Line 41 changes the center frequency to 300 MHz. Line 42 changes the span to200 MHz.
Enter the following program line to place a marker at the highest peak on the trace:
44 PRINT #l,"MKPK HI;"
The completed program is shown below:
10 'File = 232PROG220 OPEN "COMl:9600,N,8,1" AS #130 PRINT #l,"IP;"40 PRINT #l,"SNGLS;TS;"41 PRINT #l,"CF 300MZ;"42 PRINT #l,"SP 200MZ;"43 PRINT #l,"TS;"44 PRINT Xl,"MKPK HI;"50 END
Run the program to make the measurement. Watch the spectrum analyzer display as itcompletes each instruction. When a certain measurement is repeated often, a computerprogram can save time. Also, the computer is much less likely to make an error than anoperator manually entering the same instructions from the front panel.
Writing a Program 2-5

Enhancing the Program with VariablesIn the last program, specific center frequency and span values were set. By modifying theprogram, we can cause different values to be set each time the program is run.
Program Example for the HP-IB InterfaceIn the following program, the exclamation point (!) allows the words that follow to be ignoredby the computer. Thus, they serve as comments in the program.
10 !FILE: “VARIO”20 REAL C,freq,S-pan !define the variables30 Analyzer=71840 CLEAR Analyzer50 OUTPUT Analyzer;“IP;SNGLS;TS;”60 !ask for the desired center frequency:70 INPUT “CENTER FREQUENCY (MHz) ?I’, C-f req80 !ask for the desired span:90 INPUT “SPAN(MHz)?” ,S,pan100 !send the center frequency and span to the110 !analyzer and take a sweep to update the120 !analyzer screen:130 OUTPUT Analyzer; “CF “;C-freq; “MZ; ‘I140 OUTPUT Analyzer ; “SP I’ ; S-pan; “MZ ; ‘I150 OUTPUT Analyzer ; “TS ; ‘I160 !find the signal peak with peak search:170 OUTPUT Analyzer ; “MKPK HI ; I’180 LOCAL 7190 END
Three modifications are made to the previous program so it includes center frequency and spanvariables. First, using the HP BASIC REAL command, we define two variables, C-freq andS-pan. The frequency and span parameters are stored in these variables. (Refer to line 20.)
Second, using the HP BASIC INPUT command, we prompt the user to enter the desired centerfrequency and span. The center frequency and span values are entered on the computer;because the measurement units will be entered by the program, the user does not enter them.(See lines 70 to 140.)
Third, we modify the output parameter statements so that the values stored in C-freq andS-pan are sent to the spectrum analyzer. (See lines 130 to 140.)
A sweep is taken after the parameters are sent to the spectrum analyzer, to ensure that thespectrum analyzer screen is updated before the marker is placed on the highest signal peak.
2-6 Writing a Program

Program Example for the RS-232 InterfaceIn the following program, the apostrophe (‘) allows the words that follow to be ignored by thecomputer. Thus, they serve as comments in the program.
10 ‘File = 232PROG320 OPEN "COMl:9600,N,8,1" AS #130 PRINT #l,"IP;"40 PRINT #l,"SNGLS;TS;"50 'Ask for the center frequency and span60 PRINT "INPUT THE CENTER FREQUENCY (MZ) ";70 INPUT CENTER80 PRINT "INPUT THE SPAN (MZ) 'I;90 INPUT SPAN100 'Send center freq and span to spectrum analyzer110 'take a sweep to update screen120 PRINT #l,"CF ";CENTER;"MZ;"130 PRINT #l,"SP ";SPAN;"MZ;"140 PRINT #l,"TS;"150 'find the signal peak with peak search160 PRINT #l,"MKPK HI;"170 END
Three modifications are made to the previous program in order to include center frequency andspan variables. First, we use two variables, CENTER and SPAN, to store the frequency andspan parameters.
Second, using the BASIC INPUT command, we ask the computer operator to enter the desiredcenter frequency and span. (See lines 70 and 90 in previous program example). Next, wemodify the output parameter statements so that the values stored in the CENTER and SPANvariables are sent to the spectrum analyzer. (See lines 120 and 130.) A sweep is taken after theparameters are sent to the spectrum analyzer, to ensure that the spectrum analyzer screen isupdated before the marker is placed on the highest signal peak.
Writing a Program 2-7
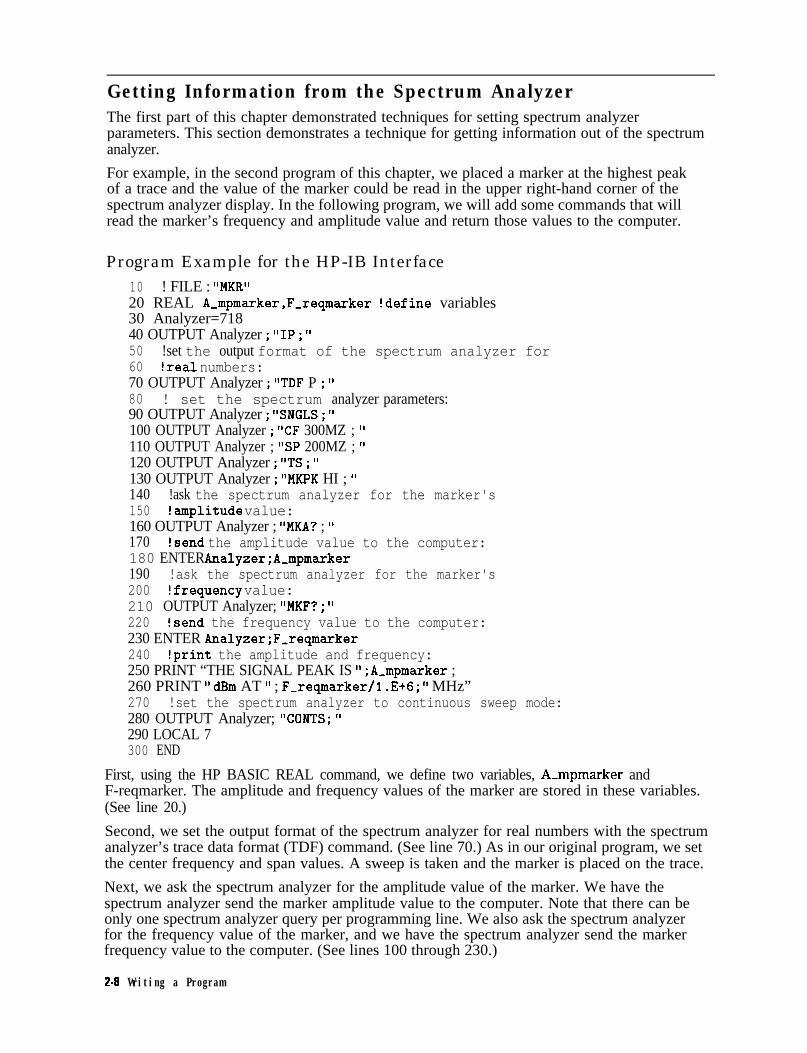
Getting Information from the Spectrum AnalyzerThe first part of this chapter demonstrated techniques for setting spectrum analyzerparameters. This section demonstrates a technique for getting information out of the spectrumanalyzer.
For example, in the second program of this chapter, we placed a marker at the highest peakof a trace and the value of the marker could be read in the upper right-hand corner of thespectrum analyzer display. In the following program, we will add some commands that willread the marker’s frequency and amplitude value and return those values to the computer.
Program Example for the HP-IB Interface10 ! FILE : “MKR”20 REAL A-mpmarker,F,reqmarker !define variables30 Analyzer=71840 OUTPUT Analyzer ; “IP ; ‘I50 !set the output format of the spectrum analyzer for60 !real numbers:70 OUTPUT Analyzer ; “TDF P ; ‘I80 ! set the spectrum analyzer parameters:90 OUTPUT Analyzer ; “SNGLS ; ‘I100 OUTPUT Analyzer ; “CF 300MZ ; ”110 OUTPUT Analyzer ; “SP 200MZ ; ‘I120 OUTPUT Analyzer ; “TS ; I’130 OUTPUT Analyzer ; “MKPK HI ; ‘I140 !ask the spectrum analyzer for the marker's150 !amplitude value:160 OUTPUT Analyzer ; “MKA? ; I’170 !send the amplitude value to the computer:180 ENTER Analyzer;A-mpmarker190 !ask the spectrum analyzer for the marker's200 !frequency value:210 OUTPUT Analyzer; “MKF? ; ‘I220 !send the frequency value to the computer:230 ENTER Analyzer;F,reqmarker240 !print the amplitude and frequency:250 PRINT “THE SIGNAL PEAK IS ” ;A,mpmarker ;260 PRINT ” dBm AT ” ; F-reqmarker/l .E+6; ” MHz”270 !set the spectrum analyzer to continuous sweep mode:280 OUTPUT Analyzer; “CONTS; ‘I290 LOCAL 7300 END
First, using the HP BASIC REAL command, we define two variables, A-mpmarker andF-reqmarker. The amplitude and frequency values of the marker are stored in these variables.(See line 20.)
Second, we set the output format of the spectrum analyzer for real numbers with the spectrumanalyzer’s trace data format (TDF) command. (See line 70.) As in our original program, we setthe center frequency and span values. A sweep is taken and the marker is placed on the trace.
Next, we ask the spectrum analyzer for the amplitude value of the marker. We have thespectrum analyzer send the marker amplitude value to the computer. Note that there can beonly one spectrum analyzer query per programming line. We also ask the spectrum analyzerfor the frequency value of the marker, and we have the spectrum analyzer send the markerfrequency value to the computer. (See lines 100 through 230.)
2-8 Writing a Program

Finally, we print the values on the computer screen:
"THE SIGNAL PEAK IS . . . dBm AT . . . MHz"
Before we end the program, we return the spectrum analyzer to continuous-sweep mode andlocal control.
Program Example for the RS-232 Interface10 'File = 232PROG420 OPEN "COMl:9600,N,8,1" AS #l30 PRINT #l,"IP;"40 'Set the output format of the spectrum analyzer for50 'real numbers60 PRINT #l,"TDF P;"70 'set the spectrum analyzer's parameters80 PRINT #l,"SNGLS;"90 PRINT #l,"CF 300MZ;"100 PRINT #l,"SP 200MZ;"110 PRINT #l,"TS;"120 PRINT #l,"MKPK HI;"130 'ask the spectrum analyzer for the marker's140 'amplitude value150 PRINT #l "MKA'."160 'get the'ampli&rde from the spectrum analyzer170 INPUT #l,AMPMARKER180 'ask the spectrum analyzer for the marker's frequency value190 PRINT #1 "MKF'."200 'get the'freq&cy value from the spectrum analyzer210 INPUT #l,FREQMARKER220 'print the amplitude and frequency230 PRINT "THE SIGNAL PEAK IS ";AMPMARKER;240 PRINT " dbm AT ";FREQMARKER/lOOOOOO!;" MZ"250 'set the spectrum analyzer to continuous sweep mode260 PRINT #l,"CONTS;"270 END
First, set the output format of the spectrum analyzer to real numbers with the spectrumanalyzer’s trace data format (TDF) command (line 60).
As in the original program, the center frequency and span values are set and a sweep is taken.Next, the marker is placed on the trace.
Two additional variables are used for AMPMARKER and FREQMARKER. The amplitude andfrequency values of the marker are stored in these variables (lines 170 and 210). The programrequests the amplitude and frequency values of the marker (lines 150 and 190). Note thatthere can be only one spectrum analyzer query per programming line.
Finally, the amplitude and frequency values are displayed on the computer screen:
"THE SIGNAL PEAK IS . . . dBM AT . . . MZ"
Writing a Program 2-9

Programming Guidelines1. Perform the measurement manually, keeping track of the sequence of functions used.
2. In the written program, execute an instrument preset (IP) and set single-sweep mode(SNGLS) before setting other spectrum analyzer functions.
3. Use variables for function values. List variables at the beginning of the program,
4. Activate spectrum analyzer functions in logical order. Place quotation marks aroundspectrum analyzer commands. Separate commands with semicolons.
5. After setting spectrum analyzer functions, execute a take sweep (TS) command beforereading data or activating markers.
6. The spectrum analyzer can return only one value per programming line. Do not have morethan one query per programming line.
7. Use the exclamation point (!) to include comment lines when using HP BASIC. Use theapostrophe or REM to create comment lines when using GW BASIC. (The use of theexclamation point and the apostrophe to create comment lines are dependent on the
your system.)
2-l 0 Writing a Program

3Programming Xbpics
What You’ll Learn in This ChapterThis chapter contains the following advanced programming techniques and topics.
n An example of moving and saving trace data from the spectrum analyzer into the computer.
n An example of how spectrum analyzer states are saved with the computer, then returned tothe spectrum analyzer.
n An example of reading trace data from a computer disk.
n An example of saving and recalling instrument states.
n An example of returning the spectrum analyzer to its former state.
n An example of remotely measuring harmonic distortion.
n A summary of using different formats for trace data transfers.
Many of the programming suggestions discussed in Chapter 2, “Writing a Program,” have beenincorporated into the programs in this chapter.
Note Ail programming examples for the HP-IB interface in this chapter are writtenin HP BASIC 4.0. For the RS-232 interface, examples are written in GW BASIC.
A general knowledge of the BASIC programming language is recommended before readingthis chapter. (Refer to your software documentation manuals.) Chapter 5 of this manual,“Programming Commands,” defines spectrum analyzer commands alphabetically.
Programming Topics 3-l

Controlling Trace Data with a ComputerUsing sample programs, this section shows you how to read trace data and store the data withyour computer.
Reading Trace DataThe following program, which has been annotated with comments, reads a trace from thespectrum analyzer and stores the trace data in a variable.
Program Example for the HP-IB Interface10 !FILE: “IBPROG5”20 !create a 401 point trace array:30 REAL Trace,a(l:401)40 Analyzer=71850 OUTPUT Analyzer;“IP; ‘I60 !set the output format of the spectrum analyzer for70 !real numbers:80 OUTPUT Analyzer ; “TDF P ; I’90 !set the spectrum analyzer parameters:100 OUTPUT Analyzer; “SNGLS; ‘I110 OUTPUT Analyzer ; “CF 300MZ ; ‘I120 OUTPUT Analyzer ; “SP 200MZ ; ‘I130 OUTPUT Analyzer ; “TS ; ‘I140 OUTPUT Analyzer; “MKPK HI ; ‘I150 !move peak to center of spectrum analyzer screen:160 OUTPUT Analyzer ; “MKCF ; I’170 OUTPUT Analyzer ; “TS ; ‘I180 !ask the spectrum analyzer for trace data:190 OUTPUT Analyzer ; “TRA? ; ‘I200 !send the trace data to the computer:210 ENTER Analyzer;Trace-a(*)220 OUTPUT Analyzer ; “CONTS; I’230 LOCAL 7240 END
Trace data can be read with the computer by making three changes to the program created inChapter 2. First, we modify the program to create a 401-point trace array, called Trace-a, inwhich the trace data will be stored. Second, the program uses the TRA command to requesttrace A data. (The MKA and MKF commands from the previous program have been deleted.)Third, the spectrum analyzer sends trace A data to the variable, Trace-a.
3-2 Programming Topics

Program Example for the RS-232 Interface10 'File = 232PROG520 OPEN "COMl:9600,N,8,1" AS #l30 'create a 401-point trace array40 DIM TRCA(401)50 PRINT #1 "IP."60 'set outiut iormat of spectrum analyzer for real numbers70 PRINT #l,"TDF P;"80 ‘set spectrum analyzer parameters90 PRINT #l,"SNGLS;"100 PRINT #l,"CF 300MZ;"110 PRINT #l,"SP 200MZ;”120 PRINT #l,"TS;"130 PRINT tl "MKPK."140 'move peik to lenter of spectrum analyzer screen150 PRINT #l "MKCF."3 ,160 PRINT #1 "TS."170 'ask spe&r& analyzer for trace data180 PRINT #l,"TRA?;"190 'retrieve trace data from spectrum analyzer200 FOR I=1 TO 401210 INPUT #l,TRCA(I)220 NEXT I230 'set continuous-sweep mode240 PRINT #l,"CONTS;"250 END
Trace data can be read with the computer by making three changes to the program createdin Chapter 2. First, we modify the program to create a 401-point trace array, called TRCAin which trace data will be stored (line 40). Second, the program uses the TRA command torequest trace A data (line 180). (The MKA and MKF commands in the original program havebeen deleted.) Third, we will have the spectrum analyzer send the trace A data into the TRCAvariable (line 210).
Programming Topics 3-3

Saving Trace DataThe trace data in the previous program can be stored on a computer disk by making threeprogram modifications.
10 !FILE: "IBPROGG"20 !create a 401 point trace array:30 REAL Trace,a(l:401)40 Analyzer=71850 OUTPUT Analyzer;"IP;"60 !set the output format of the spectrum analyzer for70 !real numbers:80 OUTPUT Analyzer;"TDF P;"90 !set the spectrum analyzer parameters:100 OUTPUT Analyzer;"SNGLS;"110 OUTPUT Analyzer;"CF 300MZ;"120 OUTPUT Analyzer;"SP 200MZ;"130 OUTPUT Analyzer;"TS;"140 OUTPUT Analyzer;"MKPK HI;"150 !move peak to center of spectrum analyzer screen:160 OUTPUT Analyzer;"MKCF;"170 OUTPUT Analyzer;"TS;"180 !ask the spectrum analyzer for trace data:190 OUTPUT Analyzer;"TRA?;"200 !send the trace data to the computer:210 ENTER Analyzer;Trace-a(*)220 !create file to store trace230 !file is 13 records long:240 CREATE BDAT "DATA-A",13250 !assign path for the file:260 ASSIGN @File TO "DATA-A"270 !send trace data to the file:280 OUTPUT OFile;Trace,a(*)290 OUTPUT Analyzer;"CONTS;"300 LOCAL 7310 !close file:320 ASSIGN @File TO *330 END
First, using the CREATE command, we create an empty file on the disk for storing the trace.The file is 13 records long. (To determine the number of records, the 401-point trace ismultiplied by 8 bytes per point, the storage required for real numbers, then divided by 256bytes per record. The result is rounded to the next largest integer.)
Next, we assign an input and an output path to the file DATA-A. Then, we send the trace datato the file. (See lines 260 through 280.) Finally, in line 320, we close the file.
Note If a program containing the CREATE command is run twice, the computer willreport an error the second time because the file already exists. To prevent thiserror, place an exclamation mark before the CREATE command to “commentout” the line after the first run. (See line 240.)
3-4 Programming Topics

Program Example for the RS-232 Interface10 'File = 232PROG620 OPEN "COMl:9600,N,8,1" AS #l30 'create a 401-point trace array40 DIM TRCA(401)50 PRINT #l,"IP;"60 'set output format of spectrum analyzer for real numbers70 PRINT #l,"TDF P;"80 'set spectrum analyzer parameters90 PRINT #l "SNGLS."100 PRINT #;,"CF 3;OMZ;"110 PRINT tl,"SP 200MZ;"120 PRINT #1 "TS."130 PRINT #l:"MKPK;"140 'move peak to center of spectrum analyzer screen150 PRINT #1 "MKCF."160 PRINT #l:"TS;"'170 'ask spectrum analyzer for trace data180 PRINT #1 "TRA'."190 'input the t&e data to the BASIC program200 FOR I=1 TO 401210 INPUT #l,TRCA(I) 'data input in dBm220 NEXT I230 'create file to store trace on disk240 OPEN "TRACEA" FOR OUTPUT AS #2250 'print the trace data to the disk260 FOR I=1 TO 401270 PRINT #2,TRCA(I)280 NEXT I290 'put spectrum analyzer into continuous-sweep mode300 PRINT tl "CONTS.", ,310 END
Using the OPEN command, we create an empty file on the disk for storing the trace and assignan input and an output path to the file TRACEA. Then we send the trace data to the file. (Seelines 260 through 280.)
Lines 20 through 220 of 232PROG6 are identical to the previous program, 232PROG5.
Programming Topics 3-5

Reading Trace Data from a Computer DiskIf we want to return trace data to the spectrum analyzer for later viewing, we must workthe “saving” process in reverse. The following program reads a trace previously stored on acomputer disk and stores the trace in an array variable.
Program Example for the HP-IB Interface10 !FILE: "IBPROG7"20 !create a 401-point trace array:30 REAL Trace-a(l:401)40 !assign path to the file with the50 !trace in it:60 ASSIGN @File TO "DATA-A"70 !enter trace into variable Trace-a:80 ENTER QFile;Trace-a(*)90 !close file:100 ASSIGN OFile TO *110 END
First, in line 30, the program creates a 401-point trace array. Then, in line 60, the programassigns a path to the trace file. Finally, in line 80, the program sends the trace data to thevariable Trace-N *).
Program Example for the RS-232 Interface10 'File = 232PROG720 OPEN "COMl:9600,N,8,1" AS #l30 'create a 401-point trace array40 DIM TRCA(401)50 'assign number to file with trace data in it60 OPEN "TRACEA" FOR INPUT AS #270 'enter the trace into the array80 FOR I=1 TO 40190 INPUT #2,TRCA(I)100 NEXT I110 CLOSE120 END
First, in line 40, the program creates a 401-point trace array. Then, in lines 60 through 100, theprogram reads the disk file TRACEA and stores data in the array variable TRCA.
3-6 Programming Topics

Saving and Recalling Instrument StatesThe spectrum analyzer’s control settings (or its “state”) can be saved with a computer andretrieved later to streamline test sequences or repeat manual measurements. Control settingscan be stored in one of eight state registers in the spectrum analyzer, in computer memory, oron a computer disk.
The first program in this section demonstrates techniques for saving an instrument state, alongwith its current trace A data. The second program demonstrates how the state information andthe trace data is read from the computer and returned to the spectrum analyzer.
If you wish to save states in the spectrum analyzer, see the descriptions of the save state(SAVES) and recall state (RCLS) commands in Chapter 5.
Saving the Spectrum Analyzer’s StateThe following two programs read and store a trace from the spectrum analyzer.
Programming Topics 3-7

Program Example for the HP-IB Interface10 !FILE: "IBPROG8"20 !define 202 character string:30 DIM Learn_string$[202]40 !create 401-point array to store trace:50 INTEGER Trace,a(l:401)60 Analyzer=71870 !set output format for two byte integers:80 OUTPUT Analyzer;"TDF B;"90 !ask spectrum analyzer for trace data:100 OUTPUT Analyzer;"TRA?;"110 !send trace to the computer:120 ENTER Analyzer USING "t,W";Trace,a(*)130 !get learnstring from spectrum analyzer:140 OUTPUT Analyzer;"OL;"150 ENTER Analyzer USING "#,202A";Learn_string$160 !create file to store trace:170 CREATE BDAT "STATE",4180 !assign path to the file:190 ASSIGN @File TO "STATE"200 !send trace to the file:210 OUTPUT QFile;Learn,string$,Trace_a(*)220 !return output format to default mode:230 OUTPUT Analyzer;"TDF P;"240 !close file:250 ASSIGN @File TO *260 END
3-g Programming Topics

The HP-IB version stores the trace in the variable called Trace-a(*). The state of the spectrumanalyzer is stored in the variable Learn-string& These two variables are then saved in a filecalled STATE. Finally, the file is stored on a disk.
Using the data stored in STATE, the spectrum analyzer settings can be reset according to thesaved state. Then, using the stored trace data, trace data can be viewed on the spectrumanalyzer display.
Line 30 gives the dimensions of the learn string using the HP BASIC DIM command. Learnstrings for the spectrum analyzer require 202 bytes of storage space. Also see the output learnstring (OL) command.
Line 70 uses TDF B to format the output in binary. Binary provides the fastest data transferand requires the least amount of memory to store data. Each data point is transferred inbinary as two 8-bit bytes. The data points are in the internal representation of measurementdata. (See “Different Formats for Trace Data Transfers” at the end of this chapter for moreinformation about trace data formats.)
When the trace and state data are sent from the spectrum analyzer to the computer, theymust be formatted. Lines 120 and 150 format trace data with the HP BASIC USING command.In the formatting statement, I‘#” indicates that the statement is terminated when the lastENTER item is terminated. EOI (end-or-identify) and LF (line feed) are item terminators, andearly termination will result in an inaccurate learn string. “W” specifies word format. “202A”indicates the size of the learn string.
Line 170 creates a file called STATE that is 4 records long. (lb determine the number of recordsfor the computer in our example, the 401-point trace is multiplied by 2 bytes per point and the202-byte learn string is added to give 1004 bytes total. This total is divided by 256 bytes perrecord, resulting in 4 records.)
Note If the program containing the CREATE command is run twice, the computerwill report an error the second time because the file already exists. lb preventthis, place an exclamation mark before the CREATE command to “commentout” line 170 after the program has been executed.
Programming Topics 3-9

Program Example for the RS-232 Interface10 'File = 232PROG820 OPEN "COMl:9600,N,8,1" AS #I30 'Define 202-character string40 DIM LEARN$(202)50 'Create 802-character string to store trace data60 DIM TR1$(200>,TR2$(200>,TR3$(200)70 DIM TR4$(2OO>,TR5$(2>,TR6$(200)80 'ask spectrum analyzer for trace data in binary format90 PRINT #l,"TDF B; TRA?;"100 'enter trace data from spectrum analyzer110 TRl$=INPUT(200,#1) 'first 200 characters120 TR2$=INPUT(200,#1) 'second 200 characters130 TR3$=INPUT(200,#1) 'third 200 characters140 TR4$=INPUT(200,#1) 'fourth 200 characters150 TR5$=INPUT(2,#1) 'last two characters160 'ask for learn string from spectrum analyzer170 PRINT #l,"OL;"180 'get learn string from spectrum analyzer190 LEARN$=INPUT$(202,#1>200 'create file to store trace on disk210 OPEN "TRACEA" FOR OUTPUT AS #2220 'change ASCII data to integers for disk storage230 'because ASCII 26 will put EOF on disk240 DEFINT X,Y,I 'integer variables250 DIM Xl(202),Yl(802) 'arrays for the data260 'first format the learn string270 FOR I= 1 TO 202280 'get ASCII character from string290 L2$=MID$(LEARN$,I,l)300 'make integer of ASCII value O-255310 Xl(I)=ASC(L2$)320 NEXT I330 'format the data strings340 T5=1 'set counter350 TRG$=TRl$ 'set string to be converted360 GOSUB 620 'do the conversion370 T5=201 'set counter380 TR6$=TR2$ 'set string to be converted390 GOSUB 620 'do conversion400 T5=401410 TR6$=TR3$420 GOSUB 620
3-l 0 Programming Topics

430 T5=601440 TR6$=TR4$450 GOSUB 620460 'convert last two characters470 L2$=MID$(TRS$,l,l)480 Yl(80l)=ASC(L2$)490 L2$=MID$(TR5$,2,1)500 Y(802)=ASC(L2$)510 'data is now formatted, write to disk520 FOR I=1 TO 202530 PRINT #2,X1(1)540 NEXT I550 FOR I=1 TO 802560 PRINT #2,Yl(I)570 NEXT I580 'close the data file590 CLOSE600 GOT0 680610 'subroutine for converting data:620 FOR I=1 TO 200630 L2$=MID$(TRG$,I,l) 'get ASCII character640 Yl(T5)=ASC(L2$) 'set value in array650 T5=T5+1660 NEXT I670 RETURN 'done with conversion680 END
The previous program reads a trace from the spectrum analyzer, then stores it in the variablecalled TRCA. The state of the spectrum analyzer is stored in the variable LEARNS. These twovariables are then saved in a file called TRACEA. Finally, the file is stored on a disk.
Using the data stored in TRCA, the spectrum analyzer settings can be reset according to thesaved state. Then, using the stored trace data, trace data can be viewed on the spectrumanalyzer display.
Line 40 gives the dimensions of the learn string using the GW BASIC DIM command. Learnstrings for the spectrum analyzer require 202 bytes of storage space. Refer to the output learnstring (OL) command description in Chapter 5 for more information.
Line 90 uses TDF B to format the output in binary. Binary provides the fastest data transferand requires the least amount of memory to store data. Each data point is transferred inbinary as two 8-bit bytes. The data points are in the internal representation of measurementdata. (See “Different Formats for Trace Data Transfers” at the end of this chapter for moreinformation about trace data formats.)
When the trace and state data is sent from the spectrum analyzer to the computer, it must beformatted. Lines 270 through 320 format the trace data.
Programming Topics 3-l 1
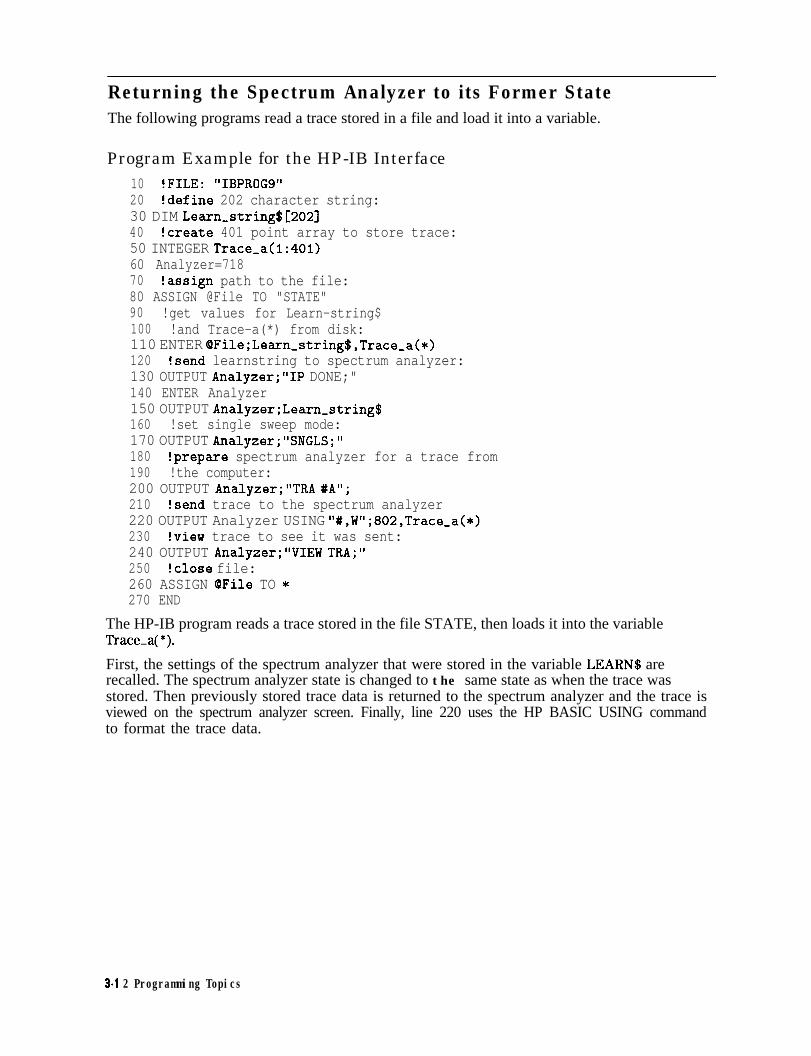
Returning the Spectrum Analyzer to its Former StateThe following programs read a trace stored in a file and load it into a variable.
Program Example for the HP-IB Interface10 !FILE: "IBPROGS"20 !define 202 character string:30 DIM Learn,string$[202]40 !create 401 point array to store trace:50 INTEGER Trace,a(l:401)60 Analyzer=71870 !assign path to the file:80 ASSIGN @File TO "STATE"90 !get values for Learn-string$100 !and Trace-a(*) from disk:110 ENTER OFile;Learn-string$,Trace,a(*)120 !send learnstring to spectrum analyzer:130 OUTPUT Analyzer;"IP DONE;"140 ENTER Analyzer150 OUTPUT Analyzer;Learn-string$160 !set single sweep mode:170 OUTPUT Analyzer;"SNGLS;"180 !prepare spectrum analyzer for a trace from190 !the computer:200 OUTPUT Analyzer;"TRA #A";210 !send trace to the spectrum analyzer220 OUTPUT Analyzer USING "#,W";802,Trace-a(*)230 !view trace to see it was sent:240 OUTPUT Analyzer;"VIEW TRA;"250 !close file:260 ASSIGN @File TO *270 END
The HP-IB program reads a trace stored in the file STATE, then loads it into the variableTrace-$ *).
First, the settings of the spectrum analyzer that were stored in the variable LEARN$ arerecalled. The spectrum analyzer state is changed to the same state as when the trace wasstored. Then previously stored trace data is returned to the spectrum analyzer and the trace isviewed on the spectrum analyzer screen. Finally, line 220 uses the HP BASIC USING commandto format the trace data.
3-l 2 Programming Topics

Program Example for the RS-232 Interface10 'File = 232PROG920 OPEN "COMl:9600,N,8,1" AS #I30 DEFINT X,Y,I 'integer variable40 'define 202-character string50 DIM LEARN$(202),Xl(202)60 'create an 802-character string to store disk data70 DIM TR1$(200>,TR2$(200>,TR3$(200),TR4$(200)80 DIM TR5$(2>,TR6$(2OO>,Yl(802)90 'open disk file "TRACEA"100 OPEN "TRACEA" FOR INPUT AS #2110 'enter learn array from disk120 FOR I=1 TO 202130 INPUT #2,X1(1) 'get integer variable from disk140 NEXT I150 'enter trace data from disk160 FOR I=1 TO 802170 INPUT #2,Yl(I)180 NEXT I190 'close the disk file200 CLOSE #2210 'format the integer data into strings220 'for the spectrum analyzer. See 232PROG8 for explanation230 LEARN$="" 'null out the learn string240 FOR I=1 TO 202 'format learn string first250 LEARN$=LEARN$+CHR$(Xl(I))260 NEXT I270 'format the trace data280 12=1 'set the counter290 GOSUB 500 'do the conversion300 TRl$=TRG$ 'set the string310 12=201320 GOSUB 500 'do the conversion330 TR2$=TR6$340 12=401
Programming Topics 3-13

350 GOSUB 500360 TR3$=TR6$370 12=601380 GOSUB 500390 TR4$=TR6$400 'format last two characters410 TR5$=""420 TR5$=TR5$+CHR$(Yl(80l))+CHR$(Y1(802))430 'write to spectrum analyzer440 PRINT #l,LEARN$450 'output trace data460 PRINT #l,"IB";TRl$;TR2$;TR3$;TR4$;TR5$;470 PRINT #l,"VIEW TRB;"480 GOT0 560 'end program490 'subroutine for converting integer data to ASCII500 TR6$="" 'set the string to a null value510 FOR I=1 TO 200520 TRS$=TRS$+CHR$(Yl(IZ>)530 12=12+1540 NEXT I550 RETURN 'done with conversion560 END
The RS-232 program, 232PROG9, reads a trace stored in the file TRACEA and loads it into thevariable TRCA. This program assumes that trace data is stored on the disk from the previousprogram example, 232PROG8.
First, the settings of the spectrum analyzer that were stored in the variable LEARN$ arerecalled. The spectrum analyzer state is changed to the same state as when the trace wasstored. Then previously stored trace data is returned to the spectrum analyzer and the trace isviewed on the spectrum analyzer screen.
3-14 Programming Topics

Measuring Harmonic DistortionThe harmonic distortion program presented here illustrates how the spectrum analyzer canbe directed by a computer to make a complete measurement. Measuring the percent of totalharmonic distortion is tedious when performed manually: it involves tuning to the fundamentaland to each harmonic of interest, recording the amplitude of each signal, converting theseamplitudes to linear units (volts), and calculating the result using a formula. The followingprogram measures percent of total harmonic distortion automatically, quickly, and accurately.
The program operates as if we were making the measurement manually.
Note This program is designed to measure harmonics of a signal that is greater than20MHz.
Program Example for the HP-IB Interface10 !FILE: “THD-TEST”20 ASSIGN QSa TO 718 ! assign IO path to spectrum analyzer30 Variables: ! define variables:40 REAL Fundamental,Fund-amptd-v,Fund-amptd-dbm50 REAL Prcnt,distort,Sum-sqr60 INTEGER Max-harmonic,I,Number70 !allow user to change the number of harmonics:80 Max-harmonic=490 ALLOCATE REAL Harmonic-v(2:Max-harmonic)100 ALLOCATE REAL Harmonic-dbc(2:Max,harmonic)110 GOSUB Clearscreen ! clear the alpha screen120 !ask for the frequency of the fundamental:130 OUTPUT CRT USING “4/,lOX,K,3/“; "***HARMONIC DISTORTION***"140 OUTPUT CRT USING "lOX,K";"CONNECT SOURCE TO INPUT"150 OUTPUT CRT USING “10X ,K” ; ” ENTER FUNDAMENTAL FREQUENCY IN MHz”160 OUTPUT CRT USING “10X ,K”; “WHEN READY, PRESS ENTER ”170 INPUT Fundamental180 GOSUB Clearscreen ! clear the alpha screen190 Fundamental: ! write message on screen:200 DISP “MEASURING FUNDAMENTAL”210 !preset the spectrum analyzer, set single sweep mode, and220 !take sweep:230 OUTPUT @Sa;“IP; SNGLS; TS;”240 !tune the spectrum analyzer to the fundamental freq and set250 ! 20 MHz span:260 OUTPUT OSa- “CF ‘I ; Fundamental; “MZ; ”270 OUTPUT BISai “SP 20MZ; TS; ‘I280 !put a marker on signal peak, move marker to290 !reference level:300 OUTPUT %a; “MKPK HI ; MKRL; TS; ”310 !find signal peak, activate signal track, and320 !narrow span:
Programming Topics 3-15

330 OUTPUT @Sa;"MKPK HI; TS;"340 OUTPUT OSa;"MKTRACK ON; SP IOOKZ; TS;"350 !turn off signal track:360 OUTPUT QSa;"MKTRACK OFF;"370 !find the peak of the signal; move peak to center380 !of screen:390 OUTPUT OSa;"AUNITS V;"! MAKE READOUT UNITS VOLTS400 !find peak of signal; send amplitude value to410 !computer420 !enter the amplitude of the fundamental:430 OUTPUT @Sa;"MKPK HI; MKA?;"440 ENTER OSa;Fund,amptd-v450 !send marker frequency to the computer, enter460 !frequency value:470 OUTPUT OSa;"MKF?;"480 ENTER OSa;Fundamental490 !make the fundamental frequency the center freq500 !step size:510 OUTPUT OSa;"MKSS;"520 !set the fundamental frequency units to MHz:530 Fundamental=Fundamental/l.E+6540 Harmonics: !measure the amplitudes of the harmonics:,550 FOR Number=2 TO Max-harmonic560 DISP "MEASURING HARMONIC #";Number570 OUTPUT @Sa;"SP 20MZ;" !set span to 20 MHz580 OUTPUT @Sa;"CF UP; TS;" !tune to next harmonic590 !take second sweep to allow spectrum analyzer to move to the600 !center frequency; find the signal peak; activate610 !signal track:620 OUTPUT @Sa;"TS;"630 OUTPUT @Sa;"MKPK HI; MKTRACK ON; SP IOOKZ; TS;"640 !turn off signal track:650 OUTPUT OSa;"MKTRACK OFF;"660 !find signal peak; send amplitude value to computer670 !enter the amplitude of the harmonic:680 OUTPUT OSa;"MKPK HI; MKA?;"690 ENTER QSa;Harmonic-v(Number)700 NEXT Number710 !set amplitude units to dBm:720 OUTPUT OSa;"AUNITS DBM;"730 !calculate the fundamental amplitude in dBm because740 !it was measured in volts:750 Fund,amptd_dbm=lO*LGT(Fund_amptd_v^2/.05)760 !calculate the sum of the squares of the amplitudes770 !of the harmonics; calculate amplitudes of780 !harmonics (dBm):790 Sum-sqr=O800 FOR I=2 TO Max-harmonic810 Sum,sqr=Sum,sqr+Harmonic,v(I)^2820 Harmonic-dbc(I)=20*LGT(Fund-amptd-v/Harmonic-v(1))830 NEXT I
3-l 6 Programming Topics

840 !calculate the percent distortion:850 Prcnt,distort=SQR(Summ,sqr)/Fund~amptd,v*lOO860 GOSUB Clearscreen !clear the alpha screen:870 !Output,data:880 !send data to the screen of the computer:890 OUTPUT CRT USING "7/,lX,K"; "HARMONIC DISTORTION RESULTS"900 OUTPUT CRT USING "llX,K,DDDD.D,K";"FREQ = ";Fundamental;" MHz"910 OUTPUT CRT USING "llX,K,DDDD.D,K";"AMP = ";Fund-amptd-dbm;" dBm"920 OUTPUT CRT USING "llX,K,DDD.D,K";"2nd HARMONIC = -";Harmonic_dbc(2);" dBc"930 OUTPUT CRT USING ',llX,K,DDD.D,K";"3rd HARMONIC = -";Harmonic,dbc(3);" dBc"940 FOR I=4 TO Max-harmonic950 OUTPUT CRT USING "lOX,DD,K,DDD.D,K";I;"th HARMONIC = -";Harmonic,dbc(I) dBc"960 NEXT I970 OUTPUT CRT USING "llX,K,DDD.D,K";"TOTAL DISTORTION = ";Prcnt,distort;" %"980 !990 LOCAL 71000 STOP1010 !1020 Clearscreen: !alpha clear subroutine1030 !the statement below presses the "CLR SCR" key on1040 !the keyboard:1050 OUTPUT KBD USING "# B"*255 753"1060 RETURN1070 END
The program prompts the user to connect a source to the spectrum analyzer INPUT and enterthe source frequency. It sets the spectrum analyzer center frequency to the value of thesource, or fundamental, frequency. It measures and records the frequency and amplitude ofthe fundamental, then measures and records the amplitude of the second, third, and fourthharmonics. These values are used to compute percent of harmonic distortion. The result of theharmonic distortion percentage computation, plus harmonic amplitudes in dBc (decibels relativeto the carrier), are displayed on the computer display. Extensive annotation has been added(after the exclamation points) to help clarify the program.
If necessary, change the number of harmonics in line 80.
Programming Topics 3-17

Program Example for the RS-232 InterfaceIO 'File = THDTEST20 OPEN "COMl:9600,N,8,1" AS #I30 'allow user to change the number of harmonics40 MAXHARMONIC=50 DIM HARMONICV(lO>,HARMONICDBC(lO)60 'clear the screen70 CLS80 'ask for the frequency of the fundamental90 PRINT "******* HARMONIC DISTORTION *******"100 PRINT110 PRINT "CONNECT SOURCE TO ANALYZER INPUT, THEN"120 PRINT "ENTER FREQUENCY OF THE FUNDAMENTAL IN MHZ"130 PRINT140 INPUT FUNDAMENTAL150 CLS160 'print measuring fundamental on screen170 PRINT "MEASURING FUNDAMENTAL"180 'preset the spectrum analyzer, set single-sweep and185 'take sweep190 PRINT #l,"IP;SNGLS;TS;"200 PRINT #I "DONE."210 INPUT #(DONE
,
220 'tune the spectrum analyzer to the fundamental freq and set225 '20 MHz span230 PRINT #l,"CF ";FUNDAMENTAL;"MHZ"240 PRINT #l,"SP 20MZ;TS;"250 PRINT #l,"DONE;"260 INPUT #l,DONE270 'put a marker on signal peak, move marker to275 'reference level280 PRINT #l,"MKPK HI;MKRL;TS;"290 'find signal peak, activate signal track, and295 'narrow span300 PRINT #l,"MKPK HI;TS;"310 PRINT #l,"MKTRACK 0N;SP 1OOKZ;TS;"320 PRINT #I "DONE."330 INPUT #(DONE
,
340 'turn off signal track350 PRINT #l,"MKTRACK OFF;"360 'find peak of signal, move peak to center of screen370 'make units in volts380 PRINT #l,"AUNITS V;"390 'find peak of signal, send amplitude value to395 'computer400 PRINT #l,"MKPK HI;MKA?;"410 INPUT #l,FUNDAMPTDV420 'send marker frequency to computer, enter frequency425 'value430 PRINT #l,"MKF?;"440 INPUT #l,FUNDAMENTAL450 'make the fundamental frequency the center freq455 'step size
3-16 Programming Topics
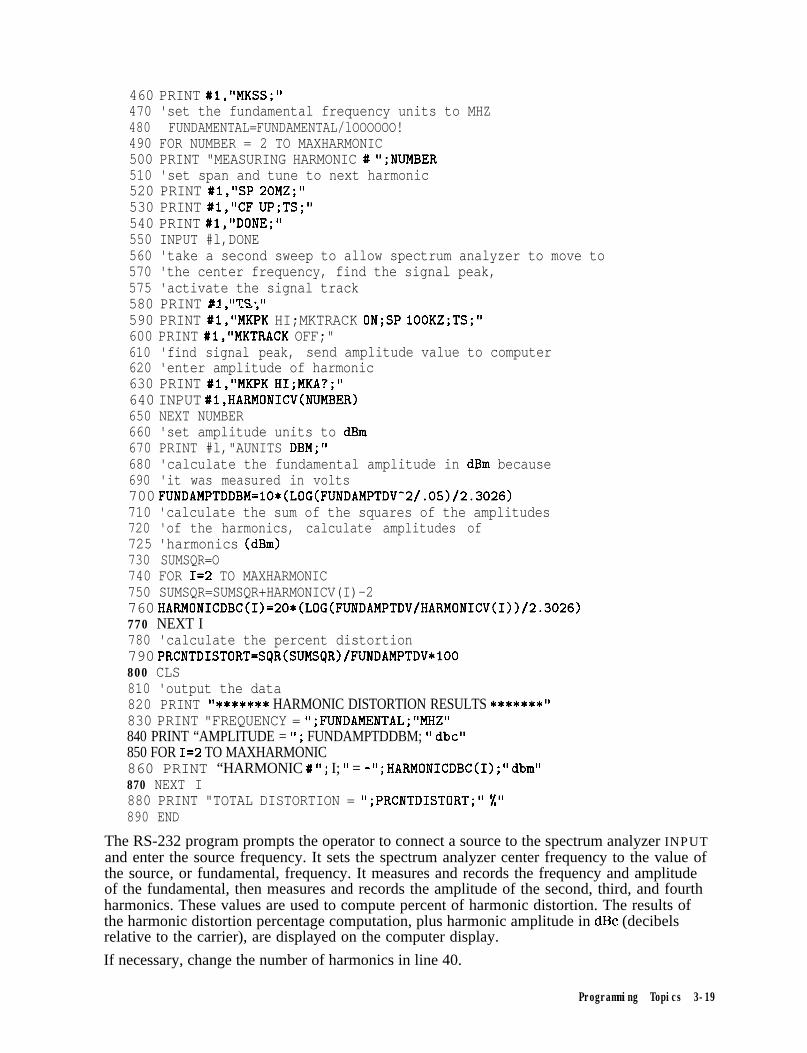
460 PRINT #l,"MKSS;"470 'set the fundamental frequency units to MHZ480 FUNDAMENTAL=FUNDAMENTAL/lOOOOOO!490 FOR NUMBER = 2 TO MAXHARMONIC500 PRINT "MEASURING HARMONIC # ";NUMBER510 'set span and tune to next harmonic520 PRINT #l,"SP 20MZ;"530 PRINT #l,"CF UP;TS;"540 PRINT #l,"DONE;"550 INPUT #l,DONE560 'take a second sweep to allow spectrum analyzer to move to570 'the center frequency, find the signal peak,575 'activate the signal track580 PRINT #I "TS."590 PRINT #l:"MK;K HI;MKTRACK 0N;SP 100KZ;TS;"600 PRINT #l,"MKTRACK OFF;"610 'find signal peak, send amplitude value to computer620 'enter amplitude of harmonic630 PRINT #l,"MKPK HI;MKA?;"640 INPUT #l,HARMONICV(NUMBER)650 NEXT NUMBER660 'set amplitude units to dBm670 PRINT #l,"AUNITS DBM;"680 'calculate the fundamental amplitude in dBm because690 'it was measured in volts700 FUNDAMPTDDBM=lO*(LOG(FUNDAMPTDV-2/.05)/2.3026)710 'calculate the sum of the squares of the amplitudes720 'of the harmonics, calculate amplitudes of725 'harmonics (dBm)730 SUMSQR=O740 FOR I=2 TO MAXHARMONIC750 SUMSQR=SUMSQR+HARMONICV(I)-2760 HARMONICDBC(I>=20*(LOG(FUNDAMPTDV/HARMONICV(I))/2.3O26)770 NEXT I780 'calculate the percent distortion790 PRCNTDISTORT=SQR(SUMSQR)/FUNDAMPTDV*lOO800 CLS810 'output the data820 PRINT “******* HARMONIC DISTORTION RESULTS *******”830 PRINT "FREQUENCY = ";FUNDAMENTAL;"MHZ"840 PRINT “AMPLITUDE = ” ; FUNDAMPTDDBM; ” dbc”850 FOR I=2 TO MAXHARMONIC860 PRINT “HARMONIC # ‘I; I; ‘I = -‘I ; HARMONICDBC(1) ; ‘I dbm”870 NEXT I880 PRINT "TOTAL DISTORTION = ";PRCNTDISTORT;" %"890 END
The RS-232 program prompts the operator to connect a source to the spectrum analyzer INPUTand enter the source frequency. It sets the spectrum analyzer center frequency to the value ofthe source, or fundamental, frequency. It measures and records the frequency and amplitudeof the fundamental, then measures and records the amplitude of the second, third, and fourthharmonics. These values are used to compute percent of harmonic distortion. The results ofthe harmonic distortion percentage computation, plus harmonic amplitude in dBc (decibelsrelative to the carrier), are displayed on the computer display.
If necessary, change the number of harmonics in line 40.
Programming Topics 3-19

Different Formats for Trace Data TransfersTwo different ways to format trace data using the TDF command were introduced earlier inthis chapter (TDF P and TDF B). This section describes all the available trace data formats.
The HP 8590 Series spectrum analyzer provides five formats for trace data transfers: realnumber (P) format, binary (B) format, A-block format, I-block format, and measurement units(M) format.
P FormatThe P format allows you to receive or send trace data in a real-number format. This is thedefault format when the instrument is powered up. Numbers are in dBm, dBmV, dBpV, volts,or watts. The AUNITS command can be used to specify the amplitude units. Real-number datamay be an advantage if you wish to use the data later in a program. However, data transfersusing P format tend to be slow and take up a lot of memory (compared to binary format, the Pformat can take up to four times the amount of memory). Data is transferred as ASCII type.
Although the spectrum analyzer can send the trace data to the computer as real numbers, thetrace data cannot be sent back to the spectrum analyzer without changing the trace data tomeasurement units (integers). See the following example.
3-20 Programming Topics

Example of Using the P Format
This example sends trace datatothe computer and backtothe spectrum analyzer using Pformat.
Note The spectrum analyzer mustbeinthelog amplitude scale to use the TDF Pformat.
1 REAL Trace_data(l:401) Declare an array for trace data.10 OUTPUT 718;"IP;CF 300MHZ;SP 20MHZ;SNGLS;TS;" Zzke a measurement sweep.20 OUTPUT 718;"TDF P;TRA?;" Activate the P format, output
trace A data.30 ENTER 718;Trace_data(*) The computer receives trace A
data from the spectrum analyzer40 OUTPUT 718;"VIEW TRA;MOV TRA,O;"
50 OUTPUT 718*"RL'*"' * ,
60 DISP "PRESS CONTINUE WHEN READY"70 PAUSE80 ENTER 718;RefJevel90 MAT Trace-data=Trace-data-(Ref-level)100 MAT Trace,data=Trace-data*(lOO)110 MAT Trace,data=Trace_data+(8000)120 OUTPUT 718m"TRA I).130 OUTPUT 718ITrace_data(*)
140 LOCAL 718150 END
lb v&f@ that the trace data istransferred back to the spectrumanalyzq set trace A to zeros.Determine the amplitude of thereference level. The amplitudeof the reference level is used tochange the integers sent to thespectrum analyzer into real numbers.
Get the refsrence level.These lines change the real tracedata (stored in Trace-data) intointegers (in measurem.ent units).Sends the trace data back to thespectrum analyzer in measure-ment units.
The trace data is sent to the computer in parameter units. A parameter unit is a standardscientific unit. For the TDF P format, the parameter unit depends on the current amplitudeunits (dBm, dBmV, dBpV, V, W). Use the AUNITS command to change the units.
For more detailed information about the P format, see the description for TDF in Chapter 5.
Programming Topics 3-21
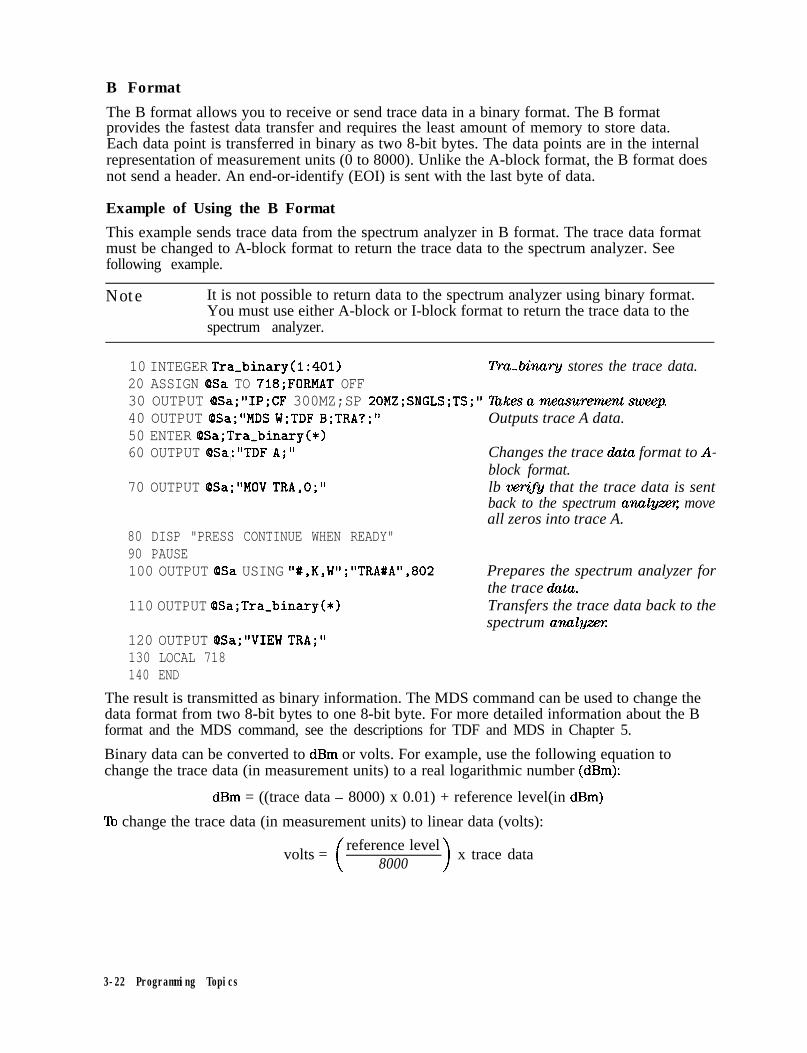
B Format
The B format allows you to receive or send trace data in a binary format. The B formatprovides the fastest data transfer and requires the least amount of memory to store data.Each data point is transferred in binary as two 8-bit bytes. The data points are in the internalrepresentation of measurement units (0 to 8000). Unlike the A-block format, the B format doesnot send a header. An end-or-identify (EOI) is sent with the last byte of data.
Example of Using the B Format
This example sends trace data from the spectrum analyzer in B format. The trace data formatmust be changed to A-block format to return the trace data to the spectrum analyzer. Seefollowing example.
Note It is not possible to return data to the spectrum analyzer using binary format.You must use either A-block or I-block format to return the trace data to thespectrum analyzer.
10 INTEGER Tra_binary(l:401)20 ASSIGN QSa TO 718;FORMAT OFF
Tra3inary stores the trace data.
30 OUTPUT OSa;"IP;CF 300MZ;SP 20MZ;SNGLS;TS;" T&kesameasurenwntsweep.40 OUTPUT @Sa;"MDS W;TDF B;TRA?;"50 ENTER OSa;Tra,binary(*)60 OUTPUT @Sa*"TDF A*", J
70 OUTPUT 6Sa;"MOV TRA,O;"
80 DISP "PRESS CONTINUE WHEN READY"90 PAUSE100 OUTPUT @Sa USING "#,K,W";"TRA#A",802
110 OUTPUT OSa;Tra,binary(*)
120 OUTPUT OSa;"VIEW TRA;"130 LOCAL 718140 END
Outputs trace A data.
Changes the trace data format to A-block format.lb ve@fy that the trace data is sentback to the spectrum analyq moveall zeros into trace A.
Prepares the spectrum analyzer forthe trace data.Transfers the trace data back to thespectrum analyzevz
The result is transmitted as binary information. The MDS command can be used to change thedata format from two 8-bit bytes to one 8-bit byte. For more detailed information about the Bformat and the MDS command, see the descriptions for TDF and MDS in Chapter 5.
Binary data can be converted to dBm or volts. For example, use the following equation tochange the trace data (in measurement units) to a real logarithmic number (dBm):
dBm = ((trace data - 8000) x 0.01) + reference level(in dBm)
To change the trace data (in measurement units) to linear data (volts):
volts =reference level
8000 >x trace data
3-22 Programming Topics

The following programming converts binary data to dBm.
102030405060708090100110120130140150160170180190200210220
! 859X binary data to real numbersSa=718ASSIGN (OSa,bin TO Sa;FORMAT OFFINTEGER Trace-a(l:401)OUTPUT Sa;"AUNITS DBM;"OUTPUT Sa*"RL?*"ENTER Sa;Ref-IkPRINT Ref-levOUTPUT Sa;"TDF B;TRA?;"ENTER OSa-bin;Trace-a(*)! now the spectrum analyzer has all the data! to determine the measured trace dataREAL Trace_a_real(l:401)
MAT Trace-a= Trace-a-(8000) ! Results in below ref! levelMAT Trace-a-real= Trace,a*(.Ol)! now in hundredths of db! below ref levMAT Trace-a-real= Trace-a-real+(Ref-lev)
FOR I=1 TO 401PRINT Trace-a-real(I)NEXT I
END
The following programming converts binary data to volts.
102030405060708090100110120130140150160170180
! 859X binary data to real numbers (linear)Sa=718ASSIGN (QSa-bin TO Sa;FORMAT OFFINTEGER Trace-a(l:401)OUTPUT Sa*"AUNITS V*"OUTPUT SaI"RL?;" 'ENTER Sa;Ref-levRef-lev-factor=Ref_lev/8000OUTPUT Sa;"TDF B;TRA?;"ENTER OSa,bin;Trace,a(*)! now the spectrum analyzer has all the data! to determine the measured trace dataREAL Trace,a,real(l:401)MAT Trace-a-real= Trace-a*(Ref,lev,factor)
FOR I=1 TO 401PRINT Trace-a-real(I)NEXT I
END
Programming Topics 3-23

A-Block Format
The A-block format is similar to binary format in that each data point is sent as two 8-bit bytes(this, too, is in the internal representation of measurement data). A-block format also transfersa four-byte header before the 401 points of trace data. These bytes are the ASCII character“f’, “A”, and two-byte number representing the length of the trace data, followed by the databytes.
Example of Using the A-Block Format
This example sends trace data from the spectrum analyzer to the computer and back to thespectrum analyzer in A-block format.
10 INTEGER Tra_binary(l:401)
20 DIM Header$[4]
Declare an array for tracedata.Declare a string for the #,A, MSB length, and LSBlength heao!.ex
30 OUTPUT 718;"IP;CF 300MZ;SP 20MZ;SNGLS;TS;"40 OUTPUT 718;"MDS W;TDF A;TRA?;"
llxke a mxxzsurem.ent sweep.Send trace A to the com-puter in A-block format.
50 ENTER 718 USING "#,4A,401(W)";Header$,Tra_binary(*) The computer receives theheader and the trace data.
60 PRINT "PRESS CONTINUE TO RETURN DATA TO THE ANALYZER"70 PAUSE80 OUTPUT 718;"IP;TS;VIEW TRA;" View trace A.90 OUTPUT 718e"TDF A-"100 OUTPUT 71; USING' The spectrum anulgzer re-"#,K,W,40l(W)"; "TRA#A",802,Tra_binary(*),";" wives the trace data from
the computex110 END
The transferred trace data consists of #A, a two-byte number representing the most significantbyte (MSB) length and the least significant byte (LSB) length, and the data bytes. Depending onthe terminal you are using, the data bytes may appear as symbols instead of numbers. Consultyour computer documentation to determine the numeric value of the data bytes.
For more detailed information about the A-block format and the MDS command, see thedescriptions for TDF and MDS in Chapter 5.
3-24 Programming Topics

I-Block Format
Note The I-block format is not recommended for use with the RS-232 interface(Option 043).
The I-block format transfers data points as two 8-bit bytes in the internal representation ofmeasurement data. In addition to transferring trace data, I-block format also transfers thecharacters I‘#” and “I”. These characters indicate that the trace data is in I-block format. TheI-block format allows the spectrum analyzer to accept up to 401 points of trace data whenusing I-block format. Fewer than 401 points of trace data can be specified, and the spectrumanalyzer will accept data until an EOI signal is sent to it. Therefore, returning the trace data tothe spectrum analyzer requires an important instruction, END. (See following example.)
Example of Using the I-Block Format
This example sends trace data from the spectrum analyzer to the computer and back to thespectrum analyzer in I-block format.
10 INTEGER Tra_binary(l:401)
20 DIM Header$[Z]
30 OUTPUT 718;"IP;CF 300MZ;SP 20MZ;SNGLS;TS;"40 OUTPUT 718;"TDF I;TRA?;"
50 ENTER 718 USING "#,2A,40l(W)";Header$,Tra,binary(*)
60 PRINT "PRESS CONTINUE TO RETURN DATA TO THE ANALYZER"70 PAUSE80 OUTPUT 718;"IP;TS;VIEW TRA;"90 OUTPUT 718;"TDF I;"100 OUTPUT 718 USING "#,K,W,401(W)";"TRA#I",Tra-binary(*)110 END
Dec.kzre an array for tracedata.Declare an array for #, Iheader:llzke a mxxsurement sweep.Send trace A data in I-block format.The computer receives theheader and trace A data.
View trace A.
The trace data is returnedto the spectrum analyzer
The END statement in line 100 sends the spectrum analyzer the last data byte stored in thearray and sets the HP-IB EOI line “true,” as required by the I-block format.
The transferred trace data consists of #I, followed by data bytes until the EOI line is set true.
For more detailed information about the I-block format and the MDS command, see thedescriptions for TDF and MDS in Chapter 5.
Programming Topics 3-25

M FormatThe M format is for sending trace data only. It formats the trace data in the internal formatused by the spectrum analyzer, also known as measurement units.
Refer to Figure 3-1. The displayed amplitude of each element falls on one of 8000 verticalpoints with 8000 equal to the reference level. For log scale data, each point is equal to 0.01 dB.The peak of the signal in Figure 3-l is equal to -20 dBm, or two divisions below the referencelevel. In measurement units, it is equal to 6000 (8000 - 2000 = 6000). In linear mode, eachpoint has a resolution of [reference level in volts divided by SOOO]. The range of internal datais -32,768 to +32,767. In practice however, the range limits can be reached during trace mathoperations only.
+32,767 -7
8160- Y 4
8 0 0 0 -
O-
\y
LOG10 DB/
J
ii
-32,768- I /
5
cull9e
Figure 3-1. Measurement Unit Range and Trace Amplitudes
3-26 Programming Topics

IndexNumber
1
‘Ihble 3-1. Measurement Units
Description
A number within the range of 8161 to 32,767 measurement units is obtainablewith trace math operations only.
The area from 8000 (reference level) to 8160 (1.6 dB above reference level)represents the amount a trace element’s amplitude can exceed the top graticuleand still be valid.
The area from 0 to 8000 represents the displayed range for trace amplitudedata. The range of 0 to 8000 varies according to the amplitude scale of thespectrum analyzer as follows:
n In 10 dB/division, the range is from 0 to 8000.n In 5 dB/div, the range is from 4000 to 8000.w In 2 dB/div, the range is from 8000 to 6000.n In 1 dB/div, the range is from 8000 to 7000.
A number within the range of 0 to -32,768 measurement units is obtainablewith trace math operations only.
Example of Using the M Format
This example sends trace data from the spectrum analyzer to the computer in M format.
10 INTEGER A(l:401) Llimension array A.30 OUTPUT 718;"IP;CF 300MZ;SP 20MZ;SNGLS;TS;" lbkeawz.easurewwntsweep.40 OUTPUT 718;"TDF M;TRA?;" Send trace A data in Mformat.50 ENTER 718;A(*) The computer receives the trace data.60 PRINT A(*) Print trace data.70 END
Note All trace math functions are done using measurement units. See lkble 5-4 for alist of all trace math functions. See the description for the AMB command inChapter 5 for an example of trace math subtraction in measurement units.
The result is in measurement units (-32768 to +32767). For more detailed information aboutthe M format, see the description for TDF in Chapter 5.
‘Ihble 3-2 summarizes the different trace data formats.
Programming Topics 3-27

‘Ihble 3-2. Summary of the Trace Data Formats
TraceData
Format
TDF P
TDF B
TDF A
TDF I
TDF M
Description
Real NumberFormat
Binary Format
A-Block DataFormat
I-Block DataFormat
MeasurementData Format
Remarks
Spectrum analyzer must be in log scale to use TDF P. To send thetrace data back to the spectrum analyzer, the data must beconverted to measurement units.
Fastest format for trace data transfers. Use the A-block format tosend data back to the spectrum analyzer.
Trace data preceded by “#, n “A,” and a two-byte number. To usethe A-block format for sending data, you must provide thenumber of data bytes.
Trace data preceded by “#, ” and “I. ” This format is notrecommended for use with an RS-232 interface. Unlike using theA-block format, you do not provide the number of data byteswhen sending data.
TDF M cannot be used to send trace data back to the spectrumanalyzer.
3-26 Programming Topics

4Creating and Using Downloadable Programs
What You’ll Learn in This ChapterThis chapter provides fundamental information about downloadable programs (DLPs).
This chapter contains the following sections:
w Creating a DLP.n Executing a DLPn Storing DLPs on a RAM card.n Determining the amount of memory needed for a DLP.n Using the DLP editor.n DLP programming guidelines.
What is a DLP?A DLP is a sequence of programming commands used to perform a specific operation. Youcan define a DLP that is made up of several user-defined functions, user-defined variables,and user-defined traces, then store the DLP in analyzer memory or on a RAM card. Somecommands used to create DLPs are FUNCDEF, VARDEF, ACTDEF, TRDEF, and KEYDEF.
Why Use a DLP?A DLP provides an easy way to execute programming commands without the use of anexternal controller. Almost any instruction that the analyzer can execute over the interfacebus or with front-panel operation can be executed in a DLP DLPs can have decision makingcapabilities. In addition, DLPs have the ability to control other instruments over the instrumentbus. DLPs remain in analyzer memory even when the spectrum analyzer power is turnedoff; the DLPs are stored in the battery-backed RAM of the analyzer memory and can be usedrepeatedly, whenever needed.
Creating and Using Downloadable Programs 4-l

Creating a DLPThis section contains information about how to create a DLI? This section contains thefollowing procedures:
w Use a user-defined function within a DLP.w Use a user-defined variable within a DLI?n Use a user-defined trace within a DLl?n Enter values into a DLP,n Create a modular DLl?
4-2 Creating and Using Downloadable Programs

‘lb Use a User-Defined Function within a DLPA user-defined function is created by using the FUNCDEF command.
1. Begin the user-defined function definition by using the FUNCDEF command, the label(function name) for the function you are creating, a comma, and then a delimiter. See line10 of the example.
Use unique names (unique from the analyzer programming commands) for the label.lb avoid confusion with the internal variables used by the spectrum analyzer, it isrecommended that you use an underscore as the second character of the label.
2. Enter in the programming commands that you want the function to perform. See lines20 and 30 of the example. Be sure to use semicolons to separate and terminate eachprogramming command.
Terminating the end of each program line with a semicolon will suppress BASIC’s carriagereturn and line feed. This saves memory since the carriage returns and line feeds won’t bestored in the FUNCDEF.
3. End the FUNCDEF definition by specifying the same delimiter that was used in step 1. Seeline 40 of the example. The delimiters are used to enclose the programming commands forthe function.
To avoid problems with the FUNCDEF definition, you should remember the following:
w A FUNCDEF does not return a value to a calling context like functions do in some languages.n Loading functions into analyzer memory requires space in the analyzer’s memory. If you
are creating a large DLP, you should see “Determining the Amount of Memory Needed for aDLP” in this chapter for information on how to determine the amount of available analyzermemory and the size of the DLl?
w Limit the number of characters between the delimiters in the FUNCDEF declaration to amaximum of 2047 characters. If the function is too large, you may need to segment it intoseveral functions. See “To Create a Modular DLP” in this chapter for more information.
n Ensure that the commands within the function are spelled correctly, that the syntax for thecommand is correct, and that each command is properly terminated with a semicolon.
w Keep the program lines short. If necessary, divide the spectrum analyzer programmingcommands into several lines. See the example.
H See the description for the FUNCDEF command in Chapter 5 for a list of programmingcommands that cannot be used within a FUNCDEF definition.
ExampleExecuting the following programming lines creates a downloadable program called Z-OOM.Z-OOM presets the analyzer, sets the center frequency to 300 MHz, sets the span to 10 MHz,and places a marker on the highest signal. After executing the following lines, Z-OOM will bein spectrum analyzer memory.
10 OUTPUT 718;"FUNCDEF Z-OOM,Q";
20 OUTPUT 718;"IP;CF 300MHZ;";
Begins the FUNCDEF d@nition. The “@”sign delimits the programming commandsthat are within the FUNCDEFcalled Z-OOM.The semicolon at the end of the line sup-presses a carriage return and line feed.Enters IP and CF 300 MH.. commands intoz-OOM.
30 OUTPUT 718;"SP 10MHZ;TS;MKPK HI;"; Enters the SP 10 MHz, TS, MKPK HI com-mands into Z-OOM.
40 OUTPUT 718*"9*"3 , Ends the FUNCDEF definition.50 LOCAL 718 Places the anal~.zer in local mode.60 END
Creating and Using Downloadable Programs 4-3

To Use a User-Defined Variable within a DLPUser-defined variables are variables that you create with the VARDEF or ACTDEF commands.User-defined variables remain in spectrum analyzer memory and retain their values untilredefined, disposed of, or altered by MOV or math commands. Turning the spectrum analyzeroff, then on or pressing @iZK) will reset the variables to values as specified in theirdeclarations. Note that all user-defined variables are global in scope, any function can accessany variable. All variables are of type REAL.
Variables should be declared outside of functions so the MEM? command returns the correctvalue for available spectrum analyzer memory after the DLP is downloaded by an externalcontroller.
To use a user-defined variable within a DLP:
1. Use the VARDEF command to declare the variable. You should declare the variable outsideof the function definition.
2. Begin the FUNCDEF definition.
3. Use the variable within the function. If YOU want to disDlav the value of the variable, usethe DSPLY command.
4. End the FUNCDEF definition.
Example
10 OUTPUT 718;"VARDEF A,MP,O;";
20 OUTPUT 718;"FUNCDEF A,MPFUNC,!";
30 OUTPUT 718;"IP;SNGLS;";
40 OUTPUT 718;"FA 275MHZ;FB 325MHZ;";
50 OUTPUT 718;"TS;MKPK HI;";
60 OUTPUT 718;"MOV A-MP,MKA;";
70 OUTPUT 718;"PU;PA 60,180;TEXT IMARKER AMPLITUDE IS I;";80 OUTPUT 718;"DSPLY AwMP,3.1;TEXT %dBm%;";
90 OUTPUT 718;"! ;"100 END
Declares the variable calledA-MPand initializes itsvalue to zero.Begins the d@inition ofa function called AJPFUNC.Does an instmcment pre-set, sets it to single-sweepmode.Sets the start and stopfrequencies to 275 and325 MHz, respectively.Puts a marker on thehighest signal.Moves the marker am-plitude value into A-MI?Displays the message “MARKERAMPLITUDE Is: ” thendisplatis the marker am-plitude and dBm.Ends thejimction &$nition.
The programming example above alters the variable A-MP that was defined with the VARDEFcommand. The math commands can be used to alter variable values. Examples of mathcommands are the ADD, DIV, SUB, and MPY. Refer to ‘lhble 5-4 in Chapter 5 for a complete listof the math commands.
4-4 Creating and Using Downloadable Programs

To Use a User-Defined Trace within a DLPLike variables, you should define user-defined traces outside of functions. User-defined tracesretain their values until redefined, disposed of, or altered by the MOV command or a mathcommand. User-defined traces are global in scope. Unlike user-defined variables, the elementsof user-defined traces are of type INTEGER.
1. Use the TRDEF command to define a trace. Define the trace outside of the any functions.
2. Initialize the elements of the trace to 0. (Optional.)
3. Use the trace (you can use the trace within a function).
4. ‘RI display the contents of the user-defined trace, move the contents of the user-definedtrace into trace A, trace B, or trace C with the MOV command and then use the VIEWcommand to display the destination trace (trace A, trace B, or trace C).
Example
The following example demonstrates how to define a trace, move a value into the trace, movethe trace to trace A, and view trace A.
10 OUTPUT 718;"TRDEF T,RACEA,401;";20 OUTPUT 718;"MOV T,RACEA,O;";
Dt@zes a 401 -point trace called “TBACEA. ”Initializes the trace values to zero.Use the TXACEA for a measur-t.
130 OUTPUT 718;"FUNCDEF D-ISPTRACE,!"; Dtykes a function called DJPlXACE.140 OUTPUT 718;"MOV TRA,T-RACEA; "; Moves the contents of T-RACEA into trace
A.150 OUTPUT 718;"VIEW TRA;";160 OUTPUT 718;"!; "170 END
Displays trace A.Ends the FUNCDEF d@nition.
Creating and Using Downloadable Programs 4-5
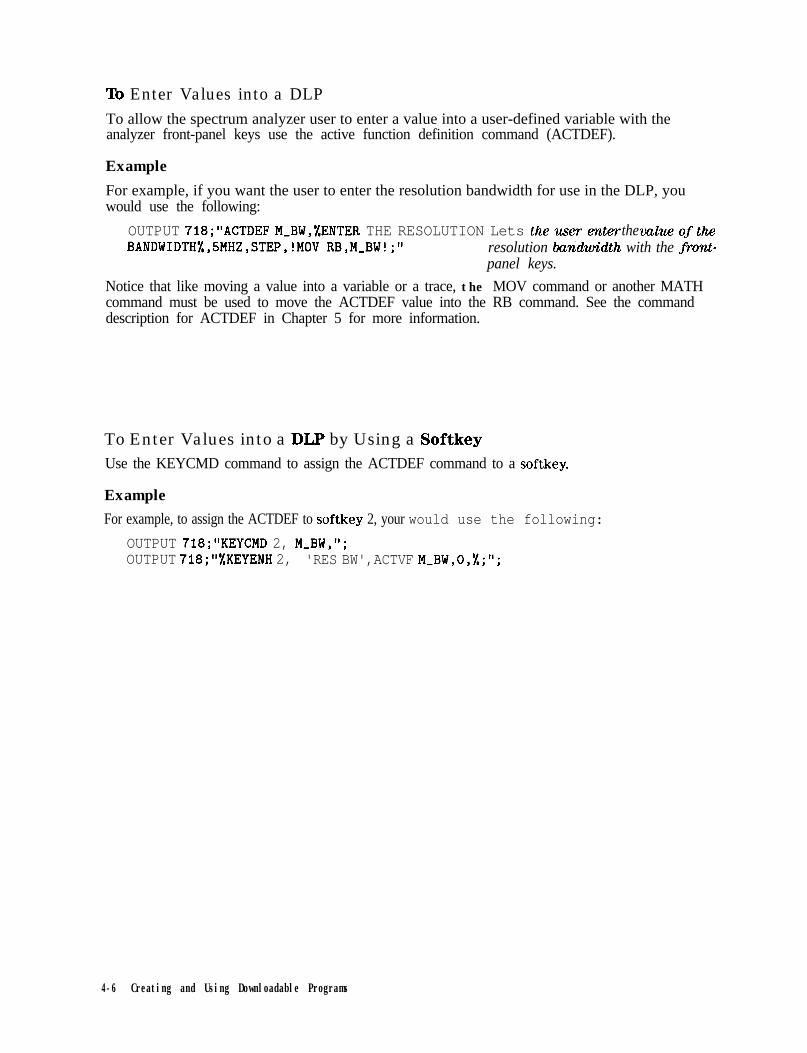
To Enter Values into a DLPTo allow the spectrum analyzer user to enter a value into a user-defined variable with theanalyzer front-panel keys use the active function definition command (ACTDEF).
Example
For example, if you want the user to enter the resolution bandwidth for use in the DLP, youwould use the following:
OUTPUT 718;"ACTDEF M-BW,%ENTER THE RESOLUTION Lets theuserenter the valueoftheBANDWIDTH#,SMHZ,STEP,!MOV RB,M-BW!;" resolution ban’dwidth with the front-
panel keys.
Notice that like moving a value into a variable or a trace, the MOV command or another MATHcommand must be used to move the ACTDEF value into the RB command. See the commanddescription for ACTDEF in Chapter 5 for more information.
To Enter Values into a DIP by Using a SoftkeyUse the KEYCMD command to assign the ACTDEF command to a softkey.
Example
For example, to assign the ACTDEF to softkey 2, your would use the following:
OUTPUT 718;"KEYCMD 2, M-BW,";OUTPUT 718;"lKEYENH 2, 'RES BW',ACTVF MmBW,O,%;";
4-6 Creating and Using Downloadable Programs
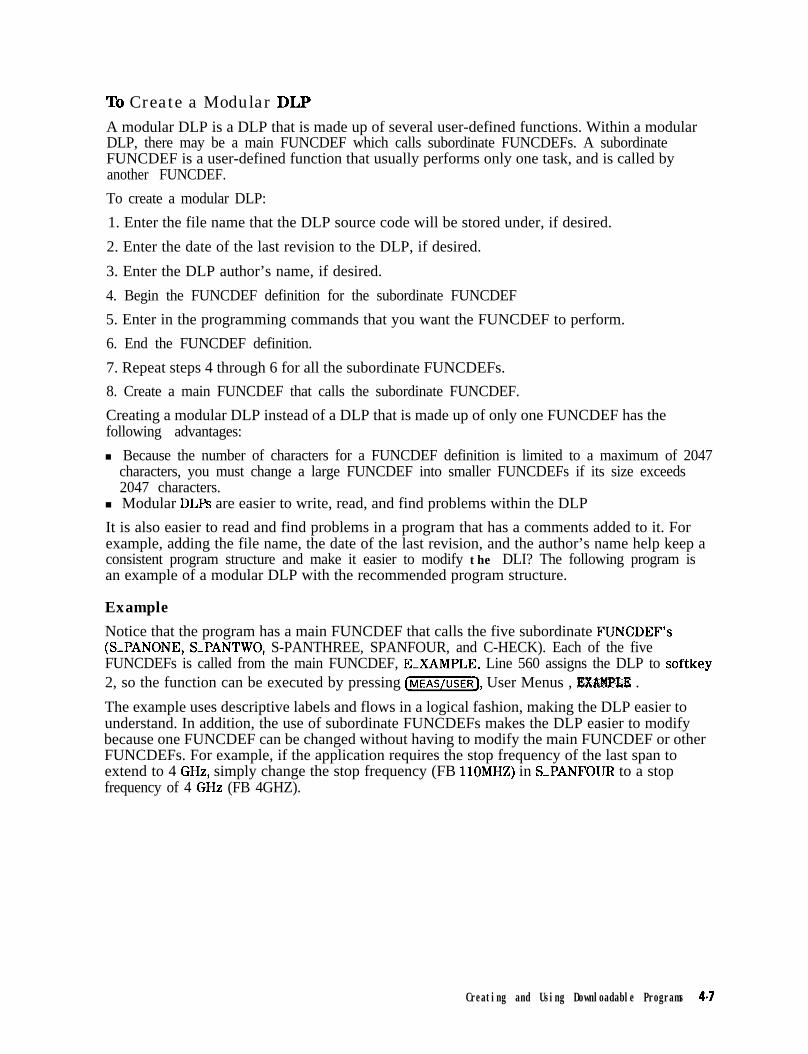
To Create a Modular DLPA modular DLP is a DLP that is made up of several user-defined functions. Within a modularDLP, there may be a main FUNCDEF which calls subordinate FUNCDEFs. A subordinateFUNCDEF is a user-defined function that usually performs only one task, and is called byanother FUNCDEF.
To create a modular DLP:
1. Enter the file name that the DLP source code will be stored under, if desired.
2. Enter the date of the last revision to the DLP, if desired.
3. Enter the DLP author’s name, if desired.
4. Begin the FUNCDEF definition for the subordinate FUNCDEF
5. Enter in the programming commands that you want the FUNCDEF to perform.
6. End the FUNCDEF definition.
7. Repeat steps 4 through 6 for all the subordinate FUNCDEFs.
8. Create a main FUNCDEF that calls the subordinate FUNCDEF.
Creating a modular DLP instead of a DLP that is made up of only one FUNCDEF has thefollowing advantages:
n Because the number of characters for a FUNCDEF definition is limited to a maximum of 2047characters, you must change a large FUNCDEF into smaller FUNCDEFs if its size exceeds2047 characters.
n Modular DLPs are easier to write, read, and find problems within the DLP
It is also easier to read and find problems in a program that has a comments added to it. Forexample, adding the file name, the date of the last revision, and the author’s name help keep aconsistent program structure and make it easier to modify the DLI? The following program isan example of a modular DLP with the recommended program structure.
Example
Notice that the program has a main FUNCDEF that calls the five subordinate FUNCDEF’s(SPANONE, S-PANTWO, S-PANTHREE, SPANFOUR, and C-HECK). Each of the fiveFUNCDEFs is called from the main FUNCDEF, E-XAMPLE. Line 560 assigns the DLP to softkey2, so the function can be executed by pressing (-1, User Menus , EX&MPLE .
The example uses descriptive labels and flows in a logical fashion, making the DLP easier tounderstand. In addition, the use of subordinate FUNCDEFs makes the DLP easier to modifybecause one FUNCDEF can be changed without having to modify the main FUNCDEF or otherFUNCDEFs. For example, if the application requires the stop frequency of the last span toextend to 4 GHz, simply change the stop frequency (FB 11OMHZ) in SPANFOUR to a stopfrequency of 4 GHz (FB 4GHZ).
Creating and Using Downloadable Programs 4-7

File name
Date and author'sname
Program Description
Define variable
Define trace
DefineFUNCDEF
DefineFUNCDEF
DeAneFUNCDEF
DefineFUNCDEF
DeEneFUNCEDEF
Define MainFUNCDEF
10 !File name: EXAMPLE
20 !Date: 9/l/88 Author: Jane Doe
30 !Description of the program: This program checks for40 !signals above -50 dEim in the following frequency50 !spans: 10 to 12 MHz, 12 to 14 MHz,60 !I4 to 16 MHz, and 16 to 110 MHz. If a70 !signal is found, it autozooms to80 !I MHz span, records the signal90 !level, and displays the highest frequency100 !signal found in trace B.
110 OUTPUT 7lB;"VARDEF P-DWER,O;"; ! Defines a variable named120 ! "P-OWER" and initialize it to zero.
130 OUTPUT 7lB;"TRDEF S-AVE.401;"; ! Defines a trace.
140 ! Subordinate FDNCDEFs:150 OUTPUT 7lB;~FGNCDEF S-PANONE.0"; !Defines a function.160 OUTPUT 7lB;"FA 1OMHZ;FB 12MHZ;"; !Set the start and stop170 ! frequencies.180 OUTPUT 71B*~~0*1~; Ends the function., ,190 OUTPUT 718;"FIJNCDEF S-PANTWD,O;"200 OUTPUT 719;"FA 12MHZ;FB 14MHZ;";210 OUTPUT 7ia-w-~~-
220 DIJTPDT 7lB;"F;NCDEF S-PANTHREE.0";230 DUTPUT 7lB;"FA 14MHZ;FB IGMHZ;";240 OUTPUT 718*"0*".250 OUTPUT 7 18 I"&CDEF S-PANFDUR,cD";
260 OUTPUT 718;"FA 16MHZ;FB IIOHHZ;";270 OUTF'UT 718*"0~"*280 OUTPUT 718 I VT&DEF c3zcK ,0” ;290 OUTPUT 7lS;"TS;MKPK HI;"; ! Places a marker on295 ! highest signal.300 OUTPUT 718;"IF MKA,GT,-50 THEN 'I; ! If the signal is higher310 OUTPUT 7lS;"MKTRACK ON;"; ! than -5OdBm, zoom to 1 MHz320 OUTPUT 71B;1SP IMHZ;"; ! span, center it and bring it330 DUTPUT 7lB;"MKTRACK 0FF;TS;"; ! to the reference level.340 OUTPUT 718;"'MKPK HI;MKCF;TS;"; ! Store it in a 4Ol-point350 OUTPUT 718;"RKRL;TS;"; ! trace previously defined as360 DIJTPUT 718;"MOV P-OWER,MKA;"; ! having the label, "S-AVE".370 OUTPUT 718;"MOV S-AVE,TRA;"; ! Save the control settings380 OUTPUT 7lS;"SAVES I;"; ! in register 1.390 OUTPUT 7lB;"ENDIF-I'* ! End the IF statement.400 OUTPUT 7ia-“o.fl-410 ! Main FDNCDEF
, I End the definition of C-HECK."
420 OUTPUT 718;"FUNCDEF E-XAMPLE,O"; ! Begins the main program.430 OUTPUT 7lS;"IP;SNGLS;MOV S-AVE,O;"; ! Places the analyzer in440 ! single-sweep mode and set all values in "S-AVE" to zero.450 OUTPUT 718;" REPEAT ";460 OUTPUT 718;" S-PANONE;C-HECK;";470 OUTPUT 718;t' S-PANTWD;C-HECK;"; ! Checks each span or a480 OUTPUT 7ia;” S-PANTHREE;C-HECK;"; ! signal greater than -50 dBm.490 OUTPUT 718;" S-PANFOUR;C-HECK;"; ! Repeat sequence until a500 OUTPUT 718;"UNTIL S-AVE[O],NE,O;"; ! non-zero value is found in510 OUTPUT 718;"MDV TRB,S-AVE;"; ! S-AVE. It then displays the located520 OUTPUT 718;"RCLS 1;BLANK TRA;VIEW TRB;"; ! signal in trace B,530 OUTPUT 7ia.l~0.lfl- ! and recalls the analyzer settings540 ! that exiited 6hen the signal550 ! was found. E-XAMPLE is assigned560 OUTPUT 7lS;"KEYDEF 2,E_XAMPLE,%EXAMPLE%;"; ! to softkey 2 so the570 END ! program may be executed from the front panel.
4-8 Creating and Using Downloadable Programs

Executing a DLPThis section contains information about how to execute a DLP This section contains thefollowing procedures:
n Execute the DLP by using a softkey.H Execute the DLP within a program.
To Execute a DIP by Using a SoftkeyThere are two ways to execute a DLP. You can execute the DLP by pressing a softkey that hasbeen assigned a function as shown in this procedure, or execute the DLP within a program(shown in the following procedure).
1. Use the KEYDEF command to assign the function that you created with the FUNCDEFcommand to a softkey.
2. Press (j-J, User Menus to access the softkey.
ExampleThe following example uses the KEYDEF command to assigns the ZBOM function to softkey 1.
10 OUTPUT 718;"KEYDEF 1, Z-OOM,%CAL SIGIZOOM%;"; Assigns thefunction Z-OOMtosoflkey 1 and assigns sofikey 1the label “CAL SIG ZOOM. ”
20 LOCAL 71830 END
You can access CAL SIG 2DOM by pressing (-1, User Menus .
lb Execute the DLP within a ProgramYou can also execute the DLP within a program.
w Use the name of the DLP within a program.
ExampleThe following programming line executes the Z-OOM function from an external controller.
OUTPUT 718;"Z-0OM;"
Creating and Using Downloadable Programs 4-9
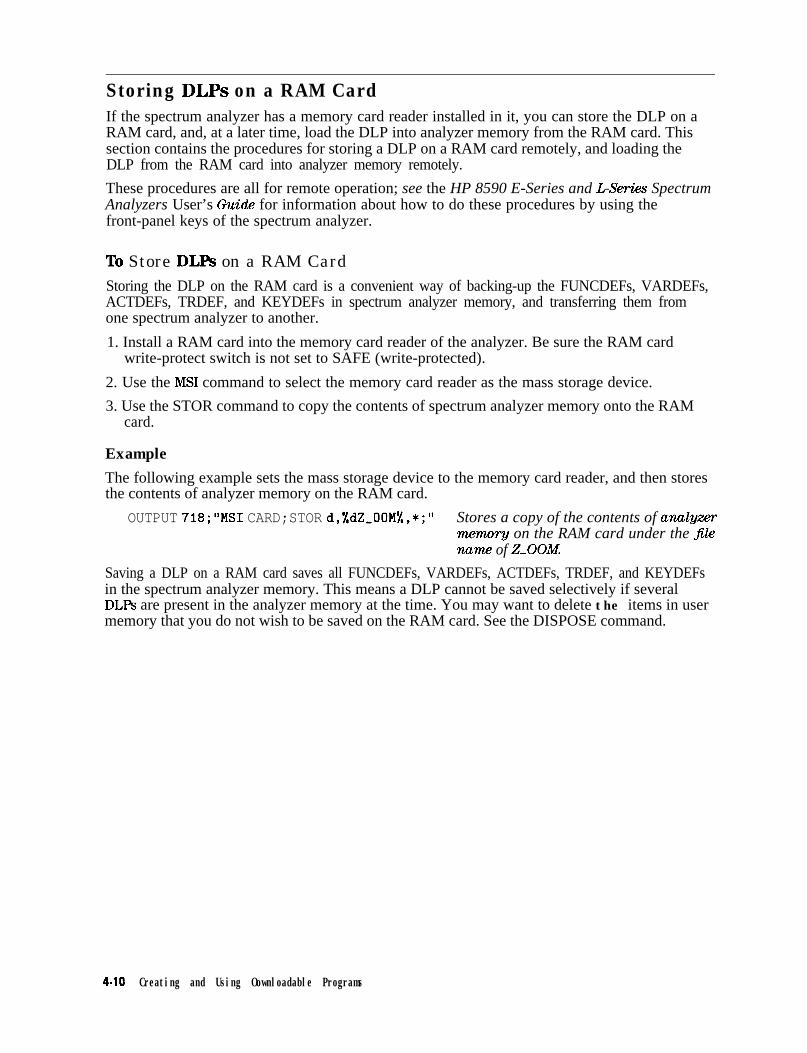
Storing DLPs on a RAM CardIf the spectrum analyzer has a memory card reader installed in it, you can store the DLP on aRAM card, and, at a later time, load the DLP into analyzer memory from the RAM card. Thissection contains the procedures for storing a DLP on a RAM card remotely, and loading theDLP from the RAM card into analyzer memory remotely.
These procedures are all for remote operation; see the HP 8590 E-Series and LSeries SpectrumAnalyzers User’s Guide for information about how to do these procedures by using thefront-panel keys of the spectrum analyzer.
To Store DLFs on a RAM CardStoring the DLP on the RAM card is a convenient way of backing-up the FUNCDEFs, VARDEFs,ACTDEFs, TRDEF, and KEYDEFs in spectrum analyzer memory, and transferring them fromone spectrum analyzer to another.
1. Install a RAM card into the memory card reader of the analyzer. Be sure the RAM cardwrite-protect switch is not set to SAFE (write-protected).
2. Use the MS1 command to select the memory card reader as the mass storage device.
3. Use the STOR command to copy the contents of spectrum analyzer memory onto the RAMcard.
Example
The following example sets the mass storage device to the memory card reader, and then storesthe contents of analyzer memory on the RAM card.
OUTPUT 718;"MSI CARD;STOR d,%dZ,OOM%,*;" Stores a copy of the contents of analyzermemory on the RAM card under the .filename of Z-OOM.
Saving a DLP on a RAM card saves all FUNCDEFs, VARDEFs, ACTDEFs, TRDEF, and KEYDEFsin the spectrum analyzer memory. This means a DLP cannot be saved selectively if severalDLPs are present in the analyzer memory at the time. You may want to delete the items in usermemory that you do not wish to be saved on the RAM card. See the DISPOSE command.
4-10 Creating and Using Oownloadable Programs

To Load DLPs from a Memory Card into Analyzer MemoryOnce a DLP has been stored on a RAM card, it can be loaded back into spectrum analyzermemory when desired. DLPs remain in spectrum analyzer memory until disposed of with theDISPOSE command, ERASE command, or ERASE DLP MEM.
1. To load a DLP from a RAM or ROM card into analyzer memory, insert the memory card intothe memory card reader.
2. Use the MS1 command to select the memory card reader as the mass storage device.
3. Use the LOAD command to copy the contents of the RAM card file into spectrum analyzermemory.
Example
The following example sets the mass storage device to the memory card reader, and then copiesthe contents of RAM card file called Z-OOM into spectrum analyzer memory.
OUTPUT 718;"MSI CARD;LOAD %dZ-OOMX;" Loads a copy of Z-OOM from the RAM cardinto spectrum analyzer memory.
Note that loading does not dispose of any DLPs which were in memory before the load wasexecuted.
Creating and Using Downloadable Programs 4.11

Determining the Amount of Memory Needed for a DLPFUNCDEFs, user-defined variables, user-defined traces, on event commands (for example,ONSRQ, ONEOS, and TRMATH), and user-defined softkeys all consume some amount ofspectrum analyzer memory. If you write a large DLP, or if you have a several DLPs stored inspectrum analyzer memory, you may run out of spectrum analyzer memory that is availablefor storing the DLPs. Also, the storage space on a RAM card is finite. If you are creating largeDLPs, you may need to determine the amount of spectrum analyze memory the DLP requiresand delete unused items from spectrum analyzer memory. This section contains the proceduresfor the following:
n Determining the available amount of spectrum analyzer memory or RAM card space.
w Delete a DLP from spectrum analyzer memory or a RAM card.
To Determine Available Analyzer MemoryBecause the amount of analyzer memory available for user-defined functions is limited, it maysometimes be necessary to determine the amount of analyzer memory available.
w Use the MEM command to determine the available analyzer memory remotely.
Example
10 OUTPUT 718*"MEM'-"-20 ENTER 718;iemor;'
8 Lleternaines the available analyzer memory.Stores the available analyzer menzory value in the vari-able memory.
30 PRINT "MEMORY = Mm,Memory Prints the amount of analyzer memory.40 END
If you are sure that the amount of memory that a DLP requires will not exceed the amountof spectrum analyzer memory available, you can download the DLP into analyzer memoryand then execute the previous program again. The amount of analyzer memory that the DLPrequires is the difference between the value that MEM? returned before the DLP was loadedinto analyzer memory and the value MEM? returned after the DLP was loaded into analyzermemory.
If the amount of memory that a DLP requires could exceed the amount of spectrum analyzermemory available, you should delete any unnecessary variables, traces, or FUNCDEFs or onevent commands from spectrum analyzer memory. See “To Delete a DLP from SpectrumAnalyzer Memory” for more information.
To Determine the Amount of Space on a RAM Card‘lb save a DLP on a RAM card, it may be necessary to determine the amount of space availableon the RAM card. To determine the amount of space on a RAM card, you must do thefollowing:
1. Catalog the memory card.
2. Determine the total number of records for the RAM card. The total number of records onthe RAM card is displayed when cataloging the card (see Figure 4-l). The number of recordson the RAM card is determined by dividing the memory capacity of the RAM card by 256(because the records are 256 bytes long). For example, if the RAM card has a capacity of32K bytes (which is equal to 32 x 1024), the total number of records on the RAM card is 128(32,768 divided by 256).
4-12 Creating and Using Downloadable Programs

3. Determine the number of records on the RAM card that are in use. The number of recordsstored on the RAM card can be determined by cataloging the card, finding the startingrecord address for the last catalog entry, adding the number of records used for the lastcatalog entry to the starting record address, and then subtracting one.
4. Subtract the number of records stored (determined in step 3) from the total number ofrecords available (determined in step 2) to determine the number of unused records on theRAM card.
Example
Figure 4-l shows that the number of records on the RAM card that are in use is 53 (35 + 19 -1 = 53), and the total number of records available are 128. The number of unused records onthe RAM card is 75 (128 - 53 = 75).
0 1
47REF \. 0 d0m ATTEN 1 0 dBPEAK HP859X 1 2 8
E.14:11:28 OCT 1 5 , 1 9 9 1
T R A C E 1 0 14:14:07 OCT 15, 1 9 9 1dB/ tTRANSD-3 T R A C E 1 5 E 14:16:03 OCT 1 5 , 1 9 9 1
tTRANSD-4 T R A C E 2 0 14:17:23 OCT 1 5 , 1 9 9 1t - 1 T R A C E 2 5 09:38:44 OCT 1 7 , 1 9 9 1
T R A C E 3 0i
12:54:56 OCT 17, 1 9 9 1D S P L Y 3 5 1 9 17:00:18 FEB 2 8 , 1 9 9 2
/
SA S BSC FC
CORRE x i t
Catalog
P r e v i o u sMenu
UBW 1 M H zS P A N 6 . 5 0 0 8Hz
S W P 1 3 0 msec RT
Figure 4-1. Determining the Number of Records
Table 4-1. Cataloging a RAM Card
LOhDF I L E
DELETEF I L E
Index Description
1 Total number of records.
2 Number of records for the last catalog item.
3 Starting record address for the last catalog entry.
4 The last cataloa entrv.
Creating and Using Downloadable Programs 4-13

‘lb Delete a DIP from Spectrum Analyzer Memory
w Use the DISPOSE command to delete the DLP item from spectrum analyzer memory.
A FUNCDEF can be deleted from analyzer memory remotely by using the DISPOSE command.The DISPOSE command can also be used to remove softkey functions, user-defined variables,and user-defined traces. (See the description for the DISPOSE command in Chapter 5 for moreinformation.)
ExampleTo remove the FUNCDEF called Z-OOM from analyzer memory, you would execute thefollowing command:
OUTPUT 718;"DISPOSE Z,OOM;";
Use DISPOSE ALL to remove all FUNCDEFs, user-defined traces, limit-lines, and user-definedvariables from analyzer memory. For example, OUTPUT 718 ; "DISPOSE ALL ; I' ; (ERASE DLP MEMis equivalent to DISPOSE ALL.)
lb Erase the DLP from a RAM Card
H Select the memory card as the mass storage device by using the MS1 command, and then usethe PURGE command to delete a specific file from the RAM card.
Example‘Ib delete the file called Z-OOM from the RAM card, you would execute the followingcommand:
OUTPUT 718;"MSI CARD;PURGE %dZ-OOMX;"
4-14 Creating and Using Downloadable Programs

Using the DLP EditorThe DLP editor functions allow you to create or modify a DLP with only an external keyboardconnected to the spectrum analyzer (an external controller is not required). This sectioncontains the following procedures:
n Connect the external keyboard to the spectrum analyzer.n Access the DLP editor functions.n
n Use the DLP editor functions to modify a DLPw Use the DLP editor functions to modify a catalog item.
The external keyboard can also be used to enter screen titles and remote programmingcommands; see the HP 8590 E-Series and L&&es Spectrum Anulgwrs User’s Guide for moreinformation.
lb Connect the External Keyboard to the Spectrum Analyzer
Caution The analyzer must be turned off before connecting an external keyboard tothe spectrum analyzer. Failure to do so may result in loss of factory-installedcorrection constants.
1.
2.
3.
4.
Turn off the spectrum analyzer.
Connect an HP Cl405 Option 002 (or Option 003) cable from the spectrum-analyzerrear-panel connector EXT KEYBOARD to the HP C1405A Option ABA keyboard.
Press m to turn the spectrum analyzer on.
Place the template for the external keyboard on the external keyboard.
SPECTRUM ANALYZER
Figure 4-2. Connecting the External Keyboard to the Spectrum Analyzer
You can now use the external keyboard to enter or modify a DLP with the DLP editor, enter ascreen title, enter programming commands, or enter a prefix.
Creating and Using Downloadable Programs 4-l 5

‘Ib Access the DLP Editor
. Press (SAVE) or (RECALL), then INTERNAL CARD (so that INTERNAL is underlined),Catalog Internal , CATALOG ALL, and then Editor.
Press IPause) on the external keyboard.
Editor or m accesses the DLP editor. There are some differences between using Editorand IPause) however. Editor allows you to access all the DLP editor softkeys (EDIT LAST,
EDIT CAT ITEM , APXD CAT ITEM , SAVE EDIT, and NEW EDIT ). With (Pause), you can onlyaccess EDIT LAST, SAVE EDIT , and NEW EDIT . m allows you to change between the DLPeditor functions and the “keyboard entry” functions such as entering programming commands,screen title, and prefix.
With the external keyboard connected to the spectrum analyzer, you can use the function keys(Fl through F6) of the external keyboard to accesses the softkeys of the spectrum analyzer. Forexample, you could press Fl to access the first softkey, F2 to access the second softkey, and soforth.
/ie7REF . 0 dBm ATTEN 1 0 dBPEAKLOG
%
SA sSC F
COR
S-PANONES-PANFOURE-XAMPLES-PANTWOS-PANTHREEA-MPFUNC
KEYIKEY#l
B A-MPC T-RACEAR S-AVE
P-OWER
2 4 0 6
t91 8 24 0
EDITLAST
E D I T CFITITEM
APND C A TITEM
SAVEEDIT
NEWEDIT
C E N T E R 3 . 2 5 0 GHzRES BW 3.0 MHz VBW 1 MHz
P r e v i o u sMenu
S P A N 6 . 5 0 0 GHzSWP 130 mseo RT
Figure 4-3. Accessing the DLP Editor
4-16 Creating and Using Downloadable Programs

To Create a DLP
1* Press HEW EDIT, NEW EDIT to enter an individual DLP item (FUNCDEF, VARDEF, orTRDEF) into the buffer of the DLP editor.
2. Use the external keyboard keys to enter the DLP item. Because you are not using anexternal computer, the spectrum analyzer commands are entered without an OUTPUT orPRINT statement preceding them.
While using the DLP editor, you may want to use the “typing keys.” The typing keys are thefunction keys F7 through F12. The typing keys automatically place the command mnemonicat the position of the cursor on the spectrum analyzer display. The commands accessed bythe typing keys are shown at the bottom of the spectrum analyzer display; you can usethe (Page] and (Page] keys of the external keyboard to access different commandmnemonics.
3. When the DLP item has been entered and you want it executed, press SAVE EDIT.
SAVE EDIT executes the contents of the DLP editor buffer as remote commands, and whenexecuting a FUNCDEF, will result in the FUNCDEF present in spectrum analyzer memoryunder the name given for the user-defined function. If you do not want to save the DLP,press WEW EDIT, WEW EDIT to clear the screen.
The buffer for the DLP editor is limited to 2500 characters, however, DLP items are limited to amaximum of 2047 characters.
For example, if you use the DLP editor to enter the Z-OOM function, the spectrum analyzerdisplay would look as follows:
I FU
E d i t i t e m m e m o r y s i z e = 5 0 T o t a l m e m o r y = 2 5 0 0
F U N C D E F Z-OOM>CIP:CF 300MHZ:SP 10MHZ:TS:MKPK H I :
D E F nl ‘JARDEF I K E Y D E F I I ELSE I E‘7 F8 F9 ::0 Fll
Figure 4-4. Entering a DLP
EDITLAST
SAVEE D I T
NEWE D I T
E x i tE d i t
)IF: I‘12 L
Creating and Using Downloadable Programs 4-17

lb Modify the DLP
1. If necessary, press m to reenter the DLP editor.
2. If the DLP is not displayed, press EDIT LAST to display the previous contents of the DLPeditor.
3. Use the external keyboard keys to edit the DLP. Because you are not using an externalcomputer, the spectrum analyzer commands are entered without an OUTPUT or PRINT ’statement preceding them.
4. When the DLP has been entered, press SAVE EDIT . SAVE EDIT executes the DLP inspectrum analyzer memory. If you do not want to execute the DLP, press NEW EDIT ,
MEI4 EDIT to clear the screen.
4-l 8 Creating and Using Downloadable Programs
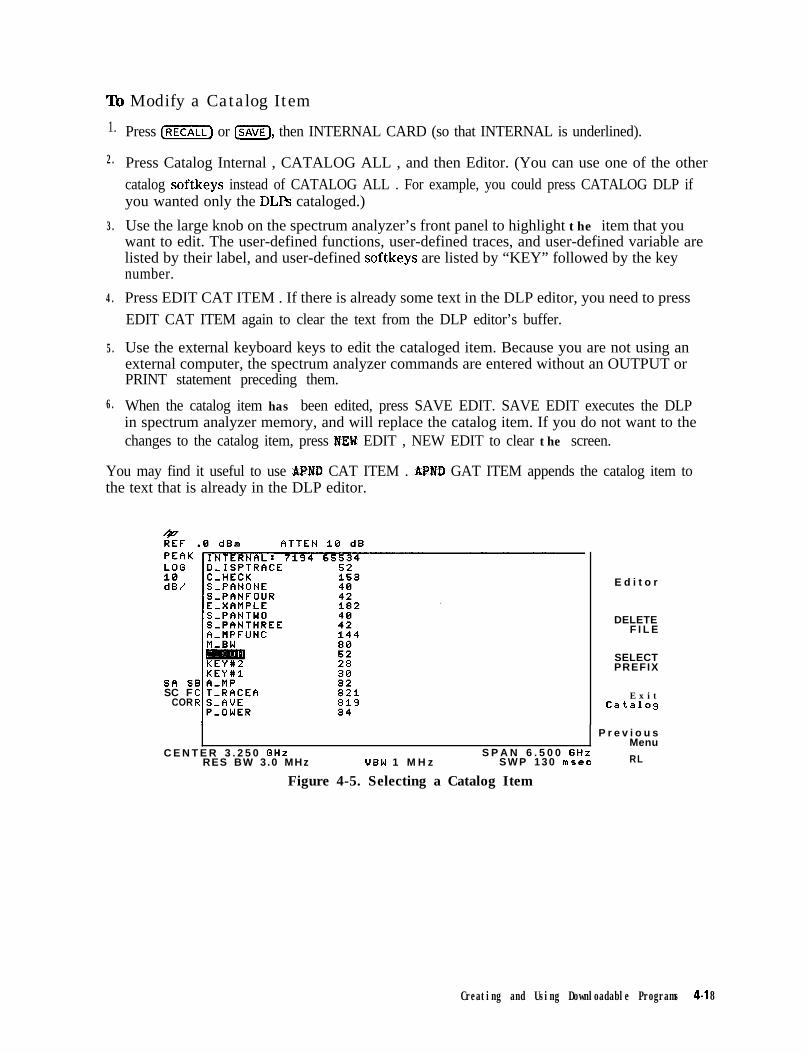
‘lb Modify a Catalog Item
1.
2.
3.
4.
5.
6.
Press (‘1 or m, then INTERNAL CARD (so that INTERNAL is underlined).
Press Catalog Internal , CATALOG ALL , and then Editor. (You can use one of the othercatalog softkeys instead of CATALOG ALL . For example, you could press CATALOG DLP ifyou wanted only the DLPs cataloged.)
Use the large knob on the spectrum analyzer’s front panel to highlight the item that youwant to edit. The user-defined functions, user-defined traces, and user-defined variable arelisted by their label, and user-defined softkeys are listed by “KEY” followed by the keynumber.
Press EDIT CAT ITEM . If there is already some text in the DLP editor, you need to pressEDIT CAT ITEM again to clear the text from the DLP editor’s buffer.
Use the external keyboard keys to edit the cataloged item. Because you are not using anexternal computer, the spectrum analyzer commands are entered without an OUTPUT orPRINT statement preceding them.
When the catalog item has been edited, press SAVE EDIT. SAVE EDIT executes the DLPin spectrum analyzer memory, and will replace the catalog item. If you do not want to thechanges to the catalog item, press HEW EDIT , NEW EDIT to clear the screen.
You may find it useful to use APND CAT ITEM . APED GAT ITEM appends the catalog item tothe text that is already in the DLP editor.
sfl sSC F
COR
E d i t o r
DELETEF I L E
SELECTPREFIX
E x i tCatal
C E N T E R 3 . 2 5 0 GHzRES BW 3.0 MHz UBW 1 M H z
P r e v i o u sMenu
S P A N 6 . 5 0 0 GHzS W P 1 3 0 msec RL
Figure 4-5. Selecting a Catalog Item
Creating and Using Downloadable Programs 4-l 8

DLP Programming GuidelinesThis section contains some suggestions that can make it easier to write a DLP, read andunderstand the DLP code, and find problems in a DLP.
lb Make the DLP More ReadableHere are a few suggestions which help make any program, including a DLP, more readable:
n Write short program lines. One or two commands per line.
n Use standard indent format for looping and branching.
n Use descriptive variable names and labels. ,
n Add comments to the source code.
n Make the program modular.
lb Find Problems in a DLPMore often than not, new programs do not work as they were intended to work. In DLPs,problems (also referred to as bugs) may appear in any of the following ways:
n As an error message displayed on the analyzer screen.
n The DLP does the unexpected. For example, it halts execution, or enters an infinite loop, orstarts executing before its start-execution command occurs.
n As an unexpected or out-of-range result or value is obtained.
Some suggestions for find a problem in a DLP are as follows:
n Follow the suggestions in “To make the DLP more readable. ”n Check that each function has matching delimiters, be careful with nested delimiters.n Check that the commands within the DLP are spelled correctly, contain spaces where
indicated by the syntax diagram for the command, and are terminated by a semicolon.n You can use the DLP editor to inspect the contents of the DLP before you execute it. The
DLP editor shows what characters the spectrum analyzer will use when executing the DLP.This can be helpful for finding omitted spaces.
n Test FUNCDEFs individually. Comment out the calls to the other FUNCDEFs in the mainFUNCDEF, if necessary.
4-20 Creating and Using Downloadable Programs

If a DLP causes the spectrum analyzer not to respond normally (for example, the spectrumanalyzer seems to be in an infinite loop or an error message is displayed), try one or all of thefollowing suggestions:
n Press [PRESET].
n Press I-), More I of 3 , ERASE DLP MEM , ERASE DLP ME!! . (ERASE DLP MEM requiresa double key press and deletes any DLPs from spectrum analyzer memory.)
n Turn the spectrum analyzer off and then back on.
If the spectrum analyzer is still not responding, you should do the following:
n For a spectrum analyzer with Option 021 installed in it, execute the following program line:
SEND 7;UNL MTA LISTEN 18 CMD 12 This semis a command to the spectrum ana-lyzer instructing it to delete any DLA and usw-d@rwd variables from spectrum analyzer memory.
Note If the spectrum analyzer is not at address 18, change the number 18 in theprevious program line to the spectrum analyzer’s current address.
n For a spectrum analyzer with Option 023 installed in it, execute a break, and then press@GKZJ More i of 3 , ERASE DLP MEM , ERASE DLP MEN . (ERASE DLP MEM requires adouble key press.)
Creating and Using Downloadable Programs 4-21

5Programming Commands
What You’ll Learn in This ChapterThis chapter is a reference for the HP 8590 Series spectrum analyzer command language. It is acommand dictionary; commands are listed alphabetically.
To find a programming command that performs a particular function, first refer to thefunctional index (‘lkble 5-4) where commands are categorized by function. Once the desiredcommand is found in the functional index, refer to the description for the command in thischapter.
This chapter includes the reference tables listed below:
n ‘lhble 5-1, Syntax Elements.
n ‘Ihble 5-2, Characters and Secondary Keywords (Reserved Words).
n ‘Ihble 5-3, Summary of Compatible Commands.
n Table 5-4, Functional Index.
Programming Commands 5-l

Syntax ConventionsCommand syntax is represented pictorially.
CHARACTER OR REPEAT I NGCOMMAND SECONDARY SYNTAX SYNTAXMNEMON I C KEYWORD ELEMENT ELEMENT
RECOMMENDED OPT I ONALPATH
TERMINATOR
cul14e
Figure 5-1. Command Syntax Figure
n Ovals enclose command mnemonics. The command mnemonic must be entered exactly asshown.
w Circles and ovals surround secondary keywords or special numbers and characters. Thecharacters in circles and ovals are considered reserved words and must be entered exactly asshown. See Iable 5-2.
w Rectangles contain the description of a syntax element defined in ‘lhble 5-l.
n A loop above a syntax element indicates that the syntax element can be repeated.
w Solid lines represent the recommended path.
n Dotted lines indicate an optional path for bypassing secondary keywords or using alternateunits.
n Arrows and curved intersections indicate command path direction.
n Semicolons are the recommended command terminators. Using semicolons makes programseasier to read, prevents command misinterpretation, and is recommended by IEEE Standard728.
Note Uppercase is recommended for entering all commands unless otherwise noted.
5-2 Programming Commands

Syntax Elements are shown in the syntax diagrams as elements within rectangles.
‘Ihble 5-1. Syntax Elements
Syntax Component
analyzer command
DellnitionlRange
Any spectrum-analyzer command in this chapter, with required parameters andterminators.
character S,! “#S%&‘()+ ,/0123456789: ; A B C D E F G H I J K L M N O P Q R S TLJVWXYZ[\)? -‘abcdefghijklmnopqrstuvwxyz(Charactersareasubset of data byte.)
character & EOI 8-bit byte containing only character data and followed by end-or-identify (EOI)condition, where the EOI control llne on HP-IB is asserted to indicate the end of thetransmission. END signifies the EOI condition.
character string
data byte
data byte & EOI
A list of characters.
8-bit byte containing numeric or character data.
8-bit byte containing numeric or character data followed by end-or-identify (EOI)condition, where the EOI control line on HP-IB is asserted to Indicate the end of thetransmission. END signifies the EOI condition.
delimiter -I\@=/-$%;!‘: w&zMatching characters that mark the beginning and end of a character string, or a list ofuser-defined functions or spectrum analyzer commands. Choose delimiting charactersthat are not used within the string they delimit.
digit
lsb length
0 1 2 3 4 5 6 7 8 9
Represents the least significant byte of a two-byte word that describes the number ofbytes returned or transmitted. See msb length.
msb length Represents the most significant byte of a two-byte word that describes the number ofbytes returned or transmitted. See lsb length.
number Expressed as integer, decimal, or in exponential (E) form. Real Number Range: f1.797693134862315 x 1tio8, including 0.
Up to 15 signllicant figures allowed.Numbers may be as small as f 2.225073858507202 x 1O-3o8
output termination
Integer Number Range: -32,768 through + 32,767
Carriage return (CR) and line feed (LF), with end-or-identify (EOI) condition. ASCIIcodes 13 (carriage return) and 10 (line feed) is sent via HP-IB, then the end-or-identifycontrol line on HP-IB sets to indicate the end of the transmission.
predefined function ACTVF, AMPLEN, BITF, CNTLI, CORREK, DONE, HAVE, HN, LIMIFAIL, MEAN,MEANTH, MEM, MINPOS, MKBW, PEAKS, PKPOS, PWRBW, REV, RMS, SER, STB,STDEV, SUM, SUMSQR, TRCMEM, VARIANCE.
A predellned function is an analyzer command that returns a number that can beoperated on by other spectrum analyzer commands. Insert a predefined function intoa command statement where predefined function appears in the command syntaxchart.
If a predefined function takes a parameter (for example, PKPOS TRA), it can be usedonly as the last parameter of an spectrum analyzer command that has two or morepredelined functions as parameters. For example, MPY VAR,PKPOS TRB,HAVE CARD;is illegal, but MPY V-AR,DONE,HAVE CARD; is not.
Programming Commands 5-3

Syntax Component
predeflned variable
‘able 5-1. Syntax Elements (continued)
Definition/Range
The values of the following variables change depending on the current instrumentsettings. Each variable represents the value of the command function that has thesame name as the variable.
trace element
AMB, AMBPL, ANLGPLUS, ANNOT, AT, BAUDRATE, CF, CNTLA, CNTLB, CNTLC,CNTLD, COUPLE, CRTHPOS, CRTVPOS, DATEMODE, DET, DL, DOTDENS, FA, FB,FMGAIN, FOFFSET, GATE, GATECTL, GD, GL, GP, GR, GRAT, INZ, LG, LIMIDISP,LIMIMODE, LIMIREL, LIMITEST, MEASURE, MENU, MF, MKA, MKACT, MKF, MKFCR,MKN, MKNOISE, MKP, MKPAUSE, MKPX, ML, MKTRACK, MODE, MSI, NRL,POWERON, PREAMPG, PRNTADRS, PSTATE, RB, RL, RLPOS, ROFFSET, SAVRCLN,SETDATE, SETTIME, SP, SQLCH, SRCALC, SRCAT, SRCNORM, SRCPOFS, SRCPSTP,SRCPSWP, SRCPWR, SRCTK, SS, ST, SWPCPL, SYNCMODE, TH, TIMEDATE, TIMEDSP,TVLINE, TVSFRM, TVSYNC, TVSTND, VB, VBR, WINZOOM, ZMKCNTR, ZMKSPAN.
Value contained in one trace point. Notated as TRA[N] where N specifies the pointposition ln the trace array. Values for N are 1 to 401 (for traces A, B, C) or 1 to 2047(for traces specified by TRDEF). The same values apply to trace B (TRB[N]), trace C(TRC[N]), and user-defined traces (LABEL[N]).
trace range Values contained in trace segment. Multi-point segments are notated as TRA[N,M],where N and M are end points of a segment and specify point positions in trace array.Values for N or M are 1 to 401 (for traces A, B, C), or 1 to the length of a trace asspecified by TRDEF. The same values apply to trace B (TRB[N,M]), trace C (TRC[N,M]),and user-defined traces (LABEL[N,M]). Single-point segments are notated the same asthe trace element above.
units
user-defined function
Represent standard scientific units.
Frequency Units: GHZ or GZ, MHZ or MZ, KHZ or KZ, HZ
Amplitude Units: DB, DM, DBMV, DBUV, V, MV, UV, W, MW, UW
Time Units: SC, MS, US
Current Units: A, MA, UA
Impedance Units: OHM
A label 2 to 11 characters long that is defined by the FUNCDEF command. Choice ofcharacters is A through Z and the underscore (-). The underscore should be used as thesecond character of the label. Omitting the underscore, or using the underscore asother than the second character in a label, is not recommended.
user-defined trace
user-defined variable
A label 2 to 11 characters long that is defined by the TRDEF command. Choice ofcharacters is A through Z and the underscore(-). The underscore should be used as thesecond character of the label. Omitting the underscore, or using the underscore asother than the second character in a label, is not recommended.
A label 2 to 11 characters long that is defined by the VARDEF or ACTDEF command.Choice of characters is A through Z and the underscore(-). The underscore should usedas be the second character of the label. Omitting the underscore, or using theunderscore as other than the second character in a label, is not recommended.
5-4 Programming Commands

In the syntax diagrams, characters and secondary keywords are shown within circles or ovals.Characters and secondary keywords must be entered exactly as shown.
‘lhble 5-2. Characters and Secondary Keywords (Reserved Words)
Element
a
A
ABSHZ
AC
ALLAM
AMP
AMPCOR
AUTO
AVG
B
BOTH
BW
CARD
CNT
COLOR
d
DB
DBM
DBMV
DBUV
DC
DELTA
DISP
DLP
DM
DMY
DN
DUMP
EDGE
EP
EQEVENEXT
FADC
FETCH
FFT
FIXED
FLAT
FLATTOP
FMD
Description
Amplitude correction factors.
Amp (unit) or A-block data field.
Absolute Hz (unit).
Alternating current.
All.Amplitude modulation.
Amplitude.
Amplitude correction,
Auto couple or set to automatic.
Average.
b-bit byte or binary format.
Both odd and even frames trigger.
Black and white.Memory card.
Counter-lock.Color.
Downloadable programs.
Decibel (unit).
Absolute decibel milliwatt (unit).
Decibel millivolt (unit).
Decibel microvolt (unit).
Direct current.
Delta.
Display.
Downloadable program.
Absolute decibel milliwatt (unit).
Day, month, year format.
Decreases parameter one step size.
Dump.
Triggers on the edge of the trigger input.
Pauses program for data entry from spectrum analyzer front panel.
Equal to.
Even video frame.
External trigger.
Fast analog-to-digital converter (ADC).
Fetch.Fast Fourier transform.
Fixed.
Flat.
Flat top filter window.
Frequency modulation demodulator.
Programming Commands 5-5

‘Ihble 5-2.Characters and Secondary Keywords (Reserved Words) (continued)
Element Description
FM Frequency modulation.
FMV Frequency modulation detection.
FREE Free run.
FREQ or FRQ Frequency.
GATE Gate.
GE Greater than or equal to.
GHZ Gigahertz (unit).
GT Greater than.
GZ Gigahertz (unit).
HANNING Harming filter window.
HI Highest.
HPIB HP-IB.
HZ Hertz (unit).
I I-block data Eeld.
i Display image file.
[NIT Initialize.
[NT Internal or integer.
IP Instrument preset.
[ST Inverse sweep time.
K Free Eeld ASCII format with no terminator.KC Free field ASCII format with “CR” an “LF” terminator.
KHZ Kilohertz (unit).
KL Free field ASCII format with “CR” an “END” terminator.
KZ Kilohertz (unit).
1 Limit line.
LAST Last state.
LE Less than or equal to.
LEVEL Level gating.
LIMILINE Limit line.LINE Line trigger.
LOAD15 Loads the values for the horizontal and vertical position of the spectrum analyzer.
LOWER Lower limit line.
LT Less than.
M Measurement units.
MA Milliamp (unit).
MDY Month, day, year format.
MHZ Megahertz (unit).
MS Millisecond (unit).
MTR Meter.
MV Millivolts (unit).
MW Milliwatt (unit).
MZ Megahertz (unit).
NE Not equal to.
NEG Negative.
NH Next highest peak.
NL Next peak left.
5-5 Programming Commands

‘Ikble 5-2.Characters and Secondary Keywords (Reserved Words) (continued)
Element
NONENR
NRM or NORMALNTSC or NTSClS
OA
ODD
OFF
ONP
PAL or PAL15PALM
PERPKAVG
PKPIT
POINT
POS
PSN
RECALL
RS232
S
SA
SAVE
SC
SECAML
SLOPE
SMP
SP
SR
STATE
STEP
STORE
SWT
t
TG
TRATRB
TRC
TV
UA
UNIFORMUP
UPLOW
UPPER
us
u v
u w
Description
No units.Next peak right.
Normal.NTSC video format.
Output amplitude.
Odd video frame trigger.
Turns off function.
Turns on function.
Parameter units.
PAL video format.PAL-M video format.
Period.Peak average.
Peak pit.
Point.
Positive.Position.
Recall operation.
RS-232 interface.
State.Signal analysis.
Save operation.
Seconds (unit).
SECAM-L video format.
Slope.
Sample detection mode.
Space.
Stimulus response.
State register.
Step key ability.
Store.Sweep time.
Trace.Tracking generator.
Trace A.
Trace B.
Trace C.
TV trigger.
Microamp (unit).
Uniform filter window.Increases the parameter one step sire.
Upper and lower limit lines.
Upper limit line.
Microseconds (unit).
Microvolts (unit).
Microwatt (unit).
Programming Commands 5-7

‘Ihble 5-2.Characters and Secondary Keywords (Reserved Words) (continued)
Element
V
VERTICAL
VID
W
YTF
XTAL*
0
1
50
75
?
Description
Volts (unit).
Vertical triggering.
Video trigger.
Watts or word (for MDS command).
YIG-tuned filter.
Crystal.
Asterisk (used as a wildcard).
Semicolon (ASCII code 59).
Comma (ASCII code 44).
Off (command argument).
On (command argument).
500.
753.
Returns a query response containing the value or state of the associated parameter. Thequery response is followed by a carriage-return/line-feed.
5-8 Programming Commands

The alternate commands (listed in the left column of Table 5-3) provide compatibility withcommands used by the HP 8566A/B, HP 8568A/B, and HP 70000 Series instruments. Theequivalent commands for the HP 8590 Series spectrum analyzer are listed in the right column.
able 5-3. Summary of Compatible Commands
Alternate Description HP 8590 SeriesCommands Command
A l Clear write trace A CLRW TRA
A2 Max hold trace A MXMH TRA
A3 Store and view trace A VIEW TRA
A4 Store and blank trace A BLANK TRA
Bl Clear write trace B CLRW TRB
B2 Max hold trace B MXMH TRB
B3 Store and view trace B VIEW TRB
B4 Store and blank trace B BLANK TRB
BL B - DL -> B BML
Cl Trace A minus trace B off AMB OFF
c2 Trace A minus trace B on AMB ON
CA Coupled input attenuation AT AUTO
CR Coupled resolution bandwidth RB AUTO
cs Coupled step size SS AUTO
CT Coupled sweep time ST AUTO
c v Coupled video bandwidth VB AUTO
El Peak search MKPK HI
E2 Enter marker into center frequency MKCF
E3 Enter marker delta into center frequency step size MKSS
E4 Enter marker amplitude into reference level MKRL
EM Erase graphics memory CLRDSP
EX Exchange trace A and B AXB
KSA dBm amplitude units AUNITS DBM
KSB dBmV amplitude units AUNITS DBMV
KSC dBpV amplitude units AUNITS DBUV
KSD Volt amplitude units AUNITS V
KSE Screen title TITLE
KSG Video average on VAVG ON
KSH Video average off VAVG OFF
KSM Marker noise MKNOISE
KS0 Marker value to span MKSP
KS2 Reference level offset ROFFSET
KSC Trace A plus trace B into trace A APB
KSi Exchange trace B and C BXC
KS1 Trace B into trace C BTC
KSm Graticule off GRAT OFF
KSn Graticule on GRAT ON
K&J Annotation off ANNOT OFF
KSP Annotation on ANNOT ON
LO Display line off DL OFF
Programming Commands 5-9

‘Ihble 5-3. Summary of Compatible Commands (continued)
Alternate Description HP 8690 SeriesCommands Command
Ml Marker off MKOFFM2 Marker normal MKNM3 Marker delta MKD
MA Marker amplitude MKA?
MC Marker count MKFCMT0 Marker track off MKTRACK OFFMT1 Marker track on MKTRACK ON
01 Output format, in real number format TDF P
02 Output format, in binary format, two bytes (word) per TDF B;MDS Welement
03 Output format, in measurement data format TDF M
04 Output format, ln binary format, 1 byte per element TDF B;MDS B
Rl Activates illegal command service request only RQS 32
R2 Activates end-of-sweep, illegal command RQS 36
R3 Activates broken hardware, illegal command RQS 40
R4 Activates units-key pressed, illegal command RQS 34
RC Recall state RCLS
Sl Sweep continuous CONTS
s2 Sweep single SNGLS
s v Save state SAVES
TO Threshold off TH OFF
Tl Trigger mode free run TM FREE
T2 Trigger mode line TM LINE
T3 Trigger mode external TM EXT
T4 Trigger mode video TM VID
T7 Trigger mode level GATECTL LEVEL
TS Trigger mode edge GATECTL EDGE
5-l 0 Programming Commands

This functional index categorizes the programming commands by the type of function that thecommand performs. The functional index contains the following information: the programmingcommand mnemonic, the softkey or front-panel key that corresponds to the command’sfunction, and a brief definition of the command. Once the desired command is found, referto the alphabetical listing of commands later in this chapter for more information about thecommand.
FunctionCategory
\MPLITUDE
‘Ihble 5-4. Functional Index
Command Corresponding DescriptionKey Function
AT ATTEN AUTO UAN Specifies RF input attenuation.
AUNITS Amptd Units Specifies amplitude units for input,output, and display.
COUPLE * COUPLE AC DC * Selects direct-current (dc) coupling oralternating-current (ac) coupling.
INZ INPVI’ 2 50R 75R Specifies the value of input impedanceexpected at the active input port.
LG SCALE LOG LLN (when Specifies the vertical graticule divisionsLOG is underlined) as logarithmic units, without changing
the reference level.
LUTO COUPLING
WXILIARY:ONTROL
LN
ML
NRLPREAMPG
ppt
RESETRL
RL
ROFFSET
AUTO
CNTLA
CNTLB
CNTLC
CNTLD
CNTLI
SCALE LOG LIN (when LIN Specifies the vertical graticule divisionsls underlined) as linear units, without changing the
reference level.
UAX UXR LVL Specifies the maximum signal level thatis applied to the input mixer for a signalthat is equal to or below the referencelevel.
Sets the normalized reference level.
EXTERWAL PREABPG Subtracts a positive or negativepreamplifier gain value from thedisplayed signal.
PRESEL PEAK t Performs a preselector peak.
Resets the reference level to itsinstrument preset level.
REP LVL Specifies the amplitude value of thereference level.
REF I.‘& OFFSET Offsets all amplitude readouts withoutaffecting the trace.
AUTO ALL Couples the active functionsautomatically.
CNTL A 0 1 Sets the control line A of the auxiliaryinterface high or low.
CNTL I3 0 I Sets the control line B of the auxiliaryinterface high or low.
GNTL C 0 1 Sets the interface control line C of theauxiliary interface high or low.
CNTL D 0 1 Sets the interface control line D of theauxiliary interface high or low.
DISPLAY CNTL I Returns a “1” when the interfacecontrol line I of the auxlllary interface ishigh, and “0” if the line is low.
For HP 85943, HP 85953, or HP 8596E only.For HP 8592L, HP 85933, HP 85953, or HP 85963 only.
Programming Commands 5-l 1
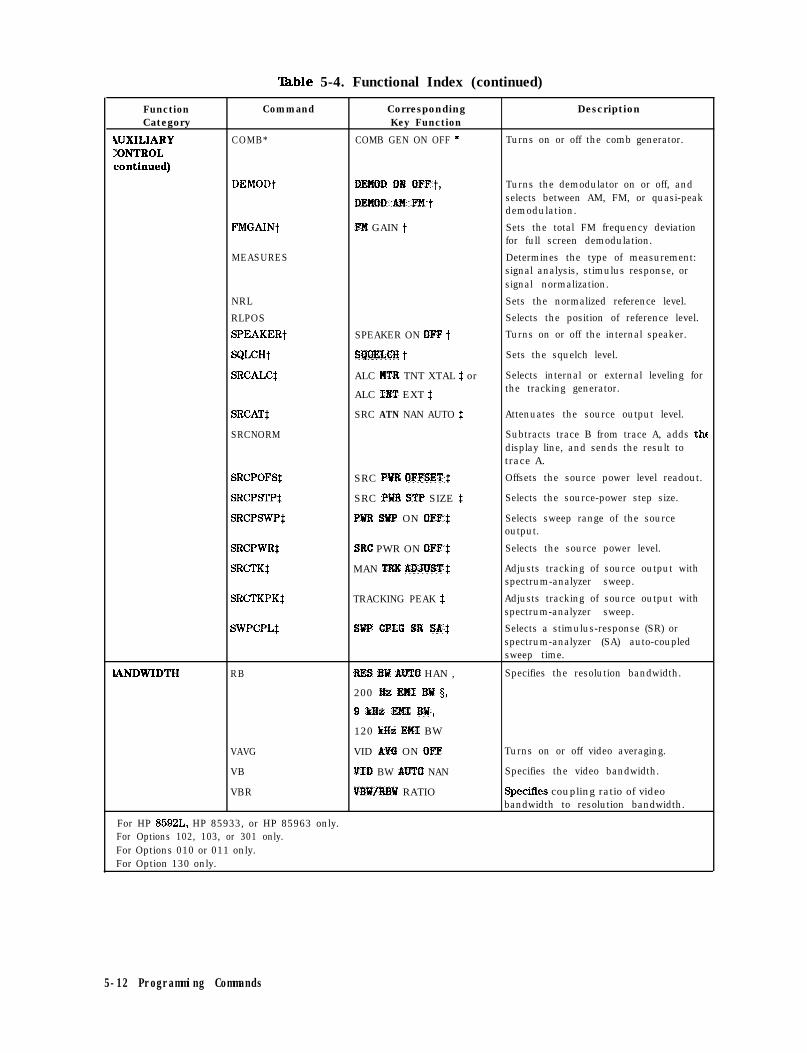
FunctionCategory
IUXILIARY:ONTROL,continued)
MNDWIDTH
‘Ihble 5-4. Functional Index (continued)
Command Corresponding DescriptionKey Function
COMB* COMB GEN ON OFF * Turns on or off the comb generator.
DEMODt DENOD GN OFFt, Turns the demodulator on or off, and
DENBDANFNt selects between AM, FM, or quasi-peakdemodulation.
FMGAINt FN GAIN t Sets the total FM frequency deviationfor full screen demodulation.
MEASURES Determines the type of measurement:signal analysis, stimulus response, orsignal normalization.
NRL Sets the normalized reference level.
RLPOS Selects the position of reference level.
SPEAKERt SPEAKER ON OFF t Turns on or off the internal speaker.
sQLCHt SQUELCR t Sets the squelch level.
SRCALC$ ALC Nl’R TNT XTAL $ or Selects internal or external leveling for
ALC LNT EXT $ the tracking generator.
SRCATS SRC ATN NAN AUTO $ Attenuates the source output level.
SRCNORM Subtracts trace B from trace A, adds thedisplay line, and sends the result totrace A.
SRCPOFSS SRC PWR OFFSET$ Offsets the source power level readout.
SRCPSTPS SRC PWR STP SIZE $ Selects the source-power step size.
SRCPSWPJ PWR SWP ON OFF’$ Selects sweep range of the sourceoutput.
SRCPWR$ SW PWR ON OFFS Selects the source power level.
SRCTKS MAN TIW ADJUST$ Adjusts tracking of source output withspectrum-analyzer sweep.
SRCTKPKS TRACKING PEAK $ Adjusts tracking of source output withspectrum-analyzer sweep.
SWPCPLS SUP CPLG SR SA$ Selects a stimulus-response (SR) orspectrum-analyzer (SA) auto-coupledsweep time.
RB REX3 BW AUTO HAN , Specifies the resolution bandwidth.
200 Ez ma BW 9,
9 LHz EHI BW,
120 LB2 EN1 BW
VAVG VID AVG ON OFF Turns on or off video averaging.
VB VII) BW AUT# NAN Specifies the video bandwidth.
VBR VBW/RBW RATIO Specifies coupling ratio of videobandwidth to resolution bandwidth.
For HP 8592L, HP 85933, or HP 85963 only.For Options 102, 103, or 301 only.For Options 010 or 011 only.For Option 130 only.
5-12 Programming Commands
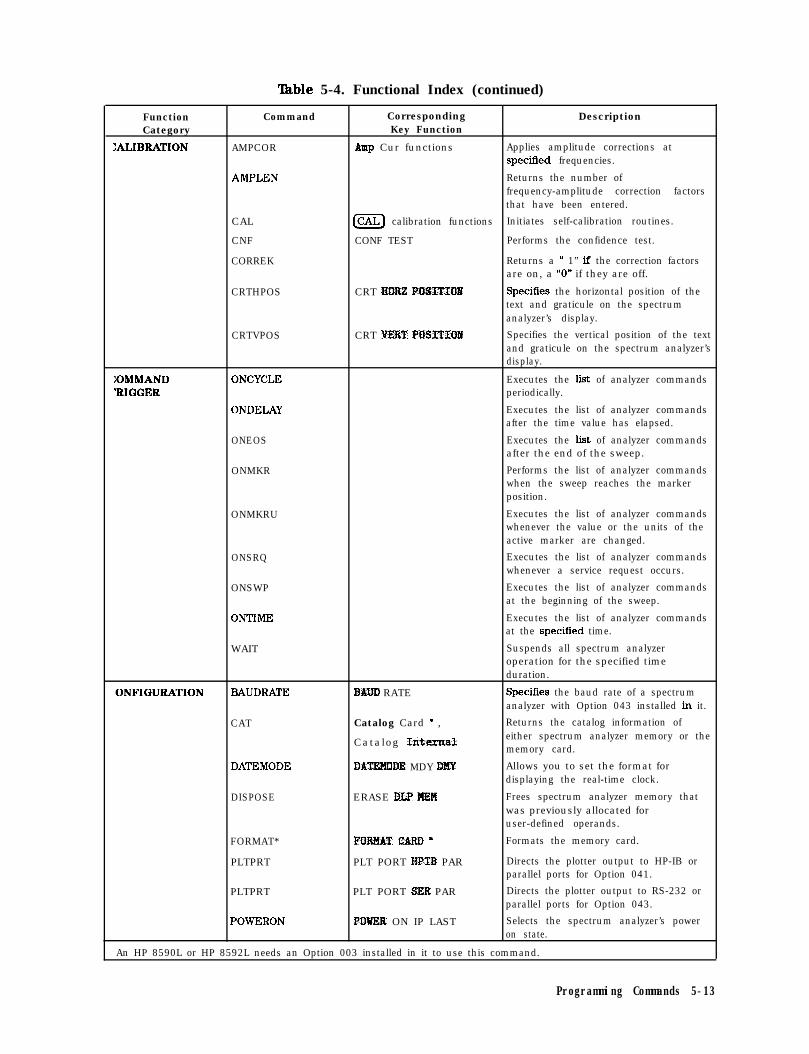
‘Ihble 5-4. Functional Index (continued)
FunctionCategory
:ALIBRATION
Command
AMPCOR
AMPLEN
CorrespondingKey Function
Azip Cur functions
Description
Applies amplitude corrections atspecified frequencies.
Returns the number offrequency-amplitude correction factorsthat have been entered.
:OMMANDYRIGGER
CAL
CNF
CORREK
CRTHPOS
CRTVPOS
ONCYCLE
ONDELAY
ONEOS
ONMKR
ONMKRU
ONSRQ
ONSWP
ONTIME
WAIT
ICAL) calibration functions Initiates self-calibration routines.
CONF TEST Performs the confidence test.
Returns a ” 1” lf the correction factorsare on, a “0” if they are off.
CRT HORE POSITIOK Specifies the horizontal position of thetext and graticule on the spectrumanalyzer’s display.
CRT VERT POSITIOW Specifies the vertical position of the textand graticule on the spectrum analyzer’sdisplay.
Executes the list of analyzer commandsperiodically.
Executes the list of analyzer commandsafter the time value has elapsed.
Executes the list of analyzer commandsafter the end of the sweep.
Performs the list of analyzer commandswhen the sweep reaches the markerposition.
Executes the list of analyzer commandswhenever the value or the units of theactive marker are changed.
Executes the list of analyzer commandswhenever a service request occurs.
Executes the list of analyzer commandsat the beginning of the sweep.
Executes the list of analyzer commandsat the specified time.
Suspends all spectrum analyzeroperation for the specified timeduration.
!ONFIGURATION BAUDRATE
CAT
DATEMODE
DISPOSE
FORMAT*
PLTPRT
PLTPRT
POWERON
BAUD RATE
Catalog Card * ,
Catalog Internal
DATEHODE MDY BHY
ERASE DLF MEN
FOIWAT CARD *
PLT PORT RPIB PAR
PLT PORT SER PAR
PDRER ON IP LAST
Specifies the baud rate of a spectrumanalyzer with Option 043 installed in it.
Returns the catalog information ofeither spectrum analyzer memory or thememory card.
Allows you to set the format fordisplaying the real-time clock.
Frees spectrum analyzer memory thatwas previously allocated foruser-defined operands.
Formats the memory card.
Directs the plotter output to HP-IB orparallel ports for Option 041.
Directs the plotter output to RS-232 orparallel ports for Option 043.
Selects the spectrum analyzer’s poweron state.
An HP 8590L or HP 8592L needs an Option 003 installed in it to use this command.
Programming Commands 5-13

‘able 5-4. Functional Index (continued)
Function Command Corresponding DescriptionCategory Key Function
CONFIGURATION PREFX Change Prefix Specifies or changes the prefix used in[continued) save and recall operations.
PRNPRT PRN PORT HPIB PAR Directs the printer output to HP-IB orparallel ports for Option 041.
PRNPRT PRN PORT SER PAR Directs the printer output to RS-232 orparallel ports for Option 043.
SETDATE SET DATE Sets the date of the real-time clock.
SETTIME SET TINE Sets the time of the real-time clock.
SYNCMODE SYNC NM NTSC , Selects either the horizontal and vertica
DEF’ABLT SYNC,synchronizing constants, or thesynchronization rate for the internal
SYNC NRN PAL monitor.
TIMEDATE Sets the time and date of the real-timeclock.
TIMEDSP TINNDATE ON OFF Turns on or off the display of thereal-time clock.
DISPLAY ANLGPLUS* ANALOG+ ON OFF * Turns the Analog+ display mode on orOf f .
ANNOT ANNOTATN ON OFF Turns on or off the screen annotation.
DA Accesses the current address of thedisplay list.
DL DSP LINE ON OFF Defines the level of the display line inthe active amplitude units and displaysthe display line on the spectrumanalyzer screen.
DOTDENS* ANALOG+ ON OFF * Sets the dot density value in theAnalog+ display mode.
DSPLY Displays the value of a variable on thespectrum analyzer screen.
GRAT MAT OK OFF Turns on or off the graticule.
HD HOLD or IHOLD) Disables data entry via the spectrumanalyzer numeric keypad, knob, or stepkeys. The active function readout isblanked, and any active function isdeactivated.
MENU Displays speclfled menu on the spectrunanalyzer screen.
PREFX Change Prefix Specifies the prefix.
TH TARESNLD ON OFF Clips signal responses below thethreshold level.
TITLE Change Title Activates the screen title mode.
TREQUENCY CF CENTER FREQ Specifies center frequency.
FA START FREQ Specifies the start frequency.
FB STOP FREfJ Specifies the stop frequency.
FOFFSET FNEQ OFFSET Specifies the frequency offset for allabsolute frequency readouts such ascenter frequency.
ss CF STEP &WI’0 NAN Specifies center-frequency step size.
’ For Option 101 or 301 only.
5-14 Programming Commands

FunctionCategory
;RAPHICS
‘Ihble 5-4. Functional Index (continued)
Command Corresponding DescriptionKey Function
CLRBOX Clears a rectangular area on thespectrum analyzer display.
CLRDSP Erases user-generated graphics and text.
DA Accesses the current address of thedisplay list.
DRAWBOX Draws a rectangular box on thespectrum analyzer display.
DT Defines any character as a labelterminator.
GETPLOT (copy ) Initiates output of the spectrumanalyzer display to a plotter.
GETPRNT ICOPYJ Initiates output of the spectrumanalyzer display to a printer.
GR Graphs the given y coordinate whileincrementing the z coordinate by 1.
LB Writes text at the current pen position.
PA Moves the pen to a vector location onthe spectrum analyzer screen relative tothe reference coordinates (0,O).
PD Instructs the spectrum analyzer to plotvectors on the spectrum analyzer screenuntil a PU command is received.
NFORMATION
PR
PRNTADRS
PU
TEXT
TRGRPH
ACTVF
BIT
@Z5r) to a printer
PRLNTER ADDRESS
Moves the pen to a new plot location onthe spectrum analyzer screen relative tothe current coordinates in display units
Prints screen data.
Allows you to set the HP-IB address ofthe printer.Instructs the spectrum analyzer not toplot vectors on the spectrum analyzerscreen until a PD command is received.
Writes text on the analyzer screen atthe current pen position.
Graphs compressed trace.
Returns a “0” if the given function isnot active, a “1” lf it is active.
Places the state of a bit in thedestination.
BITF
CLS
HAVE SHOW DPTTONS
Returns the state of a bit.
Clears all status bits.
Returns a “0” if a device or option is notinstalled.
ID SHOW OPTIONS Returns the spectrum analyzer modelnumber.
MDU
OP
PARSTAT
PWRUPTIME
Returns values for the spectrumanalyzer’s baseline and reference level.
Returns the coordinates of thelower-left and upper-right comers ofthe spectrum analyzer display.
Returns parallel port status.
Returns the number of milliseconds thathave elapsed since the spectrumanalyzer was turned on.
Programming Commands 5-15

‘able 5-4. Functional Index (continued)
FunctionCateccorv
NFORMATIONcontinued)
NPUT and OUTPUT
,IMIT LINES
REV
RQSSER
SRQ
STB
EE
EK
ENTER
EP
DADL
OUTPUT
RELHPIB
TA
TB
I’DF
lRA TRB TRC
LIMIDEL
LIMIDISP
JMIFAIL
JMIFT
JMIHI
JMILINE
CorrespondingKey Function
SHOW OPTIONS
SNOW OPTIONS
‘URGE LINITS
Xl’ DLSP Y N AUTO
Xl’ TEST ON OFF
Description
Returns the date code of the Ermwarerevision number in YYMMDD format.
Sets a bit mask for service requests.
Returns the serial number suffix of thespectrum analyzer.
The SRQ command is used by anexternal controller to simulateinterrupts from the spectrum analyzer.
Returns to the controller the decimalequivalent of the status byte.
Sends the controller the values enteredon the spectrum analyzer numerickeypad by the operator.
Allows data entry with the front-panelknob when the spectrum analyzer isunder remote control.Allows the spectrum analyzer to receivedata from other devices on the HP-IB.
Sends values entered on the spectrumanalyzer number keyboard to thepresent active function value.
Returns the value of the active function.
Transmits information to the controllerthat describes the state of the spectrumanalyzer when the OL command isexecuted.Allows the spectrum analyzer to senddata to other devices on the HP-IB.Releases spectrum analyzer control ofthe HP-IB.Returns trace A amplitude values fromthe analyzer to the controller.
Transfers trace B amplitude values fromthe analyzer to the controller.
Formats trace information for return tothe controller.Controls trace data input or output.
Deletes all segments in the currentlimit-line table.
Controls when the limit line (or limitlines) are displayed.
Returns a “0” if the last measurementsweep of trace A is equal to or withinthe limit-line bounds.Selects how the limit-line segments areplaced on the spectrum analyzerdisplay: according to frequency, oraccording to the sweep time setting ofthe spectrum analyzer.
Allows you to specify a fixed trace aathe upper limit line.
Outputs the current limit-line tabledeilnitions.
5-l 5 Programming Commands

FunctionCategory
LIMIT LINES:continued)
dARKER
‘Ihble 5-4. Functional Index (continued)
Command Corresponding DescriptionKey Function
LIMILO Allows you to specify a Axed trace asthe lower limit line.
LIMIMIRROR Reflects the current deilnition about theamplitude axis at the largest frequencyor the largest sweep time in thedefinition.
LIMIMODE Edit Wpper , Edit Lover, Determines whether the limit-line
Edit Up/Lou , entries are treated as upper amplitudevalues, lower amplitude values, upper
Edit Plid/Delt and lower amplitude values, ormid-amplitude and delta values.
LIMIREL LIWTS FIX REL Specifies the current limit lines as ilxedor relative.
LIMISEG Edit Wpper , Edit Lower Adds new segments to the currentfrequency limit line in either the upperlimit llne or the lower limit line.
LIMISEGT Edit Upper, Edit Lower Adds new segments to the currentsweep time limit line in either the upperlimit line or the lower limit line.
LIMITEST WI” TEST OH OFF Compares trace A with the currentlimit-line data.
SEGDEL DELETE SEGMEKT Deletes the specified segment from thelimit-line tables.
SENTER Edit VP/LOU , Enters the limit-line data ln either the
Edit Aid/Delt upper and lower limit-line tables or themid and delta table for limit lines basedon frequency.
SENTERT Edit Up/Low , Enters the limit-line data in either the
Edit Mid/Delt upper and lower limit-line table or themid and delta table for limit lines basedon sweep time.
MDS Specifies measurement data size as byteor word.
MF Returns the frequency (or time) of theon-screen active marker.
MKA Specifies amplitude of the active marker
MKACT SELECT 1 2 3 4 Specifies the active marker.
MKACTV IIARKER Cnmubex> 0% OFF Makes the current active marker theactive function.
MKBW N dB PTS OA OFF Returns the bandwidth at the specifiedpower level relative to an on-screenmarker (if present) or the signal peak (ifno on-screen marker is present).
MKCF MA= -> CF Sets the center frequency equal to themarker frequency and moves the
MKCONT
MKD
MKDLMODE
MKF
MAIUEER A
TBBLE ADL IIR?I
marker to the center of the screen.
Resumes the sweep after execution of aMKSTOP command.
Activates the delta marker.
Selects if the marker amplitude valuesare shown as relative to the referencelevel or relative to the display line.
Specifies the frequency value of theactive marker.
Programming Commands 5-17

‘Ihble 5-4. Functional Index (continued)
Function CommandCategory
rlARKER (continued) MKFC’
MKFCR*
MKMIN
MKN
MKNOISE
MKOFF
MKP
MKPAUSE
MKPK
CorrespondingKey Function
NX COUNT ON OFF *
CNT RES AUTO &IA% *
MARKER -> MIN=
MhRNER BORKAL
MK NOTSE UK OFF
NhRNER ALL OFF
KK PAUSE ON OFF
(PEAK SEARCH),
NEXT PEAR ,
NEXT PX RXGRT ,
NEXT PI LEFT,
MARKER ->PK-PK
Description
Turns on or off marker frequencycounter.Sets the resolution of the markerfrequency counter.
Moves active marker to minimum signaldetected.
Activates and moves the marker to thespecified frequency.
Displays the average noise level at themarker.Turns off either the active marker or allthe markers.
Places the active marker at the givenZ-coordinate.
Pauses the sweep at the active markerfor the duration of the delay period.
Positions the active marker on a signalpeak.
MKPX PEAK EXGURSN
MKREAD MK READ F T I P
MKRL MARKER -> REF LYL
MKSP MhRNER A -> SPAN
Specifies the minimum signal excursionfor the spectrum analyzer’s internalpeak-identiftcation routine.
Selects the type of active traceinformation displayed by the spectrumanalyzer marker readout.
Sets the reference level to theamplitude value of the active marker.
Sets the start and stop frequencies tothe values of the delta markers.
MKSS
MKSTOP
MKTBL
MKTRACE
MKTRACK
MKTYPE
MARKER -Z CF STEP
MK ThBLE ON OFF
MK TIME BUT0 A3C
KK TRACK ON OFF
t4hRKER AHPTD
M4
PKDLMODE
PKRES
PK HOBE ODL NRK
Sets the center-frequency step-size tothe marker frequency.
Stops the sweep at the active marker.
Turns on or off the marker table.
Moves the active marker to acorresponding position in trace A, traceB, or trace C.
Moves the signal with an active markerto the center of the spectrum analyzerdisplay and keeps the signal peak atcenter screen.Changes the type of the current activemarker.Activates a single marker on the traceand enables the knob to change theposition of the marker. The activefunction is then set to span.
Selects the signal peaks that aredisplayed in the peak table.
Returns the x-axis coordinates of thepeaks in the peak table.
Not available for an HP 8592L. An HP 85901, needs Option 013 installed in it.
5-18 Programming Commands

‘Ihble 5-4. Functional Index (continued)
Function Command Corresponding DescriptionCategory Key Function
MARKER (continued) PKSORT PK SORT FRQ AI@ Selects how the signal peaks listed inthe peak table are sorted: by decreasimamplitude or by ascending frequency.
PKTBL PK TABLE ON OFF Turns on or off the peak table.
YIATH (see also ABS Places the absolute value of the sourcel’race Math) values in the destination.
ADD Adds the sources and sends the sum tothe destination.
AVG Averages the source and the destination
BIT Returns the state of a bit.
CTA Converts the source values frommeasurement units to the currentabsolute amplitude units and stores theresult in the destination.
CTM Converts the source values tomeasurement units and places the resuliin the destination.
DIV Divides source 1 by source 2 and placesthe result in the destination.
EXP Places the exponential of the source inthe destination.
INT Places the greatest integer that is lessthan or equal to the source value intothe destination.
LOG ‘lakes the logarithm (base 10) of thesource, multiplies the result by thescaling factor, then stores it in thedestination.
MEAN Returns the mean value of the giventrace ln measurement units.
MEANTH Returns the mean value of the giventrace above the threshold, inmeasurement units.
MIN Compares source 1 and 2, point bypoint, and stores the lesser of the two inthe destination.
MINPOS Returns a value, which is the s-axisposition (in display units) of the
MOD
minimum amplitude value in trace A,trace B, trace C, or user-defined trace.
Stores the remainder from the divisionof source 1 by source 2 in thedestination.
MPY
MXM
PDA
Multiplies the sources, point by point,and places the results in the destination.
Compares source 1 and source 2, pointby point, sending the greater value ofeach comparison to the destination.
Sums the probability distribution ofamplitude in the destination trace withthe amplitude distribution function ofthe source trace.
PDF Increments an element of thedestination trace whenever thecorresponding element of the sourcetrace exceeds a threshold.
Programming Commands 5-l 9

‘Ihble 5-4. Functional Index (continued)
FunctionCategory
dATH (continued)
dEASURE/USER
Command
RMS
SQR
Returns the root mean square value ofthe trace in measurement units.
Places the square root of the source intothe destination.
STDEV
SUB
Returns the standard deviation of thetrace amplitude ln measurement units.
Subtracts source 2 from source 1, pointby point, and sends the difference tothe destination.
VARIANCE Returns the amplitude variance of the
AD3 CIIAK POWER
specified trace, in measurement units.
ACP
ACPBW
ACPCONTM
ACPE
ACPGRAPH
ACPPAR
ACPSNGLM
ACPSP
CHP
FFT
FFTAUTO
FFTCLIP
FFTCONTS
FFTMKR
CorrespondingKey Function
Description
Performs the adjacent channel powermeasurement.
EIABIEL BABDl?DTH
COET HEAS
ADJ CM PTdR estd
SINGLE WAS
3IANNEI. SPACING
XIAEMZL POKER
vIARKER -> AUTO FFT
:OETIBJuS FFT
FFT WlRKERS
Allows you to specify the channelbandwidth used for the adjacentchannel power (ACP), adjacent channelpower extended (ACPE), and channelpower (CHP) measurements.
Changes the spectrum analyzer’s sweepmode to continuous sweep, and thenperforms the previous powermeasurement (occupied bandwidth,adjacent channel, or channel power) atthe end of every sweep.
Performs the adjacent channel powerextended measurement.
Computes and displays an adjacentchannel power (ACP) graph.
Determines if the spectrum analyzersettine used for the adjacent channelpower (ACP), adjacent channel powerextended (ACPE), channel power (CHP),or occupied bandwidth (OBW)measurement are set manually orautomatically.
Changes the spectrum analyzer’s sweepmode to single sweep, performs a takesweep (TS), and then performs theprevious power measurement.
Allows you to specify the frequencyspacing between channels.
Performs the channel powermeasurement.
Performs a discrete fast Fouriertransform on the source trace array andstores the result in the destination array.
Performs a fast Fourier transform (FFT)on the signal on which the marker isplaced.
Indicates if the FFT results are valid.
Performs a fast Fourier transform (FFT)continuously on the current signal.
Activates the FFT markers and displaysthe FFT annotation on the spectrum
1 analyzer display.
5-20 Programming Commands

lfdble 5-4. Functional Index (continued)
FunctionCategory
MEASURE/USERIcontinued)
Command
FFTMM
FFTMS
CorrespondingKey Function
BARKER -> BID SCRIU
MAXKER -> FFT STOP
Description
Changes the FFT midscreen frequencyof the spectrum analyzer to thefrequency of the FFT marker.
Changes the FFT stop frequency of thespectrum analyzer to the frequency ofthe FFT marker.
FFTOFF
FFTPCTAM
FFTPCTAMR
FFTSNGLS
FFT OFF
% AH 08 OFF (during anFFT measurement)
SIIIGLE FFT
FFTSTAT
FFl’STOP
MEASOFF
NDB
NDBPNT
MEAS OFF
N d3 PTS ON OFF
N dl3 PTS ON OFF
Exits the fast Fourier transform (FFT)measurement and FFT settings.
Turns the percent AM function on orOf f .
Returns the percent of amplitudemodulation (AM).
Changes the spectrum analyzer’s sweepmode to single sweep mode (ifnecessary), and then performs a fastFourier transform (FIT) on trace A.
Returns the status of the spectrumanalyzer’s FFT measurement functions.
Sets the FFT stop frequency of the FFTmeasurement.Turns off the current measurement,erases the display, and then displays themenu accessed by (MEAS/USER].
Specifies the distance (in dB) from thesignal peak for the N dB pointsmeasurement (NDBPNT).
Turns on or off the N dB pointsmeasurement.
NDBPNTR
OBW
OBWPCT
PCTAM
OCGBPTRB BAADWDTR
OCC BY % POWER
% AM ON OFF
Returns the bandwidth measured by theN dB points measurement (NDBPT).
Performs the occupied bandwidthmeasurement using the value foroccupied bandwidth percent (OBWPCT).
Specifies the percent of total power thatis to be used in calculating the occupiedbandwidth (OBW).
Turns on or off the percent AMmeasurement.
PCTAMR Returns the percent AM measured bythe percent AM measurement (PCTAM).
PWRBW
TO1 TOI OW OFF
Computes the bandwidth around thetrace center, which includes signalswhose total power is a specifiedpercentage of the total trace signalpower.
Turns on or off the third-orderintermodulation (TOI) measurement.
TOIR Returns the highest third-orderintermodulation product measured bythe third-order intermodulationmeasurement (TOI).
AODE MODE SPEC’IRUH AHALYZER Returns a “0” if the mode of operationis spectrum analysis. A number otherthan “0” is returned if the operatingmode (also called “personality”) is otherthan spectrum analysis.
Programming Commands 5-21

‘Ihble 5-4. Functional Index (continued)
Function Command Corresponding DescriptionCategory Key Function
IPERATOR ENTRY DN El Reduces the active function by theapplicable step size.
EE Enables front-panel number entry.
EK Enables front-panel knob control.
EP Enter parameter from front panel.
HD HOLD or [HOLD) Holds or disables entry and blanksactive function readout.
‘LOTTER
‘RESET
‘RINTER
‘ROGRAM FLOW
UP
GETPLOT
PLOT
IP
LF*
POWERON
RESETRL
GETPRNT
ABORT
0
lcopyl
Icopy) (to a plotter)
piiisq
POWER 01 IP LAST
m
lcopyl (to a printer)
Increases the active function by theapplicable step size.
Initiates output of the spectrumanalyzer display to a plotter. (For usewithin a downloadable program.)
Initiates output of the spectrumanalyzer display to a plotter.
Performs an instrument preset.
Performs an instrument preset to thebase band (band 0).
Selects the state the spectrum analyzerwill be in when it is turned on: IP(instrument preset) or LAST state.
Resets the reference level to instrumentpreset value.
Initiates output of the spectrumanalyzer display to a printer. (For usewithin a downloadable program.)
Initiates output of the spectrumanalyzer display to a printer.
Stops the execution all user-definedfunctions and readies the instrument forthe next command received.
IF
REPEAT
RETURN
IF/THEN/ELSE/ENDIF forms a decisionand branching construct.
REPEAT/UNTIL forms a loopingconstruct.
Stops the operation of a user-definedcommand and returns programoperation to the point where the
WAIT
!ECALL or SAVE CAT Catalog Internal,
Catalog Caxd t
LOADt LOAD PILE t
MS1 INTERNAL CARD
PREFX Change Prefix
For HP 8592L, HP 85933, HP 8595E, or HP 85963 only.Option 003 required for HP 8590L or HP 8592L.
user-defined function was called.
Suspends all spectrum analyzeroperation for the specified timeduration.
Displays directory information fromeither the specified or the current massstorage device.
Loads a file from the memory card.
Allows you to specify the current massstorage device as the spectrum analyzermemory or a memory card.
Specties the prefix.
5-22 Programming Commands

‘able 5-4. Functional Index (continued)
FunctionCategory
RECALL or SAVE
Command
PSTATE
PURGE
RCLS
RCLT
SAVES
SAVET
SAVRCLF
SAVRCLN
SAVRCLW
STOR’
Corresponding DescriptionKey Function
SAV LOCK ON OFF Protects all of the spectrum analyzer’suser state and trace registers from bein]changed.
DELETE FILE Deletes the specified file from thecurrent mass storage device.
INTERUAL -> STATE Recalls spectrum analyzer state datafrom one of the nine state registers inspectrum analyzer memory.
The softkeys accessed by Recalls previously saved trace data,
Tnternal -> Trace amplitude factors, or limit-line datafrom the trace registers in spectrumanalyzer memory.
STATE -> INTRUL Saves the currently displayedinstrument state ln spectrum analyzermemory.
The softkeys accessed by Saves the selected trace data and stateTrace -> Intrnl information, amplitude correction
factors, or limit-line tables in spectrumanalyzer memory.
~or~RECALL] Specifies either a save or recalloperation.
Specifies the number to append to theprefix for a save or recall operation, aminitiates the transfer of data.
Specilles the data to be transferred.
STATE -> CARD *, Stores data on a RAM card.
Trace -> Card*,
ALL DLP -> CARD *
lPAN FS
HNt
HNLOCKt
FULL SPAN Sets the frequency span of the spectrunanalyzer to full span.
Returns the harmonic number of thecurrent harmonic band in which thespectrum analyzer is tuning.
Band selection accessed by Forces the spectrum analyzer to useBand Luck t or only the selected harmonic band.
BKD LOCK OR UFFt
HNUNLKt
LSPAN
PKZMOK
BND LOCK OR OFF (OFF is Unlocks the harmonic band.underlined)+
LAST SPAN Changes the spectrum analyzer’s span tcthe previous span setting.
Returns a “0” if the peak zoom routine(PKZOOM) found only the spectrumanalyzer’s local oscillator feedthrough,otherwise a “1” is returned.
PKZOOM PEAK Z#DA Automatically tunes the spectrumanalyzer to the signal with the highestamplitude level while narrowing thefrequency span to the specifiedfrequency span.
Option 003 required for HP 8590L or HP 8592L.For HP 8592L, HP 85933, HP 85953, or HP 85963 only.
Programming Commands 5-23

‘Ihble 5-4. Functional Index (continued)
Function Command CorrespondingCategory Key Function
3PAN (continued) SP SPAN
SPZGGM SPA2 2OOI
Description
Changes the total displayed frequencyrange symmetrically about the centerfrequency.
Places a marker on the higheston-screen signal (if an on-screen markeris not present), turns on the signal trackfunction, and activates the spanfunction.
SWEEP CONTS
GATE’
GATECTL*
GC*
GD*
GDRVCLPAR*
GDRVGDEL*
GDRVGLEN*
GDRVGT’
GDRVGTIM*
GDRVPRI’
GDRVPWID*
SWEEP COlT SGL (CONT is Sets the spectrum analyzer to theunderlined) continuous sweep mode.
GATE ON OFF * Turns on or off the time-gating.
GATE CTL EDGE LVL* Selects between the edge and the levelmode for Option 105, the time-gatedspectrum analysis capability.
(PRESET) Presets Option 105, the time-gatedspectrum analysis capability.
GATE DELAY* Sets the delay time before the gateopens.
CLEAR PARAH * Clears the pulse parameters (pulsewidth, pulse repetition interval, andreference edge) for a time-gatemeasurement by setting the pulseparameters to 0.
GATE DELAY l (when using For the frequency window only,the gate utility) GDRVGDEL sets the time delay from
when the gate trigger occurs to whenthe gate is opened.
GATE LBNGTH * Adjusts the gate length in both the timeand frequency windows.
GATE ON OFF * Turns on or off the gate in thefrequency window.
TRIG HER ON OFF * Activates the gate trigger marker, andplaces it at the given value.
ENTER PRI * Enters the specified value as the pulserepetition interval.
EN+lYEX WIDTH * Enters the specified value as the pulsewidth.
GDRVRBW* CPL RBW ON OFF l Couples or uncouples the resolutionbandwidth to the specified pulse width.
GDRVREFE * ENTER RRF EDGE* Allows you to enter the position (intime) for a reference edge.
GDRVST* CPL SWF ON OFF * Couples or uncouples the sweep time tothe pulse repetition interval.
GDRVSWAP * UPDAm TIBRFREQ * Makes the window (either the time orfrequency window) that is currently notthe active window, the active window.
GDRVSWDE’ Sk’EEE’ DELAY * Allows you to specify the delay fromthe edge of the gate trigger until thesweep is started in the time window.
Option 105 required.
5.24 Programming Commands

ltdble 5-4. Functional Index (continued)
FunctionCategory
3WEEP (continued)
3YNCHRONIZATION DONE
rRACE AMB A- B -> A ON OFF
GDRVSWP*
CorrespondingKey Function
T WINDOW SNP TINE*
GDRVUTIL* GATE UTILYTY *
3DRVVBW * CPL VBW ON DFF *
3L*
3P*
ST
GATE LENGTH *
EDGE POL POS NEG *
SWP TIMB AUTO HAN
l-S
AMBPL NUFtNLI2E ON OFF
4XB
BLANK
BML
BTC
BXC
ZLRW
DET
A <--> B
BLANK A, BLANK B ,
BLANK C
B- DL -> B
6 -> &
6 <--> c
CLEAR WFIITE A,
CLEAR WRITE B ,
CLEAR NRTTE C
DETECTOR PK SP HEG or
DETECTOR SItI’ PK
:B
MERGE
MINH NTN NOLD c
MOV
MXMH HAX HOLD A, NAX ROLD 3
‘KPOS
Description
Specifies the sweep time for the timedomain window of the gate utility.
Turns on or off the gate utility.
Couples or uncouples the videobandwidth to the gate length.
Sets the length of time the gate is open.
Sets the polarity (positive or negative)for the gate trigger.
Specifies the time in which the spectrunanalyzer sweeps the displayedfrequency range.
Allows you to determine when thespectrum analyzer has started toexecute all commands prior to andincluding DONE.
Starts and completes one full sweepbefore the next command is executed.
Subtracts trace B from trace A andsends the result to trace A during everysweep of the spectrum analyzer.
Subtracts trace B from trace A, adds thrdisplay line value to the difference, andsends the result to trace A during everysweep of the spectrum analyzer.
Exchanges trace A and trace B.
Blanks trace A, trace B, or trace C andstops taking new data into the specifiedtrace.Subtracts display line from trace B andplaces the result in trace B.
Transfers trace B into trace C.
Exchanges trace B and trace C.
Clears the specified trace and enablestrace data acquisition.
Selects the spectrum analyzer detectionmode.
Provides a method for putting valuesinto trace B.
Merges the source trace into thespecified area of the destination trace.
Updates trace C elements with minimumlevel detected.Copies the source values into thedestination.Updates trace elements with maximumlevel detected.Returns a value, which is the index ofthe maximum value in trace A, trace B,trace C, or user-defined trace.
Option 105 required.
Programming Commands 5-25

‘Ihble 5-4. Functional Index (continued)
Function CommandCategory
rRACE (continued) TA
TBTRA TRB TRC
TRCMEM
CorrespondingKey Function
Description
Returns trace A data.
Returns trace B data.
Controls trace data input and output.
Returns a nonnegative integer thatindicates the total number of trace
TRDEF
TRDSP
registers available for SAVET and RCLT.
Creates a user-defined trace.
Turns on or off the display of trace A, B,or C without clearing the trace
TRGRPH
TRPRST
TRSl’AT
TWNDOW
VAVG
VIEW
(measurements can still be taken).
Displays a compressed trace on theanalyzer display.
Sets the trace operations to their presetvalues.Returns the status of traces A, B, and C:clear write, blank, view, minimum hold,or maximum hold.
Creates a window trace array for thefast Fourier transform (FFT) function.
VID AVG ON OFF Enables the video-averaging function,which averages trace points to smooththe displayed trace.
VIEW A, VIEW B, VIEW C Displays trace A, trace B, or trace C,and stops taking new data into theviewed trace.
I’RACE MATH (seetlso Math)
APB
CLRAVG
COMPRESS
CONCAT
FFT
LINFILL
MIRROR
PEAKS
SMOOTH
SUM
SUMSQR
TRMATH
XCH
VID AVG ON OFF
Adds trace A to trace B and sends theresult to trace A.
Restarts video averaging.
Reduces the number of trace elementswhile retaining the relative frequencyand amplitude characteristics of thetrace data.
Combines two traces.Calculates fast Fourier transform.
Fills linear interpolated data into thespecified trace data points of adestination trace.Displays the mirror image of a trace.
Sorts signal peaks by frequency oramplitude, stores the results ln thedestination trace, and returns thenumber of peaks found.
Smooths the trace according to thenumber of points specified for therunning average.
Returns the sum of the amplitudes ofthe trace elements in measurementlullts.
Returns the sum of the squares of theamplitude of each trace element.
Executes a list of analyzer commands atthe end of each sweep.
Exchanges traces.
5-26 Programming Commands

FunctionCategory
rRIGGER
‘0ble 5-4. Functional Index (continued)
Command Corresponding DescriptionKey Function
ONEOS Performs the command list at the end olsweep.
ONSWP Performs the command list at beginningof sweep.
SNGLS @miFswp), Selects single-sweep mode.
SWEEP CONT SGL (SGL isunderlined)
TM FREE RUN, LINE , VTDEU , Specifies trigger mode.
EXTERgAL, TV TRIG *
TS
TVLINE+
TVSFRM’
TV LIKE # *
TV TRTG ODD FLD *,
TV TRIG EVER FLD l ,
Begins a new sweep.
Sets the line number of the horizontalline of video on which to trigger.
Specifies type of video frame to triggeron.
TV TRIG VERT IWT *
JSER-DEFINED
TVSTND *
TVSYNC*
ABORT
ACTDEFDISPOSE
ERASE
TV Standard *
TV SYNC NEG PBS *
ERASE DLP HE?4
Selects the triggering for NTSC, PAL,PAL-M, and SECAM-L formats.
Selects between negative and positivetriggering for video frame formats.
Aborts all user-defined functions.
Creates a user-defined active function.
Deletes user-deflned functions.
Clears trace A and trace B, disposes ofthe contents of the user memory, andresets the state reglsters and the
FUNCDEF
KEYCLR
KEYCMD
KEYDEF
KEYENH
KEYEXC
KEYLBL
MEM
MENU
RETURNSAVEMENU
spectrum analyzer to the instrumentpreset state.
Defines a routine consisting of spectrumanalyzer commands, assigns the routinea label, and stores the routine and itslabel in the user memory.
Clears softkeys 1 through 6.
Allows you define the function and labelof a softkey. The softkey label isupdated whenever a softkey is pressed.
Assigns a label and user-definedfunction to a softkey.
Allows you to activate inverse videomode or underline part or all of thesoftkey label.
Executes the specified, previouslydefined softkey.
Relabels a softkey without changing itsfunction.
Returns the amount of spectrumanalyzer memory available.
Selects and displays the softkey menuson the spectrum analyzer screen.
Returns from user-defined function.Saves menu 1 under the specified menunumber.
’ Options 101 and 102, or Option 301 required.
Programming Commands 5-27

F u n c t i o n
Category
USER-DEFINED
WINDOWS
‘Ihble 5-4. Functional Index (continued)
Command Corresponding DescriptionKey Function
TRDEF Declares a user-defined trace.
USTATE Transmits information that has beenstored in the analyzer by the user.
VARDEF Creates a user-defined variable andassigns it a value.
WINNEXT m* Makes the window that is currently notthe active window, active.
WINOFF WINDDWS OFF * Turns off the windows display.
WINON m)* Activates the windows display mode.
WINZOOM (ZOOM-* Expands the size of the active windowso that it fills the entire spectrumanalyzer display.
ZMKCNTR ZONE CKNTNR * Positions the zone marker at thespecified frequency.
ZMKPNL ZmIE PK LEFT * Places the zone marker at the nextsignal peak that is left of the zonemarker’s current position.
ZMKPNR ZONB PK RIGHT * Places the zone marker at the next peakto the rlght of the zone marker’s currentposition.
ZMKSPAN ZONE SPAN * Allows you to change the width of thezone marker.
’ Not available for the HP 8590L or HP 8592L.
5.28 Programming Commands

ABORT Abort
ABORTAbortStops the execution all user-defined functions and readies the instrument for the nextcommand received.
Syntax
ABORT
Related Commands: ACTDEF, FUNCDEF, REPEAT/UNTIL, RETURN.
ExampleIn the example below, ABORT is in the function called D-LP.
10 OUTPUT 718*"IP-"20 OUTPUT 718;"CLRDSP;"
30 OUTPUT 718;"TRDSP TRA,OFF;"40 OUTPUT 718;"ANNOT 0FF;GRAT OFF;"50 OUTPUT 718;"VARDEF C-OUNT,O;"
60 !70 OUTPUT 718;"FUNCDEF D-LP,Q";
80 OUTPUT 718;"REPEAT;";90 OUTPUT 718;"ADD C,OUNT,C-OUNT,lOO;";100 OUTPUT 718;"PU,PA 100,lOO;PD;";110 OUTPUT 718;"DSPLY C-OUNT,4.0;";120 OUTPUT 718;"IF C_OUNT,EQ,300 THEN;ABORT;ENDIF;";
130 OUTPUT 718;"UNTIL C_OUNT,EQ,400;";
140 OUTPUT 718*"0*"*150 OUTPUT 718;"F;NCDEF S-HELL,@";
160 OUTPUT 718;"D,LP;TEXT!INSIDE S-HELL!;@"
170 !180 OUTPUT 718;"SBHELL;"
190 END
Initializesspectrum analyzerClears graphics from the spec-trum analyzer display.Turns ofl trace A.Blanks annotation and graticule.Declares a user-&fined vari-able called C-OUNT
Declares a user-d@inedfunc-tion called D-LRBegins a repeat loop.Adds 100 to COUNT.
Displays the valz~ of C-OlliNT.Aborts the function whenCOUNT is equal to 300.This is not executed becauseof the ABORT command inline 120.Ma&s end of D-LI?DQhtes second user-d@inedfunction called SHELL.Executes D-LPand displaysmessage on display
This calls the S-HELLjknc-tion which in turn calls theD_LP function.
Programming Commands 5-29

ABORT Abort
DescriptionIf ABORT is encountered in a function that has been executed by pressing a softkey, thefunction is interrupted and front-panel control is returned.
If the ABORT function is nested within one or more user-defined functions, ABORT stops theexecution of all user-defined functions and readies the spectrum analyzer to act on the nextcommand received.
In comparison, the RETURN command also interrupts operation of a user-defined function, butRETURN returns the operation to the point at which the user-defined function was called. (See“RETURN” for more information.)
5-30 Programming Commands

ABS Absolute
ABSAbsolutePlaces the absolute value of the source values in the destination.
Syntax
7 d e s t i n a t i o n -
b u s e r - d e f i n e d t r a c e d
h t r a c e r a n g e /
b predefined v a r i a b l e /
u s e r - d e f i n e d varioblej
Item
User-de&ted trace
User-defined variable
PredeEned variable A command that acts as a variable. Refer to Table 5-l.
PrederIned function Function that returns a value. Refer to Table 5-l.
Trace range A segment of trace A, trace B, trace C, or a user-defined trace.
Number Anv real or inteeer number.
Description/Default
A trace defined by the TRDEF command.
A variable defined by VARDEF or ACTDEF commands.
J
Any valid trace name.
Any valid variablename.
Real number range.
Prerequisite Commands: TRDEF when using user-defined trace. ACTDEF or VARDEF whenusing user-defined variable. TS when using trace data.
Programming Commands 5-31

ABS Absolute
Example10 OUTPUT 718;“IP;SNGLS;”20 OUTPUT 718;“VARDEF P,OINT,O;”
30 OUTPUT 718;“ABS P-OINT,-2;”40 OUTPUT 718;“P_OINT?;“;50 ENTER 718;Second60 DISP Second70 END
Description
Initializes spectrum analyze?; stops sweeping.D@ines a variable, called P-OINT, and initializes itto 0.Places the absolute value of -2 into POINTReturns value of IWNT to computerAssigns value to computer variable, Second.Displays the absolute value (2).
The source and the destination may be different lengths. The lengths of predefined traces(trace A, trace B, or trace C) is 401, while user-defined traces have a length of up to 2047, andvariables have a length of 1. When the source is longer than the destination, the source istruncated to fit. When the source is shorter than the destination, the last element is repeatedto fill the destination.
5-32 Programming Commands

ACP Adjacent Channel Power
ACPAdjacent Channel PowerPerforms the adjacent channel power measurement.
Syntax
ACPXACP
Equivalent Softkey: AD3 CfiAN POWER.Related Commands: ACPPAR, ACPSP, ACPBW, ACPSNGLM, ACPCONTM, ACPGRAPH,ACPGR, ACPMK.
Example
OUTPUT 718;"ACP;" F&forms the adjacent channel power masurewsnt.
DescriptionACP measures the power of the carrier and the power of the channels that are adjacent to thecarrier, and then computes a power ratio for each of the adjacent channels, using the carrierpower as a reference. ACP performs the adjacent channel power measurement using the valuesfor channel spacing (ACPSP) and channel bandwidth (ACPBW).
To use ACP:
1. Set the center frequency to the carrier’s frequency.
2. For best accuracy, set the reference level so that the carrier signal peak is within the first(top) division of the display graticule.
3. Select the channel spacing with the ACPSP command.
4. Select the channel bandwidth with the ACPBW command.
5. If you want the spectrum analyzer settings to be set automatically, ensure that ACPPAR isset to 1. If you want to set the spectrum analyzer settings manually, set ACPPAR to 0. (See“ACPPAR” for more information about selecting the spectrum analyzer settings manually.)
6. If the spectrum analyzer is in the continuous-sweep mode, use the single sweep command(SNGLS) to select the single-sweep mode.
7. Execute the ACP command.
8. Query ACPERR to determine if there is a setup error for the ACP measurement. See thefollowing table for more information about ACPERR.
9. If no error occurred, query ACPPWRTX, ACPMAX, ACPLOWER, and ACPUPPER variablesfor the numeric results of the ACP measurement. See the following table for moreinformation about these variables.
10. If no error occurred, query trace A (TRA) for the trace results of the ACP measurement.
Measurement Results: The results of the ACP command are stored in the variables and tracein the following table.
Programming Commands 5-33

ACP Adjacent Channel Power
ACP Measurement Results
Variableor Trace
Description units
1CPERR A variable that indicates if setup errors occurred for the ACP measurement. NoneIf ACPERR is 0, no errors occurred. If ACPERR is greater than 0, an erroroccurred. An ACPERR value of 1 to 7 indicates that the frequency span,channel spacing, or the channel bandwidth are not set correctly. AnACPERR value of 1 to 7 indicates the following:
KPPWRTX
1 Frequency span < (2 x channel spacing + channel bandwidth).2 Channel bandwidth > 2 x channel spacing.3 Frequency span < (2 x channel spacing + channel bandwidth) and
channel bandwidth > 2 x channel spacing.4 Channel bandwidth < frequency span/loo.5 Frequency span < (2 x channel spacing + channel bandwidth) and
channel bandwidth < frequency span/loo.6 Channel bandwidth > 2 x channel spacing and channel bandwidth
< frequency span/loo.7 Frequency span < (2 x channel spacing + channel bandwidth), channel
bandwidth > 2 x channel spacing, and channel bandwidth < frequencyspan/loo.
A variable that contains the total transmit band carrier power. ACPPWRTX Determined byis calculated by the following: AUNITS command
Default unit is dBm.10 x b(Powe~carTier)
KPMAX
KPLOWER
A variable that contains the relative power level of the adjacent channelwith the highest measured power level.
A variable that contains the relative power level found in the loweradjacent channel. ACPLOWER is calculated by the following:
dB
dB
LCPUPPER
‘RA
10 x log( P’-‘~e%wer channel
PoweTcarrier1
A variable that contains the relative power level found in the upper dBadjacent channel. ACPUPPER is calculated by the following:
Power10 x log(
upper channel
Power 1carrier
TRA is trace A. Trace A contains the swept RF spectrum that was used to Determined by themeasure adjacent channel power. trace data format
(TDF) command.
RestrictionsExecuting ACP exits the following functions: windows display mode (WINON), N dB pointmeasurement (NDBPNT), the FFT menu measurements (FFTAUTO, FFTCONTS, FFTSNGLS),gate utility functions (GDRVUTIL), TO1 measurement (TOI), marker table (MKTBL), peak table(PKTBL), percent AM (PCTAM), or peak zoom (PKZOOM).
AUNITS of W or V, will give incorrect results for ACPMAX, ACPLOWER, and ACPUPPER.
5.34 Programming Commands
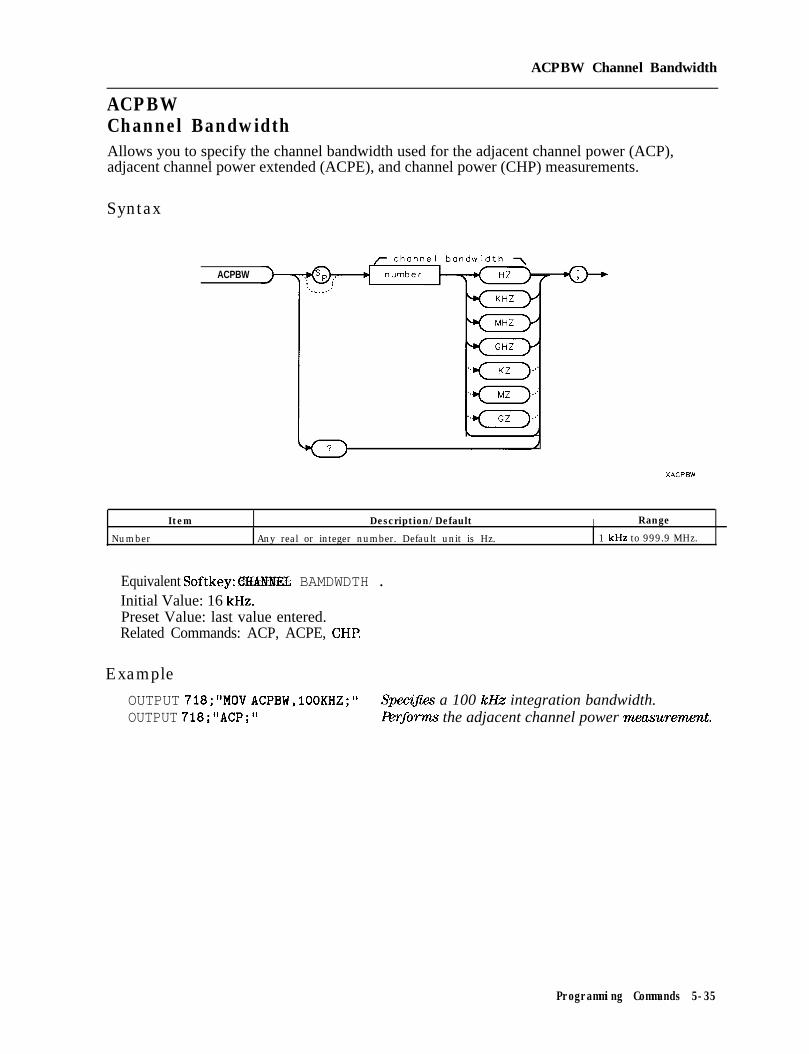
ACPBW Channel Bandwidth
ACPBWChannel BandwidthAllows you to specify the channel bandwidth used for the adjacent channel power (ACP),adjacent channel power extended (ACPE), and channel power (CHP) measurements.
Syntax
ACPBW
Item Description/Default I Range
Number Any real or integer number. Default unit is Hz. 1 kHz to 999.9 MHz.
Equivalent Softkey: CHANNEL BAMDWDTH .Initial Value: 16 kHz.Preset Value: last value entered.Related Commands: ACP, ACPE, CHP.
Example
OUTPUT 718;"MOV ACPBW,lOOKHZ;" SpeciJies a 100 kHz integration bandwidth.OUTPUT 718."ACP*"9 8 F&forms the adjacent channel power measurement.
Programming Commands 5-35

DescriptionThe value of ACPBW is used when calculating the results of the adjacent channel (ACP),adjacent channel extended (ACPE), or channel power (CHP) measurement. The value ofACPBW is also used when ACPPAR is set for automatic coupling the spectrum analyzer settingsfor the ACP, ACPE, or CHP measurement.
Once you enter a value into ACPBW, that value is retained until you change it, or executeDISPOSE ALL. Pressing (FiZ5Fij or turning the spectrum analyzer off does not change thevalue of ACPBW.
You can execute the ACPBW command two different ways. You can either execute the ACPBWcommand directly (for example, “ACPBW IOOKHZ; ‘I) or use the MOV command to move the valuefor the bandwidth into the ACPBW command (for example, “MOV ACPBW,lOOKHZ;“). If you usethe MOV command, no text is displayed in the active function area during command execution.
Query Response
chonne Ib a n d w i d t h
/ \o u t p u t
t e r m i n a t i o n +
5-36 Programming Commands
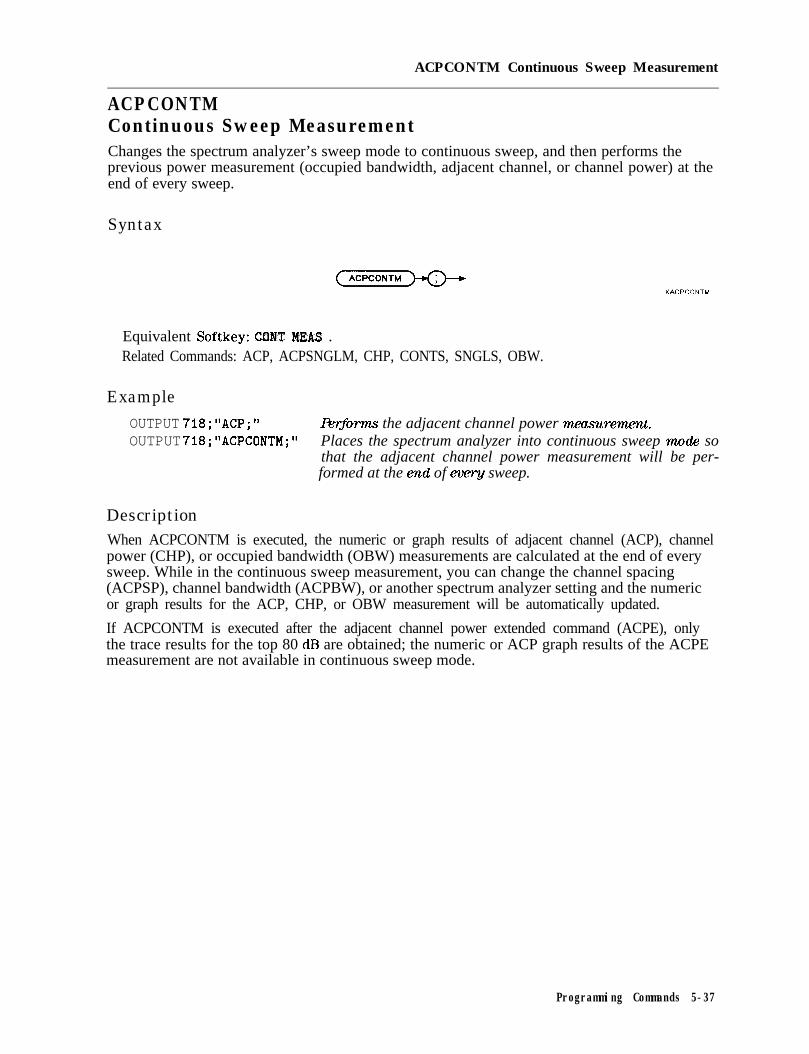
ACPCONTM Continuous Sweep Measurement
ACPCONTMContinuous Sweep MeasurementChanges the spectrum analyzer’s sweep mode to continuous sweep, and then performs theprevious power measurement (occupied bandwidth, adjacent channel, or channel power) at theend of every sweep.
Syntax
Equivalent Softkey: CONT MEAS .Related Commands: ACP, ACPSNGLM, CHP, CONTS, SNGLS, OBW.
Example
OUTPUT 718*"ACP*"OUTPUT 718;"ACP~ONTM;"
I4qforrn.s the adjacent channel power measurenzent.Places the spectrum analyzer into continuous sweep mode sothat the adjacent channel power measurement will be per-formed at the end of ever9 sweep.
DescriptionWhen ACPCONTM is executed, the numeric or graph results of adjacent channel (ACP), channelpower (CHP), or occupied bandwidth (OBW) measurements are calculated at the end of everysweep. While in the continuous sweep measurement, you can change the channel spacing(ACPSP), channel bandwidth (ACPBW), or another spectrum analyzer setting and the numericor graph results for the ACP, CHP, or OBW measurement will be automatically updated.
If ACPCONTM is executed after the adjacent channel power extended command (ACPE), onlythe trace results for the top 80 dB are obtained; the numeric or ACP graph results of the ACPEmeasurement are not available in continuous sweep mode.
Programming Commands 5-37

ACPEAdjacent Channel Power ExtendedPerforms the adjacent channel power extended measurement.
Syntax
ACPE
Equivalent Softkey: AKl CRAM PWR extd .Related Commands: ACPPAR, ACPSNGLM, ACPSP, ACPBW.
Example
OUTPUT 718;"ACPE;" &forms the adjacent channel power extended meamrewznt.
DescriptionACPE performs the adjacent channel power measurement using the values for channel spacing(ACPSP) and channel bandwidth (ACPBW). ACPE is similar to ACP, but unlike ACP, ACPEmeasures the adjacent channel power over an extended dynamic range. The extended range ismeasured by taking two measurement sweeps, with the reference level for each sweep set todifferent values, and then combining the trace data.
Executing ACPE places the spectrum analyzer in the single sweep measurement mode. Thelog scale is set to 13 dB/div, which provides an actual display range of 104 dB. If you executethe continuous sweep measurement command (ACPCONTM), only the trace results for the top80 dB are obtained; the numeric and ACP graph results of the ACPE measurement are notavailable.
To use ACPE:
1. Set the center frequency to the carrier’s frequency.
2. For best accuracy, set the reference level so that the carrier signal peak is within the first(top) division of the display graticule.
3. Select the channel spacing with the ACPSP command.
4. Select the channel bandwidth with the ACPBW command.
5. If you want the spectrum analyzer settings to be set automatically, ensure that ACPPAR isset to 1. If you want to set the spectrum analyzer settings manually, set ACPPAR to 0. See“ACPPAR” for more information about selecting the spectrum analyzer settings manually.
6. If the spectrum analyzer is in the continuous-sweep mode, use the single sweep command(SNGLS) to select the single-sweep mode.
7. Execute the ACPE command.
8. Query ACPERR to determine if there is a setup error for the ACP measurement. See thefollowing table for more information about ACPERR.
9. If no error occurred, query ACPPWRTX, ACPMAX, ACPLOWER, and ACPUPPER variablesfor the numeric results of the ACPE measurement. See the following table for moreinformation about these variables.
5.38 Programming Commands
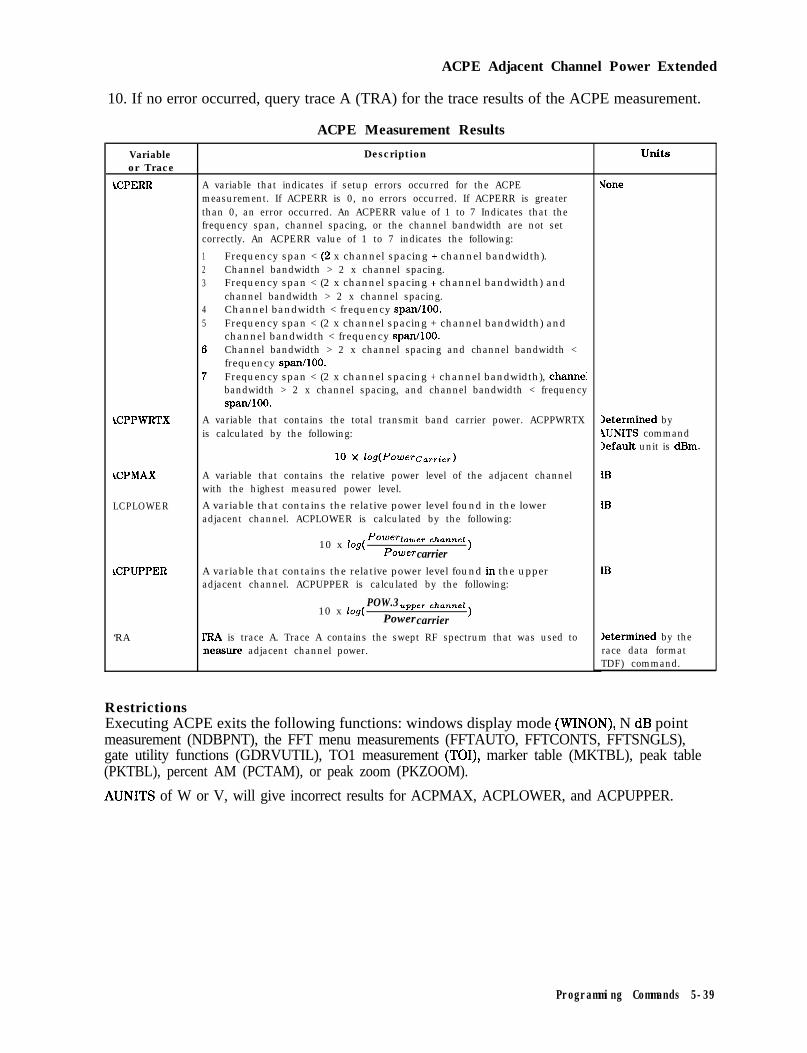
ACPE Adjacent Channel Power Extended
10. If no error occurred, query trace A (TRA) for the trace results of the ACPE measurement.
ACPE Measurement Results
Variableor Trace
1CPERR
KPPWRTX
LCPMAX
LCPLOWER
k?PUPPER
‘RA
Description
A variable that indicates if setup errors occurred for the ACPEmeasurement. If ACPERR is 0, no errors occurred. If ACPERR is greaterthan 0, an error occurred. An ACPERR value of 1 to 7 Indicates that thefrequency span, channel spacing, or the channel bandwidth are not setcorrectly. An ACPERR value of 1 to 7 indicates the following:
1 Frequency span < (2 x channel spacing + channel bandwidth).2 Channel bandwidth > 2 x channel spacing.3 Frequency span < (2 x channel spacing + channel bandwidth) and
channel bandwidth > 2 x channel spacing.4 Channel bandwidth < frequency span/loo.5 Frequency span < (2 x channel spacing + channel bandwidth) and
channel bandwidth < frequency span/loo.6 Channel bandwidth > 2 x channel spacing and channel bandwidth <
frequency span/loo.7 Frequency span < (2 x channel spacing + channel bandwidth), channe:
bandwidth > 2 x channel spacing, and channel bandwidth < frequencyspan/loo.
A variable that contains the total transmit band carrier power. ACPPWRTXis calculated by the following:
lo X ~o.!7(Po~eTCarrie~)
A variable that contains the relative power level of the adjacent channelwith the highest measured power level.
A variable that contains the relative power level found in the loweradjacent channel. ACPLOWER is calculated by the following:
10 x log( ~~~~%wer channel
POWCT 1carrier
A variable that contains the relative power level found ln the upperadjacent channel. ACPUPPER is calculated by the following:
POW.310 x log( upper channel
Power 1carrier
IRA is trace A. Trace A contains the swept RF spectrum that was used toneasure adjacent channel power.
units
Vane
determined byIUNITS commanddefault unit is dBm.
1B
1B
iB
determined by therace data formatTDF) command.
RestrictionsExecuting ACPE exits the following functions: windows display mode (WINON), N dB pointmeasurement (NDBPNT), the FFT menu measurements (FFTAUTO, FFTCONTS, FFTSNGLS),gate utility functions (GDRVUTIL), TO1 measurement (TOI), marker table (MKTBL), peak table(PKTBL), percent AM (PCTAM), or peak zoom (PKZOOM).
AUNITS of W or V, will give incorrect results for ACPMAX, ACPLOWER, and ACPUPPER.
Programming Commands 5-39

ACPGRAdjacent Channel Power Graph On or OffDetermines if the adjacent channel power (ACP) graph function is enabled or disabled.
Syntax
Equivalent Softkey: ACPGWR ON OFF .Related Commands: ACP, ACPE.
ExampleOUTPUT 718;"ACP;" F&yfoms the adjacent channel power measurement.OUTPUT 718;"MOV ACPGR,l;" l3~~bles the ACP graph function and creates a graph of
ACP as a function of the frequency offset from the centerfreq=y.
DescriptionSetting ACPGR to 1, does the following:
w Turns off the display of the ACP numeric results.
w Generates a graph of the adjacent channel power ratio, for the selected channel bandwidth,as a function of frequency spacing from the center frequency.
n Places the graph in trace C.
n Adds the GRPH MKR ON OFF softkey to the menu.
n If in continuous measurement mode, the ACP graph will be updated at the end of everysweep.
5-40 Programming Commands

ACPGR Adjacent Channel Power Graph On or Off
Setting the ACPGR to - 1, does the following:
n Turns off the display of the ACP graph in trace C.
n Calculates and displays the ACP numeric results.
n Removes the GRPH MKR ON OFF softkey from the menu.
n Turns off the ACP graph marker.
n If in continuous measurement mode, the numeric results will be updated at the end of everysweep.
When the graph is generated, the reference level represents an adjacent channel power ratio of0, and the horizontal center represents a frequency offset (and channel spacing) of 0 Hz. Theresults of ACPGR are not defined for frequency spacings where the graph is drawn below thebottom graticule line.
Programming Commands 5-41

ACPGRAPHCompute the Adjacent Channel Power GraphComputes and displays an adjacent channel power (ACP) graph.
Syntax
Equivalent Softkey: none.Related Commands: ACP, ACPE.
ExampleOUTPUT 718;"ACP;" Performs the adjacent channel power measurement.OUTPUT 718;"ACPGRAPH;" Creates a graph of ACP as a function of the frequency offset
from the center-frequency.
DescriptionACPGRAPH uses the ACP spectrum data that was obtained (in trace A) by the previousadjacent channel power or adjacent channel power extended measurement to generate thegraph. (Use the ACP or ACPE command to perform the adjacent channel power measurement.)ACPGRAPH does the following:
I Generates a graph of the adjacent channel power ratio, for the selected channel bandwidth,as a function of frequency spacing from the center frequency.
n Places the graph in trace C. The units for all traces is determined by the trace data format(TDF) command.
When the graph is generated, the reference level represents an adjacent channel power ratio of0, and the horizontal center represents a frequency offset (and channel spacing) of 0 Hz. Theresults of ACPGRAPH are not defined for frequency spacings where the graph is drawn belowthe bottom graticule line.
5-42 Programming Commands

ACPMK Adjacent Channel Power Marker On or Off
ACPMKAdjacent Channel Power Marker On or OffDetermines if the graph marker function is enabled or disabled for the adjacent channel power(ACP) graph.
Syntax
xacpmk
Equivalent Softkey: GRPH ON OFF .Related Commands: ACPGR, ACPGRAPH, CHPGR, ACPSNGLM, ACPCONTM.
Example
OUTPUT 718;"ACPOUTPUT 718;"MOV
OUTPUT 718;"MOV
. II8 &forms the adjacent channel power measurement.ACPGR,l;" Enables the ACP graph function and creates a graph of
ACP as a function of the frequency offset from the centerfreq-y.
ACPMK,l;" Enables the ACP graph mm-km
DescriptionSetting ACPMK to 1, does the following for ACP graph:
w Positions a reference marker on the trace for ACP graph at the center frequency position.
w Positions a A marker on the trace at one channel spacing above the center frequency.
n Displays numeric values for delta frequency, ACP ratio, and channel power at the markerposition.
Setting ACPMK to 1, does the following for channel power graph:
w Positions a marker on the trace for channel power graph at center frequency position.
n Displays numeric values for frequency and channel power at the marker position.
Setting the ACPMK to -1, turns off the marker function.
Programming Commands 5.43
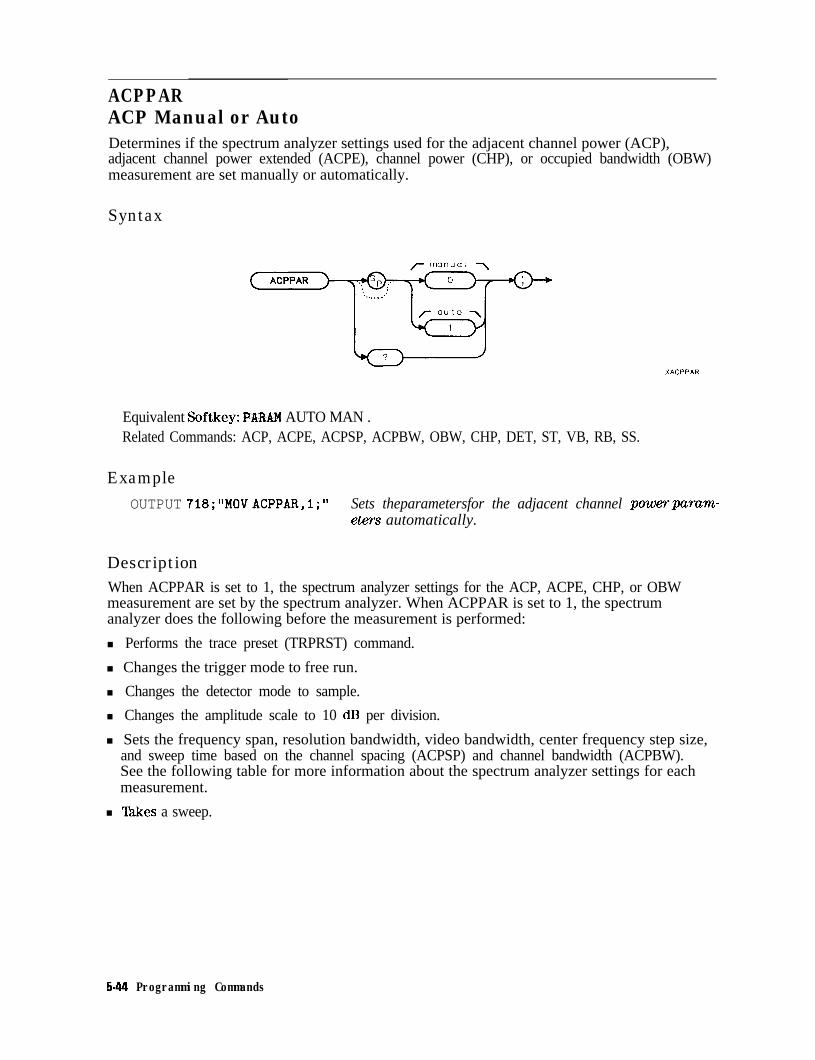
ACPPARACP Manual or AutoDetermines if the spectrum analyzer settings used for the adjacent channel power (ACP),adjacent channel power extended (ACPE), channel power (CHP), or occupied bandwidth (OBW)measurement are set manually or automatically.
Syntax
Equivalent Softkey: PARA?! AUTO MAN .Related Commands: ACP, ACPE, ACPSP, ACPBW, OBW, CHP, DET, ST, VB, RB, SS.
ExampleOUTPUT 718;"MOV ACPPAR,l;" Sets theparametersfor the adjacent channel powerparam-
eters automatically.
DescriptionWhen ACPPAR is set to 1, the spectrum analyzer settings for the ACP, ACPE, CHP, or OBWmeasurement are set by the spectrum analyzer. When ACPPAR is set to 1, the spectrumanalyzer does the following before the measurement is performed:
n Performs the trace preset (TRPRST) command.
n Changes the trigger mode to free run.
n Changes the detector mode to sample.
n Changes the amplitude scale to 10 dB per division.
n Sets the frequency span, resolution bandwidth, video bandwidth, center frequency step size,and sweep time based on the channel spacing (ACPSP) and channel bandwidth (ACPBW).See the following table for more information about the spectrum analyzer settings for eachmeasurement.
n ‘fakes a sweep.
5-44 Programming Commands

ACPPAR ACP Manual or Auto
‘able 5-5. Spectrum Analyzer Settings, ACPPAR is Set to Automatic
Measurement Res Video Span Step SweepBandwidth Bandwidth Size Time
Adjacent Channel Power Highest setting that does 10 x RB ACPSP AutoWJ’) not exceed 0.025 x (400 x ACPSP)
ACPBW’ INT[< (4OOxACPSP)~xACPSP+I.~XACPBW)~
Channel Power (CHP) Highest setting that does 10 x RB 2 x ACPBW ACPSP Autonot exceed 0.025 xACPBW’
Occupied Bandwidth Highest setting that does 10 x RB 3 x ACPSP ACPSP AutoVW not exceed 0.02 x
ACPSP *
* If Option 130 is not installed in the spectrum analyzer, the narrowest resolution bandwidth is limited to 1 kHz.
When ACPPAR is set to 0, you must set the spectrum analyzer settings for the ACP, ACPE, CHP,or OBW measurement. You must ensure that trace A contains the RF spectrum to be measured,and that the frequency span, resolution bandwidth, video bandwidth, and the detector are setappropriately for the measurement. When ACPPAR is set to 0, the measurement commands(ACP, ACPE, OBW, CHP) do not take a sweep before making the measurement.
You can execute the ACPPAR command two different ways. You can either execute theACPPAR command directly (for example, “ACPPAR 1; ‘I) or use the MOV command to movethe 1 or 0 into the ACPPAR command (for example, “MOV ACPPAR, 1; ‘I). If you use the MOVcommand, no text is displayed in the active function area during command execution.
Query Response
r manual 7
A 0o u t p u t
/ l t e r m i n a t i o n ---)
Programming Commands 5-45

ACPSNGLMSingle Sweep MeasurementChanges the spectrum analyzer’s sweep mode to single sweep, performs a take sweep (TS),and then performs the previous power measurement (occupied bandwidth, adjacent channel,adjacent channel power extended, or channel power).
Syntax
Equivalent Softkey: SINGLE MEAS.Related Commands: ACP, ACPCONTM, ACPE, CHP, CONTS, SNGLS, OBW.
ExampleOUTPUT 718;"ACP;" Performs the adjacent channel power measurement.OUTPUT 718*"ACPSNGLM*"8 , Repeats the previous wzeasuremmt once.
DescriptionSee the “ACP ” “ACPE, ” “CHP,” and “OBW” for more information about the measurementresults of each measurement.
5.46 Programming Commands

ACPSP Channel Spacing
ACPSPChannel SpacingAllows you to specify the frequency spacing between channels.
Syntax
- c h a n n e l s p a c i n g 7-
HZ
Item Description/Default Range
Number Any real or integer number. Default unit is Hz. 1 kHz to 999.9 MHz.
Equivalent Softkey: CHANNEL SPACING,Initial Value: 25 kHz.Preset Value: last value entered.Related Commands: ACP, ACPE.
Example
OUTPUT 718;"MOV ACPSP,lOOKHZ;" [email protected] 100 kHz frequency spacing between channels.OUTPUT 718;"ACP;" Performs the adjacent channel power wxmsurenz-ent.
DescriptionThe value of ACPSP is used when calculating the results of the adjacent channel (ACP) oradjacent channel extended (ACPE) measurement. The value of ACPSP is also used whenACPPAR is set for automatic coupling of the spectrum analyzer settings for the ACP, ACPE,CHP, or OBW measurement.
Once you enter a value into ACPSP, that value is retained until you change it, or executeDISPOSE ALL. Pressing (JZF] or turning the spectrum analyzer off does not change thevalue of ACPSP
You can execute the ACPSP command two different ways. You can either execute the ACPSPcommand directly (for example, "ACPSP 1OOKHZ ; I’) or use the MOV command to move thefrequency value into the ACPSP command (for example, ~~MOVACPSP,lOOKHZ;"). If you use theMOV command, no text is displayed in the active function area during command execution.
Programming Commands 5-47

ACPSP Channel Spacing
Query Response
chonne Ir s p a c i n g
o u t p u tt e r m i n a t i o n ---)
5-46 Programming Commands

ACTDEF Active Function Definition
ACTDEFActive Function DefinitionCreates a user-defined active function.
Syntax
f u n c t i o n n a m e/ \
ACTDEF c h a r a c t e r
t e x t f o r a c t i v ef u n c t i o n r e a d o u t/ \
del i m i t e r c h a r a c t e r dei i m i t e r
- p r e s e t v a l u e - u n i t s
u s e r - d e f i n e d v a r i a b l e
XACTDEF
Programming Commands 5-49

ACTDEF Active Function Definition
Item Description/Default Range
Character (function name) Any valid character. Use the function name as the remote 2 to 11 characterscommand name. long, A through Z and
the underscore (theunderscore should beused as the secondcharacter of thelabel).
Character (text for active Any valid character. The active function label is displayed in thefunction label) active function block (when the function is active).
User-defined variable A variable defined by VARDEF or ACTDEF commands. Any valid variablename.
Number Any real or integer number. Default value is 0, default unit is Real number range.none.
Delimiter Matching characters marking the beginning and end of the list of - 1 \ @ = / ^ $ % ; ! ’ :spectrum analyzer commands. ” &
Analyzer command Any valid spectrum analyzer command.
User-deflned function A function defined by the FUNCDEF command. Any valid functionname.
Prerequisite Command: FUNCDEF when using a user-defined function. VARDEF when usinga user-defined variable.
Example 1
10 DIM A$[1501
20 OUTPUT 718;"ACTDEF M-BW,%MY BANDWIDTH%,5MHZ,STEP,@";30 OUTPUT 718;"MOV RB,M-BWO;";
40 OUTPUT 718;"M,BW;"50 OUTPUT 718;"ACTDEF M-BW?;"
60 ENTER 718;A$70 DISP A$
Dimensions array to holdquery response.lk$ms a function calledM-BW M-BWallows ma-nipulation of the ini-tial value of RES BW (5MHz) by the step keysand the knob. The res-olution bandwidth willbe rounded to the near-est allowable bandwidth,howevex The “@” sym-bol marks the end of theACTDEF declaration.Activates the M-BWfunction.Queries the &fir&ion ofthe M-BWfunction.
Displays the definitionof the M-BWfunction.
80 END
5-50 Programming Commands

ACTDEF Active Function Definition
Example 2This example uses ACTDEF in a downloadable program that is created by the KEYDEFcommand. In this example, the ACTDEF function D-SPAN is assigned to softkey 1. Whensoftkey 1 is pressed, ENTER FFT SPAN is displayed on the spectrum analyzer display. When avalue is entered, the sweep time is changed to prepare the spectrum analyzer for making a fastFourier transform measurement. (See “FFT” for more information about making a fast Fouriertransform measurement.)
OUTPUT 718;"KEYDEF l,D-SPAN,@ FFTISPANO;" Assigns D-SPAN to SOJ%key 1.
OUTPUT 718;"ACTDEF D-SPAN,OENTER FFT SPANO,lOO,HZ,Q"; Defines the DSPANfunc-tion. The D-SPAN func-tion displays ENTER FFTSPAN on the spectrum an-alyzer display, and hasan initial value of 100 Hz.Thefrequency span mustbe zero to make a FFTmeasurement.
OUTPUT 718;"MOV SP,O;";
OUTPUT 718;"DIV ST,200,D_SPAN;";
OUTPUT 718;"@;"LOCAL 718
Changes the spectrum an-al yzer sweep time accord-ing to the value of D-SPAN.DSPANis divided by 200,which represents the num-ber of buckets.Ends the ACTDEF declaration.
After executing this example, the softkey label of softkey 1 is FFT SPBBS . Softkey 1 can beaccessed by pressing (j-j, User Mems .
DescriptionWith the ACTDEF command, you can create an active function that is similar to the activefunctions that are already provided by the spectrum analyzer. For example, CF, DL, AT, MKA,MKFCR, MKD, MKF, MKN, RB, SS, ST, TH, VAVG, VB, VBR are all active functions that areprovided by the spectrum analyzer.
The ACTDEF command consists of the function name, the text for the active function readout,the preset value, the unit, and the analyzer commands or user-defined function.
Function name: The function name is the name that will be used to invoke the ACTDEFfunction. See line 40 of Example 1 for an example of invoking an ACTDEF function.
Text for the active function readout: This is the text is displayed, when the ACTDEFfunction is active, in the active function readout area of the spectrum analyzer display.
Preset value: The preset value is the value of the ACTDEF function until you change it.Executing an instrument preset (IP) resets the ACTDEF function’s value back to the presetvalue.
Units: The ACTDEF function’s value can be manipulated in different ways depending on theunits parameter that is specified. For example, if you select INT (integer) units, the value of theACTDEF function can only be incremented or decremented by 1. For the INT unit, the stepkeys and the knob can be used to change the function’s value.
Programming Commands 5-51

ACJTDEF Active Function Definition
Refer to the following table for a description of the different unit parameter.
Behavior of Unit Parameters for ACTDEF Command
Parameter
INT
STEP
NONE
HZ
ABSHZ
SEC
DB
DBM
V
StepIncrement Value
Integer, increment ordecrement by 1 only
Increment or decrement by1 only
Not applicable
Resolution bandwidthduring zero-span mode;otherwise, 10% of span.
1.5, 2, 3, 5, 7.5
1.5, 2, 3, 5, 7.5
dB per division
dB per division
1.5, 2, 3, 5, 7.5
KnobIncrement Value
1
.1
Not applicable
Resolution bandwidth,during zero-span mode;otherwise, 0.05% of span.
1%
1%
1% of dB per division
1% of dB per division
1%
unit-Keys
None
None
None
Frequency
Frequency, in absolute Hz
Time
Relative amplitude
Absolute amplitude
Volts
Some of the unit parameters specify the units of the function value (Hz, seconds, dB, dBm, V).The STEP, INT, and NONE parameters are unitless values. The STEP unit parameter worksthe same as the INT unit parameter. When using the INT, STEP, and NONE parameters inan ACTDEF declaration, the value displayed on spectrum analyzer display for the ACTDEFfunction value is rounded to the nearest integer; however the actual value in spectrumanalyzer memory is not rounded.
Use the following guidelines when defining ACTDEF:
n The function name used in the ACTDEF declaration must be unique. Do not use an existingTable 5-2 for a list of
reserved words.
n Limit the number of characters (between the delimiters) in the list of spectrum analyzercommands to a maximum of 2047 characters.
Query ResponseThere are two ways to query the ACTDEF command. Querying the ACTDEF function’s namereturns the value of the ACTDEF function. For example, if the ACTDEF function’s name isTEST, executing OUTPUT 718;"TEST ? ; ‘I returns the value of ACTDEF function TEST in thefollowing format:
5-52 Programming Commands

ACTDEF Active Function Definition
Querying both “ACTDEF” and the ACTDEF function’s name returns the definition of thefunction. For example, execute OUTPUT 718 ; "ACTDEF TEST. ,7 * ” (TEST is the ACTDEF function’sname).
u s e r - d e f i n e d t e x t f o r a c t i v ef u n c t i o n nome f u n c t i o n r e a d o u t
/ \ / \
A C T D E F c h a r a c t e r c h a r a c t e r
u s e r - d e f i n e d f u n c t i o n,- r o u t i n e -\
a n a l y z e r comnand o u t p u t’ t e r m i n a t i o n +
QACTDEF
Programming Commands 5-53
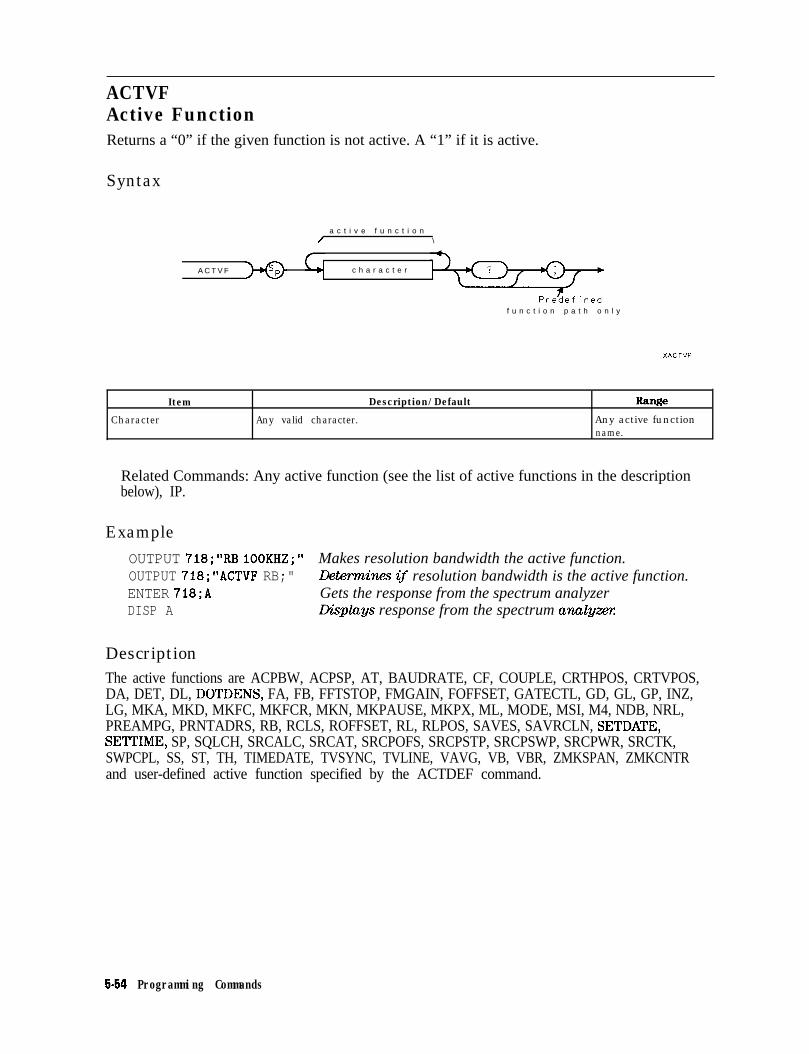
ACTVFActive FunctionReturns a “0” if the given function is not active. A “1” if it is active.
Syntax
A C T V F
a c t i v e f u n c t i o n/ \
c h a r a c t e r
Prezef inedf u n c t i o n p a t h o n l y
Item Description/Default tinge
Character Any valid character. Any active functionname.
Related Commands: Any active function (see the list of active functions in the descriptionbelow), IP.
Example
OUTPUT 718;"RB IOOKHZ;" Makes resolution bandwidth the active function.OUTPUT 718;"ACTVF RB;" Lleterrnines if resolution bandwidth is the active function.ENTER 718;A Gets the response from the spectrum analyzerDISP A LXsplays response from the spectrum analyzer:
DescriptionThe active functions are ACPBW, ACPSP, AT, BAUDRATE, CF, COUPLE, CRTHPOS, CRTVPOS,DA, DET, DL, DOTDENS, FA, FB, FFTSTOP, FMGAIN, FOFFSET, GATECTL, GD, GL, GP, INZ,LG, MKA, MKD, MKFC, MKFCR, MKN, MKPAUSE, MKPX, ML, MODE, MSI, M4, NDB, NRL,PREAMPG, PRNTADRS, RB, RCLS, ROFFSET, RL, RLPOS, SAVES, SAVRCLN, SETDATE,SETTIME, SP, SQLCH, SRCALC, SRCAT, SRCPOFS, SRCPSTP, SRCPSWP, SRCPWR, SRCTK,SWPCPL, SS, ST, TH, TIMEDATE, TVSYNC, TVLINE, VAVG, VB, VBR, ZMKSPAN, ZMKCNTRand user-defined active function specified by the ACTDEF command.
5-54 Programming Commands

ADD Add
ADDAddAdds the sources and sends the sum to the destination.
Syntax
ADDADD
7 d e s t i n a t i o n -7 d e s t i n a t i o n -
k u s e r - d e f i n e d t r a c e /k u s e r - d e f i n e d t r a c e /
kk t r a c e ranget r a c e range //
% p r e d e f i n e d v a r i a b l e I% p r e d e f i n e d v a r i a b l e I
u s e r - d e f i n e d variable)u s e r - d e f i n e d variable)
,- s o u r c e 1 ‘\ ,- s o u r c e 2 -,
‘+ u s e r - d e f i n e d t r a c e /
Y t r a c e r a n g e /
Y p r e d e f i n e d v a r i a b l e /
u s e r - d e f i n e d v a r i a b l e
u s e r - d e f i n e d t r a c e
b t r a c e r a n g e I
predeflned v a r i a b l e I
u s e r - d e f i n e d v a r i a b l e
XADD
Item Description/Default
User-defined trace A trace defined by the TRDEF command.
User-defined variable A variable deEned by VARDEF or ACTDEF commands.
PredeEned variable A command that acts as a variable. Refer to Table 5-l.Predefined function Function that returns a value. Refer to Table 5-1.Trace range A segment of trace A, trace B, trace C, or a user-defined trace.
Number Any real or integer number.
Range
Any valid trace name.
Any valid variablename.
Real number range.
Prerequisite Commands: TRDEF when using user-defined trace. ACTDEF or VARDEF whenusing user-defined variable. TS when using trace data.Related Commands: AMBPL, APB, SUB.
Programming Commands 5.55

ADD Add
ExampleAdd 38 MHz to the center frequency, then store the sum in a user-defined variable.
10 OUTPUT 718;"IP;"20 OUTPUT 718;"CF 300MHZ;"30 OUTPUT 718;"VARDEF N,EW,O;"40 OUTPUT 718;"ADD N,EW,CF,38E6;"
50 OUTPUT 718;"N,EW?;"60 ENTER 718;Freq70 DISP Freq80 END
Description
Initializes spectrum analyzeChanges the centerj?equency.L?&nes a variable, N-m and initializes it to 0.Adds 38 MHz to the center frequency, then placesthe sum in NJX?Returns value of N-h’Wto the computer:Assigns value to variabh Freq.Displays Freq on computer display.
The ADD command adds values of source 1 and source 2 (point by point), and sends the sum tothe destination.
Traces, user-defined traces, and trace ranges are added as 16-bit integers. Negative numbersare represented in two’s complement format. Single variables and numbers are treated asfloating point numbers and must be within the real number range as defined in Table 5-1.
The sources and destination may be different lengths. The length of predefined traces (trace A,trace B, or trace C) is 401. User-defined traces have a length of up to 2047, and variables havea length of 1. When sources differ in length, the last element of the shorter source is repeatedfor the addition process. After the addition, the last element is repeated if the destinationis longer than the sum trace. When the sources are longer than the destination, they aretruncated to fit.
5-56 Programming Commands

AMB Trace A Minus Trace B
AMBTrace A Minus Trace BSubtracts trace B from trace A and sends the result to trace A during every sweep of thespectrum analyzer.
Syntax
AMB OFF
ON
Preset State: AMB OFF.Related Commands: CLRW, CONTS, MXMH, SNGLS, TS, VAVG, VIEW.Restrictions: Not compatible with Analog+ display mode. See “ANLGPLUS” for moreinformation.
Equivalent Softkey: B - B -> A ON OFF .
Example 1
10 OUTPUT 718;"IP;" Initializes spectrum analyzer20 OUTPUT 718;"CLRW TRB;TS;VIEW TRB;AMB ON;" Displuys trace B and turns on the
AMBjknction. If trace A and trace Bcontain exactly the same trace data,the result is trace data at 0 mea-surement units, at the bottom of thedisplay.
30 OUTPUT 718*"AMB'*"40 ENTER 718;ieply;'
Queries the state of the AMBfunction.The query response is placed in astring variable.
50 DISP Reply$ “ON” is displayed on the computerdisplay.
60 END
Programming Commands 5-57

AMB Trace A Minus Trace B
Example 210 OUTPUT 718;"IP;SNGLS;"20 OUTPUT 718;"MOV TRA, 8000;"
30 OUTPUT 718;"VIEW TRA;"40 OUTPUT 718;"MOV TRB,7000;"
50 OUTPUT 718;"VIEW TRB;"60 OUTPUT 718;"AMB ON;"70 OUTPUT 718;"BLANK TRB;VIEW TRA;"
80 END
Example 3
10 OUTPUT 718;"IP;SNGLS;RL 20DB;"
20 OUTPUT 718;"MOV TRA,5000;"
30 OUTPUT 718;"VIEW TRA;"40 OUTPUT 718;"MOV TRB,4000;"
50 OUTPUT 718;"VIEW TRB;"60 OUTPUT 718;"DL ODB;"
70 OUTPUT 718."BML-"9 2
80 OUTPUT 718;"AMB ON;"
Initializes spectrum analyzer.Each element of trace A is set to 8000 measure-ment units, which is equal to 0 dBm.Places trace A in the view mode.Each element of trace B is set to 7000 measure-ment units, which is equal to -10 dBm.Places trace B in the view mode.Subtracts trace B from trace A.The result is displayed at 1000 measurementunits which is equal to -70 dBm.
Initializes the spectrum analyzer and sets thereference level.Sets trace A to 5000 measurement units, whichis equal to -10 dBm.Places trace A in the mew mode.Sets trace B to 4000 measuremtst units, whichis equal to -20 dBm.
Sets display line to 0 dBm, which is at 6000measurement units.Subtracts trace B minus display line. Result is4000 - 6000 = -2000 measurements units (oflscreen).Subtracts trace A minus modified trace B (5000-(-2000) = 7000 or 10 dBm. Notice that this hasresulted in a subtraction of amplitude in dBm,-10 dBm -(-20 dBm) = 10 dBm.
90 OUTPUT 718;"BLANK TRB;VIEW TRA;"100 END
5-58 Programming Commands

AMB Trace A Minus Trace B
DescriptionThe AMB command subtracts trace B from trace A (point by point), and sends the result totrace A. The AMB function remains in effect until it is turned off by executing “AMB OFF;“.
The AMB command is a trace math command and subtracts trace B from trace A inmeasurement units (see “CTA” for information about measurement units). Because subtractingtrace B from trace A can cause the result in trace A to be displayed off screen, the trace Aminus trace B plus display line (AMBPL) command can be used. As shown in example 2, if thetrace data value of trace A is 0 dBm (8000 measurement units), and trace B is -10 dBm (7000measurement units), the result of executing AMB is 1000 measurement units. If the AMBPLcommand is used instead of AMB, and the display line is set at -50 dBm (mid-screen), theresult in trace A is kept at mid-screen.
A common use of trace subtraction is to normalize one trace with respect to another. Forexample, traces are frequently subtracted to normalize the spectrum analyzer response when atracking generator is used. In such applications, amplitude units in dBm should be subtracted.As shown in example 2, subtraction of measurement units is not equivalent to subtractionof amplitude units. Correct results are obtained if the display line is set to 0 dBm using DL,and BML is used to subtract the display line from trace B. See example 3 for an example ofsubtracting the display line from trace B.
Query Response
ON
OFF
0 0 2
Programming Commands 5-59

AMBPLTrace A Minus Trace B Plus Display LineSubtracts trace B from trace A, adds the display line value to the difference, and sends theresult to trace A during every sweep of the spectrum analyzer.
Syntax
OFF /
ON
Equivalent Softkey: NORMLIZE ON OFF .Preset State: AMBPL OFF.Related Commands: ADD, AMB, CONTS, CLRW, DL, MXMH, SNGLS, SUB, TS, VAVG, VIEW.Restrictions: Not compatible with Analog+ display mode. See “ANLGPLUS” for moreinformation.
Example
10 OUTPUT 718;"IP;SNGLS;RL 20DB;"
20 OUTPUT 718;"MOV TRA,5000;"
30 OUTPUT 718;"VIEW TRA;"40 OUTPUT 718;"MOV TRB,4000;"
50 OUTPUT 718;"VIEW TRB;"60 OUTPUT 718;"DL ODM;”
70 OUTPUT 718;"AMBPL ON;"
Initializes spectrum analym activates single-sweep mode.Sets trace A to 5000 meoxurement units, whichis equal to -10 dBm.
Sets trace B to 4000 measurement units, whichis equal to -20 dBm.
Sets display line to 0 dBm, which is at 6000measurement units.&forms trace A - trace B + display line. Theresult is 5000 - 4000 + 6000 = 7000 or 10 dBm.Note that this has resulted in a subtraction ofamplitude in dBm, -10 dBm -(-20 dBm) = 10dBm.
80 OUTPUT 718;"BLANK TRB;VIEW TRA;"90 END
5-60 Programming Commands

AMBPL Trace A Minus Trace B Plus Display Line
DescriptionThe AMBPL command subtracts trace B from trace A (point by point), adds the display linevalue to the difference, and sends the result to trace A. The AMBPL function remains in effectuntil it is turned off by executing “AMBPL OFF;“.
A common use of trace subtraction is to normalize one trace with respect to another. Forexample, traces are frequently subtracted to normalize the spectrum analyzer response when atracking generator is used. In such applications, amplitude units in dBm should be subtracted.To accomplish this, the display line should be set to 0 dBm using DL as shown in the example.To compare how you would use the AMB command to do the same operation, see examples 2and 3 for the AMB command.
Query Response
ON
OFF
0 0 2
Programming Commands 5-61

AMPCORAmplitude CorrectionApplies amplitude corrections at specified frequencies.
Syntax
HZ
KHZ
number
MHZ
Item Description/Default Range
Number Any real or integer number. Default unit is Frequency: 0 to 1000 GHz Amplitude:dB. f327 dB.
Equivalent Softkeys: the softkeys accessed by bp Car .Preset State: AMPCOR OFF.Related Commands: AMPLEN, AT, RL.
ExampleCompensate for frequency-dependent amplitude inaccuracies at the input.
102030IGHZ,
40 OUTPUT 718;"AMPCOR?;"50 ENTER 718;A$60 PRINT A$70 OUTPUT 718;"AMPCOR OFF;"
DIM A$[2001OUTPUT 718 ; "CF 1GHZ ; SP 200MHZ ; ‘I Sets center frequency and span.OUTPUT 718;"AMPCOR lOOMHZ,5DB, Stores frequency-amplitude pairs in spectrum-5DB,i.5GHZ,lODB;" analyzer Notice that j?equencies are in as-
cending order:Returns correction values to computer
Displays the frequency-amplitude pairs.Turns off the amplitude correction constants.
5-62 Programming Commands

AMPCOR Amplitude Correction
80 OUTPUT 718;"AMPCOR?;"90 ENTER 718;A$100 PRINT A$110' END
Because AMPCOR is ofi “0,O” is displayed.
DescriptionUse AMPCOR to compensate for frequency-dependent amplitude variations at the spectrumanalyzer input. Up to 79 pairs of frequency-amplitude correction points can be entered. Thefrequency values entered must either be equal or in increasing order, or an error conditionresults. Whenever AMPCOR is on, the correction values are added to all measurementresults. Executing “AMPCOR ON;” or entering frequency and amplitude corrections, turnson the amplitude correction factors. Performing an instrument preset (IP) or turning offthe spectrum analyzer sets AMPCOR to OFF. (Setting AMPCOR to OFF does not change thefrequency-amplitude correction factors that have been entered.)
The values of the correction points are applied across the active measurement range. Betweenpoints, the correction values are interpolated. When measuring at frequencies outside thefirst and last correction points, these values are used as the correction value. If you do notwant any amplitude correction outside of the first and last correction points, set the amplitudecorrection to 0 at the frequencies that are outside of the first and last correction values.
With the Analog + display mode: When the Analog+ display mode is turned on, AMPCORapplies only one amplitude correction across the displayed frequency span. When the Analog+display mode is turned on, the amplitude correction for the current center frequency is usedover the entire frequency span.
Amplitude correction factors can be stored in spectrum analyzer memory with the SAVET orSAVRCLN commands, or on the memory card with the STOR or SAVRCLN commands. Theamplitude correction factors can be edited and viewed with the Amp Cor softkey functions.
Query ResponseAMPCOR? returns the frequency and amplitude correction
f r e q u e n c y amp I i t ude/ \
In-
pairs.
Returned values are 0,O when AMPCOR is set to OFF
Programming Commands 5-63

AMPLENAmplitude Correction LengthReturns the number of frequency-amplitude correction factors that have been entered.
Syntax
AMPLEN,+a v
Xinedf u n c t i o n p a t h o n l y
XAMPLEN
Related Commands: AMPCOR.
ExampleOUTPUT 718;"AMPLEN?;"
DescriptionThe absolute value of the number that AMPLEN? returns is the number of frequency-amplitude correction factors that have been entered. If no amplitude correction factorshave been entered, AMPLEN? returns a 0. (See “AMPCOR” for more information aboutfrequency-amplitude correction factors.)
AMPLEN returns the number of frequency-amplitude correction factors as a positive ornegative number. If AMPLEN returns a positive number, the frequency-amplitude correctionfactors are turned on. If AMPLEN returns a negative number, the frequency-amplitudecorrection factors are turned off.
Query ResponseAMPLEN can return a number from 80 to -80.
n u m b e ro f c o r r e c t i o n f a c t o r s
o u t p u tt e r m i n a t i o n +
QAMPLEN
5.64 Programming Commands

ANLGPLUS Analog Plus
ANLGPLUSAnalog PlusTurns on or off the Analog+ display mode.
Syntax
ON/
OFF
XANLCPLUS
Equivalent Softkey: ZWBLOG* ON OFF .Required Option: Option 101 or 301.Preset State: ANLGPLUS OFFRelated Commands: DOTDENS.
ExampleOUTPUT 718;"ANLGPLUS ON;" Turns on the Analog+ display mode.
DescriptionThe Analog+ display mode enables the trace display to emulate an analog display. Emulatingan analog display means that a dot density of up to 40 dots per trace element can be obtainedinstead of the usual one point per trace element.
Restrictions: Analog+ display mode is only available with sweeptimes greater than 200 ms.Certain programming commands are not compatible with the Analog+ display mode. Youshould not use the Analog+ display mode with the following programming commands:AMB, AMBPL, AXB, BML, CLRW (TRB or TRC only), DEMOD, FFT, FF’IAUTO, FFTCONTS,FFTSNGLS, LIMITEST, MEANTH, MINH, MKFC, MKPAUSE, MKSTOP, MKTRACK, MXMH,ONMKR, PLOT, PP, SPZOOM, SRCTKPK, TH, TRDSP, VAVG, and VIEW.
Some programming commands allow you to specify a destination trace for the trace results. Ifyou are using the Analog+ display mode and you specify trace A as the destination trace, thetrace results are moved into the 401 point trace and not into the dots on the display. The dotson the display remain unchanged. The programming commands that allow you to specify traceA as the destination trace are as follows: ABS, ADD, APB, AVG, COMPRESS, CONCAT, DIV,EXP, INT, LOG, MIN, MIRROR, MOD, MOV, MPY, MXM, PDA, PDF, PEAKS, SMOOTH, SQR, SUB,TRA, TWNDOW, XCH.
Programming Commands 5-65

ANLGPLUS Analog Plus
Query Response
ONo u t p u t
’ t e r m i n a t i o n --)
OFF
(102
5.66 Programming Commands

ANNOT Annotation
ANNOTAnnotationTurns on or off the display annotation.
Syntax
OFF /
ON
P i 0
‘.. . . . . .._. .’
w
1
?
Equivalent Softkey: ANNOTATN ON OFF .Preset State: ANNOT ON.Related Commands: GRAT, TITLE.
Example
10 OUTPUT 718 ; "ANNOT ON ; ‘I Turns on the annotation.20 OUTPUT 718;"ANNOT?;" Queries state of the annotation f&&ion.30 ENTER 718;Reply$ Places response in a variable.40 DISP Reply$ Displays response on the computer screen.50 END
DescriptionThe ANNOT command turns on or off all the words and numbers (annotation) on the spectrumanalyzer display (except for the softkey labels).
Query Response
ON o u t p u t’ t e r m i n a t i o n +
OFF
002
Programming Commands 5-67

APBTrace A Plus Trace BAdds trace A to trace B and sends the result to trace A.
Syntax
APB
Related Commands: CLRW, SNGLS, TS, VIEW.
Example10 OUTPUT 718;"IP;SNGLS;"
20 OUTPUT 718;"TS;"30 OUTPUT 718;"VIEW TRA;RL -2ODM;CLRW TRB;"40 OUTPUT 718;"TS;VIEW TRB;"50 OUTPUT 718."APB*"60 OUTPUT 718;"BLAiK TRB;VIEW TRA;"70 END
Description
Initializes spectrum andyzq changesto single-sweep mode.Updates the trace.Changes the refwence level.llzkes a measurement sweep.Activates APB command.Displays the result of APB
The traces are added as 16-bit integers. Negative numbers are represented in two’scomplement format. The two’s complement representation of a negative number is obtained bychanging the 1s to OS in the binary representation of the number, and then binarily adding 1.
5-66 Programming Commands

AT Attenuation
ATAttenuationSpecifies the RF input attenuation.
Syntax
/- a t t e n u a t i o n
Item Description/Default Range
Number Any real or integer. Default units are dB. Input attenuatorrange of spectrumanalvzer.
Equivalent Softkey: ATTI$?J AUTO #AM is similar.Preset State: 10 dB.Step Increment: in 10 dB steps.Related Commands: AUTO, ML, RL.
Example
OUTPUT 7 18 ; “AT 40DB ; ” Sets the attenuation to 40 dROUTPUT 7 18 ; “AT UP ; ” Increases the attenuation to 50 dR
DescriptionThe AT command specifies the input attenuation in 10 dB steps. Normally, the input attenuatoris coupled to the reference level. When a continuous wave signal is displayed with its peak ator below the reference level, the coupling keeps the mixer input level at or below the specifiedlevel (also see the command “ML”). The AT command allows less than the specified value at themixer input.
When the attenuation is increased with the AT command, the reference level does not change.If the attenuation is decreased from the coupled value using the AT command, the referencelevel will be decreased. When the reference level is changed using the RL command, theinput attenuation changes to maintain a constant signal level on the screen if attenuation isauto-coupled. Using auto-coupling resets the attenuation value so that a continuous wavesignal displayed at the reference level yields -10 dBm (or the specified mixer level) at themixer input.
The step keys, knob, and DN parameter do not allow an attenuation entry below 10 dB. Onlydirect entry of “AT ODB;” will achieve 0 dB attenuation.
Programming Commands 5-69

AT Attenuation
Caution Signal levels above + 30 dBm will damage the spectrum analyzer.
Query Response
t e r m i n a t i o n +
5-70 Programming Commands

AUNITS Amplitude Units
AUNITSAmplitude UnitsSpecifies the amplitude units for input, output, and display.
Syntax
DBM
DBMV
Equivalent Softkey: Aruptd Units .Related Commands: CAL, DL, MKA, RL, TH.
ExampleOUTPUT 718.“LN*”OUTPUT 718 ; “AUNITS DBMV ; "
Changes spectrum analyzer to linear mode.Changes the linear amplitude units to DBMV
OUTPUT 718.“AUNITS’.”ENTER 718;&PIy$
* 9 Queries current amplitude units.Puts response in a variable.
DISP Reply$ Displays response on the computer screen.
DescriptionThe AUNITS command sets the amplitude readouts (reference level, marker, display line,and threshold) to the specified units. Different amplitude units can be set for log and linearamplitude scales.
Query ResponseThe query response returns the current amplitude units for the current amplitude scale.
o u t p u t’ t e r m i n a t o r +
Programming Commands 5-71

AUTOAuto CoupleCouples the active functions automatically.
Syntax
a c t i v er f u n c t i o n
Related Commands: AT, DL, HD, MKA, MKD, MKF, MKFCR, MKN, RB, SRCPSTP, SRCPSWP,SRCPWR, SS, ST, TH, VAVG, VB, VBR.
Example
OUTPUT 718."AT AUTO-"OUTPUT 718;"HD;AUTO;"
Couples the attenuation.Couples all functions.
OUTPUT 718*"AUTO-"9 2 Couples and deactivates a related function (if one was active), or
couples all Jimctions (if rm functions were active).
DescriptionThe result of the AUTO command depends on the active function it acts upon. The followingare the functions that are affected by the AUTO parameter:
ATDLMKAMKDMKFMKFCR
MKNRBSRCPSTPSRCPSWPSRCPWRssSTTH
VAVGVBVBR
couples attenuation to the reference level.turns off display of line but does not change the value of the display line.turns off marker.turns off marker.turns off marker.deactivates use of user-supplied counter resolution value, however, the valueremains unchanged.turns off marker.couples resolution bandwidth to frequency span.sets source power step to 0 (it may value may be displayed at 10 however).turns off power sweep.turns off source power.couples step size to frequency span.couples sweep time to frequency span.turns off display of threshold, but does not change its value or prevent usage inpeak searching.stops averaging.couples video bandwidth to resolution bandwidth.sets the video to bandwidth ratio to 0.3.
Individual functions can be coupled by entering the keyword for the command before AUTO,(for example, “AT AUTO; “).
AUTO has no effect if the active function is not in the above list.
Executing “AUTO;” if no functions are active couples all functions. Executing “HD;AUTO;”couples all functions, turns off the reference position, and turns off normalization.
5-72 Programming Commands

AVG Average
AVGAverageAverages the source and the destination.
Syntax
AVG
7 d e s t i n a t i o n -
b u s e r - d e f i n e d t r a c e /
\L t r a c e r a n g e /
h p r e d e f i n e d v a r i a b l e d
u s e r - d e f i n e d variable/
b u s e r - d e f i n e d t r a c e /
u s e r - d e f i n e d varidble
p r e d e f i n e d v a r i a b l e
u s e r - d e f i n e d v a r i a b l e
p r e d e f i n e d f u n c t i o n
Item Description/Default
User-defined trace A trace defined by the TRDEF command.
User-dehned variable A variable defined by VARDEF or ACTDEF commands.
Predefined variable A command that acts as a variable. Refer to Table 5-l.Predefined function Function that returns a value. Refer to Table 5-l.
Trace range A segment of trace A, trace B, trace C, or a user-defined trace.
Trace element An element of trace A, trace B, trace C, or a user-defined trace.
Number Any real or integer number.
Any valid variablename.
1Real number range.
Prerequisite Commands: TRDEF when using a user-defined trace. ACTDEF or VARDEF whenusing a user-defined variable. TS when using trace data.Related Commands: CLRAVG, TS.
Programming Commands 5-73
AVG Average
Example
10 OUTPUT 718;"IP;"20 OUTPUT 718;"SNGLS;"30 OUTPUT 718;"DET POS;TS;"
40 OUTPUT 718;"VIEW TRA;"50 OUTPUT 718;"DET SMP;"60 OUTPUT 718;"CLRW TRB;TS;"70 OUTPUT 718;"VIEW TRB;"80 OUTPUT 718;"AVG TRA,TRB,2;"
90 OUTPUT 718;"BLANK TRB;"100 END
Description
Initializes spectrum analyzezActivates single-sweep mode.Activates the positive-peak detector and updates thetrace.Stores results and displays trace A.Activates sample detection.Activates trace B and takes a sweep of trace BLXsplafys trace BAverages traces B and A with ratio of 2 and stores theresult in trace A.Blanks trace B and displays result in trace A.
The AVG command averages the source and the destination and then stores the result in thedestination according to the following algorithm:
Average = ((ratio - 1) x destination) + sourceratio
The results of AVG are invalid if the ratio is equal to zero.
When the source is longer than the destination, the source is truncated to fit. When the sourceis shorter than the destination, the last element is repeated to fill the destination.
5-74 Programming Commands

AXB Exchange Trace A and Trace B
AXBExchange Trace A and Trace BExchanges trace A and trace B.
Syntax
AXB
Equivalent Softkey: A <- -? f3.Related Commands: CLRW, SNGLS, TS, VIEW.Restrictions: Not available with Analog+ display mode. See “ANLGPLUS” for moreinformation.
Example10 OUTPUT 718."IPa"20 OUTPUT 718;"SNhLS;"30 OUTPUT 718;"DET POS;TS;"40 OUTPUT 718;"VIEW TRA;"50 OUTPUT 718;"DET SMP;"60 OUTPUT 718;"CLRW TRB;TS;"70 OUTPUT 718;"VIEW TRB;"80 OUTPUT 718~"AXB~"90 OUTPUT 718;"BLAiK TRB;"100 END
Description
Initializes spectrum analyze?:Activates single-sweep mode.Activates positive-peak detection of trace A.Stores results, displays trace A.Activates sample detection.Clear-writes trace B and takes sweep.Stores results of sweep in trace BExchanges trace A with trace BBlanks trace S: leaving only trace A on screen.
The AXB command exchanges trace A and trace B, point by point. AXB sets trace A and traceB to the view mode.
Programming Commands 5-75

BAUDRATEBaud Rate of Spectrum AnalyzerSpecifies the baud rate of a spectrum analyzer with Option 043 (the RS-232 and parallelinterface) installed in it.
Syntax
b a u d r a t e
XBAUDRATE
Item Description/DefaultNumber Any valid integer number.
Range4 to 57600.
Equivalent Softkey: BAUD ISATE .Option Required: Option 043.
ExampleThe following example allows you to use a softkey to change the baud rate of the spectrumanalyzer to 2400 baud. The softkey (key number 1) can be accessed by pressing C-1,user Menus .
PRINT #l,“KEYDEF l,%BAUDRATE 24OO;%,$BAUDRATE12400$;”
DescriptionThe BAUDRATE command changes the baud rate of the spectrum analyzer to one of thestandard baud rates. The standard baud rates are as follows: 300, 1200, 2400, 4800, 9600,14400, 19200, 38400, and 57600. If you specify a baud rate other than one of the standardbaud rates, the nearest standard baud rate will be used.
To communicate with the computer, the baud rates of the spectrum analyzer and the computermust be the same. Because changing the baud rate of the spectrum analyzer within aprogram ends communication with the computer, you should only use BAUDRATE within adownloadable program or when using the external keyboard to enter programming commands.To reestablish communication with the computer, you must set the baud rate back to the baudrate of the computer.
5.76 Programming Commands

BAUDRATE Baud Rate of Spectrum Analyzer
Query Response
baud rate/ \
o u t p u tt e r m i n a t i o n +
Programming Commands 5-77

BITBitPlaces the state (“1” or “0”) of a bit in the destination.
Syntax
7 d e s t i n a t i o n 7
,, predeflned v a r i a b l e
buser-defined v a r i a b l e )
L t r a c e e l e m e n t /
I- s o u r c e --\
n u m b e r/
b p r e d e f i n e d v a r i a b l e 1
u s e r - d e f i n e d variable/
$ p r e d e f i n e d f u n c t i o n I
b t r a c e element /
7 b i t n u m b e r 7
/
% p r e d e f i n e d v a r i a b l e I
buser-defined variable)
% p r e d e f i n e d f u n c t i o n I
b trace e l e m e n t J
Item
User-defined variable
Predeiined variable
Predeflned functionTrace element
Number (source)
Number (bit number)
Description/Default Range
A variable defined by VARDEF or ACTDEF commands. Any valid variablename.
A command that acts as a variable. Refer to Table 5-l.
Function that returns a value. Refer to Table 5-l.
An element of trace A, trace B, trace C, or a user-defined trace.
Any valid integer number. 64-bit integer.
Any valid integer number. 0 to 63.
Prerequisite Commands: ACTDEF or VARDEF when using a user-defined variable.Related Commands: INT, STB.
Example
10 CLEAR 71820 OUTPUT 718;"IP;"30 OUTPUT 718;"VARDEF E-RROR,O;"
40 OUTPUT 718;"BIT E-RROR,STB,S;"50 OUTPUT 718;"E_RROR?;"60 ENTER 718;Err70 IF NOT Err THEN DISP "NO 'I;
80 DISP "ERROR PRESENT";90 END
5-78 Programming Commands
Clears HP-IB bus.Initializes spectrum analyzerDefines user-&fined variable EA?ROR and sets itequal to 0.Stores value of bit 5 of status byte in E-RROR.Returns value of E-RROR.Assigns value to computer variable, ErrIf Err equals zero, displays “NO’* on computerscreen.Displays ‘<ERROR PRESENT” on computer screen.

BIT Bit
DescriptionThe BIT places either a “0” or a “ 1” in the destination. A “0” indicates the bit is off. A “ 1”indicates the bit is on.
Specifying the bit number: When you specify the bit number, remember the following:
n The bit number is limited from 0 to 63. If you enter a negative number for the bit number,the bit number defaults to 0. If you enter a number that is greater than 63, the bit numberdefaults to the remainder of the number divided by 64.
n The least significant bit is bit 0. The most significant bit is bit 63.
n Floating-point numbers are changed to a 64-bit integer before BIT is executed.
The BIT command can be used to determine information about the status byte or a memorycard inserted into the spectrum analyzer’s memory card reader. (See “HAVE” for moreinformation about determining information about the memory card.)
Programming Commands 5-79

BITFBit FlagReturns the state (“ 1 n or “0”) of a bit.
Syntax
I \
BITF
p r e d e f i n e d v a r i a b l e
Item
User-defined variable
Predefined variable
Predellned functionTrace element
Number (source)
Number (bit number)
/% p r e d e f i n e d v a r i a b l e J
*user-defined v a r i a b l e )f u n c t i o n p a t h o n l y
p r e d e f i n e d f u n c t i o n /
b t r a c e e l e m e n t /
Description/Default
A variable defined by VARDEF or ACTDEF commands.
A command that acts as a variable. Refer to Table 5-l.
Function that returns a value. Refer to Table 5-l.An element of trace A, trace B, trace C, or a user-defined trace.
Any valid integer number.
Anv valid integer number.
Range
Any valid variablename.
64-bit integer.
0 to 63.
Prerequisite Commands: ACTDEF or VARDEF when using a user-defined variable.Related Commands: BIT.
5-90 Programming Commands

BITF Bit Flag
Example
10 CLEAR 71820 OUTPUT 718;"IP;"30 OUTPUT 718;"BITF STB,5;"40 ENTER 718;Err50 IF NOT Err THEN DISP "NO 'I;60 DISP "ERROR PRESENT";70 END
Description
Clears HP-IB bus.Initializes spectrum analyzerL3etermines the value of bit 5 of status byte.Assigns value to computer variable, Err:If Err equals zero, displays “NO ” on computer screen.L?ispla ys ‘<ERROR PRESENT” on computer screen.
The value returned by BITF is either a “0” or a “ 1. ” A “0” indicates the bit is off, a “ 1 nindicates the bit is on. Unlike BIT, BITF returns the state of the bit directly; the state of the bitis not stored in a destination.
Specifying the bit number: When you specify the bit number, remember the following:
n The bit number is limited from 0 to 63. If you enter a negative number for the bit number,the bit number defaults to 0. If you enter a number that is greater than 63, the bit numberdefaults to the remainder of the number divided by 64.
n The least significant bit is bit 0. The most significant bit is bit 63.
n Floating-point numbers are changed to a 64-bit integer before BITF is executed.
The BITF command can be used to determine information about the status byte or a memorycard inserted into the spectrum analyzer’s memory card reader. (See “HAVE” for moreinformation about determining information about the memory card.)
Programming Commands 5-91

BLANKBlank TraceBlanks trace A, trace B, or trace C and stops taking new data into the specified trace.
Syntax
Equivalent Softkeys: BLANK A , BLAXK B , and BLANK C .Preset State: BLANK TRB, BLANK TRC.Related Commands: CLRW, MXMH, TRDSP, VIEW.
ExampleOUTPUT 718;"BLANK TRA;"
5-92 Programming Commands

BML Trace B Minus Display Line
BMLTrace B Minus Display LineSubtracts display line from trace B and places the result in trace B.
Syntax
BML
Equivalent Softkey: B - DL -> B .Related Commands: BLANK, CLRW, SUB, TS.Restrictions: Not available with Analog+ display mode. See “ANLGPLUS” for moreinformation.
Example10 OUTPUT 718;"IP;SNGLS;" Initial&s spectrum analyzq activates single-sweep mode.20 OUTPUT 718;"BLANK TRA;" Blanks trace A.30 OUTPUT 718;"CLRW TRB;TS;" Clear-writes trace S; takes sweep.40 OUTPUT 718;"DL -7ODM;" Sets the display line to -70 dBm.50 OUTPUT 718;"BML;" Activates BML jimction.60 END
DescriptionThe BML command subtracts the display line from trace B (point by point), and sends thedifference to trace B.
Programming Commands 5-83

BTCTransfer Trace B to Trace CTransfers trace B into trace C.
Syntax
BTCXBTC
Equivalent Softkey: B -> C .Related Commands: BLANK, CLRW, SNGLS, TS, VIEW.
Example
10 OUTPUT 718;"IP;"20 OUTPUT 718*"SNGLS-"30 OUTPUT 718;"BLANK'TRA;"40 OUTPUT 718;"CF 300 MHZ;SP 1MHZ;"50 OUTPUT 718;"CLRW TRB;TS;"60 OUTPUT 718;"BTC;"70 OUTPUT 718;"BLANK TRB;VIEW TRC;"80 END
Initializes spectrum analyzer:Activates single-sweep mode.Blanks trace A.Sets up measurement range.lbkes measurement sweep.Moves trace B to trace C.Displays result in trace C.
DescriptionThe BTC command moves trace B into trace C, then stops updating trace C by placing it inthe view mode. Trace B is unchanged by BTC. Trace B must contain a complete sweep ofmeasurement information.
5-84 Programming Commands

BXC Trace B Exchange Trace C
BXCTrace B Exchange Trace CExchanges trace B and trace C.
Syntax
BXC
Equivalent Softkey: B <--? C .Related Commands: BLANK, CLRW, SNGLS, TS.
Example10 OUTPUT 718;"IP;BLANK TRA"20 OUTPUT 718*"SNGLS-"30 OUTPUT 718;"DET Pk;CLRW TRB;TS;"40 OUTPUT 718;"VIEW TRB;"50 OUTPUT 718;"DET SMP;CLRW TRC;"60 OUTPUT 718*"TS-"70 OUTPUT 718;"VIiW TRC;"80 OUTPUT 718;"BXC;"90 OUTPUT 718;"BLANK TRB;"100 END
Initializes spectrum analyzer:Activates single-sweep mode.Activates positive-peak detection of trace BStores results and displays trace BActivates sample detection.
Stores results of sweep in trace C.Exchanges trace B with trace C.Blanks trace B leaving only trace C on screen.
DescriptionThe BXC command exchanges the contents of traces B and C, then places both traces in theview mode.
To retain all data, trace B and trace C should contain a complete sweep of measurement databefore BXC is executed.
Programming Commands 545

CALCalibrationInitiates self-calibration routines.
Syntax
Example
OUTPUT 7 18 ; “CAL FREq ; ” &forms the frequency correction routine.
DescriptionThe CAL command controls calibration functions. CAL initiates action according to the CALparameters. The various parameters correspond to spectrum analyzer softkeys as shown below.
ON turns correction factors on and corresponds to CORRECT CM OFF (ON is underlined). (Seealso ’ CORREK. “)
OFF turns correction factors off and corresponds to CORRECT ON OFF (OFF is underlined).(See also “CORREK.“)
STORE moves the correction factors to an area of spectrum analyzer memory that isaccessed when the spectrum analyzer is powered on. STORE corresponds to CAL STORE .The CAL STORE command cannot be executed if the correction data is not valid. Correctiondata is valid if CORRECT 01Q OFF (ON is underlined) causes CORR to be displayed on thespectrum analyzer display. Executing the CAL STORE command with invalid data generatesan SRQ 110.
FETCH recalls the correction factors from the “working” random-access memory. The“working” random-access memory is the section of memory that is accessed when thespectrum analyzer is turned on. CAL FETCH corresponds to CAL FETCIl .
5-86 Programming Commands

CAL Calibration
Note Execute CAL STORE after successful completion of the self-calibrationroutines.
Connect a cable between CAL OUT and the spectrum analyzer input beforerunning the CAL FREQ, CAL AMP, or CAL ALL correction routines.
FREQ initiates the frequency correction routine and corresponds to CAL FREq .
AMP initiates the amplitude correction routine and corresponds to CAL AWTD .
ALL initiates frequency and amplitude correction routines. It corresponds toCAL FREq & AMPTD .
Note fir an HP 8592L, HP 8593E, HP 85963 only: A cable must be connectedbetween COMB OUT and the spectrum analyzer input to use the comb signalfor CAL YTF.Fbr the HP 85953 only: Connect the cable between the CAL OUT connectorand the spectrum analyzer input.
YTF initiates the correction routine for the YIG-tuned filter. The CAL YTF commandcorresponds to CAL YTF . (HP 8592L, HP 85933, HP 85953, or HP 85963 only.)
DISP displays some of the correction factors on the spectrum analyzer display.
DUMP returns correction factors to the controller.
INIT sets the calibration data back to predetermined values. CAL INIT corresponds toDEFAULT CAL DATA . Before executing CAL INIT, you must set the spectrum analyzer’scenter frequency -37 Hz to access this function. After CAL INIT has been performed, youshould perform CAL YTF for an HP 8592L, HP 85933, HP 85953, or HP 85963.
Note Before executing the CAL TG command, a cable must be connected betweenthe tracking generator output and the spectrum analyzer input.
TG performs the calibration routines if the tracking generator is installed (Option 010 or011). CAL TG corresponds to CAL TRK GEI .
Refer to the HP 8590 E-Series and L-Series Spectrum Analyzers User’s Guide for moreinformation about the self-calibration routines, including the correct instrument set-up for eachroutine.
CAL DISP and CAL DUMP do not return all of the correction factors because the numberof characters that can be displayed on the spectrum analyzer screen is limited. CAL DUMPonly returns the correction factors (as ASCII values) that would be displayed on the spectrumanalyzer screen. Refer to the Service Guide for your spectrum analyzer for more informationabout displaying calibration data and reinitializing calibration data.
If the calibration data has been corrupted or is obviously inaccurate, use CAL FETCH toretrieve the calibration data that has previously been saved. If the calibration data fetched iscorrupt, the following example can be used to set the calibration data back to predeterminedvalues. Execute OUTPUT 718;"CF -37HZ;CAL INIT;", then perform the CAL AMP, CAL FREQ,or CAL ALL calibration routines. Use CAL STORE if the calibration routines have finishedsuccessfully.
Programming Commands 5-87

CAL Calibration
Note Using the default calibration data may cause the calibration routine to fail.If this occurs, execute “OUTPUT 718; CF -37HZ; ” before performing the CALFREQ or CAL ALL calibration routines.
The take sweep (TS) and DONE commands can be used to indicate that the correction routinehas finished. Query the CORREK command to check that the calibration routines have finishedsuccessfully.
5-88 Programming Commands

CAT Catalog
CATCatalogCatalogs either spectrum analyzer memory or the memory card and returns the cataloginformation to the controller.
Syntax
Equivalent Softkeys: the functions accessed by Catalog Internal or Catalog Card.Related Commands: LOAD, MSI, STOR.
ExampleThis example returns the catalog information for the states stored on the memory card. Cataloginformation is sent as individual catalog lines that are separated by a carriage return and aline feed. A carriage return, a line feed, and a line feed with an EOI (equivalent to a carriagereturn, a line feed, and a line feed) is asserted after the last item.
10
20
30
DIM User$ [2000] ,Catalog$ (1: 100) [80] Dimensions strings to store the catalogin$ormation. U.ser$ stores the entirestring of catalog irlformation. Catalogsstores the catalog irlforrnation line byline (up to 80 lines and 100 charactersend.
INTEGER I,Pos,lf I and FbsJf are used to search throughUsers string.
OUTPUT 718;“CAT s*,CARD;” The spectrum analyzer sends catalog in-formation for all the states stored on thememory card.
40 ENTER 718 USING ‘I#, -K” ;User$
50 I=060 WHILE LEN(User$) >l
Reads the catalog iqforrnation into theUsers string.
Loops until the Use& string is empty.
Programming Commands 5-88

CAT Catalog
70 I=I+l80 Pas-lf=POS(User$,CHR$(lO)) Checks for line feeds. CHR$(IO) repre-
sents the line feed, the ASCII code for aline feed is “10. ”
90 Catalog$(I)=User$Cl,Pos,lf -21 Extracts catalog line.100 OUTPUT CRT;Catalog$(I) Displays catalog line.120 User$=User$[Pos,lf+l]130 END WHILE140 END
DescriptionTo use the CAT command, you must specify the type of information to be cataloged and eitherthe spectrum analyzer memory or the memory card as the catalog source. After the spectrumanalyzer has sent the catalog information to the controller, the spectrum analyzer sends twoline feed characters to the controller.
Specifying the type of information: The types of information that can be cataloged dependon the source. See the following sections, “Cataloging the Memory Card” and “CatalogingSpectrum Analyzer Memory” for more information.
Specifying the source: You can specify the spectrum analyzer memory or the memory card asthe source by specifying INT or CARD, respectively. If source (CARD or INT) is omitted, thedefault is the current mass storage device. See “MSI” for more information about setting thecurrent mass storage device.
Note When CAT is executed from a remote port, the catalog information is sent tothe remote port.
Cataloging the Memory CardWhen cataloging a memory card, you can specify the type of information to be catalogedby specifying the letter (a, d, 1, i, s, or t) that represents the data type. For example, if youexecute “CAT l*,CARD;” all of the limit line files on the memory card will be returned. Theletters correspond to the data types are as follows:
a* Amplitude correction files.
d* Downloadable programs.
1* Limit line files.
i* Display files.
S* Saved spectrum analyzer state.
t* Saved spectrum analyzer traces,
The asterisk (*) character is interpreted as a wild card. The asterisk can be used with the datatype to catalog all files of that data type, or alone to catalog all files on the memory card.
CAT returns the directory information only if a file has been found.
What is returned when the memory card is cataloged: When the memory card is the catalogsource, the cataloged information is returned to the computer as a series of strings. Each stringcontains information about one file that has been saved on the memory card. The informationis placed in specific fields within a string as shown in the following table.
5.90 Programming Commands

CAT Catalog
Information
File name
File Type
Data Type
Start Record
Length
Time of creation
Position within DescriptionS t r i n g
1 through 10 Name of the file.
11 through 16 ASCII or binary data (in LIF -2 format).
17 through 22 a = amplitude correction factors, d = downloadable program,1 = limit line, i = display files s = spectrum analyzer state, t = trace.
23 through 30 Physical record number of the start of file.
31 through 38 Number of records in the file.
39 through 52 The time the file was created in year, month, day, hour, minute,second (YYMMDDHHMMSS) format.
Each string is right-justified within its field, with spaces separating the fields.
Cataloging Spectrum Analyzer MemoryWhen cataloging analyzer memory, you can use “prefix”, “reg,” or “on” to specify the type ofinformation to be cataloged.
prefix* Catalogs the programs and variables in spectrum analyzer memory according to thecurrent prefix. (Use Change Prefix or PREFX to change the current prefix.)
reg* Catalogs the contents of the state and trace registers. The center frequency andspan of the state registers are displayed; the title and date of the trace registers aredisplayed.
on* Catalogs the on event commands and their status. See the “Cataloging the on eventcommands n for more information.
* Catalogs all the programs and variables stored in spectrum analyzer memory, but doesnot return the on event commands or the contents of the state and trace registers.
Cataloging the on event commands: When the on event programming commands have notbeen set or an instrument preset has been performed, cataloging the on events displays thestatus of the on events as UNDEFINED. If the ONEOS, ONSWP, TRMATH, ONMKR, ONSRQ,and ONPWRUP commands have been set, “CAT on*;” displays their status as ACTIVE. WhenONCYCLE, ONDELAY, or ONTIME have been set, “CAT on*;” returns the information shown inthe following table.
fro@--Command
Description of the Catalog On Event Response
ONCYCLE
ONDELAY
ONTIME
The entry for ONCYCLE displays the number of seconds left until the event occurs, followedby the number of seconds ONCYCLE was set for.
The entry for ONDELAY displays either a positive or negative number. A positive numberindicates the number of seconds left until the event occurs, a negative number indicates theamount of time that has passed (in seconds) since the event.
The date (in year, month, and day format) and the time (in 24 hour format) that ONTIME is setfor.
Programming Commands 5-91

CAT Catalog
If you want to catalog all user-defined variables, user-defined softkeys, or user-definedfunctions in spectrum analyzer, use the asterisk without “prefix,” “reg,” or “on” preceding theasterisk. For example “CAT *,INT; “.
Cataloging spectrum analyzer (internal) memory returns the following information:
n MS1 device (internal).H Bytes of spectrum analyzer memory used.n Total amount of spectrum analyzer memory (in bytes). This number includes the amount of
spectrum analyzer memory in use and the amount of spectrum analyzer memory available.n Name of the stored data and the number of bytes used.
Note The difference between the bytes of spectrum analyzer memory used and thetotal spectrum analyzer memory available is the amount of spectrum analyzermemory available.
5-92 Programming Commands

CF Center Frequency
CFCenter FrequencySpecifies the center frequency.
Syntax
c CF
/ f r e q u e n c y value \
number
Item Description/Default Range
Number Any real or integer number. Default unit is Hz. Frequency range ofthe spectrum analyzer.
Equivalent Softkey: CEHTEH FREQ .Step Increment: If uncoupled, step size is determined by the SS command. If coupled, stepsize is 10% of span.Related Commands: HNLOCK, FA, FB, FOFFSET, FS, MKCF, MKSS, SP, SS.
Note Although the spectrum analyzer allows entry of frequencies not in the specifiedfrequency range, using frequencies outside the frequency span of the spectrumanalyzer is not recommended and is not warranted to meet specifications.
Example
OUTPUT 718; “CF 300MHZ; ” Sets the center freqwncp to 300 hEliz.
Programming Commands 5-93

CF Center Frequency
DescriptionThe CF command specifies the value of the center frequency.
Query Response
5.94 Programming Commands

CHP Channel Power
CHPChannel PowerPerforms the channel power measurement.
Syntax
CHPXCHP
Equivalent Softkey: ClUNNEL PCIVER .Related Commands: ACPPAR, ACPCONTM, ACPSNGLM, ACPSP, ACPBW, CHPGR, ACPMK.
Example
OUTPUT 718*"CHP*", , Flyforms the channel power rneasur~t.
DescriptionCHP measures the total power in the specified channel bandwidth (ACPBW). The powerspectral density per Hz is also computed and displayed. This value is the average-powerspectral density in the specified channel bandwidth.
‘lb use CHP:
1. Set the center frequency to the carrier’s frequency.
2. For best accuracy, set the reference level so that the carrier signal peak is within the first(top) division of the screen graticule.
3. Select the channel bandwidth with the ACPBW command.
4. Select the channel spacing with the ACPSP command. (For the channel powermeasurement, ACPSP is only used to set the center frequency step size.)
5. If you want the spectrum analyzer settings to be set automatically, ensure that ACPPAR isset to 1. If you want to set the spectrum analyzer settings manually, set ACPPAR to 0. See“ACPPAR” for more information about selecting the spectrum analyzer settings manually.
6. If the spectrum analyzer is in the continuous-sweep mode, use the single sweep command(SNGLS) to select the single-sweep mode.
7. Execute the CHP command.
8. Query ACPERR to determine if there is a setup error for the CHP measurement. See thefollowing table for more information about ACPERR.
9. If no error occurred, query the CHPWR variable for the numeric results of the CHPmeasurement. See the following table for more information about CHPWR.
10. If no error occurred, query trace A (TRA) for the trace results of the CHP measurement.
Measurement Results: The results of the CHP command are stored in the variable and tracedescribed in the following table.
Programming Commands 5-95

CEIP Channel Power
CEIP Measurement Results
Variable or Trace Description Units
ACPERR A variable that indicates setup errors for the CHP measurement. Thevalue of ACPERR indicates the following:
n If no errors occurred, ACPERR is 0.n If ACPERR is 1, channel bandwidth > frequency span.n If ACPERR is 2, the channel bandwidth < frequency span/loo.
CHPWR A variable that contains the channel power. Determinded byAUNITS command.Default unit is dBm.
CHPSD A variable that contains the average channel power spectral density Determinded byper Hz. AUNITS command.
Default unit isdBm/Hz .
TRA TRA is trace A. Trace A contains the swept RF spectrum. Determined by thetrace data format(TDF) command.
RestrictionsExecuting ACPE exits the following functions: windows display mode (WINON), N dB pointmeasurement (NDBPNT), the FFT menu measurements (FFTAUTO, FFTCONTS, FFTSNGLS),gate utility functions (GDRVUTIL), TO1 measurement (TOI), marker table (MKTBL), peak table(PKTBL), percent AM (PCTAM), or peak zoom (PKZOOM).
5-96 Programming Commands

CElPGR Channel Power Graph On or Off
CHPGRChannel Power Graph On or OffDetermines if the channel power graph function is enabled or disabled.
Syntax
Equivalent Softkey: PWkGRAPH ON OFFRelated Commands: CHP
Example10 OUTPUT 718; “CHP; ” Fkyforrns the channel power masurmt.20 OUTPUT 718;"MOV CHPGR,l;" Enables the power graph function and creates a graph of
the channel power as a function of frequency.
DescriptionSetting CHPGR to 1, does the following:
n Turns off the display of the channel-power numeric results.
n Generates a graph of the channel power as a function of frequency.
n Places the graph in trace C
n Adds the GRPH MKR ON OFF softkey to the menu.
n If in continuous measurement mode, the channel power graph will be updated at the end ofevery sweep.
Setting the CHPGR to -1, does the following:
n Turns off the display of the channel-power graph in trace C.
n Calculates and displays the channel-power numeric results.
n Removes the GRPH NKR ON OFF softkey from the menu.
n Turns off the channel power graph marker.
n If in continuous measurement mode, the numeric results will be updated at the end of everysweep.
When the graph is generated, it represents the power in the channel bandwidth (set by theACPBW command). The results of CHPGR are not defined for frequencies where the graph isdrawn below the bottom graticule line.
Programming Commands 5-97

CLRAVGClear AverageRestarts video averaging.
Syntax
CLRAVG
Related Commands: AMB, CLRW, MINH, MXMH, VAVG.
Example
OUTPUT 718;"IP;" Initializes the spectrum analyzer:OUTPUT 718;"VAVG 100;" Initializes video averaging.WAIT 30OUTPUT 718*"CLRAVG-", , Restarts wide0 averaging.
DescriptionThe CLRAVG command restarts the VAVG command by resetting the number of averagedsweeps to one. The video averaging routine resets the number of sweeps, but does not stopvideo averaging. Use “VAVG OFF;” to stop video averaging.
5-99 Programming Commands

CLRBOX Clear Box
CLRBOXClear BoxClears a rectangular area on the spectrum analyzer display.
Syntax
Item Description/Default RangeNumber Any valid integer number. For xl or x2, -40 to 471.
For yl or y2, -22 tb 233.
Related Commands: CLRDSP.
ExampleThe following programming line results in the spectrum analyzer display shown in Figure 5-2.
OUTPUT 718;“CLRBOX 1,1,200,20O,A;” Clears the annotation and graticule from the
&REF . 0 dBmPEAKLOG
2,
WA SESC FC
CORR
CENTE
d Jl.JlATTEN 1 0 dG
rectangular area of 1,l to 200,200. -
SPECTRUM
.:::I ANALY=ER
.................................................
....................................... . .........
....................................... . .........
......................................... .......t--++++~
. . . . . . . . . . . . . . . . . . . . . . . . . . . . . . . . . . . . . . . . . . . . . . . . .
3 . 2 5 0 GHzES BW 3 . 0 MHz
More1 o f 3
S P A N 6 . 5 0 0 GHzUBW 1 MHz SWP 130 mseo RT
Figure 5-2. Using the CLRBOX Command
Programming Commands 5-99

CLRJSOX Clear Box
Descriptionlb use CLRBOX, you must specify the rectangular area of the box. You can also specifywhether the annotation or trace planes are to be cleared.
Specifying the rectangular area of the box
You specify the rectangular area by specifying the coordinates of the lower left corner (xl, yl)and the upper right corner (x2, y2) of the rectangle in display units. (The cleared area includesthe xl, yl, x2, and y2 coordinates).
Specifying the annotation or trace plane
You can specify whether the annotation or the traces are to be cleared by specifying an “A”for the annotation plane or a “T” for the trace plane. If you specify the annotation plane,everything but the trace display will be cleared. If you specify the trace plane, the tracedisplay will be cleared. (The cleared trace display can be overwritten if the spectrum analyzeris in the clear-write mode, however.) If you do not specify the annotation or trace plane, boththe annotation and trace planes are cleared.
CLRBOX affects only the spectrum analyzer display and printing of the spectrum analyzerdisplay. CLRBOX does not change the plot of the spectrum analyzer display; the area that iscleared by CLRBOX will still be plotted.
5-100 Programming Commands

CLRDSP Clear Display
CLRDSPClear DisplayErases user-generated graphics and text,
Syntax
CLRDSP
Related Commands: CLRBOX, DA, DRAWBOX, DSPLY, PA, PD, PR, PU, TEXT.
Example
OUTPUT 718;"CLRDSP;BLANK TRA;BLANK TRB; Blanks the spectrum analyzer screen, ex-GRAT 0FF;TH 0FF;DL OFF;" cept for trace C and annotation.OUTPUT 718;"CLRW TRA;GRAT 0N;ANNOT ON;" Reinstates the display of trace A, the gratic-
ulq and the annotation.
DescriptionThe CLRDSP command removes all user-created graphics and text from the spectrum analyzerscreen and memory. CLRDSP also removes the graphics and text from the display list. See“DA” for more information about the display list.
Programming Commands 5-101

CLRWClear WriteClears the specified trace and enables trace data acquisition.
Syntax
XCLRW
Equivalentsoftkeys: CLl%R WRITE A, CLEAR WRITE B, and CLEAR WRITE C.Preset State: CLRW TRA.Related Commands: BLANK, DET, MINH, MXMH, VAVG, VIEW.Restrictions: CLRW TRB and CLRW TRC are not available with Analog+ display mode. See“ANLGPLUS” for more information.
ExampleOUTPUT 718;"CLRW TRA;"
DescriptionThe CLRW command places the indicated trace in the clear-write mode. Data acquisition beginsat the next sweep. (See “TS” for more information about data acquisition.)
5-102 Programming Commands

CL!3 Clear Status Byte
CLSClear Status ByteClears all status bits.
Syntax
CLS
Related Commands: RQS, SRQ, STB.
ExampleOUTPUT 7 18 - “CLS * ”, ,
DescriptionThe CLS command clears all the status bits in the status byte. (See “SRQ” for more informationon the status byte.)
Programming Commands 5-l 03
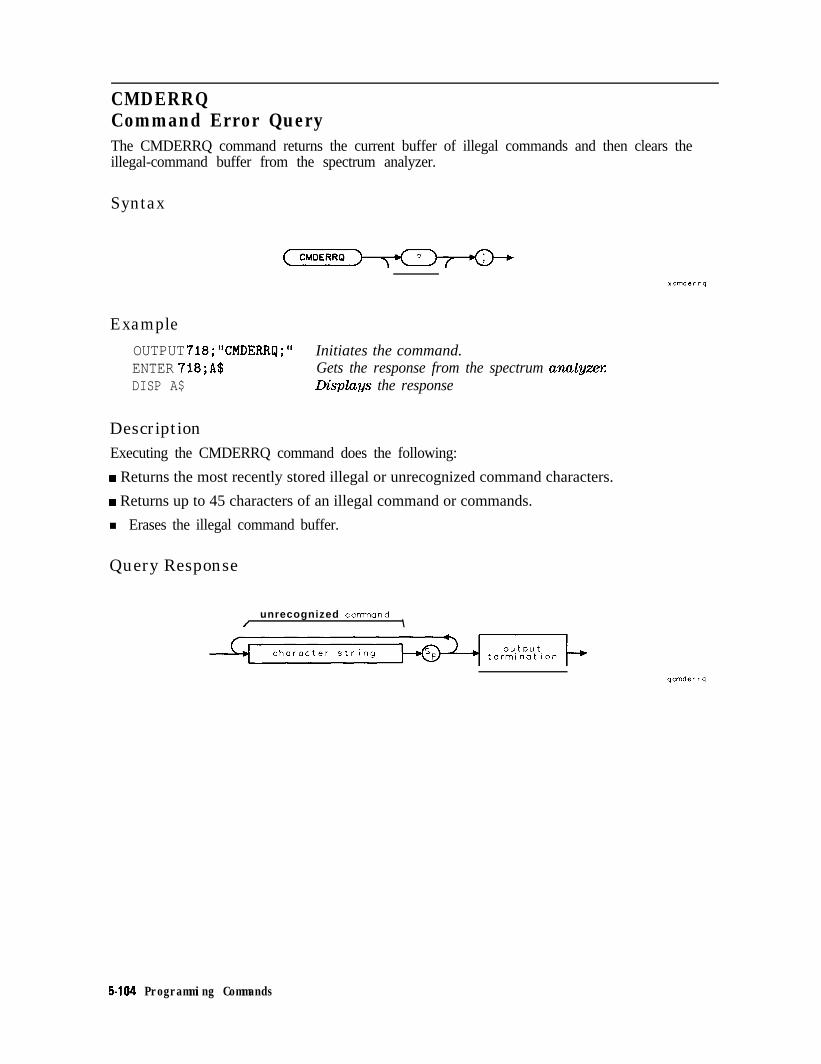
CMDERRQCommand Error QueryThe CMDERRQ command returns the current buffer of illegal commands and then clears theillegal-command buffer from the spectrum analyzer.
Syntax
Example
OUTPUT 718;"CMDERRQ;" Initiates the command.ENTER 718;A$ Gets the response from the spectrum anu1yze.xDISP A$ Llisplu~s the response
DescriptionExecuting the CMDERRQ command does the following:
w Returns the most recently stored illegal or unrecognized command characters.
4 Returns up to 45 characters of an illegal command or commands.
n Erases the illegal command buffer.
Query Response
unrecognized command/ \
5-104 Programming Commands

CNF Confidence Test
CNFConfidence ‘I&tPerforms the confidence test.
Syntax
CNFXCNF
Equivalent Softkey: COhfF TEST .
ExampleOUTPUT 718; “CNF; ”
DescriptionThe CNF command initiates a confidence test of the resolution bandwidth, video bandwidth,and step gain.
Note Connect a cable between CAL OUT and the spectrum analyzer input beforeexecuting the CNF command.
Programming Commands 5-105

CNTLAAuxiliary Interface Control Line ASets the control line A of the auxiliary interface high or low.
Syntax
CNTLA OFF /
O N
XCNTLA
Equivalent Softkey: CNTL A 0 1 .Related Commands: CNTLB, CNTLC, CNTLD, CNTLI.
ExampleOUTPUT 718 ; "CNTLA ON; I’ Sets control line A high.OUTPUT 718;"CNTLA?;" Queries the state of control line A.ENTER 718;A$ Gets the response from the spectrum analyzixDISP A$ Displays the response.
DescriptionCNTLA ON sets control line A to high, CNTLA OFF sets it to low (the auxiliary interfaceconnector outputs use transistor-transistor logic).
Query Response
o u t p u t’ t e r m i n a t i o n +
5-l 06 Programming Commands

CNTLB Auxiliary Interface Control Line B
CNTLBAuxiliary Interface Control Line BSets the control line B of the auxiliary interface high or low.
Syntax
OFF /
ON
XCNTLB
Equivalent Softkey: CNTL B 0 1 .Related Commands: CNTLA, CNTLC, CNTLD, CNTLI.
ExampleOUTPUT 718 * "CNTLB ON - ‘I9 9 Sets control line B high.OUTPUT 718."CNTLB'."ENTER 718;i$
* , Queries the state of control line BGets the response from the spectrum analyze7:
DISP A$ Displays the response.
DescriptionCNTLB ON sets control line B to high, CNTLB OFF sets it to low (the auxiliary connectoroutputs use transistor-transistor logic).
Query Response
ON o u t p u t’ t e r m i n a t i o n -
OFF
Programming Commands 5-107

CNTLCAuxiliary Interface Control Line CSets the interface control line C of the auxiliary interface high or low.
Syntax
OFF/
ON
Equivalent Softkey: CNTL C 0 1 .Related Commands: CNTLA, CNTLB, CNTLD, CNTLI.
ExampleOUTPUT 718."CNTLC ON*"t # Sets control line C high.OUTPUT 718."CNTLC'."ENTER 718;i$
. 9 Queries the state of control line C.Gets the response from the spectrum anal~zxx
DISP A$ Lhkplays the response.
DescriptionCNTLC ON sets control line C to high, CNTLC OFF sets it to low (the auxiliary interfaceconnector outputs use transistor-transistor logic).
Query Response
ON
OFF
5-l 08 Programming Commands

CNTLD Auxiliary Interface Control Line D
CNTLDAuxiliary Interface Control Line DSets the interface control line D of the auxiliary interface high or low.
Syntax
Equivalent Softkey: CNTL D 0 1 .Related Commands: CNTLA, CNTLB, CNTLC, CNTLI.
Example
OUTPUT 718 ; "CNTLD ON ; I' Sets control line D high.OUTPUT 718."CNTLD'."ENTER 718;i$
* , Queries the state of control line D.Gets the response from the spectrum anal~zerz
DISP A$ Displays the response.
DescriptionCNTLD ON sets control line D to high, CNTLD OFF sets it to low (the auxiliary connectoroutputs use transistor-transistor logic).
Query Response
Programming Commands 5-109

CNTLIAuxiliary Interface Control Line InputReturns a “ 1” when the interface control line I of the auxiliary interface is high, and “0” if theline input is low.
Syntax
f u n c t i o n p a t h o n l y
XCNTL I
Equivalent Softkey: DISPLAY CMTL I .Related Commands: CNTLA, CNTLB, CNTLC, CNTLD.
ExampleOUTPUT 718; “CNTLI ; I1 Gets the status of control line IENTER 718;ADISP A Displays status.
5-110 Programming Commands

COMB Comb
COMBCombTurns on or off the comb generator.
Syntax
XCOMB
Equivalent Softkey: CO?!E! GEN ON OFF .Model Required: HP 8592L, HP 85933, or HP 85963.
Example
OUTPUT 718;"COMB ON;" Turns onthecombgenerator:
DescriptionTo use the comb signal, a cable must be connected from the COMB OUT connector to thespectrum analyzer input.
Programming Commands 5-111

COMPRESSCompress TraceReduces the number of trace elements while retaining the relative frequency and amplitudecharacteristics of the trace data.
Syntax
COMPRESS
7 d e s t i n a t i o n
r a l g o r i t h m 7
XCOMPRESS
Item Description/Default Range
User-defined trace A trace defined by the TRDEF command Any valid trace name.
Trace Range A segment of trace A, trace B, trace C, or a user-defined trace.
Prerequisite Commands: TRDEF when using user-defined trace. TS when using trace data.
5-l 12 Programming Commands

COMPRESS Compress Trace
ExampleThis example compresses trace B into “C-0MPTRAC” using the positive (POS) algorithm.
10 OUTPUT 718."IP-"20 OUTPUT 718;"TR;EF C-OMPTRAC,lOO;"
30 OUTPUT 718 ;“BLANK TRA; SNGLS;"
40 OUTPUT 718;"CLRW TRB;TS;"50 OUTPUT 718;"COMPRESS C-OMPTRAC,TRB,POS;"60 OUTPUT 718;"BLANK TRB;"70 OUTPUT 718;"MOV TRA,C-OMPTRAC;"80 OUTPUT 718;"VIEW TRA;"90 END
Initializes spectrum analyz4xCreates a trace called C-OMFTRACwitha length of 100 elements.Blanks trace A, activates single-sweepmode.Measures with trace BCompresses trace B into C-OMFTRAC.Blanks trace BMoves C-OMPTRAC into trace A.Displays the result.
DescriptionThe COMPRESS command stores a compressed copy of the source trace into a smallerdestination trace. The source trace is divided into the same number of intervals as there arepoints in the destination trace, and the data within each interval are compressed into the valuefor the corresponding destination trace point. The algorithm used to compress the data is givenas an parameter to the command.
The algorithms available are as follows:
AVERAGE@W
The average of the points within an interval is used.
NORMALNW
NRM computes the compressed value of the interval by using a rosenfellalgorithm. The rosenfell algorithm is a mathematical operation defined inspectrum analyzer firmware. The algorithm compresses a locally continuouslyrising or falling signal into the peak value detected in each interval. If thedetected signal is not continuously rising or falling, then the data valuealternates between minimum and maximum in the compressed interval.This shows the peak-to-peak noise variations. The rosenfell option is usefulfor accurately displaying noise, because peak detection can give misleadingrepresentation of noise.
NEGATIVE(NW
The lowest value in each interval is used.
POSITIVE Specifying POS selects the highest point in the interval as the compressed(PW value.
SAMPLE (SMP) Specifying SMP selects the last point in the interval as the compressed value.
PEAK The PKAVG algorithm selects the difference between the peak and the averageAVERAGE value of the interval as the compressed value.(PKAVG)
PEAK PIT The PKPIT algorithm returns the difference between the positive and the(PKPIT) negative peaks within the interval.
Programming Commands 5-l 13
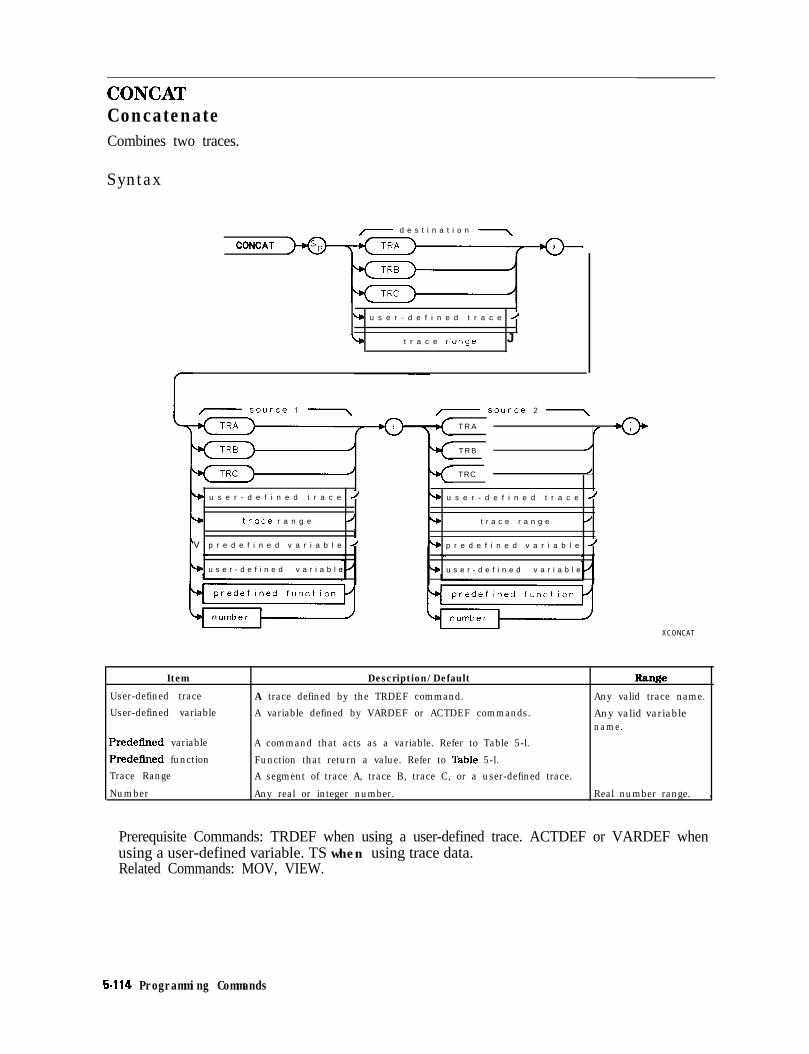
CONCATConcatenateCombines two traces.
Syntax
CONCAT
7 d e s t i n a t i o n
b u s e r - d e f i n e d t r a c e I
b t r a c e range J
,- source 1 '\
V u s e r - d e f i n e d t r a c e /
v trace r a n g e /
V p r e d e f i n e d v a r i a b l e /
u s e r - d e f i n e d v a r i a b l e
,- source 2 .-\
T R A/
T R B /
TRC /
+ u s e r - d e f i n e d t r a c e /
b t r a c e r a n g e /
b p r e d e f i n e d v a r i a b l e /
u s e r - d e f i n e d v a r i a b l e
XCONCAT
Item
User-defined trace
User-defined variable
Predeflned variable
PredeEned functionTrace Range
Number
Description/Default R=ae
A trace defined by the TRDEF command. Any valid trace name.
A variable defined by VARDEF or ACTDEF commands. Any valid variablename.
A command that acts as a variable. Refer to Table 5-l.
Function that return a value. Refer to ‘lbble 5-l.A segment of trace A, trace B, trace C, or a user-defined trace.
Any real or integer number. Real number range. ,
Prerequisite Commands: TRDEF when using a user-defined trace. ACTDEF or VARDEF whenusing a user-defined variable. TS when using trace data.Related Commands: MOV, VIEW.
5-114 Programming Commands

Example
CONCAT Concatenate
10 OUTPUT 718;"IP;"20 OUTPUT 718;"SNGLS;"
30 OUTPUT 718;"TS;VIEW TRA;"40 OUTPUT 718;"CLRW TRB;TS;"
50 OUTPUT 718;"CONCAT TRC,TRA[1,200],TRB[201,4011;"
60 OUTPUT 718;"BLANK TRA;BLANK TRB;"70 OUTPUT 718;"VIEW TRC;"80 END
Description
Initializes the spectrum analyzer:Activates the single-sweep mode.
Stores and displays trace A.3zkes a measurement sweepwith trace BConcatenates the last half oftrace B to the Jirst half oftrace A.Blanks trace A and trace BLXsplays the result.
The CONCAT command concatenates source 2 to the end of source 1, then stores the result inthe destination. If the destination length is less than the length of source 1 and source 2, thelist is truncated. For example, executing “CONCAT TRA[l, 15],TRB[3,6],TRB[7,207];” resultsin trace A elements 1 to 4 being replaced by trace B elements 3 to 6, and trace A elements 5to 15 being replaced by trace B elements 7 to 17. Trace B elements 18 to 207 are ignored. Ifnecessary, reduce trace lengths with the COMPRESS command.
If the length of the destination is greater than the length of source 1 and source 2, the lastvalue is repeated. For example, executing “CONCAT TRA[1,15],TRB[3,6],TRB[7,9];” results intrace A elements 1 to 4 being equal to trace B elements 3 to 6, trace A elements 5 and 6 beingreplaced by trace B elements 7 and 8, and trace A elements 7 to 15 being replaced by trace Belement 9.
Programming Commands 5-115

CONTSContinuous SweepSets the spectrum analyzer to the continuous sweep mode.
Syntax
CONTS
Equivalent Softkey: SWEEP COMT SGL (when CONT is underlined).Preset State: CONTS.Related Commands: SNGLS, ST, TM.
ExampleOUTPUT 718; “CONTS; ”
DescriptionThe CONTS command sets the spectrum analyzer to continuous sweep mode. In the continuoussweep mode, the spectrum analyzer takes its next sweep as soon as possible after the currentsweep (as long as the trigger conditions are met). A sweep may temporarily be interrupted bydata entries made from the front panel or over the remote interface.
5-l 16 Programming Commands

CORREK Correction Factors On
CORREKCorrection Factors OnReturns a “1” if the correction factors are on, a “0” if they are off.
Syntax
f u n c t i o n path o n l y
XCORREK
Equivalent Softkey: CORRECT ON OFF .Related Commands: CAL.
ExampleOUTPUT 718;"CORREK;"ENTER 718;ADISP A
Query Response
r off I
1”
0o u t p u t
r
+ t e r m i n a t i o n +
Programming Commands 5-l 17
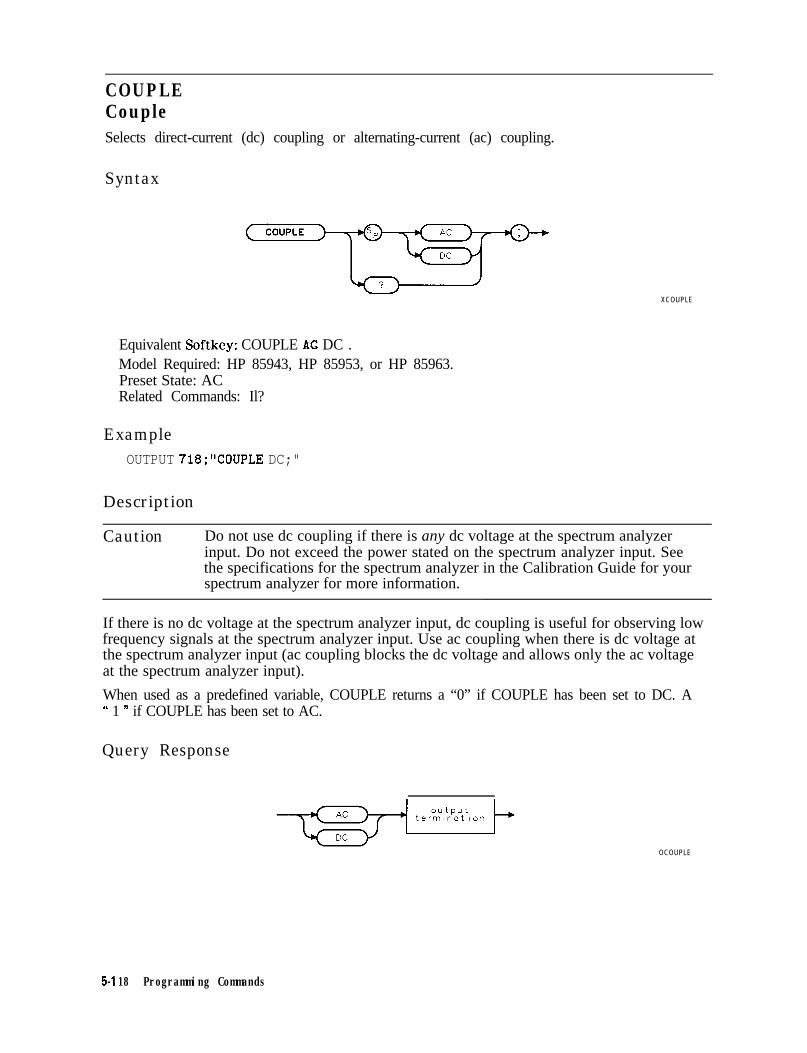
COUPLECoupleSelects direct-current (dc) coupling or alternating-current (ac) coupling.
Syntax
XCOUPLE
Equivalent Softkey: COUPLE AG DC .Model Required: HP 85943, HP 85953, or HP 85963.Preset State: ACRelated Commands: Il?
ExampleOUTPUT 718;"COUPLE DC;"
Description
Caution Do not use dc coupling if there is any dc voltage at the spectrum analyzerinput. Do not exceed the power stated on the spectrum analyzer input. Seethe specifications for the spectrum analyzer in the Calibration Guide for yourspectrum analyzer for more information.
If there is no dc voltage at the spectrum analyzer input, dc coupling is useful for observing lowfrequency signals at the spectrum analyzer input. Use ac coupling when there is dc voltage atthe spectrum analyzer input (ac coupling blocks the dc voltage and allows only the ac voltageat the spectrum analyzer input).
When used as a predefined variable, COUPLE returns a “0” if COUPLE has been set to DC. A“ 1 * if COUPLE has been set to AC.
Query Response
OCOUPLE
5-l 18 Programming Commands

CRTHPOS Horizontal Position of CRT Display
CRTHPOSHorizontal Position of CRT DisplaySpecifies the horizontal position of the text and graticule on the spectrum analyzer’s display.
Syntax
h o r i z o n t a lr p o s i t i o n
XCRTHPOS
Item Description/Default Range
Number Any valid integer number. 1 to 34.
Equivalent Softkey: CRT HORZ POSITIOf .Default Value: 10.Step Increment: by 1.Related Commands: CRTVPOS, SYNCMODE.
ExampleOUTPUT 718;"CRTHPOS 15;"
DescriptionThe CRTHPOS command specifies the horizontal position of the information on the spectrumanalyzer’s display. Each CRTHPOS number represents four screen pixels. (The spectrumanalyzer display is 512 screen pixels wide by 256 screen pixels high.) Execute CAL STORE tostore the current CRTHPOS value as the default value of the horizontal position.
Query Response
Programming Commands 5-119

CRTVPOSVertical Position of CRT DisplaySpecifies the vertical position of the text and graticule on the spectrum analyzer’s display.
Syntax
v e r t i c a l
CRTVPOS
Item Description/Default Range
Number Any valid integer number. 10 to 58.
Equivalent Softkey: CRT VERT POSITION .Default Value: 48.Step Increment: by 1.Related Commands: CRTHPOS, SYNCMODE.
ExampleOUTPUT 718;"CRTVPOS 50;"
DescriptionThe CRTVPOS command specifies the vertical position of the information on the spectrumanalyzer’s display. Each CRTVPOS number represents four screen pixels. (The spectrumanalyzer display is 512 screen pixels wide by 256 screen pixels high.) Execute CAL STORE tostore the current CRTVPOS value as the default value of the vertical position.
Query Response
5-120 Programming Commands

CE4 Convert to Absolute Units
CTAConvert to Absolute UnitsConverts the source values from measurement units to the current absolute amplitude unitsand then stores the result in the destination.
Syntax
CTA
7 d e s t i n a t i o n ,- Source ‘7
b n u m b e r/
b p r e d e f i n e d v a r i a b l e /
- u s e r - d e f i n e d variable)
b p r e d e f i n e d f u n c t i o n /
XCTA
Item Description/Default
User-defined variable A variable defined by VARDEF or ACTDEF commands.
Number Any valid integer number.
Predefined variable A command that acts as a variable. Refer to Table 5-I.Predefined function Function that return a value. Refer to lhble 5-l.
Range
Any valid variablename.
-32,768 to +32,767.
Prerequisite Commands: ACTDEF or VARDEF when using a user-defined variable.Related Commands: AUNITS, LG, LN, RL.
Example10 OUTPUT 718;"VARDEF C-ONLV,O;"20 OUTPUT 718*"LG."30 OUTPUT 718;"RL'-10DB;"40 OUTPUT 718;"CTA C-ONLV, 8000;"50 OUTPUT 718;"RL -2ODB;"60 OUTPUT 718;"CTA C_ONLV,8000;"70 OUTPUT 718;"C_ONLV?;"80 ENTER 718;A90 DISP A100 END
Declares a variable called C-ONLY;Puts the spectrum analyzer in log mode.Changes the reference level.Stores -10 in C-ONLYChanges the refwence level.Stores -20 in C-ONLY?
Programming Commands 5-121

CTA Convert to Absolute Units
DescriptionThe result of the CTA command depends on the reference level, the current amplitude units,and the amplitude scale (log or linear).
Measurement units are the internal binary data representation of measured results. Theinternal binary data representation is 16-bit amplitude values that are stored in traces. Thevalues range from -32,768 to 32,767. The value of 8000 corresponds to an amplitude equalto the reference level. In log mode, each count represents 0.01 dBm. A signal 0.01 dBmabove the reference level is at 8001, and a signal 1.0 dBm below the reference level is at 8000minus 100, or 7900. In linear mode, 8000 is the reference level and 0 is the 0 volt level. If thereference level is at 80 mV, each count would represent 0.080 divided by 8000 or 10 pV, but areference level of 2.4 volts would represent 2.4 divided by 8000 or 300 PV per count.
5-122 Programming Commands

CTM Convert to Measurement Units
CTMConvert to Measurement UnitsConverts the source values to measurement units and places the result in the destination.
Syntax
,- scJurce -\
CTM
u s e r - d e f i n e d v a r i a b l e
XCTM
Item Description/Default
User-defined variable A variable defined by VARDEF or ACTDEF commands
Number A number expressed in integer, decimal, or exponential form.
R-tfe
Any valid variablename.
Real number range.
Prerequisite Commands: ACTDEF or VARDEF when using a user-defined variable.Related Commands: AUNITS, CTA, LG, LN, RL.
ExampleOUTPUT 718;"VARDEF A,MPV,O;" Lleclares a variable called A-MPVOUTPUT 718*"LG*"OUTPUT 718;"RL'-1ODB;"
Pats the spectrum analyzer in log m.ookChanges the referent level.
OUTPUT 718;"CTM A-MPV,-10;" Stores 8000 in AXPI?OUTPUT 718;"DSPLY A,MPV,13.5;" DispZuysAiWI?
DescriptionThe result of the CTM command depends on the reference level, the current amplitude units,and the amplitude scale (log or linear).
Measurement units are the 16-bit amplitude values stored in traces. The values range from-32,768 to 32,767. The value of 8000 corresponds to an amplitude equal to the reference level.In log mode, each count represents 0.01 dBm. A signal 0.01 dBm above the reference level is at8001, and a signal 1.0 dBm below the reference level is at 8000 minus 100, or 7900. In linearmode, 8000 is the reference level and 0 is the 0 volt level. If the reference level is at 80 mV,each count would represent 0.080 divided by 8000 or 10 pV, but a reference level of 2.4 voltswould represent 2.4 divided by 8000 or 300 PV per count.
Programming Commands 5.123

DADisplay AddressAccesses the current address of the display list.
Syntax
d i s p l a y
Item Description/DefaultNumber Any integer number.
Range0 to 16383.
Preset State: 0.Related Commands: DSPLY, GR, LB, PA, PD, PR, PU, TEXT.
ExampleThis example allows you to display a message on the spectrum analyzer display, blank themessage, and then display another message on the spectrum analyzer display.
OUTPUT 718;"VARDEF D-ADDRESS,O;"OUTPUT 718;"CLRDSP;"
DQines a variable called D-ADDRESS.Erases the display list andclears all text and graphicsfrom the spectrum analyzerdisplay.
OUTPUT 718;"PUPA 100,180;TEXT %Measurement%;"
OUTPUT 718;"MOV D,ADDRESS,DA;"
OUTPUT 718;"PUPA 100,lOO;TEXT ISignal found%;"
Displays “Measurement” onthe spectrum analyzer dis-play. The text is also addedto the display list.Saves the value of the displayaddress by moving the dis-play address into D-ADDRESS.Displays text on the spectrumanalyzer display. The textis also saved in the displaylist, and the display addressis increased. (The displayaddress is increased propor-tionally to the length of thedisplayed text.)
OUTPUT 718;"PUPA 100,lOO;TEXT %
You can add code for contin-uing the measurement here.
%; " Blanks the message “Signalfound” on the analyzer screenand adds the blank spaces tothe display list.
5.124 Programming Commands

DA Display Address
Restores the display address.LXspla ys the meSSage “‘Done”on the analyzer screen, andreplaces the text ‘Signalfound”and the blank spaces that werein the display list. The text‘Measurement77 remains onthe spectrum analyzer dis-play and in the display list.
OUTPUT 718;"MOV DA,D,ADDRESS;"OUTPUT 718;"PUPA 100,120;TEXT %Done%;"
DescriptionThe DA command allows you to access the current address of the display list. The display listis a buffer that contains all of the text and graphics that have been displayed on the spectrumanalyzer screen with the DSPLY, GR, LB, or TEXT commands.
How the display list works: Every time you use a programming command to display textor graphics on the analyzer display, the text or graphics is also entered into the display list.While you can change or erase what is displayed on the analyzer screen, the list for screengraphics accumulates all of the text and graphics. For example, if you execute the followingprogramming lines:
OUTPUT 718;"PUPA 100,lOO;TEXT %Signal found%;"OUTPUT 718;"PUPA 100,lOO;TEXT % %; "OUTPUT 718;"PUPA 100,lOO;TEXT %Done%;"
the text “Signal found” would be displayed on the analyzer screen, and then be erased by theblank spaces, and then “Done” would be displayed. The display list would save the text “Signalfound, ” the blank spaces, and the text “Done, ” in separate (and sequential) locations in thedisplay list.
The display list is important because the contents of the display list are used to restore thescreen text when the annotation or graticule is turned off and then turned back on, or whenthe screen display is plotted. When the screen text is restored on the spectrum analyzerdisplay, or the screen display is plotted, the entire display list is used. Because the entiredisplay list is used, there can be some text “flashing” on the spectrum analyzer display or theplot can contain unwanted text. The DA command can be used to avoid this situation.
What the DA command does: The DA command allows you to save and then restore thecurrent address of the display list, thus controlling where text is written in the display list. Forexample, if you want your program to display the messages “Signal found,” and “Done,” andyou want only the messages that are currently displayed on the spectrum analyzer screen to bestored in the display list, you would do the following:
1. Save the display address in a variable.2. Execute the commands that display the first message on the spectrum analyzer display.
When you want to change the message, you would do the following:
1. Execute the commands that put blank spaces over the message (to clear the message fromthe analyzer display). You do not need to use blank spaces the clear the previous messageif the number of characters in the new message is equal to or greater than the originalmessage.
2. Copy the display address from the variable back into DA (this recalls the previous displayaddress).
3. Execute the commands that display the new message on the spectrum analyzer display.
Programming Commands 5-125

DA Display Address
Note Assigning random values to the display address can have undesirable effects.
Restrictions: You cannot alter earlier entries to the display list without rewriting allsubsequent entries in the display list. For example, the display list, with three messages in it,could be represented as follows:
Display List Contents: <first message> <second message> <third message>Display Address: T T T
Because the display address is proportional to the length of the text, you could not change thesecond message without affecting the display address of the third message. In this case youshould rewrite both the second and third message.
Query Response
d i s p l a yr a d d r e s s -,
o u t p u tt e r m i n a t i o n +
PDA
5-l 26 Programming Commands

DATEMODE Date Mode
DATEMODEDate ModeAllows you to set the format for displaying the real-time clock in either the month, day, yearformat or the day, month, year format.
Syntax
XDATEMODE
Equivalent Softkey: DATENODE MDY DMY .
Example 1
OUTPUT 718;"DATEMODE DMY;" Sets the date mode to day, month, yearformat.OUTPUT 718;"DATEMODE?;" Queries the format of the display of the real-time clock.ENTER 718;A$DISP A$
Example 2
OUTPUT 718;"VARDEF T-EMP,O;"OUTPUT 718;"DATEMODE DMY;"OUTPUT 718;"MOV T,EMP,DATEMODE?;"
OUTPUT 718;"T,EMP?;"ENTER 718;ADISP A
Description
Creates a variable.Sets the date mode to day, month, year format.Queries the format of the display of the real-timeclock as a preo!@ned variable.Gets the result.
When used as a predefined variable, DATEMODE returns a “0” if DATEMODE has been set toMDY. A U 1 n if DATEMODE has been set to DMY. See example 2.
Query Response
o u t p u t’ termfnation +
ODATEMODE
Programming Commands 5-127

DEMODDemodulationTurns the demodulator on or off, and selects between AM, FM, or quasi-peak demodulation,
Syntax
DEMOD
Equivalent Softkey: DEKOD ON OFF is similar.Option Required: Option 102, 103, or 301.Related Commands: DET, FMGAIN, HAVE, MKPAUSE, SP, SPEAKER, SQLCH.Restrictions: Not available with Analog+ display mode. See “ANLGPLUS” for moreinformation.
ExampleThis example demonstrates FM demodulation in a span greater than zero.
10 OUTPUT 718;"IP;FA SOMHZ;" Sets start frequencjj.20 OUTPUT 718;"FB 11OMHZ;" Sets stop frequency.30 OUTPUT 718;"TS;MKPK HI;MKCF;" Places marker on the highest peak and brings the
peak to center frequency.40 OUTPUT 718;"DEMOD 0N;DEMOD FM;" Turns on FM demodulation.50 OUTPUT 718;"MKPAUSE 500MS;” Turn on marker pause. The detector switches
automatically to the FMV detector during thedwell time.
60 END
DescriptionExecute “DEMOD ON;” to turn on the demodulator. “DEMOD AM;“, “DEMOD FM;“, or“DEMOD QPD;” selects the demodulation mode, but does not turn on the demodulator.
For AM or FM demodulation in nonzero frequency spans, use MKPAUSE to set the dwell time ofthe marker.
Quasi-peak demodulation (QPD) is available with Option 103. See the Option 103 ManualSupplement for more information about operating the quasi-peak detector remotely.
5-l 28 Programming Commands

DET Detection Mode
DETDetection ModeSelects the spectrum analyzer detection mode.
Syntax
XDET
Equivalent Softkey: DETECTOR PK SP NG or DETECTOR SMP PK.Preset State: DET POS.Related Commands: DEMOD, MEANTH, TV.
Example
10 OUTPUT 718;"IP;"20 OUTPUT 718;"SNGLS;"30 OUTPUT 718;"DET POS;TS;"40 OUTPUT 718;"VIEW TRA;"50 OUTPUT 718;"DET SMP;"60 OUTPUT 718;"CLRW TRB;TS;"70 OUTPUT 718;"VIEW TRB;"80 OUTPUT 718;"AVG TRA,TRB,2;"
90 OUTPUT 718;"BLANK TRB;"100 END
Description
Initializes the spectrum analy.zerActivates single-sweep mode.Activates the positive-peak detection of trace A.Stores results in trace A.Activates sample detection for trace I3Measures with trace BStores results in trace BAverages trace A and B with a ratio of 2, and storesthe results in trace A.Blanks trace rj leaving on1 y averaged results on screen.
The DET command selects the type of spectrum analyzer detection (positive-peak, sample, ornegative) and accesses service-diagnostic detection functions.
POS enables positive-peak detection, which displays the maximum video signal detectedover a number of instantaneous samples for a particular frequency.
SMP enables sample detection, which uses the instantaneous video signal value. Videoaveraging and noise-level markers, when activated, activate sample detectionautomatically.
NEG enables negative peak detection in sweep times of less than or equal to 200 ms. Thenegative peak detector is available with Option 101 or Option 301 only.
Programming Commands 5-128

DET Detection Mode
When used as a predefined variable, DET returns a number. The number that is returnedcorresponds to the DET parameter as shown in the following table.
SMP 0
POS 1
NEG 49
Query Response
5-130 Programming Commands

DISPOSE Dispose
DISPOSEDisposeFrees spectrum analyzer memory that was previously allocated for user-defined operands.
Syntax
xdispose
Item Description/Default
Jser-defined trace A trace defined by the TRDEF command.
Jser-defined variable A variable defined by the VARDEF or ACTDEF commands.
User-defined function A subroutine defined by the FUNCDEF command.
Number Any valid softkey number.
Range
Any valid trace name.
Any valid variablename.Any valid functionname.1 to 6, 601 to 1200.
Equivalent Softkey: DISPOSE ALL and DISPOSE USER REM are equivalent.Prerequisite Commands: TRDEF when using a user-defined trace. VARDEF or ACTDEF whenusing a user-defined variable.Related Commands: ERASE, KEYCMD, KEYDEF, KEYLBL, LIMIDEL, ONCYCLE, ONMKRU,ONPWRUP, ONDELAY, ONEOS, ONMKR, ONSRQ, ONSWP, ONTIME, TRMATH.
Programming Commands 5-131

DISPOSE Dispose
Example
OUTPUT 718;"VARDEF T-EMP,lO;" [email protected] a vam’able for use in a program. When thevariable is no longer needed, it can be deleted using theDISPOSE command
OUTPUT 718;"DISPOSE T-EMP;" Deletes T-EMP from spectrum analyzer memory.
DescriptionUsing the ONCYCLE, ONDELAY, ONEOS, ONMKR, ONMKRU, ONSRQ, ONSWP, ONTIME,TRMATH, TRDEF, VARDEF, FUNCDEF, ACTDEF, KEYDEF, KEYENH, or KEYCMD programmingcommands create a trace, variable, function, softkey, or “on-event” function that remains inthe spectrum analyzer’s memory until you delete it with the DISPOSE command, or executethe ERASE command. With the DISPOSE command, you can select which item is to be deleted(for example, executing “DISPOSE ONMKR; ” would delete any ONMKR functions that you havecreated). Or, if you execute DISPOSE ALL, all of the traces, variables, functions, softkeys,and “on-event” functions that you have created will be deleted from spectrum analyzermemory. Executing “DISPOSE ALL;” or the ERASE command frees all available spectrumanalyzer memory (except the state registers and predefined traces), to make the total availableuser-allotted memory the maximum size.
5-132 Programming Commands

DIV Divide
DIVDivideDivides source 1 by source 2 and places the result in the destination.
Syntax
D I V
- d e s t inot i o n
u s e r - d e f i n e d t r a c e I
L trace range /
% p r e d e f i n e d v a r i a b l e /
u s e r - d e f i n e d variable/
Item
User-defined trace
User-defined variable
Predeflned variable A command that acts as a variable. Refer to Table 5-l.
Predefined function Function that returns a value. Refer to Table 5-l.
Trace range A segment of trace A, trace B, trace C, or a user-defined trace.
Number Any real or integer number.
Description/Default
A trace defined by the TRDEF command.
A variable defined by VARDEF or ACTDEF commands.
Range
Any valid trace name.
Any valid variablename.
Real number range.
Prerequisite Commands: TRDEF when using a user-defined trace. ACTDEF or VARDEF whenusing a user-defined variable. TS when using trace data.Related Commands: MPY, SNGLS, TS.
Programming Commands 5-133

DIV Divide
Example
OUTPUT 718*"IP-"OUTPUT 718;"SNk;"OUTPUT 718."TS-"OUTPUT 718;& TRB,TRA,2;"OUTPUT 718;"VIEW TRB;"
Description
Initializes the spectrum analyzerActivates single-sweep mode.Updates trace information.Divides trace A &q two and places it in trace BD&plugs the result.
Integer values are used when a trace is either the destination or one of the sources. If tracedata is used both as the source and the destination, the DIV function is done with 32-bitarithmetic on 16-bit integer data. If a user-defined variable or predefined variable is used aseither the source or the destination, the DIV function is done in floating-point format. If a realnumber is used as a source, but the destination is an integer value, the result is truncated.If a trace is used as a source, be sure the trace contains a complete sweep of measurementinformation before executing DIV.
When the source is longer than the destination, the source is truncated to fit. When the sourceis shorter than the destination, the last element is repeated to fill the destination.
The results of the DIV function are invalid if source 2 is equal to zero.
5-134 Programming Commands

DL Display Line
DLDisplay LineDefines the level of the display line in the active amplitude units and displays the display lineon the spectrum analyzer screen.
Syntax
Item Description/Default Range
Number Any real or integer number. Default units are dBm. Dependent on thereference level.
Equivalent Softkey: l3SP LINE OM OFF .Preset State: DL OFFStep Increment: 1 major division.Related Commands: AUNITS, AUTO, LG, LN, NRL, RL, ROFFSET, TH.
Example
OUTPUT 718;"AUNITS DBM;" Changes the active amplitude units to dBm.OUTPUT 718;"DL ON;" Turns on the displa?/ line.OUTPUT 718;"DL -5DM;" Changes display line to -5 dBm.
DescriptionActivating video trigger mode activates the display line. The AUTO command and “DL OFF; ”turn off the display line. See “AUNITS” for more information on changing the active amplitudeunits.
Programming Commands 5-135

DL Display Line
Query Response
5-136 Programming Commands

DN Down
DNDownReduces the active function by the applicable step size.
Syntax
( DNXDN
Related Commands: See the list of active functions listed in the description for DN.
ExampleOUTPUT 718;“SS 1MHZ;CF 1GHZ;DN;” Setscenterfrequency to 1 GHz.OUTPUT 718;“SP 40MHZ;MKPK;DN;” Decreases the frequency span.
DescriptionBefore executing DN, be sure that the function to be decreased is the active function. Forexample, the second line of the programming example decreases the span, because markerpeak (MKPK) is not an active function.
The active functions are ACPBW, ACPSP, AT, CF, CRTHPOS, CRTVPOS, DL, DOTDENS, FA,FB, FMGAIN, GD, GL, LG, MKA, MKD, MKFCR, MKN, MKPAUSE, MKPX, ML, NDB, NRL, RB,RCLS, ROFFSET, RL, RLPOS, SAVES, SAVRCLN, SETDATE, SETTIME, SP, SQLCH, SRCALC,SRCAT, SRCPOFS, SRCPSWP, SRCPWR, SRCTK, SS, ST, TH, TVLINE, VB, VBR, and user-definedactive function specified by the ACTDEF command.
Programming Commands 5-137

DONEDoneAllows you to determine when the spectrum analyzer has separated the spectrum analyzercommands and has started to execute all commands prior to and including DONE. Thespectrum analyzer returns a value of “1” when all commands in a command string enteredbefore DONE have been started.
Syntax
DONE
f u n c t i o n p a t h o n l y
XDONE
Related Commands: TS.
Example
OUTPUT 718;"IP;SNGLS;CF lGHZ;SP 1GHZ;DONE;" Because TS does not precede the DONEcommand in this line, the center fre-quenxy and span values are set beforeDONE returns a “1. ” Functions cou-pled to Sl: such as R& have not beenchanged, and there is no trace data as-sociated with the new frequency settings.
ENTER 718;DoneDISP Done
Example 2
OUTPUT 718;"IP;SNGLS;CF lGHZ;SP 1GHZ;TS;DONE;" Because the take sweep (TS) mustbe completed before the DONE com-mand is executed, the autocoupledfunctions and trace data have beenchanged before the DONE commandis executed.
ENTER 718;Done Stores 1 in computer variable, calledDorE
DISP Done
5-138 Programming Commands

DONE Done
DescriptionAs shown by the example, if a take sweep (TS) precedes the DONE command, DONE isexecuted after all the preceding commands have been completed. Use a take sweep (TS) toensure all previous commands have completed before DONE returns a “ 1. ”
Query Response
Programming Commands 5.139

DOTDENSDot DensitySets the dot density value in the Analog+ display mode.
Syntax
d o t
XDOTDENS
Item Description/Default Range
Number Any valid integer number. 1 to 40.
Equivalent Softkey: BNfiOG+ ON OFF .Option Required: Option 101 or 301.Preset State: 15.Related Commands: ANLGPLUS.
ExampleOUTPUT 718;"ANLGPLUS ON;" Turns on the Analog+ display mode.OUTPUT 718;"DOTDENS 40;" Sets the dot density to 40.
DescriptionThe dot density value can be set from 1 to 40 dots per trace element. This command is specificto the Analog+ display mode; see “ANLGPLUS” for more information about the Analog+display mode.
Query Response
o u t p u ttermination -
5.140 Programming Commands

DRAWBOX Draw Box
DRAWBOXDraw BoxDraws a rectangular box on the spectrum analyzer display.
Syntax
DRAWBOX‘.w....
XDRAWBOX
For xl or x2, -40 to 471.For yl or y2, -22 to 233.For x thickness, 1 to x2 - xl, fory thickness, 1 to y2 - yl.
Related Commands: CLRDSP.
ExampleThe following programming line results in the spectrum analyzer display shown in Figure 5-3.
OUTPUT 718;"DRAWBOX 1,1,200,200,10,5;" Draws a box from 1,1 to 200,200. The boxhas horizontal boro!ers that are 10 displayunits wide, and a vertical borders that are5 display units wide.
47REF .0 dBm ATTEN 1 0 dBPEAKLOG
%
WA sSC F
COR
...................................... . ........
...............................................
...................................... . ........
...............................................
CENT 3 . 2 5 0 GHz S P A N 6 . 5 0 0 GHiS BW 3.0 MHz VBW 1 MHz S W P 1 3 0 msec
Figure 5-3. Using the DRAWBOX Command
SPECTRUMANALYZER
More1 of 3
RT
Programming Commands 5-141

DRAWBOX Draw Box
DescriptionYou must specify the rectangular area and the thickness of the horizontal and vertical bordersof the box.
Specifying the rectangular area: You specify the rectangular area by specifying thecoordinates of the lower left corner (xl, yl), and the upper right corner (x2, y2) of therectangle in display units. If you select a value of x2 that is equal to xl, the result will be avertical line instead of a box, and the border will be on the right side of the line. If y2 is equalto yl, a horizontal line will be drawn instead of a box, and the border will be below the line.
Specifying the border thickness: The value of x thickness allows you to specify the widthof the horizontal borders, and the value of y thickness allows you to specify the width of thevertical borders. If you select a thickness value that is equal to or greater than half of x2minus xl or greater than half of y2 minus yl, the result will be a solid box.
DRAWBOX affects only the spectrum analyzer display and printing of the spectrum analyzerdisplay. DRAWBOX does not change the plot of the spectrum analyzer display; the rectangularbox drawn by DRAWBOX will not be plotted. The rectangular box can be erased by executingCLRDSP.
5142 Programming Commands

DSPIX Display
DSPLYDisplayDisplays the value of a variable on the spectrum analyzer screen.
Syntax
f i e l d d e c i m a l
predefined v a r i a b l e /
*user-defined vorioble)
% p r e d e f i n e d functton /
b t r a c e element /
XDSPLY
“Field width” specifies the number of digits displayed, including sign and decimal point. (Placesto the right of the decimal point are limited by the decimal places field.) For example, thenumber 123.45 has a field width of 7 (even though the sign is not displayed) and 2 decimalplaces.
Item
Number
Number (field width ordecimal places)
User-defined variable
Predeflned variable A command that acts as a variable. Refer to ‘lhble 5-I.
PredeEned function Function that returns a value. Refer to Table 5-1.
Trace element An element of trace A. trace B. trace C. or a user-defined trace.
Description/Default
Any real or integer number.
Any integer number.
A variable defined by VARDEF or ACTDEF commands.
Range
Real number range.
Integer number range.
Any valid variablename.
Prerequisite Commands: ACTDEF or VARDEF when using a user-defined variable.Related Commands: DA, PA, PD, PR, PU.
Programming Commands 5-143
DSPLY Display
Example
OUTPUT 718;"CF BOOMHZ;” Sets center frequencz/ to 300 MHzOUTPUT 718;"PU;PA 50,lSO;DSPLY CF, Center frequency is displayed to three oT.ecirnal13.3;" places in a field width of 13.
DescriptionThe DSPLY command displays the value of a variable anywhere on the spectrum analyzerdisplay. Use the PU, PR, and PA commands to position the variable on the screen. (You do nothave to specify the PU or PD commands; DSPLY can display the data independent of PU or PDcommands.)
The coordinates given relate to the lower left corner of the first character. For example,“PU;PA 50,lOO;DSPLY CF,13.3;” would display the center frequency with the first digit tothe right and above the point represented by 50, 100. (Position the pen before executing theDSPLY command.)
If the number to be displayed is larger than the field width, the number is displayed inscientific notation.
The DSPLY command also places the value of the variable in the display list. See “DA” formore information about the display list.
5-144 Programming Commands

DT Define Terminator
DTDefine TerminatorDefines any character as a label terminator. The label terminator is only used with the LBcommand.
Syntax
c h a r a c t e r
XDT
Item Description/Default Rtae
Character Any valid character.
Related Commands: LB.
Example
OUTPUT 718; “DTQ; ”
OUTPUT 718; “CF GOOMHZ; ”
OUTPUT 718;“PU;PA 100,lOO;LB CAL OUT 2ND HARMONICORL ODM;”
Lk@ws the “@” symbolas the text terminator:Sets center frequency to600 MHz.Displuys the label “CAL,OUT 2ND HARMONIC”on the spectrum analyzerscreen then executes theRL command.
DescriptionThe DT command is used by the LB command to separate text from spectrum analyzercommands.
Programming Commands 5-145

EEEnable EntrySends the controller the values entered on the spectrum analyzer numeric keypad by theoperator.
Syntax
< EEXEE
Related Commands: RQS.
ExampleThe following example works with both RS-232 and HP-IB interfaces; however, the address(718) must be changed for RS-232 operation.
The program polls the spectrum analyzer for its status byte.
10 PRINTER IS 1 Outputs to the computer screen.20 DISP "Enter new value with spectrum analyzernumber pad and terminate with units key"30 OUTPUT 718;"RQS 2;CF EE;"
40 REPEAT
50 OUTPUT 718;"STB?;"
60 ENTER 718;A70 UNTIL BIT(A,l)=l
80 DISP90 OUTPUT 718;"?;"100 ENTER 718;New,value110 PRINT "You entered the value of 'I;
New-value120 OUTPUT 718;"HD;"130 END
Sets up SRQ mask, then uses theenable entry mode.Rd?s the spectrum analyzer untilentry is complete.Asks the spectrum analyzer forstatus byte.
Does REPEAT UNTIL loop untiluser presses a terminating key.Asks for ermy.
Displays value.Turns oflenable entry mode
5-146 Programming Commands
EE Enable Entry
DescriptionUnlike enter parameter (EP), EE does not terminate the entry mode when the operatorcompletes an entry.
The EE command is used generally in the following sequence of events:
1. A program loop prevents the controller from using the entered value until the operatorsignals that the entry is complete.
2. The operator makes a data entry, which is stored in the spectrum analyzer internal dataregister.
3. The operator indicates completion of the entry.
4. The controller reads the value of the entry and continues to the next program step.
Programming Commands 5-147

EKEnable KnobAllows data entry with the front-panel knob when the spectrum analyzer is under remotecontrol.
Syntax
( EK
Example
1 PRINTER IS 110 OUTPUT 718;"MKN;EK;"
20 PRINT "USE KNOB TO PLACE MARKER"
30 PRINT "PRESS CONTINUE WHEN DONE"40 PAUSE
XEK
Activates a marker and enables the front-panelknob.While the program pauses, the operator posi-tions a marker on a signal that needs furtheranalysis.Prompts userThe operator positions a marker on a signal thatneeds further analysis.Insert analysis program here.
100 END
DescriptionWith the EK command, the knob is functional, but other front-panel functions remaininoperative. Moving the knob changes the active function. If no function is active, moving theknob has no effect.
5-148 Programming Commands
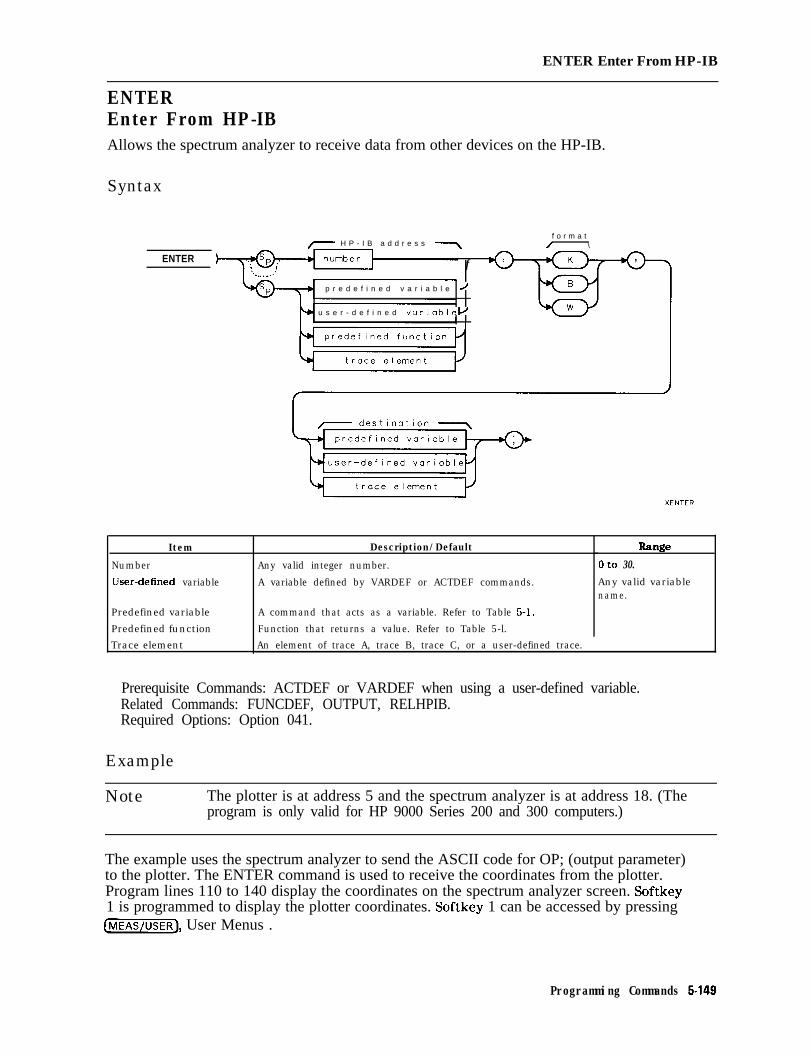
ENTER Enter From HP-IB
ENTEREnter From HP-IBAllows the spectrum analyzer to receive data from other devices on the HP-IB.
Syntax
ENTER
- H P - I B a d d r e s sf o r m a t/ \
f
p r e d e f i n e d v a r i a b l e /
u s e r - d e f i n e d variable/
Item
Number
User-defined variable
Predefined variable A command that acts as a variable. Refer to Table 5-l.
Predefined function Function that returns a value. Refer to Table 5-l.Trace element An element of trace A, trace B, trace C, or a user-defined trace.
Description/Default
Any valid integer number.
A variable defined by VARDEF or ACTDEF commands.
R-fleoto 30.
Any valid variablename.
Prerequisite Commands: ACTDEF or VARDEF when using a user-defined variable.Related Commands: FUNCDEF, OUTPUT, RELHPIB.Required Options: Option 041.
Example
Note The plotter is at address 5 and the spectrum analyzer is at address 18. (Theprogram is only valid for HP 9000 Series 200 and 300 computers.)
The example uses the spectrum analyzer to send the ASCII code for OP; (output parameter)to the plotter. The ENTER command is used to receive the coordinates from the plotter.Program lines 110 to 140 display the coordinates on the spectrum analyzer screen. Softkey1 is programmed to display the plotter coordinates. Softkey 1 can be accessed by pressing(MEAS/USERj, User Menus .
Programming Commands 5-149
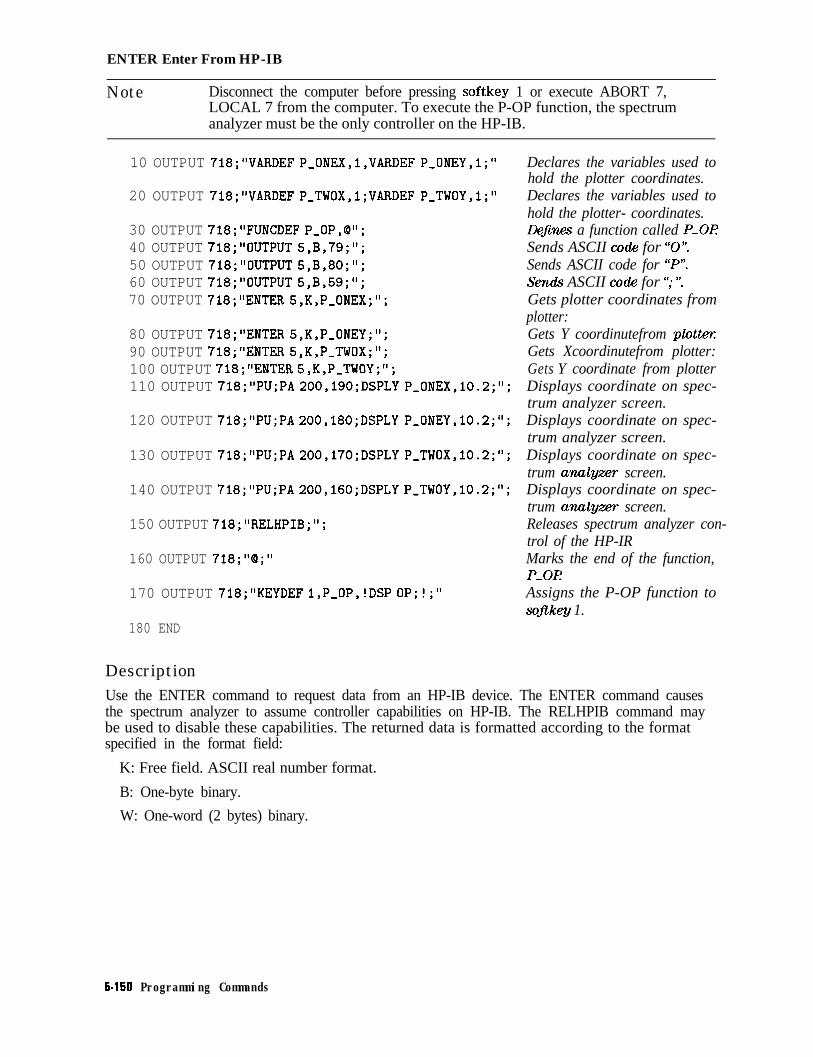
ENTER Enter From HP-IB
Note Disconnect the computer before pressing softkey 1 or execute ABORT 7,LOCAL 7 from the computer. To execute the P-OP function, the spectrumanalyzer must be the only controller on the HP-IB.
10 OUTPUT 718;"VARDEF P-ONEX,l,VARDEF P-ONEY,l;"
20 OUTPUT 718;"VARDEF PmTWOX,l;VARDEF PmTWOY,l;"
30 OUTPUT 718;"FUNCDEF P-OP,Q";40 OUTPUT 718;"OUTPUT 5,B,79;";50 OUTPUT 718;"OUTPUT 5,B,80;";60 OUTPUT 718;"OUTPUT 5,B,59;";70 OUTPUT 718;"ENTER 5,K,P,ONEX;";
80 OUTPUT 718;"ENTER 5,K,P,ONEY;";90 OUTPUT 718;"ENTER S,K,P-TWOX;";100 OUTPUT 718;"ENTER 5,K,P_TWOY;";110 OUTPUT 718;"PU;PA 200,190;DSPLY P-ONEX,l0.2;";
120 OUTPUT 718;"PU;PA 200,180;DSPLY P-ONEY,l0.2;";
130 OUTPUT 718;"PU;PA 200,170;DSPLY P,TWOX,l0.2;";
140 OUTPUT 718;"PU;PA 200,160;DSPLY P,TWOY,l0.2;";
150 OUTPUT 718;"RELHPIB;";
160 OUTPUT 718;"@;"
170 OUTPUT 718;"KEYDEF l,P,OP,!DSP OP;!;"
Declares the variables used tohold the plotter coordinates.Declares the variables used tohold the plotter- coordinates.D&nes a function called P-OI?Sends ASCII co& for “0”.Sends ASCII code for “P”.Seno!s ASCII code for “; “.Gets plotter coordinates fromplotter:Gets Y coordinutefrom plot&xGets Xcoordinutefrom plotter:Gets Y coordinate from plotterDisplays coordinate on spec-trum analyzer screen.Displays coordinate on spec-trum analyzer screen.Displays coordinate on spec-trum anulyz47.r screen.Displays coordinate on spec-trum analyzer screen.Releases spectrum analyzer con-trol of the HP-IRMarks the end of the function,P-ORAssigns the P-OP function tosojtkey 1.
180 END
DescriptionUse the ENTER command to request data from an HP-IB device. The ENTER command causesthe spectrum analyzer to assume controller capabilities on HP-IB. The RELHPIB command maybe used to disable these capabilities. The returned data is formatted according to the formatspecified in the format field:
K: Free field. ASCII real number format.
B: One-byte binary.
W: One-word (2 bytes) binary.
6-150 Programming Commands

EP Enter Parameter Function
EPEnter Parameter FunctionSends values entered on the spectrum analyzer number keyboard to the present active functionvalue. EP must be invoked each time a new value is entered.
Syntax
( E P
XEP
Related Commands: See the list of active functions listed in the description for El?
Example
OUTPUT 718;"ST;EP;" The sweep time can be entered by using the front-panel kegs.
DescriptionThe EP command allows the user to enter a value manually through the numeric keypad.When the value is terminated by a unit or CENTER) key on the spectrum analyzer, the spectrumanalyzer will be ready to execute more remote commands.
Note Because the EP command uses the current active function, confirm that thedesired function is active before executing the EP command.
The active functions are ACPBW, ACPSP, AT, BAUDRATE, CF, CRTHPOS, CRTVPOS, DL,DOTDENS, FA, FB, FFTSTOP, FMGAIN, FOFFSET, GD, GL, LG, MKA, MKD, MKFCR, MKN,MKPAUSE, MKPX, ML, M4, NDB, NRL, PREAMPG, PRNTADRS, RB, RCLS, ROFFSET, RL,RLPOS, SAVES, SAVRCLN, SETDATE, SETTIME, SP, SQLCH, SRCAT, SRCPOFS, SRCPSTP,SRCPSWP, SRCPWR, SRCTK, SS, ST, TH, TIMEDATE, TVLINE, VB, VBR, and user-definedactive function specified by the ACTDEF command.
Programming Commands 5-l 51
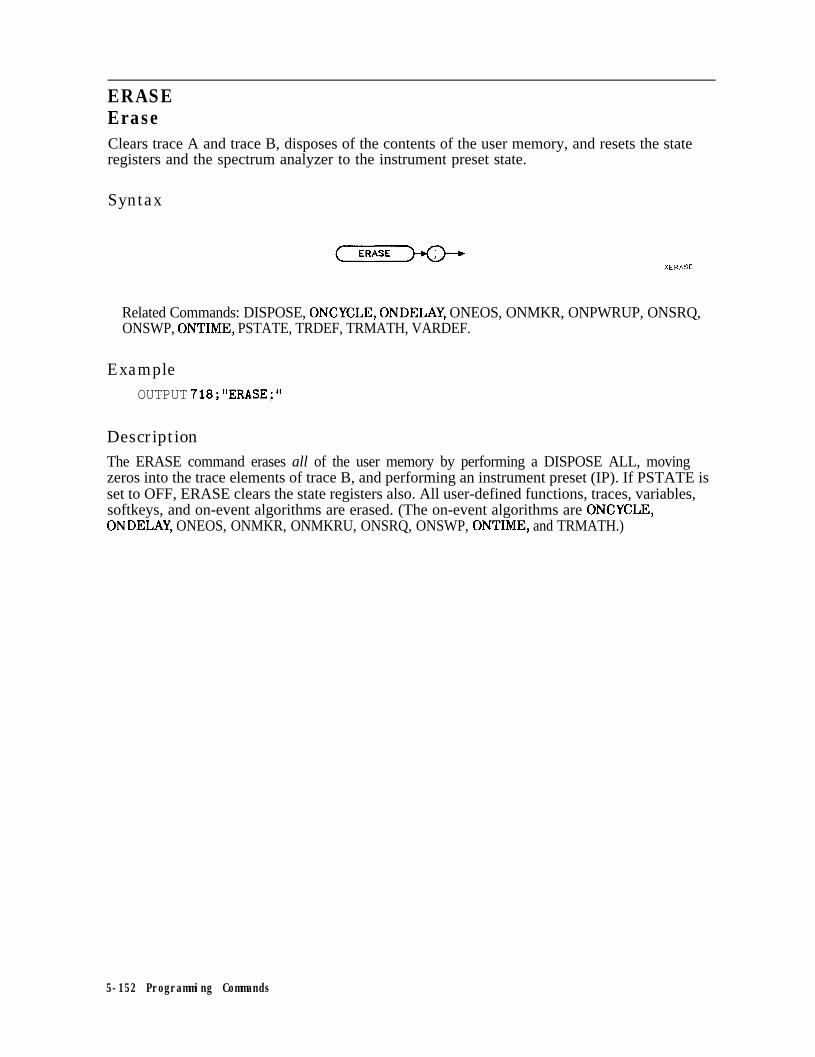
ERASEEraseClears trace A and trace B, disposes of the contents of the user memory, and resets the stateregisters and the spectrum analyzer to the instrument preset state.
Syntax
Related Commands: DISPOSE, ONCYCLE, ONDELAY, ONEOS, ONMKR, ONPWRUP, ONSRQ,ONSWP, ONTIME, PSTATE, TRDEF, TRMATH, VARDEF.
ExampleOUTPUT 718*"ERASE*"# ,
DescriptionThe ERASE command erases all of the user memory by performing a DISPOSE ALL, movingzeros into the trace elements of trace B, and performing an instrument preset (IP). If PSTATE isset to OFF, ERASE clears the state registers also. All user-defined functions, traces, variables,softkeys, and on-event algorithms are erased. (The on-event algorithms are ONCYCLE,ONDELAY, ONEOS, ONMKR, ONMKRU, ONSRQ, ONSWP, ONTIME, and TRMATH.)
5-152 Programming Commands

EXP Exponent
EXPExponentPlaces the exponential of the source in the destination. The EXP command is useful forconverting log values to linear values.
Syntax
E X P
7 d e s t i n a t i o n -
b u s e r - d e f i n e d t r a c e /
h t r a c e r a n g e I
b p r e d e f i n e d v a r i a b l e I
u s e r - d e f i n e d v a r i a b l e
s c a l i n g f a c t o rs c a l i n g f a c t o r
Item
User-defined trace
User-defined variable
DescriotionlDefault
A trace deflned by the TRDEF command.
A variable defined by VARDEF or ACTDEF commands.
Predeflned variable A command that acts as a variable. Refer to Table 5-l.
Predetied function Function that returns a value. Refer to Table 5-1.
Trace range A segment of trace A, trace B, trace C, or a user-defined trace.
Trace element An element of trace A, trace B, trace C, or a user-defined trace.
Number Any real or integer number.
XEXP
Any valid trace name.
Any valid variablename.
Real number range.
Prerequisite Commands: TRDEF when using a user-defined trace. ACTDEF or VARDEF whenusing a user-defined variable. TS when using trace data.Related Commands: FUNCDEF, LOG.
Programming Commands 5-l 53

EXP Exponent
Example 1This example converts the marker amplitude to power units.
10 OUTPUT 718;"IP;" Initializes the spectrum analyzer20 OUTPUT 718;"SNGLS;" Activates the single-sweep mode.30 OUTPUT 718;"VARDEF P-MW,O;" Initializes variable P..MW to 0.40 OUTPUT 718;"TS;MKPK HI;" Fino!s highest peak of sweep.50 OUTPUT 718;"EXP P-MW,MKA,lO;" Divides the marker amplitude by 10, raises the
value of the marker amplitude to the power of 10,and stores the results in P-MN?
60 OUTPUT 718;"P,MW?;"70 ENTER 718;Number80 DISP Number;"mW"90 END
Returns the value of PM to computerAssigns value to computer variable.Displays result on the computer screen.
Example 2This example finds the natural exponential of anumber and uses the LOG command to returnthe original source value of the EXP function.
10 OUTPUT 718;"VARDEF E,XP,O;" Dejlnes a variable called E-XI?20 OUTPUT 718;"EXP E,XP,2,2.30259;" Fino!s the natural exponential of 2.30 OUTPUT 718;"E,XP?;" Returns the natural exponent of 2.40 ENTER 718;Value50 PRINT Value60 OUTPUT 718;"LOG E-XP,E,XP,2.30259;"
Prints the value of the exponential.Uses the log function on the exponentialvalue.
70 OUTPUT 718;"E_XP?;"
80 ENTER 718;Logvalue90 PRINT Logvalue100 OUTPUT 718;"VARDEF E-XPY,O;"110 OUTPUT 718;"EXP E-XPY,-5,2.30259;"120 OUTPUT 718;"E_XPY?;"
130 ENTER 718;Value2140 PRINT Value2150 OUTPUT 718;"LOG E,XPY,E-XPY,2.30259;"
160 OUTPUT 718;"E_XPY?;"
170 ENTER 718;Logval180 PRINT Logval190 END
The log of the exponential value is ap-proximately 2.
Prints value.Declares a variable called E-XPYFinds the natural exponential of -5.Returns the value of the natural exponen-tial of -5.
Prints the value of the exponential.Uses the log function on the exponentialvalue.The log of the exponential value is ap-proximately -5.
5-154 Programming Commands

EXP Exponent
DescriptionThe EXP command first divides the source by the scaling factor, then uses the quotient as anexponent of 10:
10source/scaling factor is placed into the destination.
The EXP command can be used to evaluate a natural exponential function by using 2.30259as the scaling factor. Because EXP and LOG are inverse functions, the EXP command hasa scaling factor that may be used to “undo” the scaling factor of the LOG command. (Seeexample 2.)
When the source is longer than the destination, the source is truncated to fit. When the sourceis shorter than the destination, the last element is repeated to fill the destination.
See “LOG” for more information on the scaling factor.
Programming Commands 5-155

FAStart FrequencySpecifies the start frequency.
Syntax
Item Description/Default R-eNumber Any real or integer number. Default unit is Hz. Frequency range of
the spectrum analyzer.
Equivalent Softkey: START FREQ .Step Increment: Frequency span divided by 10.Related Commands: CF, FB, FOFFSET, FS, HNLOCK, HNUNLK, MKF, SI?
ExampleOUTPUT 718;"FA 88MHZ;FB 108MHZ;" Sets the start frequency to 88MH2, the stop frequency
to 108 MHzOUTPUT 718*"FA'-"ENTER 718;l&eq
* , Returns the start frequency.Stores the response from the spectrum analyzer
DISP Freq Displays the frequency on the computer screen.
5-l 56 Programming Commands

FA Start Frequency
DescriptionThe FA command specifies the start frequency value. The start frequency is equal to the centerfrequency minus the span divided by two (FA = CF - SP/2).
Note Changing the start frequency changes the center frequency and span. Rx- theHP 8592L, HP 8593E, HP 8595E, HP 85963 only: The start frequency may belimited by the harmonic band, if harmonic band locking is used.
Query Response
Programming Commands 5-157

FBStop FrequencySpecifies the stop frequency.
Syntax
Item Description/Default Range
Number Any real or integer number. Default unit is Hz. Frequency range ofthe spectrum analyzer.
Equivalent Softkey: STOP FREQ .Step Increment: Frequency span divided by 10.Related Commands: CF, FA, FOFFSET, FS, HNLOCK, MKF, SI?
ExampleOUTPUT 718;"FA 88MHZ;FB 108MHZ;" Sets the start frequency to 88 MHz?, the stop frequency
to 108 MHkOUTPUT 718."FB'."ENTER 718;keq
* # Returns the stop jkequency.Stores the response from the spectrum analyzex
DISP Freq Displays the frequency on the computer screen.
5-l 58 Programming Commands

FB Stop Frequency
DescriptionThe FB command specifies the stop frequency value. The stop frequency is equal to the centerfrequency plus the span divided by two (FA = CF + SP/2).
Note Changing the stop frequency changes the center frequency and span. fir theHP 8592L, HP 85933, HP 8595E, or HP 8596E only: The stop frequency may belimited by the harmonic band, if harmonic band locking is used.
Query Response
o u t p u tt e r m i n a t i o n ---)
Programming Commands 5-159

FFTFast Fourier TransformPerforms a discrete fast Fourier transform on the source trace array and stores the result in thedestination array.
Syntax
FFT
- d e s t i n a t i o n
u s e r - d e f i n e d t r a c e
,- w i n d o w -\
u s e r - d e f i n e d t r a c e u s e r - d e f i n e d t r a c e
Item I Description/Default
User-defined trace A trace defined by the TRDEF command.I Range
Any valid trace name.
Prerequisite Commands: TWNDOW.Related Commands: MKREAD, TWNDOW.Restrictions: Not available with Analog+ display mode. See “ANLGPLUS” for moreinformation.
Example
OUTPUT 718."IP*SNGLS*"OUTPUT 718;"CFy300MHk;TS;MKPK HI;MKTRACK ON;"
OUTPUT 718;"CONTS;SP 200KHZ;RB IOOKHZ;"
OUTPUT 718;"MKTRACK 0FF;SP OHZ;"
OUTPUT 718;"MKPK HI;MKRL;LN;SNGLS;"OUTPUT 718;"ST 800MS;TS;"
OUTPUT 718;"TWNDOW TRB,FLATTOP;"
Initializes spectrum anulyxer:Tunes center frequency to the car-rier and decreoxes span.Changes resolution bandwidth to cap-ture modulation.Reduces span to zero Hz to demodu-late carrierChanges to linear amplitude scale,Sets sweep time to correspond tomodulation frequ&ncy, the executesFFT function.The TWNDOW must be defiined be-fore using the F~jknction.
5-160 Programming Commands

FFT F&t Fourier Transform
OUTPUT 718;"FFT TRA,TRA,TRB;VIEW TRA;"
OUTPUT 718;"MKPK HI;"OUTPUT 718."MKD."OUTPUT 718;"MKPi NR;"OUTPUT 718;"MKREAD FFT;"
OUTPUT 718."MKF'.", * ,
ENTER 718;ADISP A
Executes the FFTjimction with thetrace window function.Finds the highest signal.Activates the marker deltajim%ion.Finds the next peak to the right.Selects the FFl’ marker to displaythe marker delta value as a fre-quency instead of time value.Finds the dz@rence between the twopeaks.
Displays thefrequency d@Lmnce.
DescriptionFFT weights the source trace with the function in the window trace (the window trace isdescribed below). The transform is computed and the results are placed in the destinationtrace. Unlike FFTAUTO and FFTCONTS, FFT performs the FFI’ measurement only once. UseFFTAUTO or FFI’CONTS if you want the FFT measurement to be performed at the end of everymeasurement sweep.
The spectrum analyzer should be in linear mode when using the FF”I’ command. The FFTresults are displayed on the spectrum analyzer in logarithmic scale. For the horizontaldimension, the frequency at the left side of the graph is 0 Hz, and at the right side is Fmax.
Fmax can be calculated using a few simple equations and the sweep time of the spectrumanalyzer. The sweep time divided by the number of trace array elements containing amplitudeinformation is equal to the sampling period. The reciprocal of the sampling period is thesampling rate. The sampling rate divided by two yields Fmax.
For example, let the sweep time of the spectrum analyzer be 20 ms and the number of traceelements be 400. The sweep time (20 ms) divided by 400 equals 50 ps, the sampling period.The sample rate is l/50 ps. Fmax equals l/50 p.s divided by 2, or 10 kHz.
FFT is designed to be used in transforming zero span information into the frequency domain.Performing FF’T on a frequency sweep (when the frequency span is greater than zero) will notprovide time-domain results.
The windowing function stored in the window trace may be selected with the trace window(TWNDOW) command or you can store your own values in that trace. The trace windowfunction modifies the contents of a trace array according to one of three built-in algorithms:UNIFORM, HANNING, or FLATTOI? See Figure 5-4, Figure 5-5, and Figure 5-6. The TWNDOWcommand multiplies a trace array with one of these windows.
Selecting a window: The amplitude and frequency uncertainty of the Fourier-transformeddisplay depends on both the choice of trace windows and the spectrum analyzer sweep time.Amplitude uncertainty is maximum when the spectral component falls midway between thefilter shapes. Passbands that are flatter in shape, like the FLATTOP filter, contribute lessamplitude uncertainty, but frequency resolution and sensitivity are compromised.
The UNIFORM window algorithm has the least frequency uncertainty and greatest amplitudeuncertainty. The UNIFORM window does not contain time-domain weighing and leaves thedata alone. Use the UNIFORM window for transforming noise signals or transients that decaywithin one sweep time period. The UNIFORM window yields the best frequency resolution, butalso produces the highest side lobes for periodic signals.
Programming Commands 5-l 61
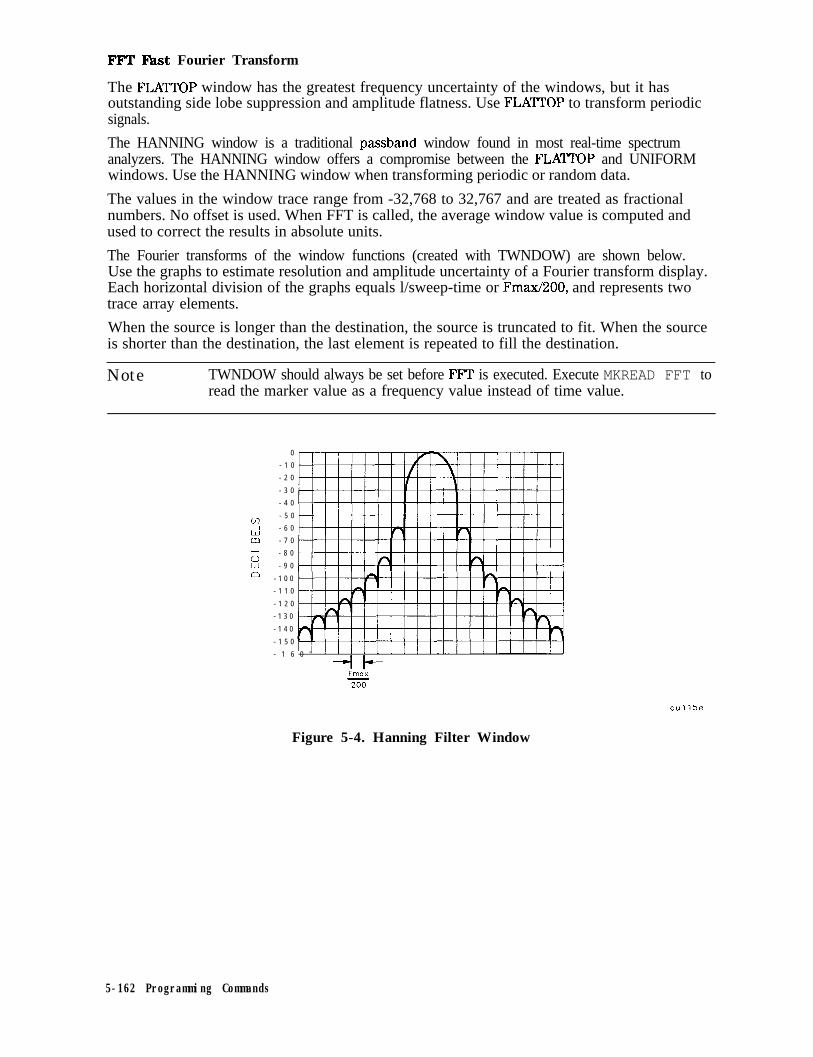
FFT, F&t Fourier Transform
The FLATTOP window has the greatest frequency uncertainty of the windows, but it hasoutstanding side lobe suppression and amplitude flatness. Use FLATTOP to transform periodicsignals.
The HANNING window is a traditional passband window found in most real-time spectrumanalyzers. The HANNING window offers a compromise between the FLATTOP and UNIFORMwindows. Use the HANNING window when transforming periodic or random data.
The values in the window trace range from -32,768 to 32,767 and are treated as fractionalnumbers. No offset is used. When FFT is called, the average window value is computed andused to correct the results in absolute units.
The Fourier transforms of the window functions (created with TWNDOW) are shown below.Use the graphs to estimate resolution and amplitude uncertainty of a Fourier transform display.Each horizontal division of the graphs equals l/sweep-time or Fmax/BOO, and represents twotrace array elements.
When the source is longer than the destination, the source is truncated to fit. When the sourceis shorter than the destination, the last element is repeated to fill the destination.
Note TWNDOW should always be set before FFI’ is executed. Execute MKREAD FFT toread the marker value as a frequency value instead of time value.
0
- 1 0
- 2 0
- 3 0
- 4 0
cn- 5 0
1 - 6 0
ii - 7 0
- - 8 00w - 9 0n - 1 0 0
- 1 1 0
- 1 2 0
- 1 3 0
- 1 4 0
- 1 5 0
- 1 6 0 "
-it--
cu115e
Figure 5-4. Hanning Filter Window
5-162 Programming Commands

FFT Fbst Fourier Transform
8 0
.90
00
I I1 i I
II I
0
- 1 0
- 2 0
- 3 0
- 4 0VI-A - 5 0
E - 6 0
0 - 7 0
E - 8 0
- 9 0
- 1 0 0
- 1 1 0
- 1 2 0
- 1 3 0
- 1 4 0
Figure 5-5. Uniform Filter Window
Figure 5-6. Flat Top Filter Window
Programming Commands 5-163

FFTAUTOMarker to Auto FFTPerforms a fast Fourier transform (FIT) on the signal on which the marker is placed.
Syntax
Equivalent Softkey: MARKER -> AUTO FFT .Prerequisite Commands: Use a marker command to place a marker on the signal of interest.See YIhble 5-4 for a list of the marker commands.Related Commands: FFI’CONTS, FFTOFF, FFTSNGLS.
ExampleThis example can be used to perform an FF”I’ continuously on an amplitude modulated signal at100 MHz.
OUTPUT 718*"RL ODB-"OUTPUT 718&F 100ilHZ;"
Sets reference level to 0 dBm.Sets the center frequency to 100 MHz.
OUTPUT 718."SP IOMHZ-", t Decreases the freqwncg span.OUTPUT 718."MKPK HI-", , Places the marker on a signal (this example oxwnes that there
is only one signal present).OUTPUT 718;"FFTAUTO;" Zoom in on the sip&, and then does an FFT continuously
on the modulated siml.
DescriptionFFTAUTO uses the marker’s position to determine which signal is to be measured. FFIAUTOcenters the signal and, if the frequency span of the spectrum analyzer is greater than zero,decreases the frequency span to zero before performing an FFT on the signal. When the FFT isperformed, the spectrum analyzer does the following:
n Changes to the continuous sweep mode.n Changes to the linear amplitude scale.n If the current detector is the peak detector, changes to the sample detector.n If the initial frequency span was greater than 0 Hz, the spectrum analyzer adjusts the signal
peak to within 0.5 division of the top graticule.n Does an FFT on trace A and then places trace A in both the clear-write and store-blank
modes. (When the spectrum analyzer is in both the clear-write and store-blank modes, thetrace data is still taken from the spectrum analyzer input during every measurement sweep,but the trace is not shown on the spectrum analyzer display.)
n Places the results of the FFT in trace B, and then changes trace B to the view mode.
FFTAUTO performs the FFT on the signal at the end of every sweep. After executingFFTAUTO, you should adjust the values for the resolution bandwidth, video bandwidth,and sweep time according to the highest modulation frequency of interest. The resolutionbandwidth should be about ten times greater than the highest modulation frequency ofinterest, and the video bandwidth should be about 10 times higher than the highest modulationfrequency of interest. The sweep time should be set according to the chart shown in
5-l 64 Programming Commands

FFTAUTO Marker to Auto FFT
“Measuring Amplitude Modulation with the Fast Fourier Transform Function” in Chapter 4 ofthe HP 8590 E-Series and LSeries Spectrum An&zers User’s Guide. You can use the resultsof the FFTCLIP command to determine if the FFT data is valid.
RestrictionsExecuting FFTAUTO turns off the following functions: windows display mode (WINON), N dBpoint measurement (NDBPNT), gate utility functions (GDRVUTIL), TO1 measurement (TOI),marker table (MKTBL), peak table (PKTBL), percent AM (PCTAM), peak zoom (PKZOOM),power menu measurements (ACP, ACPE, CHP, and OBW), and Analog+ display mode(ANLGPLUS).
FFTAUTO uses the following when performing an FFT:
n The flat top filter window. (See “FFT” for more information about the flat top filter window.)
w Trace B and trace C. If you want to save the trace data that is in trace B or trace C, youshould save the trace data before executing FFTAUTO, FFTCONTS, or FFTSNGLS. (See“SAVET” for more information about saving trace data.)
n The FFTMKR command to turn on the FFT markers (you can use the MKA or MKF todetermine the amplitude or frequency of the marker).
Programming Commands 5-165

FFTCLIPFFT Signal ClippedIndicates if the FFI’ results are valid.
Syntax
FFTCL I P
Prerequisite Commands: FFTAUTO, FFTSNGLS, FFTCONTS.Related Commands: FFTSTAT.
Example
OUTPUT 718*"FFTCONTS-", 9 Starts the FFI:OUTPUT 718."FFTCLIP'."ENTER 718;kclippe&
Queries FFTCLEReturns the value of FFTCLII?
DescriptionWhenever you use FFTAUTO, FFTCONTS, or FFTSNGLS to perform an FFI’ on a signal, you canuse the FFTCLIP command to determine if the FFT data is valid. If the current measurementsweep resulted in a trace that is above the top graticule line on the spectrum analyzer display,the input trace (trace A) has been “clipped,” and the FFI data is not valid. If the input trace isnot clipped, the FFT data is valid.
Query Response
QFFTCL IP
5.166 Programming Commands

FFT.CONTS FFT Continuous Sweep
FFTCONTSFFT Continuous SweepPerforms a fast Fourier transform (FFT) continuously on the current signal.
Syntax
Equivalent Softkey: CONTINUS FFT .Prerequisite Commands: LN, Sl?Related Commands: FFTOFF, FFTSNGLS.
ExampleOUTPUT 718; “SP OHZ; ” Sets the spectrum analyzer to zero span.OUTPUT 718; “LN; ” Changes the amplitude scale to linear:OUTPUT 718;"FFTCONTS;" Starts the continuous FlT
DescriptionYou should change the frequency span to 0 Hz and the amplitude scale to linear beforeexecuting FFTCONTS. When FFTCONTS is executed, the spectrum analyzer does the following:
n Changes to the continuous sweep mode.n If the current detector is the peak detector, changes to the sample detector.
Does an FFI’ on trace A. Trace A is then placed in both the clear-write and store-blankmodes. (When the spectrum analyzer is in both the clear-write and store-blank modes, thetrace data is still taken from the spectrum analyzer input during every measurement sweep,but the trace is not shown on the spectrum analyzer display.)
n Places the results in trace B (trace B is placed in the view mode).
You can use the results of the FFTCLIP command to determine if the FFI’ data is valid. If youwant to view the input data (trace A), execute “TRDSP TRA,ON; ‘I.
RestrictionsExecuting FFTCONTS turns off the following functions: windows display mode (WINON),N dB point measurement (NDBPNT), gate utility functions (GDRVUTIL), TO1 measurement(TOI), marker table (MKTBL), peak table (PKTBL), percent AM (PCTAM), peak zoom(PKZOOM), power menu measurements (ACP, ACPE, CHP, and OBW), or Analog+ display mode(ANLGPLUS).
FFTCONTS uses the following when performing an FFT:
n The flat top filter window. See “FFT” for more information about the flat top filter window.w Trace B and trace C. If you want to save the trace data that is in trace B or trace C, you
should save the trace data before executing FFTAUTO, FFTCONTS, or FFTSNGLS. (See“SAVET” for more information about saving trace data.)
n The FFTMKR command to turn on the FFI markers (you can use the MKA or MKF todetermine the amplitude or frequency of the marker).
You should execute the FFTOFF command when you are finished using the FFT measurement.
Programming Commands 5-167

FFTMKRFFT MarkersActivates the FFI’ markers and displays the FFT annotation on the spectrum analyzer display.
Syntax
F F T M K R
Equivalent Softkey: FFT MARKERS .Related Commands: FFTCONTS, FFTOFF, FFISNGLS, FFTPCTAM, FFTPCTAMR, MKA, MKF.
Example
OUTPUT 718;"RCLT TRA,l;" Recalls the FFl’ trace.OUTPUT 718;"FFTMKR;" Activates the FFT markers.
DescriptionIf the spectrum analyzer is not performing an FFT measurement, the FFTMKR commanddisplays the FFT annotation below the last graticule on the spectrum analyzer display, andactivates the marker in the FFT readout mode. (FFTMKR uses the current sweep time todetermine the FFT stop frequency that is displayed.) If the spectrum analyzer is alreadyperforming an FFI’, executing FFI’MKR activates only the FFT markers. You need to executeFFIOFF to exit out of the FFT measurement and return to normal spectrum analyzeroperation.
RestrictionsExecuting FFTMKR turns off the following functions: windows display mode (WINON), N dBpoint measurement (NDBPNT), gate utility functions (GDRVUTIL), TO1 measurement (TOI),marker table (MKTBL), peak table (PKTBL), percent AM (PCTAM), peak zoom (PKZOOM),power menu measurements (ACP, ACPE, CHP, and OBW), and Analog+ display mode(ANLGPLUS).
The purpose of the FFIMKR command is to allow you to restore the FFT annotation when yourecall FFT trace data (the FFI annotation is not saved when you save trace data). The percentAM readout can also be restored by executing the FFTPCTAM command after FFTMKR. (See“FFI’PCTAM” for more information about the percent AM measurement.)
You can use the MKF or MKA commands to determine the amplitude or frequency of an FFI’marker.
5-l 66 Programming Commands

FBTMM FFT Marker to Midscreen
FFTMMFFT Marker to MidscreenChanges the FFT midscreen frequency of the spectrum analyzer to the frequency of the FFImarker.
Syntax
F F T M M
Equivalent Softkey: M&lXER -) KID SCRN .Prerequisite Commands: FFTAUTO, FFTSNGLS, FFTCONTS.Related Commands: FFTMS, MKA, MKF.
ExampleOUTPUT 718;"FFTCONTS;"OUTPUT 718;"MKPK HI;"
OUTPUT 718;"MKPK NH;"
OUTPUT 718;"FFTMM;"
Description
Starts the continuous FIT.Finds the sign& with the highest amplitude (usually the signalat 0 Hz).Finds the signal with the next highest amplitude (usually thedominant modulation frequency).Moves the signal to FFT midscreen.
FFI’MM is performed only if the spectrum analyzer is performing a FFI’ measurement.Changing the FFI midscreen frequency of the spectrum analyzer also changes the FFI’ stopfrequency of the spectrum analyzer. Because the FFl’ stop frequency is limited by sweep timeof the spectrum analyzer, it may not be possible to change the FFI’ midscreen frequency to thefrequency of the FFI marker. If the FFTMM command does not move the signal to the FFTmidscreen frequency, you should check if the FFT stop frequency is limited by the sweep timerange or the sweep time increments for your spectrum analyzer. The FFI’ stop frequency isrelated to the sweep time as follows:
FFT stop frequency =400
(Sweep time x 2)
Programming Commands 5-169

FFTMSFFT Marker to FFT Stop FrequencyChanges the FFT stop frequency of the spectrum analyzer to the frequency of the FFI marker.
Syntax
F F T M S
Equivalent Softkey: MARKER -? FFT STOP.Prerequisite Commands: FFTAUTO, FFTSNGLS, FFTCONTS.Related Commands: FFI’MM, MKA, MKF.
ExampleOUTPUT 718;"FFTCONTS;" Starts the continuous FITOUTPUT 718;"MKPK HI;" Finds the signal with the highest amplitude (usually the signal
at 0 Hz).OUTPUT 718;"MKPK NH;" Finds the signal with the next highest amplitude (usually the
dominant modulation frequency).OUTPUT 718."FFTMS-", 9 Changes the FFT stop frequerxy to the signal frequency.
DescriptionFFTMS is performed only if the spectrum analyzer is performing a FFT measurement. If amarker is on a signal, FFTMS will move that signal to the right side of the graticule. FFI’MSis useful because moving the signal toward the FFT stop frequency increases the frequencyresolution of the FF”I’ measurement. For best results, the signal of interest should be placedslightly left of the FFI’ stop frequency (the signal should not touch the right side of thegraticule). If the signal is placed at the FFT stop frequency, small variations in acquired datacan cause large changes in the displayed amplitude of the signal which do not reflect the actualsignal amplitude.
Because the FFT stop frequency is limited by sweep time of the spectrum analyzer, it may notbe possible to change the FFT midscreen frequency to the frequency of the FFT marker. Ifthe FFTMS command does not move the signal to the FYI’ stop frequency, you should check ifthe FFT stop frequency is limited by the sweep time range or sweep time increments for yourspectrum analyzer. The FFT stop frequency is related to the sweep time as follows:
FFT stop frequency =400
(Sweep time x 2)
5-170 Programming Commands

FFTOFFFFTOff
FFTOFFFFTOffExits the fast Fourier transform (FFT) measurement and FFl’ settings.
Syntax
F F T O F F
Equivalent Softkey: FFT OFF .Prerequisite Commands: FFTAUTO, FFTSNGLS, FFTCONTS, FFTMKR.Related Commands: FFTMKR, FFI’AUTO, FFTCONTS, FFTSNGLS.
ExampleOUTPUT 718;"FFTCONTS;" Starts the continuous FFTOUTPUT 718;"FFTOFF;" Turns of the FFT
DescriptionThe FFTOFF command aborts any of the FFT functions (FFTAUTO, FFTCONTS, FFTMKR, orFFTSNGLS) and returns the spectrum analyzer display back to normal.
Programming Commands 5-171

FFTPCTAMFFT Percent Amplitude ModulationTurns on or off the percent AM function.
Syntax
0/
'._.__.'
r on 7
1
I
/ XFFTPCTAM
Equivalent Softkey: FFTPCTAM is equivalent to using X AK UI? OFF during an FFTmeasurement.Prerequisite Commands: FFTCONTS, FFI’MKR, FFTSNGLS, FFTAUTO.Related Commands: FFTPCTAMR.
ExampleOUTPUT 718;"FFTCONTS;" Starts the FlTOUTPUT 718;"MOV FFTPCTAM,l;" Turns on the percent AMjimction.
DescriptionThe FFI’PCTAM command turns the percent AM function on or off. The percent AMmodulation is calculated using only the largest single frequency of modulation.
FFTPCTAM can be executed on FFT trace data even if an FFT measurement is not beingperformed, as long as the FFT marker (FFTMKR) is invoked. For example, you can restore thepercent AM readout of a recalled FFl’ trace by executing the FFTMKR command, and then theFFTPCTAM command.
You can execute the FFTPCTAM command two different ways. You can either execute theFFTPCTAM command directly (for example, "FFTPCTAM 1; I’) or use the MOV command to movethe 1 or 0 into the FFTPCTAM command (for example, "MOV FFTPCTAM,l;"). If you use theMOV command, no text is displayed in the active function area during command execution.
Query Response
I-- Off 7
I=0
o u t p u t’ t e r m i n a t i o n +
f -
QFFTPCTAM
5-172 Programming Commands

FFTPCTAMR FFT Percent Amplitude Modulation Readout
FFTPCTAMRFFT Percent Amplitude Modulation ReadoutReturns the percent of amplitude modulation (AM).
Syntax
F F T P C T A M R
XFFTPCTAMR
Prerequisite Commands: FFTCONTS, FFTMKR, FFTSNGLS, FF”IAUT0, FFTPCTAM.Related Commands: FFTPCTAM.
Example
OUTPUT 718;"FFTCONTS;" Starts the FFTOUTPUT 718;"MOV FFTPCTAM,l;" Turns on the percent AMfunction.OUTPUT 718;"FFTPCTAMR?;" Queries the percent AM reading.ENTER 718;Percentam Gets the percent AM reading.
DescriptionFFTPCTAMR returns either a positive real number, a “0,” or a “-1” as follows:
A real number If the a valid signal could be measured, FFTPCTAMR returns a real numberthat represents the percent AM of the FFT signal (the percent AM is calculatedusing only the largest single frequency of modulation).
0 If no modulation was detected, FFIPCTAMR returns a “0.”
- 1 If the FFT input was above the top graticule (clipped), FFTPCTAMR returns aU-1.”
Query Response
% A Mm o d u l a t i o n
/ \o u t p u t
t e r m i n a t i o n +OFFTPCTAMR
Programming Commands 5-173

FFTSNGLSFFT Single SweepChanges the spectrum analyzer’s sweep mode to single sweep mode (if necessary), and thenperforms a fast Fourier transform (FFT) on trace A.
Syntax
Equivalent Softkey: SINGLE FFT .Prerequisite Commands: LN, Sl?Related Commands: FFI’CONTS, FFTOFF
Example
OUTPUT 7 18 . “SP OHZ * ”# Sets the spectrum analyzer to zero span.OUTPUT 7 18 ; “LN ; ” Changes the amplitude scale to linear:OUTPUT 718 ; “FFTSNGLS ; ” Ftyforms the FFi?
DescriptionYou should change the frequency span to 0 Hz and the amplitude scale to linear beforeexecuting FFTSNGLS. How FFTSNGLS performs the FFT depends on the current sweep mode,the trace status of trace A, and if FFTSNGLS is already active.
n If the spectrum analyzer is in the single-sweep mode or trace A is in the view mode whenFFISNGLS is first executed, the spectrum analyzer does an FFT on trace A without updatingthe contents of trace A.
n If the spectrum analyzer is in the continuous-sweep mode when FFTSNGLS is executed, thespectrum analyzer changes to the single sweep mode, and then does an FFT on trace A.
n If the spectrum analyzer is currently performing the FFTSNGLS command, a take sweep isperformed and then an FFI’ is performed on trace A.
FFTSNGLS does the following when performing an FFT:
n If the current detector is the peak detector, the detector is changed to the sample detector.n Places trace A in both the clear-write and store-blank modes. (When the spectrum analyzer is
in both the clear-write and store-blank modes, the trace data is still taken from the spectrumanalyzer input during every measurement sweep, but the trace is not shown on the spectrumanalyzer display.)
n Places the results of the FFT in trace B, and then changes trace B to the view mode.
RestrictionsExecuting FFTSNGLS exits the following functions: windows display mode (WINON), N dBpoint measurement (NDBPNT), gate utility functions (GDRVUTIL), TO1 measurement (TOI),marker table (MKTBL), peak table (PKTBL), percent AM (PCTAM), peak zoom (PKZOOM),power menu measurements (ACP, ACPE, CHP, and OBW), and Analog+ display mode(ANLGPLUS).
You can use the results of the FFTCLIP command to determine if the FFT data is valid.
5.174 Programming Commands

FFTSNGLS FFT Single Sweep
FFTSNGLS uses the following when performing an FFT:
w The flat top filter window. See “FFT” for more information about the flat top filter window.w Trace B and trace C. If you want to save the trace data that is in trace B or trace C, you
should save the trace data before executing FFIAUTO, FFTCONTS, or FFTSNGLS. (See“SAVET” for more information about saving trace data.)
H The FFTMKR command to turn on the FFT markers (you can use the MKA or MKF todetermine the amplitude or frequency of the marker).
You should execute the FFTOFF command when you are finished using the FFT measurement.
Programming Commands 5.175

FFTSTATFFT StatusReturns the status of the spectrum analyzer’s FFT measurement functions.
Syntax
F F T S T A T
Prerequisite Commands: FFI’AUTO, FFTSNGLS, FFTCONTS, FFTMKR.Related Commands: FFTCLIP.
Example
OUTPUT 718*"FFTCONTS*"OUTPUT 718;"FFTSTAT?;"
Starts the FFTQv.wries FF’TSTAII:
ENTER 718;Fftstatus Returns the value of FmSTAT.
DescriptionFFTSTAT returns either a “0,’ a “ 1,” or a “2” as follows:
0 If the spectrum analyzer is not performing an FFI’ measurement, FFTSTAT returns a“0. ”
1 If the spectrum analyzer is performing an FFT measurement, FFI’STAT returns a ” 1. ”
2 If the spectrum analyzer is not performing an FFT measurement but the FFT markersand FFT annotation are on, FFI’STAT returns a “2.”
FFTSTAT returns a “0” if FFTOFF has been executed.
Query Response
,,-.r a c t i v e 7
7(
0o u t p u t
/ ’ t e r m i n a t i o n +
a c t i v e 4
a n n o t a t i o n
5-176 Programming Commands

FFTSTOP FFT Stop Frequency
FFTSTOPFFT Stop FrequencySets the FFI’ stop frequency of the FFT measurement.
Syntax
Item Description/Default R-e
Number Any real or integer number. Default unit is Hz. Range is limited bythe range of thesweep time for the
Prerequisite Commands: FFI’AUTO, FFTSNGLS, FFTCONTS.Related Commands: ST.
ExampleOUTPUT 718 * “FFTCONTS - ”OUTPUT 718; “FFTSTOP ;KHZ; ”
Starts the FFTSets the FlTstopjYequemy to 1 kHz.
DescriptionTo change the FFT stop frequency, FFTSTOP changes the sweep time of the spectrum analyzeras follows:
400FFT stop frequency = (Sweep time x 2j
You can execute the FFTSTOP command two different ways. You can either execute theFFTSTOP command directly (for example, “FFTSTOP 1; ‘I) or use the MOV command to movethe 1 or 0 into the FFTSTOP command (for example, “MOV FFTSTOP, 1; ‘I). If you use the MOVcommand, no text is displayed in the active function area during command execution.
Programming Commands 5-177

FFTSTOP FFT Stop Frequency
Query Response
s t o pf r e q u e n c y
/ \o u t p u t
t e r m i n a t i o n +QFFTSTOP
5-176 Programming Commands
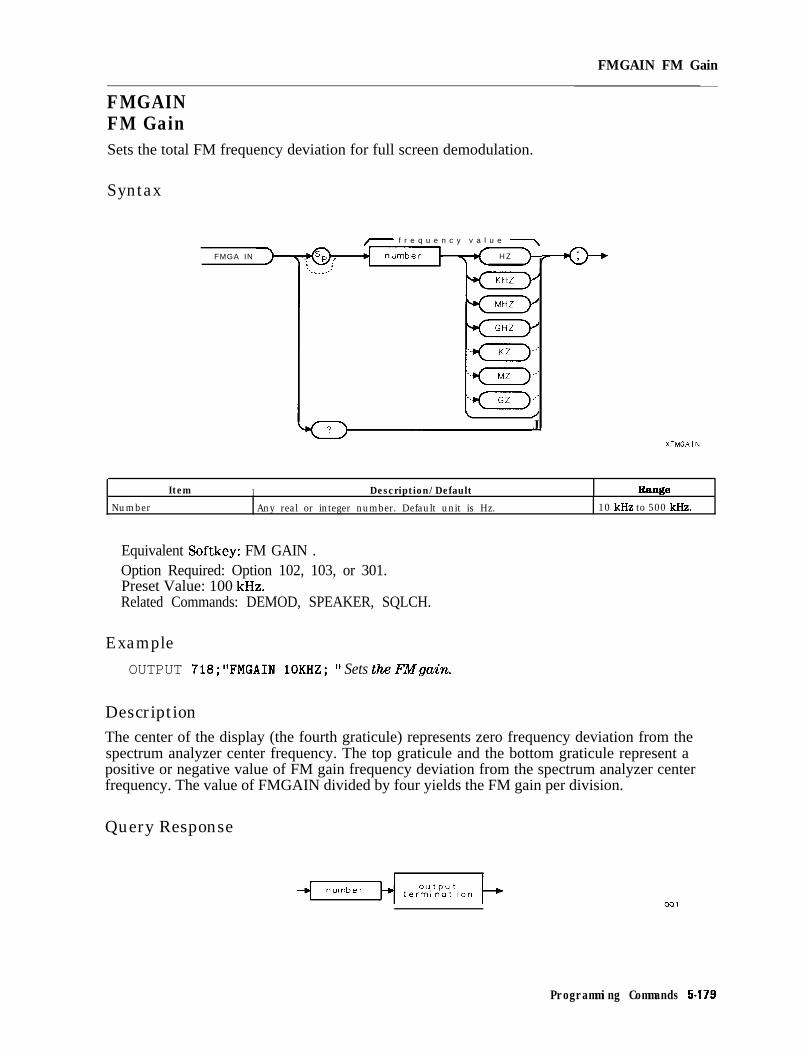
FMGAIN FM Gain
FMGAINFM GainSets the total FM frequency deviation for full screen demodulation.
Syntax
FMGA IN
/ f r e q u e n c y v a l u e \
H Z-...._.: T--*0-+/
I
/
..’
..’
..’
/
JXFMGAlN
Item I Description/Default R=r3e
Number Any real or integer number. Default unit is Hz. 10 kHz to 500 kHz.
Equivalent Softkey: FM GAIN .Option Required: Option 102, 103, or 301.Preset Value: 100 kHz.Related Commands: DEMOD, SPEAKER, SQLCH.
Example
OUTPUT 718;"FMGAIN 10KHZ; ‘I Sets theFMgain.
DescriptionThe center of the display (the fourth graticule) represents zero frequency deviation from thespectrum analyzer center frequency. The top graticule and the bottom graticule represent apositive or negative value of FM gain frequency deviation from the spectrum analyzer centerfrequency. The value of FMGAIN divided by four yields the FM gain per division.
Query Response
Programming Commands 5-179

FOFFSETFrequency OffsetSpecifies the frequency offset for all absolute frequency readouts such as center frequency.
Syntax
F O F F S E T
/ f r e q u e n c y v a l u e \
HZ. . ..._..’
Item Description/Default Range
Number Any real or integer number. Default unit is Hz.
Equivalent Softkey: FREQ OFFSET .Preset State: 0 Hz.Related Commands: CF, FA, FB, MKN,
Example10 OUTPUT 718;"IP;FA 200MZ;"20 OUTPUT 718;"FB 1GZ;"30 OUTPUT 718;"TS;MKPK HI;"40 OUTPUT 718;"MF;"50 ENTER 718;A60 PRINT A70 OUTPUT 718;"FOFFSET 500MZ;"80 OUTPUT 718;"TS;MF;"
90 ENTER 718;A100 PRINT A
110 END
MKF,MKSP, MKSS.
Initializes spectrum analyz4x Sets start frequency.Sets stop freqwncy.Places marker on signal peak.Finds frequency of marker:
Printsfrequency of marker:Adds a frequewy oflset.The frequency of the marker now is the frequency ofthe signal peak plus the frequency offset.
The displayed frequency is 500 MHz greater than thefrequency displayed in line 60.
5-180 Programming Commands
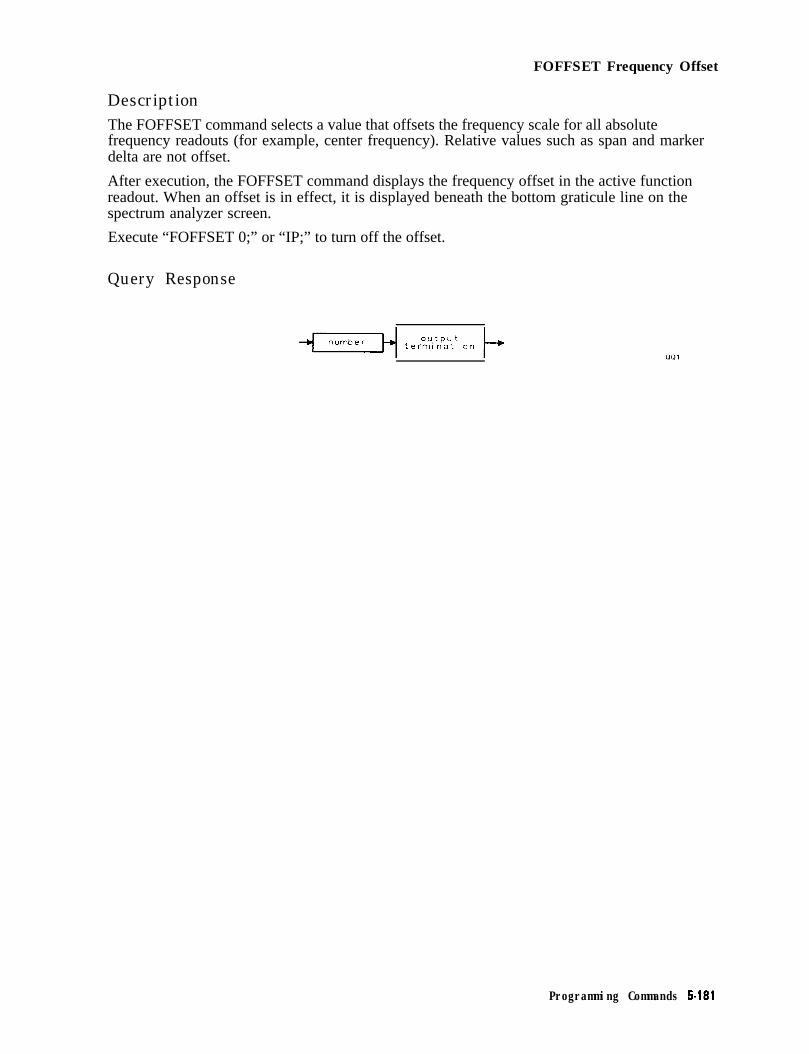
FOFFSET Frequency Offset
DescriptionThe FOFFSET command selects a value that offsets the frequency scale for all absolutefrequency readouts (for example, center frequency). Relative values such as span and markerdelta are not offset.
After execution, the FOFFSET command displays the frequency offset in the active functionreadout. When an offset is in effect, it is displayed beneath the bottom graticule line on thespectrum analyzer screen.
Execute “FOFFSET 0;” or “IP;” to turn off the offset.
Query Response
Programming Commands 5-181

FORMATFormat CardFormats the memory card.
Syntax
/ l a b e l \
i m i t e r c h a r a c t e r
Equivalent Softkey: FORMAT CARD .
XFORMAT
Item
Character
Delimiter
Description/Default Range
Any valid character. 0 to 6 characters long,A through Z and theunderscore (theunderscore cannot bethe Arst character ofthe label).
Matching characters marking the beginning and end of the list of - 1 \ @ = / - $ % ; ! ’ :spectrum analyzer commands. ” &
Option Required: An HP 8590L or HP 8592L needs to have Option 003 installed in thespectrum analyzer to use the FORMAT command.
Example
OUTPUT 718;"FORMAT XMYCARDW l+rwmts a memory card with the label “MYCARD. ”
DescriptionThe memory card if formatted with the LIF format. If a label is not specified, the label defaultsto HP859X.
5-182 Programming Commands

FS Full Span
FSFull SpanSets the frequency span of the spectrum analyzer to full span.
Syntax
Equivalent Softkey: FULL SPAN .Related Commands: CF, FA, FB, HNLOCK, SP, SS.
Example
OUTPUT 7 18 ; “FS ; ” Puts the spectrum analyzer in full-span mode.
DescriptionThe FS command selects both the start frequency and the stop frequency according to thefrequency span of the spectrum analyzer. Resolution bandwidth, video bandwidth, and sweeptime are all set to autocoupled.
Spectrum Analyzer start stopModel Frequency Frequency
HP 8590L or HP 85913 0 Hz 1.8 GHz
HP 8592L* or HP 8593E* 2.750 GHz 22 GHz
HP 85943 0 Hz 2.9 GHz
HP 8595E* 0 Hz 6.5 GHz
HP 85963' 0 12.8 GHz
I *In harmonic unlock. I
In harmonic lock, “FS;” sets both the center frequency and the span according to the harmonicband shown in the following table.
Center Frequency and Span Setting
2HP 8592L, HP 85933, or HP 85963 only.
Programming Commands 5-183
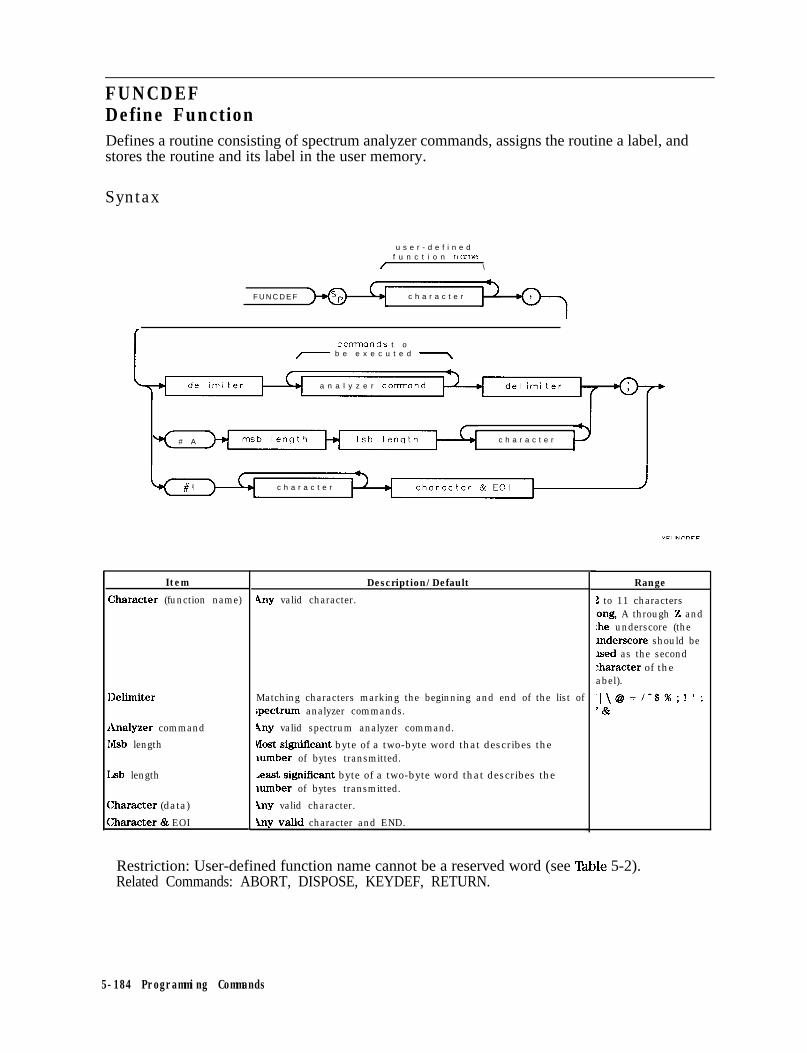
FUNCDEFDefine FunctionDefines a routine consisting of spectrum analyzer commands, assigns the routine a label, andstores the routine and its label in the user memory.
Syntax
u s e r - d e f i n e df u n c t i o n nane
/ \
F U N C D E F c h a r a c t e r
comnonds t o/ b e e x e c u t e d \
a n a l y z e r comnand
< # A c h a r a c t e r
c h a r a c t e r
Item Description/Default
Character (function name) 9ny valid character.
jelimiter
inalyzer command
vlsb length
.sb length
Xaracter (data)
:haracter & EOI
Matching characters marking the beginning and end of the list ofspectrum analyzer commands.
4ny valid spectrum analyzer command.
VIost significant byte of a two-byte word that describes thelumber of bytes transmitted.
.east signlflcant byte of a two-byte word that describes themmber of bytes transmitted.
1ny valid character.
1ny valid character and END.
Range
! to 11 characters.ong, A through Z and;he underscore (theutderscore should beused as the second:haracter of theabel).
‘I\@=/^$%;!‘:‘&
Restriction: User-defined function name cannot be a reserved word (see lkble 5-2).Related Commands: ABORT, DISPOSE, KEYDEF, RETURN.
5-184 Programming Commands

.
FUNCDEF Define Function
ExampleConnect CAL OUT to the spectrum analyzer input.
IO OUTPUT 718;“IP;”20 OUTPUT 718;“VARDEF H-SPAN,O;”
30 OUTPUT 718;“FUNCDEF S,HIFT,O”;
40 OUTPUT 718;“DIV H_SPAN,SP,2;“;50 OUTPUT 718;“ADD CF,CF,H-SPAN;“;60 OUTPUT 718*“@*”70 OUTPUT 718;“KkDEF l,S-HIFT,%SHIFT-UP%;”
80 OUTPUT 718;“CF 300MHZ;”90 OUTPUT 718;“SP IMHZ;“;100 LOCAL 718110 END
Initializes spectrum analyzerD&nes user-o!@ned variable with aninitial value of 0.Creates user-&@u?d jimction, calledSHIFT. Shift divides the span by twoand adds the results to the center fre-quency. The Y@” delimits the [email protected] half of span value into H-SPAN.Adds H-SPAN to Cl?Marks the end of the FUNCDEF declaration.Assigns the function XHIFT to theuser&$ned sojtkey, called SHITl’-UI?Displays the calibrator signal.
Returns control to local mode.
The semicolons at the end of lines 30, 40, and 50 in the example suppress BASIC’s carriagereturn and line feed. Adding the semicolons at the end of the lines of a FUNCDEF declarationsaves memory (because the carriage returns and line feeds are not stored in the FUNCDEF).
DescriptionThe FUNCDEF command can be used to create a user-defined function. Note that auser-defined function does not return a value like functions do in many programminglanguages. ‘lb use the FUNCDEF command, you must specify the function label and the listof commands it executes. Once a user-defined function is created, it is stored in spectrumanalyzer memory. The user-defined function can be executed by invoking the function namewithin the definition of a user-defined softkey, another user-defined function, or a computerprogram. ‘Ib delete the function from spectrum analyzer memory, use the DISPOSE command.(See Chapter 4 for more information about creating and using a FUNCDEF).
The ABORT, IF/THEN/ELSE/ENDIF, REPEAT/UNTIL, or RETURN commands are usefulcommands for altering the user-defined function’s operation.
The following are general rules and limitations of FUNCDEF:
n Do not use existing function names or secondary keywords (reserved words) as labels foruser-defined functions. See %ble 5-2 for a list of reserved words.
w Limit the number of characters (between the delimiters) in the list of spectrum analyzercommands to a maximum of 2047 characters.
w The maximum number of nested FUNCDEF declarations is 40. (Nested FUNCDEFdeclarations is when one FUNCDEF calls another FUNCDEF.) See the programming examplefor the ABORT command for an example of nesting FUNCDEF declarations.
n Avoid using the POWERON LAST, SAVE STATE, and RECALL STATE programming commandswithin the function. These commands save and recall a state that, within auser-definedfunction, may only partially recall the saved state.
Programming Commands 5-l 85

GATEGateTurns on or off the time-gating.
Syntax
G A T E OFF/
ON
KATE
Equivalent Softkey: lGgTE ON OFF .Option Required: Option 105.Preset State: GATE OFF’.Related Commands: GATECTL, GD, GDRVUTIL, GL, GP
ExampleConnect the HI SWEEP IN/OUT connector to the GATE TRIGGER INPUT. Connect the CAL OUTto the spectrum analyzer input.
10 OUTPUT 718."IP-"20 OUTPUT 718;"CF'300MHZ;SP 0HZ;ST 200MS;"
30 OUTPUT 718;"GD 66MS;GL 66M.S;”40 OUTPUT 718;"GATECTL EDGE;"
50 OUTPUT 718."GP POS*"> 9
60 OUTPUT 718;"GATE ON;"70 END
It?rforms an instrument preset.Sets the center frequency, span, andsweep time.Sets the gate delay and gate length.Sets the gate triggering for the edgeof the trigger input signal.Triggers on the positive edge of thetrigger input signal.Turns on the gating.
5-l 88 Programming Commands

GATECTL Gate Control
GATECTLGate ControlSelects between the edge and the level mode for Option 105, the time-gated spectrum analysiscapability.
Syntax
XGATECTL
Equivalent Softkey: GATE CTL EDGE LVL .Option Required: Option 105.Preset State: GATECTL EDGE.Related Commands: GATE, GD, GL, GP.
ExampleOUTPUT 718;“GATECTL LEVEL;”
DescriptionIn the edge mode, a trigger input starts the delay timer that triggers the gate timer. The gatepolarity (GP), gate delay time (GD), and gate time length (GL) are operational in the edge mode,but not in the level mode. In the level mode, the gate follows the trigger input level.
When used as a predefined variable, GATECTL returns a “0” if GATECTL has been set toEDGE, a “ 1 n if GATECTL has been set to LEVEL.
Query Response
o u t p u tt e r m i n a t i o n --)
QCATECTL
Programming Commands 5-187

GCGate PresetPresets Option 105, the time-gated spectrum analysis capability.
Syntax
( GC
XGC
Option Required: Option 105.Related Commands: GATE, GATECTL, GD, GL, GP.
ExampleOUTPUT 718;"GC;"
DescriptionThe GC command sets the following time-gated spectrum analysis functions:
n GATE to OFF.w GATECTL to EDGE.n GP to POS.w The gate delay (GD) and gate length (GL) time values are set to 1 ps.
5-188 Programming Commands

GD Gate Delay
GDGate DelaySets the delay time from when the gate trigger occurs to when the gate opens.
Syntax
c GD
I- t i m e v a l u e -\
\ u s/
‘...._..’
;gY
L /
XGD
Item Description/Default RangeNumber Any real or integer number. Default unit is seconds. 1 ps to 65.5 ms
Equivalent Softkey: GATE DELAY .Option Required: Option 105.Preset State: 1 ps.Related Commands: GATE, GATECTL, GC, GL.
ExampleOUTPUT 718; “GD 1US; ”
DescriptionGD applies only if GATECTL is set to EDGE.
Query Response
QQI
Programming Commands 5-l 88
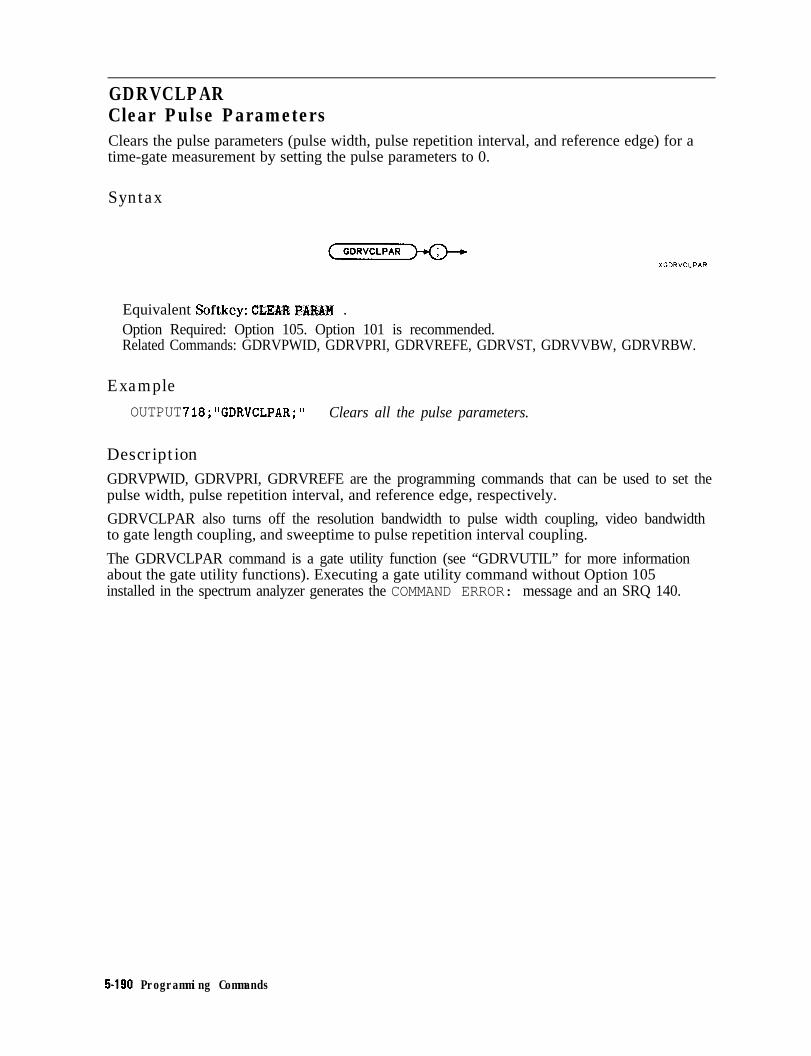
GDRVCLPARClear Pulse ParametersClears the pulse parameters (pulse width, pulse repetition interval, and reference edge) for atime-gate measurement by setting the pulse parameters to 0.
Syntax
XGDRVCLPAR
Equivalent Softkey: CLE&R PARAM .Option Required: Option 105. Option 101 is recommended.Related Commands: GDRVPWID, GDRVPRI, GDRVREFE, GDRVST, GDRVVBW, GDRVRBW.
ExampleOUTPUT 718;"GDRVCLPAR;" Clears all the pulse parameters.
DescriptionGDRVPWID, GDRVPRI, GDRVREFE are the programming commands that can be used to set thepulse width, pulse repetition interval, and reference edge, respectively.
GDRVCLPAR also turns off the resolution bandwidth to pulse width coupling, video bandwidthto gate length coupling, and sweeptime to pulse repetition interval coupling.
The GDRVCLPAR command is a gate utility function (see “GDRVUTIL” for more informationabout the gate utility functions). Executing a gate utility command without Option 105installed in the spectrum analyzer generates the COMMAND ERROR: message and an SRQ 140.
5-180 Programming Commands
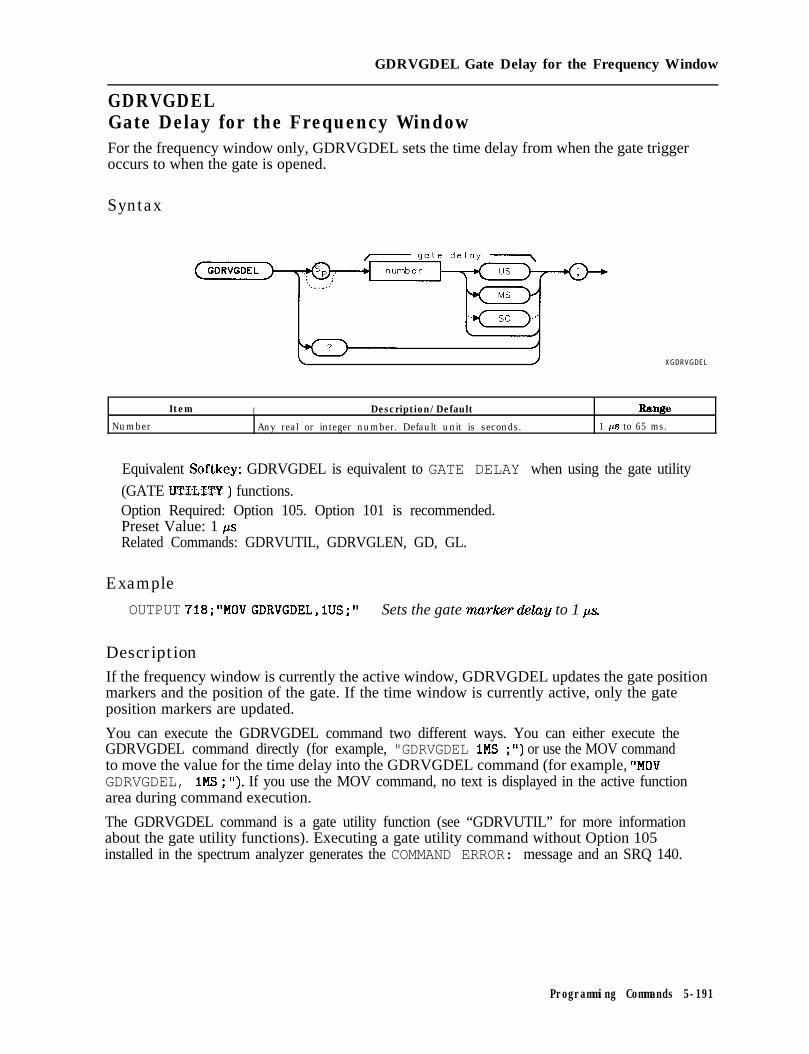
GDRVGDEL Gate Delay for the Frequency Window
GDRVGDELGate Delay for the Frequency WindowFor the frequency window only, GDRVGDEL sets the time delay from when the gate triggeroccurs to when the gate is opened.
Syntax
\ / XGDRVGDEL
Item I Description/Default R=u3e
Number Any real or integer number. Default unit is seconds. 1 ps to 65 ms.
Equivalent Softkey: GDRVGDEL is equivalent to GATE DELAY when using the gate utility
(GATE UTILfTY ) functions.Option Required: Option 105. Option 101 is recommended.Preset Value: 1 psRelated Commands: GDRVUTIL, GDRVGLEN, GD, GL.
Example
OUTPUT 718;"MOV GDRVGDEL,lUS;" Sets the gate marker delay to 1 ps.
DescriptionIf the frequency window is currently the active window, GDRVGDEL updates the gate positionmarkers and the position of the gate. If the time window is currently active, only the gateposition markers are updated.
You can execute the GDRVGDEL command two different ways. You can either execute theGDRVGDEL command directly (for example, "GDRVGDEL IMS ; ‘I) or use the MOV commandto move the value for the time delay into the GDRVGDEL command (for example, “MOVGDRVGDEL, 1MS ; ‘I). If you use the MOV command, no text is displayed in the active functionarea during command execution.
The GDRVGDEL command is a gate utility function (see “GDRVUTIL” for more informationabout the gate utility functions). Executing a gate utility command without Option 105installed in the spectrum analyzer generates the COMMAND ERROR: message and an SRQ 140.
Programming Commands 5-191

GDRVGDEL Gate Delay for the Frequency Window
Query ResponseGDRVGDEL? returns the last value entered for GDRVGDEL. To determine the current gatedelay, query the gate delay (GD) command.
g a t e d e l a y/
o u t p u tt e r m i n a t i o n +
QCDRVGDEL
5-l 92 Programming Commands

GDRVGLEN Gate Length for the Frequency and Time Windows
GDRVGLENGate Length for the Frequency and Time WindowsAdjusts the gate length in both the time and frequency windows.
Syntax
- octe lenath -
Item Description/Default hngeNumber Any real or integer number. Default unit is seconds. 1 ps to 65 ms.
Equivalent Softkey: GDRVGLEN is equivalent to GATE LElWI% when using the gate utility(GATE UTILITY ) functions.Option Required: Option 105. Option 101 is recommended.Preset Value: 1 ps.Related Commands: GDRVUTIL, GDRVGDEL, GD, GL.
Example
OUTPUT 718;"MOV GDRVGLEN,lUS;" Sets the gate marker to a length of 1 ps.
DescriptionYou can execute the GDRVGLEN command two different ways. You can either execute theGDRVGLEN command directly (for example, "GDRVGLEN 1MS ; ‘I) or use the MOV command tomove the value for the gate length delay into the GDRVGLEN command (for example, “MOVGDRVGLEN , 1MS ; ‘I). If you use the MOV command, no text is displayed in the active functionarea during command execution.
The GDRVGLEN command is a gate utility function (see “GDRVUTIL” for more informationabout the gate utility functions). Executing a gate utility command without Option 105installed in the spectrum analyzer generates the COMMAND ERROR: message and an SRQ 140.
Query ResponseGDRVGLEN? returns the last value entered for GDRVGLEN. lb determine the current gatetime length, query the gate length (GL) command.
g a t el e n g t h 7
o u t p u ttermlnotion -
Programming Commands 5-l 93

GDRVGLEN Gate Length for the Frequency and Time Windows
GDRVGTWindow Gate ControlTurns on or off the gate in the frequency window.
Syntax
g a t e
r off 7
GDRVGT 0r
. . ..._..’g a t e o n
/ \
Equivalent Softkey: GDRVGT is equivalent to GATE Ohl OFF when using the gate utility(GATE UTILITY ) functions.Option Required: Option 105. Option 101 is recommended.Related Commands: GDRVUTIL, GATE.
ExampleOUTPUT 718;"MOV GDRVGT,l;" Turns on the gate in thefrequmcu window.
DescriptionBefore executing GDRVGT, you should do the following:
1. Ensure there is a trigger pulse connected to the GATE TRIGGER INPUT connector on therear panel of spectrum analyzer. The gate utility functions do not work if there is not atrigger input.
2. Ensure that the GATE OUTPUT connector and the EXT TRIG INPUT connector areconnected together.
If the time window is the active window, turning on the gate with GDRVGT makes thefrequency window the active window. The GDRVGT command is a gate utility function (see“GDRVUTIL” for more information about the gate utility functions). Executing a gate utilitycommand without Option 105 installed in the spectrum analyzer generates the COMMAND ERROR:message and an SRQ 140.
You can execute the GDRVGT command two different ways. You can either execute theGDRVGT command directly (for example, "GDRVGT 1; I’) or use the MOV command to movethe 1 or 0 into the GDRVGT command (for example, "MOV GDRVGT,l;"). If you use the MOVcommand, no text is displayed in the active function area during command execution.
5-194 Programming Commands

GDRVGT Window Gate Control
Query Response
r off 7 I
7<
0o u t p u t
t e r m i n a t i o n +
Programming Commands 5-l 95

GDRVGTIMGate Trigger to Marker Position for the Time WindowActivates the gate trigger marker, and then places it at the given value in the time window.The trigger marker readout shows the time between the gate trigger edge and the currentmarker position.
Syntax
- m a r k e r p o s i t i o n 7
4US
/.._._..’
2;;
L I
/
XGDRVGTIM
Item Description/Default
Number Any real or integer number. Default unit is seconds.
Equivalent Softkey: GDRVGTIM is similar to TRIG MKR ON OFF .Option Required: Option 105. Option 101 is recommended.Initial Value: 0.Related Commands: GDRVUTIL.
Example
! Range
I 0 to the sum of thesweev time and sweevdelay (GDRVSWDE). -
I
OUTPUT 718;“MOV GDRVGTIM,lOMS;” Places the gate trigger marker 10 ms a&v- the startof the sweep.
DescriptionIf the frequency window is the active window, executing GDRVGTIM makes the time windowthe active window.
Once you enter a value into GDRVGTIM, that value is retained until you change it, or executeDISPOSE ALL. Pressing (-1 or turning the spectrum analyzer off does not change thevalue of GDRVGTIM.
You can execute the GDRVGTIM command two different ways. You can either execute theGDRVGTIM command directly (for example, “GDRVGTIM 1MS ; I’) or use the MOV commandto move the value for the time delay into the GDRVGTIM command (for example, “MOVGDRVGTIM, 1MS ; ‘I). If you use the MOV command, no text is displayed in the active functionarea during command execution.
The GDRVGTIM command is a gate utility function (see “GDRVUTIL” for more informationabout the gate utility functions). Executing a gate utility command without Option 105installed in the spectrum analyzer generates the COMMAND ERROR: message and an SRQ 140.
5-195 Programming Commands

GDRVGTIM Gate Trigger to Marker Position for the Time Window
Query ResponseGDRVGTIM? returns the last value entered for GDRVGTIM. If you want the current value forthe gate trigger marker, make the marker active with MKACTV, and then use MKF?.
m a r k e r
o u t p u tt e r m i n o t i o n --)
Programming Commands 5-l 97

GDRVPRIPulse Repetition IntervalEnters the specified value as the pulse repetition interval.
Syntax
GDRVPR I
pulser e p e t i t i o n i n t e r v a l 7
du sf+
Item Description/Default Range
Number Any real or integer number. Default unit is seconds. Range is from thesweep delay(GDRVSWDE) to thesweep time plus the
GDRVPRI is equivalent to ENTER $31 .Option Required: Option 105. Option 101 is recommended.Initial Value: 0.Related Commands: GDRVCLPAR, GDRVST.
ExampleOUTPUT 718;"MOV GDRVPRI,lMS;" Sets the pulse repetition interval to 1 ms.
DescriptionWhen the pulse repetition interval is entered, the approximate gate trigger position will beindicated on screen by either a “T”for a positive trigger, or a “I” for a negative trigger. UnlikeEhlTER PRI , GDRVPRI does not make the marker function active or display the Pulse Paramsoftkeys.
Once you enter a value into GDRVPRI, that value is retained until you change it, or executeDISPOSE ALL. Pressing (j-1 or turning the spectrum analyzer off does not change thevalue of GDRVPRI.
You can execute the GDRVPRI command two different ways. You can either execute theGDRVPRI command directly (for example, "GDRVPRI 1MS ; I’) or use the MOV command to movethe value for the time delay into the GDRVPRI command (for example, "MOV GDRVPRI , 1MS ; I').If you use the MOV command, no text is displayed in the active function area during commandexecution.
The GDRVPRI command is a gate utility function (see “GDRVUTIL” for more information aboutthe gate utility functions). Executing a gate utility command without Option 105 installed inthe spectrum analyzer generates the COMMAND ERROR: message and an SRQ 140.
5-l 98 Programming Commands

GDRVPRI Pulse Repetition Interval
Query ResponseGDRVPRI returns the current value for the pulse repetition interval.
p u l s e r e p e t i t i o nr i n t e r v a l 7
o u t p u tt e r m i n a t i o n -
Programming Commands 5-l 99

GDRVPWIDPulse WidthEnters the specified value as the pulse width.
Syntax
GDRVPWI D/
.._._.:
Item Description/Default Raw-Number Any real or integer number. Default unit is ps. Range is from the
sweep delay(GDRVSWDE) plus thesweep time to the
Equivalent Softkey: E#m WIDTH .Option Required: Option 105. Option 101 is recommended.Initial Value: 0.Related Commands: GDRVCLPAR, GDRVRBW.
Example
OUTPUT 718;"MOV GDRVPWID,lMS;" Sets the pulse width to 1 ms.
Description
Unlike ElQTER WIDTH , GDRVPWID does not make the marker function active or display the
Pulse Param softkeys.
Once you enter a value into GDRVPWID, that value is retained until you change it, or executeDISPOSE ALL. Pressing CPRESET) or turning the spectrum analyzer off does not change thevalue of GDRVPWID.
You can execute the GDRVPWID command two different ways. You can either execute theGDRVPWID command directly (for example, "GDRVPWID 1MS ; ‘I) or use the MOV commandto move the value for the pulse width into the GDRVPWID command (for example, "MOVGDRVPWID, 1MS; I’). If you use the MOV command, no text is displayed in the active functionarea during command execution.
The GDRVPWID command is a gate utility function (see “GDRVUTIL” for more informationabout the gate utility functions). Executing a gate utility command without Option 105installed in the spectrum analyzer generates the COMMAND ERROR: message and an SRQ 140.
5-200 Programming Commands

GDRVPWID Pulse Width
Query ResponseGDRVPWID returns the current value for the pulse width.
p u l s e/- w i d t h
o u t p u tt e r m i n a t i o n -
Programming Commands 5-201

GDRVRBWCouple Resolution Bandwidth to Pulse WidthCouples or uncouples the resolution bandwidth to the specified pulse width.
Syntax
u n c o u p l e d, \
Equivalent Softkey: CPL RBW OM OFF.Option Required: Option 105. Option 101 is recommended.Preset Value: Uncoupled.Related Commands: GDRVPWID, GDRVVBW, GDRVST.
Example
OUTPUT 718;“MOV GDRVRBW,l;” Couples the resolution bandwidth to the pulse width.
DescriptionBefore coupling the resolution bandwidth to the pulse width, you should enter the pulse widthinto GDRVPWID. Coupling the resolution bandwidth to the pulse width updates the tracedisplay in the active window. If the resolution bandwidth and the pulse width are uncoupled,the setting of the resolution bandwidth does not change.
The resolution bandwidth is at least three times Pu,sekadth when coupled. The resolutionbandwidth is updated to the coupled value when the window is next active.
You can execute the GDRVRBW command two different ways. You can either execute theGDRVRBW command directly (for example, “GDRVRBW 1; I’) or use the MOV command to movethe 1 or 0 into the GDRVRBW command (for example, “MOV GDRVRBW, 1; ‘I). If you use the MOVcommand, no text is displayed in the active function area during command execution.
The GDRVRBW command is a gate utility function (see “GDRVUTIL” for more informationabout the gate utility functions). Executing a gate utility command without Option 105installed in the spectrum analyzer generates the COMMAND ERROR: message and an SRQ 140.
5.202 Programming Commands
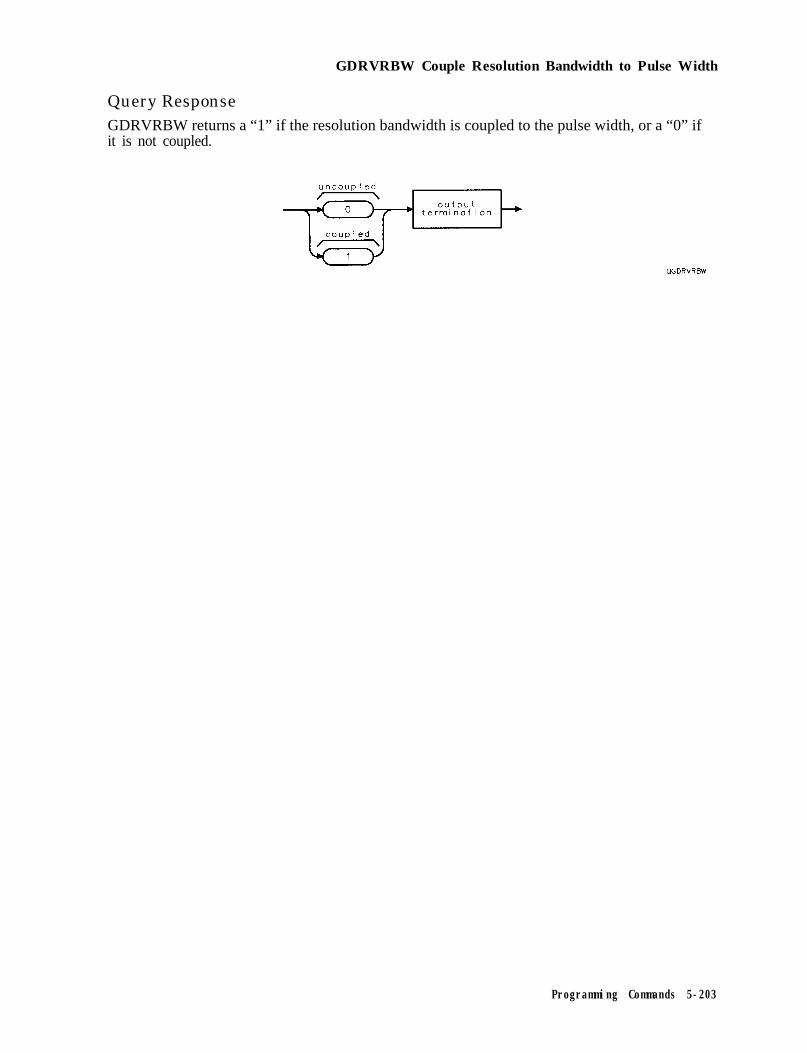
GDRVRBW Couple Resolution Bandwidth to Pulse Width
Query ResponseGDRVRBW returns a “1” if the resolution bandwidth is coupled to the pulse width, or a “0” ifit is not coupled.
OGDRVREW
Programming Commands 5-203
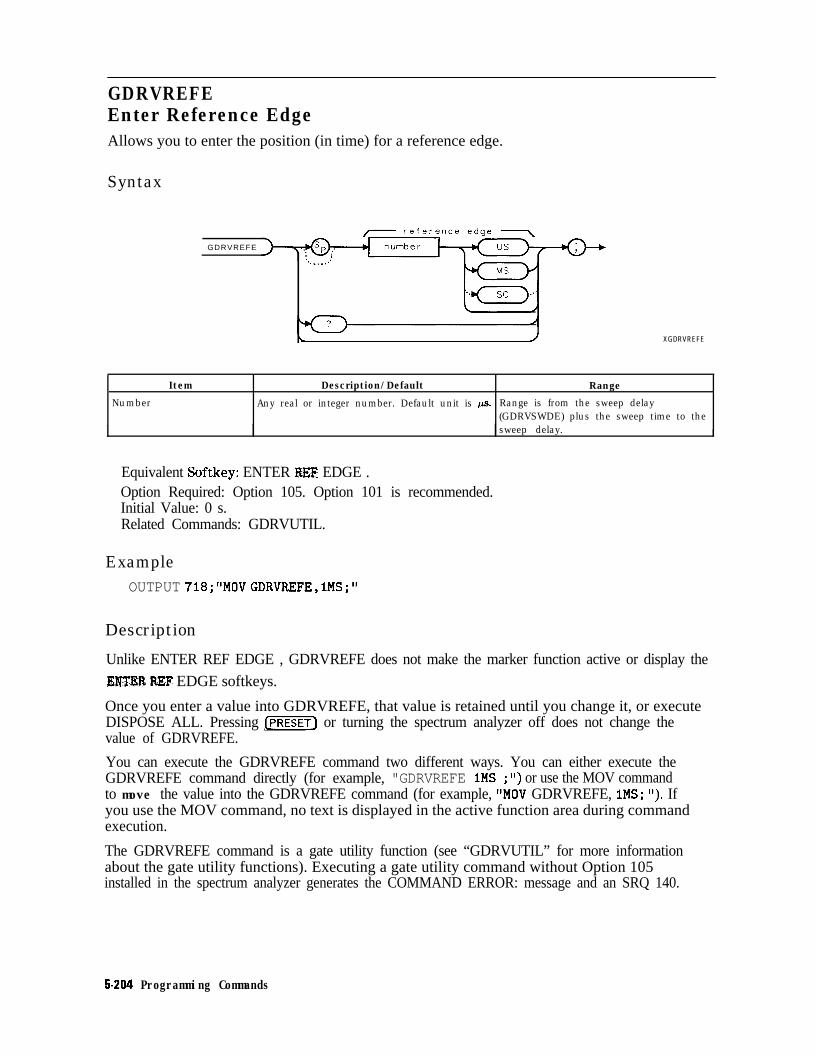
GDRVREFEEnter Reference EdgeAllows you to enter the position (in time) for a reference edge.
Syntax
GDRVREFE
‘._._.’
/ XGDRVREFE
Item Description/Default Range
Number Any real or integer number. Default unit is p.s. Range is from the sweep delay(GDRVSWDE) plus the sweep time to the
I I sweep delay. I
Equivalent Softkey: ENTER REF EDGE .Option Required: Option 105. Option 101 is recommended.Initial Value: 0 s.Related Commands: GDRVUTIL.
ExampleOUTPUT 718;"MOV GDRVREFE,lMS;"
Description
Unlike ENTER REF EDGE , GDRVREFE does not make the marker function active or display the
Enter REF EDGE softkeys.
Once you enter a value into GDRVREFE, that value is retained until you change it, or executeDISPOSE ALL. Pressing @?Z’Z7] or turning the spectrum analyzer off does not change thevalue of GDRVREFE.
You can execute the GDRVREFE command two different ways. You can either execute theGDRVREFE command directly (for example, "GDRVREFE 1MS ; ‘I) or use the MOV commandto move the value into the GDRVREFE command (for example, “MOV GDRVREFE, 1MS; ‘I). Ifyou use the MOV command, no text is displayed in the active function area during commandexecution.
The GDRVREFE command is a gate utility function (see “GDRVUTIL” for more informationabout the gate utility functions). Executing a gate utility command without Option 105installed in the spectrum analyzer generates the COMMAND ERROR: message and an SRQ 140.
5-204 Programming Commands

GDRVREFE Enter Reference Edge
Query Response
r e f e r e n c e
/ edge \o u t p u t
t e r m i n a t i o n +
Programming Commands 5-205

GDRVSTCouple Sweep Time to Pulse Repetition IntervalCouples or uncouples the sweep time to the pulse repetition interval
Syntax
uncoup I e d
.._._..’c o u p l e d
/ \
XGDRVST
Equivalent Softkey: CPL SWP ON OFF.Option Required: Option 105. Option 101 is recommended.Preset Value: Uncoupled.Related Commands: GDRVPRI.
Example
OUTPUT 718;"MOV GDRVST,l;" Couples the sweep time to the pulse repetition interval.
DescriptionBefore coupling the sweep time to the pulse repetition interval, you should enter the pulserepetition interval into GDRVPRI. Coupling the sweep time to the pulse repetition intervalupdates the trace display in the active window. If the sweep time and the pulse repetitioninterval are uncoupled, the setting of the sweep time does not change.
The sweep time is 401 times the pulse repetition interval when coupled. The sweep time isupdated to the coupled value when the window is next active.
You can execute the GDRVST command two different ways. You can either execute theGDRVST command directly (for example, "GDRVST 1; I’) or use the MOV command to movethe 1 or 0 into the GDRVST command (for example, "MOV GDRVST, 1; 'I). If you use the MOVcommand, no text is displayed in the active function area during command execution.
The GDRVST command is a gate utility function (see “GDRVUTIL” for more information aboutthe gate utility functions). Executing a gate utility command without Option 105 installed inthe spectrum analyzer generates the COMMAND ERROR: message and an SRQ 140.
5-206 Programming Commands

GDRVST Couple Sweep Time to Pulse Repetition Interval
Query ResponseGDRVST returns a “1” if the sweep time is coupled to the pulse repetition interval, or a “0” ifit is not coupled.
Programming Commands 5-207

GDRVSWAPUpdate the Time or Frequency WindowMakes the window (either the time or frequency window) that is currently not the activewindow, the active window.
Syntax
Equivalent Softkey: GDRVSWAP is equivalent to UPDATE TIMEFREq , or pressing ml.Option Required: Option 105. Option 101 is recommended.Related Commands: GDRVUTIL.
ExampleOUTPUT 718;"GDRVSWAP;"
DescriptionWhenever the window is made active, the trace and gate position are updated. GDRVSWAPalso couples the resolution bandwidth, video bandwidth, and sweep time to the current pulsewidth and pulse repetition interval values, if the pulse values have been entered and couplingis active. (See “GDRVRBW, ” “ GDRVVBW, ” and “GDRVST” for more information about couplingresolution bandwidth, video bandwidth, and sweep time to the current pulse width and pulserepetition interval.)
The GDRVSWAP command is a gate utility function (see “GDRVUTIL” command for moreinformation about the gate utility functions). Executing a gate utility command without Option105 installed in the spectrum analyzer generates the COMMAND ERROR: message and an SRQ 140.
5-206 Programming Commands

GDRVSWDE Delay Sweep for Time Window
GDRVSWDEDelay Sweep for Time WindowAllows you to specify the delay from the edge of the gate trigger until the sweep is started inthe time window.
Syntax
Item Description/Default R=t3eNumber Any real or integer number. Default unit is second. 1 ps to 65 ms.
Equivalent Softkey: SWEEP DELAY .Option Required: Option 105. Option 101 is recommended.Initial Value: 1 ps.Related Commands: GDRVUTIL, GD.
Example
OUTPUT 718 ; “MOV GDRVSWDE, 1US ; ” Sets the time delay to 1 ps.
DescriptionWhen using GDRVSWDE, the gate zone markers shown in the time window are updated to thevalue of GDRVSWDE.
Once you enter a value into GDRVSWDE, that value is retained until you change it, or executeDISPOSE ALL. Pressing (PRESET] or turning the spectrum analyzer off does not change thevalue of GDRVSWDE.
You can execute the GDRVSWDE command two different ways. You can either execute theGDRVSWDE command directly (for example, “GDRVSWDE 1MS ; I’) or use the MOV commandto move the value for the time delay into the GDRVSWDE command (for example, “MOVGDRVSWDE, 1MS ; ‘I). If you use the MOV command, no text is displayed in the active functionarea during command execution.
The GDRVSWDE command is a gate utility function (see “GDRVUTIL” for more informationabout the gate utility functions). Executing a gate utility command without Option 105installed in the spectrum analyzer generates the COMMAND ERROR: message and an SRQ 140.
Programming Commands 5-209

GDRVSWDE Delay Sweep for Time Window
Query ResponseGDRVSWDE? returns the last value entered into GDRVSWDE. To determine the current valueof the sweep time delay, query the gate delay (GD) command.
o u t p u tt e r m i n a t i o n +
5-210 Programming Commands

GDRVSWP Sweep Time for the Time Window
GDRVSWPSweep Time for the Time WindowSpecifies the sweep time for the time domain window of the gate utility.
Syntax
/- s w e e p t i m e -\
/ XGDRVSWP
I t e m Description/Default Range
Number Any real or integer number. Default unit is second. 0 to 65 ms.
Option Required: Option 105. Option 101 is recommended.Initial Value: 0.Related Commands: GDRVUTIL, ST.
ExampleOUTPUT 718 ; “MOV GDRVSWP, 1MS ; ‘I Sets the time o?ek.zy to 1 rns.
DescriptionThe positions of the gate markers and the gate trigger markers are updated to the new value ofthe sweep time.
Once you enter a value into GDRVSWP, that value is retained until you change it, or executeDISPOSE ALL. Pressing CM] or turning the spectrum analyzer off does not change thevalue of GDRVSWP
You can execute the GDRVSWP command two different ways. You can either execute theGDRVSWP command directly (for example, “GDRVSWP 1MS ; ‘I) or use the MOV commandto move the value for the sweep time into the GDRVSWP command (for example, “MOVGDRVSWP , 1MS ; ‘I). If you use the MOV command, no text is displayed in the active function areaduring command execution.
The GDRVSWP command is a gate utility function (see “GDRVUTIL” for more informationabout the gate utility functions). Executing a gate utility command without Option 105installed in the spectrum analyzer generates the COMMAND ERROR: message and an SRQ 140.
Programming Commands 5-211

GDRVSWP Sweep Time for the Time Window
Query ResponseGDRVSWP? returns the last value entered into GDRVSWP To determine the current value ofthe sweep time in the time window, query the sweep time (ST).
s w e e p t i m e/ \
o u t p u tt e r m i n a t i o n +
5-212 Programming Commands

GDRVUTIL Gate Utility
GDRVUTILGate UtilityTurns on or off the gate utility.
Syntax
u t i l i t y
r Off 7
0/
..___...u t i l i t y
/- on 7
Equivalent Softkey: GATE UTILITY .Option Required: Option 105. Option 101 is recommended.
ExampleOUTPUT 718;"MOV GDRVUTIL,l;" Turns on the gate utility.
DescriptionWhen the gate utility is turned on, the spectrum analyzer screen displays two windows. Theupper window displays the input signal in the time domain, and the lower window displays theinput signal in the frequency domain. If the spectrum analyzer is in zero span when the gateutility is turned on, the frequency span of the lower window will be set to a nonzero frequencyspan.
Before executing GDRVUTIL, you should do the following:
1. Ensure there is a trigger pulse connected to the GATE TRIGGER INPUT connector on therear panel of spectrum analyzer. The gate utility functions do not work if there is not atrigger input.
2. Ensure that the GATE OUTPUT connector and the EXT TRIG INPUT connector areconnected together.
3. Set the center frequency of the analyzer to the signal’s center frequency.
4. Set the reference level of the analyzer so that the signal’s peak is within the first graticule.
The spectrum analyzer cannot turn on the gate utility if the spectrum analyzer is not properlytriggered. Once the gate utility has been turned on, you can use the commands that beginwith “GDRV” to make the time-gate measurement. Executing a gate utility command withoutOption 105 installed in the spectrum analyzer generates the COMMAND ERROR: message and anSRQ 140.
Programming Commands 5-213

GDRVUTIL Gate Utility
RestrictionsExecuting GDRVUTIL exits the following functions: windows display mode (WINON), NdB point measurement (NDBPNT), the FFT menu measurements (FFTAUTO, FFTCONTS,FFISNGLS), TO1 measurement (TOI), marker table (MKTBL), peak table (PKTBL), percent AM(PCTAM), peak zoom (PKZOOM), or power menu measurements (ACP, ACPE, CHP, and OBW).
You should turn off the gate utility (set GDRVUTIL to 0) when you are done with the gateutilities.
Query Response
r off 7
1”
0 o u t p u t
f
l t e r m i n a t i o n +
QGDRVUT I L
5-214 Programming Commands

GDRVVBW Couple Video Bandwidth to Gate Length
GDRVVBWCouple Video Bandwidth to Gate LengthCouples or uncouples the video bandwidth to the gate length.
Syntax
XGDRVVBW
Equivalent Softkey: CPL VBU ON OFF.Option Required: Option 105. Option 101 is recommended.Preset Value: Uncoupled.Related Commands: GDRVGLEN.
ExampleOUTPUT 718;"MOV GDRVVBW,l;" Couples the video bandwidth to the gate length.
DescriptionBefore coupling the video bandwidth to the gate length, you should enter the gate length intoGDRVGLEN. Coupling the video bandwidth to the gate length updates the trace display in theactive window. If the video bandwidth and the gate length is uncoupled, the setting of thevideo bandwidth does not change.
The video bandwidth is at least equal to the inverse of the gate length when coupled. Thevideo bandwidth is updated to the coupled value when the window is next active.
You can execute the GDRVVBW command two different ways. You can either execute theGDRVVBW command directly (for example, "GDRVVBW 1; ‘I) or use the MOV command to movethe 1 or 0 into the GDRVVBW command (for example, "MOV GDRVVBW, 1; 'I). If you use the MOVcommand, no text is displayed in the active function area during command execution.
The GDRVVBW command is a gate utility function (see “GDRVUTIL” for more informationabout the gate utility functions). Executing a gate utility command without Option 105installed in the spectrum analyzer generates the COMMAND ERROR: message and an SRQ 140.
Programming Commands 5-215

GDRVVBW Couple Video Bandwidth to Gate Length
Query ResponseGDRVVBW returns a “1” if the resolution bandwidth is coupled to the pulse width, or a “0” ifit is not coupled.
QGDRVVBW
5-216 Programming Commands

GETPLOT Get Plot
GETPLOTGet PlotInitiates output of the spectrum analyzer display to the active plotter port. GETPLOT is meantto be used within a downloadable program.
Syntax
XGETPLOT
Item Description/DefaultNumber Any real or integer number.
R=u3eNumber withinthe plotter
Related Commands: FUNCDEF, GETPRNT, SNGLS, TS, PLTPRT.Restrictions: Not available with Analog+ display mode. See “ANLGPLUS” for moreinformation.
Example for the HP-IB InterfaceThis example illustrates how you can use a softkey to plot the spectrum analyzer display, andthen have the plotter perform a page feed. (Not all plotters support the page feed command,however.) This example assumes that the plotter is at address 5 and the spectrum analyzer is ataddress 18. (This example is only valid for HP 9000 series 200 and 300 computers.)
OUTPUT 718;"FUNCDEF P-LOT,%";
OUTPUT 718."GETPLOT*"-, , #
OUTPUT 718;"OUTPUT 5,B,80;";
OUTPUT 718;"OUTPUT 5,B,71;";
OUTPUT 718;"OUTPUT 5,B,59;";
OUTPUT 718;"%;"OUTPUT 718;"KEYDEF l,P-LOT,%PLOT PGIFEED %; ”
Creates a user-o!@nedjimction calledP-LOT.P-LOTperforms the GETPLOTcom-mand to plot the spectrum anu-ly.247.r screen.P-LOT then sends the ASCII codefor “P” to the plotter:P-LOT then sends the ASCII codefor “G” to the plotterP-LOT then sends the ASCII codefor a semicolon to the plotter:Ends the FUNCDEF declaration.Assigns P-LOT to soflkey number1. SojZkey number 1 can be ac-cessed bypressingC~EAS/USER), User ?ktntzrs.
LOCAL 718
Programming Commands 5-217

GETPLOT Get Plot
DescriptionThe GETPLOT command transfers the trace data, graticule, and annotation of the spectrumanalyzer screen to a plotter via the spectrum analyzer interface (softkey labels excluded). Thedata is transferred in ASCII, HPGL format.
Before executing the downloadable program that contains GETPLOT, you should do one of thefollowing:
n Disconnect the computer from the spectrum analyzer.
Or,
n Send the following BASIC commands:ABORT 7LOCAL 7
ABORT 7 instructs the computer to release control of the HP-IB, and LOCAL 7 allows you tocontrol the spectrum analyzer from the front panel.
When using the PLOT command, the scaling points (Plx, Ply; P2x, P2y) can be specified.These scaling points specify the (x,y) coordinates, which determine the size of the plot.(Plx,Ply) refers to the lower-left plotter coordinates. (P2x,P2y) refers to the upper-rightplotter coordinates.
Note The HP 7470A plotter does not support 2 plots per page. If you use anHP 7470A plotter with an HP 8590 Series spectrum analyzer, you can select oneplot per page or four plots per page but not 2 plots per page.
5-218 Programming Commands

GETPRNT Get Print
GETPRNTGet PrintInitiates output of the spectrum analyzer display to a printer. GETPRNT is meant to be usedwithin a downloadable program.
Syntax
( G E T P R N T -kI
/
I
/
/
I
I
/
*
. ...-’
r BW 7C D -
/ color ,
-
LQ570SM
e
LQ570LG
s
DJCOLOR
D
D J540CLR
-a--+
cu126e
Programming Commands 5-21 g

GETPRNT Get Print
Related Commands: FUNCDEF, GETPLOT, PRNPRT.
Example for the HP-IB InterfaceThis example illustrates how you can use a softkey to print the spectrum analyzer display, andthen have the printer perform a page feed. This example assumes that the printer is at address1 and the spectrum analyzer is at address 18. (This example is only valid for HP 9000 series 200and 300 computers.)
OUTPUT 718;"FUNCDEF P,RINT,%";
OUTPUT 718;"GETPRNT;";
Creates a user-&fined fan&ioncalled PJLWTPXINT performs the GEI’PRNTcommand to print the spectrumanalger screen.P-RINT then sends the ASCII codefor a carriage return to the printerPJINT then sends the ASCII codefor a line feed to the printer:PXINT then sends the ASCII codefor a form feed to the printer:Ends the FUNCDEF declaration.Assigns PJLWT to soflkep num-ber 2. Sojtkep number 2 can beaccessed bg pressing CMEASIUSER),
User Meltus.Allows you to control the spec-trum analyzerfrom thefront panel.
OUTPUT 718;"OUTPUT l,B,lO;";
OUTPUT 718;"OUTPUT l,B,l3;";
OUTPUT 718;"OUTPUT l,B,l2;";
OUTPUT 718;"%;"OUTPUT 718;"KEYDEF 2,P,RINT,%PRINTIFRM FEED%;"
LOCAL 718
DescriptionThe data is output in HP raster graphics format. Executing “GETPRNT;“, “GETPRNT O;“, or“GETPRNT BW;” produces a monochrome printout. Executing “GETPRNT 1;” and “GETPRNTCOLOR;” produces a “color format” output for an HP PaintJet printer. Execute “MENU 0;”before printing to blank the softkeys.
Before executing the downloadable program that contains GETPRNT, you should do one of thefollowing:
n Disconnect the computer from the spectrum analyzer.
n Send the following BASIC commands:ABORT7LOCAL7
ABORT 7 instructs the computer to release control of the HP-IB, and LOCAL 7 allows you tocontrol the spectrum analyzer from the front panel.
5-220 Programming Commands
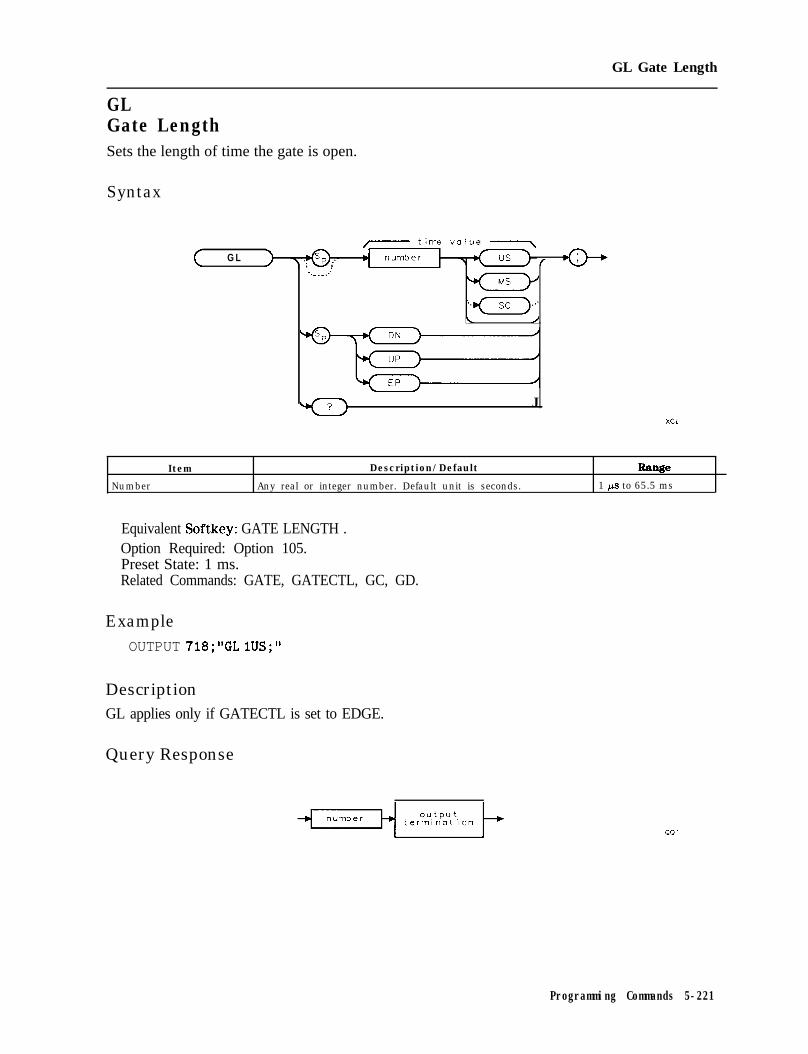
GL Gate Length
GLGate LengthSets the length of time the gate is open.
Syntax
( GL /. . ..._..’24;L /
JXGL
Item Description/Default Range
Number Any real or integer number. Default unit is seconds. 1 ps to 65.5 ms
Equivalent Softkey: GATE LENGTH .Option Required: Option 105.Preset State: 1 ms.Related Commands: GATE, GATECTL, GC, GD.
ExampleOUTPUT 718;"GL IUS;"
DescriptionGL applies only if GATECTL is set to EDGE.
Query Response
Programming Commands 5-221

GPGate PolaritySets the polarity (positive or negative) for the gate trigger.
Syntax
XGP
Equivalent Softkey: EDGE POL POS NEG.Option Required: Option 105.Preset State: GP POS.Related Commands: GATE, GATECTL, GD, GL.
ExampleOUTPUT 718;"GP POS;"
DescriptionGP applies only if GATECTL is set to EDGE.
When used as a predefined variable, GP returns a “0” if GP has been set to NEG, a “1” if GPhas been set to POS.
Query Response
o u t p u tb t e r m i n a t i o n --)
QGP
5-222 Programming Commands

GR Graph
GRGraphGraphs the given 9 coordinate while incrementing the x coordinate by 1.
Syntax
c GRXGR
Item Description/Default Range
Number Any valid integer. -22 to 233.
Related Commands: CLRDSP, DA.
ExampleThis example graphs a diagonal line on the spectrum analyzer display.
OUTPUT 718;"BLANK TRA;"OUTPUT 718;"PU;PA 0,O;GR;" Rxitions thepen.FOR I = 0 TO 400 I represents the Y value in graticule coordinates.OUTPUT 718;I DIV 2 Graphs the Y values, incrementing the X value by 1.NEXT I
DescriptionThe GR command plots a graph at the amplitude point indicated by the next y coordinate. The3 coordinates are specified in display units, with -22 at the bottom of the spectrum analyzerdisplay and 233 at the top of the spectrum analyzer display. See “PA” for more informationabout display units. The x coordinate is always incremented by 1; it cannot be decremented.
The GR command also places the graph in the display list. See “DA” for more informationabout the display list.
Programming Commands 5-223
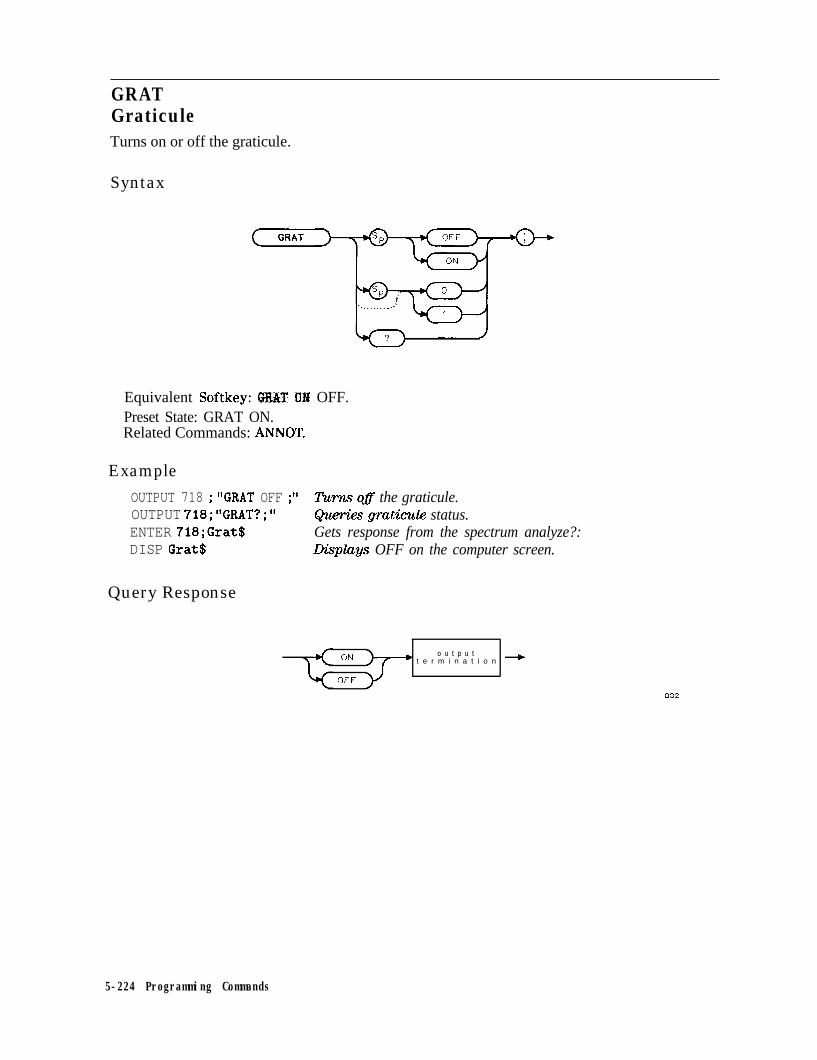
GRATGraticuleTurns on or off the graticule.
Syntax
Equivalent Softkey: GRIT OEf OFF.Preset State: GRAT ON.Related Commands: ANNOT.
Example
OUTPUT 718 ; "GRAT OFF ; ” lWn.s ofl the graticule.OUTPUT 718;"GRAT?;" Qu.tkes graticub status.ENTER 718;Grat$ Gets response from the spectrum analyze?:DISP Grat$ Risplays OFF on the computer screen.
Query Response
ON o u t p u tb t e r m i n a t i o n --)
OFF
002
5-224 Programming Commands

HAVE Have
HAVEHaveReturns a “0” if the specified option or device is not installed.
Syntax
cu 125e
ExampleOUTPUT 718; “HAVE HPIB; ” Queries whether Option 041 is installed.ENTER 718;A Recm~ves response from spectrum analyzerDISP A Disph ys response.
Programming Commands 5-225
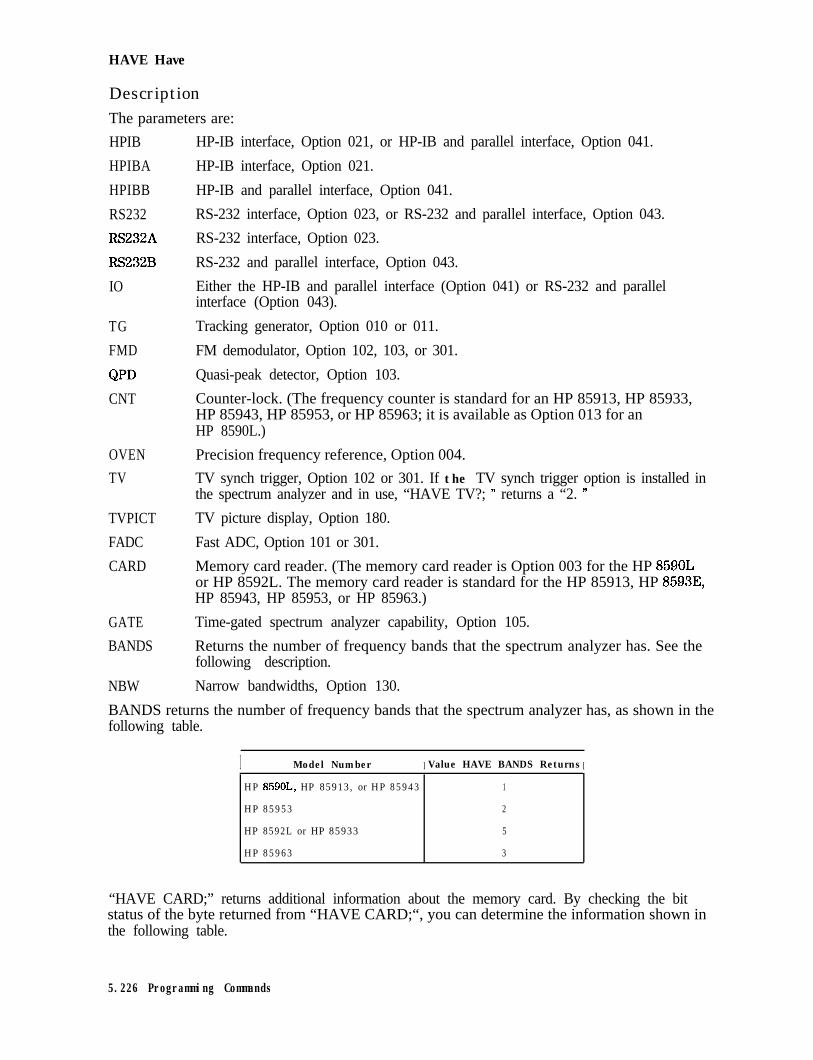
HAVE Have
DescriptionThe parameters are:
HPIB
HPIBA
HPIBB
RS232
RS232A
RS232B
IO
TG
FMD
QPDCNT
OVEN
TV
TVPICT
FADC
CARD
GATE
BANDS
NBW
HP-IB interface, Option 021, or HP-IB and parallel interface, Option 041.
HP-IB interface, Option 021.
HP-IB and parallel interface, Option 041.
RS-232 interface, Option 023, or RS-232 and parallel interface, Option 043.
RS-232 interface, Option 023.
RS-232 and parallel interface, Option 043.
Either the HP-IB and parallel interface (Option 041) or RS-232 and parallelinterface (Option 043).
Tracking generator, Option 010 or 011.
FM demodulator, Option 102, 103, or 301.
Quasi-peak detector, Option 103.
Counter-lock. (The frequency counter is standard for an HP 85913, HP 85933,HP 85943, HP 85953, or HP 85963; it is available as Option 013 for anHP 8590L.)
Precision frequency reference, Option 004.
TV synch trigger, Option 102 or 301. If the TV synch trigger option is installed inthe spectrum analyzer and in use, “HAVE TV?; ” returns a “2. ”
TV picture display, Option 180.
Fast ADC, Option 101 or 301.
Memory card reader. (The memory card reader is Option 003 for the HP 85901,or HP 8592L. The memory card reader is standard for the HP 85913, HP 8593E,HP 85943, HP 85953, or HP 85963.)
Time-gated spectrum analyzer capability, Option 105.
Returns the number of frequency bands that the spectrum analyzer has. See thefollowing description.
Narrow bandwidths, Option 130.
BANDS returns the number of frequency bands that the spectrum analyzer has, as shown in thefollowing table.
I Model Number I Value HAVE BANDS Returns I
HP 859OL, HP 85913, or HP 85943 1
HP 85953 2
HP 8592L or HP 85933 5
HP 85963 3
“HAVE CARD;” returns additional information about the memory card. By checking the bitstatus of the byte returned from “HAVE CARD;“, you can determine the information shown inthe following table.
5.226 Programming Commands

HAVE Have
BitPosition
Bit Status = 0 Bit Status = 1
0 Memory card reader is not installed. Memory card reader is installed.
1 Memory card is write protected. Memory card is not write protected.
2 Memory card is a random access card Memory card is a read only memory(RAM). card (ROM).
I 3 Memory card not inserted into memoryIMemory card is inserted into memory
card reader. card reader.
You can use the BIT or BITF command to determine the status of the bits. For example,
OUTPUT 718;"VARDEF R-ESULT,O;" Stores the bit status in R-ESULTOUTPUT 718;"BIT R,ESULT,HAVE CARD,S;" Checks the status of bit 3.OUTPUT 718;"R,ESULT?;" Gets the result.ENTER 718;ADISP A Displays the bit status of bit 3.
Programming Commands 5-227
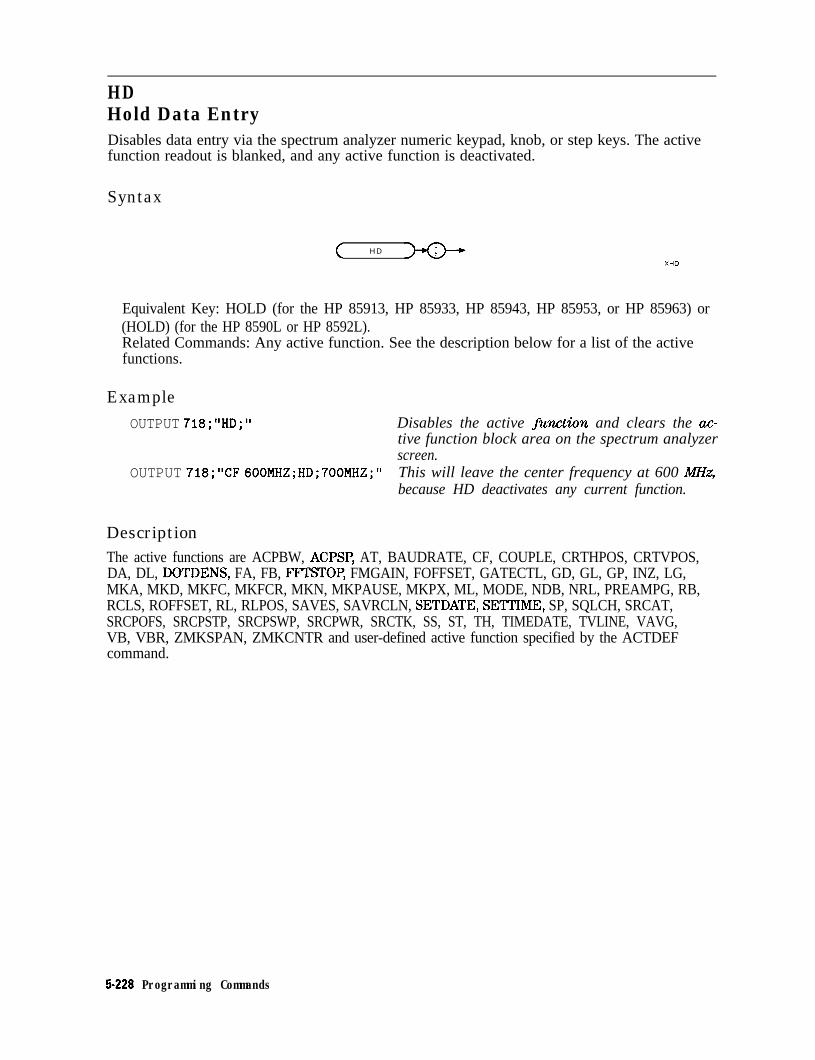
HDHold Data EntryDisables data entry via the spectrum analyzer numeric keypad, knob, or step keys. The activefunction readout is blanked, and any active function is deactivated.
Syntax
( H D
XHD
Equivalent Key: HOLD (for the HP 85913, HP 85933, HP 85943, HP 85953, or HP 85963) or(HOLD) (for the HP 8590L or HP 8592L).Related Commands: Any active function. See the description below for a list of the activefunctions.
Example
OUTPUT 718;"HD;" Disables the active jbaction and clears the ac-tive function block area on the spectrum analyzerscreen.
OUTPUT 718;"CF 600MHZ;HD;700MHZ;" This will leave the center frequency at 600 MHZ,because HD deactivates any current function.
DescriptionThe active functions are ACPBW, ACPSP, AT, BAUDRATE, CF, COUPLE, CRTHPOS, CRTVPOS,DA, DL, DOTDENS, FA, FB, FFTSTOP, FMGAIN, FOFFSET, GATECTL, GD, GL, GP, INZ, LG,MKA, MKD, MKFC, MKFCR, MKN, MKPAUSE, MKPX, ML, MODE, NDB, NRL, PREAMPG, RB,RCLS, ROFFSET, RL, RLPOS, SAVES, SAVRCLN, SETDATE, SETTIME, SP, SQLCH, SRCAT,SRCPOFS, SRCPSTP, SRCPSWP, SRCPWR, SRCTK, SS, ST, TH, TIMEDATE, TVLINE, VAVG,VB, VBR, ZMKSPAN, ZMKCNTR and user-defined active function specified by the ACTDEFcommand.
5-226 Programming Commands

HN Harmonic Number
HNHarmonic NumberReturns the harmonic number of the current harmonic band in which the spectrum analyzer istuning.
Syntax
c
PreZefinedf u n c t i o n p a t h o n l y
XHN
Model Required: HP 8592L, HP 85933, HP 85953, or HP 85963.Related Commands: FS, HNLOCK, HNUNLK.
ExampleOUTPUT 718*"HN'*"ENTER 718;kmb;;
Queries harmonic band of spectrum analyzer:Gets response from the spectrum analyzer
DISP Number Displays the result on computer screen.
Query ResponseThe HN command returns the number of the harmonic band, if the spectrum analyzer issweeping single-band. A “-1” is returned if the spectrum analyzer is sweeping multiband.
Programming Commands 5.229

HNLOCKHarmonic Number LockForces the spectrum analyzer to use only the selected harmonic band.
Syntax
s e l e c t e d
Item Description/Default Range
Number Any valid integer number. 0 to 4 (for HP 8592L, HP 85933, or HP 8596E), 0to 3 (HP 85963 only), 0 to 1 (for HP 8595E).
Equivalent Softkey: The HNLOCK command and the softkeys under the Band Luck menuare identical.Model Required: HP 8592L, HP 85933, HP 85953, or HP 85963.Preset State: HNLOCK OFFRelated Commands: CF, FA, FB, FOFFSET, HN, HNUNLK, SNGLS, SP
ExampleINPUT "SELECT THE DESIRED FRECjUENCY BAND",Harm Gets harmonicbandfromusexOUTPUT 718;"HNLOCK ";Harm;";" Loch harmonic band.
DescriptionHNLOCK ON locks onto the harmonic band that is appropriate for the current centerfrequency, lowering the span, if necessary, due to the limits of the harmonic band.
HNLOCK <number>, where <number> is an integer, locks onto harmonic band <number> andautomatically selects the settings shown in the following table.
RemoteCommands
HNLOCK 0
HNLOCK 1
HNLOCK 2
HNLOCK 3
HNLOCK 4
T1Equivalent Frequent ySoftkey Settings
BAND 0 Center frequency 1.450 GHz
BAND 1 Center frequency 4.638 GHz
BAND 2 Center frequency 9.400 GHz
BAND 3 Center frequency 15.90 GHz
BAND 4 Center frequency 20.55 GHz
1Span 2.900 GHz
Span 3.600 GHz
Span 6.800 GHz
Span 7.000 GHz
Span 2.900 GHz
5-230 Programming Commands
HNLOCK Harmonic Number Lock
Once HNLOCK is set, only frequencies and spans that fall within the frequency band of thecurrent harmonic may be entered. The span is reduced automatically to accommodate a centerfrequency specified near the end of the band range.
Note Before changing the frequency range to another harmonic, unlock the bandwith the harmonic unlock command, “HNLOCK OFF;” or “HNUNLK; “.
BAND LOCK ON (HNLOCK ON)
Start FrequencyIf a start frequency is entered that is outside of the current band boundaries, it will be setto the nearest band edge instead. If a start frequency that is greater than the current stopfrequency is entered, the (possibly modified) start frequency is used for both the start and thestop frequency; therefore, the span will be set to zero. If the start and stop frequencies specifytoo large a span, they will be modified. (Also see “FA.“)
Stop FrequencyIf a stop frequency is entered that is outside of the current band boundaries, it will be set tothe nearest band edge instead. If a stop frequency that is less than the current start frequencyis entered, the (possibly modified) stop frequency will be used for both the start and stopfrequency; therefore, the span will be set to zero. (Also see “FB.“)
Center FrequencyThe span will be modified if necessary to get the center frequency specified without crossingthe band edges. (Also see “CF.“)
SpanThe span will be limited as necessary to keep the start and stop frequencies within the bandedges without changing the center frequency. The maximum span allowed is 2.943 GHz in band0, 3.600 GHz in band 1, 6.957 GHz in band 2, and 7 GHz in higher bands. (Also see “SP.“)
BAND LOCK OFF (HNLOCK OFF)The start and stop frequencies are bounded by the range of the instrument.
The frequency not specified will be bounded by the following scheme:
Continuous Sweep Mode: If the specified frequency is in band 0, the values will be containedby the bounds of band 0. If the value is in the harmonic band range, the values willbe bounded by the top of the instrument range and the lower end of band 1. (Also see“CONTS. “)
Single Sweep Mode: The values are bounded by the instrument range only; therefore, band 0can be included in a multiband sweep in single mode. (Also see “SNGLS.“)
Programming Commands 5-231
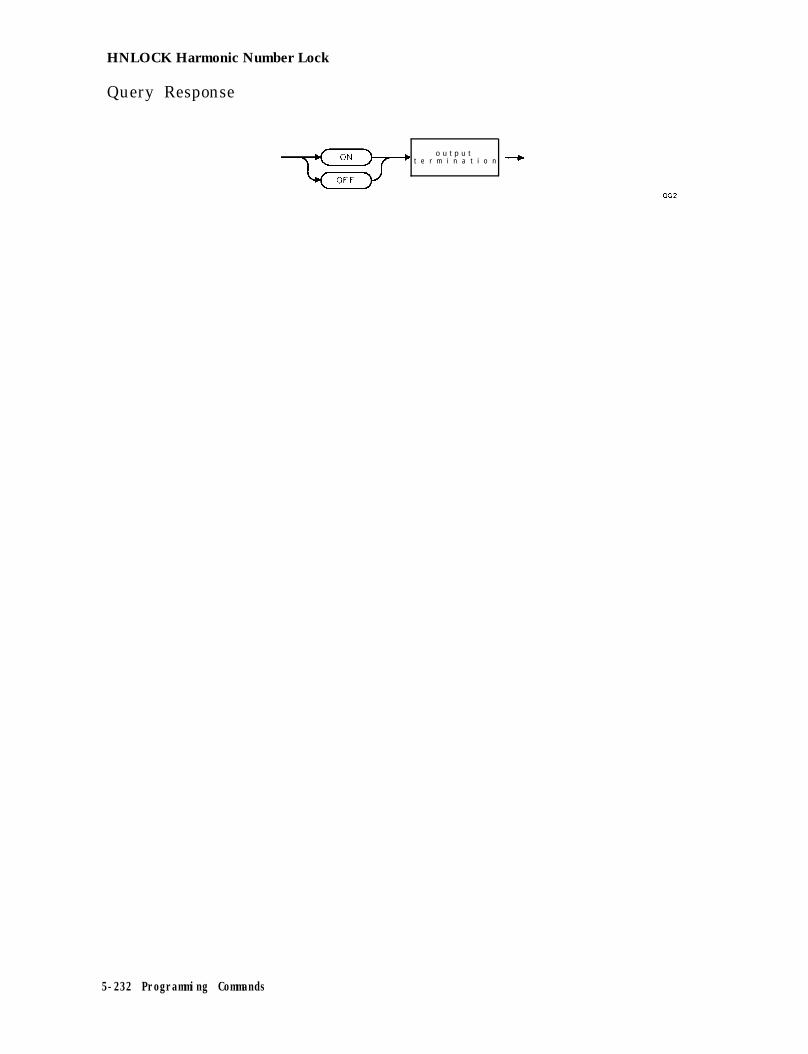
HNLOCK Harmonic Number Lock
Query Response
o u t p u t’ t e r m i n a t i o n --)
a02
5-232 Programming Commands

HNUNLK Unlock Harmonic Number
HNUNLKUnlock Harmonic NumberUnlocks the harmonic band.
Syntax
H N U N L K
XHNVNLK
Equivalent Softkey: HNUNLK is equivalent to HNLOCK OFF and BIJD LDCK ON OFF (OFF isunderlined).Model Required: HP 8592L, HP 85933, HP 85953, or HP 85963.Related Commands: CF, FA, FB, FOFFSET, FS, HN, HNLOCK, SP.
ExampleOUTPUT 718;"HNUNLK;"
DescriptionThe HNUNLK command allows you to select frequencies and spans outside the range of a singleharmonic band.
Programming Commands 5-233

IBInput BProvides a method for putting values into trace B. The spectrum analyzer expects 401 two-byteintegers. The data values can represent the range of integer numbers.
Syntax
Item Description/Default Range
Data byte &bit byte containing numeric or character data.
Example10 ASSIGN @a TO 718;FORMAT ON20 ASSIGN BSa-bin TO 718;FORMAT OFF30 INTEGER Binary(l:401)40 OUTPUT (PSa;"CF 300MZ;CLRW TRB;BLANK TRA;SP1OMZ;SNGLS;TS;"50 OUTPUT QISa;"TDF B;MDS W;TB;"60 ENTER QSa-bin;Binary(*)70 OUTPUT @Sa;"CF 1OOMZ;RB 30KZ;SP 1MZ;TS;"80 DISP "PRESS CONTINUE WHEN READY"90 PAUSE100 OUTPUT OSa;"IB";
110 OUTPUT aSa_bin;Binary(*)120 OUTPUT 718;"VIEW TRB;"130 END
Llimensions an array called “‘Binary. ”Zzkes a measurement sweep.
Outputs trace B (in binary) to computer:Stores trace data in array.Changes the spectrum analyzer settings.
Prepares spectrum analyzer to re-ceive trace B data stored in array.Sends trace B data to spectrum analyzer
DescriptionThe IB command sends trace B data as binary data only; IB is independent of the measurementdata size (MDS) command. The IB command expects 802 data bytes (401 data points, two byteseach).
5.234 Programming Commands

ID Identify
IDIdentifyReturns the spectrum analyzer model number to the controller (for example, “HP8593E”).
Syntax
Equivalent Softkey: SHOW DPTIOlG .Related Commands: REV, SER.
Example
10 ALLOCATE A$[501 Allocates string to hold model number:20 OUTPUT 718;"ID;" Gets m.oo!&numberz30 ENTER 718;A$ Transfers number to computer:40 DISP A$ Displ.uys m&3? number:50 END
Query Response
Programming Commands 5-235

IF THEN ELSE ENDIFIf Then Else EndifThe IF/THEN/ELSE/ENDIF commands form a decision and branching construct.
Syntax
,- o p e r a n d 1 -,
/
b p r e d e f i n e d v a r i a b l e /
huser-defined v a r i a b l e )
b p r e d e f i n e d f u n c t i o n /
L t r a c e element /
GT/
L T
EQ
NE
GE
L E
p r e d e f i n e d v a r i a b l e /
buser-defined v a r i a b l e /
G t r a c e e l e m e n t /
a n a l y z e r c o m m a n d
a n a l y z e r command ENDIF
Item Description/Default
Number Any real or integer number.
User-defined variable A variable defined by VARDEF or ACTDEF commands.
Predefined variablePredefined function
Trace element
Analyzer command
A command that acts as a variable. Refer to Table 5-l.Function that returns a value. Refer to lhble 5-1.
An element of trace A, trace B, trace C, or a user-defined trace.
Any spectrum analyzer command.
Range
Real number range.
Any valid variablename.
Prerequisite Commands: ACTDEF or VARDEF when using a user-defined variable.Related Commands: REPEAT/UNTIL.
5-236 Programming Commands

IF TEEN ELSE ENDIF If Then Else Endif
ExampleThe following example uses the IF/THEN/ELSE/ENDIF command to pick a center frequency.
10 OUTPUT 718; “IP; ”20 OUTPUT 718;“TH -35DM;”30 OUTPUT 718;“TS;MKPK HI;MA;”40 OUTPUT 718;“IF MA,GT,TH THEN;”50 OUTPUT 7 18 ; “CF 20MHZ ; ”
60 OUTPUT 718; “ELSE; ”70 OUTPUT 718;“CF 100MHZ;TS;MKPK HI;”80 OUTPUT 718; “ENDIF; ”90 END
Initializes spectrum analyzxxSets threshold level.Finds highest peak.Compares peak to threshold.Changes center frequency to 20 MHz if peakamplitude is greater than the threshold.This line is executed if peak is less than orequal to the threshold level.End of IF/THEN/EUE/ENDIF
The example below does not include the ELSE portion of the IF/THEN/ELSE/ENDIF command.This example lowers any signal positioned above the spectrum analyzer screen.
10 OUTPUT 718; “IP; ” Initializes spectrum analyzer20 OUTPUT 718 ; “SNGLS ; TS ; MKPK HI ; MA ; ‘I Finds peak of trace.30 OUTPUT 718;“IF MA,GT,RL THEN;” Compares peak amplitude and reference level.40 OUTPUT 7 18 ; “MKRL ; ” rt?rfrms line 40 if the marker amplitude is
greater than the reference level.50 OUTPUT 718; “ENDIF; ”60 END
Ends IF/THEN/EN/ENDIF structure.
DescriptionThe IF portion compares operands 1 and 2 with the operators shown in the following table.
Operator Description
GT
LT
EQNE
GE
LE
Greater than.
Less than.
Equal to.
Not equal to.
Greater than or equal to.
Less than or equal to.
If the condition is true, the command list following the IF statement is executed and commandsbetween ELSE and ENDIF are skipped. If the condition is false, the commands after the ELSEstatement are executed. If there is no ELSE statement, program execution resumes after theENDIF statement.
Programming Commands 5-237

IF THEN ELSE ENDIF If Then Else Endif
The “equal to” (EQ) operator is not recommended if value 1 or value 2 represents a realnumber. When checking for equality with real numbers, the difference between the numbers isuseful. For example:
OUTPUT 718;"SUB T,EST,V-ARA,V,ARB;" Pkices the di@?wn.ce of VARA and V-ARB intoT-EST. VARA, VA@ and T-EST are user-d&ned variables.
OUTPUT 718;"ABS T,EST,T-EST;" Finds the absolute value of T-ESTOUTPUT 718;"IF T,EST,LT,.Ol THEN;" Does a comparison.OUTPUT 718;"CF UP;"OUTPUT 718~"ENDIF~"9 ,
When used within a downloadable program (DLP), the maximum number of IF THEN ELSEENDIF statements that can be nested is 20.
5-238 Programming Commands

INT Integer
INTIntegerPlaces the greatest integer that is less than or equal to the source value into the destination.
Syntax
4 u s e r - d e f i n e d t r a c e M
x I NT
Item Description/Default
User-deflned trace A trace defined by the TRDEF command.
User-defined variable A variable defined by VARDEF or ACTDEF commands.
PredeEned variable A command that acts as a variable. Refer to ‘lbble 5-l.
PredeEned function Function that returns a value. Refer to Table 5-l.
Trace range A segment of trace A, trace B, trace C, or a user-defined trace.
Number Any real or integer number.
Range
Any valid trace name.
Any valid variablename.
Real number range.
Prerequisite Commands: TRDEF when using a user-defined trace. ACTDEF or VARDEF whenusing a user-defined variable. TS when using trace data.Related Commands: REPEAT/UNTIL.
Programming Commands 5-239

INT Integer
Example
OUTPUT 718;"INT RL,3.75;" Resets the reference level wing the integer value of 3.
DescriptionWhen the number of items in the source is longer than the destination, the source is truncatedto fit. When the source is shorter than the destination, the last element is repeated to fill thedestination.
When the spectrum analyzer is sweeping across more than one band, taking the integer valueof the sweep time (ST) may yield a real number.
5-240 Programming Commands

INZ Input Impedance
INZInput ImpedanceSpecifies the value of input impedance expected at the active input port.
Syntax
Equivalent Softkey: fIJKIl’ Z 508 75Q .Preset Value: Returns impedance to the power-on value.Related Commands: AUNITS.
Example
OUTPUT 718;"INZ 75;" Changes input impedance to 75 ohms.OUTPUT 718 ; "AUNITS V; ” Changes amplitude units to volts.
DescriptionThe actual impedance can be affected only by internal hardware. With the exception of Option001 or 011 (HP 859OL or HP 85913 only), the spectrum analyzer hardware supports 5Ofl only.The INZ command is used for computation purposes during power or voltage conversions.
The INZ command affects only the amplitude results that are reported in absolute relativepower (dBm units or watts). (See “AUNITS.“)
Query Response
QINZ
Programming Commands 5-241

IPInstrument PresetPerforms an instrument preset.
Syntax
Equivalent Softkey: (PRESET_) is similar
ExampleOUTPUT 718;"IP;"
Description
AMB
AMBPL
AMPCOR
ANLGPLUS
ANNOT
AT
AUNITS
AUTO
BLANK B, BLANK C
CLRDSP
CLRW A
CONTS
COUPLE
DA
DET
DL
DOTDENS
FMGAIN
FOFFSET
GATE
GATECTL
Turns off A - B mode.
Turns off A - B plus display line mode.
Turns off amplitude correction factors.
Turns off the Analog+ display mode.
Turns on annotation.
Sets attenuation to 10 dB.
Loads the amplitude units from a configuration location in spectrumanalyzer memory.
Couples RB, AT, SS, ST, and VB. Turns off display line and threshold.
Blanks trace B and trace C.
Erases user graphics.
Clears and writes trace A.
Selects continuous sweep mode.
Selects ac coupling. (HP 85943, HP 85953, HP 85963 only.)
Sets the display address to zero.
Selects positive peak detection.
Turns off the display line.
Sets the dot density value to 15.
Sets FM gain to 100 kHz. (Option 102 or 103 only.)
Sets the frequency offset to 0 Hz.
Sets the gating to off. (Option 105 only.)
Sets the gate control to edge triggering. (Option 105 only.)
5-242 Programming Commands
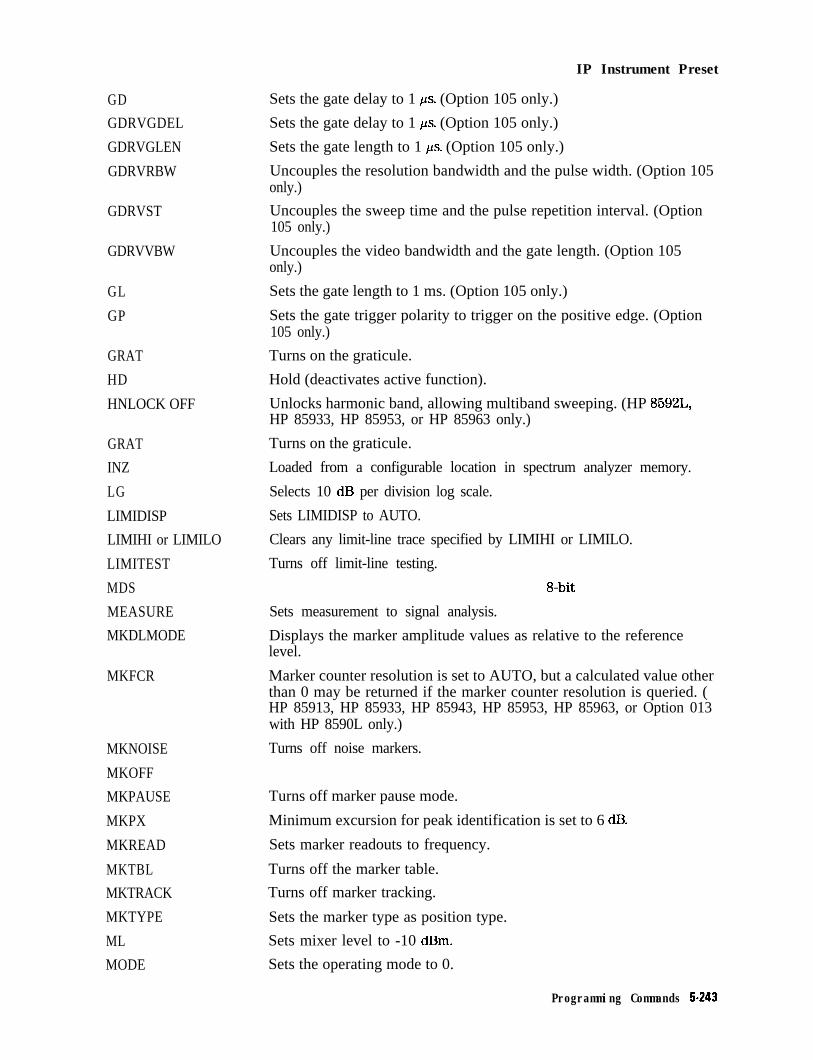
IP Instrument Preset
Sets the gate delay to 1 ps. (Option 105 only.)
Sets the gate delay to 1 ,us. (Option 105 only.)
Sets the gate length to 1 ps. (Option 105 only.)
Uncouples the resolution bandwidth and the pulse width. (Option 105only.)
Uncouples the sweep time and the pulse repetition interval. (Option105 only.)
Uncouples the video bandwidth and the gate length. (Option 105only.)
Sets the gate length to 1 ms. (Option 105 only.)
Sets the gate trigger polarity to trigger on the positive edge. (Option105 only.)
Turns on the graticule.
Hold (deactivates active function).
Unlocks harmonic band, allowing multiband sweeping. (HP 8592L,HP 85933, HP 85953, or HP 85963 only.)
Turns on the graticule.
Loaded from a configurable location in spectrum analyzer memory.
Selects 10 dB per division log scale.
Sets LIMIDISP to AUTO.
Clears any limit-line trace specified by LIMIHI or LIMILO.
Turns off limit-line testing.
8-bit
Sets measurement to signal analysis.
Displays the marker amplitude values as relative to the referencelevel.
Marker counter resolution is set to AUTO, but a calculated value otherthan 0 may be returned if the marker counter resolution is queried. (HP 85913, HP 85933, HP 85943, HP 85953, HP 85963, or Option 013with HP 8590L only.)
Turns off noise markers.
Turns off marker pause mode.
Minimum excursion for peak identification is set to 6 dB.
Sets marker readouts to frequency.
Turns off the marker table.
Turns off marker tracking.
Sets the marker type as position type.
Sets mixer level to -10
Sets the operating mode to 0.
GD
GDRVGDEL
GDRVGLEN
GDRVRBW
GDRVST
GDRVVBW
GL
GP
GRAT
HD
HNLOCK OFF
GRAT
INZ
LG
LIMIDISP
LIMIHI or LIMILO
LIMITEST
MDS
MEASURE
MKDLMODE
MKFCR
MKNOISE
MKOFF
MKPAUSE
MKPX
MKREAD
MKTBL
MKTRACK
MKTYPE
ML
MODE
Programming Commands 5,243

IP Instrument Preset
MS1
NDB
PD
PKDLMODE
PKSORT
PKTBL
PKZOOM
QPOFFSET
RB
RL
RLPOS
ROFFSET
RQS 40
SPEAKER
SQLCH
SRCALC
SRCNORM
SRCPSWP
SRCPWR
ss
STATUS BYTE
TH
TITLE
TM
TDF
TRB
TRC
TVLINE
TVSYNC
VAVG
VB
VBR
Selects the spectrum analyzer memory as the mass storage device.
Sets the number of dB for the NDBPNT measurement to -3 dB.
Puts pen down at current position.
Displays all the signal peaks in the peak table.
Sorts the signal peaks in the peak table by decreasing amplitude.
Turns off the peak table.
Sets the final span for the peak zoom routine to 1 MHz.
Sets the QPOFFSET to 20. (Option 103 only.)
Sets the resolution bandwidth to 3 MHz.
Sets reference level to 0 dBm.
Sets the reference level position to 8.
Sets reference offset to 0.
Allows SRQ 110, SRQ 140 for illegal commands or broken hardware.
Turns on the speaker. (Option 102, 103, or 301 only.)
Sets the squelch level to 0. (Option 102 or 103 only.)
Sets the source leveling control to internal. (Option 010 or 011 only.)
Sets the source normalization to off. (Option 010 or 011 only.)
Sets the source power sweep to off. (Option 010 or 011 only.)
Sets the source power level to -10 dBm. (Option 010 or 011 only.)
Sets the center frequency step size to 100 MHz.
Clear the status byte.
One division above bottom graticule line, threshold line off.
Clears the title from the spectrum analyzer screen.
Selects free run trigger mode.
Selects parameter units output format.
Sets the trace values to 0.
Sets the trace values to 8000.
Sets TV line number to 17. (Options 101 and 102, or 301 only.)
Triggers on negative polarity of the video modulation. (Options 101and 102, or 301 only.)
Turns off video averaging and sets the video averaging limit to 100.
Sets the video bandwidth to 1 MHz.
Sets VBR to 0.300.
5-244 Programming Commands

IP Instrument Preset
IP also clears all user graphics, all on-event algorithms, and turns off the windows displaymode. (The on-event algorithms are ONCYCLE, ONDELAY, ONEOS, ONMKR, ONSRQ, ONSWP,and ONTIME.)
Instrument preset automatically occurs when you turn on the spectrum analyzer. IP is a goodstarting point for many measurement processes. When IP is executed remotely, the spectrumanalyzer does not necessarily execute a complete sweep, however. You should execute a takesweep (TS) to ensure that the trace data is valid after an IP.
Note that ONPWRUP will be terminated, not erased, by performing one of the following:
n Pressing [?Z5Z?-j on the spectrum analyzer.
n Executing the universal HP-IB command DCL Device Clear.
n Executing the RS-232 command BREAK.
To remove ONPWRUP execute the DISPOSE ONPWRUP command.
Programming Commands 5-245

KEYCLRKey ClearClears softkeys 1 through 6 of menu 1.
Syntax
K E Y C L R
Related Commands: DISPOSE, KEYDEF, KEYEXC, KEYLBL, SAVEMENU.
Example 1
OUTPUT 718;"MENU 1;" Dis$h!ayswwnu1.OUTPUT 718;"KEYCLR;" Erases sojtkeys 1 through 6 of menu 1.
XKEYCLR
Example 2OUTPUT 718;"MENU 1;"OUTPUT 718;"SAVEMENU 101;"OUTPUT 718;"KEYCLR;"PAUSEOUTPUT 718;"MENU 101;"
Description
Displays ???xnu 1.Copies the softkey functions from menu 1 into menu 101.Erases the soflkey functions of wwnu 1.
Lxsphys menu 101.
The KEYCLR command clears softkeys 1 through 6. Use the DISPOSE command to clear asingle softkey.
Softkeys 1 through 6 can be displayed by executing “MENU 1;” or by pressing [m),User Menus .
5-246 Programming Commands
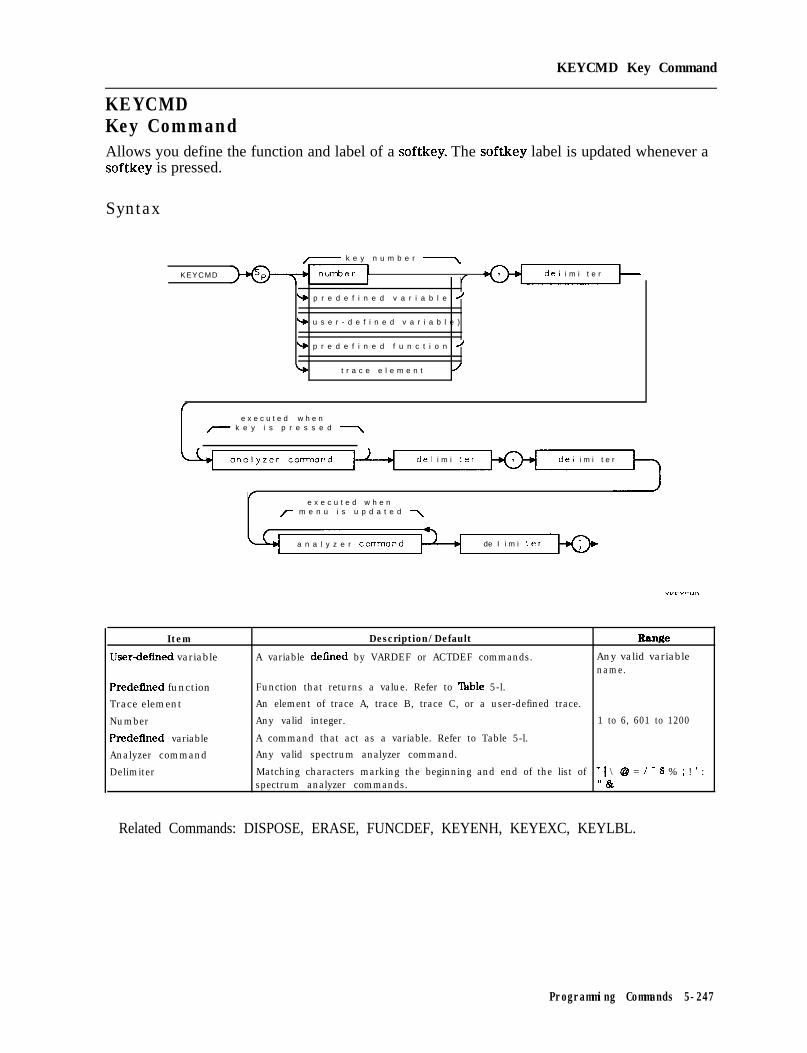
KEYCMD Key Command
KEYCMDKey CommandAllows you define the function and label of a softkey. The softkey label is updated whenever asoftkey is pressed.
Syntax
KEYCMD
,- k e y n u m b e r \
/
b p r e d e f i n e d v a r i a b l e /
% u s e r - d e f i n e d v a r i a b l e )
del i m i t e r
9 p r e d e f i n e d f u n c t i o n /
b t r a c e e l e m e n t /
e x e c u t e d w h e n- k e y i s p r e s s e d 7
del i m i ter del i m i t e r
/e x e c u t e d w h e n
r m e n u i s u p d a t e d 7
a n a l y z e r corrmand de I i m i ter
Item
User-detlned variable
Predefined function
Trace element
Number
Predellned variable
Analyzer command
Delimiter
Description/Default Range
A variable defined by VARDEF or ACTDEF commands. Any valid variablename.
Function that returns a value. Refer to lhble 5-l.
An element of trace A, trace B, trace C, or a user-defined trace.
Any valid integer. 1 to 6, 601 to 1200
A command that act as a variable. Refer to Table 5-l.Any valid spectrum analyzer command.
Matching characters marking the beginning and end of the list of - 1 \ @ = / ^ $ % ; ! ’ :spectrum analyzer commands. ” &
Related Commands: DISPOSE, ERASE, FUNCDEF, KEYENH, KEYEXC, KEYLBL.
Programming Commands 5-247

KEYCMD Key Command
Example 1This example defines 1. Softkey 1 has the label “QSAD” until it is pressed. Whensoftkey 1 is pressed, the following changes occur: center frequency changes to 105.3 MHz,span changes to 300 and the label for 1 changes from “QSAD” to “KSAD.” Ifsoftkey 1 is pressed again, the center frequency changes to 100.1 MHz and the label changesback to “QSAD. ”
10 OUTPUT 718;"IP;" Initializes spectrum analyzer:20 !30 OUTPUT 718;"VARDEF CmOUNTRY,l;" DQin..es variable called C-OUNTRI!40 !50 OUTPUT 718;"KEYCMD 1,"; Llqfims sojtkey 1.60 OUTPUT 718;"%";70 OUTPUT 718;"IF C,OUNTRY,EQ,
1;THEN;";80 OUTPUT 718;"CF 105.3MHZ;SP 300KHZ;";90 OUTPUT 718;"MOV CmOUNTRY,O;";100 OUTPUT 718;"ELSE;";110 OUTPUT 718;"CF lOO.lMHZ;SP 300KHZ;";120 OUTPUT 718;"MOV C-OUNTRY,l;";130 OUTPUT 718;"ENDIF;";140 OUTPUT 718;"%,";150 OUTPUT 718;"@";160 OUTPUT 718;"IF C,OUNTRY,EQ,O THEN;";170 OUTPUT 718;"KEYLBL l,%KSAD%;";180 OUTPUT 718;"ELSE;";190 OUTPUT 718;"KEYLBL l,%QSAD%;";200 OUTPUT 718;"ENDIF;";210 OUTPUT 718*"@*"-8 9,220 END
Example 2Softkey 2 has a softkey label, “COUNTRY YES NO.” If the value of the variable COUNTRYis 1, then YES is underlined and label of softkey 1 is “QSAD.” Pressing softkey 2 moves theunderline to NO and changes the label of softkey 1 to “KSAD. ”
102030405060708090100110120130140150160
OUTPUT 718;"IP;"
Ul$=CHR$(lG)Off$=CHR$(l5)
OUTPUT 718;"VARDEF C-OUNTRY,l;"!OUTPUT 718;"KEYCMD 1,";OUTPUT 718;"%";OUTPUT 718;"IF C,OUNTRY,EQ,Q THEN;";OUTPUT 718;"MOV CF 105.3MHZ;MOV SP,300KHZ;";OUTPUT 718;"MOV C,OUNTRY,O;";
OUTPUT 718*"ELSE-"*OUTPUT 7;8;"MO; CF lOO.lMHA;MOV SP,300KHZ;";OUTPUT 718;"MOV CmOUNTRY,l;";
OUTPUT 718;"ENDIF;";
5-248 Programming Commands

KEYCMD Key Command
170180190200210220230240250260270280290300310320330340350360370380390400410420430440450460470
OUTPUT 718;"%,";OUTPUT 718."(6".OUTPUT 718;"IF'C.OUNTRY.EQ.O THEN;";OUTPUT 718;"KEYLBL l,%KSAD%;";
OUTPUT 718;"ELSE;";OUTPUT 718;"KEYLBL l,%QSAD%;";
OUTPUT 718;"ENDIF;";OUTPUT 718*"@-"-9 ,,!OUTPUT 718;"KEYCMD 2,";OUTPUT 718;"X";OUTPUT 718;"IF C-OUNTRY,EQ,l THEN;";OUTPUT 718;“MOV CF,l05.3MHZ;MOV SP,300KHZ;";OUTPUT 718;"MOV C,OUNTRY,O;";
OUTPUT 718;"ELSE;";OUTPUT 718;"MOV CF,lOO.lMHZ;MOV SP,300KHZ;";OUTPUT 718;"MOV C-OUNTRY,l;";
OUTPUT 718;"ENDIF;";OUTPUT 718;"%,";OUTPUT 718;"O";OUTPUT 718;"KEYENH 2,";OUTPUT 718;"/";OUTPUT 718;"COUNTRYI";Ul$;"YES";Off$;" NO";OUTPUT 718;"/";OUTPUT 718;",0,";OUTPUT 718;"!";OUTPUT 718;"IF CmOUNTRY,EQ,O";OUTPUT 718;"! ;'I;OUTPUT 718*"@-"*, ,,!END
Descr ip t i on
The KEYCMD command updates the label whenever the softkey is pressed (as shown inexample 2).
The functions of KEYCMD and KEYDEF are similar. The advantage of KEYCMD is that thelabel of the softkey can change dependent on a conditional statement without the softkey itselfbeing pressed. KEYCMD is useful for indicating the state of a function in the spectrum analyzerby changing the appearance of the softkey.
Programming Commands 5-249

KEYCMD Key Command
Softkey numbers: When specifying the softkey number, you should only use a number from 1through 6, or 601 through 1200. Using other than the recommended softkey numbers can causeundesirable results.
The softkey number corresponds to the menu number as follows:
softkey number = (menu number - 1) x 6 + softkey position(The softkey position range is 1 through 6.)
For example:
Menu 1 contains softkey numbers 1 through 6Menu 101 contains softkey numbers 601 to 606Menu 200 contains softkey numbers 1195 to 1200
Menu 1 can be accessed by pressing (j-1, U;ser Menus . Menus 101 through 200, as wellas menu 1, can be accessed using the MENU command. See “MENU” for more information onaccessing softkeys and menus.
5-250 Programming Commands

KEYDEF User-Defined Key Definition
KEYDEFUser-Defined Key DefinitionAssigns a label and user-defined function to a softkey.
Syntax
,- k e y n u m b e r -\
b p r e d e f i n e d v a r i a b l e
h u s e r - d e f i n e d v a r i a b l e J
b p r e d e f i n e d f u n c t i o n /
b t r a c e e l e m e n t /
D/ del imiter 1
I II,/-- corrmond s t r i n g -,
a n a l y z e r c o m m a n d
u s e r - d e f i n e d f u n c t i o n
del i m i t e r
/-key label\
x k e y d e f
Programming Commands 5-251

KEYDEF User-Defined Key Definition
Item
User-de&ted variable
Predefined function
Trace element
Number
Predefined variable
Delimiter
Analyzer command
User-defined function
Character
Description/Default Range
A variable deEned by VARDEF or ACTDEF commands. Any valid variablename.
Function that returns a value. Refer to lhble 5-l. Any valid predeflnedfunction that returnsa value within thesoftkey number range.
An element of trace A, trace B, trace C, or a user-defined trace.
Any valid integer. 1 to 6, 601 to 1200.
A command that acts as a variable. Refer to Table 5-l. Any valid predeflnedvariable that returns avalue within softkeynumber range.
Matching characters marking the beginning and end of the list of - 1 \ @ = / ^ $ % ; ! ’ :spectrum analyzer commands. ” &
Any valid spectrum analyzer command.
A subroutine de&red by the FUNCDEF command. Any valid functionname.
Any valid character. Bee “LB” for additional characters and label 1 to 8 characters perfunctions. label line, use the (I)
symbol or blankspaces to separatesoftkey label lines.
Prerequisite Commands: ACTDEF or VARDEF when using a user-defined variable.Related Commands: DISPOSE, ERASE, FUNCDEF, KEYEXC, KEYLBL.
Example 1Connect CAL OUT to the spectrum analyzer input.
OUTPUT 718*"IP*"OUTPUT 718;"FUkDEF D-LP,Q";OUTPUT 718;"CF 300MHZ;";
OUTPUT 718;"SP IMHZ;";
OUTPUT 718."(9."3 ,
OUTPUT 718;"KEYDEF l,D,LP,%SHOWICAL%;"
OUTPUT 718;"KEYEXC 1;"
Initializes spectrum analyzexL%@u?s a function called D-L?Changes center frequency to measure thecalibration signal.Measures the calibration signal in narrowspan.The ‘@” signifies the end of the &n&iondeclaration.SojZkey 1 will now have the “‘SHOW CAL”label and perform thejbnction D-LI?Exectutes sofikey 1.
5-252 Programming Commands

KEYDEF User-Defined Key Definition
Example 2To redefine the command string without changing the label, enter a single blank space for thecommand string parameter. If you want to delete the command string and the softkey label,enter two or more blank spaces for the softkey label parameter.
OUTPUT 718;“KEYDEF 2,XIP;CF 300MHZ;%,%MY KEYILABELX;” &@zesso~?key,Z.OUTPUT 718;“KEYDEF 2, ,%MY KEYILABELI;” Removes the command string
fM.ctions, but the sojtkeylabel remain.5 on screen.
OUTPUT 718;“KEYDEF 2, , ;‘I Removes the command stringficnctions and the sojtkeylabel.
DescriptionLimit the number of characters (between the delimiters) in the list of spectrum analyzercommands to a maximum of 2047 characters.
Programming Commands 5-253

KEYDEF User-Defined Key Definition
Softkey numbers: When specifying the softkey number, you should only use a number from 1through 6, or 601 through 1200. Using other than the recommended softkey numbers can causeundesirable results.
The softkey number corresponds to the menu number as follows:
softkey number = (menu number - 1) x 6 + softkey position(The softkey position range is 1 through 6.)
For example:
Menu 1 contains softkey numbers 1 through 6Menu 101 contains softkey numbers 601 to 606Menu 200 contains softkey numbers 1195 to 1200
Menu 1 can be accessed by pressing f-J, User #enus . Menus 101 through 200, as wellas menu 1, can be accessed using the MENU command. See “MENU” for more information onaccessing softkeys and menus.
The softkey label and the command string can be deleted by entering blank spaces in thesoftkey label or command string. See example 2.
Query Response
o u t p u tt e r m i n o t i o n l
QKEYDEF
5-254 Programming Commands

KEYENH Key Enhance
KEYENHKey EnhanceAllows you to activate inverse video mode or underline part or all of the softkey label.
Syntax
,- k e y n u m b e r \
KEYENH del i m i t e r
9 p r e d e f i n e d v a r i a b l e /
buuser-defined v a r i a b l e )
% p r e d e f i n e d f u n c t i o n /
b t r a c e e l e m e n t /
c
r k e y l a b e l 7
del i m i t e r
/
i n v e r s e v i d e oI- c o n d i t i o n -\
a n a l y z e r comnand del i m i t e r del i m i t e r
Ir o v e e n h a n c e m e n t
,- condi t i o n -\
a n a l y z e r comnand de I i m i t e r
XKEYENH
Programming Commands 5-255

KEYENH Key Enhance
Item
User-defined variable
Predefined function
Trace element
Number
Predefined variable
Delimiter
Character
Analyzer command Any valid spectrum analyzer command.
Description/Default
A variable defined by VARDEF or ACTDEF commands.
Range
Any valid variablename.
Function that returns a value. Refer to Table 5-1. Any valid predefinedfunction that returnsa value within thesoftkey number range
An element of trace A, trace B, trace C, or a user-defined trace.
Any valid integer. 1 to 6, 601 to 1200.
A command that act as a variable. Refer to Table 5-l. Any valid predefinedvariable that returns 2value within softkeynumber range.
Matching characters marking the beginning and end of the list of - 1 \ @ = / - $ % ; ! ’ :spectrum analyzer commands. ” &
Any valid character. gee “LB” for additional characters and label 1 to 8 characters perfunctions. line, use the (I) symbol
or blank spaces toseparate softkey labellines.
Related Commands: DISPOSE, ERASE, FUNCDEF, KEYCMD, KEYEXC, KEYLBL.
Example 1The following program lines show two different ways of using KEYENH to underline “OFF” inthe softkey label.
OUTPUT 718;"KEYENH 2,@0N ";CHR$(lG)~;"OFF"; Uno!erlirws the “OFF” section of the la-CHR$(l5);"@,0,0;" bel. Notice that the wuwe enhancement
condition is false, and CHRS(l6) andCHR$(lS) control the “OFF” section ofthe soflkey label.
OUTPUT 718;"KEYENH 2,O";CHR$(l6>;"ON";CHR$(lS);" OFFQ,O,l;"
Underlines the “OFF” section of the la-bel. Notice that the move enhancementcondition is trme, and CHR$(16) andCHR$(lS) control the “ON” section of thesoftkey label.
The following program lines show two different ways of using KEYENH to underline “ON” inthe softkey label.
OUTPUT 718;"KEYENH 2,O";CHR$(l6);"ON";CHR$(l5); Urmkrlines the “ON” section of the' OFF@,O,O;" llabel.OUTPUT 718;"KEYENH 2,@0N";CHR$(l6);" OFF"; Underlines the “ON” section of theCHR$(l5);"@,0,1;" label.
5-256 Programming Commands

Example 2
KEYENH Key Enhance
Use the KEYENH command to turn on inverse video for the upper label line of softkey number1.
Ul$=CHR$ (IS)
IJff$=CHR$(lS)
OUTPUT 718;"VARDEF I,NV,O;"
OUTPUT 718;"VARDEF M-OVENH,O . II9
OUTPUT 718;"KEYENH l,%MY KEYEQ,I,NVO,QIF O,Eq,M,OVENHO;"
I";Ul$;"ON";Off$;" OFF%,@IF 0,
Example 3
Defines UL$ as the char-acter to turn the under-line on.Dc#n-e.s OFF$ as the char-acter to turn oflinversevideo and underlining.The value of I-NV actsas a inverse video condition.The value of MSOVENHacts as the move enhance-ment condition.The MY KEY label linechanges to inverse video,and OFF (in the lowerlabel line) is underlined.
Changing the condition of the inverse video mode to false turns off the inverse video.
Ul$=CHR$(lG)
Off$=CHR$(lS)
OUTPUT 718;"MOV I,NV,O;"OUTPUT 718;"MOV M,OVENH,l;"
OUTPUT 718;"KEYENH l,%MY KEYl";Ul$;"ON";Off$;" OFF%,OIF 0,EQ,I,NVO,QIF O,EQ,M,OVENHQ;"
B@ses UL$ as the char-acter to turn the under-line on.D@hes OFF$ as the char-acter to turn oflinversevideo and underlining.
Changes the conditionalvo9ue of MmOVENH.The ON portion of thelower label is underlined,the My KEY portion ofthe label is still in in-verse video.
Programming Commands 5-257

KEYENH Key Enhance
Example 4Omitting Ul$ and Off$ turns on inverse video for the upper and lower softkey label lines.
Ul$=CHR$ (16)
Off$=CHR$(lS)
OUTPUT 718;“MOV I-NV,O;”
&f&es UL$ as the charac-ter to turn the underlineon.Lk@ws OFF$ as the char-acter to turn o~$ inversevideo and underlining.
OUTPUT 718;“MOV M,OVENH,l;”OUTPUT 718;“KEYENH l,%MY KEYION OFF%,@IF 0, EQ,I-NVQ,OIF MYKEYand ONOFFareO,EQ,M-OVENHO;” displayed in inverse video.
DescriptionThe KEYENH command has two parameters (inverse video condition and move enhancementcondition). Setting these parameters to true or false controls how the softkey label is displayed.The softkey label can be displayed with sections of the label in inverse video or underlined.
If the inverse video condition for the softkey label is true, the following occurs:
w The top line of the softkey label is displayed in inverse video (see example 2).w If there are no enhancements embedded in the softkey label for the second line of the
softkey label, the second line of the softkey label is displayed in inverse video. (Seeexample 4). (See the following section, “Using Enhancements,” for more information aboutenhancements.)
If the inverse video condition for the softkey label is false, the inverse video is not used andthe softkey label appears as specified by the move enhancement condition.
If the move enhancement condition is true, the following occurs:
n If no enhancements are used in the softkey label, the last line of the softkey label isunderlined.
w If enhancements are used in the softkey label, the enhancement (inverse video orunderlining) is moved to the other side of the softkey label.
If the move enhancement condition for the softkey label is false, the softkey label appears asspecified by the inverse enhancement condition.
Using EnhancementsAn alternate way to control underlining and inverse video is to use “codes” to separate sectionsof a softkey label.
n If you want to underline different sections of the softkey label, use code CHR$(lG) (turns onunderlining) and CHR$(15) (turns off the enhancements).
n If you want to use inverse video on different sections of the softkey label, use code CHR$(14)(turns on inverse video) and CHR$(15) (turns off enhancements).
Example 1 demonstrates that there are two ways to underline the “OFF” section of softkeylabel using enhancements.
The recommended convention for using inverse video and underlining is to use inverse video toindicate an active function and underlined labels to show a choice.
5-258 Programming Commands

KEYENH Key Enhance
Softkey numbers: When specifying the softkey number, you should only use a number from 1through 6, or 601 through 1200. Using other than the recommended softkey numbers can causeundesirable results. The softkey number corresponds to the menu number as follows:
softkey number = (menu number - 1) x 6 + softkey position(The softkey position range is 1 through 6.)
For example:
Menu 1 contains softkey numbers 1 through 6Menu 101 contains softkey numbers 601 to 606Menu 200 contains softkey numbers 1195 to 1200
Menu 1 can be accessed by pressing Cm), User Menus . Menus 101 through 200, as wellas menu 1, can be accessed using the MENU command. See “MENU” for more information onaccessing softkeys and menus.
Programming Commands 5-259

KEYEXCKey ExecuteExecutes the specified, previously defined softkey.
Syntax
KEYEXC
k e y n u m b e r/ \
XKEYEXC
Item Description/Default
Number Any valid integer
Related Commands: DISPOSE, ERASE, FUNCDEF, KEYDEF, KEYLBL.
Range
1 to 6, 601 to 1200.
ExampleOUTPUT 718;"FUNCDEF D-LP,@";OUTPUT 718*"CF 300MHZ."., t 9
OUTPUT 718;"SP IMHZ;";
OUTPUT 718;"@;"
OUTPUT 718;"KEYDEF l,D,LP,%SHOW CAL%;"
OUTPUT 718;"KEYEXC 1;"
De@ws a jimction called D-LETChanges center frequency to wwasure thecalibration signal.Measures the calibration signal in narrowspan.The “@” signi~ the end of the jbzctiondeclaration.Soflkey 1 will now have the “SHOW CAL.”label and perform the fimction DARExecutes sojtkey 1.
5.260 Programming Commands

KEYLBL Key Label
KEYLBLKey LabelRelabels a softkey without changing its function.
Syntax
- k e v n u m b e r -
K E Y L B L
.
/del i m i t e r
1 c-z.11
User-defined variable
?redefined function
rrace element
Yumber
?redefied variable
Delimiter
Character
“mziDI;I qJC’“‘Y YmzilauL -‘t&C
A variable defined by VARDEF or ACTDEF commands. Any valid variablename.
Function that returns a value. Refer to %ble 5-l.
An element of trace A, trace B, trace C, or a user-defined trace.
Any valid integer. 1 to 6, 601 to 1200.
A command that acts as a variable. Refer to Table 5-1.
Matching characters marking the beginning and end of the list of - 1 \ @ = / ^ $ % ; ! ’spectrum analyzer commands. ” &
Any valid character. See “LB” for additional characters and label 1 to 8 characters perfunctions. label line, use the (I)
symbol or blankspaces to separatesoftkey label lines.
Prerequisite Commands: ACTDEF or VARDEF when using a user-defined variable.Related Commands: DISPOSE, ERASE, FUNCDEF, KEYDEF, KEYEXC, KEYLBL.
ExampleConnect CAL OUT to the spectrum analyzer input.
10 OUTPUT 718;"FUNCDEF D,LP,O";
20 OUTPUT 718;"CF 300MHZ;";
30 OUTPUT 718;"SP 1MHZ;";
&fines a function called D-LP The ‘@”sp&ol indicates the beginning of thefunction.Changes center frequency to masure thecalibration signal.Measures the calibration signal in nar-row span.
Programming Commands 5-261

KEYLESL Key Label
40 OUTPUT 718;"@;"
50 OUTPUT 718;"KEYDEF l,D-LP,%SHOW CAL%;"
60 OUTPUT 718;"KEYEXC 1;"70 OUTPUT 718;"KEYLBL l,%NEW NAME%;"
80 END
Description
The “@” signifies the end of the functiondeclaration.Soflkey 1 is now called “‘SHOW CAL” andperforms the function D-L2Executes sojtkey 1.Soflkey 1 is now labeled “NEW NAME”,but performs the same function.
When specifying the softkey number, you should only use a number from 1 through 6, or 601through 1200. Using other than the recommended softkey numbers can cause undesirableresults.
The softkey number corresponds to the menu number as follows:
softkey number = (menu number - 1) x 6 + softkey position(The softkey position range is 1 through 6.)
For example:
Menu 1 contains softkey numbers 1 through 6Menu 101 contains softkey numbers 601 to 606Menu 200 contains softkey numbers 1195 to 1200
Menu 1 can be accessed by pressing (MEAS/USEji), User hanus . Menus 101 through 200, as wellas menu 1, can be accessed using the MENU command. See “MENU” for more information onaccessing softkeys and menus.
5-262 Programming Commands

LB Label
LBLabelWrites text (label) at the current pen position. The text consists of alphanumeric charactersspecified in the character field.
Syntax
L B
,- text -\7 t e r m i n a t o r
c h a r a c t e r c h a r a c t e r
XLB
Item Description/Default
Character (text) Any valid character. See “LB” for additional characters available.
Character (delimiter) Anv valid character declared as a delimiter bv the DT command.
Range
Prerequisite Command: DT.Related Commands: TEXT, TITLE.
Example10 OUTPUT 718*"IP-"20 OUTPUT 718;"BLiNK TRA;ANNOT OFF;"
30 OUTPUT 718;"DT@;"
40 OUTPUT 718;"PU;PA 75,175;LB LABEL@;"
50 OUTPUT 718;"PU;PA 75,150;LB";CHR$(36);"@;"
60 OUTPUT 718;"PU;PA 75,125;LB";CHR$(16);"AN UNDERLINED LABEL";CHR$(l5);"0;"
70 OUTPUT 718;"PU;PA 75,100;LB";CHR$(l4);"A LABEL IN INVERSE VIDEO";CHR$(l5);"@;"
80 END
Initializes spectrum awlyzezClears trace and annotation from thespectrum analyzer screen.Establishes @ as the termination of thelabel text.Displays “‘LABEL” on the spectrum an-alyzer screen.Displays the dollar sign “$” on thespectrum analyzer screen. l%e semi-colons before and a$er CHRS(36) pre-vent the computer from performing aline feed.Underlines the text.
Displays the text in inverse video.
Programming Commands 5-263

LB Label
DescriptionEach text character is specified by 8 bits in an 8 bit data byte, which immediately follows theLB command. Additional characters can be displayed using CHR$(code) where code representsthe ASCII code. (See line 50 of the example.) Refer to the following tables for additionalcharacters and label functions available.
LB displays the text at the current pen position. When using LB, the end of the text charactersmust be terminated. If the text is not terminated, instructions and other text following theactual label’s statement are displayed on the spectrum analyzer screen. The label mode canalways be terminated with an ASCII end-of-text code (decimal code 3), or with a characterspecified previously by the DT command. The terminator character itself must immediatelyfollow the label.
To remove the text written by the LB command, write spaces over the text or use the CLRDSPcommand.
The LB command also enters the text into the display list. See “DA” for more informationabout the display list.
5-264 Programming Commands

LB Label
‘Ihble 5-6. Character Set
Code3233343536373839404142434445464748495051525354555657585960616263646566676869707172
CharIspace:
!II
#$%&
;>*
+,-
I0123456789
,<=>?
@ABCDEFGH
Code737475767778798081828384858687888990919293949596979899100101102103104105106107108109110111112113
ChwIJKLMN0
l!RSTUVWXY2
:1
.
abC
defIi!hijk1
mn0
P9
Code114115116117118119120121122123125126160162163164165166167168169170171172173174175176177178179180181182183184185186187188189
ChurS
tU
V
W
X
YZ
{
l
A. .
fL
cx
@
+
+
§
*
1
X
7
0
1
2
3
-1
2
;
N
II
:.
5
1L
Code190191192193194195196199200201204205206207208209210211212213214216217218219220221222224225226227228229230231232233234235236
Char
1
LA
seV!3h
T
L”
nCl
P
Co
rS
T
AV
I-+=++
II
Code237238239240241242243244245246247248249250251252253254
Chal
Pv0
iTe
eL77v
W
r
6
D
cl
A
T
x
Programming Commands 5-265

LB Label
Code
8
10
11
12
13
14
15
16
1 ible 5-7. Label Functions
F u n c t i o n
back space
line feed
vertical tab
form feed
carriage return
inverse video on
enhancements offIi underlining on
Description
~ Positions the pen back one character width.
Positions the pen position down one character height.
, Positions the pen up one character height.
‘Position the pen to the upper-left comer of the display.
Positions the pen at the far left side of the display.
Turns on inverse video.Turns off underlining or inverse video.
Turns on underlining.
5-266 Programming Commands

LF’ Base Band Instrument Preset
LFBase Band Instrument PresetPerforms an instrument preset into base band (band 0).
Syntax
( L F
XLF
Model Required: HP 8592L, HP 85933, HP 85953, HP 85963.Related Commands: IP.
ExampleOUTPUT 718;"LF;"
DescriptionUse LF instead of instrument preset (IP) if harmonic band 0 is desired. Using LF instead of IPreduces the wear on an internal spectrum analyzer switch (the RF switch).
Programming Commands 5-267

LGLogarithmic ScaleSpecifies the vertical graticule divisions as logarithmic units, without changing the referencelevel.
Syntax
l o g a r i t h m i c scale 7
Item I Description/Default I Range
Number Any real or integer number. Default units are dB. 0.1 to 20 dB.
Equivalent Softkey: SCALE LOG LIN (when LOG is underlined).Preset State: 10 dB.Related Commands: LN.
ExampleOUTPUT 718;"LG 1DB;"
DescriptionThe vertical scale can be specified (in tenths) from 0.1 to 0.9 dB, or in integers from 1 to 20 dBper graticule division.
If LG is used as the destination in a MOV command, it changes the log scale, but does notchange the scale from linear to logarithmic.
Query Response
5.266 Programming Commands

LIMIDELDelete Limit-Line TableDeletes all upper and lower segments in the current limit-line table.
Syntax
Equivalent Softkey: PURGE LIMITS .Related Commands: LIMIFT, LIMIHI, LIMILO, LIMIREL, LIMISEG, LIMISEGT, SEGDEL,SENTER, SENTERT.
ExampleOUTPUT 718."LIMIDEL*"9 #
DescriptionUse LIMIDEL before entering a new limit line.
Note Use STOR, SAVET, or SAVRCLW if you want to save the current limit-line table.LIMIDEL does not affect stored limit-line data.
LIMIDEL sets LIMIREL OFF (specifies that the limit line is fixed) and LIMIFT FREQ (specifiesthat the limit line is based on frequency). See “LIMILINE” for more information about limitline construction.
Programming Commands 5-269

LIMIDISPLimit Line DisplayControls when the limit line (or limit lines) are displayed.
Syntax
Equivalent Softkey: LMT DXSP Y N AUTO .Preset Value: AUTO.Related Commands: ANLGPLUS, LIMILINE, LIMITEST.
ExampleOUTPUT 718; “LIMIDISP ON; ” Displays any portion of the limit lines that are currently
within the spectrum analyzer screen boundaries.
DescriptionIf a limit line is currently in spectrum analyzer memory, you can use LIMIDISP to control thedisplay of the limit lines. The parameters of LIMIDISP do the following:
ON Turns on the limit line display.
OFF Turns off the limit line display.
AUTO Allows LIMITEST to control the display of the limit lines. If LIMITEST is on,the limit lines will be displayed. If LIMITEST is off, the limit lines will not bedisplayed.
UPPER Displays the upper limit line only.
LOWER Displays the lower limit line only.
Note Turning on Analog+ display mode changes the way that LIMIDISP functions asfollows:
n LIMIDISP ON, LIMIDISP LOWER, and LIMIDISP UPPER do not work whenthe Analog+ display mode is turned on.
n LIMIDISP AUTO will still perform the limit line test if LIMITEST is on, butthe limit lines will not be displayed.
5.270 Programming Commands
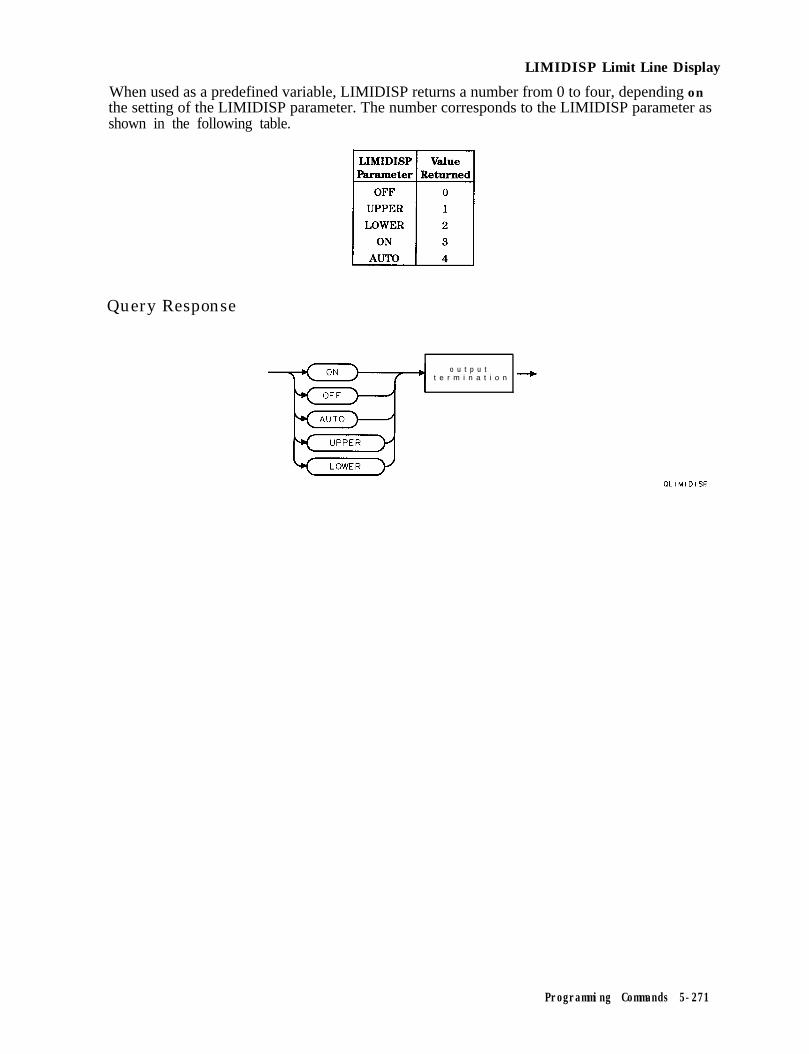
LIMIDISP Limit Line Display
When used as a predefined variable, LIMIDISP returns a number from 0 to four, depending onthe setting of the LIMIDISP parameter. The number corresponds to the LIMIDISP parameter asshown in the following table.
Query Response
o u t p u tt e r m i n a t i o n +
Programming Commands 5-271

LIMIFAILLimits FailedReturns a “0” ifthelastmeasurementsweep of trace AisequaIto or within the limit-linebounds.
Syntax
Pre’def inedf u n c t i o n p a t h o n l y
Related Commands: LIMIHI, LIMILINE, LIMILO, LIMISEG, LIMISEGT, LIMITEST, SENTER,SENTERT.
Example
10 OUTPUT 718;“IP;SNGLS;CF300MHZ;SPlOOMHZ;”
20 OUTPUT 718;“LIMIDEL;”
30 OUTPUT 718;“LIMIMODE UPPER;”40 OUTPUT 718;“LIMISEG 250MHZ,-60DB,FLAT;”
Initializes spectrum analyzer andchanges the frequency and spansettings.Deletes any limit-line tables, setsthe table type to $xed.Spec@es the upper limit-line table.Creates an entry for the upperlimit-line table. Because the LIMISEGcommand is used, the limit-linewill be boxed on the frequency.
OUTPUT 718;“LIMISEG 290MHZ,-60DB,SLOPE;”OUTPUT 718;"LIMISEG 295MHZ,-lSDB,FLAT;"OUTPUT 718;"LIMISEG 305MHZ,-15DB,SLOPE;"OUTPUT 718;"LIMISEG 3lOMHZ,-GODB,FLAT;"OUTPUT 718;"LIMISEG SlOMHZ,-GODB,FLAT;"OUTPUT 718;"LIMITEST 0N;TS;" Turns on limit-line testing.OUTPUT 718;"LIMIFAIL?;" Returns the status of the limit-line
testing.ENTER 718;ADISP A Displays the result.END
5060708090100110
120130140
5.272 Programming Commands

LIMIFAIL Limits lkiled
DescriptionLIMIFAIL returns one of the following values:
0 indicates that the measurement sweep was within the limit-line bounds.1 indicates that the measurement sweep failed the lower limit.2 indicates that the measurement sweep failed the upper limit.3 indicates that the measurement sweep failed both the lower and upper limits.4 indicates that no test was performed. A “4” is returned if LIMITEST is set to OFF.
Query Response
Programming Commands 5.273

LIMIFTSelect Frequency or Time Limit LineSelects how the limit-line segments are defined: according to frequency, or according to thesweep time setting of the spectrum analyzer.
Syntax
Equivalent Softkey: LIMIFT is equivalent to LIMITS FRIJ TIME.Related Commands: LIMIDEL, LIMILINE, LIMIMODE, LIMIREL, LIMISEG, LIMISEGT,SEGDEL, SENTER, SENTERT.
ExampleOUTPUT 718;"LIMIFT TIME;" Ifthe current limit-line table is a frequency limit-line table,
it is purged. LIMIFT TIME places the limit-line segmentson the spectrum analyzer display with respect to the sweeptime of the spectrum analyzer:
DescriptionIf you execute “LIMIFT TIME;“, LIMISEGT, or SENTERT, the limit-line segments are placed onthe spectrum analyzer display with respect to the sweep time setting of the spectrum analyzer.If you execute “LIMIFT FREQ;“, LIMISEG, or SENTER, the limit-line segments are placedaccording to the frequency that is specified for each segment. If a limit line has already beendefined, changing the LIMIFI’ setting clears the existing limit line.
Query Response
T I M E
FREQ
5-274 Programming Commands

LIMIHI Upper Limit
LIMIHIUpper LimitAllows you to specify a fixed trace as the upper limit line.
Syntax
LIMIHI/
h u s e r - d e f i n e d t r a c e /
XLlMlHl
Related Commands: IP, LIMIDEL, LIMIFAIL, LIMILO, LIMISEG, LIMITEST, SENTER.
Example
10 OUTPUT 718;"TRDEF M,ASK,401;”20 OUTPUT 718;"MOV M,ASKC1,1001,1000;"
30 OUTPUT 718;"MOV M~ASK[101,2001,2000;"40 OUTPUT 718;"MOV M~ASK[201,300],3000;"50 OUTPUT 718;"MOV M,ASK[301,401] ,400O;”60 OUTPUT 718;"LIMIHI M-ASK;"
70 OUTPUT 718;"LIMITEST ON;"80 OUTPUT 718;"LIMIFAIL?;"90 ENTER 718;A100 DISP A110 END
Dejines a trace called “M-ASK. ”Moves values into sections of the M-ASKtrace.
[email protected] M-ASK as the upper limitlineTurns on limit-line testing.l&sts if trace A fails limit-line testing.
Displays result of limit-line testing.
DescriptionUnlike specifying a limit line with LIMISEG, LIMISEGT, SENTER, or SENTERT, the limit linespecified with LIMIHI is not updated if the center frequency, frequency span, sweep time, orreference level are changed.
Note Executing IP, LIMIDEL, LIMISEG, LIMISEGT, SENTER, or SENTERT will deletethe limit line specified with LIMILO or LIMIHI. Executing LIMILO or LIMIHIwill delete the limit line specified with LIMISEG, LIMISEGT, SENTER, orSENTERT.
Use LIMITEST ON to display the limit line trace specified by LIMIHI. Use LIMITEST OFF toblank the limit line trace specified by LIMIHI.
Programming Commands 5-275

LIMILINELimit LinesOutputs the current limit-line table definitions.
Syntax
LIMILINE
Related Commands: LIMIFI’, LIMIREL, LIMIMODE, LIMIREL, LIMISEG, LIMISEGT,LIMITEST, SAVRCLW, SENTER, SENTERT.
Example
10 DIM States$[2000]
20 OUTPUT 7l8;"IP;CF300MHZ;SPlOOMHZ;"30 OUTPUT 718;"LIMIDEL;"
40 OUTPUT 718;"LIMIMODE UPPER;"45 OUTPUT 718;"LIMIFT FREG;"50 OUTPUT 718;"LIMISEG 250MHZ,-60DB,FLAT;"
60 OUTPUT 718;"LIMISEG 290MHZ,-60DB,SLOPE;"70 OUTPUT 718;"LIMISEG 295MHZ,-15DB,FLAT;"80 OUTPUT 718;"LIMISEG 305MHZ,-15DB,SLOPE;"90 OUTPUT 718;"LIMISEG 3lOMHZ,-GODB,FLAT;"100 OUTPUT 718;"LIMISEG 910MHZ,-60DB,FLAT;"110 OUTPUT 718;"LIMILINE?;"
120 ENTER 718 USING I'#,-K";States$130 PRINT States$
Dhnmsions an array to store thelimit-line irlformation.Initializes spectrum analyzexLkletes any limit-line tables, setsthe table type to fiked.Specifies the upper limit-line table.Selects a limit line based onfrequency.Enters a value for the upper limit-line table. Because the LJMXSEGcommand is used, the limit-linesegment is for a limit-line basedmfMww.
Gets the current limit-line [email protected] in&ormation into array.Prints the current limit-line table&$nitions.
140 END
5-276 Programming Commands

LIMILINE Limit Lines
DescriptionLIMILINE is used to query the current limit line. Executing LIMILINE returns an ASCII stringcontaining the commands needed to create the limit line.
Use these commands (in the order given) to build a limit line:
1. Use LIMIDEL to clear the limit-line table.
2. Use LIMIFI’ to select a limit line that is either based on frequency or sweep time.
3. Use LIMIREL to determine whether the values of the limit line are absolute values orpositioned relative to the reference-level and center-frequency settings.
4. Use LIMIMODE, LIMISEG, LIMISEGT, SENTER, SENTERT to enter the limit-line segments.(Use LIMISEG or SENTER for a limit-line based on frequency; use LIMISEGT or SENTERTfor a limit-line based on sweep time.)
5. Use the LIMIDISP command to select if the limit line is displayed or not.
6. Use the LIMITEST command to turn on limit-line testing.
7. Use the LIMIFAIL command to determine if the measurement sweep passed or failed thelimit line boundaries.
Enabling limit-line testing: When limit testing is enabled, the segments in the current tableare interpolated into the limit-line traces according to the current span and center frequency orsweep time of the spectrum analyzer. After the sweep, each value in trace A is compared to itscorresponding value in the limit-line traces. If the current limit-line table is empty (for instanceafter using the command LIMIDEL) and limit testing is enabled, then the limit-line traces areblanked and set to out-of-range values. By using the SUB, MKPK HI, and MKF? commands, youcan read the point of greatest difference between the trace and limit line. See “LIMITEST” formore information about limit-line testing.
Saving the limit line table: Once you have built the limit line, you can save the limit-linetable on a memory card or in spectrum analyzer memory. Use the STOR or SAVRCLWcommands to store the current limit-line table on the memory card. Use SAVET or SAVRCLW tostore the limit-line table in spectrum analyzer memory.
Query ResponseThe query response is a character string consisting of LIMILINE, LIMIREL, LIMIMODE,LIMIHALF, LIMISEG, LIMISEGT, SENTER, or SENTERT commands. LIMIMODE returnsthe number of for the current limit-line table. (The LIMIHALF command is for backwardcompatibility; it is not used as an HP 8590 Series spectrum analyzer programming command.)
Programming Commands 5-277

LIMILINE Limit Lines
n u m b e r o fr s e g m e n t s 7
LIMIDEL LIMIREL
/frequency\ uPPer l o w e r/value 7 / v a l u e \
S E N T E R
S E N T E R T
/frequency\ /ompIitude\
5-278 Programming Commands

LIMILO Lower Limit
LIMILOLower LimitAllows you to specify a fixed trace as the lower limit line.
Syntax
XLIMILO
Related Commands: IF’, LIMIDEL, LIMIFAIL, LIMISEG, LIMITEST, SENTER.
Example
10 OUTPUT 718;"TRDEF M,ASK,401;" D$ke.s a trace called ‘M_ASK. ”20 OUTPUT 718;"MOV M~ASK[1,100],1000;" Moves mlues into sections of the M-ASK
trace.30 OUTPUT 718;"MOV M~ASK[101,200],2000;"40 OUTPUT 718;"MOV M,ASK[201,300],3000;"50 OUTPUT 718;"MOV M~ASK[301,401],4000;"60 OUTPUT 718;"LIMILO M-ASK;" Specifies M-ASK as the lower limit
line.70 OUTPUT 718;"LIMITEST ON;"80 OUTPUT 718;"LIMIFAIL?;"90 ENTER 718;A100 DISP A110 END
Turns on limit-line testing.7bst.s if trace A fails limit-line testing.
Displays result of limit-line testing.
DescriptionUnlike specifying a limit line with LIMISEG, LIMISEGT, SENTERT, or SENTER, the limit linespecified with LIMILO is not updated if the center frequency, frequency span, sweep time, orreference level is changed.
Note Executing IP, LIMIDEL, LIMISEG, LIMISEGT, SENTERT, or SENTER will deletethe limit line specified with LIMILO or LIMIHI. Executing LIMILO or LIMIHIwill delete the limit line specified with LIMISEG or SENTER.
Use LIMITEST ON to display the limit line trace specified by LIMILO. Use LIMITEST OFF toblank the limit line trace specified by LIMILO.
Programming Commands 5-279

LIMIMIRRORMirror Limit LineReflects the current definition about the amplitude axis at the largest frequency (for a limit linebased on frequency) or the largest sweep time (for a limit line based on the sweep time) in thedefinition.
Syntax
Related Commands: LIMILINE, LIMISEG, LIMISEGT, SENTER, SENTERT.
Example
10 OUTPUT 718 ,
20 OUTPUT 718 ;
30 OUTPUT 718;"LIMIMODE UPPER;"35 OUTPUT 718;"LIMIFT FREQ;"40 OUTPUT 718;"LIMISEG 250MHZ,-60DB,FLAT;"
50 OUTPUT 718;"LIMISEG 290MHZ ,-50DB,SLOPE;"60 OUTPUT 718;"LIMISEG 295MHZ,-15DB,SLOPE;"70 OUTPUT 718;"LIMISEG 300MHZ,-lODB,SLOPE;"80 OUTPUT 718;"LIMIMIRROR;"90 OUTPUT 718;"LIMITEST ON;"
100
"IP;CF300MHZ;SPlOOMHZ;"
"LIMIDEL;"
END
Initializes spectrum an&y- changesthe frequency and span.Deletes any limit-line tables, setsthe table type to jixed.SpecQks the upper limit-line tableSelects a limit line boxed on frequency.Enters a value into the upper limit-line table.
Mirrors the upper limit-line entries.Turns on the limit-line testing anddisplays the limit lines.
The example results in the limit-line table shown in the following table.-1EG-
12
3
4
5
6
7
8-
!f
WART-FREQ
250.0 MHz290.0 MHz
295.0 MHz300.0 MHz
305.0 MHz
310.0 MHz
310.0 MHz350.0 MHz
You may notice that the LIMIMIRROR command may create more than one table entry for afrequency (for example, see segment 6 in the above table). The LIMIMIRROR command createsan extra segment so that the previous segment is explicitly ended at the correct amplitude.
5-280 Programming Commands

LIMIMODE Limit-Line Entry Mode
LIMIMODELimit-Line Entry ModeDetermines whether the limit-line entries are treated as upper amplitude values, loweramplitude values, upper and lower amplitude values, or mid-amplitude and delta values.
Syntax
Related Commands: LIMILINE, LIMISEG, LIMISEGT, SEGDEL, SENTER, SENTERT.
ExampleThis example uses LIMIMODE to enter segments into the upper limit-line table, and then toenter a segment into the lower limit-line table (upper and lower limit lines are treated asseparate tables). Line 60 demonstrates entering a segment into a combined upper and lowerlimit-line table.
10 OUTPUT 718;"LIMIDEL;" Deletes the current limit-line ta-ble, sets the table type to jixed.Specifies the upper limit-line table.Selects a limit line based on frequency.Enters a segment into the up-per limit-line table. Because theLMSEG command is used, thelimit-line table will be based [email protected] the lower limit-line table.Enters a segment into the lowerlimit-line table.
20 OUTPUT 718;"LIMIMODE UPPER;"30 OUTPUT 718;"LIMIFT FREQ;"40 OUTPUT 718;"LIMISEG 300MHZ,-30DB,SLOPE;"
50 OUTPUT 718;"LIMIMODE LOWER;"60 OUTPUT 718;"LIMISEG 300MHZ,-70DB,SLOPE;"
70 OUTPUT 718;"LIMIMODE UPLOW;"
80 OUTPUT 718;"SENTER 350MHZ,-30DB,-80DB,FLAT;"
90 OUTPUT 718;"LIMIDISP ON;"100 END
SpecQies the upper and lower limit-line tables.Enters a segment into the upperand lower limit-line tables.Displays the limit lines.
Programming Commands 5-281

LIMIMODE Limit-Line Entry Mode
DescriptionUse LIMIMODE in conjunction with LIMISEG, LIMISEGT, SENTER, or SENTERT. SpecifyLIMIMODE UPPER or LIMIMODE LOWER before using LIMISEG or LIMISEGT. SpecifyLIMIMODE UPLOW or LIMIMODE DELTA before using SENTER or SENTERT.
The LIMIMODE command determines whether the limit-line table entries are to be treatedseparately (upper or lower) or together (upper and lower) when deleting a segment withSEGDEL (see “SEGDEL”). If limit-line table entries are entered with LIMISEG or LIMISEGT,they are treated as entries to separate tables even if LIMIMODE UPLOW or LIMIMODE DELTAhad been previously specified.
When used as a predefined variable, LIMIMODE returns a number from 0 to three, dependingon the setting of the LIMIMODE parameter. The number corresponds to the LIMIMODEparameter as shown in the following table.
Query Response
o u t p u t’ t e r m i n a t i o n ---)
QLIMIMODE
5-282 Programming Commands

LIMIREL Relative Limit Lines
LIMIRELRelative Limit LinesSpecifies whether the current limit lines are fixed or relative.
Syntax
L I M I R E L O F F/
ON
Related Commands: LIMIDEL, LIMIFT, LIMILINE.
Example
OUTPUT 718;"LIMIFT FREQ;" Selects a limit line based on frequency.OUTPUT 718;"LIMIREL ON;" SpecQks that the limit line will be relative to the reference-
level and center-frequency settings.
DescriptionYou should use LIMIFT to select whether the limit lines are based on frequency or sweep timebefore using LIMIREL, because changing between a frequency or sweep time limit line purgesthe current limit line table and sets LIMIREL to OFF.
LIMIREL and the reference level: Regardless of whether the limit line is based on frequencyor sweep time, LIMIREL determines if the amplitude parameter in a limit line table representsabsolute values or relative values. If LIMIREL is set to OFF, the limit lines amplitude valuesare specified in absolute amplitude and do not depend on the reference level (RL) setting. IfLIMIREL is set to ON, the limit line amplitude values are relative to the current reference level(RL) setting.
For limit lines that are based on frequency: The LIMIREL command determines whetherthe frequency parameter in a limit-line table represent absolute or relative values that arereferenced to the center-frequency settings.
n Executing “LIMIREL OFF;” specifies that the frequency values in a limit-line table are fixedvalues, and the limit line is positioned accordingly. Fixed limit lines are specified in absolutefrequency and do not depend upon the center frequency value.
n Executing “LIMIREL ON;” specifies that the frequency values in a limit-line table are relativevalues and positions the limit line relative to the center-frequency settings. Relative limitlines are specified in relative frequency and are positioned with respect to the current centerfrequency. When the current center frequency value is changed, the segment frequenciesare converted according to the current center frequency value.
Programming Commands 5.283

LIMIREL Relative Limit Lines
For limit lines that are based on the sweep time: Limit lines that are based on sweep timeare always relative to the start time, and the horizontal position of the limit line is not affectedby the setting of LIMIREL.
Query Response
o u t p u tl t e r m i n a t i o n +
002
5-284 Programming Commands

LIMISEG Enter Limit-Line Segment for Frequency
LIMISEGEnter Limit-Line Segment for FrequencyAdds new segments to the current frequency limit line in either the upper limit line or thelower limit line.
Syntax
LIMISEC
,- f r e q u e n c y -,
HZ
I
I
l p r e d e f i n e d v a r i a b l e -/
Luser-defined v a r i a b l e -I
L p r e d e f i n e d f u n c t i o n I
k t r a c e e l e m e n t /z
s e g m e n t
/ type \
TQ-d
S L O P E
b p r e d e f i n e d v a r i a b l e J
buuser-defined variable>
b p r e d e f i n e d f u n c t i o n J
t r a c e e l e m e n t J
-0
XLIMISEG
Item Description/Default Range
Number Any real or integer number. Default unit is dBm. Varies with FOFFSETand ROFFSET.
Related Commands: LIMIDEL, LIMILINE, LIMIMODE, LIMIREL, SEGDEL, SENTER.
Programming Commands 5-285

LIMISEG Enter Limit-Line Segment for Frequency
Example
10 OUTPUT 718;"IP;SNGLS;CF300MHZ;SPlOOMHZ;RB 3MHZ;"
20 OUTPUT 718;"LIMIDEL;"
30 OUTPUT 718;"LIMIMODE UPPER;"
35 OUTPUT 718;"LIMIFT FRED;"
40 OUTPUT 718;"LIMISEG 250MHZ ,-GODB,FLAT;"
50 OUTPUT 718;"LIMISEG 290MHZ,-60DB,SLOPE;"60 OUTPUT 718;"LIMISEG 295MHZ,-15DB,FLAT;"70 OUTPUT 718;"LIMISEG 305MHZ,-15DB,SLOPE;"80 OUTPUT 718;"LIMISEG 3lOMHZ,-GODB,FLAT;"90 OUTPUT 718;"LIMISEG 910MHZ,-60DB,FLAT;"100 OUTPUT 718;"LIMIMODE LOWER;"
110 OUTPUT 718;"LIMISEG 250MHZ,-75DB,FLAT;"
120 OUTPUT 718;"LIMISEG SlOMHZ,-75DB,FLAT;"130 OUTPUT 718;"LIMITEST 0N;TS;"140 OUTPUT 718;"LIMIFAIL?;"
150 ENTER 718;A160 DISP A170 END
Initializes spectrum an-alyq changes the fre-quency, span, and bandwidth.Deletes the current limit-line table, sets the tabletype to $xed.Spec@es the upper limit-line table.Selects a limit line basedon frequent y.Adds segment to the up-per limit-line table
Specifies the lower limit-line table.Adds segment to the lowerlimit-line table.
Enables limit-line testing.Returns the result of limit-line testing.
Displays the result.
DescriptionIf the current limit line table contains lines based on sweep time (as opposed to a limit linebased on the frequency), executing LIMISEG will clear the current sweep time limit line table,and set LIMIREL to OFF.
Each limit-line segment is specified with a starting frequency, an amplitude, and a segmenttype. The segment type defines how the line segment is to extend from its starting point to thenext segment. The segment types are FLAT, SLOPE, and POINT.
n FLAT draws a zero-slope line between the coordinate point of the current segment and thecoordinate point of the next segment, producing limit-line values equal in amplitude for allfrequencies between the two points. If the amplitude values of the two segments differ, thelimit line will “step” to the value of the second segment.
w SLOPE draws a straight line between the coordinate point of the current segment and thecoordinate point of the next segment, producing limit-line values for all frequencies betweenthe two points.
5-286 Programming Commands

LIMISEG Enter Limit-Line Segment for Frequency
n POINT specifies a limit value for the coordinate point, and no other frequency points, sothat a POINT segment specifies a limit value for a single frequency. For an upper limit line,a POINT segment is indicated by a line drawn from the coordinate point, to a point that isvertically off the top of screen. For a lower limit line, a POINT segment is indicated by a linedrawn from the coordinate point, to a point that is vertically off the bottom of screen. ThePOINT segment type should be used as the last segment in the limit-line table. However, ifthe last segment in the table is not specified as the POINT segment type, an implicit point isused automatically. If a visible POINT segment at the right edge of the display is not desired,add an explicit last point segment (higher in frequency than the stop frequency) to thelimit-line table.
Segments are sorted according to starting frequency. A maximum of 20 segments can bedefined in each of the upper and lower halves of a limit line. When the segment type isomitted, the last type given (or SLOPE if no previous type has been given) is used.
Use LIMISEG if you want to enter amplitude data in the upper or lower limit lines. If youwant to enter amplitude data as upper and lower amplitude pairs or as mid and delta pairs, usethe SENTER command instead of LIMISEG. Use LIMIMODE to specify entry into the upperlimit-line table or the lower limit-line table. (See line 30 of example.)
Programming Commands 5-287

LIMISEGTEnter Limit-Line Segment for Sweep TimeAdds new segments to the current sweep time limit line in either the upper limit line or thelower limit line.
Syntax
LIMISEGT
,- t ime -\
\ us /
g-;
L /
b p r e d e f i n e d v a r i a b l e d
%user-defined variable>
% p r e d e f i n e d F u n c t i o n -J
b t r a c e e l e m e n t d
s e g m e n t,- a m p I i t u d e .-\ / type \
DE/
SLOPE
p--J ..,IY p r e d e f i n e d v a r i a b l e -/
*user-defined variable2
Y p r e d e f i n e d f u n c t i o n 2
Y t r a c e e l e m e n t J
Item Description/Default Rwle
Number Any real or integer number. For the sweep time, the default unit The range of theis seconds. For the amplitude value, the default unit is dBm. sweep time is
0 to 100 s. The rangeof the amplitudevaries with ROFFSET.
Related Commands: LIMIDEL, LIMIFT, LIMILINE, LIMIMODE, LIMIREL, SEGDEL, SENTERT.
5-288 Programming Commands

LIMISEGT Enter Limit-Line Segment for Sweep Time
Example
OUTPUT 718;"LIMIDEL;"
OUTPUT 718;"LIMIMODE UPPER;"OUTPUT 718;"LIMIFT TIME;"OUTPUT 718;"LIMISEGT OMS,-GODB,FLAT;"OUTPUT 718;"LIMISEGT GMS,-GODB,SLOPE;"OUTPUT 718;"LIMISEGT 8MS,-lSDB,FLAT;"OUTPUT 718;"LIMISEGT llMS,-20DB,SLOPE;"OUTPUT 718;"LIMISEGT 14MS,-GODB,FLAT;"OUTPUT 718;"LIMISEGT 20MS,-GODB,POINT;"OUTPUT 718;"LIMIMODE LOWER;"OUTPUT 718;"LIMISEGT OK,-75DB,FLAT;"OUTPUT 718;"LIMISEGT 20MS,-75DB,POINT;"OUTPUT 718;"LIMITEST 0N;TS;"OUTPUT 718;"LIMIFAIL?;"ENTER 718;ADISP A
Deletes the current limit-line table, sets thetable type to jixed.Spec.@es the upper limit-line table.Selects a limit line based on the sweep time.Adds segment to the upper limit-line table.
Specifies the lower limit-line tableAdds segment to the lower limit-line table.
Enubles limit-line testing.Returns the result of limit-line testing.
Displays the result.
DescriptionEach limit-line segment is specified with a starting sweep time, an amplitude, and a segmenttype.
Note If the current limit line table contains limit lines based on frequency (asopposed to a limit line based on the sweep time), executing LIMISEGT willclear the current frequency limit line table, and set LIMIREL to OFF
Starting sweep time: When you specify the starting sweep time, you are specifying thestarting sweep time with respect to the sweep time of the spectrum analyzer. For example, ifyou specify a starting sweep time of 0, the limit-line segment will start at the left side of thespectrum analyzer display.
Segment type: The segment type defines how the line segment is to extend from its startingpoint to the next segment. The segment types are FLAT, SLOPE, and POINT.
n FLAT draws a zero-slope line between the coordinate point of the current segment and thecoordinate point of the next segment, producing limit-line values equal in amplitude for allsweep times between the two points. If the amplitude values of the two segments differ, thelimit line will “step” to the value of the second segment.
w SLOPE draws a straight line between the coordinate point of the current segment and thecoordinate point of the next segment, interpolating amplitude values for all sweep timesbetween the two points.
Programming Commands 5-288

LIMISEGT Enter Limit-Line Segment for Sweep Time
n POINT specifies a limit value for the coordinate point, and no other sweep time points, sothat a POINT segment specifies an amplitude value for a single sweep time. For an upperlimit line, a POINT segment is indicated by a line drawn from the coordinate point, to a pointthat is vertically off the top of the graticule area. For a lower limit line, a POINT segmentis indicated by a line drawn from the coordinate point, to a point that is vertically off the
the limit-line table. However, if the last segment in the table is not specified as the POINT
edge of the display is not desired, add an explicit last point segment to (higher in sweep time
Segments are sorted according to starting sweep time. A maximum of 20 segments can be
Use LIMISEGT if you want to enter amplitude data in the upper or lower limit lines. UseLIMIMODE to specify entry into the upper limit-line table or the lower limit-line table (see line30 of example). If you want to enter amplitude data as upper and lower amplitude pairs or asmid and delta pairs, use the SENTERT command instead of LIMISEGT.
5-280 Programming Commands

LIMITEST Enable Limit Line Testing
LIMITESTEnable Limit Line ‘&stingCompares trace A with the current limit-line data.
Syntax
XLIMITEST
Preset State: LIMITEST OFF.Related Commands: LIMIFAIL, LIMIHI, LIMILO, LIMISEG, LIMISEGT, SENTER, SENTERT.Restrictions: Not available with Analog+ display mode. See “ANLGPLUS” for moreinformation.
Example10 OUTPUT 7l8;"IP;SNGLS;CF300MHZ;SPlOOMHZ;"
20 OUTPUT 718;"LIMIDEL;"
30 OUTPUT 718;"LIMIMODE UPPER;"35 OUTPUT 718;"LIMIFT FREQ;"40 OUTPUT 718;"LIMISEG 250MHZ,-60DB,FLAT;"
50 OUTPUT 718;"LIMISEG 290MHZ,-60DB,SLOPE;"60 OUTPUT 718;"LIMISEG 295MHZ,-lSDB,FLAT;"70 OUTPUT 718;"LIMISEG 305MHZ,-lSDB,SLOPE;"80 OUTPUT 718;"LIMISEG 310MHZ,-GODB,FLAT;"90 OUTPUT 718;"LIMISEG SlOMHZ,-GODB,FLAT;"100 OUTPUT 718;"LIMITEST 0N;TS;"110 OUTPUT 718;"LIMIFAIL?;"
120 ENTER 718;A130 DISP A140 END
Initializes spectrum analyzer andchanges the frequency and spansettings.Deletes any limit-line tables, setsthe table type to jixed.Specifies the upper limit-line table.Selects a limit line based onfrequency.Creates an entry to the upper limit-line table.
Turns on limit-line testing.Returns the status of the limit-linetesting.
Displays the result.
Programming Commands 5.281

LIMITEST Enable Limit Line Testing
DescriptionA test is made of the data in TRA (trace A), and the result can be read, using LIMIFAIL, aftereach sweep.
5-282 Programming Commands

LINFILL Line Fill
LINFILLLine FillFills linear interpolated data into the specified trace data points of a destination trace.
Syntax
9 p r e d e f i n e d v a r i a b l e /
h u s e r - d e f i n e d variable/
b p r e d e f i n e d f u n c t i o n I
b t r a c e e l e m e n t /
n u m b e r o f e l e m e n t s/- \
l n u m b e r/
% p r e d e f i n e d v a r i a b l e /
huser-defined v a r i a b l e /
% p r e d e f i n e d f u n c t i o n I
b t r a c e e l e m e n t J
/$ p r e d e f i n e d v a r i a b l e /
*user-defined v a r i a b l e )
b p r e d e f i n e d f u n c t i o n 1
b t r a c e e l e m e n t /
Programming Commands 5-283

LINFILL Line Fill
Item
User-defined variable
Predefined variable
Predefined function
Trace element
Number
Description/Default R-f&
A variable deEned by VARDEF or ACTDEF Any valid variable name.commands.
A command that acts as a variable. Refer to‘lhble 5-1.Function that returns a value. Refer to ‘lhble5-l.
An element of trace A, trace B, trace C, or auser-defined trace.Any valid integer number. For the starting value or number of
elements, the range of the number is 0 tothe length of the trace minus 1. For theending value, the range is -32,763 to+ 32,767.
ExampleOUTPUT 718;"LINFILL TRC,O,O,O;" Initializes trace C.OUTPUT 718;"MOV TRC[l,lO] ,TRA[l,lOl;" Moves the jirst 10 elements of trace A into
trace C.OUTPUT 718;"LINFILL TRC,l0,40,8000;" Uses the 10th element of trace C as the start-
ing valwq fills trace C elements 11 through 50with the interpolated data, and places end-ing value (8000) into the 50th element of traceC.
DescriptionLINFILL uses the value of the starting value and the ending value to calculate the linearinterpolation data (the values for ending value should be in measurement units). The “numberof elements” field allows you to specify the number trace data points that are “filled in” withlinear interpolation data. The number of elements field includes the starting element, so if thestarting value is 10 and the number of elements is 40, the ending element will be 50.
The data will not be interpolated if the starting value is 0. If the starting value is 0, the endingvalue is copied into the first element of the destination trace. You may want to set the startingvalue to 0 to initialize a trace before using LINFILL to fill the trace with interpolated data. Ifthe starting value and the number of elements exceed the length of the destination trace, theinterpolation ends at the end of the trace array; the ending value is never reached.
5.284 Programming Commands

LN Linear Scale
LNLinear ScaleSpecifies the vertical graticule divisions as linear units, without changing the reference level.
Syntax
( LN
Equivalent Softkey: SXLE LOG LIN (when LIN is underlined).Related Commands: LG, RL.
Example
OUTPUT 718*"LN*"OUTPUT 718;"LN;RL 30MV;"
Selects linear mode.
DescriptionThe LN command scales the amplitude (vertical graticule divisions) proportionally to the inputvoltage, without changing the reference level. The bottom graticule line represents a signallevel of zero volts.
Voltage entries are rounded to the nearest 0.1 dB. Thus, 30.16 mV becomes - 17.4 dBm for a5OB spectrum analyzer system.
Programming Commands 5-295

LOADLoadLoads a file from the memory card.
Syntax
r f i l e n a m e 7
L O A D del i m i t e r c h a r a c t e r del Imi ter
f-/
r t r a c e d e s t i n a t i o n
u s e r - d e f i n e d t r a c e
\ J XLOAD
Item Description/Default R=t3e
Character Any valid character. Any valid file name.
Delimiter Matching characters marking the beginning and end of the list of - ) \ @ = / ^ $ % ; ! ’ :spectrum analyzer commands. ” &
Equivalent Softkey: LOAII FILE.Option Required: An HP 859OL or HP 8592L needs to have Option 003 installed in thespectrum analyzer to use the LOAD command to load a file from the memory card.Related Commands: CAT, STOR.
Example
OUTPUT 7 18 ; “LOAD %tMYTRA% ,TRA ; ” Loads MYTRA from the memory card into trace A.OUTPUT 718 ; “LOAD %dM-YPROG% ; ” Loads a program from the memory card into spec-
trum aruzl~zer memory.
DescriptionBe sure to insert the memory card into the spectrum analyzer’s memory card reader beforeusing the LOAD command.
lb use the LOAD command, you must specify the file name of the file to be loaded from thememory card into spectrum analyzer memory, and, if you are loading trace data, you must alsospecify the trace destination.
5-296 Programming Commands

LOAD Load
File name: You must supply the file name of the file to be loaded. When specifying the filename, be sure to include the lowercase letter that indicates the data type, because the resultof the LOAD operation is dependent on the data type. (For example, the “d” in “dM-YPROG”indicates the file type is for a downloadable program.) The lowercase letters correspond to thedata type as shown in the following table.
File DescriptionI
ResultI
a Amplitude correction Loads the amplitude correction factors.factors I
i Display image file Loads and displays the display image file.
d Downloadable Loads the contents of the file that was stored with STOR. Becauseprogram STOR stores a copy of user-memory in the file, more than one item
may be retrieved when executing the LOAD command.
I 1 I Limit lines I Loads the limit-line values into the current limit-line table. I
Loads the spectrum analyzer state, and changes the current spectrumanalyzer state to the state that was loaded.
ItJT.race 1 Loads the trace and state. The current spectrum analyzer trace andstate is changed to the trace and state that was loaded.
Destination: When recalling trace data, you need to specify either TRA, TRB, TRC, ora user-defined trace as the destination. Omit the destination parameter when recallingdownloadable programs, states, limit-line tables, display image files, or amplitude correctionfactors.
Note The LOAD command recalls data from the memory card. See “SAVRCLN, n“RCLT, ” or “RCLS” to recall data from spectrum analyzer memory.
Programming Commands 5-297

LOGLogarithm‘E&es the logarithm (base 10) of the source, multiplies the result by the scaling factor, thenstores it in the destination.
Syntax
b u s e r - d e f i n e d t r a c e /
b t r a c e r a n g e /
% p r e d e f i n e d v a r i a b l e I
u s e r - d e f i n e d variable/
- s c a l i n g f a c t o r
M p r e d e f i n e d varic
u s e r - d e f i n e d v a r i a b l e )
p r e d e f i n e d v a r i a b l e
u s e r - d e f i n e d v a r i a b l e
p r e d e f i n e d f u n c t i o n
XLOG
Item Description/Default
User-defined trace A trace defined by the TRDEF command.User-defined variable A variable defined by VARDEF or ACTDEF commands.
tinge
Any valid trace name.
Any valid variablename.
Predefined variable
Predefined function
Trace range
Trace element
Number
A command that acts as a variable. Refer to Table 5-l.
Function that returns a value. Refer to Table 5-1.A segment of trace A, trace B, trace C, or a user-defined trace.
An element of trace A, trace B, trace C, or a user-defined trace.
Any real or integer number. Real number range.
5-298 Programming Commands

LOG Logarithm
Prerequisite Commands: TRDEF when using a user-defined trace. ACTDEF or VARDEF whenusing a user-defined variable. TS when using trace data.Related Commands: EXP.
Example 1
OUTPUT 718~"IP~"OUTPUT 718;"VAIiDEF P,OWER,O;"
Initializes spectrum analyzerDt$nes a user-de$ned variable, called P-OWE& and setsit equal to 0.
OUTPUT 718;"LOG P,OWER,S,lO;" P-OWER = 10x LOG(5)OUTPUT 718;"P,OWER?;" Returns value to computer:ENTER 718;N Assigns value to computer variable.DISP USING "D.DD,K";N;" dB" Displays value on the computer screen.
Example 2This example finds the natural exponential of a number and uses the LOG function to returnthe original source value of the EXP function.
10 OUTPUT 718;"VARDEF E-XP,O;"20 OUTPUT 718;"EXP E,XP,2,2.30259;"30 OUTPUT 718;"E_XP?;"40 ENTER 718;Value50 PRINT Value60 OUTPUT 718;"LOG EmXP,E-XP,2.30259;"
70 OUTPUT 718*"E XP'.", - *,
80 ENTER 718;Logvalue90 PRINT Logvalue100 OUTPUT 718;"VARDEF E-XPY,O;"110 OUTPUT 718;"EXP E,XPY,-5,2.30259;"120 OUTPUT 718;"E_XPY?;"
130 ENTER 718;Value2140 PRINT Value2150 OUTPUT 718;"LOG E-XPY,E-XPY,2.30259;"
160 OUTPUT 718;"E,XPY?;"
170 ENTER 718;Logval180 PRINT Logval190 END
Dt$lnes a variable called E-XI!Fino!s the natural exponential of 2.Returns the natural exponential of 2.
I?+& the value of the exponential.Uses the log function on the exponentialvalue.The log of the exponential value is ap-proximately 2.
Declares a variable called E-XPk:Finds the natural exponential of -5.Returns the value of the natural exponen-tial of -5.
FVints the value of the exponential.Uses the log fan&ion on the exponentialvalue.The log of the exponential value is ap-proximately -5.
Programming Commands 5-299

LOG Logarithm
DescriptionThe scaling factor may be used to improve numerical computations when calculating logarithmsof integer trace data. For example, the log of a trace value of 8000 is 3.9, which would bestored as the value 4 in a trace.
The log of trace value of 1 is 0, so the log of a trace containing values from 1 to 8000 wouldbe compressed to values 0, 1, 2, 3, 4. Computational accuracy can be improved by using thescaling factor to scale up the log values before they are stored. In this case, because 3.903 isthe log of 8000 and the largest positive trace value is 32,767, a scaling factor of 32,767 dividedby 3.903 or 8,395 may be applied to the data. Because EXP and LOG are inverse functions, theEXP command has a scaling factor that may be used to “undo” the scaling factor of the LOGcommand.
The LOG command can be used to calculate the natural logarithm by using 2.30259 as thescaling factor.
The LOG function returns an invalid result if the source is zero or a negative number.
When the source is longer than the destination, the source is truncated to fit. When the sourceis shorter than the destination, the last element is repeated to fill the destination.
5-300 Programming Commands

LSPAN Last Span
LSPANLast SpanChanges the spectrum analyzer’s span to the previous span setting.
Syntax
LSPAN
Equivalent Softkey: LAST SPAN .Related Commands: SF!
ExampleOUTPUT 718;"LSPAN;"
Programming Commands 5-301

MDSMeasurement Data SizeSpecifies measurement data size as byte or word.
Syntax
cRelated Commands: MKA, TDF, TRA.Preset State: W.
ExampleThese commands transfer trace A in binary, 2 bytes per word.
INTEGER TRACE-A (1:401) Declares variable, Trace-A.OUTPUT 718;"SNGLS;TS;" Activates single-sweep, updates trace A.OUTPUT 718;"TDF B;MDS W;TRA?;" Reads trace A in “word” form&.ENTER 7 18 USING 'I#, 40 1 ( W) II ; TRACE-A (* > Fbmu~ts trace A output using data size of one
word.PRINT TRACE-A(*) Prints trace A.
DescriptionThe MDS command formats binary data in one of the following formats:
B selects a data size of one 8-bit byte. When transferring trace data, MDS B transfers tracedata the faster than MDS W because only 401 bytes are transferred. Because MDS Bcombines two bytes into one byte, some resolution is lost.
W selects a data size of one word, which is two 8-bit bytes. When transferring trace data,MDS W transfers 802 bytes of trace data with no loss of resolution.
How data is represented with MDS W: When data is sent with MDS W, the trace data isconverted into two bytes as follows:
1. The trace element’s amplitude (in measurement units) is divided by 256. The binaryrepresentation of the result is placed in the most significant byte (MSB).
2. The binary representation of the remainder is placed in the least significant byte (LSB).
For example, a trace element that is at the reference level has the value of 8000 (inmeasurement units). The result of 8000 divided by 256 is 30, with a remainder of 120. For thisdata, the contents of the MSB would contain the binary representation for 30.
Contents of the MSB
0 OlOllll 1 110
5-302 Programming Commands

MDS Measurement Data Size
For this data, the contents of the LSB would contain the binary representation for 120.
Contents of the LSB
0 1 1 1 0 0 1 0
How data is represented with MDS B: When data is sent with MDS B, the trace data isconverted into one byte as follows:
H The trace element’s amplitude (in measurement units) is divided by 32. The binaryrepresentation of the result is placed into one byte.
For example, a trace element that is at the reference level has the value of 8000 (inmeasurement units). The result of 8000 divided by 32 is 250. For this data, the contents of thebyte would contain the binary representation for 250.
Contents of Byte
1 1 1 1 1 0 1 0
See “TDF” for information about using MDS for trace data transfers.
Query Response:
o u t p u tl t e r m i n a t i o n ---*
Programming Commands 5-303

MDUMeasurement Data UnitsReturns values for the spectrum analyzer baseline and reference level.
Syntax
Related Commands: TDF.
Example10 OUTPUT 718;"IP;TDF M;"
20 OUTPUT 718;"RL -1ODM;"30 OUTPUT 718*"MDU'*" *9 ,
40 ENTER 718;A,B,C,D,A$50 PRINT A,B,C,D,A$60 END
Initializes the spectrum analyzer and formats the trace datain measurenxent units.Changes the refwertce level to -10 dBm.Queries the position of the spectrum analyzer baseline andreference level.Moves the spectrum analyzer response to the computerDisplays the results on the computer screen.
The example returns the following to the controller: 0, 200, -90, -10 dBm. The first twonumbers received indicate that the vertical scale spans from 0 to 200 plotter units. The thirdand fourth number received indicate that the baseline is at -90 dBm, and the reference level isat -10 dBm. So, the baseline value of -90 dBm is equal to 0 plotter units. The reference levelof -10 dBm is equal to 200 plotter units.
DescriptionThe MDU command returns values for the spectrum analyzer baseline and reference level, inplotter units and measurement units.
5304 Programming Commands

MDU Measurement Data Units
Query Response
base1 i n e r e f e r e n c e bosel i n e r e f e r e n c e
QMDU
Programming Commands 5-305

MEANTrace MeanReturns the mean value of the given trace in measurement units.
Syntax
MEAN
,- s o u r c e -\
F
PreZef inedf u n c t i o n p a t h o n l y
b u s e r - d e f i n e d t r a c e /
Item Description/Default RangeUser-defined trace A trace defined by the TRDEF command Any valid trace name.Trace Range A segment of trace A, trace B, trace C, or a user-defined trace.
Prerequisite Commands: TRDEF when using a user-defined trace. TS when using trace data.Related Commands: MEANTH, RMS, STDEV, VARIANCE.
Example
10 OUTPUT 718;"IP;"20 OUTPUT 718*"SNGLS-"
Initializes spectrum analyzer
30 OUTPUT 718;"CF 30;MHZ;SP IMHZ;"Activates the single-sweep mode.Sets measurement range.
40 OUTPUT 718;"TS;" Sweeps trace A.50 OUTPUT 718;"MEAN TRA?;" Returns the mean value of trace A to the computer:60 ENTER 718;Number Assigns value to computer variable, Number70 DISP "MEAN OF TRACE A IS '-, Number Displays result on the computer screen.80 END
Query Response
5-306 Programming Commands
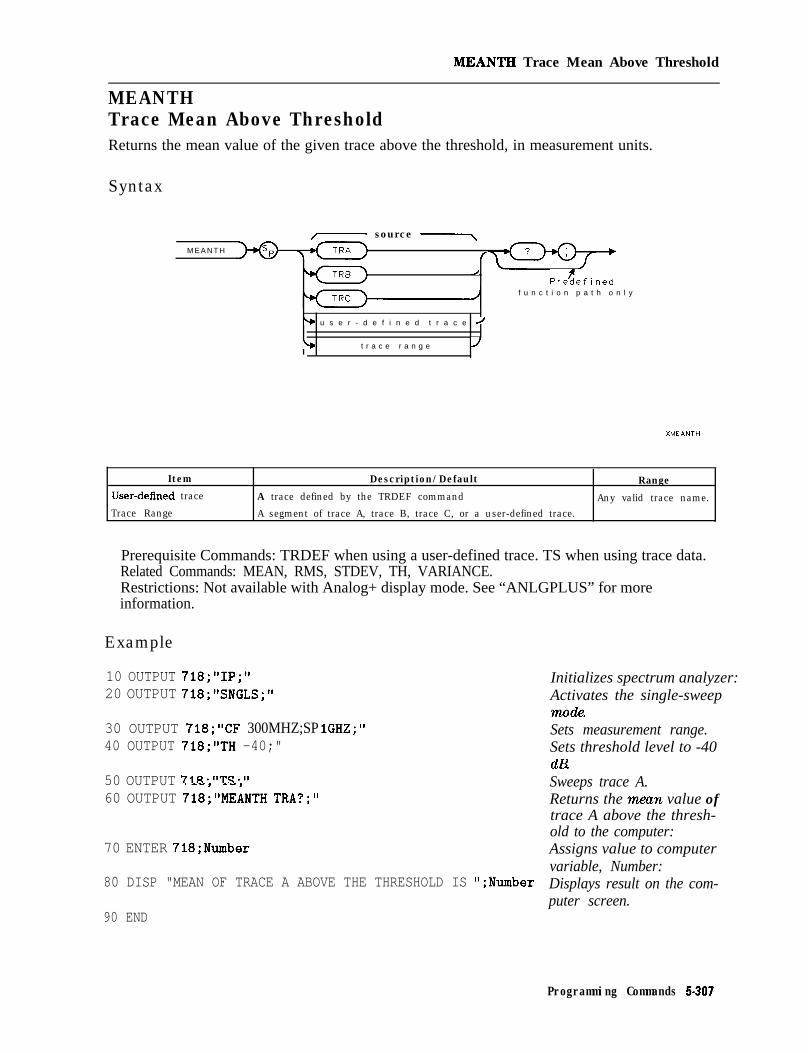
MEANTEI Trace Mean Above Threshold
MEANTHTrace Mean Above ThresholdReturns the mean value of the given trace above the threshold, in measurement units.
Syntax
M E A N T H
,-- source -,
fb
/Pretef ined
f u n c t i o n p a t h o n l y
$ u s e r - d e f i n e d t r a c e /
b t r a c e r a n g e /
Item Description/Default
User-dellned trace A trace defined by the TRDEF command
Trace Range A segment of trace A, trace B, trace C, or a user-defined trace.
Range
Any valid trace name.
Prerequisite Commands: TRDEF when using a user-defined trace. TS when using trace data.Related Commands: MEAN, RMS, STDEV, TH, VARIANCE.Restrictions: Not available with Analog+ display mode. See “ANLGPLUS” for moreinformation.
Example
10 OUTPUT 718;"IP;"20 OUTPUT 718;"SNGLS;"
30 OUTPUT 718;"CF 300MHZ;SP IGHZ;"40 OUTPUT 718;"TH -40;"
50 OUTPUT 718*"TS*"60 OUTPUT 718;"MEiNTH TRA?;"
70 ENTER 718;Number
80 DISP "MEAN OF TRACE A ABOVE THE THRESHOLD IS ";Number
Initializes spectrum analyzer:Activates the single-sweepmode.Sets measurement range.Sets threshold level to -40dRSweeps trace A.Returns the mean value oftrace A above the thresh-old to the computer:Assigns value to computervariable, Number:Displays result on the com-
90 ENDputer screen.
Programming Commands 5-307

MEANTH Trace Mean Above Threshold
DescriptionMEANTH returns the mean value of the trace above the threshold; MEAN returns the meanvalue of the trace, regardless of the threshold level. MEANTH returns a “0” if there is not asignal above the threshold.
Use TH (threshold) to set the threshold level.
Query Response
o u t p u tt e r m i n a t i o n --+
5.308 Programming Commands

MEASOFF’ Measurement Off
MEASOFFMeasurement OffTurns off the current measurement, erases the display, and then displays the MEAS/USERmenu.
Syntax
Equivalent Softkey: MEBS OFF .Related Commands: ACP, ACPE, ACPGRAPH, CHP, OBW.
Example
OUTPUT 718;"MEASOFF;" lbns ofl the current measurement.
DescriptionIf ACPPAR is set to automatic, executing MEASOFF returns the following spectrum analyzersettings back to their premeasurement settings:
H Frequency span, resolution bandwidth, video bandwidth, center frequency step size, andsweep time.
n Detector mode.
n Amplitude scale.
MEASOFF does not do any of the following:
n Change the values of the channel spacing (ACPSP) or the channel bandwidth (ACPBW).
n Restore the trace contents, trigger mode, amplitude units, and any trace math functions (see‘l%ble 5-4 for a list of the trace math functions) to their premeasurement state.
You should execute MEASOFF when you no longer want to use any of the power menufunctions. (The power menu functions are ACP, ACPE, ACPGRAPH, CHP, and OBW).
MEASOFF may also turn off some other spectrum analyzer measurements. For example,MEASOFF also turns off FFTCONTS, FFTAUTO, FFTSNGLS, NDBPNT, PCTAM, GDRVUTIL, andTOI.
Programming Commands 5-309

MEASUREMeasure ModeDetermines what kind of measurements the spectrum analyzer makes: signal analysis, stimulusresponse, or signal normalization.
Syntax
XMEASURE
Option Required: Option 010 or 011.Related Commands: Commands affecting amplitude, such as AUNITS, DL, INZ, LN, MKA,MKREAD, MKRL, RL, RLPOS, ROFFSET, TH.Preset State: MEASURE SA.
ExampleActivate the tracking-generator source output.
OUTPUT 718;"MEASURE SR;" Sets spectrum anul~z43r to stimulus-response mode.OUTPUT 718;"SRCPWR -1ODM;" Makes the tracking generator source power the active
function.
Description
“MEASURE SA;” activates spectrum analysis and auto couples the spectrum analyzerfunctions. If AMB ON or AMBPL ON and RLPOS have been executed prior to MEASURE SA,MEASURE SA turns off the reference level position. When normalization is off, all amplitudeunits are specified in absolute values determined by:
n Amplitude units (AUNITS).n Reference level (RL).n Reference-level offset (ROFFSET).n Input impedance (INZ).n Logarithm scale (LG).n Linear scale (LN).w Amplitude Correction (AMPCOR).
“MEASURE SR;” activates stimulus-response measurements and uncouples the sweep timefor faster sweep times. If AMB ON or AMBPL ON and RLPOS are executed, MEASURE SRactivates the reference level position. When normalization is used, amplitude units arespecified relative to the display level.
5-310 Programming Commands

MEASURE Measure Mode
During this relative-amplitude mode, the following parameters are in dB:
n Trace data (TRA, TRB, TRC).w Display line (DL).n Threshold (TH).n Marker amplitude (MKA).
“MEASURE NRM;” recouples the sweep time for accurate signal analysis measurements. IfAMB ON or AMBPL ON and RLPOS are executed, MEASURE NRM activates the referencelevel position.
See “RLPOS” for more information about changing the reference level position.
When used as a predefined variable, MEASURE returns a value depending on the setting of theMEASURE parameter.
Query Response
Programming Commands 5-311

MEMMemory AvailableReturns the amount of spectrum analyzer memory available.
Syntax
f u n c t i o n p a t h o n l y
XMEM
Related Commands: ACTDEF, DISPOSE, ERASE, FUNCDEF, LOAD, ONDELAY, ONEOS,ONTIME, ONSRQ, ONSWP, TRCMEM, TRDEF, TRMATH, VARDEF.
Example10 OUTPUT 718*"MEM'*"20 ENTER 718;iow-m;:h-memory
Queries the amount of user-allotted memory available.Sends response from spectrum analyzer to the computer.
30 DISP How-much-memory40 END
Displays the amount of available memory.
DescriptionFunctions that affect the amount of user-allotted memory include: ACTDEF, FUNCDEF,ONDELAY, ONEOS, ONSRQ, ONSWP, ONTIME, TRDEF, TRMATH, VARDEF.
The MEM command returns the number of bytes of user-allotted spectrum analyzer memory tothe controller.
Query Response
5-312 Programming Commands

MENU Menu
MENUMenuSelects and displays the softkey menus on the spectrum analyzer screen.
Syntax
MENU
Item Description/Default Range
Number Any valid integer number. 1, 101 to 200.
Related Commands: DISPOSE, ERASE, KEYDEF, KEYLBL, SAVEMENU.
Example 1OUTPUT 718;"MENU 1;" Displays menu 1 on the spectrum analyzer screen.
Example 2
10 OUTPUT 718;"KEYDEF l,!IP;CF 300MHZ;SP IOOMHZ;MKPK HI;!,OSETUPI#l@;"20 OUTPUT 718;"KEYDEF 2,!IP;CF 600MHZ;SP 1OOMHZ;MKPK HI;!OSETUPl#20;"30 OUTPUT 718;"KEYDEF 3,!IP;CF 900MHZ;SP IOOMHZ;MKPK HI;!,QSETUPI#3@;"40 OUTPUT 718;"KEYDEF 4,!SNGLS;TS;MKPKHI;MKD;MKMIN;!,OFINDIDELTAO;"50 OUTPUT 718;"KEYDEF 5,!MKOFF ALL;CONTS;!,ORESUMElSWEEPO;"60 OUTPUT 718;"KEYDEF G,!MENU 102! ,OMOREISETUPSQ;"70 OUTPUT 718;"KEYDEF 607,!FA 88MHZ;FB 108MHZ;MKPK HI;DEMOD ON;DEMOD FM;MENU ~;!,QFM IDEMOD(P;~~
80 OUTPUT 718;"KEYDEF 608,!FA 10KHZ;FB 88MHZ;MKPK HI;DEMOD ~N;DEMOD AM;MENU 1; !,OAM IDEMoD@;”
[email protected] sojtkey 1.
D&ws soBkey 2.
[email protected] soj%key 3.
Defines sofikey 4.
Dynes sofi ke y 5.
Lk@tes sojtkey 6.L3@nes so$key 607. So&key 607 is accessed by exe-cuting MENU 102 (see pro-gramming line 60).D@ues sofikey 608. Sofi-key 608 is accessed by exe-cuting MENU 102 (see pro-gramming line 60).
Programming Commands 5.313

MENU Menu
DescriptionWhen using the KEYDEF, KEYENH, or KEYCMD commands, you need to specify the softkeynumber. The softkey number corresponds to the menu number as follows:
softkey number = (menu number - 1) x 6 + softkey position(The softkey position range is 1 through 6.)
For example:
Menu 1 contains softkey numbers 1 through 6Menu 101 contains softkey numbers 601 to 606Menu 200 contains softkey numbers 1195 to 1200
Menu 1 can be accessed by pressing C-J, User IIenus . Menus 101 through 200, as wellas menu 1, can be accessed using the MENU command. The MENU command is a useful wayto “link” softkey menus together. For example, example 2 shows how menu 1 (with softkeys1 through 6) can be used to access menu 102 (with softkeys 607 and 608). Menu 1 can be
v I
accessed by pressing c-1, User Minus .
MENU 1 M E N U 1 0 2
S o f t k e y s1 t h r o u g h 6 F IND DELTA
RESUME SWEEP
MORE SETUPS --+
-
\FM DEMOD
AM DEMOD \
S o f t k e y s6 0 7 t h r o u g h 6 1 2
///
cull8e
Figure 5-7. Using the MENU Command
The menu numbers 1 and 101 through 200 are the recommended menus available for the userto use.
Executing “MENU 0;” clears the softkey menu from the spectrum analyzer screen.
Query Response
5-314 Programming Commands

MERGE Merge Two Traces
MERGEMerge Two TracesMerges the source trace into the specified area of the destination trace.
Syntax
y- d e s t i n a t i o n t r a c e
b u s e r - d e f i n e d t r a c e /
r d e s t i n a t i o n s t a r t 7
/
h p r e d e f i n e d v a r i a b l e /
b u s e r - d e f i n e d vorioble)
b p r e d e f i n e d f u n c t i o n M’
L trace element /
r d e s t i n a t i o n e n d 7
+ n u m b e r/
* p r e d e f i n e d v a r i a b l e 1
buuser-defined variable)
b p r e d e f i n e d f u n c t i o n /
G t r a c e element /
p r e d e f i n e d v a r i a b l e I
buuser-defined vorioblel
u s e r - d e f i n e d t r a c e
t r a c e r a n g e
b p r e d e f i n e d f u n c t i o n /
t r a c e e l e m e n t
Item
User-defined variable
Predeilned variable A command that acts as a variable. Refer to able 5-1.
PredeEned function Function that returns a value. Refer to Table 5-1.
Trace element An element of trace A, trace B, trace C, or a user-defined trace.Number Any valid integer number.
Description/Default
A variable defined by VARDEF or ACTDEF commands.
R=v3eAny valid variablename.
-32,768 to + 32,767.
Related Commands: All other trace math commands. See lkble 5-4 for a list of trace mathcommands.
Programming Commands 5-3 15

MERGE Merge Two Traces
Example
OUTPUT 718;"MERGE TRC,l,200,TRA,200;" Merges trace A into trace C. The trace Aelements 200 through 399 are merged intotrace C elements 1 through 200.
DescriptionMERGE copies the trace data from the source trace, starting at the specified trace element, intothe specified trace elements of the destination trace. MERGE differs from CONCAT becauseMERGE does not need the trace range of the source to be specified. If the source is not atrace, its value is copied to the destination trace. If the destination segment is longer than thespecified source segment, the last element of the source trace is repeated to fill the destination.
5-316 Programming Commands

MF’ Marker Frequency Output
MFMarker Frequency OutputReturns the frequency (or time) of the on-screen active marker.
Syntax
XMF
Related Commands: MA, MKA, MKCF, MKD, MKF, MKN, MKPK, MKREAD.
ExampleConnect CAL OUT to the spectrum analyzer input.
OUTPUT 718;"IP;SNGLS;" Initializes the spectrum analy~ activates single-sweep mode.
OUTPUT 718;"FA 280MHZ;FB 320MHZ;TS;" Sets up the measurement range.OUTPUT 718;"MKN;MKPK HI;" Places marker on peak of calibrator signal.OUTPUT 718;"MF;" Rzkesfrequency of marker:ENTER 718;A Returns frequency to the computer:PRINT A Prints the frequency on the computer screen.
DescriptionThe MF command returns the frequency of the active marker to the controller if the markeris on screen. In delta marker mode, nonzero span, “MF;” returns the frequency differencebetween the two markers. In zero span, “MF;” returns the marker time, or the delta markertime.
The data that is returned by “MF;” depends on many command conditions including TDF,MKREAD, and MDS.
If the trace data format P is used with MF, the result is one real value in time units orfrequency units, depending on the marker readout format. (See “MKREAD.“)
Example 1
OUTPUT 718;"TDF P;MKREAD FRCj;MF;" This returns a frequency value (in Hz) if not inzero-span.
OUTPUT 718;"TDF P;MKREAD FRQ;MF;" This returns a time value (in seconds) if in zero-span.
OUTPUT 718;"TDF P;MKREAD PER;MF;" This returns the time value (in seconds) of l/(markerfrequency).
OUTPUT 718;"TDF P;MKREAD SWT;MF;" This returns the marker time value (in seconds).OUTPUT 718;"TDF P;MKREAD 1ST;MF;" This returns thefrequency value (in Hz)for l/(marker
time).OUTPUT 718;"TDF P;MKREAD FFT;MF;" This returns the frequency value (in Hz).
If the trace data format is used with trace data format A, the result depends on the setting ofthe MDS command.
Programming Commands 5-317

MF Marker Frequency Output
Example 2
OUTPUT 718;"TDF A;MDS B;MF;" Returns one byte representing the marker position. Thebyte can assume values 1 to 101.
OUTPUT 718;"TDF A;MDS W;MF;" Returns two bytes in a binary word format that has avalue from 1 to 401.
If the trace data format is used with trace data format M, the result is the marker horizontalposition value, from 1 to 401, in ASCII.
Example 3OUTPUT 7 18 ; "TDF M ; MF ; ” Returns marker horizontal position value in ASCII.
5-318 Programming Commands

MIN Minimum
MINMinimumCompares source 1 and 2, point by point, and stores the lesser of the two in the destination.
Syntax
- d e s t inot i o n
% u s e r - d e f i n e d t r a c e /
b t r a c e range /
b p r e d e f i n e d v a r i a b l e I
u s e r - d e f i n e d variable/
Item
User-defined trace
User-defined variable
Description/Default
A trace defined by the TRDEF command.
A variable defined by VARDEF or ACTDEF commands.
Range
Any valid trace name.
Any valid variablename.
Predefined variable A command that acts as a variable. Refer to Table 5-l.
Predetied function Function that returns a value. Refer to Table 5-l.
Trace range A segment of trace A, trace B, trace C, or a user-defined trace.
Number Any real or integer number. Real number range.
Prerequisite Commands: TRDEF when using a user-defined trace. ACTDEF or VARDEF whenusing a user-defined variable. TS when using trace data.Related Commands: MINPOS, MXM, TS.
Programming Commands 5-319

MIN Minimum
Example
10 OUTPUT 718;"IP;"20 OUTPUT 718*"SNGLS*"30 OUTPUT 718;"VARDEi M,INIMUM,O;"40 OUTPUT 718;"TS;MKPK HI;";
50 OUTPUT 718;"MIN M-INIMUM,MKA,-20;";
60 OUTPUT 718;"M,INIMUM?;"70 ENTER 718;Number
80 DISP Number90 END
Description
Initializes spectrum analyzer:Activates the single-sweep mode.&y%.es vam’able with an initial value of 0.Sweeps trace A and places the marker at thehighest peak.Compares the marker amplitude to -20 dBm.Stores the lesser of the two in MINIMUM.Returns the result to the computer:Puts the result in the computer variable,Number:LXsplays the result.
If one of the sources is a single value, it acts as a threshold, and all values equal to or less thanthe threshold pass to the destination. The values larger than the threshold are replaced by thethreshold value in the destination.
When the source is longer than the destination, the source is truncated to fit. When the sourceis shorter than the destination, the last element is repeated to fill the destination.
5-320 Programming Commands

MINH Minimum Hold
MINHMinimum HoldUpdates trace C with the minimum level detected.
Syntax
MINH
Equivalent Softkey: MII? HOLD C .Related Commands: BLANK, CLRW, MXMH, VAVG, VIEW.Restrictions: Not available with Analog+ display mode. See “ANLGPLUS” for moreinformation.
Example
OUTPUT 718;"CLRW TRC;CONTS;" Clears trace C and begin taking data.OUTPUT 718;"MINH TRC;" Updates trace C with the minimum level detected.
DescriptionMINH updates trace C with a new value from a detector only if the new value is smaller thanthe previous trace data value.
Programming Commands 5-321
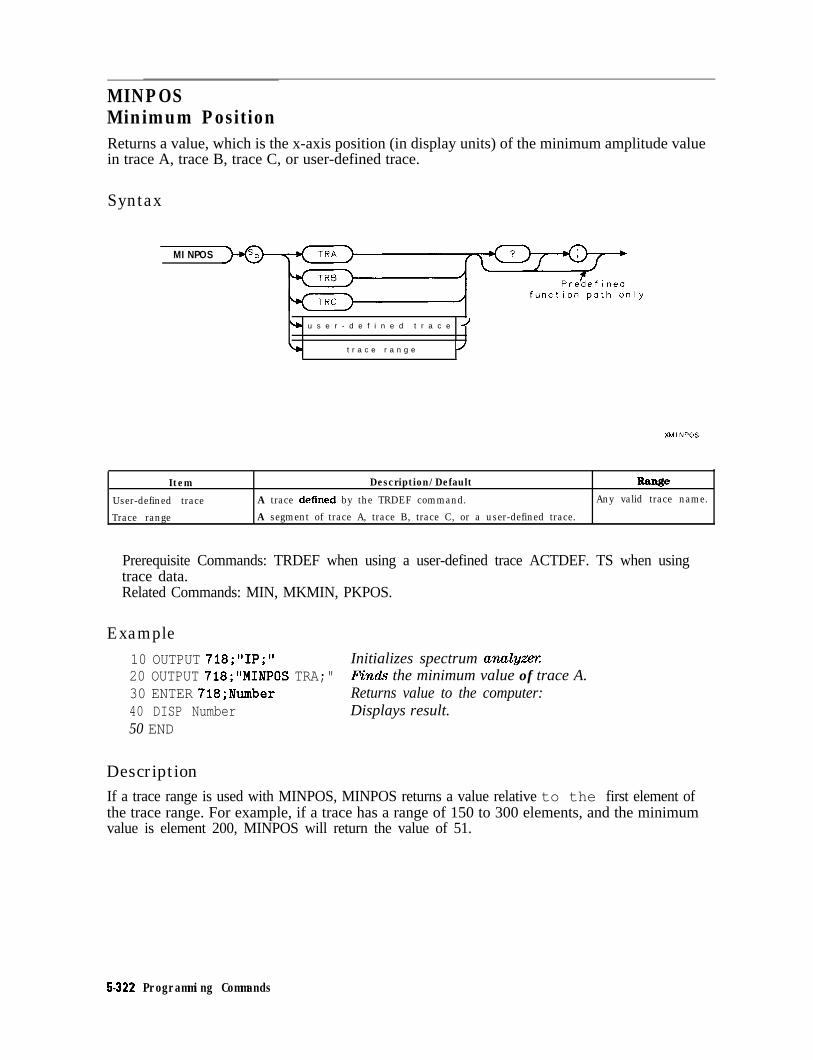
MINPOSMinimum PositionReturns a value, which is the x-axis position (in display units) of the minimum amplitude valuein trace A, trace B, trace C, or user-defined trace.
Syntax
MI NPOS
b u s e r - d e f i n e d t r a c e I
L t r a c e r a n g e /
XMINPOS
Item Description/Default Range
User-defined trace A trace defined by the TRDEF command. Any valid trace name.
Trace range A segment of trace A, trace B, trace C, or a user-defined trace.
Prerequisite Commands: TRDEF when using a user-defined trace ACTDEF. TS when usingtrace data.Related Commands: MIN, MKMIN, PKPOS.
Example10 OUTPUT 718;"IP;" Initializes spectrum analyztx20 OUTPUT 718;"MINPOS TRA;" Finds the minimum value of trace A.30 ENTER 718;Number Returns value to the computer:40 DISP Number Displays result.50 END
DescriptionIf a trace range is used with MINPOS, MINPOS returns a value relative to the first element ofthe trace range. For example, if a trace has a range of 150 to 300 elements, and the minimumvalue is element 200, MINPOS will return the value of 51.
5422 Programming Commands

MIRROR Mirror Image
MIRRORMirror ImageDisplays the mirror image of the trace.
Syntax
M I RROR
r d e s t i n a t i o n t r a c e
b u s e r - d e f i n e d t r a c e /
b t r a c e range /
- s o u r c e t r a c e
u s e r - d e f i n e d t r a c e
Item Description/Default
User-defined trace A trace defined by the TRDEF command.
Trace range A segment of trace A, trace B, trace C, or a user-defined trace.
Range
Any valid trace name.
Prerequisite Commands: TRDEF when using a user-defined trace. TS when using trace data.
Example
10 OUTPUT 718;“IP;”20 OUTPUT 718;“SNGLS;”30 OUTPUT 718;“TS;”40 OUTPUT 718;“BLANK TRA;”50 OUTPUT 718;“MIRROR TRB,TRA;”60 OUTPUT 718;“VIEW TRB;”70 END
Initializes spectrum analyzerActivates the single-sweep mode.Zzkes sweep.Blanks trace A from spectrum analyzer screen.Moves the mirror image of trace A into trace BDisplays the result.
Programming Commands 5-323

MIRROR Mirror Image
DescriptionThe MIRROR command stores the mirror image (with respect to the frequency axis) of a sourcetrace in a destination trace.
When the source is longer than the destination, the source is truncated to fit. When the sourceis shorter than the destination, the last element is repeated to fill the destination.
5-324 Programming Commands

MKA Marker Amplitude
MKAMarker AmplitudeSpecifies the amplitude of the active marker in the current amplitude units when marker typeis of fixed or amplitude type. When queried, MKA returns the marker amplitude independentof marker type.
Syntax
MKA
ompl i t u d e
XMKA
Item Description/Default R-fxe
Number Any real or integer number. Unit is current amplitude type. Amplitude range ofspectrum analyzer.
Step Increment: by 1 dB.Related Commands: AUNITS, AUTO, MA, MKD, MKN, MKTYPE, TDF.
Example
OUTPUT 718*"IP*"OUTPUT 718;"MK;YPE AMP;"
Initializes the spectrum analyzexChanges the marker type to amplitude.
OUTPUT 718;"MKA -50;" Places the marker at -50 dBm.
DescriptionThe MKA command specifies the amplitude of the active marker in current units when themarker is the fixed or amplitude type (see “MKTYPE”). If both the delta marker and activemarker are on the screen, “MKA?;” returns the amplitude difference between the two markers.Specifying the marker amplitude moves the marker to the point of the trace closest to thegiven marker amplitude.
If the trace data format P (TDF P), is used with MKA, the result is one real value in the currentamplitude units (AUNITS can be used to change the current amplitude units).
Programming Commands 5-325

MKA Marker Amplitude
Example
OUTPUT 718;"TDF P;AUNITS DBM;MKA?;" This returns the amplitude value of the marker(amplitude unit is dBm).
If the trace data format is used with trace data format A, the result depends on the setting ofthe MDS command.
Example
OUTPUT 718;"TDF A;MDS B;MKA?;" Returns one byte representing the marker verticalposition (-32,768 to 32,767) divided by 32 and thenAhDed with 255.
OUTPUT 718;"TDF A;MDS H;MKA?;" Returns two bytes in a binary word format that hasa value from -32,768 to 32,767. The value representsthe binary trace amplitude value.
Using the trace data format I is equivalent to the TDF A format. If the trace data format isused with trace data format M, the result is returned in ASCII measurement units (-32,768 to32,767).
ExampleOUTPUT 718;"TDF M;MKA?;" Returns one vertical position value in measurement units.
Query Response
5-326 Programming Commands

MKACT Activate Marker
MKACTActivate MarkerSpecifies the active marker.
Syntax
m a r k e r
Item I Description/Default Range
Number Any valid integer. Default value is 1. 1 to 4.
Equivalent Softkey: SELECT I 2 3 4 .Related Commands: MA, MKA, MKF.
ExampleOUTPUT 7 18 ; "MKACT 4 ; ‘I Marker 4 becomes marker 1.
DescriptionThere can be four different markers, but only one marker can be active at any time.
When this command is used, the following results occur:
n The marker number supplied by the command is made marker 1, the active marker.n If the marker number is not already on, the marker is turned on with preset type (position),
and the marker is placed at center screen. The trace chosen is the first displayed tracefound: trace A, trace B, trace C.
Note Using MKACT replaces marker 1 with the new marker function. The amplitudeand frequency for the previous marker are not saved.
Query Response“MKACT?; n returns the marker number.
Programming Commands 5-327

MKACTVMarker As the Active FunctionMakes the current active marker the active function.
Syntax
MKACTV
Equivalent Softkey: MKACTV is equivalent to turning on a marker withMAItKER <number> ON OFF (ON is underlined).Related Commands: MKACT, MKN, MKTYPE.
ExampleOUTPUT 7 18 - “MKACT 2 - ”OUTPUT 7 18 ; “MKACTV ; ’
Makes marker number 2 the active marker:Makes marker number 2 the active fin&ion.
DescriptionIf you have more than one marker displayed on the spectrum analyzer display, you need tomake the desired marker the active function before you can manipulate the marker.
‘lb make the marker the active function:
1. Select the desired marker with the MKACT command (MKACT makes the specified markerthe active marker).
2. Execute MKACTV to make the active marker the active function.
If there is no active marker, executing MKACTV makes marker 1 the active marker and theactive function. MKACTV makes the marker an active function according to its marker type(see “MKTYPE” for more information about marker type).
5-328 Programming Commands

MKBW Marker Bandwidth
MKBWMarker BandwidthReturns the bandwidth at the specified power level relative to an on-screen marker (if present)or the signal peak (if no on-screen marker is present).
Syntax
Pre’def i ned
f u n c t i o n p a t h o n l y
Item Description/Default Range
Number Any valid negative integer. 0 to the amplitude ofthe noise floor.
ExampleOUTPUT 718. “IP * ”OUTPUT 718;"CF'SOOMHZ;SP 1OOMHZ;SNGLS;"
Initializes spectrum anulyzexChanges the center j?-equency and span,then activates the single-sweep moo%.
OUTPUT 7 18 ; “TS ; MKPK HI ; ” Updates the sweep, places marker on signalpeak.
OUTPUT 718 ; “MKBW -3 ; ” Uses the MKBWjimction to find the signalbandwidth at -3 dB below the marker:
DescriptionThe MKBW command also displays (in the message area) the bandwidth at the power level indB below the current marker position or the current signal peak.
MKBW finds the bandwidth at the specified power level for one measurement sweep. If youwant the spectrum analyzer to find the bandwidth at the specified power level during everymeasurement sweep, use the NDBPNT command instead of MKBW.
Programming Commands 5-328

MKCFMarker to Center FrequencySets the center frequency equal to the marker frequency and moves the marker to the centerof the screen.
Syntax
MKCF
Equivalent Softkey: NARKHH -> CF.Related Commands: CF, MKF.
ExampleThis example provides a quick way to center the desired frequency on the spectrum analyzerscreen.
10 OUTPUT 718;"IP;SP 1MHZ;SNGLS;" Initializes spectrum an&q activates single-sweep mode.
20 INPUT "ENTER IN DESIRED STATIONFREQUENCY, IN MHZ”, Freq
30 OUTPUT 718."CF Us,Freq;"MHZ;"40 OUTPUT 718;"TS;MKPK HI;MKCF;TS;"
Changes spectrum analyzer center frequency.Updates the trace, places marker at the signalpeak and centers it on screen.
60 END
DescriptionThis command is performed only if an active marker is present on screen.
5-330 Programming Commands

MKCONT Marker Continue
MKCONTMarker ContinueResumes the sweep after execution of a MKSTOP command.
Syntax
MKCONT
Related Commands: MKSTOl?
Example10 OUTPUT 718."IP*TS*"20 OUTPUT 718;"MK;K I&'
Initializw spectrum aruzljgxxCreates an active marker:
30 OUTPUT 718;"MKSTOP;" Stops sweep at marker:40 OUTPUT 718; "MKCONT;" Resumes sweep.50 END
Programming Commands 5-331

MKDMarker DeltaActivates the delta marker.
Syntax
/ f r e q u e n c y value \
XMKD
Item Description/Default Range
Number Any real or integer number. Default unit is Hz, default value is Start frequency tovalue of the active marker. stop frequency of
spectrum analyzer.
Equivalent Softkey: MARXXR h .Step Increment: by l/10 of the frequency span.Related Commands: AUTO, MA, MKCF, MKF, MKN, MKSP, MKSS, MKPK.
Example10 OUTPUT 718;"IP;" Initializes spectmcm analyzer:20 OUTPUT 718;"MKMIN;" Places a marker at the minimum amplitude of trace.30 OUTPUT 718;"MKD;" Activates marker delta.40 OUTPUT 718;"MKPK HI;" Places marker at highest amplitude of trace.50 OUTPUT 718;"MKSP;" Changes span to the values of the l.@Z and right markers.60 END
5-332 Programming Commands

MKD Marker Delta
DescriptionThe MKD command computes the frequency and amplitude difference of the active markerand a special marker, called the delta or differential marker. These values are displayed in thedisplay readout.
The differential value of the frequency is equal to the active marker frequency minus thedelta marker frequency. The differential value of the amplitude is equal to the active markeramplitude minus the delta marker amplitude.
If an active marker is not on the screen, MKD positions an active marker at center screen. If adelta marker is not on the screen, MKD places one at the specified frequency, or at the currentactive marker. If the active marker is in amplitude mode, the delta marker is placed at thesame amplitude as the active marker (or a specified value).
To read the amplitude, use MKA?. ‘lb read the frequency, use MKF? The results are displayedon the spectrum analyzer screen.
In linear mode, MKD computes the ratio of the amplitudes of the active and delta markersrather than the difference. This results in similar treatment for logarithmic and linear databecause the delta of the difference of two logarithmically generated numbers results in thelogarithmically generated value of the ratio of the two numbers. (You should not changeamplitude units when making a marker delta measurement, however.)
Programming Commands 5-333
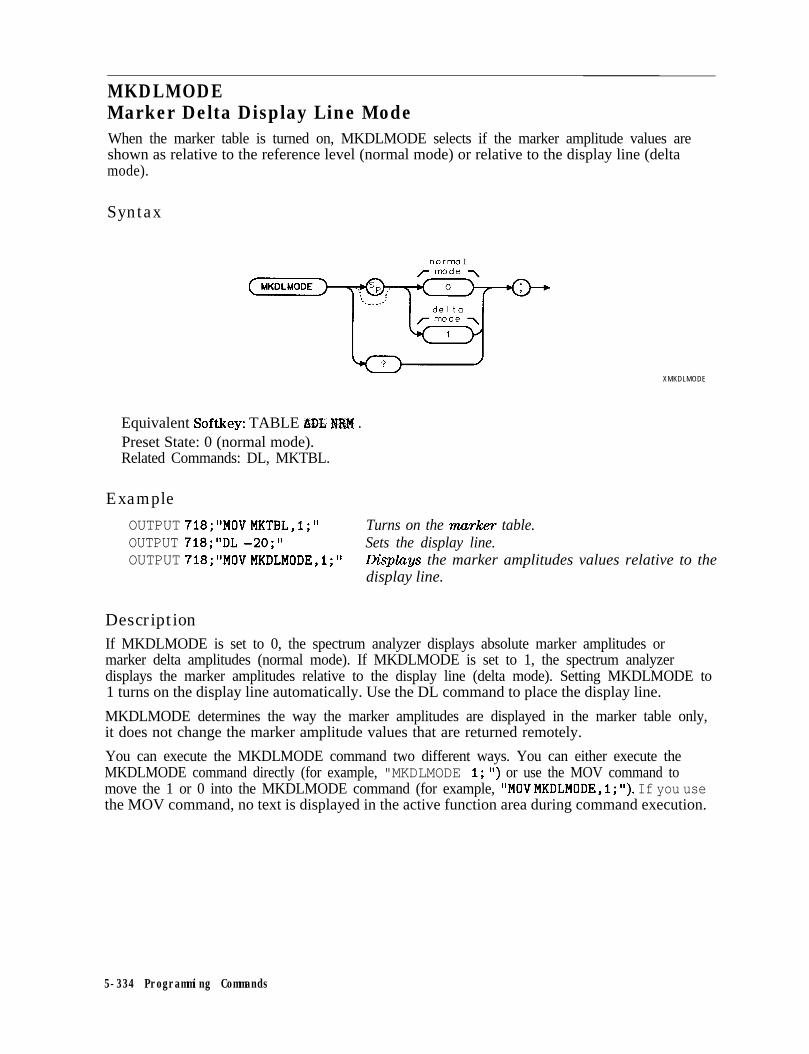
MKDLMODEMarker Delta Display Line ModeWhen the marker table is turned on, MKDLMODE selects if the marker amplitude values areshown as relative to the reference level (normal mode) or relative to the display line (deltamode).
Syntax
norma I
XMKDLMODE
Equivalent Softkey: TABLE ADL NRM .Preset State: 0 (normal mode).Related Commands: DL, MKTBL.
Example
OUTPUT 718;"MOV MKTBL,l;" Turns on the marker table.OUTPUT 718;"DL -20;" Sets the display line.OUTPUT 718;"MOV MKDLMODE,l;" Displays the marker amplitudes values relative to the
display line.
DescriptionIf MKDLMODE is set to 0, the spectrum analyzer displays absolute marker amplitudes ormarker delta amplitudes (normal mode). If MKDLMODE is set to 1, the spectrum analyzerdisplays the marker amplitudes relative to the display line (delta mode). Setting MKDLMODE to1 turns on the display line automatically. Use the DL command to place the display line.
MKDLMODE determines the way the marker amplitudes are displayed in the marker table only,it does not change the marker amplitude values that are returned remotely.
You can execute the MKDLMODE command two different ways. You can either execute theMKDLMODE command directly (for example, "MKDLMODE 1; I’) or use the MOV command tomove the 1 or 0 into the MKDLMODE command (for example, "MOV MKDLMODE,l;"). If you usethe MOV command, no text is displayed in the active function area during command execution.
5-334 Programming Commands

MKDLMODE Marker Delta, Display Line Mode
Query Response
de t a
OMKDLMODE
Programming Commands 5-335

MKFMarker FrequencySpecifies the frequency value of the active marker.
Syntax
\HZ
/
K H Z
MHZ
GHZ
&-;
+F--) . . .
<X-).,’
Item Description/Default ! Range
I Number
I
Any real or integer number. Default unit is Hz. Start frequency tostop frequency of I
Related Commands: AUTO, MKA, MKD, MKCF, MKPK.
Example
OUTPUT 718;"MKF GOOMHZ;" Places an active marker at 600 MHz.
DescriptionIn nonzero frequency spans, MKF returns the active marker frequency as a real number whenMKF is queried. In zero span, “MKF?; ” returns the time value.
The data that is returned by MKF depends on many command conditions, including TDF,MKREAD, and MDS.
MKF results with TDF set to P: If the trace data format P is used with MKF, the result is onereal value in time units or frequency units, depending on MKREAD.
5.335 Programming Commands

MKF Marker Frequency
Example
OUTPUT 718;"TDF P;MKREAD FRQ;MKF?;" This returns a frequency value (in Hz) if not inzero-span.
OUTPUT 718;"TDF P;MKREAD FRQ;MKF?;" This returns a time value (in seconds) if in mo-span.
OUTPUT 718;"TDF P;MKREAD PER;MKF?;" This returns the time value (in seconds) of l/(mrkerfrequen4.d.
OUTPUT 718;"TDF P;MKREAD SWT;MKF?;" This returns the marker time value (in seconds).OUTPUT 718;"TDF P;MKREAD IST;MKF?;" This returns the frequency value (in Hz) for
l/(m.arker time).OUTPUT 718;"TDF P;MKREAD FFT;MKF?;" This returns the frequency value (in Hz).
MKF results with TDF set to A or I: If the trace data format is used with trace data formatA, the result depends on the setting of the MDS command.
Example
OUTPUT 718;"TDF A;MDS B;MKF?;" Returns one byte representing the marker position.OUTPUT 718;"TDF A;MDS W;MKF?;" Returns two bytes in a binary word format that has a
value from 1 to 401.
Using the trace data format I is equivalent to the TDF A format.
MKF results with TDF set to M: If the trace data format is used with trace data format M,the result is the marker horizontal position value, from 1 to 401, in ASCII.
Example
OUTPUT 718;"TDF M;MKF?;" Returns marker horimntal position value in ASCII.
Query Response
Programming Commands 5-337

MKFCMarker CounterTurns on or off the marker frequency counter.
Syntax
Equivalent Softkey: MK lCW?T ON OFF .Model Required: HP 85913, HP 85933, HP 85943, HP 85953, HP 85963, or HP 85901, withOption 013.Related Commands: MKFCR, MKN.Restrictions: Not available with Analog+ display mode. See “ANLGPLUS” for moreinformation. Not available with the marker table (MKTBL).
Example
OUTPUT 718 ; "MKFC ON ; ” Turns on the wmrker counts
5-338 Programming Commands

MKFCR Marker Counter Resolution
MKFCRMarker Counter ResolutionSets the resolution of the marker frequency counter.
Syntax
j- r e s o l u t i o n -\
HZ‘.....-.:
XMKFCR
Item Description/Default Range
Number Any real or integer number. Default unit is Hz. 0 Hz to 100 kHz.
Equivalent Softkey: CNT RES AUXI NAN .Model Required: HP 85913, HP 85933, HP 85943, HP 85953, HP 85963, or HP 8590L withOption 013.Preset State: Marker counter resolution is set to AUTO. The calculated value for the markercounter resolution is returned if the MKFCR is queried.Related Commands: AUTO, MKFC.
Example
OUTPUT 718;"MKFCR IOKHZ;" Sets the marker counter resolution to 10 kHz.OUTPUT 718;"MKFCR?;" Queries the marker counter resolution.ENTER 718;A Gets the query response.DISP A LXspla ys the marker counter resolution.
Programming Commands 5.338

MKFCR Marker Counter Resolution
DescriptionExecuting either “MKFCR 0;” or “MKFCR AUTO; n auto-couples the marker counter resolutionto the frequency span.
Query Response
5-340 Programming Commands
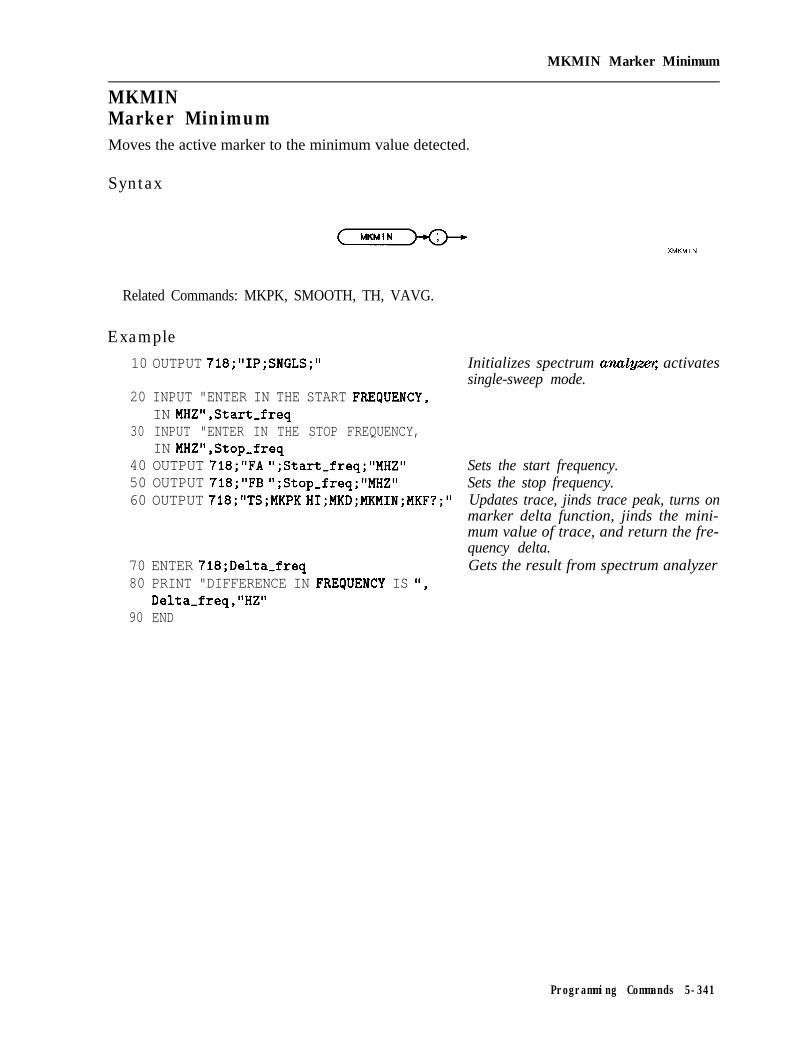
MKMIN Marker Minimum
MKMINMarker MinimumMoves the active marker to the minimum value detected.
Syntax
Related Commands: MKPK, SMOOTH, TH, VAVG.
Example
10 OUTPUT 718;"IP;SNGLS;"
20 INPUT "ENTER IN THE START FREqUENCY,IN MHZ",Start,freq
30 INPUT "ENTER IN THE STOP FREQUENCY,IN MHZ",Stop,freq
40 OUTPUT 718;"FA ";Start-freq;"MHZ"50 OUTPUT 718;"FB ";Stop,freq;"MHZ"60 OUTPUT 718;"TS;MKPK HI;MKD;MKMIN;MKF?;"
70 ENTER 718;Delta-freq80 PRINT "DIFFERENCE IN FREqUENCY IS ",
Delta-freq,"HZ"90 END
Initializes spectrum analym activatessingle-sweep mode.
Sets the start frequency.Sets the stop frequency.Updates trace, jinds trace peak, turns onmarker delta function, jinds the mini-mum value of trace, and return the fre-quency delta.Gets the result from spectrum analyzer
Programming Commands 5-341
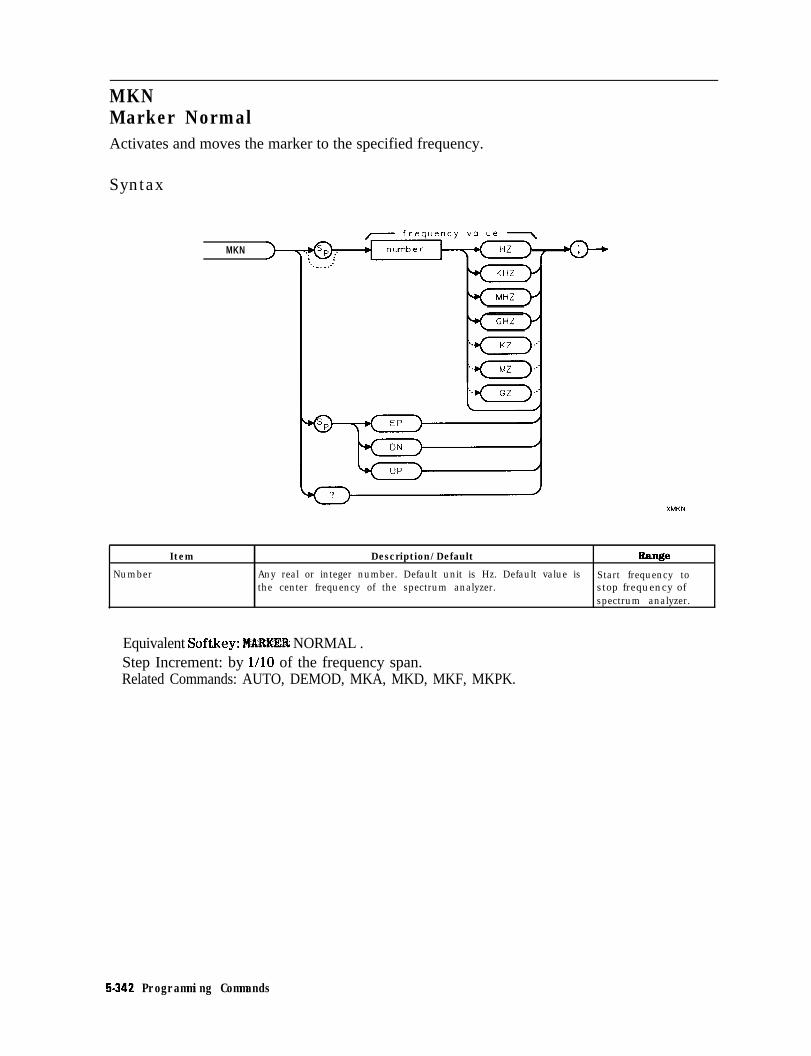
MKNMarker NormalActivates and moves the marker to the specified frequency.
Syntax
MKN
Item Description/Default R=ae
Number Any real or integer number. Default unit is Hz. Default value is Start frequency tothe center frequency of the spectrum analyzer. stop frequency of
spectrum analyzer.
Equivalent Softkey: WWER NORMAL .Step Increment: by l/10 of the frequency span.Related Commands: AUTO, DEMOD, MKA, MKD, MKF, MKPK.
5-342 Programming Commands

MKN Marker Normal
Example
10 INPUT "ENTER IN THE START FREQUENCY, IN MHZ",Start-freq20 INPUT "ENTER IN THE STOP FREQUENCY, IN MHZ",Stop-freq30 OUTPUT 718;"IP;FA ";Start-freq;"MHZ"
40 OUTPUT 718;"FB ";Stop-freq;"MHZ"50 OUTPUT 718; “MKN EK;”
60 PRINT "PLACE MARKER ON THE DESIRED SIGNAL"70 PRINT "PRESS HOLD THEN PRESS CONTINUE"80 PAUSE90 OUTPUT 718*"MKN'-"# * ,
100 ENTER 718;Mkr
110 PRINT "MARKER FREQUENCY IS ",Mkr,"Hz"120 END
Description
Initial&s spectrum an-alyzer and changes thestart frequency.Changes the stop frequency.Enables the front-panelknob.
Gets the freqwnc y of themarker:Puts thefrequency valueinto the computer vari-ab& Mkr:Prints the result.
In nonzero span, “MKN?;” returns the frequency value. In zero span, “MKN?;” returns the timevalue.
Query Response
Programming Commands 5-343

MKNOISEMarker NoiseDisplays the average noise level at the marker.
Syntax
Restrictions: Not available with the marker table (MKTBL).Equivalent Softkey: MK HfXSE ON OFF .Related Commands: MKA, MKF, MKMIN, MKN.
ExampleOUTPUT 718;"IP;CF 300MHZ;SNGLS;"
OUTPUT 718;"SP 1OMHZ;DET SMP;TS;"
OUTPUT 718;"MKPK HI;MKA?;"
ENTER 718;Amp-one
OUTPUT 718;"MKD UP;UP;MKNOISE ON;MKA?;"
ENTER 718;Amp,two
OUTPUT 718;"MKNOISE OFF;"DISP Amp-twoC-to,n=Amp-one - Amp-twoPRINT "CARRIER TO NOISE RATIO IN 1 HZBANDWIDTH IS ";C-to-nPRINT ' DB"
Initializes spectrum an&y- changes cen-ter frequency, activates single-sweep mode.Changes span, activates sample detecto?updates trace.Places marker on highest point of trace,queries marker amplitude.Pats the spectrum analyzer response in thecomputer variable, Amp-one.Moves marker and turns on the markernoise function.Puts the spectrum analyzer response in thecomputer variable, Amp-two.Turns ofl the marker noise fin&ion.Displays the result.Calculates the carrier to noise ratio.
Outputs result.
5-344 Programming Commands

MKNOISE Marker Noise
DescriptionThe marker value is normalized to a l-Hz bandwidth. Use “MKA?; ” to read the noise markervalue.
The noise marker averages 32 trace data values about the location of the marker on thefrequency or time scale. The 32 values averaged, except for the first 15 or last 14 values in thetrace, commence with the 16th point to the left of the marker, and end with the 15th point tothe right of the marker. Note that the data values averaged are not exactly symmetrical withrespect to marker position. At the trace end points, the spectrum analyzer uses the nearest 32data values. So while the marker may be moved to trace position 1 to 15, the actual amplitudevalue returned will be the same value for any marker position from 1 to 15. A similar situationapplies for markers at the end of the trace.
A nominal correction for equivalent noise bandwidths is made by the firmware based on anominal 3 dB resolution bandwidth. The firmware assumes the noise bandwidth is 1.12 timesthe resolution bandwidth. This means the shape of the resolution bandwidth filters cause thenoise power to be overstated by 1.12 times. The detection mode also affects the measurement.If in log mode, the log detector understates the noise response. lb compensate, 2.5 dB isadded to the measurement. If the detector is in linear mode, the firmware uses 1.05 dB as acorrection value.
In log detector mode, the final reported value will then be, with the result reported in dBm in al-Hz bandwidth:
(Averaged value over 32 values) - 10 x (log[1.12 x Resolution bandwidth]) + 2.5 dB
In linear detector mode (dBm) units, the final reported value will then be, with the resultreported in dBm in a l-Hz bandwidth:
(Averaged value over 32 values) - 10 x (log[1.12 x Resolution bandwidth]) + 1.05 dB
In linear detector mode with the normal display of voltage units, the noise marker voltagevalue will be related to the present marker voltage by this relation.
(V-noise-marker)2 = (V-average)’ x 1.12 x Resolution bandwidth x 0.7824
V-noise-marker = V-average/( 1.12 x Resolution bandwidth x 0.7824)“.5
V-noise-marker = V-average x l.O6633/(Resolution bandwidth)0.5
Query Response
ONo u t p u t
t e r m i n a t i o n +
OFF
002
Programming Commands 5.345

MKOFFMarker OffTurns off either the active marker or all the markers.
Syntax
Equivalent Softkey: IURKEB ALL OFF .Related Commands: MKA, MKACT, MKACTV, MKCF, MKD, MKF, MKN, MKPK.
Example
OUTPUT 718;"MKOFF ALL;" Turn.s oflall the on-screen markers.
DescriptionIf the ALL parameter is omitted, only the active marker is turned off.
5-346 Programming Commands
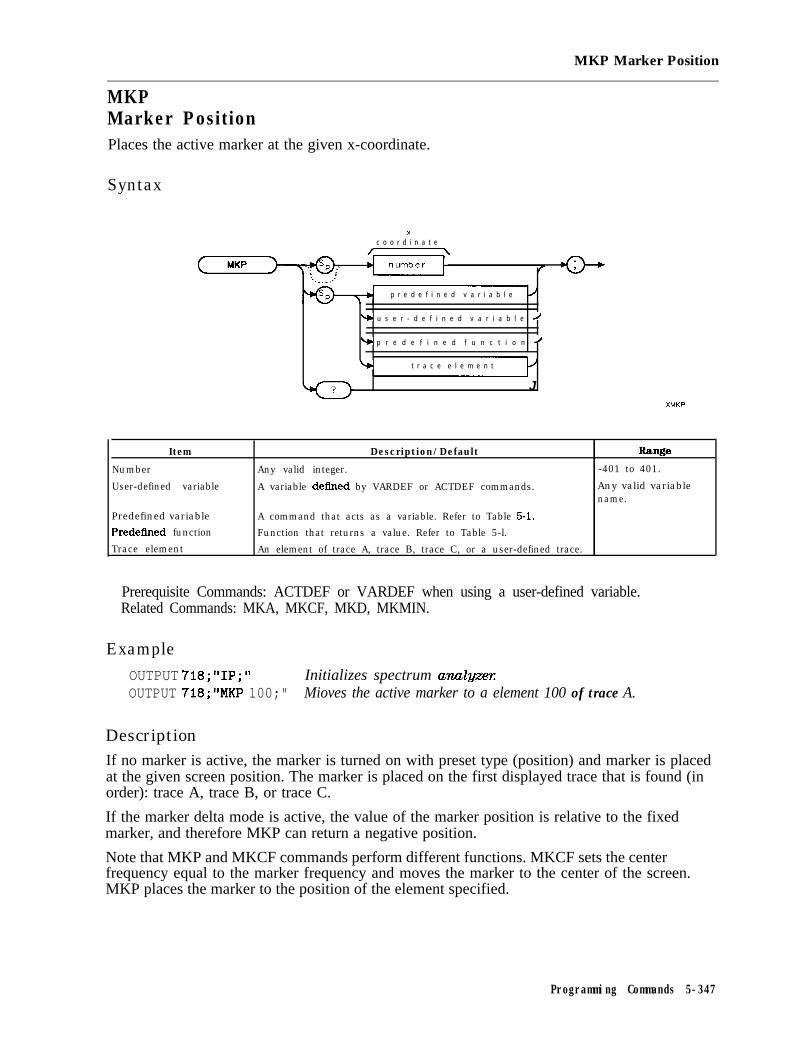
MKP Marker Position
MKPMarker PositionPlaces the active marker at the given x-coordinate.
Syntax
xc o o r d i n a t e
p r e d e f i n e d v a r i a b l e
b u s e r - d e f i n e d v a r i a b l e /
% p r e d e f i n e d f u n c t i o n /
b t r a c e e l e m e n t
JXMKP
Item
Number
User-defined variable
Predefined variablePredefLned function
Trace element
Description/Default Range
Any valid integer. -401 to 401.
A variable defined by VARDEF or ACTDEF commands. Any valid variablename.
A command that acts as a variable. Refer to Table 5-l.Function that returns a value. Refer to Table 5-l.
An element of trace A, trace B, trace C, or a user-defined trace.
Prerequisite Commands: ACTDEF or VARDEF when using a user-defined variable.Related Commands: MKA, MKCF, MKD, MKMIN.
Example
OUTPUT 718;"IP;" Initializes spectrum analyzer:OUTPUT 718;"MKP 100;" Mioves the active marker to a element 100 of trace A.
DescriptionIf no marker is active, the marker is turned on with preset type (position) and marker is placedat the given screen position. The marker is placed on the first displayed trace that is found (inorder): trace A, trace B, or trace C.
If the marker delta mode is active, the value of the marker position is relative to the fixedmarker, and therefore MKP can return a negative position.
Note that MKP and MKCF commands perform different functions. MKCF sets the centerfrequency equal to the marker frequency and moves the marker to the center of the screen.MKP places the marker to the position of the element specified.
Programming Commands 5-347

MKP Marker Position
Query Response
o u t p u tt e r m i n a t i o n ---)
5-348 Programming Commands

MKPAUSE Marker Pause
MKPAUSEMarker PausePauses the sweep at the active marker for the duration of the delay period.
Syntax
Item Description/Default Range
Number Any real or integer number. 2msto 100s.
Restrictions: Not available with Analog+ display mode. See “ANLGPLUS” for moreinformation. Not available with negative peak detection.Equivalent Softkey: MK PAUSE ON OFF.Step Decrement: Time value divided by 2.Step Increment: Time value multiplied by 2.Related Commands: DEMOD, MKA, MKF, MKFC, MKN, MKOFF, ST.
ExampleOUTPUT 718;"MKPAUSE IOSC;" Changes the marker pause time to 10 seconds.
DescriptionTo turn MKPAUSE off, turn off markers or send “MKPAUSE 0;“.
The MKPAUSE command requires a sweep time of 50 ms or longer. The sweep time is changedto 50 ms if MKPAUSE is used with a sweep time that is less than 50 ms.
After MKPAUSE is executed, the sweep must be completed before another command will beexecuted.
Programming Commands 5-349

MKPAUSE Marker Pause
Query Response
o u t p u tt e r m i n a t i o n +
5-350 Programming Commands
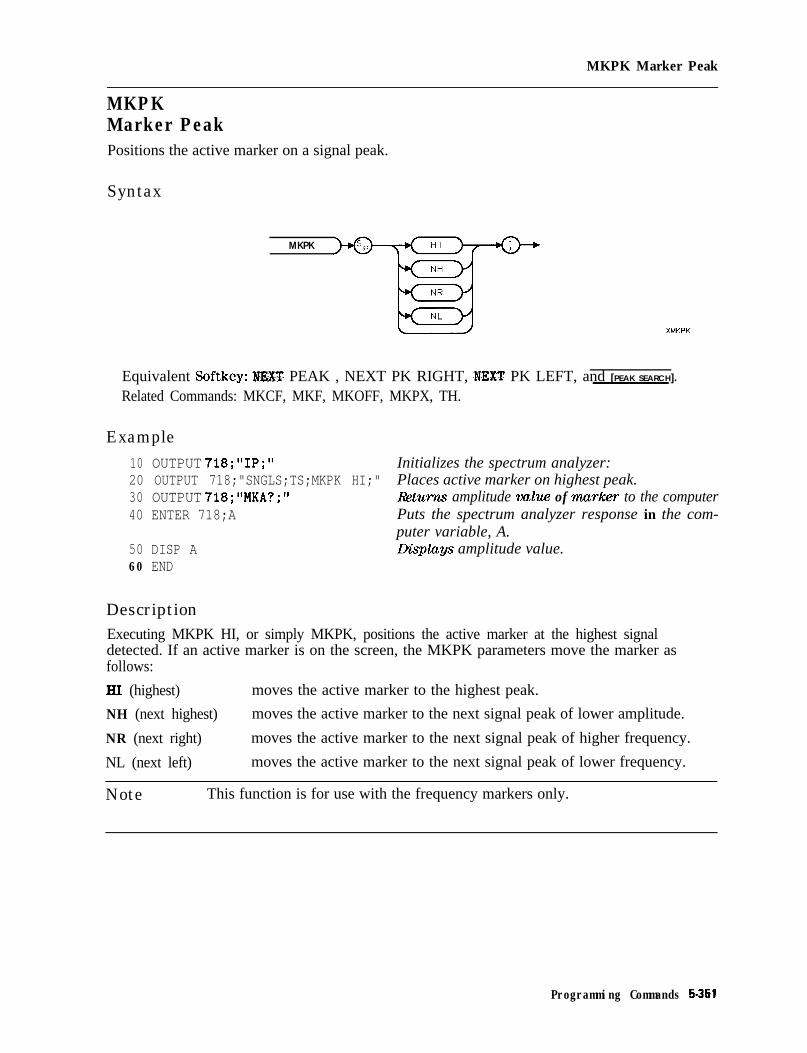
MKPK Marker Peak
MKPKMarker PeakPositions the active marker on a signal peak.
Syntax
MKPK
Equivalent Softkey: NEXT PEAK , NEXT PK RIGHT, I?EXT PK LEFT, and [PEAK SEARCH].
Related Commands: MKCF, MKF, MKOFF, MKPX, TH.
Example10 OUTPUT 718;"IP;"20 OUTPUT 718;"SNGLS;TS;MKPK HI;"30 OUTPUT 718;"MKA?;"40 ENTER 718;A
50 DISP A60 END
Description
Initializes the spectrum analyzer:Places active marker on highest peak.Returns amplitude value of marker to the computerPuts the spectrum analyzer response in the com-puter variable, A.tiplays amplitude value.
Executing MKPK HI, or simply MKPK, positions the active marker at the highest signaldetected. If an active marker is on the screen, the MKPK parameters move the marker asfollows:
HI (highest) moves the active marker to the highest peak.
NH (next highest) moves the active marker to the next signal peak of lower amplitude.
NR (next right) moves the active marker to the next signal peak of higher frequency.
NL (next left) moves the active marker to the next signal peak of lower frequency.
Note This function is for use with the frequency markers only.
Programming Commands 5-351

MKPXMarker Peak ExcursionSpecifies the minimum signal excursion for the spectrum analyzer’s internal peak-identificationroutine.
Syntax
7 ompl itude v a l u e 7
DE
Item Description/Default R-f3eNumber Any real or integer number. Default unit is dB. Oto 100dB.
Equivalent Softkey: PEAK EXCUWN .Preset State: 6 dB.Step Increment: by 1 dB.Related Commands: MKPK, PEAKS.
Example
10 OUTPUT 718;"IP;CF 300MHZ;SP IGHZ;"
20 INPUT "ENTER IN PEAK EXCURSION, IN DB ",Excursion30 OUTPUT 718;"MKPX ";Excursion;"DB;"40 OUTPUT 718;"TS;MKPK HI;MKPK NH;"
50 OUTPUT 718;"MKF?;"
60 ENTER 718;Freq
70 IF Freq <> 0 THEN
80 PRINT "PEAK FOUND"90 ELSE
100 PRINT "NO PEAKS FOUND"110 END IF120 END
Initializes spectrum anulymchanges start and stop frequencies.
Changes peak excursion level.Searches for highest peaksof trace.Finds frequency d&@rvncebetween peaks.Puts the spectrum analyzerresponse in the computervariable, Req.Outputs results if markeramplitude was not 0.
Prints “NO PEAKS FOUND”if Freq = 0.
5-352 Programming Commands

MKPX Marker Peak Excursion
Query Response
Programming Commands 5-353

MKREADMarker ReadoutSelects the type of active trace information displayed by the spectrum analyzer markerreadout.
Syntax
( M K R E A D ‘r
XMKREAD
Equivalent Softkey: I4K HEAl F T I P provides the marker readouts in the frequency,sweep time, inverse sweep time, and period. The fast Fourier transform readout is notavailable with the softkey, however.Related Commands: FFT, MKF, MKTYPE.
ExampleOUTPUT 718;"MKREAD FFT;"
DescriptionThe MKREAD command can select the following types of active trace information:
=Q frequency
SWT sweep time
IST inverse sweep time
PER period
FFT Fast Fourier Transform Readout
The results of the data depend on the MKREAD parameter, the frequency span, and if themarker delta function is used.
5354 Programming Commands

MKRRAD Marker Readout
MKREAD Non-Zero Non-Zero Span Zero Zero Span
Type Span Delta Swn Delta
FRQ Reads frequency Reads delta frequency Reads time Reads delta time
SWT Reads time since Reads delta time Waveform Waveform measurements ofthe start of sweep between end points measurements of detected modulation
detected modulation
IST N/A N/A N/A Computes frequencycorresponding to delta of markers.Performs l/(Tr - T2)
PER Period of frequency (Pulse measurement) N/A N/Adelta time
FFf N/A N/A Reads frequency Reads delta frequencycorresponding the to corresponding to delta FFf bucketFFT bucket
Query Response
QMKREAD
Programming Commands 5-355

MKRLMarker to Reference LevelSets the reference level to the amplitude value of the active marker.
Syntax
MKRL
Equivalent Softkey: #ARKER -2 REF LVL .Related Commands: MKOF'F', RL.
Example
10 OUTPUT 718;"IP;SNGLS;CF 300MHZ;SP 20MHZ;"
20 OUTPUT 718;"TS;MKPK HI;MKRL;TS;"
30 OUTPUT 718;"RL?;"40 ENTER 718 USING "K";Ref-level
50 OUTPUT 718;"AUNITS?;"60 ENTER 718;Aunits$50 PRINT "REFERENCE LEVEL IS",Ref-level,Aunits$60 END
Initializes spectrum an&y- changescenter frequency and span.Places a marker on trace peak,sets the reference level to the am-plitude of the active markq up-dates the sweep.Gets the reference level.Puts the spectrum analyzer re-sponse in the computer variable,&fLkvel.Gets the current amplitude units.
5-356 Programming Commands

MKSP Marker to Span
MKSPMarker to SpanSets the start and stop frequencies to the values of the delta markers.
Syntax
MKSP
Equivalent Softkey: MKl3 B -> SPAN.
Related Commands: MKD, SI?
Example10 OUTPUT 718;"IP;"20 OUTPUT 718*"MKMIN-"30 OUTPUT 718;"MKD;"'40 OUTPUT 718;"MKPK HI;"50 OUTPUT 718;"MKSP;"60 END
Initializes spectrum analyzerPlaces a marker at the minimum amplitude of trace.Activates marker delta.Places marker at highest amplitude of trace.Changes span to the values of the left and right markers.
DescriptionThe left marker specifies start frequency, and the right marker specifies stop frequency. If MKDis off, no operation is performed.
Programming Commands 5-357

MKSSMarker to Step SizeSets the center-frequency step-size to the marker frequency.
Syntax
MKSS
Equivalent Softkey: MARKER -2 CF STEP .
Related Commands: CF, MKA, MKCF, MKD, MKF, SS.
ExampleThis example measures a harmonic of the CAL OUT signal.
10 DISP "CONNECT THE CAL OUT TO THE INPUT"20 OUTPUT 718;"IP;SNGLS;CF 300MHZ;SP 20MHZ;TS;"
30 OUTPUT 718;"MKPK HI;MKSS;MKD;CF UP;TS;MKPK HI;"
40 OUTPUT 718;"MKA?;"
50 ENTER 718;Delta,amp
60 OUTPUT 718."MKF'." *, 9
70 ENTER 718;Delta-freq
80 PRINT "DIFFERENCE IN AMPLITUDE IS ",Delta,amp,"dB"90 PRINT "DIFFERENCE IN FREQUENCY IS ",Delta,freq,"Hz"100 END
Initializes spectrum an-alym activates single-sweep mode, changes cen-ter frequency and span,updates trace.Places the marker on thehighest point of the trace,changes the step size tothe marker frequency, ac-tivates marker delta, in-crease center frequency,update trace, places themarker at highest pointof the trace.Gets the amplitude of themarker:Puts the spectrum ana-lyzer response in the com-puter variable, Delta-Amp.Gets the frequency of themarker:Puts the spectrum ana-lyzer response in the com-puter variable, Deltafreq.
DescriptionSets the center-frequency step-size equal to the marker frequency. If in the delta mode, thestep size is set to the delta frequency (absolute value).
5-358 Programming Commands

MKSTOP Marker Stop
MKSTOPMarker StopStops the sweep at the active marker.
Syntax
Related Commands: MKCONT.Restrictions: Not available with Analog+ display mode. See “ANLGPLUS” for moreinformation.
Example
10 OUTPUT 718;"IP;TS;"20 OUTPUT 718;"MKPK HI;"30 OUTPUT 718;"MKSTOP;"40 OUTPUT 718;"MKCONT;"50 END
Initializes spectrum analyzerCreates an active marker:Stops sweep at markexResumes sweep.
Programming Commands 5-358
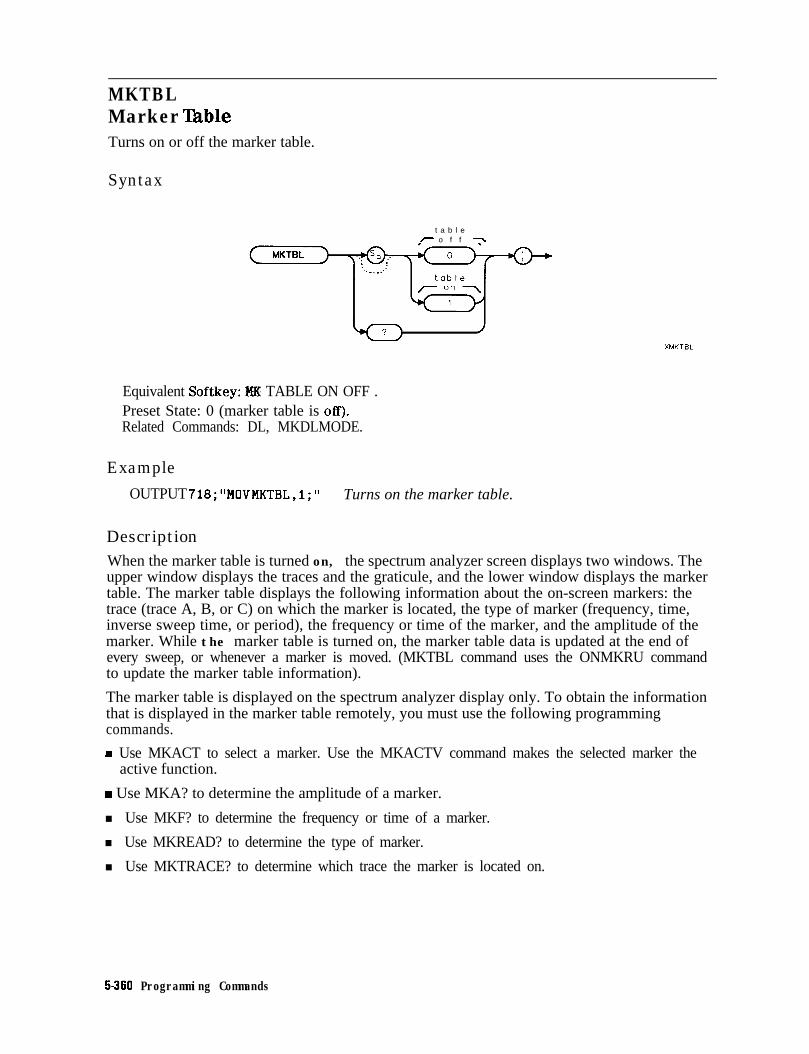
MKTBLMarker ‘IhbleTurns on or off the marker table.
Syntax
t a b l e7 o f f -
Equivalent Softkey: ?4K TABLE ON OFF .Preset State: 0 (marker table is off).Related Commands: DL, MKDLMODE.
Example
OUTPUT 718;“MOV MKTBL,l;” Turns on the marker table.
DescriptionWhen the marker table is turned on, the spectrum analyzer screen displays two windows. Theupper window displays the traces and the graticule, and the lower window displays the markertable. The marker table displays the following information about the on-screen markers: thetrace (trace A, B, or C) on which the marker is located, the type of marker (frequency, time,inverse sweep time, or period), the frequency or time of the marker, and the amplitude of themarker. While the marker table is turned on, the marker table data is updated at the end ofevery sweep, or whenever a marker is moved. (MKTBL command uses the ONMKRU commandto update the marker table information).
The marker table is displayed on the spectrum analyzer display only. To obtain the informationthat is displayed in the marker table remotely, you must use the following programmingcommands.
H Use MKACT to select a marker. Use the MKACTV command makes the selected marker theactive function.
H Use MKA? to determine the amplitude of a marker.
n Use MKF? to determine the frequency or time of a marker.
n Use MKREAD? to determine the type of marker.
n Use MKTRACE? to determine which trace the marker is located on.
5-360 Programming Commands

MKTBL Marker ‘able
RestrictionsTurning on the marker table turns off following functions: windows display mode (WINON),N dB point measurement (NDBPNT), the FFT menu measurements (FFTAUTO, FFTCONTS,FFTSNGLS), gate utility functions (GDRVUTIL), TO1 measurement (TOI), peak table (PKTBL),percent AM (PCTAM), peak zoom (PKZOOM), and power menu measurements (ACP, ACPE, CHP,and OBW). Marker noise (MKNOISE) and marker counter (MKFC) are not available with themarker table.
You can execute the MKTBL command two different ways. You can either execute the MKTBLcommand directly (for example, “MKTBL 1; “) or use the MOV command to move the 1 or 0 intothe MKTBL command (for example, “MOV MKTBL, 1; ‘I). If you use the MOV command, no text isdisplayed in the active function area during command execution.
You should turn off the marker table (set MKTBL to 0) when you are done with the markertable.
Query Response
t a b l e
r off 7
0o u t p u t
’ t e r m i n a t i o n +
t a b l e
qMKTBL
Programming Commands 5-361

MKTRACEMarker TraceMoves the active marker to a corresponding position in trace A, trace B, or trace C.
Syntax
Equivalent Softkey: HK TRACE hUTi ABC.
Example
10 OUTPUT 718;"IP;"20 OUTPUT 718 *“MKMIN*”30 OUTPUT 718;"MKTRAbE TRB;"
40 OUTPUT 718;"BLANK TRA;CLRW TRB;"50 END
Query Response
XMKTRACE
Initializes spectrum analyzerFinds the lowest amplitude of trace.Moves marker to corresponding position ontrace BBlanks trace A and displays trace B
5-362 Programming Commands
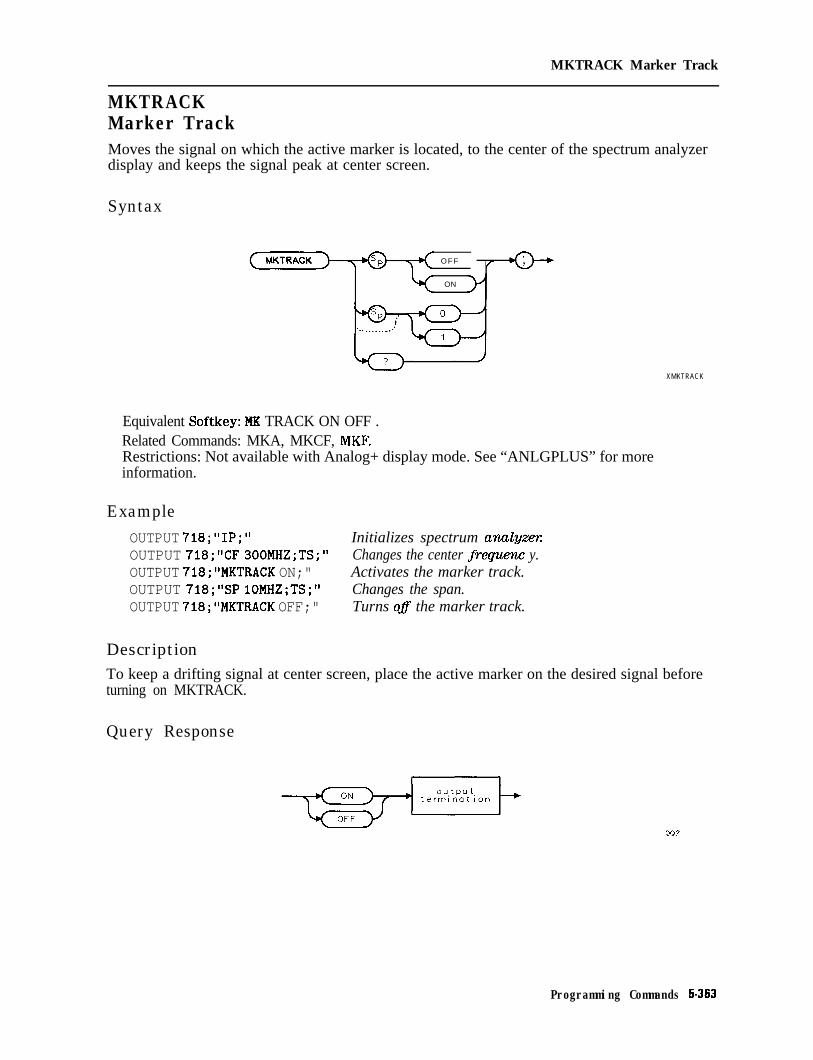
MKTRACK Marker Track
MKTRACKMarker TrackMoves the signal on which the active marker is located, to the center of the spectrum analyzerdisplay and keeps the signal peak at center screen.
Syntax
OFF/
ON
XMKTRACK
Equivalent Softkey: MF TRACK ON OFF .Related Commands: MKA, MKCF, MKF’.Restrictions: Not available with Analog+ display mode. See “ANLGPLUS” for moreinformation.
Example
OUTPUT 718;"IP;"OUTPUT 718;"CF 300MHZ;TS;"OUTPUT 718;"MKTRACK ON;"OUTPUT 718;"SP 10MHZ;TS;"OUTPUT 718;"MKTRACK OFF;"
Description
Initializes spectrum analy2ef.xChanges the center flequenc y.Activates the marker track.Changes the span.Turns of the marker track.
To keep a drifting signal at center screen, place the active marker on the desired signal beforeturning on MKTRACK.
Query Response
QO2
Programming Commands 5-363

MKTYPEMarker TypeChanges the type of the current active marker.
Syntax
/
Equivalent Softkey: The functions of MKTYPE AMP and MaRKER AMPTD are equivalent.Preset State: MKTYPE PSN.Related Commands: MKA, MKBW.
ExampleOUTPUT 718;"MKTYPE AMP;MKA -5;" Fbsitiom the marker at -5 dBm.
DescriptionThe marker types are as follows:
PSN allows markers to be positioned according to the horizontal position on the display. Themarker type is set to PSN after an instrument preset.
AMP allows markers to be positioned according to amplitude, as shown in the example. Iftwo or more points on the trace are at the same amplitude, the marker is moved to theclosest point on the trace with the correct amplitude. If no point on the trace is at thespecified amplitude, the marker is placed at the specified amplitude and not on the trace.
FIXED allows a marker to be placed at any fixed point on the spectrum analyzer screen. Theposition of the marker cannot be changed unless another marker type is used.
Use “MKTYPE PSN” to return from using the AMP, FIXED, or DELTA types.
Query Response
5-364 Programming Commands
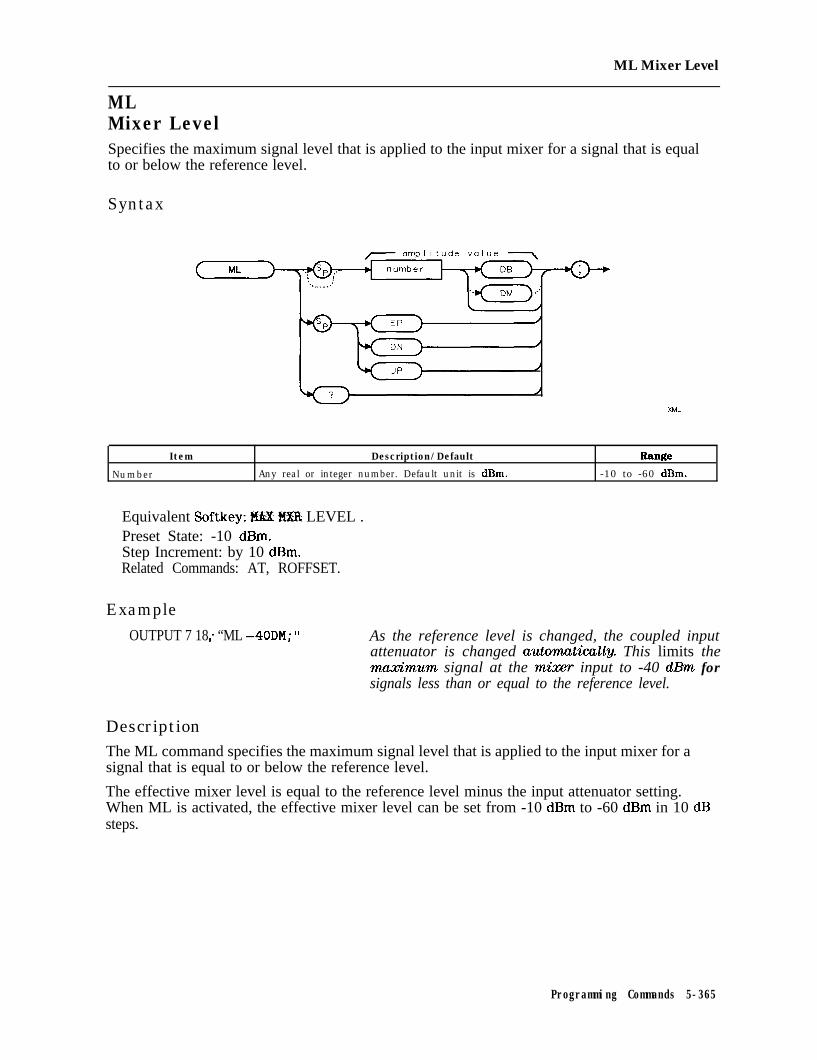
ML Mixer Level
MLMixer LevelSpecifies the maximum signal level that is applied to the input mixer for a signal that is equalto or below the reference level.
Syntax
Item Description/Default R-f+
Number Any real or integer number. Default unit is dBm. -10 to -60 dBm.
Equivalent Softkey: HAX MXR LEVEL .Preset State: -10 dBm.Step Increment: by 10 dBm.Related Commands: AT, ROFFSET.
ExampleOUTPUT 7 18 * “ML -4ODM * ”# 9 As the reference level is changed, the coupled input
attenuator is changed automaticall@ This limits themaximum signal at the mixvr input to -40 d&n forsignals less than or equal to the reference level.
DescriptionThe ML command specifies the maximum signal level that is applied to the input mixer for asignal that is equal to or below the reference level.
The effective mixer level is equal to the reference level minus the input attenuator setting.When ML is activated, the effective mixer level can be set from -10 dBm to -60 dBm in 10 dBsteps.
Programming Commands 5-365

MOD Modulo
MODModuloStores the remainder from the division of source 1 by source 2 in the destination.
Syntax
- d e s t inot i o n
h u s e r - d e f i n e d t r a c e /
b t r a c e r a n g e /
b p r e d e f i n e d v a r i a b l e I
buser-defined variable/
XMOO
Item
User-defined trace
User-defined variable
Predefined variable
Predefined function
Trace range
Number
Description/Default Range
A trace defined by the TRDEF command. Any valid trace name.
A variable defined by VARDEF or ACTDEF commands. Any valid variablename.
A command that acts as a variable. Refer to Table 5-l.
Function that returns a value. Refer to Table 5-1.
A segment of trace A, trace B, trace C, or a user-defined trace.
Any real or integer number. Real number range.
Prerequisite Commands: TRDEF when using a user-defined trace. ACTDEF or VARDEF whenusing a user-defined variable. TS when using trace data.Related Commands: DIV.
Programming Commands 5-367

MOD Modulo
Example
10 OUTPUT 718;"VARDEF S_ONE,l5;"20 OUTPUT 718;"VARDEF S_TW0,4;"30 OUTPUT 718;"VARDEF D,EST,O;"40 OUTPUT 718;"MOD D,EST,S-ONE,S-TWO;"50 OUTPUT 718;"D_EST?;"60 ENTER 718;Number
Places 15 into S-ONE.Places 4 into S-TWO.D-EST holds the result.
Moves the result to the computer:Puts the spectrum analyzer responsein the computer variable, Number:
70 DISP Number80 END
Displays a 3.
DescriptionIf source 1 is a negative number and source 2 is a positive number, the MOD function returnsa negative remainder. If both sources are negative, the MOD function returns a negativeremainder.
Integer values are used when a trace is the destination or one of the sources. If trace data isused as the source and the destination, the MOD function is done with 32-bit arithmetic using16-bit integer data. If a user-defined variable or predefined variable is used as the source ordestination, the MOD function is done in floating point format. If a real number is used as asource, but the destination is an integer value, the result is truncated. If a trace is used asa source, be sure the trace contains a complete sweep of measurement information beforeexecuting MOD.
When the source is longer than the destination, the source is truncated to fit. When the sourceis shorter than the destination, the last element is repeated to fill the destination.
5-366 Programming Commands

MODE Mode
MODEModeReturns a “0” if the mode of operation is spectrum analysis. A number other than “0” isreturned if the operating mode is other than spectrum analysis.
Syntax
MODE
ExampleOUTPUT 7 18 ; “MODE? ; ”
DescriptionAll spectrum analyzers have the spectrum analyzer mode of operation. If a program (also calleda downloadable program or personality) has been loaded into the spectrum analyzer’s memory,and the spectrum analyzer is using the personality mode, the number that is returned by MODEmay be modified.
Query Response
Programming Commands 5-369

MOVMoveCopies the source values into the destination.
Syntax
7 d e s t i n a t i o n
Item Description/Default
User-defined trace A trace defined by the TRDEF command.
User-defined variable A variable defined by VARDEF or ACTDEF commands.
Predehned variable A command that acts as a variable. Refer to ‘fable 5-l.Predeflned function Function that returns a value. Refer to Table 5-l.
Trace range A segment of trace A, trace B, trace C, or a user-defined trace.
Number Any real or integer number.
RangeAny valid trace name.
Any valid variablename.
Real number range.
Prerequisite Commands: TRDEF when using a user-defined trace. ACTDEF or VARDEF whenusing a user-defined variable.
5-370 Programming Commands

MOV Move
Example
10 CLEAR 71820 OUTPUT 718.“IP-”30 OUTPUT 7181”FA’lOOMHZ;FB 1100MHZ;”40 OUTPUT 718;“TS;MKPK HI;”50 OUTPUT 718; “DL ON; ”60 OUTPUT 718;“MOV DL,MKA;”
Clears the HP-IB bus and spectrum analyzxxInitializes spectrum analyzerSets up the measurement range.Places a marker at the highest peak.Turns on display line.Sets the display-line value equal to the markeramplitude by storing the value of the markeramplitude variable, MKA, in the display linevariable, DL.
70 END
DescriptionWhen the source is longer than the destination, the source is truncated to fit. When the sourceis shorter than the destination, the last element is repeated to fill the destination.
Programming Commands 5.371

MPYMultiplyMultiplies the sources, point by point, and places the results in the destination.
Syntax
7 d e s t i n a t i o n -
h u s e r - d e f i n e d t r a c e /
b t r a c e range /
b p r e d e f i n e d v a r i a b l e I
buuser-defined variable)
h u s e r - d e f i n e d t r a c e /
b t r a c e range
h p r e d e f i n e d v a r i a b l e p r e d e f i n e d v a r i a b l e
u s e r - d e f i n e d v a r i a b l e
p r e d e f i n e d f u n c t i o n
Item
User-defined trace
User-defined variable
Predeflned variable
Predeflned function
Trace range
Number
Description/Default
A trace defined by the TRDEF command.
A variable defined by VARDEF or ACTDEF commands.
A command that acts as a variable. Refer to Table 5-l.
Function that returns a value. Refer to ‘fable 5-l.
A segment of trace A, trace B, trace C, or a user-defined trace.
Any real or integer number.
R-mAny valid trace name.
Any valid variablename.
Real number range.
Prerequisite Commands: TRDEF when using a user-defined trace. ACTDEF or VARDEF whenusing a user-defined variable. TS when using trace data.
5-372 Programming Commands

MPY Multiply
Example
OUTPUT 718 ; "MPY CF , CF ,2 ; I' Doubles the centerfrequency.
DescriptionTraces, user-defined traces, and trace ranges are multiplied as 16-bit integers. Negativenumbers are represented in two’s complement format. ,Single variables and numbers aretreated as floating point numbers and must be within the real number range as defined in Table5-l.
When the source is longer than the destination, the source is truncated to fit. When the sourceis shorter than the destination, the last element is repeated to fill the destination.
Programming Commands 5-373

MS1Mass Storage IsAllows you to specify the current mass storage device as the spectrum analyzer memory or amemory card.
Syntax
Related Commands: CAT, SAVRCLN.
Example
OUTPUT 718 ; “MS1 CARD ; ‘I Selects the memory card as the current wmss storage dewice.
DescriptionIf you specify INT, the current mass storage device is set to spectrum analyzer memory. If youspecify CARD, the current mass storage device is set to the memory card. fir the HP 859OLor HP 859ZL only: Your spectrum analyzer must have Option 003 installed in it to select thememory card as the mass storage device.
If MS1 is used as a predefined variable, it returns a “0” if the mass storage device is thespectrum analyzer memory and a “ 1” if it is the memory card.
Query Response
5-374 Programming Commands

MXM Maximum
MXMM2lXhU.InCompares source 1 and source 2, point by point, sending the greater value of each comparisonto the destination.
Syntax
7 d e s t i n a t i o n -
II
J
p r e d e f i n e d v a r i a b l e I
I
1 L&xl.
User-defined trace
User-defined variable
Predeflned variable A command that acts as a variable. Refer to Table 5-l.
Predefined function Function that returns a value. Refer to Table 5-1.
Trace range A segment of trace A, trace B, trace C, or a user-defined trace.
Number Any real or integer number.
A trace defined by the TRDEF command.
A variable defined by VARDEF or ACTDEF commands.
-----Any valid trace name.
Any valid variablename.
Real number range.
Prerequisite Commands: TRDEF when using a user-defined trace. ACTDEF or VARDEF whenusing a user-defined variable. TS when using trace data.Related Commands: MIN, PKPOS, TS.
Programming Commands 5-375
MXM Maximum
Example
10 OUTPUT 718;"IP;"20 OUTPUT 718;"CF 300MHZ;SNGLS;"
30 OUTPUT 718;"TS;VIEW TRA;"
40 OUTPUT 718;"MXM TRB,TRA,4000;"
50 OUTPUT 718;"BLANK TRA;VIEW TRB;"60 END
Description
Initializes spectrum analyzerChanges the centerfrequency and activate single-sweep mode.Updates trace. Displays and stores the results oftrace A.Moves elements of trace A that exceed 4OUO tracedata points (above center screen) to trace BDisplays result.
If one of the sources is a single value, it acts as a threshold; all values equal to or greater thanthe threshold pass to the destination.
When the source is longer than the destination, the source is truncated to fit. When the sourceis shorter than the destination, the last element is repeated to fill the destination.
5.376 Programming Commands

MXMH Maximum Hold
MXMHMaximum HoldUpdates each trace element with the maximum level detected.
Syntax
MXMH
Equivalent Softkeys: l4A% fiOLD A and MAX HOLD B .Related Commands: BLANK, CLRW, MINH, VAVG, VIEW.Restrictions: Not available with Analog+ display mode. See “ANLGPLUS” for moreinformation.
ExampleOUTPUT 718;"MXMH TRA;"
DescriptionMXMH updates the specified trace (either trace A or trace B) with a new value from a detectoronly if the new value is larger than the previous trace data value.
Programming Commands 5-377
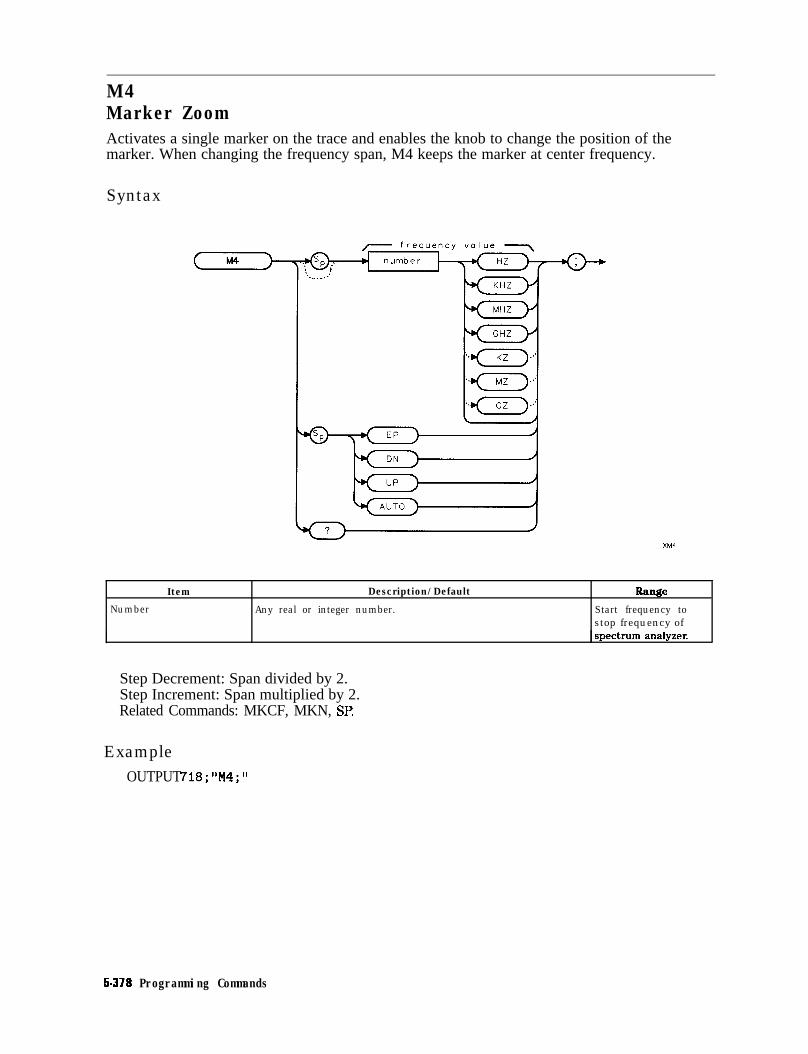
M4Marker ZoomActivates a single marker on the trace and enables the knob to change the position of themarker. When changing the frequency span, M4 keeps the marker at center frequency.
Syntax
XM4
Item Description/Default R=r3e
Number Any real or integer number. Start frequency tostop frequency of
Step Decrement: Span divided by 2.Step Increment: Span multiplied by 2.Related Commands: MKCF, MKN, SI?
ExampleOUTPUT 718;“M4;”
5-376 Programming Commands

M4 Marker Zoom
DescriptionUsed with a marker on the signal peak or at a position of interest, M4 keeps the marker atcenter screen while the frequency span is decreased.
Query Response
Programming Commands 5-379

NDBNumber of dBSpecifies the distance (in dB) from the signal peak for the N dB points measurement (NDBPNT).
Syntax
dB f r o m
XNDB
Item Description/Default Rw!e
Number Any negative real or negative integer number. Default unit is dB. - 1 to -80 dB.
Preset State: -3 dB.Related Commands: MKBW, MKPX, NDB, NDBPNT, NDBPNTR, TH.Restrictions: Not available for the windows display mode.
ExampleOUTPUT 718;"MOV NDBPNT,l;" lkns on the N dB points masurmt.OUTPUT 718;"NDB -6DB;" Sets the N dB points masurernent to measure 6 dB below
the signal’s peak.OUTPUT 718;"NDBPNTR?;" Queries NDBPNTR. NDBPNTR contains the rneasurenzent
results of the N dB points measurement.ENTER 718;Six Stores the result in the variable Six.
DescriptionWhen the NdB points function is turned on, the spectrum analyzer finds the bandwidth, atthe number of dB down specified by the NDB command, of the highest on-screen signal. Thehighest on-screen signal must be greater than the peak excursion above the current threshold,but the N dB points may fall below the threshold.
Query Response
dB f r o m/ peak \
o u t p u tt e r m i n a t i o n +
5.380 Programming Commands

NDBPNT N dB Points
NDBPNTN dB PointsTurns on or off the N dB points function.
Syntax
XNDBPNT
Equivalent Softkey: # d3 PTS ON OFF.Related Commands: MKBW, MKPX, NDB, NDBPNTR, TH.
ExampleThis example finds the shape factor of a signal.
OUTPUT 718;"MOV NDBPNT,l;"
OUTPUT 718;"NDB -6DB;"
OUTPUT 718."NDBPNTR'*", - ,
ENTER 718;Six
OUTPUT 718;"NDB -6ODB;"
OUTPUT 718;"NDBPNTR?;"ENTER 718;Sixty
IF Six 0 -100 AND Sixty <> -100 THEN
Turns on the N dB pointsmeasurement.Sets the N dB points mea-surW to wmxsure 6 dBbelow the sign& !s peak.Queries NDBPNTR. NDBPNTRcontains the wzmsurernent re-sults of the N dBpoints mmsurement.Stores the result in the vari-able Six.Sets the N dB points rnea-surernent to measure 60 dBbelow the signal’s peak.Queries NDBPNTR.Stores the result in the vari-able Sixty.If both the rneasurernmt at-6dBand-60dBweremlid,print the shape factor of thesignal.
PRINT "Shape factor is ",Sixty/Six Prints the shape factor of thesignal.
ELSE Cfthe bandwidth at -6 dB or-60 dB could not be found,an error statement isprinted.
PRINT "Error, bandwidth could not be determined"END IF
Programming Commands 5.381

OUTPUT 718;“MOV NDBPNT,O;” Turns off the N dB pointsmemr-t.
DescriptionSetting NDBPNT to 1 turns on the N dB points measurement. Setting NDBPNT to 0 turns offthe N dB points measurement. When the NdB points function is turned on, the spectrumanalyzer finds the bandwidth, at the number of dB down specified by the NDB command, ofthe highest on-screen signal. The N dB points measurement is repeated at the end of everysweep (NDBPNT uses the ONEOS command to update the measurement data) until you turn offthe N dB points measurement. To determine the bandwidth measured by NDBPNT, you mustquery NDBPNTR.
To be able to measure a signal with NDBPNT, there must be an on-screen signal that is greaterthan the peak excursion (see “MKPX” for more information about the peak excursion) abovethe threshold, and there cannot be any other signals with amplitudes within N dB of the peakof the highest signal. If a signal cannot be found or there is more than one signal within thevalue of NDB of the highest signal, the value of NDBPNTR will be -100.
You can execute the NDBPNT command two different ways. You can either execute theNDBPNT command directly (for example, “NDBPNT 1; ‘I) or use the MOV command to movethe 1 or 0 into the NDBPNT command (for example, “MOV NDBPNT, 1; ‘I). If you use the MOVcommand, no text is displayed in the active function area during command execution.
RestrictionsTurning on the NDBPNT function turns off the following functions: windows display mode(WINON), the FFT menu measurements (FFTAUTO, FFTCONTS, FFTSNGLS), gate utilityfunctions (GDRVUTIL), TO1 measurement (TOI), marker table (MKTBL), peak table (PKTBL),percent AM (PCTAM), peak zoom (PKZOOM), and power menu measurements (ACP, ACPE, CHP,and OBW).
You should turn off the N dB points measurement (set NDBPNT to 0) when you are done withthe N dB points measurement.
Query Response
r Off 7
1”
0 o u t p u t
f
’ t e r m i n a t i o n +
QNDBPNl
5-382 Programming Commands

NDBPNTR N dB Points Bandwidth
NDBPNTRN dB Points BandwidthReturns the bandwidth measured by the N dB points measurement (NDBPT).
Syntax
NDBPNTR
Related Commands: MKPX, NDB, NDBPNT, TH.
Example
OUTPUT 718;"MOV NDBPNT,l;" Turns on the N dB points measurement.OUTPUT 718;"NDB -6DB;" Sets the N dB points measurement to mmsure 6 dB below
the signal’s peak.OUTPUT 718;"NDBPNTR?;" Queries NDBPNTR. NDBPNTR contains the measurement
results of the N dB points measurement.ENTER 718;Six Stores the result in the variable Six.
DescriptionNDBPNTR returns a -100 if the NDBPNT function has not been turned on, or if NDBPNT didnot find a signal to measure. (For NDBPNT to be able to measure a signal, there must be anon-screen signal that is greater than the peak excursion above the threshold, and there cannotbe any other signals with amplitudes that are within N dB of the peak of the highest signal.)
Query Response
b o n d w i d t h’
o u t p u tt e r m i n a t i o n +
Programming Commands 5-383

NRLNormalized Reference LevelSets the normalized reference level.
Syntax
I t e m Description/Default I Range
Number Any real or integer number. Default unit is dBm.
Preset State: 0 dB.Related Commands: MEASURE, RL, RLPOS.
Example
10 OUTPUT 718*"IP*"20 OUTPUT 718;"SRCPWR -1ODB;"30 PRINT "CONNECT TRACKING GENERATOR OUTPUT TO INPUT"40 PRINT "THEN PRESS CONTINUE"50 PAUSE60 OUTPUT 718;"MEASURE SR;"
70 OUTPUT 718;"CLRW TRB;TS;"
80 OUTPUT 718;"BLANK TRB;"so PRINT "CONNECT DEVICE TO ANALYZER"100 PRINT "THEN PRESS CONTINUE"110 PAUSE120 OUTPUT 718;"CLRW TRA;TS;"
130 OUTPUT 718;"AMBPL ON;"140 OUTPUT 718;"RLPOS 4;"
150 OUTPUT 718;"NRL 40DB;"
160 END
Initializes spectrum anal2/2erSets tracking generator output.
Sets the measurement modeto stimulus-response.lbkes a measurement sweepof thejlatness of the system.
Zxkes a mxxzsurement sweepof the device under test inthe system.Normalizes the response.Changes the location of thereference level to thefourthgraticule from the bottom.Oflsets trace A so it is on-screen.
5-384 Programming Commands

NRL Normalized Reference Level
DescriptionThis function is a trace-offset function that enables you to offset the displayed trace withoutintroducing hardware-switching errors into the stimulus-response measurement. The inputattenuator and IF step gains are not affected when using NRL.
In absolute power mode (dBm), reference level affects the gain and RF attenuation settings ofthe instrument, which affects the measurement or dynamic range. In normalized mode (relativepower or dB-measurement mode), NRL offsets the trace data on-screen and does not affect theinstrument gain or attenuation settings. This allows the displayed normalized trace to be movedwithout decreasing the measurement accuracy due to changes in gain or RF attenuation. If themeasurement range must be changed to bring trace data on-screen, then the range level shouldbe adjusted. Adjusting the range-level normalized mode has the same effect on the instrumentsettings as does reference level in absolute power mode (normalize off).
Query Response
Programming Commands 5-385
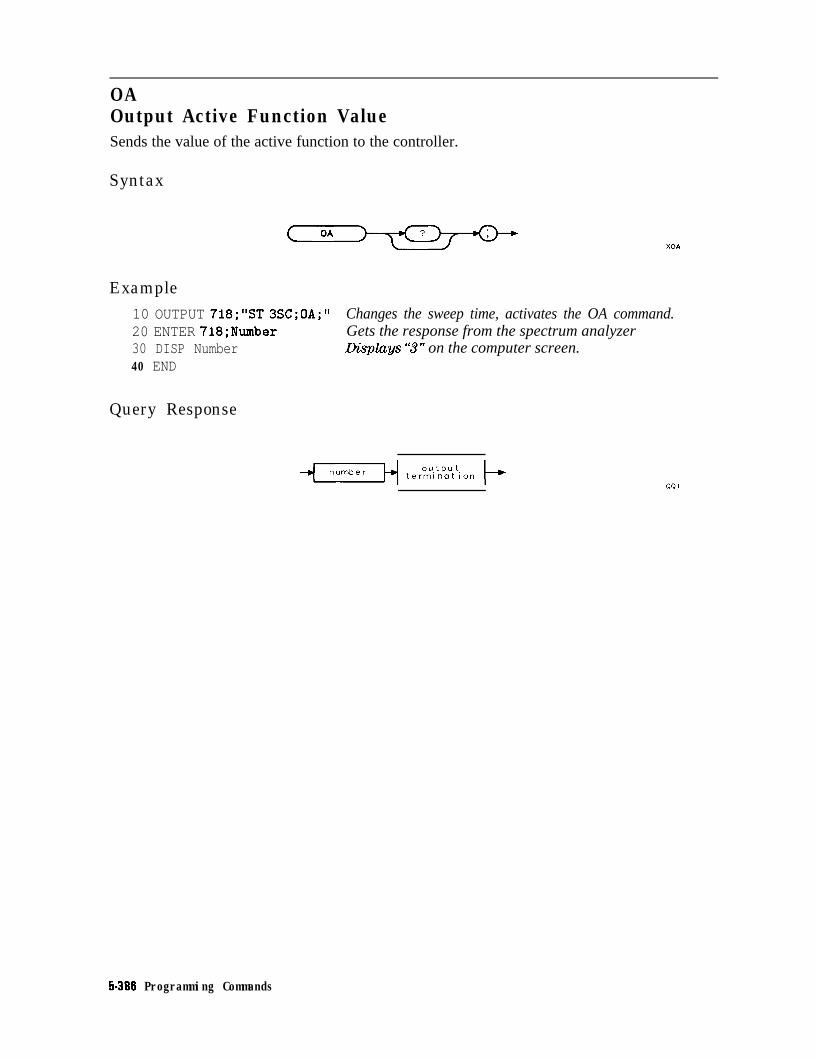
OAOutput Active Function ValueSends the value of the active function to the controller.
Syntax
Example10 OUTPUT 718;"ST 3SC;OA;" Changes the sweep time, activates the OA command.20 ENTER 718;Number Gets the response from the spectrum analyzer30 DISP Number LIispkqys “3” on the computer screen.40 END
Query Response
5-388 Programming Commands

OBW Occupied Bandwidth
OBWOccupied BandwidthPerforms the occupied bandwidth measurement using the value for occupied bandwidthpercent (OBWPCT). For example, if OBWPCT is set to 99 percent, OBW determines the 99percent power bandwidth.
Syntax
OBW
Equivalent Softkey: OCCUPIED BANDWDTH .Related Commands: ACPPAR, ACPSNGLM, ACPCONTM, ACPSP, OBWPCT.
ExampleOUTPUT 718*"OBW*"9 >
DescriptionOBW measures the power bandwidth of the measured spectrum based on the value of occupiedbandwidth percent (OBWPCT). OBW also measures transmit frequency error (the differencebetween the center frequency and the midpoint of the percent occupied bandwidth), and thetotal power of the occupied bandwidth. OBW performs the measurement using the value forchannel spacing (ACPSP).
To use OBW:
1. Set the center frequency to the carrier’s frequency.
2. For best accuracy, set the reference level so that the carrier signal peak is within the first(top) division of the screen graticule.
3. Select the channel spacing with the ACPSP command.
4. If you want the spectrum analyzer settings to be set automatically, ensure that ACPPAR isset to 1. If you want to set the spectrum analyzer settings manually, set ACPPAR to 0. See“ACPPAR” for more information about selecting the spectrum analyzer settings manually.
5. If the spectrum analyzer is in the continuous-sweep mode, use the single sweep command(SNGLS) to select the single-sweep mode.
6. Execute the OBW command.
7. Query OBWBW, OBWLOWER, OBWUPPER, OBWFERR, and OBWPWR variables for thenumeric results of the OBW measurement. See the following table for more informationabout these variables.
8. Query trace A (TRA) for the trace results of the OBW measurement.
Measurement Results: The results of the OBW command are stored in the variables and tracein the following table.
Programming Commands 5-387

OBW Occupied Bandwidth
OBW Measurement Results
Variableor Trace
Description units
OBWBW
OBWLOWER
OBWUPPER
OBWFERR
A variable that contains the bandwidth measured by OBW. HZ
A variable that contains the relative lower frequency limit of the occupied Hzbandwidth. The lower frequency limit is relative to the center frequency ofthe spectrum analyzer. The lower frequency limit is equal to the frequencyof the lower occupied bandwidth edge minus the center frequency of thespectrum analyzer.
A variable that contains the relative upper frequency limit of the occupied Hzbandwidth. The upper frequency limit is relative to the center frequency ofthe spectrum analyzer. The upper frequency limit is equal to the frequencyof the upper occupied bandwidth edge minus the center frequency of thespectrum analyzer.
A variable that contains the occupied bandwidth transmit frequency error. HzThis error is equal to the following:
OBWPWR
TRA
F~equencyerror =(OBWUPPER + OBWLOWER)
2
A variable that contains the total power in the occupied bandwidth. The Determined bytotal power of the occupied bandwidth is a summation of the power over AUNITS command.the measured occupied bandwidth. Default unit is dBm.
TRA is trace A. Trace A contains the swept RF spectrum that was used to Determined by themeasure occupied bandwidth. trace data format
(TDF) command.
RestrictionsExecuting OBW turns off the following functions: windows display mode (WINON), N dB pointmeasurement (NDBPNT), the FFI’ menu measurements (FFIAUTO, FFTCONTS, FFTSNGLS),gate utility functions (GDRVUTIL), TO1 measurement (TOI), marker table (MKTBL), peak table(PKTBL), percent AM (PCTAM), and peak zoom (PKZOOM).
5-388 Programming Commands

OBWPCT Occupied Bandwidth Percent
OBWPCTOccupied Bandwidth PercentSpecifies the percent of total power that is to be used in calculating the occupied bandwidth(OBW).
Syntax
% p e r c e n t/ \
f+
Item Description/Default R-k3
Number Any real or integer number. 1% to 99.99%.
Equivalent Softkey: OCC l3W % POWER.Initial Value: 99.Preset State: Last value entered.Related Commands: OBW.
Example
OUTPUT 718;“MOV OBWPCT,SO;” Sets the occupied bandwidth percent to 50%.OUTPUT 718; “OBW; ” I+yforms the occupied bandwidth wteasurement.
DescriptionOnce you enter a value into OBWPCT, that value is retained until you change it, or executeDISPOSE ALL. Pressing (j-1 or turning the spectrum analyzer off does not change thevalue of OBWPCT.
You can execute the OBWPCT command two different ways. You can either execute theOBWPCT command directly (for example, “OBWPCT 50 ; I’) or use the MOV command to movethe value into the OBWPCT command (for example, “MOV OBWPCT ,50 ; ‘I). If you use the MOVcommand, no text is displayed in the active function area during command execution.
Query Response
/ p e r c e n t ,
o u t p u tt e r m i n o t i o n --*
Programming Commands 5.388

OLOutput Learn StringTransmits information to the controller that describes the state of the spectrum analyzer whenthe OL command is executed.
Syntax
Related Commands: RCLS, SAVES.
Example10 DIM Learn-String$ [202] Allocates rn-ewmy space for the Learnd3Ping.20 OUTPUT 718 ; “OL ; ” Asks for first state.30 ENTER 718 USING ‘I# ,202A”; LEARN-STRINGS Computer receives the irlformation.40 DISP “CHANGE ANALYZER TO ANOTHER STATE,
THEN CONTINUE TO RESTORE FIRST STATE;”50 PAUSE60 OUTPUT 718; LEARN-STRING$
70 END
Returns the spectrum analyzer to its for-mer state (when OL was first activatedin line 20).
DescriptionThe information received from the spectrum analyzer is called the learn string. The learn stringcan be sent from the controller back to the spectrum analyzer to restore the spectrum analyzerto its original state.
The learn string requires 202 bytes of storage space. See “Saving and Recalling InstrumentStates, n in Chapter 3 for more information.
To restore the spectrum analyzer to the learn string state, you must return the learn string tothe spectrum analyzer. The learn string contains information to tell the spectrum analyzer thatit is learn string data. (Also see “RCLS” and “SAVES.“)
5-380 Programming Commands

ONCYCLE On Cycle
ONCYCLEOn CycleExecutes the list of analyzer commands periodically.
Syntax
u s e r - d e f i n e d v a r i a b l e
fcorrmands t o
/ b e e x e c u t e d \
XONCYCLE
Item
Number
User-defined variable
Delimiter
Analyzer command
Description/Default Range
A valid number. 0 to 2,147,483seconds.
A variable defined by VARDEF or ACTDEF commands. Any valid variablename.
Matching characters marking the beginning and end of the list of - ) \ @ = / ^ $ % ; ! ’ :spectrum analyzer commands. ” &
Any spectrum analyzer command.
Related Commands: CAT, DISPOSE, ERASE, IP, ONDELAY, ONEOS, ONMKR, ONSRQ,ONSWP, ONTIME.
Example
OUTPUT 718;"ONCYCLE 86400,!MKPK HI;!;" Places a marker on the highest signal peakeverg 24 hours (86,400 equals 24 hours x 60minutes x 60 seconds).
Programming Commands 5-391

ONCYCLE On Cycle
DescriptionThe ONCYCLE command performs the list of spectrum analyzer commands
periodically. In contrast, the ONDELAY command performs the list of spectrum analyzercommands once after the elapsed time interval. After the ONCYCLE function has been created,the first execution of the spectrum analyzer commands does not occur until the time value haselapsed.
Limit the number of characters (between the delimiters) in the list of spectrum analyzercommands to a maximum of 2047 characters.
Clearing the ONCYCLJZ definition: IP clears the ONCYCLE definition. You can use theDISPOSE command to clear the ONCYCLE definition also.
Query Response
t ime
# A m s b l e n g t h
a n a l y z e r command o u t p u tt e r m i n o t i o n ä
OONCYCLE
5.392 Programming Commands

ONDELAY On Delay
ONDELAYOn DelayExecutes the list of analyzer commands after the time value has elapsed.
Syntax
t i m e
del i m i t e r
u s e r - d e f i n e d v a r i a b l e
/comnonds t o
/ b e e x e c u t e d \
XONDELAY
Item
Number
User-defined variable
Delimiter
Analyzer command
Description/Default Range
A valid number. 0 to 2,147,483 seconds
A variable defined by VARDEF or ACTDEF commands. Any valid variablename.
Matching characters marking the beginning and end of the list of - 1 \ @ = / ^ $ % ; ! ’ :spectrum analyzer commands. ” &
Any spectrum analyzer command.
Related Commands: CAT, DISPOSE, ERASE, IP, ONCYCLE, ONEOS, ONMKR, ONSRQ,ONSWP, ONTIME.
Example
OUTPUT 718;"ONDELAY 000030,!CF 1.2GHZ;!;" Changes the center frequency after 30seconds.
Programming Commands 5-393

ONDELAY On Delay
DescriptionThe ONDELAY command performs the list of spectrum analyzer commands once afterthe elapsed time interval; the ONCYCLE command performs the list of spectrum analyzercommands periodically.
Limit the number of characters (between the delimiters) in the list of spectrum analyzercommands to a maximum of 2047 characters.
Clearing the ONDEIAY definition: IP clears the ONDELAY definition. You can use theDISPOSE command to clear the ONDELAY definition also.
Query Response
t i m e l e f tu n t i l e v e n t/ \
# A m s b l e n g t h I s b l e n g t h
QONDELAY
5-394 Programming Commands

ONEOS On End of Sweep
ONEOSOn End of SweepExecutes the contents of the data field after the end of the sweep.
Syntax
I r s t r i n g d a t a f i e l d 7
A - b l o c k d a t a f i e l d
l - b l o c k d a t a f i e l d
a n a l y z e r comnond c h a r a c t e r 6% E O I
Item
Delimiter
Analyzer command
Msb length
Lsb length
Character & EOI
Description/Default Range
Matching characters marking the beginning and end of the list of - 1 \ @ = I ^ $ % ; ! ’ :spectrum analyzer commands. ” &
Any spectrum analyzer command except TS.
Most signif?cant byte of a two-byte word that describes thenumber of bytes transmitted.
Least significant byte of a two-byte word that describes thenumber of bytes transmitted.
Any valid character and END.
Related Commands: CAT, DISPOSE, ERASE, IP, ONSWI?
Example
OUTPUT 718;"ONEOS!CF IOOMHZ;!" Center frequemg is changed at the end of the sweep.
Programming Commands 5-395

ONEOS On End of Sweep
DescriptionRestrictions: The list of analyzer commands should not include a take sweep (TS). Limit thenumber of characters (between the delimiters) in the list of spectrum analyzer commands to amaximum of 2047 characters.
The #A, msb length, LSB length, and character data form a A-block data field. The A-blockdata field is used when the length of the character data is known. The #I, character data, andEOI (END) form and I-block data field. The I-block data field is used when the length of thecharacter data is unknown. The I-block data field is available for HP-IB interface only.
Clearing the ONEOS definition: IP clears the ONEOS definition. You can use the DISPOSEcommand to clear the ONEOS definition also.
Query Response
< #A m s b l e n g t h a n a l y z e r cotwnand
kto u t p u tt e r m i n a t i o n
5-396 Programming Commands

ONMKR On Marker
ONMKROn MarkerPerforms the list of spectrum analyzer commands when the sweep reaches the marker position.
Syntax
conmands t o/ b e e x e c u t e d \
a n a l y z e r comnand
Item
Delimiter
Analyzer command
Description/Default Rui!e
Matching characters marking the beginning and end of the list of - ( \ @ - / ^ $ % ; ! ’ :spectrum analyzer commands. ” &
Any spectrum analyzer command.
Related Commands: CAT, DISPOSE, ERASE, IP, ONCYCLE, ONDELAY, ONEOS, ONSRQ,ONSWP, ONTIME.Restrictions: Not available with Analog+ display mode. See “ANLGPLUS” for moreinformation.
ExampleOUTPUT 718;"ONMKR !PU,PA 100,lOO;TEXTQCONNECT CAL The text is displayed on theOUT TO INPUTQ;!;" spectrum analyzer screen when
the sweep reaches the markerposition.
DescriptionThe ONMKR command performs the list of spectrum analyzer commands when the sweepreaches the marker. The sweep resumes after the list of spectrum analyzer commands isexecuted, provided the list of spectrum analyzer commands does not halt execution.
Limit the number of characters (between the delimiters) in the list of spectrum analyzercommands to a maximum of 2047 characters.
Clearing the ONMKR definition: IP clears the ONMKR definition. You can use the DISPOSEcommand to clear the ONMKR definition also.
Programming Commands 5-397

ONMKR On Marker
Query Response
-+( #A m s b l e n g t h a n a l y z e r comnand
43o u t p u tt e r m i n a t i o n
5-366 Programming Commands

ONMKRU On Marker Update
ONMKRUOn Marker UpdateExecutes the Iistofspectrum analyzer commands whenever the value or the units of the activemarker are changed.
Syntax
corrmands t o- b e e x e c u t e d -
de I imt t e r analyzer comnond del i m i t e r
Related Commands: DISPOSE,IP.
ExampleThe following example uses ONMKRU to display the marker's amplitude in watts.
150 ASSIGN QSa TO 718160 !170 OUTPUT OSa;"VARDEF T,EMP,O;";180 !190 OUTPUT QSa;"ONMKRU$";200 OUTPUT OSa;"EXP T-EMP,MA,lO;"
Assigns the IO path to spectrum anulyxer:
Lk$ines a variable called T-EM2
210 OUTPUT @Sa;"MPY T-EMP,T-EMP,lOOO;t';220 OUTPUT OSa;"MOV DA,O;";
230240250260270280290
OUTPUT QSa;"PUPAlO,lOI;";OUTPUT OSa;"TEXT-Power:-;";OUTPUT OSa;"DSPLY T-EMP,9.4;";OUTPUT OSa;"TEXT- uW^;";
OUTPUT @Sa;"$;";I
Starts the ONMKRU o!x$nition.Changes the marker’s amplitude valueto milliwatts and places it in T-EmChanges the value of T-EMP to pwatts.Changes the display address to 0 toreset the display list.B.&ions the pen.Displays a label for the results.Displays the results.Displays the units.Ends the ONWRU d@nition.
OUTPUT OSa;"CF300MZ;" Sets the center frequency to the cali-bration signal.
300 OUTPUT OSa;"SPlMZ;" Changes the span to 1 MHz.310 OUTPUT QSa;"RL -2ODM;" Sets the reference level.320 OUTPUT QSa;"RB30KZ;" Sets the resolution bandwidth.
Programming Commands 5-399

ONMKRU On Marker Update
330 OUTPUT QSa; "SNGLS;TS;"340 OUTPUT QSa;"MKN;"350 !360 END
Takes a sweep.Activates a mm1 wmrkm
DescriptionONMKRU executes the specified user-defined function whenever the value or units of a markerare changed, While ONMKR executes the function when the marker is encountered, ONMKRUexecutes the function at the end of the sweep (when the marker data is updated), when themarker is moved, or if the units are changed with AUNITS. Executing any of the markercommands (for example, MKA, MKF, or MKNOISE) also executes the function.
Restrictions: The user-defined function should not include a take sweep (TS).
Clearing the ONMKRU definition: IP clears the ONMKRU definition. You can use theDISPOSE command to clear the ONMKRU definition also.
Query Response
< #A
5-400 Programming Commands

ONPWRUP On Power Up
ONPWRUPOn Power UpExecutes the list of spectrum analyzer commands once on power up.
Syntax
/
c o m m a n d s t o/ b e e x e c u t e d \
Related Commands: CAT, DISPOSE, ERASE, ONDELAY, ONEOS, ONMKR, ONSWP, ONTIME
Example10 OUTPUT 718;"0NPWRUP! SPlOMZ; CF300MZ;!;" Sets the spectrum analyzer span to
10 MH.. and the center frequency to3OOMHizuponinstrumentpowwup.
DescriptionLimit the number of characters (between the delimiters) in the list of spectrum analyzercommands to a maximum of 2047 characters.
Clearing the ONPWRUP definition: DISPOSE.
Note If an infinite loop is inadvertently programmed in an ONPWRUP, press [PRESET)to terminate the ONPWRUP, then DISPOSE the ONPWRUP. Powering thespectrum analyzer on and off will not terminate the ONPWRUP.
Programming Commands 5-401

ONSRQOn Service RequestExecutes the list of analyzer commands whenever a service request occurs.
Syntax
c o m m a n d s t o- b e e x e c u t e d 7
d e l i m i t e r d e l i m i t e r
XONSRO
Item
Delimiter
Analyzer command
Description/Default Rmife
Matching characters marking the beginning and end of the list of - 1 \ @ = / ^ $ % ; ! ’ :spectrum analyzer commands. ” &
Any spectrum analyzer command.
Related Commands: CAT, DISPOSE, ERASE, IP, ONDELAY, ONEOS, ONMKR, ONSWP,ONTIME, SRQ.
Example
OUTPUT 718;"ONSRQ !PU;PA 100,lOO;TEXT QSRQ OCCURRED@; !;” “SRQOCCURRED”isdis-played on the spectrumanalyzer screen if an SRQis encountered.
DescriptionLimit the number of characters (between the delimiters) in the list of spectrum analyzercommands to a maximum of 2047 characters.
Clearing the ONSRQ definition: IP clears the ONSRQ definition. You can use the DISPOSEcommand to clear the ONSRQ definition also.
5-402 Programming Commands

ONSRQ On Service Request
Query Response
< #A a n a l y z e r comnand
OONSRO
Programming Commands 5403

ONSWPOn SweepExecutes the list of spectrum analyzer commands at the beginning of the sweep.
Syntax
r /
r s t r i n g d a t a f i e l d 7
/ A - b l o c k d a t a f i e l d
a n a l y z e r cormand
/
l - b l o c k d a t a f i e l d
c h a r a c t e r & E O I
Item
Delimiter
Analyzer command
Msb length
Lsb length
Character & EOI
Description/Default Range
Matching characters marking the beginning and end of the list of - 1 \ @ = / ^ $ % ; ! ’ :spectrum analyzer commands. ” &
Any spectrum analyzer command except TS.
Most signillcant byte of a two-byte word that describes thenumber of bytes transmitted.
Least significant byte of a two-byte word that describes thenumber of bytes transmitted.
Any valid character and END.
Related Commands: CAT, DISPOSE, ERASE, IP, ONDELAY, ONEOS, ONMKR, ONSRQ,ONSWP.
ExampleOUTPUT 718;"0NSWP!CF IOOMHZ;!" The center frequency is changed to 100 iW%z at the
beginning of the sweep.
5-404 Programming Commands

ONSWP On Sweep
DescriptionThe list of analyzer commands should not include a take sweep (TS). Limit the number ofcharacters (between the delimiters) in the list of spectrum analyzer commands to a maximumof 2047 characters.
The #A, msb length, lsb length, and character data form an A-block data field. The A-blockdata field is used when the length of the character data is known. To use the A-block dataformat, #A must precede the msb length and lsb length. The msb length and lsb lengthrepresent the length of the character data. The #I, character data, and EOI (END) form anI-block data field. The I-block data field is used when the length of the character data isunknown. The I-block data field is available for the HP-IB interface only.
Clearing the ONSWP definition: IP clears the ONSWP definition. You can use the DISPOSEcommand to clear the ONSWP definition also.
Query Response
+( #A m s b l e n g t h Isb l e n g t h a n a l y z e r comnand
QONSWP
Programming Commands 5-405


ONTIME On Time
DescriptionLimit the number of characters (between the delimiters) in the list of spectrum analyzercommands to a maximum of 2047 characters.
Clearing the ONTIME definition: IP clears the ONTIME definition. You can use the DISPOSEcommand to clear the ONTIME definition also.
Query Response
/- yeor -1 , - m o n t h -, - day \
d i g i t d i g i t d i g i t d i g i t
,- h o u r s ‘-\ /- m i n u t e s .-\ ,- s e c o n d s ‘-\
d i g i t d i g i t d i g i t d i g i t
#A m s b l e n g t h
OONT I ME
Programming Commands 5-407
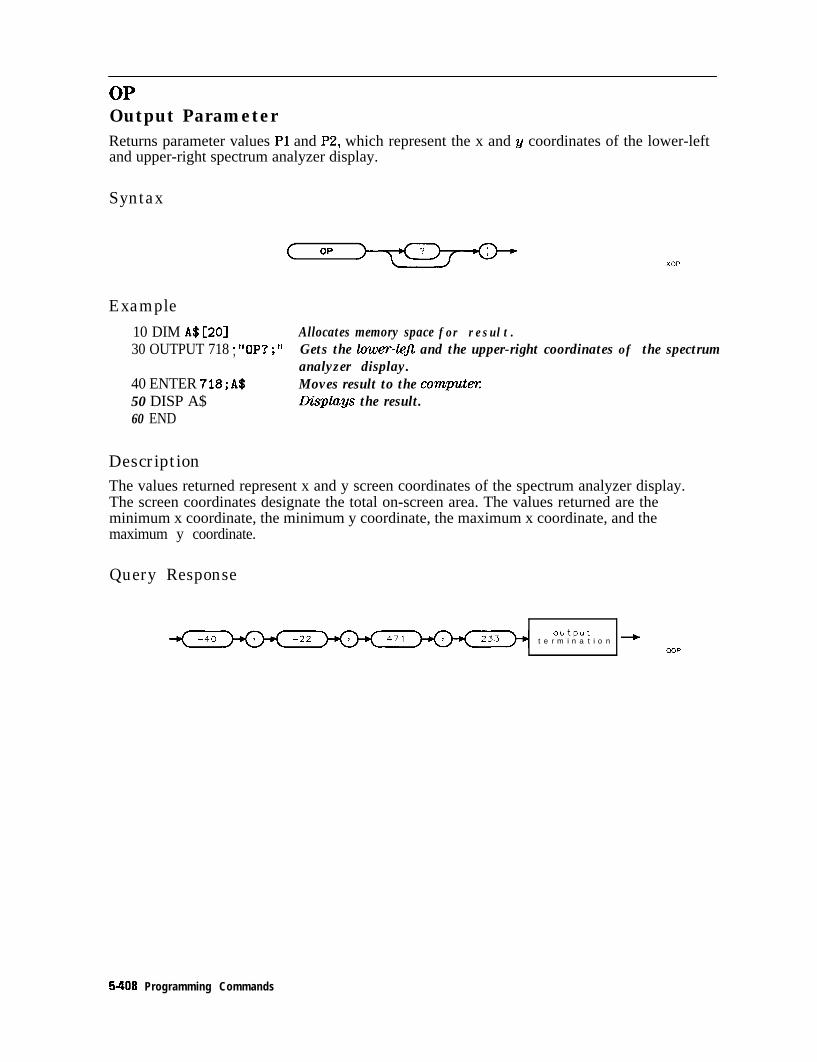
OPOutput ParameterReturns parameter values Pl and P2, which represent the x and y coordinates of the lower-leftand upper-right spectrum analyzer display.
Syntax
C OP
Example
10 DIM A$[201 Allocates memory space for result.30 OUTPUT 718 * “OP’ * ”, * 9 Gets the lower-kfl and the upper-right coordinates of the spectrum
analyzer display.40 ENTER 718;A$ Moves result to the computex50 DISP A$ Dkplays the result.60 END
DescriptionThe values returned represent x and y screen coordinates of the spectrum analyzer display.The screen coordinates designate the total on-screen area. The values returned are theminimum x coordinate, the minimum y coordinate, the maximum x coordinate, and themaximum y coordinate.
Query Response
outputt e r m i n a t i o n +
‘2OP
5408 Programming Commands
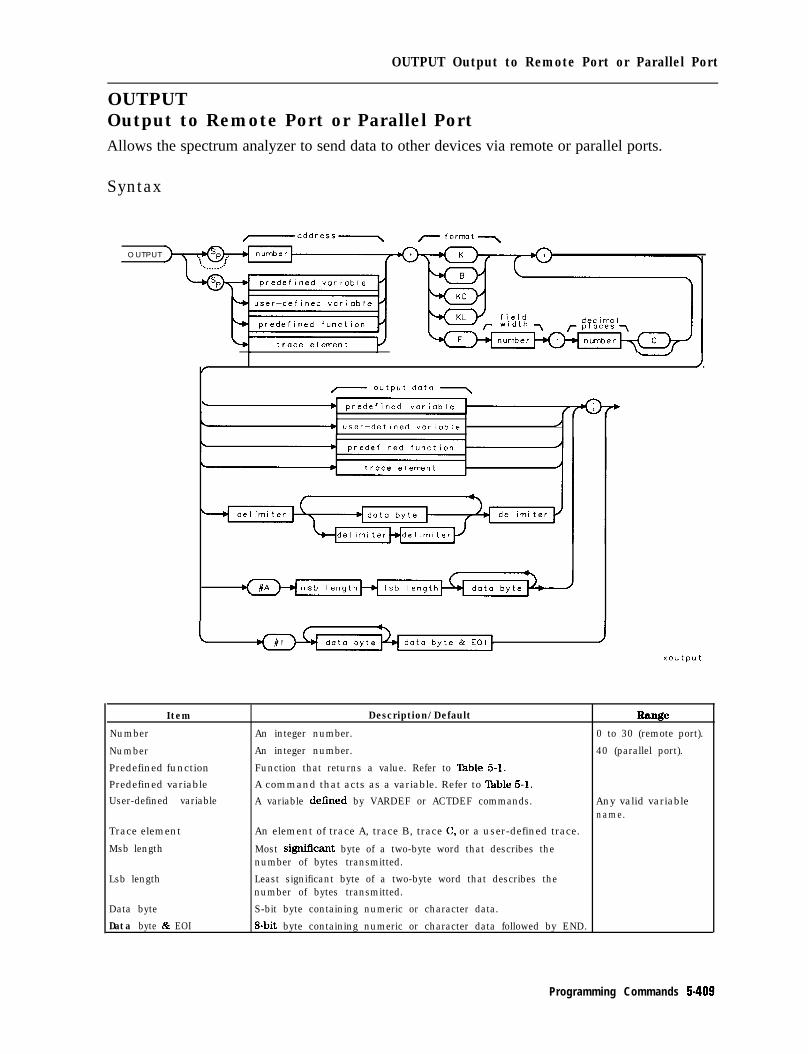
OUTPUT Output to Remote Port or Parallel Port
OUTPUTOutput to Remote Port or Parallel PortAllows the spectrum analyzer to send data to other devices via remote or parallel ports.
Syntax
O U T P U T
,-address.-,
predefined variable N’
user-defined variable I
trace element-
f/ output doto \
- predefined variable
/
user-defined variable /
trace element
del imi ter
delimiter
data byte & EOI I
xoutput
Item
Number
Number
Predefined function
Predefined variableUser-defined variable
Trace element
Msb length
Lsb length
Data byte
Data byte & EOI
Description/Default Rw3e
An integer number. 0 to 30 (remote port).
An integer number. 40 (parallel port).
Function that returns a value. Refer to lbble 5-l.
A command that acts as a variable. Refer to Table 5-l.
A variable defined by VARDEF or ACTDEF commands. Any valid variablename.
An element of trace A, trace B, trace C, or a user-defined trace.
Most signifkant byte of a two-byte word that describes thenumber of bytes transmitted.
Least significant byte of a two-byte word that describes thenumber of bytes transmitted.
S-bit byte containing numeric or character data.
&bit byte containing numeric or character data followed by END.
Programming Commands 5.408
OUTPUT Output to Remote Port or Parallel Port
Prerequisite Commands: ACTDEF or VARDEF when using a user-defined variable.Related Commands: ENTER, RELHPIB.
ExampleThis example assumes that the plotter is at address 5 and the spectrum analyzer is at address18. (The program is only valid for HP 9000 Series 200 and 300 computers.)
The following example uses the spectrum analyzer to send the ASCII code for OP; (outputparameter) to the plotter. The ENTER command is then used to receive the coordinates fromthe plotter. Program lines 110 to 140 display the coordinates on the spectrum analyzer screen.Softkey 1 is programmed to display the plotter coordinates. Softkey 1 can be accessed bypressing (j-1, IJser Menus .
Note Disconnect the computer before pressing softkey 1 or execute ABORT 7,LOCAL 7 from the computer. The execute the P-OP function, the spectrumanalyzer must be the only controller on the HP-IB.
10 OUTPUT 718;"VAFlDEF P,ONEX,l,VARDEF P,ONEY,l;" Dechres the variables used tohold the plotter coordinates.
20 OUTPUT 718;"VARDEF P-TWOX,l;VARDEF P,TWOY,l;” Declares the variables used tohold the plotter coordinates.
30 OUTPUT 718;"FUNCDEF P,OP,@"; &f&es a function called P-OF40 OUTPUT 718;"OUTPUT 5,B,79;"; Seno!s ASCII code for “0”.50 OUTPUT 718;"OUTPUT 5,B,80;"; Sends ASCII code for “P”.60 OUTPUT 718;"OUTPUT 5,B,59;"; Sends ASCII code for ‘; “.70 OUTPUT 718;"ENTER S,K,P,ONEX;"; Gets plotter coordinates from
plotter:80 OUTPUT 718;"ENTER S,K,P,ONEY;"; Gets Ycoordinutefromplotttx90 OUTPUT 718;“ENTJZR 5,K,P,TWOX;“; Gets Xcoordiruztefrom plotter:100 OUTPUT 718;"ENTER 5,K,P_TWOY;"; Gets Y coordinatefrom plot&x110 OUTPUT 718;"PU;PA 200,190;DSPLY P-ONEX,l0.2;"; Displa?~s coordinate on spec-
trum analyzer screen.120 OUTPUT 718;"PU;PA 200,180;DSPLY P-ONEY,l0.2;"; LKsplays coordinate on spec-
trum an4zly.243 screen.130 OUTPUT 718;"PU;PA 200,170;DSPLY P,TWOX,l0.2;"; Displays coordinate on spec-
trum an4zl~z47r screen.140 OUTPUT 718;"PU;PA 200,160;DSPLY P-TWOY ,10.2;“; Displu$~s coordinate on spec-
trum anul~zer screen.150 OUTPUT 718;"RELHPIB;";
160 OUTPUT 718;"(8;"
Releases spectrum analyzer con-trol of the HP-II3Marks the end of the function,P-OI?
170 OUTPUT 718;"KEYDEF l,P,OP,!DSP OP;!;"
180 END
Assigns the P-OP fanction tosoj%key 1.
5.410 Programming Commands

OUTPUT Output to Remote Port or Parallel Port
DescriptionUse OUTPUT to send data or instructions to an HP-IB device using the following outputformats.
K Outputs in free-field ASCII format with no terminator.
B Outputs in a free-field format with no terminator, but in a single &bit bytes.
KC Outputs in free-field ASCII with a carriage return and line feed terminator.
KL Outputs in free-field ASCII with a line feed and an EOI terminator.
F Outputs an ASCII number with the field width and decimal places specified. Forexample, a number displayed as 13.3 has a field width of 13 and a decimal placeof three. If a “C” follows the ASCII number, a carriage return and line feed willterminate the output.
Because HP-IB allows only one controller on the HP-IB, OUTPUT must be synchronized with acontroller operation or else incorporated into user-defined functions that are executed withsoftkeys when the spectrum analyzer is under manual control. If another controller is detectedon the HP-IB, the OUTPUT function is aborted.
Execute RELHPIB (RELEASE HP-IB) to discontinue spectrum analyzer control of HP-IB.
Programming Commands 5411

PAPlot AbsoluteMoves the pen to a vector location on the spectrum analyzer screen relative to the referencecoordinates (0,O) in display units.
Syntax
x Yc o o r d i n a t e c o o r d i n a t e/ \ / \
n u m b e r
XPA
Item Description/Default R=vze
Number Any valid integer. Within screen orgraticule coordinates.
Related Commands: CLRDSP, DSPLY, TEXT, PD, PLOT, PR, PRINT, PU.
Example
OUTPUT 718;"IP;BLANK TRA;" Initializes the spectrum analyzer and blankstrace A.
OUTPUT 718;"ANNOT 0FF;GRAT OFF;" Clears the spectrum analyzer screen.OUTPUT 718;"PU;" Fen up.OUTPUT 718;"PA 100,100;PD 100,150;" PU and PA commands prevent an initial
vector from being drawn before the pen ispositioned at (100, 100). PD draws a vectorto (loo, 150).
OUTPUT 718;"150,150,150,100,100;" Draws the last three sides of the rectangle.
DescriptionThe vector is drawn on the screen if the pen-down (PD) command is in effect. If the pen-up(PU) command is in effect, the vector does not appear on the screen.
Display units are the scaling units of the spectrum analyzer display for on screen graphicscommands such as PA or PR. One display unit is the distance between two points along an thex or Q axis. For the HP 8590 Series spectrum analyzer, there are a maximum of 511 displayunits (-40 to 471) along the x axis and 255 display units (-22 to 233) along the y axis. SeeFigure 5-8.
5-412 Programming Commands

PA Plot Absolute
400, 200 471, 233
ATTEN 1 0 dG
3 . 2 5 0 GHz
o,o
Figure 5-8. Display Units
ISThRT
F R E Q
IS T O PF R E Q
IC F S T E P
aulp M A N
IF R E Q
O F F S E T
IBandL o c k
R
The coordinates of the lower left screen corner of the screen are -4O,-22 and the upper rightscreen corner of the screen are 471,233. For the graticule area, the coordinates of the lowerleft corner of the graticule are 0,O and the coordinates of the upper right graticule area are400,200. For example, you could execute “PU;PA 0,O;PD;PA 0,200,400,200,400,0,0,0;” to drawa box around the graticule area.
Because PA is an active function, executing PA causes the.active function area on the spectrumanalyzer screen to blank. lb prevent the text following PA from being written in the activefunction area, execute hold (HD) after PA.
PU should be executed before the first PA command, and PA should be executed beforeexecuting TEXT, PD, or DSPLY commands.
Programming Commands 5-413

PARSTATParallel StatusReports the status of the printer connected to the parallel port. (Option 024, 041, 043).
Syntax
cu124e
Related Commands: PRINT, GETPRINT
Item Description/Default Range
Number Any valid integer. 0 - 32 (Option 024)
0 - 128 (Option 041,
I I 1043) I
ExampleOUTPUT 718; “PARSTAT; ”ENTER 718;APRINT “A”
Description
‘Ihble 5-9. Spectrum Analyzer Status Byte (Option 024)
Bit Decimal Bit Status = 0Number Equivalent
5 32 State of ACK line
4 16 N/A
3 8 Printer error
2 4 Off line
1 2
0 1
Bit Status = 1I
State of ACK line
WA
On line
Paper end
Printer busy
5-414 Programming Commands

PARSTAT Parallel Status
‘Ihble 5-9. Spectrum Analyzer Status Byte (Option 041, 043)
Bit Decimal Bit Status = 0 Bit Status = 1Number Equivalent
7 128 Printer busy Printer not busy
6 64 State of ACK line State of ACK line
5 32 Paper end
4 16 Off line On line
3 8 Printer error
2 4 N/A N/A
1 2 N/A N/A
0 1 N/A N/A
Query Response
Programming Commands 5-415

PCTAMPercent AMTurns on or off the percent AM measurement.
Syntax
Equivalent Softkey: $! AM ON OFF.Related Commands: MKPX, PCTAMR, TH.
Example
OUTPUT 718;"MOV PCTAM,l;"OUTPUT 718;"PCTAMR?;"
Turns on the percent AM rneasurmt.Queries PCTAMR. FCTAMR contains the results of thepercent AMmeasurement.
ENTER 718;Percent Stores the value of PCTMR in the variable Brcent.PRINT "Percent AM is ",Percent Prints the results.OUTPUT 718;"MOV PCTAM,O;" Turns ofl the percent AM measurement.
DescriptionSetting PCTAM to 0 turns off the percent AM function. Setting PCTAM to 1 turns on thepercent AM function. When the percent AM function is turned on, the spectrum analyzer findsthe signal with the highest amplitude, and then finds two signals (with lower amplitudes) oneither side of the highest signal. The highest on-screen signal is assumed to be the carrier, andthe adjacent signals are assumed to be the sidebands. The amplitude levels of all three signalsare measured, and the percent AM is calculated using the carrier level and the sideband withthe higher amplitude level. Percent AM is calculated as follows:
Percent Ah4 = 200 xLeuek7a,rierLeV47ideband
The percent AM measurement is repeated at the end of every sweep (PCTAM uses the ONEOScommand) until you turn off the percent AM measurement. You must query PCTAMR todetermine the percent AM.
PCTAM can perform the percent AM measurement only if there are three on-screen signalsthat have the characteristics of a carrier with two sidebands. Also, to be considered a signal,the levels of the carrier and sideband signals must be greater than the peak excursion abovethe threshold. If there are not three signals that fit the characteristics of a carrier with twosidebands, the value of PCTAMR will be -100.
You can execute the PCTAM command two different ways. You can either execute the PCTAMcommand directly (for example, "PCTAM 1; ‘I) or use the MOV command to move the 1 or 0 into
5-416 Programming Commands

PCIAM Percent AM
the PCTAM command (for example, "MOV PCTAM, 1; ‘I). If you use the MOV command, no text isdisplayed in the active function area during command execution.
RestrictionsTurning on the PCTAM function turns off the following functions: windows display mode(WINON), N dB point measurement (NDBPNT), the FFT menu measurements (FFI’AUTO,FFJXONTS, FFTSNGLS), gate utility functions (GDRVUTIL), TO1 measurement (TOI), markertable (MKTBL), peak table (PKTBL), peak zoom (PKZOOM), and power menu measurements(ACP, ACPE, CHP, and OBW).
You should turn off the percent AM measurement (set PCTAM to 0) when you are done withthe percent AM measurement.
Query Response
r off 7
I<
0 o u t p u t
f
l t e r m i n a t i o n +
QPCTAM
Programming Commands 5-417

PCTAMRPercent AM ResponseReturns the percent AM measured by the percent AM measurement (PCTAM).
Syntax
PCTAh4R
Related Commands: MKPX, PCTAM, TH.
Example
OUTPUT 718;"MOV PCTAM,l;"OUTPUT 718;"PCTAMR?;"
Turn-s on the percent AMmeasurement.Queries PCTAMR. PCTMR contains the results of thepercent AM?neasurement.
ENTER 718;Percent Stores the value of PCTMR in the vam’able I%rcnt.PRINT "Percent AM is ",Percent Prints the results.OUTPUT 718;"MOV PCTAM,O;" Turns ofl the percent AM mmsur~t.
DescriptionPCTAMR returns a -100 if the PCTAM function has not been turned on, or if the on-screensignal is not valid or is not present. PCTAM can perform the percent AM measurement only ifthere are three on-screen signals that have the characteristics of a carrier and two sidebands.Also, to be considered a signal, the levels of the carrier and sideband signals must be greaterthan the peak excursion above the threshold.
Query Response
outputt e r m i n a t i o n +
5-418 Programming Commands

PD Pen Down
PDPen DownInstructs the spectrum analyzer to plot vectors on the spectrum analyzer screen until a PUcommand is received.
Syntax
( P D
XPD
Related Commands: DSPLY, PA, PLOT, PR, PU, TEXT.
Example
OUTPUT 718;"IP;BLANK TRA;"
OUTPUT 718;"ANNOT 0FF;GRAT OFF;"OUTPUT 718;"PU;"OUTPUT 718;"PA 100,lOO;PD 100,150;"
OUTPUT 718;"150,150,150,100,100,100;"
Description
Initializes the spectrum analyzer and blankstrace A.Clears the spectrum analyzer screen.R?n up.PU and PA commands prevent an initialvector from being drawn before the pen ispositioned at (100, 100). PD draws a vectorto (loo, 150).Draws the last three sio!es of the rectangle.
The command PD is used to enable drawing of all vectors specified by the commands PA (plotabsolute), or PR (plot relative). It remains in effect until a PU command is received. PD doesnot need to be executed before using the TEXT or DSPLY commands.
Programming Commands 5-418

PDAProbability Distribution of AmplitudeSums the probability distribution of amplitude in the destination trace with the amplitudedistribution function of the source trace.
Syntax
p r e d e f i n e d v a r i a b l e
Item
User-defined trace
Number
User-defined variable
PredeEned variable
Predelined function
Trace element
Description/Default
A trace dellned by the TRDEF command.
Any real or integer number.
A variable deEned by VARDEF or ACTDEF commands.
A command that acts as a variable. Refer to Table 5-1.
Function that returns a value. Refer to Table 5-I.
An element of trace A, trace B, trace C, or a user-defined trace.
XPDA
RwteAny valid trace name.
Real number range.
Any valid variablename.
Prerequisite Commands: TRDEF when using a user-defined trace. ACTDEF or VARDEF for auser-defined variable. TS when using trace data.Related Commands: PDF, RMS, STDEV.
5-420 Programming Commands

PDA Probability Distribution of Amplitude
Example
OUTPUT 718;"IP;SNGLS;"
OUTPUT 718;"VB 1OKHZ;HD;TS;"OUTPUT 718;"MOV TRB,O;"OUTPUT 718;"PDA TRB,TRA,l;"
OUTPUT 718;"MPY TRB,TRB,S;"
OUTPUT 718;"VIEW TRB;"
Description
Initializes spectrum analyzer and activates the single-sweep m4de.Changes video bandwidth, updates trace.&places trace B data with all zeros.Determines the distribution of trace A and sums resultsinto trace BMultiplies values in trace B by 5 to make the results morevisible.Displays the result.
The PDA command takes the data in the source trace on a point-by-point basis. Each amplitudevalue is divided by 100 times resolution value, and the result of the division is rounded to aninteger. If the result falls within the range of the buckets of the destination trace, the contentof the corresponding destination trace element is increased by one. For example, to show thedistribution of amplitudes on a trace with values ranging from 0 to 8000, a resolution value of1 dB would result in 81 buckets ((SOOO/(l x lOO))+ 1). Amplitude values ranging from 0 to 99would go to bucket 1, values from 100 to 199 would go into bucket 2, and so forth. Finally,values from 7900 to 7999 would go to bucket 400. An amplitude value of 8000 would fall intobucket 81.
Due to the summing nature of the PDA command, the destination trace should always beinitialized to all zeros.
The PDA function is similar to the probability density function in statistics. The probabilitydensity function has the y-axis as the probability of an occurrence, where the PDA function ofthe HP 8590 Series spectrum analyzer has the number of occurrences as its y-axis. The PDAcould be converted to a probability density function by dividing, in an external controller, thevalue of each bucket by the total number of source elements. Note that performing the divideinside the spectrum analyzer would not be appropriate because the result is less than 1, whichwould be truncated to 0.
Programming Commands 5-421

PDFProbability Distribution of FrequencyIncrements an element of the destination trace whenever the corresponding element of thesource trace exceeds a threshold. This is useful for constructing a frequency probability densityfunction.
Syntax
- d e s t i n a t i o n 7
u s e r - d e f i n e d t r a c e
u s e r - d e f i n e d t r a c e
Item Description/Default
User-defined trace A trace defined by the TRDEF command.
Range
Any valid trace name.
Prerequisite Commands: TRDEF when using a user-defined trace. TS when using trace data.Related Commands: PDA, TH.
5422 Programming Commands

Example
PDF Probability Distribution of Frequency
This example finds the portions of the frequency band where no signals above -50 dBm areobservedin an hour time frame.
10 OUTPUT 718;"IP;"; Initializes spectrum anal~.z.ex20 OUTPUT 718;"SP 1OOMZ;CF 300MZ;” Changes the span and centerfrequency3 0 OUTPUT 718;"TH -50 DM;TS;" Activates the threshold level, take a
sweep.40 OUTPUT 718;"VIEW TRB;CLRW TRA;MOV TRB,O;"50 OUTPUT 718*"ST'*"60 ENTER 718;Sweepitime70 Sup-retrace = Sweep-time+.1
Sets trace B to zeros.Gets the sweep time.I&turns the sweep time to the controller:Calculates the total sweep time, in-cluding the retrace time.Calculates the number of sweeps inone hour:
80 Num,sweeps = 3600/Swp,retrace
90 FOR I = 1 TO Num-sweeps
100 OUTPUT 718;"TS;PDF TRB,TRA;"
Thisjino!s the maximum number ofsweeps that can be taken before nu-merical ove@ow (greater than 32,767.)When I = Num-sweeps, trace B con-tains the number of sweep that hadamplitudes at or above the thresholdlevel of -50 dBm.
110 NEXT I120 END
DescriptionThe TH command permits the user to set an amplitude threshold value. When PDF isperformed, measurement buckets of the source trace that exceed the threshold increment thecorresponding frequency bucket in the destination trace.
The destination trace should be set to zeros before PDF is executed for the first time.Subsequent calls to PDF increment the destination trace.
When the source is longer than the destination, the source is truncated to fit. When the sourceis shorter than the destination, the last element is repeated to fill the destination. The PDFfunction is similar to the probability density function in statistics. The probability densityfunction has the y-axis as the probability of an occurrence, where the PDF function of theHP 8590 Series spectrum analyzer has the number of occurrences as its y-axis. The PDF couldbe converted to a probability density function by dividing, in an external controller, the valueon each bucket by the total number of buckets. Note that performing the division inside thespectrum analyzer would not be appropriate because the result is less than 1, which would betruncated to 0.
Programming Commands 5.423

PEAKSPeaksSorts signal peaks by frequency or amplitude, stores the results in the destination trace, andreturns the number of peaks found.
Syntax
7 d e s t i n a t i o n
% u s e r - d e f i n e d t r a c e I
s o r t i n gr m e t h o d
f u n c t i o n p a t h o n l y
Item Description/Default R-59
User-defied trace A trace defined by the TRDEF command. Any valid trace name.
Trace range A segment of trace A, trace B, trace C, or a user-defined trace.
Prerequisite Commands: TRDEF when using a user-defined trace. TS when using trace data.Related Commands: MKPX, TH.
5-424 Programming Commands

PEAKS Peaks
ExampleConnect CAL OUT to the spectrum analyzer input.
OUTPUT 718."IP*"OUTPUT 718;"CF'300MHZ;SP 1500MHZ;RB 30KHZ;SNGLS;"
OUTPUT 718;"TH -60DM;MKPX 10DB;TS;"
OUTPUT 718;"PEAKS TRB,TRA,FRQ?;"
ENTER 718;Number
DISP Number
FOR I=1 TO Number
OUTPUT 718;"MKP TRB[";I;"]";
OUTPUT 718;"MKA?;"ENTER 718;AOUTPUT 718*"MKF'*"ENTER 718;;
* 9
PRINT A,B
NEXT I
Initializes spectrum analyzerChanges the center frequency,span, bandwidth. Actiuatessingle-sweep mode.Sets up threshold, sets mini-mum peak excursion.Returns the number of peaks intrace A above the threshold.Gets the number of peaks fromthe spectrum analyzerDisplays the result on the com-puter screen.Fbr one to the number of peaksdo the following steps.Place marker at the position ofthe first trace B element.Find the amplitude of the marker
Find thefrequency of the marker
Print the amplitude and thefrequency of the markerRepeat the FOR NEXT loop forall of the peaks that werefound.
DescriptionWhen sorting by frequency (FRQ), PEAKS first computes the horizontal position of all peaks.These positions are loaded into the destination trace consecutively, with the lowest frequencyvalue occupying the first element. Thus, signal frequencies, from low to high, determine theamplitude of the destination trace from left to right.
When sorting by amplitude (AMP), PEAKS first computes the amplitudes of all peaks in thesource trace in measurement units, and sorts these values from high to low. The positions ofthe peaks are then loaded into the destination trace, with the position of the highest amplitudevalue occupying the first element.
For example, executing the programming example results in the following spectrum analyzerdisplay:
Programming Commands 5-425

PEAKS Peaks
47 M K R 6 0 8 M H zR E F . 0 dBm ATTEN 1 0 dB - 4 2 . 2 3 dBmP E A K1 ne 1LY”
2,. . . . . . . . . . . . . . . . . . . . . . . . . . . . . . . . . . . . . . . . . . . . . . . . . . . . . . . . . . . . . . . . . . . . . . . . . . . . . . . . . . . . . . . . . . . . . . . . . . .
. . . . . . . . . . . . . . . . . . . . . . . . . . . . . . . . . . . . . . . . . . . . . . . . . . . . . . . . . . . . . . . . . . . . . . . . . . . . . . . . . . . . . . . . . . . . . . . . . .M A R K E R608 YHz- 4 2 . 2 3 dBm
. . . . . . . . . . . . . . . . . . . . . . . . . . . . . . . . . . . . . . . . . . . . . . . . . .
. . . . . . . . . . . . . . . . . . . . . . . . . . . . . . . . . . . . . . . . . . . . . . . . . . . . . . . . . . . . . . . . . . . . . . . . . . . . . . . . . . . . . . . . . . . . . . .
. . . . . . . . . . . . . . . . . . . . . . . . . . . . . . . . . . . . . . . . . . . . . . . . . . . . . . . . . . . . . . . . . . . . . . . . . . . . . . . . . . . . . . . . . . . . . . . . . .WF, S BS C F S i
CORR’ : ; : ; : ; : : !T H-60 .0 . . . . . . . . . . . . . . . . . . . . . . . . . ..t......................................................................dBm
I IC E N T E R 3 0 0 M H z S P A N 1 . 5 0 0 8Hz
tRES B W 3 0 kHz UBW 3 0 kHz S W P 5 . 0 0 set R
Figure 5-9. Frequency and Amplitude of the Peaks
If the FRQ parameter is used with the PEAKS command, the programming example returns thevalues that shown in the following table.
Trace Element
TRB[ l]
TRB[2]LTRB[3]
TRB[4]
TRB[S]
If the AMP parameter is used with the PEAKS command, the programming example returnsthe values that are shown in the following table.
Trace Element Amplitude Frequency
TRB[l] -13.95 4.E+6
TRB[S] -28.14 3.04E+8
TRB[J] -28.89 -2.963+8
TRB[4] -32.6 9.07E + 8
TRB[B] -42.23 6.08+8
Notice that MKA? and MKF? are used to determine the amplitude and frequency of the peakposition.
PEAKS sorts only signals that are above the threshold value. To be classified as a signal peak,a signal must be MKPX above the threshold value and it must rise and fall at least the peakexcursion (MKPX value). To change the threshold, use the TH command before PEAKS isexecuted.
If necessary, the last sorted value is repeated to fill remaining elements of the destination trace.
PEAKS must be used as either a query or as a source in another spectrum analyzer-commandfunction. Form a query by ending the PEAKS statement with a “?.” When used as a query,PEAKS returns the number of peaks found. When querying the trace elements of destinationtrace, the x-axis coordinate (relative to the first trace element) of the peak is returned.
5-426 Programming Commands

PEAKS Peaks
Query Response
Programming Commands 5427

PKDLMODEPeak Table Delta Display Line ModeSelects the signal peaks that are displayed in the peak table. The signal peaks can be selectedas follows: all the signal peaks, only the signal peaks that are above the display line, or onlythe peaks that are below the display line.
Syntax
p e a k s b e l o w
r DL ?
- 1/
.._,_..’01 I
/ peaks \
0
p e a k s a b o v e
r DL I
1
XPKDLMODE
Equivalent Softkey: PK MODE <>DL NRM .Preset State: 0 (display all the signal peaks).Related Commands: DL, PKSORT, PKTBL.
ExampleOUTPUT 718;“MOV PKTBL,l;” Turns on the peak table.OUTPUT 718;“DL -20;” Sets the display line.OUTPUT 718;“MOV PKDLMODE,l;” Displays the on.!?/ the signal peaks that are above the
display line.
DescriptionThe value of PKDLMODE determines how the signal peaks are displayed. You can setPKDLMODE to the following values:
n If PKDLMODE is set to 0, all signal peaks are displayed and listed.
H If PKDLMODE is set to - 1, only the signal peaks below the display line are displayed andlisted.
H If PKDLMODE is set to 1, only the signal peaks above the display line are displayed andlisted.
You can execute the PKDLMODE command two different ways. You can either execute thePKDLMODE command directly (for example, “PKDLMODE 1; ‘I) or use the MOV command tomove the 1 or 0 into the PKDLMODE command (for example, I’MOV PKDLMODE, 1; I’). If you usethe MOV command, no text is displayed in the active function area during command execution.
5-428 Programming Commands

PKDLMODE Peak ‘lhble Delta Display Line Mode
Query Response
p e a k s b e l o w
p e a k s a b o v e
QPKDLMODE
Programming Commands 5-429

PKPOSPeak PositionReturns a value, which is the index of the maximum value in trace A, trace B, trace C, oruser-defined trace.
Syntax
P K P O S
f u n c t i o n p a t h o n l y
XPKPOS
Item Description/Default Range
User-defined trace A trace deEned by the TRDEF command. Any valid trace name.
Trace range A segment of trace A, trace B, trace C, or a user-defined trace.
Prerequisite Commands: TRDEF when using a user-defined trace. TS when using trace data.Related Commands: MINPOS, MXM.
Example
OUTPUT 718;"IP;" Initializes spectrum anulyz..exOUTPUT 718;"SNGLS;TS;" Activates single-sweep mode, takes sweep.OUTPUT 718;"PKPOS TRA;" Finds the position of the highest peak.ENTER 718;Pkresult Outputs result to the computexDISP Pkresult Displays the result.
DescriptionIf a trace range is used with PKPOS, PKPOS returns a value relative to the first element ofthe trace range. For example, if a trace has a range of 150 to 300 elements, and the maximumvalue is element 200, PKPOS will return the value of 51.
5-430 Programming Commands

PKRES Peak Result
PKRESPeak ResultPKRES returns the x-axis coordinates of the peaks in the peak table.
Syntax
Item Description/Default RangeNumber An integer number. 1 to 10.
Related Commands: DL, PKSORT, PKTBL, TDF.
ExampleDIM Results(l0)OUTPUT 718;"TDF M;"
OUTPUT 718;"PKSORT 0;"OUTPUT 718;"MOV PKTBL,l;"OUTPUT 718*"TS*"FOR I=1 TO'10
>
OUTPUT 718;"PKRESC";I;"]?"ENTER 718;Results(I)
NEXT IOUTPUT 718;"TDF P;"
PRINT "PEAK","FREQUENCY","AMPLITUDE"FOR I=1 TO 10IF Results(I)>0 THEN
OUTPUT 718;"MKP ";Results(I);";"OUTPUT 718;"MKF?;"ENTER 718;AOUTPUT 718;"MKA?;"ENTER 718;BPRINT I,A,B
END IFNEXT I
Dimensions an array to hold the results.Changes the trace data format to measure-ment units.Selects listing the peaks by decreasing amplitude.Turns on the peak table.mforms a take sweep.Uses a FOR NEXT loop to get the data fromPKRESQueries each PKRES element.Enters the PKRES element into the Resultselement.
Changes the trace data format to parameterunits.Prints a heading.Uses a FOR NEXT loop to print the results.Results(I) is greater than zero if peak wasfound.Places a marker at the x- axis coordinate.Returns the frequency of the markerEnters the marker’s frequency into A.Returns the amplitude of the marker:Enters the marker’s amplitude into BPrints the peak number; frequency, and amplitudeEno!s the IF THEN statement.
Programming Commands 5431

PKRES Peak Result
DescriptionPKRES is an array that contains 10 elements. Each element of the PKRES array contains thex-axis coordinate of a signal peak, if a signal peak was found. If a signal peak was not found,the PKRES element contains a 0. The order in which the signal peaks are placed in the PKRESarray depends on how the signal peaks were sorted (see “PKSORT” for more information).
You must do the following before using PKRES:
1. Set the trace data format to TDF A, TDF B, TDF I, or TDF M only. You cannot use the TDF Ptrace data format before PKRES is queried.
2. Use PKSORT to select sorting the signal peaks by amplitude or by frequency.
3. Turn on the peak table with PKTBL.
4. Execute a take sweep (TS) to ensure that valid data is stored in PKRES.
Query ResponseQuerying PKRES returns the values of the 10 trace elements, with each value separated by acomma. Querying one element of PKRES (for example, “PKRES [l]?; “) returns the value of thatelement, followed by the output termination.
5-432 Programming Commands

PKSORT Peak Sort
PKSORTPeak SortSelects how the signal peaks listed in the peak table are sorted: by decreasing amplitude or byascending frequency.
Syntax
d e c r e a s i n gamp I i tude
Equivalent Softkey: PK SORT FRQ A#P .Preset State: 0 (sort by decreasing amplitude).Related Commands: DL, PKSORT, PKTBL.
Example
OUTPUT 718;"MOV PKTBL,l;" Twn.s on the peak table.OUTPUT 718;"MOV PKSORT,O;" Sorts the peaks by &creasing amplitude.
DescriptionIf PKSORT is set to 0, the spectrum analyzer sorts and displays the list of the peaks accordingto the amplitude of the peaks (highest amplitude first). If PKSORT is set to 1, the spectrumanalyzer sorts and displays the list of the peaks according to frequency (lowest frequency signalpeak is listed first).
See “PKRES” for information about how to get the information in the peak table remotely.
You can execute the PKSORT command two different ways. You can either execute thePKSORT command directly (for example, "PKSORT 1; ‘I) or use the MOV command to movethe 1 or 0 into the PKSORT command (for example, "MOV PKSORT,l;"). If you use the MOVcommand, no text is displayed in the active function area during command execution.
Query Response
d e c r e a s i n g
Programming Commands 5-433

PKSORT Peak Sort
PKTBLPeak ‘IhbleTurns on or off the peak table.
Syntax
t a b l e
/- off 7
0/
. . . .._...t a b l e
I- 0” 7
Equivalent Softkey: PK TABLE ON OFF .Preset State: 0 (Off).Related Commands: DL, PKRES, PKSORT, PKDLMODE.
Example
OUTPUT 718;"MOV PKTBL,l;" Twns on the peak table.
DescriptionWhen the peak table is turned on, the spectrum analyzer screen displays two windows. Theupper window displays trace A, with the signal peaks of trace A identified and numbered(the peaks are numbered according to their frequency or amplitude, see “PKSORT” for moreinformation). The lower window displays the peak table. The peak table displays the followinginformation about the on-screen signal peaks: the number of the peak, the frequency of thepeak, and the amplitude of the peak. A signal must be equal to or exceed the peak excursionto be considered a peak. (See “MKPX” for more information about the peak excursion.) Whilethe peak table is turned on, the frequency and amplitude of each peak is updated at theend of every sweep (PKTBL command uses the ONEOS command to update the peak tableinformation).
See “PKRES” for information about how to get the information in the peak table remotely.
You can execute the PKTBL command two different ways. You can either execute the PKTBLcommand directly (for example, “PKTBL 1; ‘I) or use the MOV command to move the 1 or 0 intothe PKTBL command (for example, “MOV PKTBL , 1; ‘I). If you use the MOV command, no text isdisplayed in the active function area during command execution.
RestrictionsTurning on the peak table turns off the following functions: windows display mode (WINON),N dB point measurement (NDBPNT), the FFT menu measurements (FFTAUTO, FFTCONTS,FFI’SNGLS), gate utility functions (GDRVUTIL), TO1 measurement (TOI), marker table (MKTBL),percent AM (PCTAM), peak zoom (PKZOOM), and power menu measurements (ACP, ACPE, CHP,and OBW).
You should turn off the peak table (set PKTBL to 0) when you are done with the peak table.
5-434 Programming Commands

PKTBL Peak ‘Ihble
Query Response
t a b l e
Programming Commands 5-435

PKZMOKPeak Zoom OkayReturns a “1” if the peak zoom routine (PKZOOM) found a valid signal, otherwise a “0” isreturned.
Syntax
Related Commands: PKZOOM.
Example
OUTPUT 718;"PKZOOM IMHZ;" Sets thejinal frequency span to 1 MHZ.OUTPUT 718;"PKZMOK?;" Queries the value of PKZMOK.ENTER 718;Peak-zoom-okIF Peak-zoom-ok = 0 THEN zf PKZMOK is equal to 0, the PKZOOM routine did not
.find a signal.PRINT "Signal Not Found"
ELSE
Query Response
5-436 Programming Commands
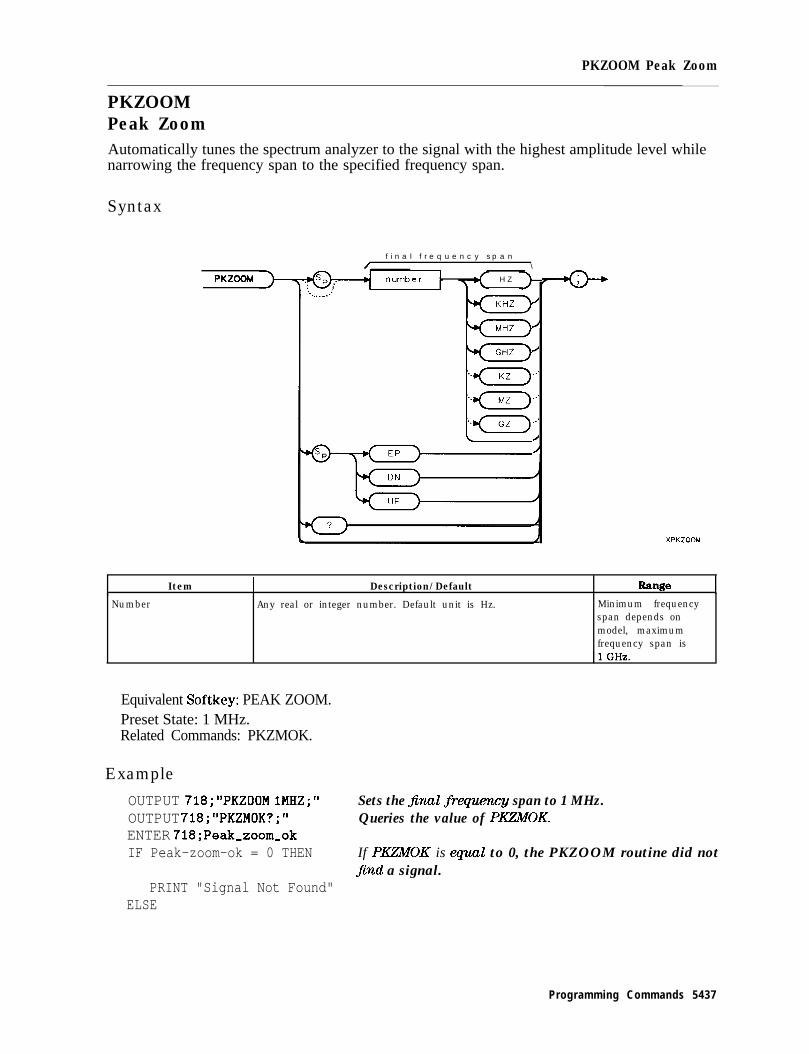
PKZOOM Peak Zoom
PKZOOMPeak ZoomAutomatically tunes the spectrum analyzer to the signal with the highest amplitude level whilenarrowing the frequency span to the specified frequency span.
Syntax
PKZOCM
f i n a l f r e q u e n c y s p a n/ \
H Z. . . .._.../
/
I
..’
..’
..’
I
/
-G--+
XPKZOOM
Item ! Description/Default
Number Any real or integer number. Default unit is Hz. Minimum frequencyspan depends onmodel, maximumfrequency span is
Equivalent Softkey: PEAK ZOOM.Preset State: 1 MHz.Related Commands: PKZMOK.
Example
OUTPUT 718;"PKZOOM 1MHZ;"OUTPUT 718;"PKZMOK?;"ENTER 718;Peak_zoom,okIF Peak-zoom-ok = 0 THEN
PRINT "Signal Not Found"ELSE
Sets the final frequ..emz/ span to 1 MHz.Queries the value of PKZMOK.
If PIEMOK is equal to 0, the PKZOOM routine did notfind a signal.
Programming Commands 5437

PKZOOM Peak Zoom
DescriptionPKZOOM finds the highest displayed signal and narrows the frequency span to the specifiedvalue. PKZOOM ignores the spectrum analyzer’s local oscillator (LO) feedthrough signal.PKZOOM sets the reference level to the signal’s amplitude, sets the center frequency stepsize to the signal’s frequency, and if the signal is within a preselected band, performs thepreselector peak routine (HP 8592L, HP 85933, HP 85953, or HP 85963 only). The minimumvalue for the final frequency span depends on the model of the spectrum analyzer.
Spectrum Analyzer Frequency SpanModel
HP 859OL or HP 8592L 500 kHz
HP 85913, HP 85933, HP 85943, HP 85953, or HP 85963 10 kHz
HP 85913, HP 85933, HP 85943, HP 85953, or HP 85963 with Option 130 300 Hz
‘lb be able to find a valid signal, PKZOOM changes the following commands:
TH Sets the threshold to 8 divisions from the top screen.LG Changes the amplitude scale to logarithmic.MKPX Sets the peak excursion to 6 dB.VAVG Sets video averaging to off.AT, RB, VB, ST Attenuation, resolution bandwidth, video bandwidth, and sweeptime are
autocoupled.MKSS The center frequency step size is set to the marker’s frequency.
For a signal to be found by PKZOOM, the signal must have a peak excursion (rise and fall) of atleast 6 dB.
RestrictionsExecuting PKZOOM turns off the following functions: windows display mode (WINON), NdB point measurement (NDBPNT), the FF”I’ menu measurements (FF’IAUTO, FFTCONTS,FFTSNGLS), gate utility functions (GDRVUTIL), TO1 measurement (TOI), marker table (MKTBL),peak table (PKTBL), percent AM (PCTAM), and power menu measurements (ACP, ACPE, CHP,and OBW).
Query Response
t e r m i n a t i o n ---)001
5-438 Programming Commands

PLOT Plot
PLOTPlotInitiates a plotter output of the screen data to the remote interface. With the appropriateHP-IB commands, the HP-IB can be configured to route the data to an external plotter.
Syntax
P L O T
Item Description/Default Range
Number Any real or integer number. Number within theplotter coordinates.
Related Commands: GETPLOT, PRINT, SNGLS, TS.Restrictions: Not available with Analog+ display mode. See “ANLGPLUS” for moreinformation.
Example for the HP-IB InterfaceThe plotter is at address 5 and the spectrum analyzer is at address 18 in this example. (Theprogram is only valid for HP 9000 series 200 and 300 computers.)
This example illustrates how an external controller can initiate the sending of print data to anexternal printer.
10 DIM P$[801 Allocates room in memory.20 OUTPUT 705;"OP;" Plotter outputs lower-L@ and upper-right display
dimensions.30 ENTER 705;P$ Puts the plotter response in the computer string.40 OUTPUT 718;"PLOT";P$ Plots the spectrum analyzer display according to the
dimensions stored in the computer string.50 SEND 7 ; LISTEN 5 TALK 18 DATA Conjigures the interface to output data from spectmcm
analyzer to plotter:60 END
Programming Commands 5-439

PLOT Plot
DescriptionThe PLOT command transfers the trace data, graticule, and annotation of the spectrumanalyzer screen to a plotter via the spectrum analyzer interface (softkey labels excluded). Thedata is transferred in ASCII, HPGL format.
The example routes the data to an external plotter; however, the controller can read the datainto a string if desired.
When using the PLOT command, the scaling points (Plx, Ply; P2x, P2y) can be specified.These scaling points specify the (x,y) coordinates, which determine the size of the plot.(Plx,Ply) refers to the lower-left plotter coordinates. (P2x,P2y) refers to the upper-rightplotter coordinates.
The PLOT command should not be used within a DLP; you should use the GETPLOT commandinstead.
Note The HP 7470A plotter does not support 2 plots per page. If you use anHP 7470A plotter with an HP 8590 Series spectrum analyzer, you can select oneplot per page or four plots per page but not 2 plots per page.
5-440 Programming Commands

PWPRT Plot Port
PLTPRTPlot PortSelects which port to output plotter data from the analyzer. (Option 041 or Option 043)
Syntax
P L T P R T
cu122e
Related Commands: PLOT, GETPLOT, PARSTAT, PRNPRT
Example
OUTPUT 718;"PLTPFtT 3;" Routes the plot i@ommtion to the serial port for Option 043.
Description
PLTPRT 0 = HP-IB port of Option 021 or Option 041PLTPRT 1 = serial port or Option 023PLTPRT 2 = parallel port of Option 024PLTPRT 3 = serial port of Option 043PLTPRT 4 = parallel port of Option 041 or Option 043
Note Setting the PRNPRT to a port inconsistent with the installed hardware option isignored, so executing PLTPRT 1 on an HP-IB equipped analyzer is ignored.
Query Response
Programming Commands 5441
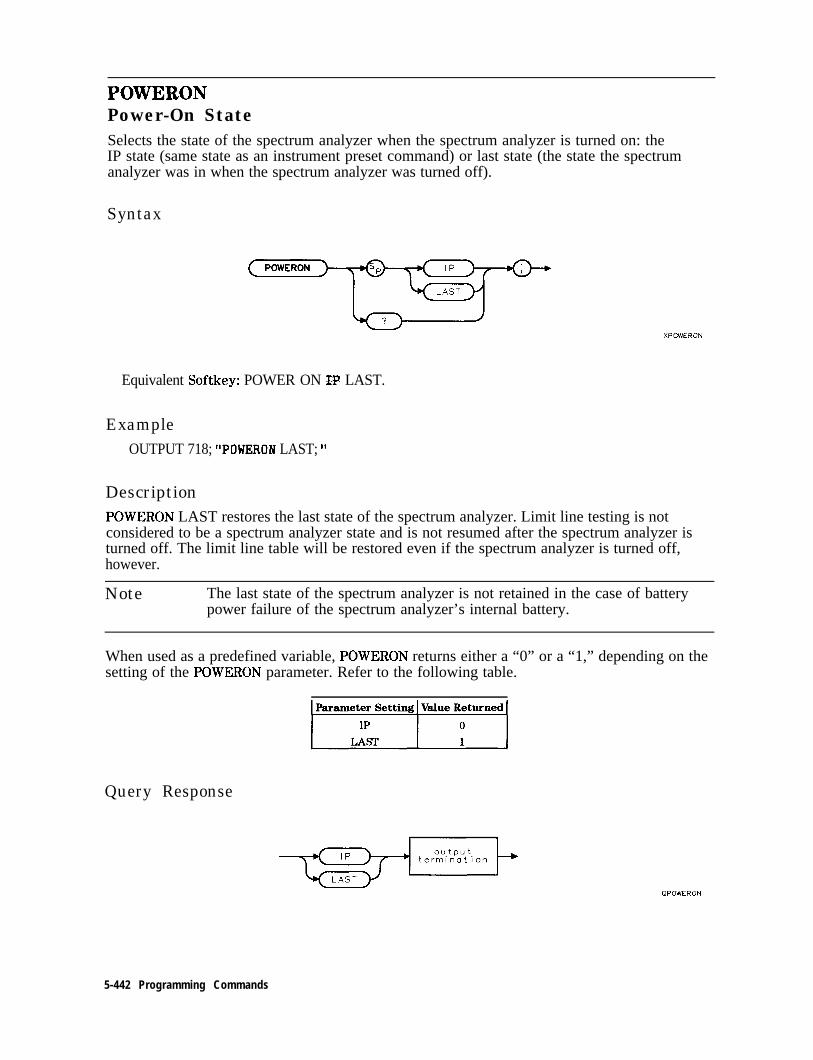
POWERONPower-On StateSelects the state of the spectrum analyzer when the spectrum analyzer is turned on: theIP state (same state as an instrument preset command) or last state (the state the spectrumanalyzer was in when the spectrum analyzer was turned off).
Syntax
XPOWERON
Equivalent Softkey: POWER ON IP LAST.
ExampleOUTPUT 718; “POWERON LAST; ”
DescriptionPOWERON LAST restores the last state of the spectrum analyzer. Limit line testing is notconsidered to be a spectrum analyzer state and is not resumed after the spectrum analyzer isturned off. The limit line table will be restored even if the spectrum analyzer is turned off,however.
Note The last state of the spectrum analyzer is not retained in the case of batterypower failure of the spectrum analyzer’s internal battery.
When used as a predefined variable, POWERON returns either a “0” or a “1,” depending on thesetting of the POWERON parameter. Refer to the following table.
Query Response
QPOWERON
5-442 Programming Commands

PP Preselector Peak
PPPreselector PeakPeaks the preselector.
Syntax
( P P
XPF
Equivalent Softkey: PRESEL PEAK .Restrictions: Not compatible with Analog+ display mode. See “ANLGPLUS” for moreinformation.Model Required: HP 8592L, HP 85933, HP 85953, or HP 85963.Related Commands: MKA, MKCF, MKD, MKF, MKN, MKPK.
ExampleOUTPUT 718;"IP;CF 3GHZ;SP SOOKHZ;" Initializes spectrum analyzq changes center fre-
quency, span.OUTPUT 718;"TS;MKPK HI;MKCF;PP;" Baks the highest on-screen signal.
Description‘Ib use PP, set the desired trace to clear-write mode, place a marker on a desired signal, thenexecute PP. Commands following PP are not executed until after the spectrum analyzer hasfinished peaking the preselector.
PP automatically adjusts the preselector tracking to peak the signal at the active marker.(When the marker is tuned to a signal and PREXXL PEAK is pressed, an internal routinesearches for the peak response of the preselector and adjusts the tracking accordingly.) Usingpreselector peak prior to measuring a signal yields the most accurate amplitude reading.
Preselector peak operates with the MARKER TJORMAL or MARKER A markers. If the marker is
OFF, pressing PRESET PEAK initiates a peak search routine and then peaks the response at thatmarker; otherwise, it peaks around the active marker. The CAL : PEAKING message appears onthe active graticule area to indicate operation of the peaking routine. Preselector peak onlyoperates in the 2.75 to 22 GHz preselector bands.
Programming Commands 5443
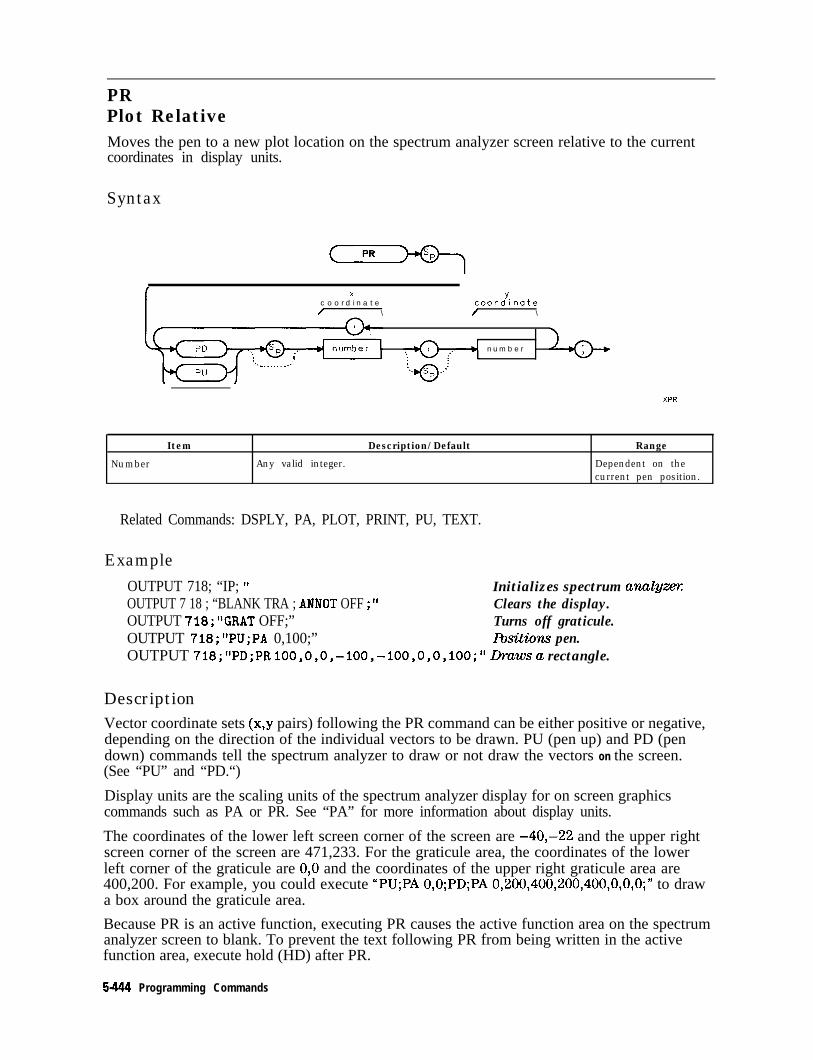
PRPlot RelativeMoves the pen to a new plot location on the spectrum analyzer screen relative to the currentcoordinates in display units.
Syntax
xc o o r d i n a t e/ \
Y.coordinate/ \
n u m b e r
XPR
Item Description/Default Range
Number Any valid integer. Dependent on thecurrent pen position.
Related Commands: DSPLY, PA, PLOT, PRINT, PU, TEXT.
Example
OUTPUT 718; “IP; ” Initializes spectrum aruzlymOUTPUT 7 18 ; “BLANK TRA ; ANNOT OFF ; ” Clears the display.OUTPUT 718;“GRAT OFF;” Turns off graticule.OUTPUT 718;“PU;PA 0,100;” Rxitions pen.OUTPUT 718;“PD;PR lOO,O,O,-lOO,-lOO,O,O,lOO;” Drawsa rectangle.
DescriptionVector coordinate sets (x,y pairs) following the PR command can be either positive or negative,depending on the direction of the individual vectors to be drawn. PU (pen up) and PD (pendown) commands tell the spectrum analyzer to draw or not draw the vectors on the screen.(See “PU” and “PD.“)
Display units are the scaling units of the spectrum analyzer display for on screen graphicscommands such as PA or PR. See “PA” for more information about display units.
The coordinates of the lower left screen corner of the screen are -4O,-22 and the upper rightscreen corner of the screen are 471,233. For the graticule area, the coordinates of the lowerleft corner of the graticule are 0,O and the coordinates of the upper right graticule area are400,200. For example, you could execute “PU;PA 0,O;PD;PA 0,200,400,200,400,0,0,0;” to drawa box around the graticule area.
Because PR is an active function, executing PR causes the active function area on the spectrumanalyzer screen to blank. To prevent the text following PR from being written in the activefunction area, execute hold (HD) after PR.
5444 Programming Commands

PRJZAMPG External Preamplifier Gain
PREAMPGExternal Preamplifier GainSubtracts a positive or negative preamplifier gain value from the displayed signal.
Syntax
7 a m p l i t u d e v a l u e 7
XPREAMPC
ExampleOUTPUT 718; “PREAMPG IODB; ”
DescriptionUnlike using ROFFSET, PREAMPG can change the attenuation depending on the preamplifiergain entered.
A preamplifier gain offset is used for measurements that require an external preamplifier orlong cables. The offset is subtracted from the amplitude readout so that the displayed signallevel represents the signal level at the input of the preamplifier or long cable. The preamplifiergain offset is displayed at the top of the screen and is removed by entering zero.
Note PREAMPG is not reset to 0 by an instrument preset (IP). Be sure to execute“PREAMPG 0; ” when the preamplifier gain is no longer needed.
Press CAL STClRE if you want the spectrum analyzer to use the current preamplifier gain offsetwhen power is turned on. Preamplifier gain offset is set to zero by DEFAULT CONFIG .
Query Response
Programming Commands 5-445

PREFXPrefixSpecifies or changes the prefix used in save and recall operations.
Syntax
I- p r e f i x 7
P R E F X del i m i t e r c h a r a c t e r d e l i m i t e r
Item Description/Default Range
Character Any valid character. 0 to 6 characters long,A through Z and theunderscore (theunderscore cannot bethe lirst character ofthe preti).
Delimiter Matching characters marking the beginning and end of the list of - ( \ @ = / ^ $ % ; ! ’ :spectrum analyzer commands. ” &
Equivalent Softkey: Change Prefix .Related Commands: CAT, SAVRCLN, STOR.
ExampleOUTPUT ~I~~PREFX %DAVE%;~~
5-446 Programming Commands

PRINT. Print
PRINTPrintInitiates a output of the screen data to the remote interface. With appropriate HP-IBcommands, the HP-IB can be configured to route the data to an external printer.
Syntax
P R I N T sPI+@-
. .._.
+a--+
xprint
Programming Commands 5.447

PRINT Print
Related Commands: GETPRNT, PLOT.
Example for the HP-IB InterfaceThe printer usually resides at address 1 and the plotter at address 5. (The program is only validfor HP 9000 Series 200 and 300 computers and HP Vectra personal computer with an HP rastergraphics printer, such as the HP Thinkjet.)
This example illustrates how an external controller can initiate the sending of print data to anexternal printer.
OUTPUT 718."PRINT-"SEND 7;UNT'UNL LISTEN 1 TALK 18 DATA Sendsdutatoprinter:
Note To print without disconnecting the computer, you must execute the followingBASIC commands:ABORT7LOCAL 7Then press Icopvl.
DescriptionThe data is output in HP raster graphics format. PRINT, PRINT 0, or PRINT BW produces amonochrome printout. PRINT 1 and PRINT COLOR produces a “color format” output for anHP PaintJet printer. Execute “MENU 0;” before printing to blank the softkeys.
The PRINT command should not be used within a DLP; you should use the GETPRNT commandinstead.
5446 Programming Commands
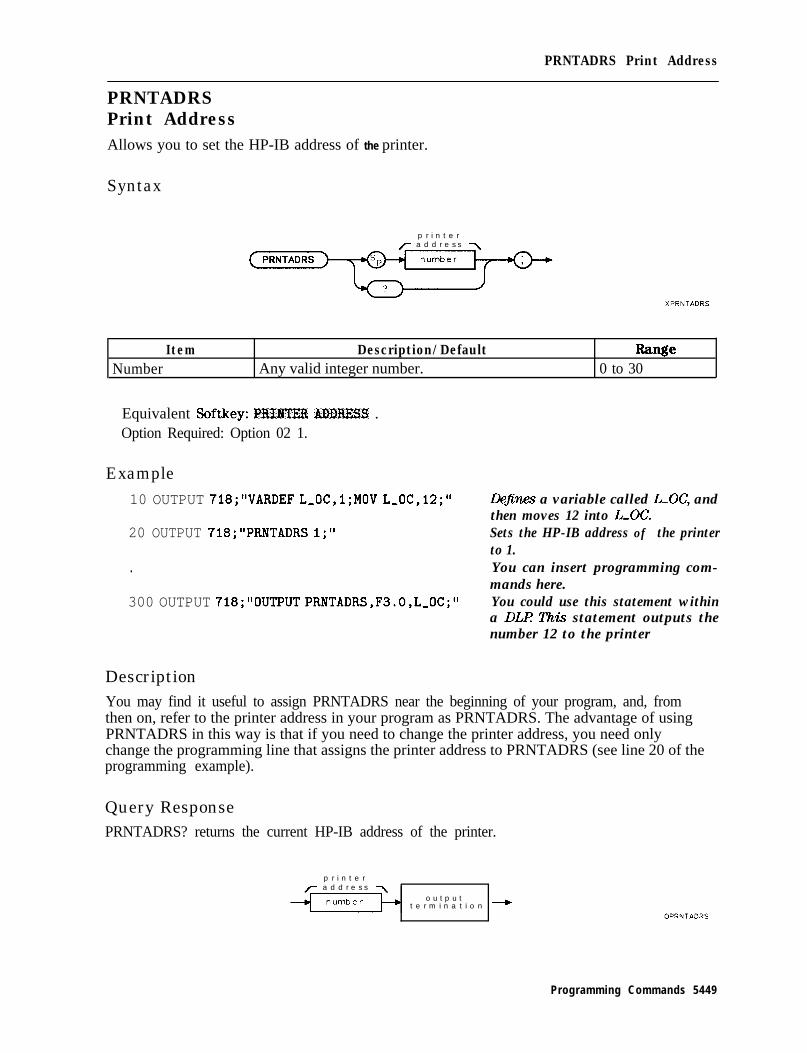
PRNTADRS Print Address
PRNTADRSPrint AddressAllows you to set the HP-IB address of the printer.
Syntax
p r i n t e rr a d d r e s s
Item Description/DefaultNumber Any valid integer number.
R-awe0 to 30
Equivalent Softkey: PfsXm AIXJRESS .Option Required: Option 02 1.
Example10 OUTPUT 718;"VARDEF L,OC,l;MOV L,OC,l2;" Dtf~nes a variable called L-OC, and
then moves 12 into L-OC.20 OUTPUT 718;"PRNTADRS 1;" Sets the HP-IB address of the printer
to 1.. You can insert programming com-
mands here.300 OUTPUT 718;"OUTPUT PRNTADRS,F3.0,L,OC;" You could use this statement within
a DLP This statement outputs thenumber 12 to the printer
DescriptionYou may find it useful to assign PRNTADRS near the beginning of your program, and, fromthen on, refer to the printer address in your program as PRNTADRS. The advantage of usingPRNTADRS in this way is that if you need to change the printer address, you need onlychange the programming line that assigns the printer address to PRNTADRS (see line 20 of theprogramming example).
Query ResponsePRNTADRS? returns the current HP-IB address of the printer.
p r i n t e rr a d d r e s s
o u t p u tt e r m i n a t i o n +
Programming Commands 5449

PRNPRTPrint PortSelects which port to output printer data from the analyzer. (Option 041 or Option 043)
Syntax
P R N P R T
Related Commands: PRINT, GETPRINT, PARSTAT, PLTPRT
Example
OUTPUT 718 ; "PRNPRT 3 ; ‘I Routes the print in$ormution to the serial port for Option 043.
DescriptionPRNPRT 0 = HP-IB port of Option 021 or Option 041PRNPRT 1 = serial port or Option 023PRNPRT 2 = parallel port of Option 024PRNPRT 3 = serial port of Option 043PRNPRT 4 = parallel port of Option 041 or Option 043
Note Setting the PRNPRT to a port inconsistent with the installed hardware option isignored, so executing PRNPRT 1 on an HP-IB equipped analyzer is ignored.
Query Response
5-450 Programming Commands

PSTATE Protect State
PSTATEProtect StateProtects all of the spectrum analyzer’s user state and trace registers from being changed,except when ERASE MEM ALL is pressed.
Caution The spectrum analyzer user states are not protected when EM% ME34 ALL ispressed.
Syntax
Equivalent Softkey: SAV LOCK OK OFF .Related Commands: ERASE, RCLS, SAVES.
ExampleOUTPUT 7 18 ; “PSTATE ON; ”
Query Response
o u t p u tt e r m i n a t i o n ---)
002
Programming Commands 5-451
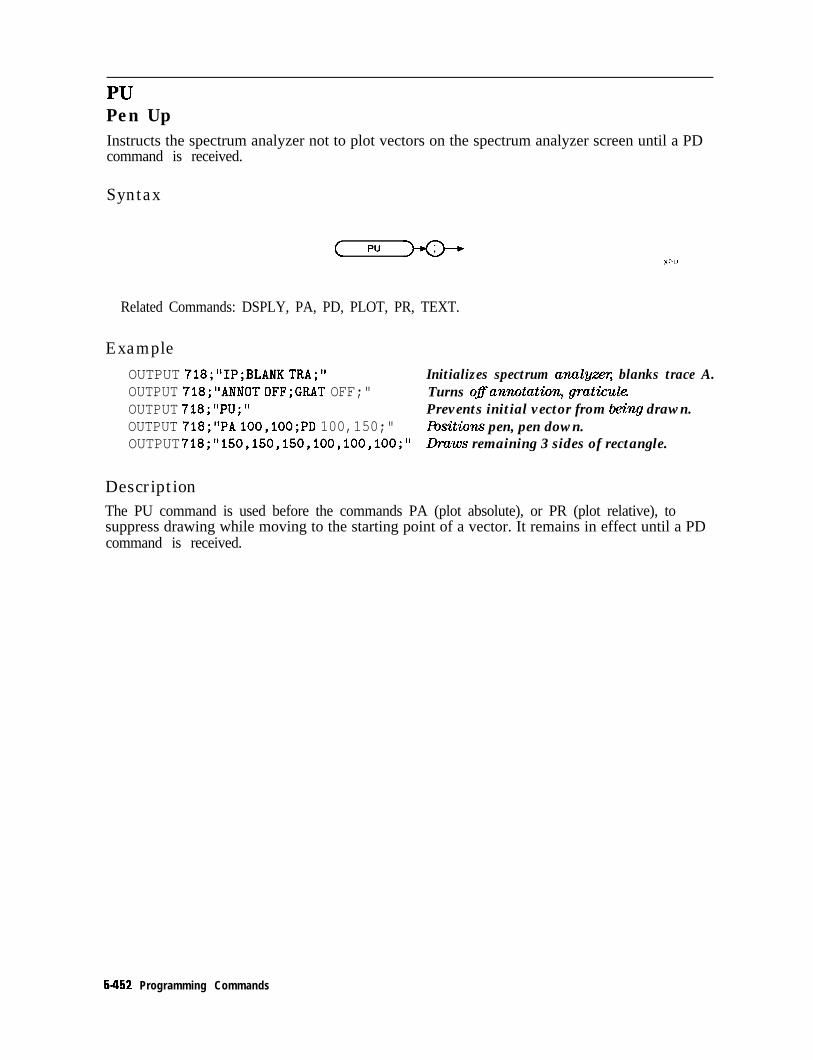
PUPen UpInstructs the spectrum analyzer not to plot vectors on the spectrum analyzer screen until a PDcommand is received.
Syntax
( PU
Related Commands: DSPLY, PA, PD, PLOT, PR, TEXT.
ExampleOUTPUT 718;"IP;BLANK TRA;" Initializes spectrum anulyzeq blanks trace A.OUTPUT 718;"ANNOT 0FF;GRAT OFF;" Turns oflannotation, graticule.OUTPUT 718;"PU;" Prevents initial vector from king drawn.OUTPUT 718;"PA 100,lOO;PD 100,150;" Rxitions pen, pen down.OUTPUT 718;"150,150,150,100,100,100;" Draws remaining 3 sides of rectangle.
DescriptionThe PU command is used before the commands PA (plot absolute), or PR (plot relative), tosuppress drawing while moving to the starting point of a vector. It remains in effect until a PDcommand is received.
5452 Programming Commands

PURGE Purge File
PURGEPurge. FileDeletes the specified file from the current mass storage device.
Syntax
c h a r a c t e r del i m i ter
XPURGE
Item
Delimiter
Character
Description/Default Range
Matching characters marking the beginning and end of the list of - 1 \ @ = / ^ $ % ; ! ’ :spectrum analyzer commands. ” &
Any valid character. Any valid filename.
Related Commands: MSI.
Example
OUTPUT 718; “MS1 CARD;" Selects the memoq card as the mass storage device.OUTPUT 718;"PURGE %dMYFILE%;" Deletes the fZ.!.e called “dMYFZJ3” from the memory
card.
DescriptionUse the MS1 command to select the mass storage device (either the spectrum analyzer memoryor a memory card) before using the PURGE command. When deleting a file from a RAM card,the RAM card files are repacked automatically after a PURGE command is executed.
Programming Commands 5453

PWRBWPower BandwidthComputes the bandwidth around the trace center, which includes signals whose total power is aspecified percentage of the total trace signal power.
Syntax
PWRBW
p r e d e f i n e d v a r i a b l e
Item
User-defmed trace
Trace range
User-defined variable
Description/Default Range
A trace defined by the TRDEF command. Any valid trace name.
A segment of trace A, trace B, trace C, or a user-defined trace.
A variable defined by VARDEF or ACTDEF commands. Any valid variablename.
Predeflned variable A command that acts as a variable. Refer to ‘lbble 5-1.
Predefined function Function that returns a value. Refer to lbble 5-1.Trace element An element of trace A, trace B, trace C, or a user-defined trace.
Number Any real or integer number. 0 to 100.
Parameter Values: The field used for the percentage must use a value between 0 and 100.Prerequisite Commands: TRDEF when using a user-defined trace. ACTDEF or VARDEF for auser-defined variable. TS when using trace data.Related Commands: RB, SP
5.454 Programming Commands

PWRBW Power Bandwidth
Example
DISP "CONNECT CAL OUT TO INPUT"OUTPUT 718;“IP;"OUTPUT 718;"SNGLS;"OUTPUT 718;"CF 300MHZ;SP 1MHZ;RB 300KHZ;"
OUTPUT 718;"MXMH TRA;TS;TS;TS;TS;"
OUTPUT 718;"PWRBW TRA, 99.0;"
ENTER 718;P
DISP "THE POWER BANDWIDTH AT 99 PERCENT IS";P/l.OE+3;"kHz"
LXsplays a user prompt.Initializes spectrum analyzexActivates single-sweep mode.Changes centerfrequency,span, and bandwidth.Activates the maximumhold of trace A, sweep 4times.Returns the 99% powerbandwidth.Gets the resultf?om thespectrum analyzer:Displays the frequencyof the power bandwidthspecQi.ed on the computerscreen.
DescriptionIf trace A is the source, a delta marker is set at the start and stop frequencies.
If 100% is specified, the power bandwidth equals the frequency range of the screen display. If50% is specified, trace elements are eliminated from either end of the array, until the combinedpower of the remaining signal responses equals half of the original power computed. Thefrequency span of these remaining trace elements is the power bandwidth returned.
Query Response
Programming Commands 5-455

PWRUPTIMEPower Up TimeReturns the number of milliseconds that have elapsed since the spectrum analyzer was turnedo n .
Syntax
Example
OUTPUT 718;"PWRUPTIME;"ENTER 718;AA = A/1000
Executes PWRUPTIME.Places the result of PWRUPTIME into A.Changes the milliseconds to seconds.
PRINT "Minutes elapsed ",A/60 Prints the number of minutes that have elapsed sincethe spectrum analyzer was turned on.
DescriptionPWRUPTIME can count the number of milliseconds for up to 232 milliseconds (232 millisecondsis equivalent to 49.7 days). If the spectrum analyzer is left on for more than 49.7 days,PWRUPTIME is reset to 0 and restarts the count.
Query Response
timein milliseconds
5-456 Programming Commands
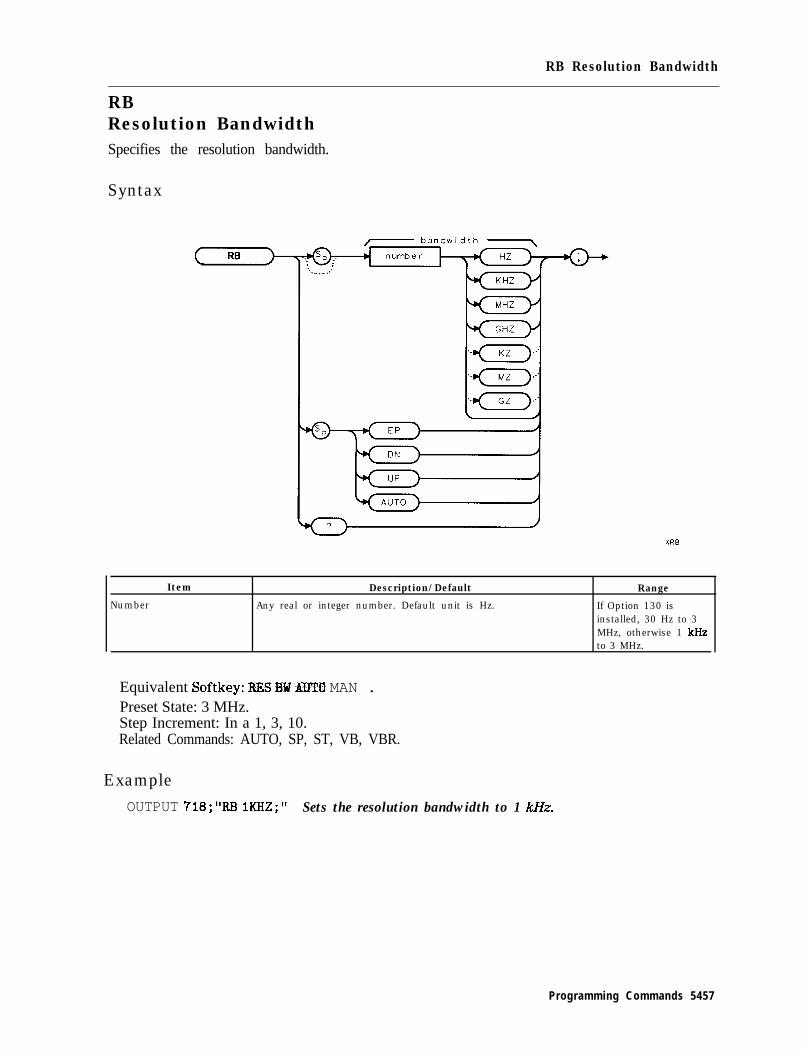
RB Resolution Bandwidth
RBResolution BandwidthSpecifies the resolution bandwidth.
Syntax
XRB
Item Description/Default Range
Number Any real or integer number. Default unit is Hz. If Option 130 isinstalled, 30 Hz to 3MHz, otherwise 1 kHzto 3 MHz.
Equivalent Softkey: RES BU AUTO MAN .Preset State: 3 MHz.Step Increment: In a 1, 3, 10.Related Commands: AUTO, SP, ST, VB, VBR.
Example
OUTPUT 718;"RB IKHZ;" Sets the resolution bandwidth to 1 kHz.
Programming Commands 5457

RR Resolution Bandwidth
DescriptionThe coupling between sweep time and resolution bandwidth is terminated by this command.Execute RB AUTO to reestablish coupling. (Also see “AUTO.“)
The 200 Hz, 9 kHz, and 120 kHz 6-dB resolution bandwidths (used for EM1 testing) are availableby specifying 200 Hz (for spectrum analyzers with Option 130 installed), 9 kHz, or 120 kHz asthe frequency value; the front-panel knob, step increment keys, and auto-coupled settingsprovide the 1, 3, 10 resolution bandwidth sequence only. Frequencies are rounded to thenearest value in the 1, 3, 10 sequence if the frequency is other than 9 kHz, 120 kHz, 5 MHz, orin the 1, 3, 10 sequence.
The spectrum analyzer provides uncalibrated bandwidths of 300 Hz (10 Hz if the spectrumanalyzer has Option 130 installed in it) and 5 MHz.
Query Response
5-458 Programming Commands

RCLS Recall State
RCLSRecall StateRecalls spectrum analyzer state data from the specified state register in spectrum analyzermemory.
Syntax
stater r e g i s t e r
Item Description/Default Range
Number Any real or integer number. 1 to 9
Equivalent Softkey: INTEHMAL -> STATE .Related Commands: LOAD, POWERON, RCLT, SAVES.
Example
OUTPUT 718 ; “IP ; CF 300MHZ ; SP 1MHZ ; I’ Changes centerfreqwnc2(, span.OUTPUT 718 ; “SAVES 3 ; ” Saves state in register 3.OUTPUT 718. “IP * ”s ,OUTPUT 7 18 * “RCLS 3 * ”, , Recalls the contents of register 3.
DescriptionYou can specify a state register number from one to nine. Registers one through eight arereserved for your use. Registers one through eight contain instrument state information ifinstrument state information has been stored in it with the SAVES command. State registernine contains the previous state data.
Note The RCLS recalls state data from spectrum analyzer memory. See “LOAD” or“SAVRCLN” to recall state data from the memory card.
Programming Commands 5-458

RCLTRecall TraceRecalls previously saved trace data, amplitude factors, or limit-line data from the specifiedtrace register in spectrum analyzer memory. Trace data is recalled with instrument state, date,and screen title.
Syntax
R C L T
u s e r - d e f i n e d t r a c e
t r a c e r a n g eI
XRCLl
Item Description/Default Range
User-defined trace A trace defined by the TRDEF command. Any valid trace name.
Trace range A segment of trace A, trace B, trace C, or a user-defined trace.
Number Any valid integer. 0 to TRCMEM - 1.
Equivalent Softkey: The RCLT command and the VIEW commands are equivalent toIntsmal -2 Trace.Parameter Value: 0 to TRCMEM - 1.Prerequisite Commands: TRDEF when using a user-defined trace.Related Commands: CAT, CLRW, LOAD, SAVET, SNGLS, TRCMEM, TS, VIEW.
Example10 OUTPUT 718;"IP;CF 300MHZ;SP 20MHZ;TS;" Initializes spectrum anulyq changes
the center frequency and span.20 OUTPUT 718;"SAVET TRA,l;"
30 OUTPUT 718;"IP;"40 OUTPUT 718;"RCLT TRA,l;VIEW TRA;"
50 END
Saves spectrum analyzer state and traceA data in register 1.Initializes spectrum analyzerRecalls spectrum analyzer state, tracedata; displays the result.
5-460 Programming Commands

RCEI’ Recall Trace
DescriptionThe state and trace data are recalled when the trace destination is trace A, trace B, or trace C.When using a user-defined trace or a trace range for the trace destination, only the trace datais recalled.
When recalling frequency-amplitude correction data, you need to specify AMPCOR as thedestination. When recalling limit line table data, specify LIMILINE as the destination.
To avoid overwriting the recalled trace data, the VIEW command should be performedimmediately after the RCLT command when recalling trace data (see line 40 in the example).
Note The RCLT recalls trace data from spectrum analyzer memory. See “LOAD” or“SAVRCLN” to recall trace data from the memory card.
Programming Commands 5-461

RELHPIBRelease HP-IBReleases spectrum analyzer control of the HP-IB.
Syntax
Option Required: Option 021.Related Commands: ENTER, OUTPUT.
Example
OUTPUT 718 ; "RELHPIB ; ‘I The spectrum analyzer releases control of HP-IB so that anotherdewice can control the bus.
DescriptionThe RELHPIB command causes the device that is acting as the controller on the HP-IB (forexample, the spectrum analyzer) to relinquish control of the bus.
5-462 Programming Commands

REPEAT UNTIL Repeat Until
REPEAT UNTILRepeat UntilThe REPEAT and UNTIL commands form a looping construct.
Syntax
U N T I L
/% p r e d e f i n e d v a r i a b l e I
buuser-defined vorioblel
L t r a c e e l e m e n t /
Item
Analyzer command
User-defined variable
Predefined variableNumber
Trace element
Description/Default R=u3e
Any valid complete spectrum analyzer command.
A variable defined by VARDEF or ACTDEF commands. Any valid variablename.
A command that acts as a variable. Refer to ‘lbble 5-1.Any real or integer number. Real number range.
An element of trace A, trace B, trace C, or a user-defined trace.
Prerequisite Commands: FUNCDEF when using a user-defined function. ACTDEF orVARDEF when using a user-defined variable.Related Commands: ABORT, IF (IF/THEN/ELSE/ENDIF).
Programming Commands 5-463

REPEAT UNTIL Repeat Until
ExampleThe following program lowers any off-screen signal.
10 OUTPUT 718;"IP;"20 OUTPUT 718;"SNGLS;TS;MKPK HI;"
30 OUTPUT 718;"IF MA,GT,RL THEN;"
40 OUTPUT 718;"REPEAT;"50 OUTPUT 718;"RL UP;TS;MKPK HI;"60 OUTPUT 718;"UNTIL MA,LE,RL;"
70 OUTPUT 718;"ENDIF;"80 OUTPUT 718."CONTS-" s 370 END
Description
Initializes spectrum anal~zfxActivates single-sweep mode, takes sweep, placesmarker on signal peak.Performs lines 40, 50 and 60 if the markeramplitude is greater than the reference level.Increases refwence level, takes sweep, placesmarker on signal peak.Does line 40 until peak amplitude is less thanor equal to the reference level.Ends the IF THEN constrwt.
All commands following the REPEAT command are executed until the comparison specifiedafter the UNTIL command is true.
The following are used for comparing the operands:
GT Greater than
I.3 Less than
IJ3 Less than or equal to
GE Greater than or equal to
EQ Equal to
NE Not equal to
When used within a downloadable program (DLP), the number of REPEAT UNTIL statementsthat can be nested is limited to 20.
5-464 Programming Commands
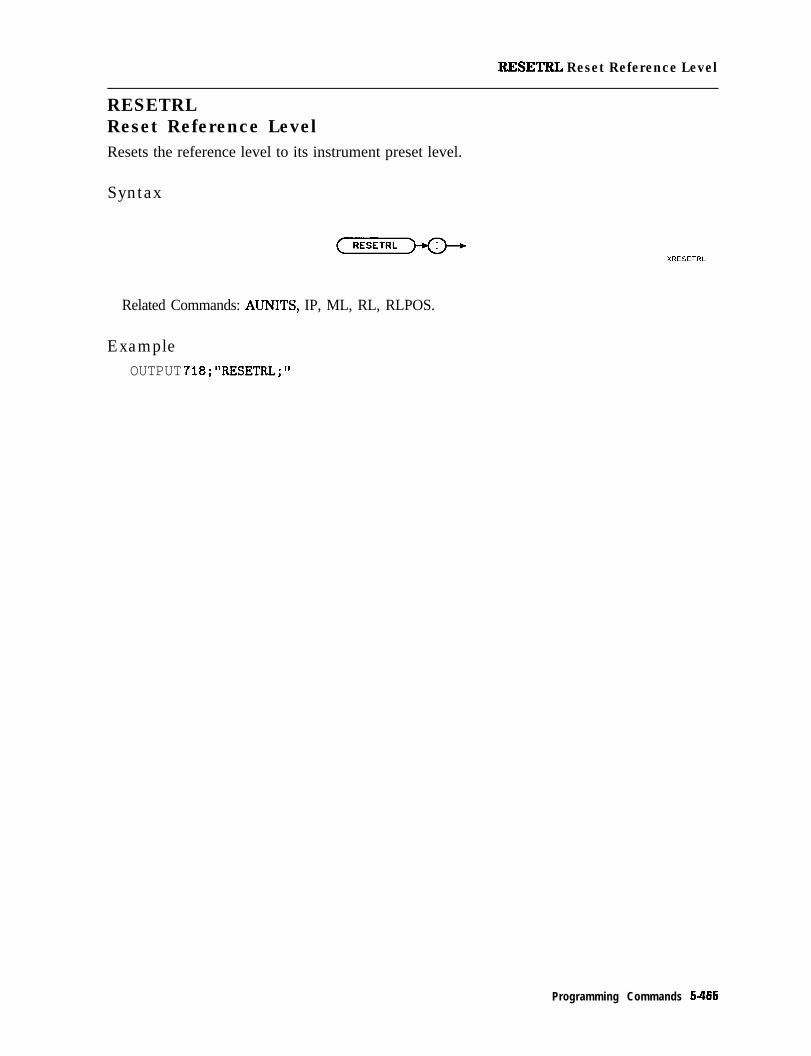
RRSETRL Reset Reference Level
RESETRLReset Reference LevelResets the reference level to its instrument preset level.
Syntax
Related Commands: AUNITS, IP, ML, RL, RLPOS.
ExampleOUTPUT 718;"RESETRL;"
Programming Commands 5-465

RETURNReturnStops the operation of a user-defined command and returns program operation to the pointwhere the user-defined function was called.
Syntax
R E T U R N
Related Commands: ABORT. FUNCDEF. IF (IFflHEN/ELSE/ENDIF), REPEAT(REPEAT/UNTIL). ’ ’ ’
Example
102030405060708090100110120130140150160170180190200210220230240250260
OUTPUT 718."IP*"OUTPUT 718;"SNGLS;TS;DONE?"ENTER 718;Done!OUTPUT 718;"FUNCDEF D,LP,O"OUTPUT 718;"CF 300MZ;SP 10MZ;TS;"OUTPUT 718;"MKPK HI;"OUTPUT 718;"PU;PA 60,180;"OUTPUT 718;"IF MKA,LT,-30 THEN;"
OUTPUT 718;"TEXT'NO SIGNAL FOUND';"OUTPUT 718;"HD;"OUTPUT 718;"CONTS;"OUTPUT 718;"RETURN;"
OUTPUT 718;"ELSE;"OUTPUT 718;"TEXT'SIGNAL FOUND';"
OUTPUT 718*"ENDIF."OUTPUT 718;"SP 5MZ;TS;MKPK;"OUTPUT 718."MKCF*"OUTPUT 718;"MKRL;TS;"OUTPUT 718;"HD;"OUTPUT 718;"CONTS;"OUTPUT 718~"Q~"# ,!OUTPUT 718;"D,LP;"!END
Description
Initializes spectrum analyzerput in single sweep modewait until done
dejines user de@ed fan&ionset CF and SPANmarker peakposition pen, get ready for textmarker less than -30 dBm?
refresh graticuleback to continuous sweepexit the function
narrow span, marker peakmarker to CFmarker to RLrefresh graticuleback to continuous sweepend of user &fined function
this line executes function D-LP
The example shows the use of the RETURN command to exit from a user-defined function.When the RETURN is encountered, execution within the function halts and control returns tothe calling context.
5-466 Programming Commands
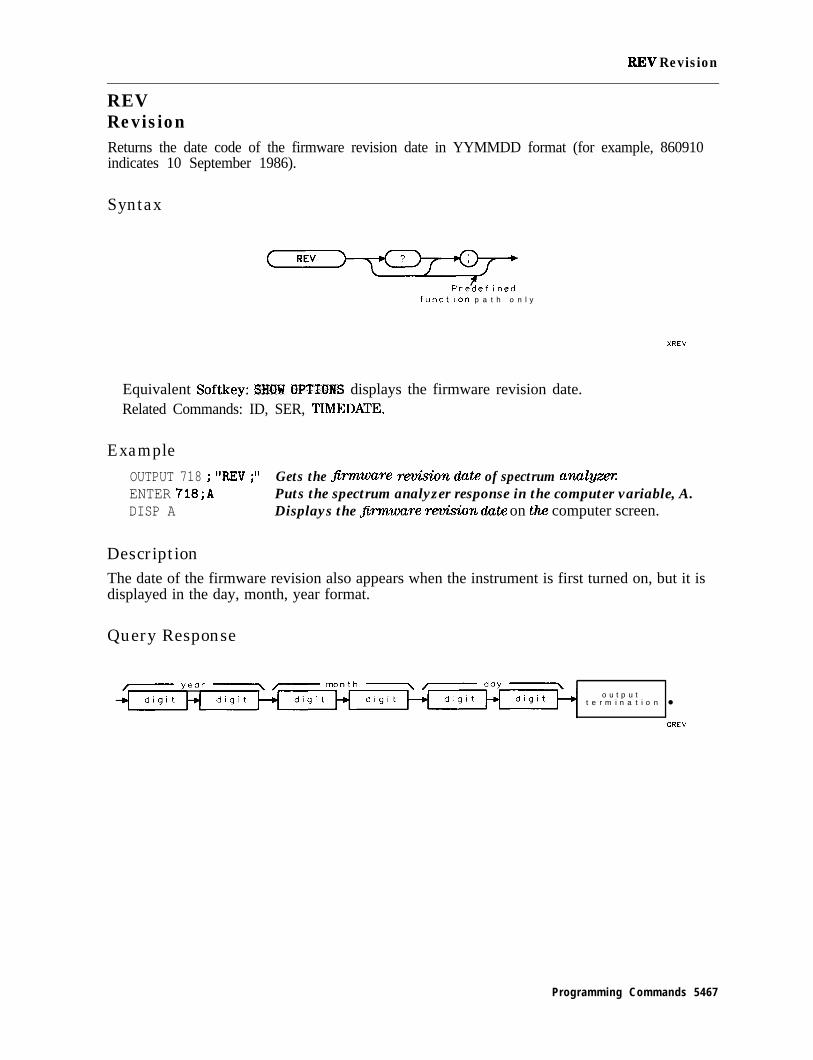
RJW Revision
REVRevisionReturns the date code of the firmware revision date in YYMMDD format (for example, 860910indicates 10 September 1986).
Syntax
function p a t h o n l y
XRE”
Equivalent Softkey: SHOW QPTIONS displays the firmware revision date.Related Commands: ID, SER, TIMEDATE.
ExampleOUTPUT 718 ; "REV ; I’ Gets the firmware revision date of spectrum analgz-ezENTER 718;A Puts the spectrum analyzer response in the computer variable, A.DISP A Displays the jiirmware rezviSiOn date on the computer screen.
DescriptionThe date of the firmware revision also appears when the instrument is first turned on, but it isdisplayed in the day, month, year format.
Query Response
o u t p u tt e r m i n a t i o n l
QREV
Programming Commands 5467
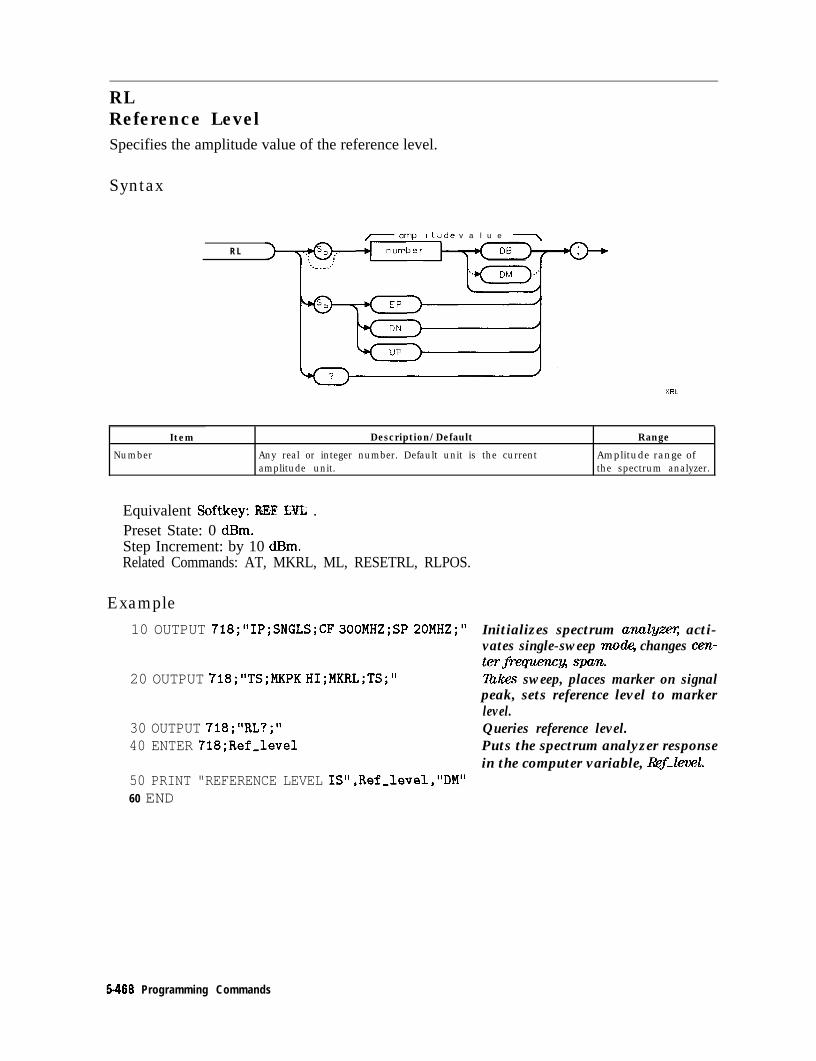
RLReference LevelSpecifies the amplitude value of the reference level.
Syntax
R L
- ompl itude v a l u e 7
XRL
Item Description/Default Range
Number Any real or integer number. Default unit is the current Amplitude range ofamplitude unit. the spectrum analyzer.
Equivalent Softkey: REF LYL .Preset State: 0 dBm.Step Increment: by 10 dBm.Related Commands: AT, MKRL, ML, RESETRL, RLPOS.
Example
10 OUTPUT 718;"IP;SNGLS;CF 300MHZ;SP 20MHZ;"
20 OUTPUT 718;"TS;MKPK HI;MKRL;TS;"
30 OUTPUT 718;"RL?;"40 ENTER 718;RefJevel
50 PRINT "REFERENCE LEVEL IS",Ref-level,"DM"60 END
Initializes spectrum analy,wq acti-vates single-sweep mooTq changes cen-tecfmww4, span.Zxkes sweep, places marker on signalpeak, sets reference level to markerlevel.Queries reference level.Puts the spectrum analyzer responsein the computer variable, Reflevel.
5468 Programming Commands

RL Reference Level
DescriptionThe reference level and input attenuator are coupled to prevent gain compression. Signals withpeaks at or below the reference level are not affected by gain compression.
Caution Signal levels above +30 dBm will damage the spectrum analyzer.
RL may affect the attenuation value.
Query Response
Programming Commands 5-469

RLPOSReference-Level PositionSelects the position of the reference level.
Syntax
R L P O S
XRLPOS
Item Description/Default Range
Number Any real or integer number. 0 to 8.
Step Increment: 1.Related Commands: IP, MEASURE, NRL, RL.Preset State: RLPOS 8.
Example
OUTPUT 718;"IP;"OUTPUT 718;"MEASURE NRM;"OUTPUT 718;"AMBPL ON;"OUTPUT 718;"RLPOS 7;"
Initializes spectrum analyzerChanges the measurement mode to normalized.Activates trace normalization.Rwitions the refwence level at the seventh major gratic-ule division.
DescriptionThe RLPOS command changes the position of the reference level during log display mode. Thetop and bottom graticule lines correspond to 8 and 0, respectively. RLPOS must be used withMEASURE NRM or MEASURE SR, and AMBPL ON or AMB ON. Arrows appear on the left andright side of the screen graticule when the reference level position is changed.
Query Response
5-470 Programming Commands

RMS Root Mean Square Value
RMSRoot Mean Square ValueReturns the root mean square value of the trace in measurement units.
Syntax
R M S
b u s e r - d e f i n e d t r a c e I
Item Description/Default Range
User-defined trace A trace defmed by the TRDEF command. Any valid trace name.
Trace range A segment of trace A; trace B, trace C, or a user-defined trace.
Prerequisite Commands: TRDEF when using a user-defined trace. TS when using trace data.Related Commands: MEAN, PDA, PDF, STDEV, VARIANCE.
ExampleOUTPUT 718;"IP;SNGLS;TS;"OUTPUT 718*"RMS TRA'."ENTER 718;Ikmber
- 9
DISP Number
DescriptionTrace data, user-defined trace data, and trace range data are treated as 16-bit integers.
Query Response
Programming Commands 5-471

ROFFSETReference Level OffsetOffsets all amplitude readouts without affecting the trace.
Syntax
R O F F S E T
Item Description/Default I Range
Number Any real or integer number. Default unit is dB. -200 dB to + 200 dB.
Equivalent Softkey: REF LVL OFFSET .Preset State: 0 dB.Related Commands: AT, RL.
Example10 OUTPUT 718; “IP; ”20 OUTPUT 718;“RL -2ODB;”30 OUTPUT 718 ; “ROFFSET -10 ; ”
40 OUTPUT 718;"RL?;"
50 ENTER 718;Ref
60 DISP "THE NEW REFERENCE LEVEL IS ",Ref70 END
Description
Initializes spectrum analyzexChanges the refwence level.Changes spectrum analyzer reference off-set value.Gets the reference value from spectrumanalyzer:Puts the spectrum analyzer response inthe computer variable, I@$LXsphys -30 as the new refwence level.
Once activated, the ROFFSET command displays the amplitude offset in the active functionblock. And, as long as the offset is in effect, the offset is displayed on the left side of thescreen.
Entering ROFFSET 0 or presetting the spectrum analyzer eliminates an amplitude offset.
Query Response
5-472 Programming Commands

RQS Service Request Mask
RQSService Request MaskSets a bit mask for service requests (see “SRQ”).
Syntax
m a s k f o r s e r v i c e
XRQS
Item Description/Default Range
Number Any valid integer. 0 to 62.
Related Commands: SRQ, STB.
ExampleOUTPUT 718;"RQS 12;" Sends a mask bit for hardware broken and end of sweep.
DescriptionAssignment of values for the mask is as follows:
32 = Illegal command (bit 5)16 = Command complete (bit 4)8 = Hardware broken (bit 3)4 = End of sweep (bit 2)2 = Units key pressed (bit 1)
As shown in the example, a mask with hardware broken and end of sweep is equal to 12 (8 +4). The mask also disables command complete and illegal command interrupts.
To activate all conditions in the mask, the mask value is equal to 62 (32 + 16 + 8 + 4 + 2). lbset the service request mask for all conditions, execute OUTPUT 718 ; "RQS 62 ; 'I.
Programming Commands 5-473

RQS Service Request Mask
Each bit in the status byte is defined as follows:
1 Indicates that the units key was pressed. SRQ 102 appears on the spectrum analyzerscreen. If you activate the units key bit, it will remain active until you activate “EE” andpress a units key. (See “EE.“)
2 Indicates end of sweep. SRQ 104 appears on the spectrum analyzer screen. If you send anyRQS value that contains mask value 4, another sweep will be taken.
3 Indicates broken hardware. SRQ 110 appears on the spectrum analyzer screen.
4 Indicates completion of a command. It is triggered by EOI at the end of a command stringor the completion of a print or plot.
5 Indicates an illegal spectrum analyzer command was used. SRQ 140 appears on thespectrum analyzer screen.
0 (LSB), 6, and 7 are not used.
The spectrum analyzer screen numbers 102, 104, and 110 are the octal values correspondingto the status register values; that is, SRQ 102 = bit 6 = octal 100 and bit 2 = octal 2 are bothtrue.
A service request is generated only if the proper request mask bit has been set, and eitherthe condition itself or the Force Service Request (see “SRQ”) is sent. To set the request mask,choose the desired interrupt conditions and sum their assigned values. Executing the RQScommand with this value sets the bit mask. After setting the bit mask, only the chosenconditions can produce an interrupt. Generally, you must set the bit mask using the RQScommand. However, the “hardware broken” and “illegal remote command” conditions areautomatically enabled after presetting or sending the IP command. Pressing (PRESET) or sendingthe IP command, then, produces the same interrupt bit mask as sending “RQS 40;” (decimal 40is the sum of the assigned values of these two interrupt bits, 32 = Bit 5 and 8 = Bit 3).
For most conditions, the RQS mask bit stays set until the next IP or RQS command is executed.The only condition in which this does not apply is the Units Key Pressed bit. When this bit (bit1) is set in the RQS mask, a Units Key Pressed interrupt occurs if EE (enable entry mode) isexecuted and a front-panel units key such as Hz, kHz, MHz, or GHz is pressed.
When a units key is pressed, the interrupt occurs and the Units Key Pressed bit in the RQSmask is reset. To reenable the Units Key Pressed interrupt, you must send a new RQS mask.
Query Response
5-474 Programming Commands

SAVEMENU Save Menu
SAVEMENUSave MenuSaves menu 1 under the specified menu number.
Syntax
Item Description/Default R-f@
Number Any valid integer. 1, 101 to 200.
Example
OUTPUT 718;"MENU 1;" Laplays rrlenu 1.OUTPUT 718;"SAVEMENU 101;" Copies the key functions from menu 1 into menu 101.OUTPUT 718;"KEYCLR;" Erases the key functions of menu 1.PAUSEOUTPUT 718;"MENU 101;" Displays ?T?Enu 101.
DescriptionThe softkey number corresponds to the menu number as follows:
softkey number = (menu number - 1) x 6 + softkey position(The softkey position range is 1 through 6.)
For example:
Menu 1 contains softkey numbers 1 through 6Menu 101 contains softkey numbers 601 to 606Menu 200 contains softkey numbers 1195 to 1200
Menu 1 is can be accessed by pressing (j-1, UJser Menus .
Menus 101 through 200 as well as menu 1 can be accessed using the MENU command. See“MENU” for more information about accessing softkeys and menus.
Programming Commands 5475

SAVESSave StateSaves the currently displayed instrument state in spectrum analyzer memory.
Syntax
stater r e g i s t e r
SAVESXSAVES
Item Description/Default Range
Number Any valid integer. 1 to 8.
Equivalent Softkey: STATE -> INTRNL .Related Commands: OL, PSTATE, RCLS, SAVET, STOR.
ExampleOUTPUT 718;"IP;CF 300MHZ;SP 20MHZ;" Initializes spectrum analyze?; changes center
frequencvp span.OUTPUT 718."SAVES 1."8 3 Saves spectrum analyzer state in register 1.
DescriptionThe state data is saved in the specified state register if the state registers have not been lockedby the PSTATE command.
Only state registers 1 through 8 are available for saving the instrument state. State registernine contains the previous state data, state register zero contains the current state.
Note The SAVES command saves state data in spectrum analyzer memory. See“STOR” or “SAVRCLN” to save state data on a RAM card.
5-476 Programming Commands

!&WET Save Trace
SAVETSave TraceSaves the selected trace data and state information, amplitude correction factors, or limit-linetables in spectrum analyzer memory.
Syntax
SAVET
t r a c er r e g i s t e r
XSAVET
Item
User-defined trace
Trace range
Number
Description/Default
A trace defined by the TRDEF command with a length of 401elements.
A segment of trace A, trace B, trace C, or a user-defined trace.
Any valid integer.
Rwe
Any valid trace name.
0 to TRCMEM - 1.
Equivalent Softkey: Trace -> Intrnl .Prerequisite Commands: TRDEF when using a user-defined trace.Related Commands: CAT, CLRW, PSTATE, RCLT, SNGLS, TS, VIEW.
ExampleOUTPUT 718;"IP;CF 300MHZ;SP 20MHZ;TS;"
OUTPUT 718;"VIEW TRA;SAVET TRA,l;"
Initializes spectrum analym changes thecenter frequency and span.Puts trace A in the view mode, saves spec-trum analyzer state and trace A data in reg-ister 1.
OUTPUT 718;"IP;" Initializes spectrum analyzerOUTPUT 718;"RCLT TRA,l;VIEW TRA;" Recalls spectrum analyzer state, trace data.
Programming Commands 5.477

SAVET Save Trace
DescriptionThe trace data is saved in the specified register if the state registers have not been locked byPSTATE ON (see “SAVES”). Use AMPCOR to save amplitude correction factors, LIMILINE tosave limit-line tables.
The TS and VIEW commands should be executed prior to saving trace data.
The SAVET command saves trace data, amplitude correction factors, or limit-line tables inspectrum analyzer memory. See “STOR” or “SAVRCLN” to save data on a RAM card.
5.478 Programming Commands

SAVRCLF Save or Recall Flag
SAVRCLFSave or Recall FlagIndicates a save or recall operation.
Syntax
SAVRCLF
Related Commands: MSI, PREFX, RCLS, RCLT, SAVES, SAVET, SAVRCLN, SAVRCLW.
ExampleThis example allows trace A to be saved on a RAM card.
OUTPUT 718; “SAVRCLF SAVE; ”OUTPUT 718; “SAVRCLW TRA; ”OUTPUT 718; “MS1 CARD; ”
OUTPUT 718 ; ~~PFW~ %FRED% ; 11
OUTPUT 718;“PU;PA O,lGO;TEXT%ENTER TEST NUMBER%;”
OUTPUT 718 ; ” SAVRCLN EP ; ”
Spec@ies a save operation.Spec4Jie.s the source as trace A.Specifies the card as the massstorage device.SpecQies the pre$k to store thetrace data under:Prompts the user for the num-ber to append to the prem.Ajbr the user enters the num-ber; the number is to appendedto the pre$xand the data trans-fer is initiated.
The RAM card now contains a file called tFRED_(register number).
Programming Commands 5479

SAVRCLNSave or Recall NumberSpecifies the number to append to the prefix for a save or recall operation, and initiates thetransfer of data.
Syntax
n u m b e r t o
SAVRCLN
XSAVRCLN
Item Description/Default Range
Number Any valid integer. Dependent on massstorage device.
Related Commands: MSI, PREFX, RCLS, SAVES, SAVRCLF, SAVRCLW.
ExampleThis example allows trace A to be saved on a RAM card.
OUTPUT 718;"SAVRCLF SAVE;"OUTPUT 718;"SAVRCLW TRA;"OUTPUT 718;"MSI CARD;"
OUTPUT 718;lf~~~FX %FRED%;"
OUTPUT 718;"PU;PA O,IGO;TEXT%ENTER TEST NUMBER%;"
OUTPUT 718;"SAVRCLN EP;"
Specifies a save operation.Spetii_ifies the source as trace A.Specifies the card as the massstorage dewice.SpecQies the prem to store thetrace data under:Prompts the user for the num-ber to append to the prem.A$er the user enters the num-ber, the number is appended tothe pre& and the data transferis initiated.
5480 Programming Commands

SAVRCLN Save or Recall Number
DescriptionSAVRCLN is used to save or recall data from spectrum analyzer memory or from a RAM card.SAVRCLN is useful if you want to write a program that allows the spectrum analyzer operatorto save data in spectrum analyzer memory or on a RAM card. The SAVRCLN command usesthe SAVRCLF flag information, SAVRCLW information, prefix, and mass storage device whentransferring data.
Because the SAVRCLN command initiates the transfer of data, it should be the last commandspecified in the sequence to save or recall data.
The sequence to save or recall data is as follows:
1. Specify either a save or recall operation with SAVRCLF.
2. Indicate the type of data to be saved or recalled using SAVRCLW.
3. Specify a RAM card or spectrum analyzer memory as the mass storage device with MSI.
4. When saving to or recalling from a RAM card, specify the prefix to be used with PREFX.The prefix is ignored when saving or recalling from spectrum analyzer memory.
5. Enter the number to append to the prefix and initiate the data transfer with SAVRCLN.
When saving trace data, amplitude correction factors, or limit-line tables in spectrum analyzermemory, specify a number within the trace register number range (0 to TRCMEM - 1). Whensaving state data in spectrum analyzer memory, specify a number within the state numberrange (1 to 8).
When saving data on a RAM card, the number plus the number of characters in the prefix mustnot exceed eight characters.
Note With the memory card reader, the spectrum analyzer can read from either aRAM (random-access memory) card or a ROM (read-only memory card). lbwrite to a memory card, the memory card must be a RAM card. The spectrumanalyzer cannot write to a ROM card.
Programming Commands 5481
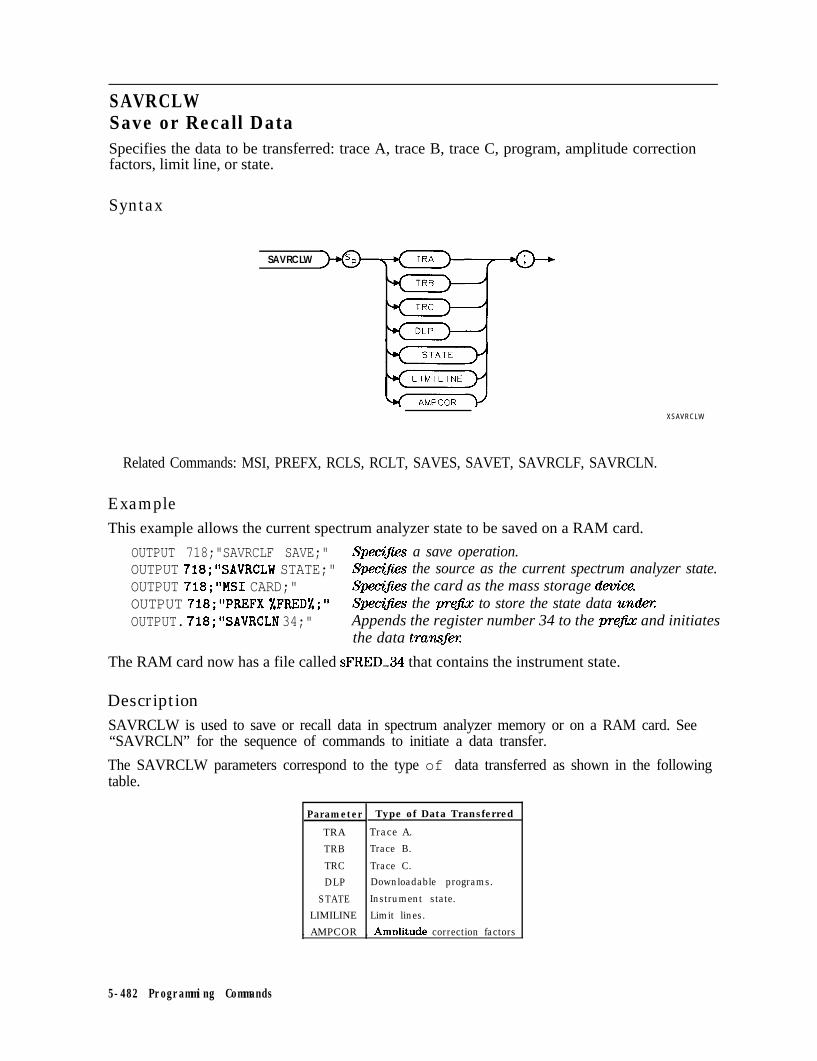
SAVRCLWSave or Recall DataSpecifies the data to be transferred: trace A, trace B, trace C, program, amplitude correctionfactors, limit line, or state.
Syntax
SAVRCLW
XSAVRCLW
Related Commands: MSI, PREFX, RCLS, RCLT, SAVES, SAVET, SAVRCLF, SAVRCLN.
ExampleThis example allows the current spectrum analyzer state to be saved on a RAM card.
OUTPUT 718;"SAVRCLF SAVE;" SpecQies a save operation.OUTPUT 718;"SAVRCLW STATE;" Spec(jies the source as the current spectrum analyzer state.OUTPUT 718;"MSI CARD;" SpecQies the card as the mass storage okwice,OUTPUT 718;"PREFX %FRED%;" [email protected] the pre@ to store the state data under:OUTPUT. 718;"SAVRCLN 34;" Appends the register number 34 to the prefix and initiates
the data transfm
The RAM card now has a file called sFRED-34 that contains the instrument state.
DescriptionSAVRCLW is used to save or recall data in spectrum analyzer memory or on a RAM card. See“SAVRCLN” for the sequence of commands to initiate a data transfer.
The SAVRCLW parameters correspond to the type of data transferred as shown in the followingtable.
Parameter Type of Data Transferred
TRA Trace A.
TRB Trace B.
TRC Trace C.DLP Downloadable programs.
STATE Instrument state.
LIMILINE Limit lines.
. AMPCOR , AmDlitude correction factors
5-482 Programming Commands

SEGDEL Segment Delete
SEGDELSegment DeleteDeletes the specified segment from the limit-line tables.
Syntax
SEGDEL
s e g m e n t7 n u m b e r
Related Commands: LIMIMODE, LIMISEG, LIMISEGT, SENTER, SENTERT.
Example 1This example uses LIMIMODE for entering segments into the upper limit-line table, thenentering a segment into the lower limit-line table (upper and lower limit lines are treated asseparate tables). Line 60 demonstrates the effect of deleting a segment when the upper andlower limit-line tables are treated separately.
10 OUTPUT 718;"LIMIDEL;"
20 OUTPUT 718;"LIMIMODE UPPER ;25 OUTPUT 718;"LIMIFT FREQ;"30 OUTPUT 718;"LIMISEG BOOMHZ ,
40 OUTPUT 718;"LIMIMODE LOWER
,I
-3ODB,FLAT;"
II
50 OUTPUT 718;"LIMISEG 300MHZ;-70DB,FLAT;"
60 OUTPUT 718;"SEGDEL 1;"
Deletes the current limit-line table, setsthe table type to jixed.Speci$?es the upper limit-line table.Limit lines to be based on frequenq.Enters a segment into the upper limit-line table.Spe&fi.es the lower limit-line table.l3nters a segment into the lower limit-line table.Deletes the segment from the lower limit-line table.
70 END
Programming Commands 5-483

SEGDEL Segment Delete
Example 2With the addition of line 60, the upper and lower limit-line tables are no longer treated asseparate tables, but as one table. The segment is deleted from the upper and lower limit-linetables (for the given frequency).
10 OUTPUT 718;"LIMIDEL;"20 OUTPUT 718;"LIMIMODE UPPER;"25 OUTPUT 718;"LIMIFT FREQ;"30 OUTPUT 718;"LIMISEG 300MHZ,-30DB,FLAT;"
40 OUTPUT 718;"LIMIMODE LOWER;"50 OUTPUT 718;"LIMISEG SOOMHZ ,-70DB,FLAT;"
60 OUTPUT 718;"LIMIMODE UPLOW;"
70 OUTPUT 718;"SEGDEL 1;"
80 END
Description
Deletes the current limit-line table.Specifies the upper limit-line table.Limit lines to be based on frequency.Enters segment into the upper limit-line table.Spec@es the lower limit-line table.Enters a segment into the lower limit-line tableSpe&@ both the upper and lowerlimit-line tables.Deletes the segment from the upperand lower limit-line tables.
The result of SEGDEL depends on the setting of the LIMIMODE command as shown in thefollowing table.
LIMIMODE Setting Result of SEGDEL
LIMIMODE UPPER Deletes specified segment from the upper limit-line table.
LIMIMODE LOWER Deletes specilled segment from the lower limit-line table.
LIMIMODE UPLOW Deletes specified segment from the upper and lower limit-line table.
LIMIMODE DELTA Deletes specified segment from the mid and delta limit-line table.
You may want to query LIMIMODE before using SEGDEL if you are unsure of the LIMIMODEsetting.
‘Ib determine the number of each segment, you can use the softkeys accessed by Edi% Limitto display the limit-line table. (Limit-line entries are sorted according to frequency or time.)
5.484 Programming Commands

SENTER Segment Entry for Frequency Limit Lines
SENTERSegment Entry for Frequency Limit LinesEnters the limit-line data in the upper and lower limit-line table or the mid and delta table forlimit lines based on frequency.
Syntax
SENTER
,- f r e q u e n c y -\
H Z
K H Z
~.b(-E--) . .
qF-) . .
WpT-) . .L /
p r e d e f i n e d v a r i a b l e
r u p p e r o r m i d v a l u e
$ p r e d e f i n e d v a r i a b l e J
huser-defined variable>
b t r a c e e l e m e n t J
l o w e r o r d e l t a v a l u e
XSENTER
Programming Commands 5-485

SENTER Segment Entry for Frequency Limit Lines
Item Description/Default
Number Any real or integer number. Default unit is dBm.
User-defined variable A variable defined by VARDEF or ACTDEF commands.
Predelined variable A command that acts as a variable. Refer to Table 5-1.Trace element An element of trace A, trace B, trace C, or a user-defined trace.
Related Commands: LIMIMODE, LIMIREL, LIMISEG, SEGDEL, SENTERT.
Example 1
RangeVaries with FOFFSETand ROFFSET.Any valid variablename.
This example enters limit-line values into the upper and lower limit-line tables.
OUTPUT 718;"LIMIFT FREQ;" Sets the limit lines to be based [email protected] the upper and lower limit-line table asfixed.
OUTPUT 718;"LIMIMODE UPLOW;LIMIREL OFF;"
OUTPUT 718;"SENTER 300MHZ,-lODB,-50DB,FLAT;" Enters in values jiwasegment.OUTPUT 718;"SENTER 350MHZ,-15DB,-60DB,FLAT;" Entersinvalwforasegment.
Example 2
OUTPUT 718;"LIMIFT FREQ;" Sets the limit lines to be based on.PewenwSpecifies the mid and delta table for-mat and#xed type.
OUTPUT 718;"LIMIMODE DELTA;LIMIREL OFF;"
OUTPUT 718;"SENTER 300MHZ,-20DB,lODB,FLAT; ‘I Entersinvalues forasegment.OUTPUT 718;"SENTER 350MHZ,-30DB,20DB,FLAT;" Entersinvaluesforasegment.
DescriptionEach limit-line segment is specified with a starting frequency, an upper or median amplitudevalue, a lower or delta amplitude value, and a segment type. The segment type defines how theline segment is to extend from its starting point to the next segment.
Note If the current limit line table contains lines based on sweep time (as opposed toa limit line based on the frequency), executing SENTER will clear the currentsweep time limit line table.
The three segment types are FLAT, SLOPE, and POINT.
n FLAT draws a zero-slope line between the coordinate point of the current segment and thecoordinate point of the next segment, producing limit-line values equal in amplitude for allfrequencies between the two points. If the amplitude values of the two segments differ, thelimit-line will “step” to the value of the second segment.
n SLOPE draws a straight line between the coordinate point of the current segment and thecoordinate point of the next segment, producing limit-line values for all frequencies betweenthe two points.
E-486 Programming Commands

SENTER Segment Entry for Frequency Limit Lines
n POINT specifies a limit value for the coordinate point, and no other frequency points, sothat a POINT segment specifies a limit value for a single frequency. For an upper limit-line,a POINT segment is indicated by a line drawn from the coordinate point, vertically off thetop of screen. For a lower limit-line, a POINT segment is indicated by a line drawn from thecoordinate point, vertically off the bottom of screen. The POINT segment type should beused as the last segment in the limit-line table. However, if the last segment in the table isnot specified as the POINT segment type, an implicit point is automatically used. If a visiblePOINT segment at the right-hand edge of the display is not desired, add an explicit last pointsegment to the limit-line table that is higher in frequency than the stop frequency.
Segments are sorted as they are entered according to starting frequency. A maximum of 20segments can be defined using SENTER. When the type is omitted, the last type given (orSLOPE if no previous type has been given) is used.
Programming Commands 5487

SENTERTSegment Entry for Sweep Time Limit LinesEnters the limit-line data in either the upper and lower limit-line table or the mid and deltatable for limit lines based on sweep time.
Syntax
t i m e -,
SENTERT -I us /
p r e d e f i n e d v a r i a b l e
u s e r - d e f i n e d v a r i a b l e
t r a c e e l e m e n t
l o w e r o r d e l t a v a l u e/ \
% p r e d e f i n e d v a r i a b l e d
buuser-defined voriobleJ
L t r a c e e l e m e n t 2
5488 Programming Commands

SENTERT Segment Entry for Sweep Time Limit Lines
Item Description/Default RangeUumber Any real or integer number. For amplitude, the The range for the
default unit is dBm. For sweep time, the default amplitude variesunit is seconds. with ROFFSET.
The range for thesweep time is thesweep time rangeof the spectrumanalyzer.
User-defined variable A variable defined by VARDEF or ACTDEF Any validcommands. variable name.
?redefined variable A command that acts as a variable. Refer to ‘Ikble5-1.
Trace element An element of trace A, trace B, trace C, or auser-defined trace.
Related Commands: LIMIMODE, LIMIREL, LIMISEGT, SEGDEL, SENTER.
Example 1This example enters limit-line values into the upper and lower limit-line tables.
OUTPUT 718;"RL -1ODB;"OUTPUT 718~"LIMIDEL*"OUTPUT ~~~I~~LIMIFT +IME;"
Sets the reference level to -10 dBErases any the current limit line table.Sets the limit lines to be based onsweep time.
OUTPUT 718;"LIMIMODE UPLOW;LIMIREL ON;" Specifies the upper and lower limit-line table as rektive.
OUTPUT 718;"SENTERT lOMS,-lODB,-50DB,FLAT;" Enters in values for a segment.OUTPUT 718;"SENTERT OMS,-15DB,-GODB,FLAT;" Enters in values for a segment.OUTPUT 718;"LIMITEST 0N;TS;" Turns on the limit-line testing.
Example 2
OUTPUT 718;"LIMIFT TIME;" Sets the limit lines to be based on sweeptime.
OUTPUT 718;"LIMIMODE DELTA;LIMIREL OFF;" [email protected] the mid and delta table formatand jkzd type.
OUTPUT 718;"SENTERT lOMS,-20DB,lODB,FLAT;" Enters in values for a segment.OUTPUT 718;"SENTERT OMS,-30DB,20DB,FLAT;" Enters in values for a segment.OUTPUT 718;"LIMITEST 0N;TS" Turns on the limit-line testing.
DescriptionEach limit-line segment is specified with a starting sweep time, an upper or median amplitudevalue, a lower or delta amplitude value, and a segment type. The segment type defines how theline segment is to extend from its starting point to the next segment.
Programming Commands 5488

SENTERT Segment Entry for Sweep Time Limit Lines
Note If the current limit line table contains lines based on frequency (as opposed to alimit line based on the sweep time), executing SENTERT will clear the currentfrequency limit line table.
The three segment types are FLAT, SLOPE, and POINT.
n FLAT draws a zero-slope line between the coordinate point of the current segment and thecoordinate point of the next segment, producing limit-line values equal in amplitude for allsweep times between the two points. If the amplitude values of the two segments differ, thelimit-line will “step” to the value of the second segment.
n SLOPE draws a straight line between the coordinate point of the current segment and thecoordinate point of the next segment, producing limit-line values for all sweep times betweenthe two points.
n POINT specifies a limit value for the coordinate point, and no other sweep time points, sothat a POINT segment specifies a limit value for a single sweep time. For an upper limit-line,a POINT segment is indicated by a line drawn from the coordinate point, vertically off thetop of screen. For a lower limit-line, a POINT segment is indicated by a line drawn from thecoordinate point, vertically off the bottom of screen. The POINT segment type should beused as the last segment in the limit-line table. However, if the last segment in the table isnot specified as the POINT segment type, an implicit point is automatically used. If a visiblePOINT segment at the right-hand edge of the display is not desired, add an explicit last pointsegment to the limit-line table that is higher in sweep time than the current sweep time ofthe spectrum analyzer.
Segments are sorted as they are entered according to starting sweep time. A maximum of 20segments can be defined using SENTERT.
5480 Programming Commands

SER Serial Number
SERSerial NumberReturns the serial number suffix of the spectrum analyzer.
Syntax
f u n c t i o n p a t h o n l y
XSER
Related Commands: ID, REV.
ExampleDIM Serial$[24] Reserves m.emory space for a string.OUTPUT 718;"SER;" Gets the serial number from the spectrum analyzer:ENTER 718; Serials Puts the spectrum analyzer response in the computer variable.DISP Serial$ Displays the serial number on the computer screen.
Query ResponseThe last five digits of the serial number are returned.
o u t p u t’ t e r m i n a t i o n --)
Programming Commands 5-481

SETDATESet DateAllows you to set the date of the real-time clock of the spectrum analyzer.
Syntax
d a t ef (YYMMDD)
XSETDATE
Item Description/Default R-t+Number A number in the YYMMDD format. Valid year, month, and
Equivalent Softkey: SET DATE .Related Commands: SETTIME, TIMEDATE, TIMEDSP.
Example
OUTPUT 718;"SETDATE 890212;" Sets the date to Fidmu.zry 12, 1989.
Query Response
o u t p u tt e r m i n a t i o n l
QSETDATE
5482 Programming Commands

SETTIME Set Time
SETTIMESet TimeAllows you to set the time of the real-time clock of the spectrum analyzer.
Syntax
t imer (HHMMSS)
XSETTIME
Item Description/Default R=ae
Number A number in the HHMMSS (24 hour) format. 0 to 235959.
Equivalent Softkey: SET TIME.Related Commands: SETDATE, TIMEDATE, TIMEDSI?
Example
OUTPUT 718;"SETTIME 135501;" Sets the time to 1:55:01 PM.
Query Response
,- h o u r
d i g i t
PSETTIME
Programming Commands 5-493

SMOOTHSmooth TraceSmoothes the trace according to the number of points specified for the running average.
Syntax
b u s e r - d e f i n e d trace /
b t r a c e r a n g e /
h p r e d e f i n e d v a r i a b l e /
buser-defined variable)
b p r e d e f i n e d f u n c t i o n /
L t r a c e e l e m e n t /
XSMOOTH
Item
User-defined trace
Trace range
Number
User-defined variable
Description/Default R=u3eA trace deflned by the TRDEF command. Any valid trace name.
A segment of trace A, trace B, trace C, or a user-defined trace.
Any real or integer number. Real number range.
A variable defined by VARDEF or ACTDEF commands. Any valid variablename.
Predetied variable A command that acts as a variable. Refer to Table 5-l.
Predeflned function Function that returns a value. Refer to Table 5-1.Trace element An element of trace A, trace B, trace C, or a user-defined trace.
Prerequisite Commands: TRDEF when using a user-defined trace. ACTDEF or VARDEF for auser-defined variable. TS when using trace data.Related Commands: SNGLS, TS, VAVG.
5494 Programming Commands

SMOOTH Smooth Trace
Example
10 OUTPUT 718;"IP;"20 OUTPUT 718;"SNGLS;TS;"30 OUTPUT 718;"VIEW TRA;"40 OUTPUT 718;"SMOOTH TRA,lO;"50 OUTPUT 718;"VIEW TRA;"60 END
Description
Initializes spectrum analyzer:Activates single-sweep mode, takes a sweep.Stores results of trace A.Smoothes trace A.Displays the result.
Each point value is replaced with the average of the values (in measurement units) of thegiven number of points centered on it. Increasing the number of points increases smoothing atthe cost of decreasing resolution. If the number of points is an even number, then the numberof points is increased by one. If the number of points is larger than the size of SOURCE, thenthe size of SOURCE is used (unless size of SOURCE is even, in which case the size of SOURCEminus one is used). Smoothing decreases at the endpoints.
The purpose of this function is to perform a spatial video averaging as compared to thetemporal version supplied by the video-average (VAVG) command. The functions of SMOOTHand VAVG are not interchangeable however. Unlike VAVG, SMOOTH averages values that occurbefore and after the data point in time. This can cause some display irregularities at the startand stop frequencies. Use low values for the SMOOTH parameter to avoid signal distortion.
By replacing the value of each point in a trace with the average of the values of a number ofpoints centered about that point, any rapid variations in video noise or signals are smoothedinto more gradual variations. It thereby performs a function similar to reducing the videobandwidth without the corresponding changes in sweep time. As such, it does result in areduction of frequency resolution. Also, signal peaks are reduced with large smoothing values,and this can cause the amplitude to appear to be low.
This command requires user memory for its execution. Memory is not permanently allocated,so the largest amount of memory is available for the functions that are used in a particularapplication. When the command is complete, memory is returned to the free user memory.
Programming Commands 5495

SNGLSSingle SweepSets the spectrum analyzer to single-sweep mode.
Syntax
SNGLS
Equivalent Keys: CsGLSWP) or SlJEEP COI?T SGL (SGL is underlined).Related Commands: CLRW, CONTS, TM, TS.
ExampleOUTPUT 718;"SNGLS;"
DescriptionEach time TS (take sweep) is sent, one sweep is initiated, as long as the trigger and data entryconditions are met.
Fbr the HP 8592L or the HP 85933 only: The frequency span that can be viewed with asingle-sweep is bounded by the instrument range only; therefore, band 0 can be included in amultiband sweep in single sweep mode. This allows a 0 GHz to 22 GHz span with an HP 8592Lor HP 85933 (also see “TS”).
5496 Programming Commands

SP Span
SPSpanChanges the total displayed frequency range symmetrically about the center frequency.
Syntax
/ f r e q u e n c y s p a n \
HZf+
\
\
Item Description/Default R-f3e
Number Any real or integer number. Default unit is Hz. Frequency span of thespectrum analyzer.
Equivalent Softkey: SPAN .Step Increment: 1, 2, 5, 10 sequence (up to the stop frequency of the spectrum analyzer).Related Commands: CF, FA, FB, FOFFSET, FS, HNLOCK, HNUNLK, RB, ST, VB.
Example
OUTPUT 718;"IP;SP 20MHZ;" Initializes spectrum analym changes frequency span.OUTPUT 718;"SP?;" Gets the span value from the spectrum analyzerENTER 718;Span Puts the spectrum analyzer response in the computer vari-
able, Span.PRINT Span Displays the span value.
Programming Commands 5497

SP Span
DescriptionThe frequency span readout refers to the displayed frequency range. Dividing the readout by10 yields the frequency span per division.
If resolution and video bandwidths are coupled to the span width, the bandwidths change withthe span width to provide a predetermined level of resolution and noise averaging. Likewise,the sweep time changes to maintain a calibrated display, if coupled. All of these functions arenormally coupled, unless RB, VB, or ST have been executed.
Because span is affected by frequency, change the frequency before changing span (see“HNLOCK”). For the HP 8592L and HP 85933, the span can be set to include band 0 and band1 except in single-sweep mode.
Specifying 0 Hz enables zero-span mode, which configures the spectrum analyzer as afixed-tuned receiver.
Query Response
0 0 1
5-499 Programming Commands
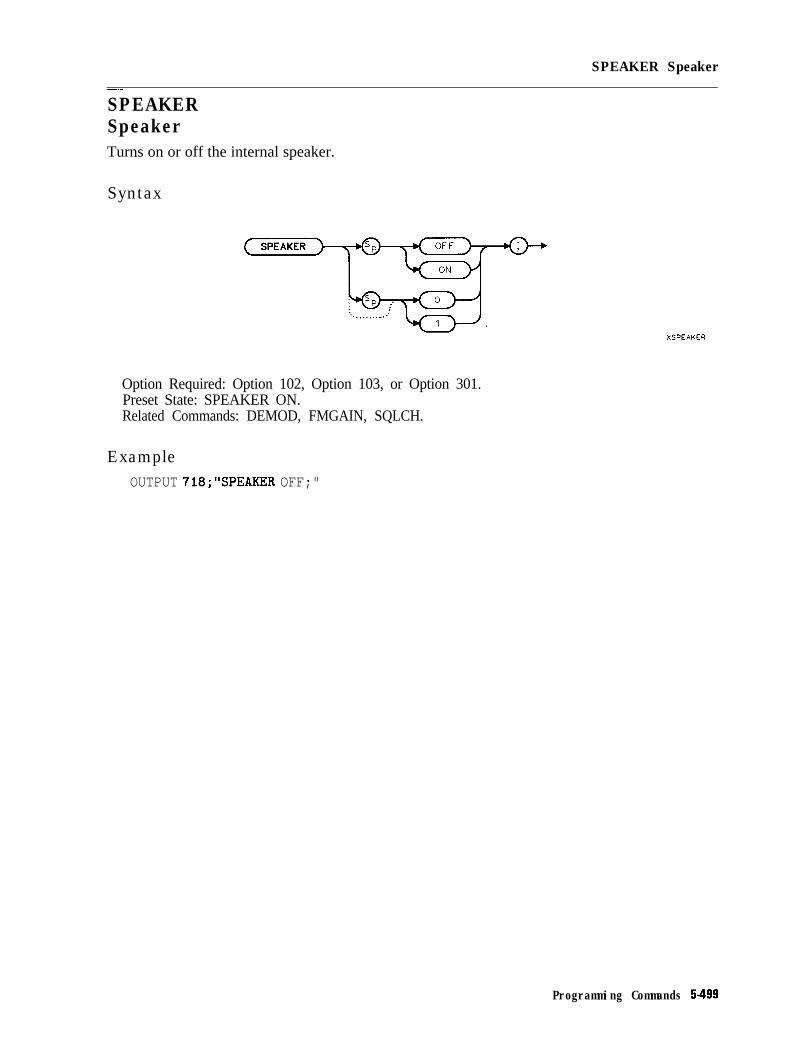
SPEAKER Speaker
SPEAKERSpeakerTurns on or off the internal speaker.
Syntax
XSPEAKER
Option Required: Option 102, Option 103, or Option 301.Preset State: SPEAKER ON.Related Commands: DEMOD, FMGAIN, SQLCH.
ExampleOUTPUT 718;"SPEAKER OFF;"
Programming Commands 5-499

SPZOOMSpan ZoomPlaces a marker on the highest on-screen signal (if an on-screen marker is not present), turnson the signal track function, and activates the span function.
Syntax
Equivalent Softkey: SPAN ZOOM.Restrictions: Not available with Analog+ display mode. See “ANLGPLUS” for moreinformation.
ExampleOUTPUT 718;"IP;CF 300MZ;TS;"OUTPUT 718;"SPZOOM;"
DescriptionIf a marker is present before SPZOOM is executed, SPZOOM turns on the signal track functionand activates the span function.
5400 Programming Commands

SQLCH Squelch
SQLCHSquelchSets the squelch threshold by setting the squelch level.
Syntax
s q u e l c ht h r e s h o l d
Item Description/Default R=u3e
Number Any valid integer. 0 to 100.
Equivalent Softkey: S@XLCH .Option Required: Option 102, 103, or 301.Preset Value: 0.Related Commands: DEMOD, FMGAIN, SPEAKER.
ExampleOUTPUT 718;"SQLCH 100;"
DescriptionSQLCH mutes weak signals and passes strong signals.
Query Response
Programming Commands 5-501

SQRSquare RootPlaces the square root of the source into the destination.
Syntax
SQR
7 d e s t i n a t i o n
Y u s e r - d e f i n e d t r a c e /
Y trace r a n g e /
Y p r e d e f i n e d v a r i a b l e /
*user-defined v a r i a b l e
I t e m Description/Default
User-defined trace A trace defined by the TRDEF command.
User-defined variable A variable defined by VARDEF or ACTDEF commands.
Predeflned variablePredefined function
Trace range
Number
A command that acts as a variable. Refer to Table 5-l.Function that returns a value. Refer to ‘lbble 5-l.
A segment of trace A, trace B, trace C, or a user-defined trace.
Any real or integer number.
name.
!Real number range.
Prerequisite Commands: TRDEF when using a user-defined trace. ACTDEF or VARDEF for auser-defined variable. TS when using trace data.Related Commands: PDA, PDF, STDEV.
5-502 Programming Commands

SQR Square Root
Example
OUTPUT 718 ; "SQR SP, lE8 ; ‘I Changes the span to 10 kHz.
DescriptionIf the source is negative, the square root of the absolute value will be returned.
When the source is longer than the destination, the source is truncated to fit. When the sourceis shorter than the destination, the last element is repeated to fill the destination.
Programming Commands 5-503

SRCALCSource Leveling ControlSelects internal or external leveling for use with the built-in tracking generator.
Syntax
Option Required: Option 010 or 011.Preset State: SRCALC INT.Related Commands: CF, FA, FB, FS, HNLOCK, SI?
ExampleOUTPUT 718;"SRCALC XTAL;"
DescriptionFor the HP 8590L or HP 85913: Option 010 or 011 for the HP 859OL and HP 85913 provideinternal (INT), crystal (XTAL), and meter (MTR) leveling.
n SRCALC INT activates internal leveling.
n SRCALC XTAL activates external leveling. The external leveling input (EXT ALC INPUT) islocated on the rear panel of the spectrum analyzer. Positive- or negative-polarity detectorsare supported. External leveling increases the amplitude accuracy by improving the effectivesource match.
n SRCALC MTR narrows loop bandwidth so Hewlett-Packard power meters can be used forexternal leveling.
Fbr the HP 859OL and HP 8591E only: The functions of SRCALC and ALC KTR INT XT& areidentical.
For the HP 85933, HP 85943, HP 85953, or HP 85963: Option 010 for the HP 85933,HP 85943, HP 85953, or HP 85963 provide internal (INT) and external (EXT) leveling.
n SRCALC INT activates internal leveling.
n SRCALC EXT is for externai leveling. The external leveling input (EXT ALC INPUT) islocated on the rear panel of the spectrum analyzer. Only negative-polarity detectors aresupported. External leveling increases the amplitude accuracy by improving the effectivesource match.
5-504 Programming Commands

SRCALC Source Leveling Control
Fbr the HP 85933, HP 8594E, HP 8595E, and HP 85963 only: The functions of SRCALC andALC INT EXT are identical.
When used as a predefined variable, SRCALC returns a number from 0 to 2. The value that isreturned by SRCALC depends on the SRCALC parameter, as shown in the following table.
Query Response
QSRCALC
Programming Commands 5-505

SRCATSource AttenuatorAttenuates the source output level.
Syntax
/- a t t e n u a t i o n
XSRCAT
Item Description/Default Range
Number (HP 85913 only) Any real or integer number, specified in multiples of 10 dB. 0 to 60 dB.
Number (HP 8593E, Any real or integer number, specified in multiples of 8 dB. 0 to 56 dB.HP 85943, HP 8595E, orHP 8596E only)
Equivalent Softkey: SBC ATM MAM AUTO .Option Required: Option 010 or 011 installed in an HP 85913. Option 010 installed in anHP 85933, HP 85943, HP 85953, or HP 85963.Coupling: Coupled to power level of the source output (SRCPWR) when set to auto (SRCATAUTO).Related Commands: SRCPSTPPreset State: SRCAT AUTO.
ExampleThe following example uses the SRCAT command to attenuate the source output. This valuespecified for SRCAT (20 dB) applies to an HP 85913 only.
OUTPUT 7la;"SRCAT AUTO;" Activates source-attenuation coupling.OUTPUT 7lapS~~PwR -2ODB;" Activates source output.OUTPUT 71a;"SRCAT 20DB;" Sets attenuator to 20 dB This decouples the attenuator
from the source power-level setting.
5.505 Programming Commands

SRCAT Source Attenuator
DescriptionThe SRCAT command attenuates the output level of the source. Use SRCAT to attenuate thepower level of the source manually, from 0 to 60 dB in 10 dB steps for an HP 85913, from 0 to56 dB in 8 dB steps for an HP 85933, HP 85943, HP 85953, or HP 85963.
“SRCAT AUTO;” automatically adjusts the attenuator to yield the source amplitude levelspecified by the SRCPWR command.
Query Response
Programming Commands 5-507

SRCNORMSource NormalizationSubtracts trace B from trace A, adds the display line value to the difference, and sends theresult to trace A during every sweep of the spectrum analyzer.
Syntax
OFF /
ON
XSRCNORM
Equivalent Softkey: IK%MLIZE 04 OFF .Preset State: SRCNORM OFF.Related Commands: AMB, CONTS, CLRW, DL, MXMH, SNGLS, TS, VAVG, VIEW.
Example10 OUTPUT 718;"IP;SNGLS;RL 20DB;"
20 OUTPUT 718;"MOV TRA,5000;"
30 OUTPUT 718;"VIEW TRA;"40 OUTPUT 718;"MOV TRB,4000;"
50 OUTPUT 718;"VIEW TRB;"60 OUTPUT 718;"DL ODM;"
70 OUTPUT 718;"SRCNORM ON;"
80 OUTPUT 718;"BLANK TRB;VIEW TRA;"90 END
Initial&s spectrum analog activates single-sweep mode.Sets trace A to 5000 measurement units, whichis equal to -10 dBm.
Sets trace B to 4000 measurement units, whichis equal to -20 dBm.
Sets display line to 0 dBm, which is at 6000measurement units.Performs trace A - trace B + display line. Theresult is 5000 - 4000 + 6000 = 7000 or 10 dBm.Note that this has resulted in a subtraction ofamplitude in dBm, -10 dBm -(-20 dBm) = 10dBm.
5-508 Programming Commands
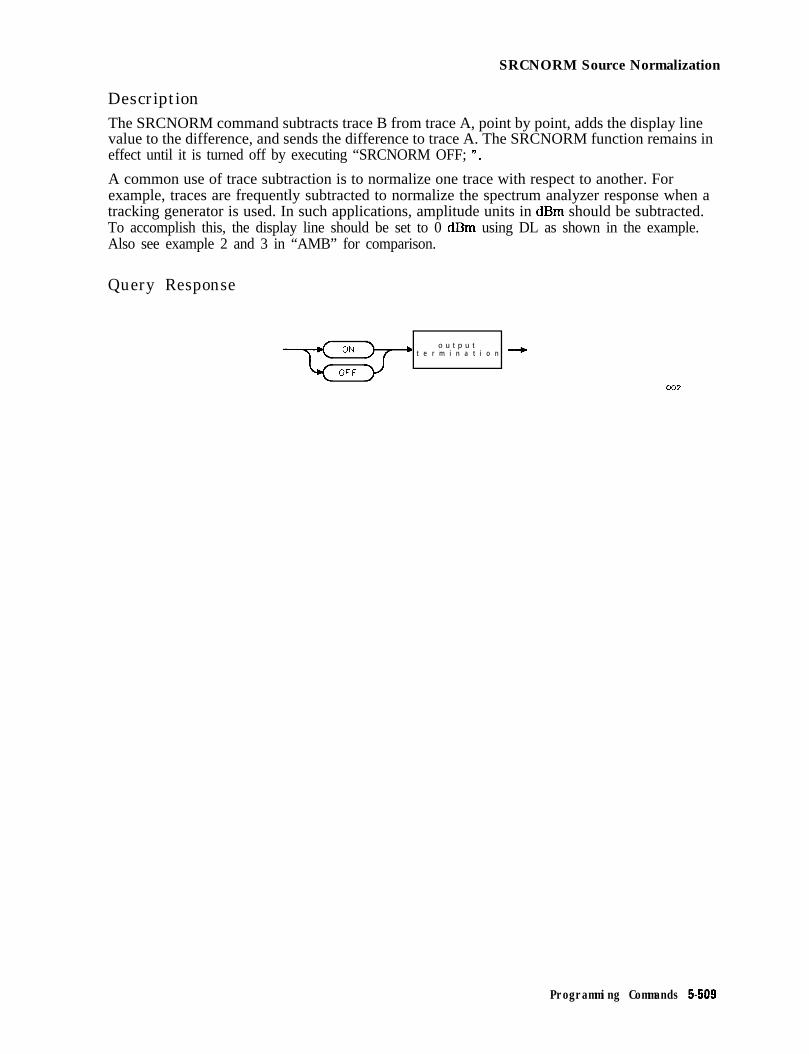
SRCNORM Source Normalization
DescriptionThe SRCNORM command subtracts trace B from trace A, point by point, adds the display linevalue to the difference, and sends the difference to trace A. The SRCNORM function remains ineffect until it is turned off by executing “SRCNORM OFF; ,,.
A common use of trace subtraction is to normalize one trace with respect to another. Forexample, traces are frequently subtracted to normalize the spectrum analyzer response when atracking generator is used. In such applications, amplitude units in dBm should be subtracted.To accomplish this, the display line should be set to 0 dBm using DL as shown in the example.Also see example 2 and 3 in “AMB” for comparison.
Query Response
ON o u t p u t’ t e r m i n a t i o n +
OFF
002
Programming Commands 5-509

SRCPOFSSource Power OffsetOffsets the source power level readout.
Syntax
XSRCPOFS
Item Description/Default Range
Number Any real or integer number.
Option Required: Option 010 or 011.Equivalent Softkey: $QlC PWR OFFSET .Related Commands: SRCPWR, SRCPSWPStep Increment: Determined by SRCPSTPPreset State: 0 dB.
ExampleUse SRCPOFS to offset the power-level readout for the tracking-generator source.
OUTPUT 718;"MEASURE SR;" Sets spectrum analyzer to stimulus-response mode.OUTPUT 718;"SRCPWR -1ODB;" Turns on source output.OUTPUT 718;"SRCPOFS 13DB;" Oflets power-level readout for source by 13 dR
DescriptionThe SRCPOFS command offsets the displayed power of the built-in tracking generator. Thisfunction may be used to take into account system losses (for example, cable loss) or gains (forexample, preamplifier gain) reflecting the actual power delivered to the device under test.
Query Response
QQ,
5.510 Programming Commands

SRCPSTP Source Power-Level Step Size
SRCPSTPSource Power-Level Step SizeSelects the source-power step size.
Syntax
I- s t e p s i z e
XSRCPSTP
Item Description/Default Range
Number Any real or integer number.
Option Required: Option 010 or 011.Equivalent Softkey: SRC PWR STP SIZE.Step Increment: 0.1 dB.Related Commands: SRCPWR, SRCPOFS, SRCPSWPPreset State: SRCPSTP AUTO (one major vertical ‘scale division).
ExampleSelect incremental changes of power effected by “SRCPWR UP;“, “SRCPWR DN;” commands, orthe step keys.
OUTPUT 718;"MEASURE SR;" Activates stimulus-response mode.OUTPUT 718;"SRCPWR -1ODB;" Turns on the source output.OUTPUT 718;"SRCPSTP .3DB;" Sets power-level step size to 0.3 dBOUTPUT 718;"SRCPWR UP;" Increases the power level.
DescriptionThe SRCPSTP command selects the step size for the following source commands:
n Power offset (SRCPOFS).n Power sweep (SRCPSWP).n Power (SRCPWR).
Use SRCPSTP to set the step size to a specific value.
“SRCPSTP AUTO;” sets the step size to one vertical scale division.
Programming Commands 5-511

SRCPSTP Source Power-Level Step Size
Query Response
5-512 Programming Commands

SRCPSWP Source Power Sweep
SRCPSWPSource Power SweepSelects the sweep range of the source output,
Syntax
( SRCPSWP >/- sweep --\
DB
I
I
I
I
I
. . . . . . . . . . . . .._._............. .’
JXSRCPSWP
Item Description/Default R-w
Number Any real or integer number.
Option Required: Option 010 or 011.’Equivalent Softkey: PWR SWP ON OFF .
Step Increment: Determined by SRCPSTP.Related Commands: SRCPSWP, SRCPOFS, SRCPSTPPreset State: SRCPSWP OFF.
ExampleUse SRCPSWP to sweep the power level of the source output.
OUTPUT 718;"MEASURE SR;" Activates stimulus-response mode.OUTPUT 718;"SRCPWR -1ODB;" Sets power level of source output to -10 dBm.OUTPUT 718;"SP 0;" Sets span to 0 Hz.OUTPUT 718;"SRCPSWP IODB;" Sweeps source output from -10 dBm to 0 dBm.
DescriptionThe SRCPSWP command works in conjunction with the SRCPWR (source power) command tosweep the amplitude level of the source output. The SRCPWR setting determines the amplitudelevel at the beginning of the sweep. The SRCPSWP command determines the change inamplitude level of the sweep.
For example, if SRCPWR and SRCPSWP are set to -15 dBm and 4 dB respectively, the sourcesweeps from - 15 dBm to - 11 dBm.
Programming Commands 5-513
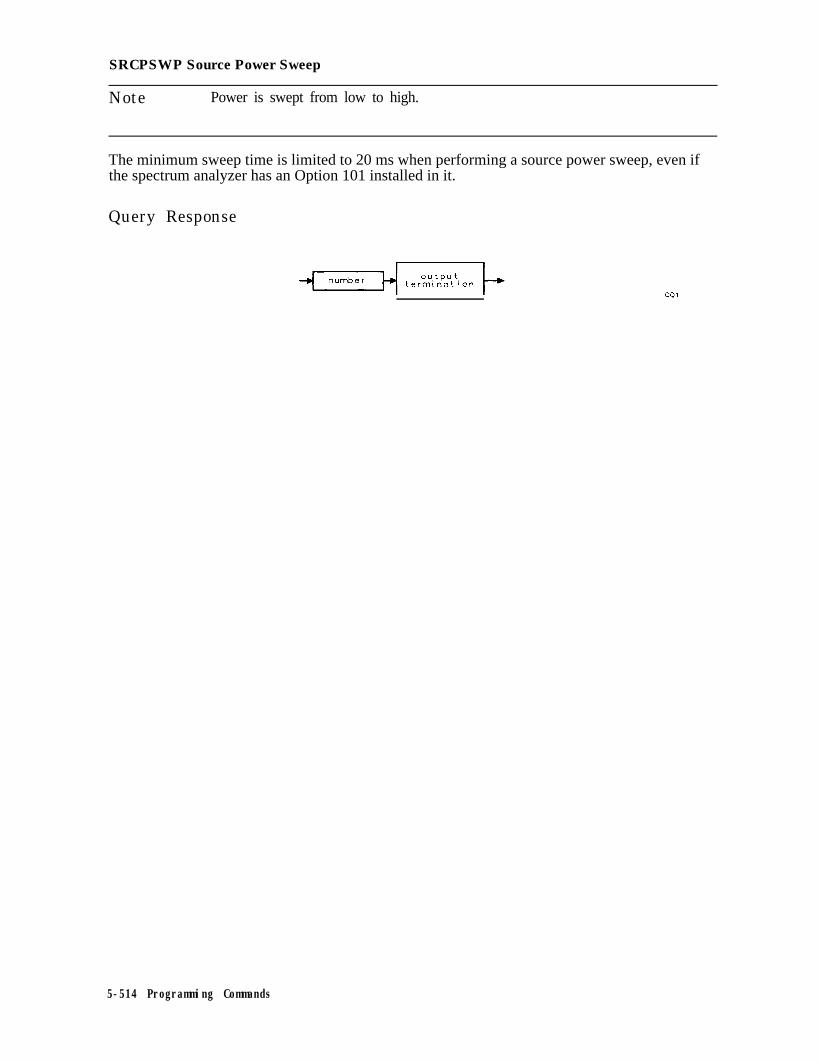
SRCPSWP Source Power Sweep
Note Power is swept from low to high.
The minimum sweep time is limited to 20 ms when performing a source power sweep, even ifthe spectrum analyzer has an Option 101 installed in it.
Query Response
5-514 Programming Commands

SRCPWR Source Power
SRCPWRSource PowerSelects the source power level.
Syntax
/- Power\
XSRCPWR
Item Description/Default Range
Number Any real or integer number. Default unit is the current Actual range isamplitude unit. hardware dependent.
Option Required: Option 010 or 011.Equivalent Softkey: SRC PWR ON OFF .Step Increment: Set by SRCPSTI?Related Commands: SRCAT, SRCPSTP, SRCPSWP.Preset State: -10 dBm.
ExampleUse SRCPWR to turn on the source and adjust its power level.
OUTPUT 718;"SRCPWR -2ODB;" Changes power level to -20 dBm.OUTPUT 718;"AUNITS DBMV;" Changes the current amplitude unit.OUTPUT 718;"SRCPWR 37;" The source power is rww 37 dBmK
DescriptionThe SRCPWR command turns the source off or on and sets the power level of the source.The source is turned on automatically whenever its value is specified with SRCPWR. Also see“ SRCPSTP. ”
Programming Commands 5-515

SRCPWR Source Power
Query Response
5-516 Programming Commands

SRCTK Source Tracking
SRCTKSource TrackingAdjusts the tracking of the source output with the spectrum analyzer sweep.
Syntax
SRCTK
I t e m Description/Default tinge
Number Any real or integer number. 0 to 16,383.
Option Required: Option 010 or 011.Equivalent Softkey: Ml? TM ADJUST .Step Increment: 1.Related Commands: Commands that change bandwidth, such as RB, VB, ST, and commandsthat change frequency, such as SP, CF, FA, FB, SP, FS, SRCTKPK.
Example
OUTPUT 718;"MEASURE SR;" Activates the stimulus-response moo%?.OUTPUT 718;"SRCPWR -2ODB;" Turns on the power at the source output.OUTPUT 718;"SP IMHZ;" Sets measurement range.OUTPUT 718;"RB IKHZ;"OUTPUT 718;"TS;" Zzkes sweep.OUTPUT 718;"SRCTK EP;" Allows entry offrom front-panel keys to adjust tracking.
DescriptionThe SRCTK command adjusts the tracking of the tracking-generator output relative to thecenter frequency of the spectrum-analyzer. SRCTK is used typically for bandwidths less than300 kHz. Bandwidths greater than 300 kHz do not require tracking adjustment. Use SRCTK toimprove amplitude accuracy and maximize signal response. Use SRCTKPK to adjust trackingautomatically. See “SRCTKPK. n
Programming Commands 5-517

SRCTK Source Tracking
Query Response
PO1
5-518 Programming Commands

SRCTKPK Source Tracking Peak
SRCTKPKSource Tracking PeakAutomatically adjusts the tracking of source output with spectrum-analyzer sweep.
Syntax
Option Required: Option 010 or 011.Equivalent Softkey: TRM!KING PEAK .Related Commands: Commands that change bandwidth, such as RB, VB, ST, and commandsthat change frequency, such as SP, CF, FA, FB, SP, FS, SRCTK.Restrictions: Not available with Analog+ display mode. See “ANLGPLUS” for moreinformation.
ExampleOUTPUT 718;"MEASURE SR;" Activates the stimulus-response mode.OUTPUT 718;"SRCPWR -1ODB;" Turns on the power at the source output to its current
setting.OUTPUT 718;"SP IMHZ;" Sets mhxsurement range.OUTPUT 718;"RB 1KHZ;"OUTPUT 718;"TS;" lbkes sweep.OUTPUT 718;"SRCTKPK;" Automatically [email protected] the tracking.’
DescriptionThe SRCTKPK command adjusts the tracking of the tracking-generator source outputautomatically to maximize responses for measurements made with resolution bandwidths lessthan 300 kHz.
SRCTKPK maximizes the amplitude of the displayed active trace.
Programming Commands 5-519

SRQForce Service RequestThe SRQ command is used by an external controller to simulate interrupts from the spectrumanalyzer.
Syntax
service
SRQXSRQ
Item Description/Default mt3e
Number Any valid integer. 2 to 126.
Related Commands: CLS, EE, RQS, STB.
Example
OUTPUT 718;"RQS 8;SRQ 8;" Sets bit mask for a hardware broken semrice request, genm-ates a hardware broken interrupt.
Note A program can respond to the interrupt in the same way it would under a trueservice request condition.
DescriptionThe service request condition is also displayed on the spectrum analyzer screen with theannotation SRQ XXX, where XXX is a three-digit octal number.
The conditions that can generate a service request are as follows:
32 = Illegal command16 = Command complete8 = Hardware broken4 = End of sweep2 = Units key pressed
A service request is generated only if the proper request mask bit has been set (see “R&S”),and either the condition itself or the Force Service Request is sent. To set the request mask,choose the desired interrupt conditions and sum their assigned values. Executing the RQScommand with this value sets the bit mask. After setting the bit mask, only the chosenconditions can produce an interrupt.
Each bit in the status byte is defined as shown in the following table.
5-520 Programming Commands

SRQ Force Service Request
‘Ihble 5-9. Spectrum Analyzer Status Byte
BitNumber
DecimalEquivalent
32
16
8
4
2
Spectrum AnalyzerState
Set when an illegalcommand is present.
Set when any command iscompleted.
Indicates hardware brokencondition.
Indicates end of sweep.
Indicates a units key waspressed.
Description
SRQ 140 appears on the spectrumanalyzer screen.
It is triggered by EOI at the end of acommand string or the completion of aprint or plot.
SRQ 110 appears on the spectrumanalyzer screen.
SRQ 104 appears on the spectrumanalyzer screen. If you send any R&Svalue that contains mask value 4,another sweep will be taken.
SRQ 102 appears on the spectrumanalyzer screen. If you activate theunits key bit, it will remain active untilyou activate “EE” and press a units key.(See “EE.“)
Bit numbers 0 (LSB), 6, and 7 are not used.
The spectrum analyzer screen numbers 102, 104, and 110 are the octal values correspondingto the status register values; that is, SRQ 102 = bit 6 = octal 100 and bit 2 = octal 2 are bothtrue.
Generally, you must set the bit mask using the RQS command. However, the “hardwarebroken” and “illegal remote command” conditions are automatically enabled after presettingor sending the IP command. Pressing C-1 or sending the IP command, then, produces thesame interrupt bit mask as sending “RQS 40; n (decimal 40 is the sum of the assigned values ofthese two interrupt bits, 32 = bit 5 and 8 = bit 3).
For most conditions, the RQS mask bit stays set until the next instrument preset (IP), or RQScommand is executed. The only condition to which this does not apply is the Units Key Pressedbit. When this bit (bit 1) is set in the RQS mask, a Units Key Pressed interrupt occurs if EE(enable entry mode) is executed and a front-panel units key such as Hz, kHz, MHz, or GHz ispressed.
When a units key is pressed, the interrupt occurs and the Units Key Pressed bit in the RQSmask is reset. lb reenable the Units Key Pressed interrupt, you must send a new RQS mask.See “RQS” for detailed information.
As mentioned, you can simulate a service request condition. Choose the desired interruptconditions from the RQS command table (see “RQS”), and sum their assigned values. Use theRQS command with this value to set the bit mask. By setting the corresponding bits in theSRQ command and sending the SRQ command to the spectrum analyzer, the desired interruptoccurs. This allows the user to verify proper operation of software routines designed to handleinfrequent or unlikely interrupts.
Programming Commands 5-521

SRQ Force Service Request
Interface DifferencesAs implemented on the HP-IB interface, an spectrum analyzer service request asserts the SRQcontrol line on the HP-IB.
On the RS-232 interface, the spectrum analyzer does not have a way of signaling the interruptcondition to a controller. In this case, the controller must operate in a polled mode if it requiresinterrupt information (see “Polled Mode of Operation” below for a discussion of the polledmode).
Interrupt-Related Commands Common to All Interfaces:
n CLS Clear status byte, without read.n RQS Request mask.n SRQ Force service request.n STB Read then clear status byte.
The HP-IB interface supports interface commands to read the status byte.
On HP-IB in HP 9000 Series 200 or 300 BASIC, the statement SPOLL (Device-address) can beused to read the status byte.
Polled Mode of OperationThe polled mode of operation is probably most applicable to an RS-232 interface user. Becausethere is no interrupt signal to the RS-232 controller, the user must periodically ask the spectrumanalyzer, via the “STB?” command, for the contents of its status register. For example, theRS-232 controller could periodically check for the hardware-broken condition by executing the“STB?” command and reading the results.
Status Byte DefinitionThe status byte sent by the spectrum analyzer determines the nature of the service request.The meaning of each bit of the status byte is explained in Table B-l.
I
Bit Message0 (LSB) Unused
1 Unit Key Pressed2 End of sweep3 Hardware broken4 Command complete5 Illegal spectrum analyzer command6 Universal HP-IB service request HP-IB R&S bit7 Unused
‘Ihble 5-10. Status Byte Definition
Display Message
SRQ 102SRQ 104SRQ 110SRQ 120SRQ 140
The display message is an octal number based on the binary value of the status byte. Thisoctal number always begins with a u 1” since this is translated from bit 6, the universal servicerequest bit. The status byte for an illegal spectrum analyzer command (SRQ 140) is as follows:
bit number 7 6 5 4 3 2 1 0
status byte 0 1 1 0 0 0 0 0
5-522 Programming Commands
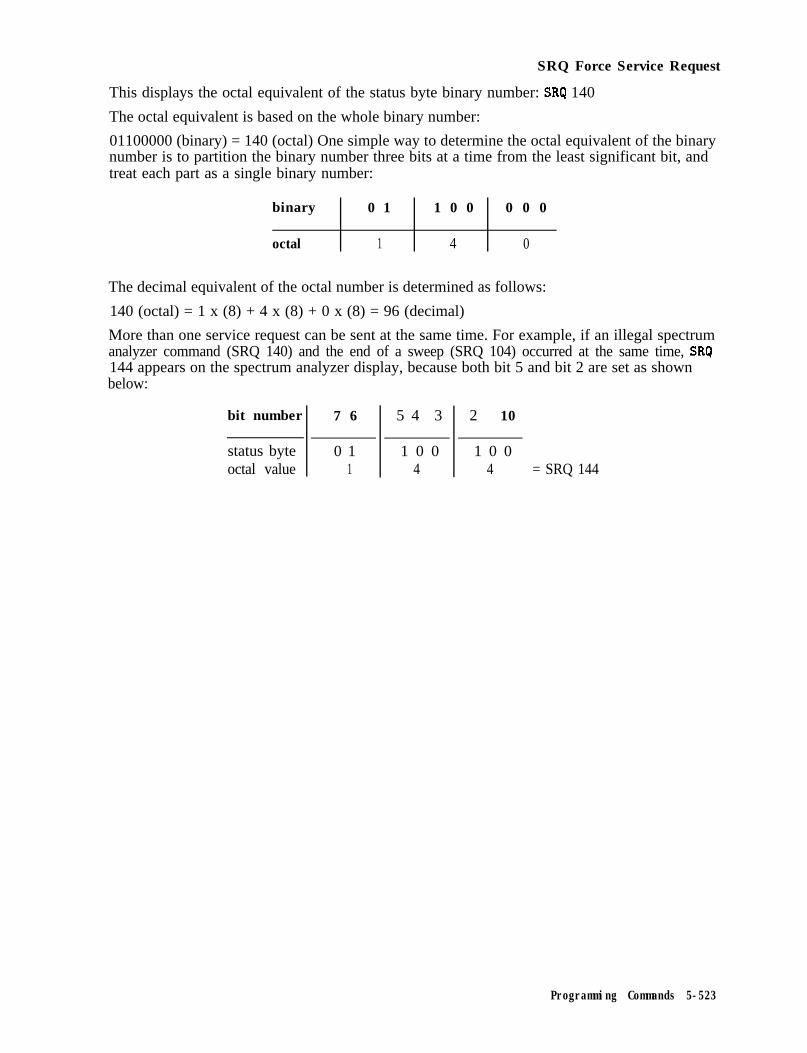
SRQ Force Service Request
This displays the octal equivalent of the status byte binary number: SRq 140
The octal equivalent is based on the whole binary number:
01100000 (binary) = 140 (octal) One simple way to determine the octal equivalent of the binarynumber is to partition the binary number three bits at a time from the least significant bit, andtreat each part as a single binary number:
binary 0 1 1 0 0 0 0 0
octal 1 4 0
The decimal equivalent of the octal number is determined as follows:
140 (octal) = 1 x (8) + 4 x (8) + 0 x (8) = 96 (decimal)
More than one service request can be sent at the same time. For example, if an illegal spectrumanalyzer command (SRQ 140) and the end of a sweep (SRQ 104) occurred at the same time, SF&l144 appears on the spectrum analyzer display, because both bit 5 and bit 2 are set as shownbelow:
bit number 7 6
status byte 0 1octal value 1
5 4 3
1 0 04
2 10
1 0 04 = SRQ 144
Programming Commands 5-523

ssCenter Frequency Step SizeSpecifies center frequency step size.
Syntax
UP
AUTO
Item Description/Default Range
Number Any real or integer number. Default unit is Hz. Frequency range ofthe spectrum analyzer.
Equivalent Softkey: CF SW AUTO NAN .Preset State: 100 MHz.Step Increment: 1, 2, 5, 10 sequence.Prerequisite Commands: ACTDEF or VARDEF when using a user-defined variable.Related Commands: AUTO, CF, FOFFSET, SP.
5-524 Programming Commands

SS Center Frequency Step Size
Example10 CLEAR 71820 OUTPUT 718;"IP;SNGLS;CF 300MHZ;SP 20MHZ;TS;"
30 OUTPUT 718;"MKPK HI;MKRL;TS;MKF?;"
40 ENTER 718 USING "K";Mk,freq
50 OUTPUT 718;"MKA?;"60 ENTER 718 USING "K";Mk-amp
70 OUTPUT 718;"SS ";Mk-freq;"HZ"
80 OUTPUT 718;"CF UP;TS;MKPK HI;MKA?;"
90 ENTER 718;Mk-amp1
100 PRINT "THE FUNDAMENTAL IS ";Mk-amp-Mk,amp1110 PRINT "dB ABOVE THE SECOND HARMONIC"120 END
Description
Clears the HP-BInitializes the spectrum an&y-activatessingle-sweep mode, changesthe center frequency, span, takessweep.Finds the highest peak, changesthe reference level to the markqtakes sweep, returns the frequencyof the marker:Puts the spectrum analyzer re-sponse in the computer variable,h!k-freq.Returns the amplitude of the markerPuts the spectrum analyzer re-sponse in the computer variable,h&.Changes the step size to the markerfreq-uIncreases the centerfrequency, takessweep, puts the marker on thehighest peak and returns the am-plitude of the markerPuts the spectrum analyzer re-sponse in the computer variable,Mk-ampl.Outputs the result.
The AUTO parameter removes SS as an active function but does not have an effect on its value.
Query Response
Programming Commands 5.525

STSweep TimeSpecifies the time in which the spectrum analyzer sweeps the displayed frequency range.
Syntax
Item Description/Default Rw&
Number Any real or integer number. Default unit is seconds. Within the sweep timerange of the spectrumanalyzer.
Equivalent Softkey: SWF TfME AUTO MAN .Sweep Time Range in Zero Span: 15 ms to 100s.Sweep Time Range in Zero Span, Option 101 only: 20 ,us to 100s.Sweep Time Range in Non-zero Span: 20 ms to 100 s.Step Increment: 2, 3, 5, 7.5, 10, 15 sequence.Prerequisite Commands: ACTDEF or VARDEF when using a user-defined variable.Related Commands: AUTO, CONTS, HNLOCK, HNUNLK, RB, SNGLS, SP, SRCPSWP, TS.
ExampleOUTPUT 718;"ST IOOMS;" Sets the sweep the to 100 milliseconds.
DescriptionWhen used as a predefined variable, ST returns the sweep time as a real number in seconds.
5-526 Programming Commands

ST Sweep Time
Query Response
Programming Commands 5-527

STBStatus Byte QueryReturns to the controller the decimal equivalent of the status byte.
Syntax
Pre$ef i nedf u n c t i o n p a t h o n l y
XSTB
Related Commands: RQS, SRQ,
Example
10 OUTPUT 718;"IP;"20 OUTPUT 718;"SNGLS;"30 OUTPUT 718*"CLS-" 9 ,40 OUTPUT 718*"TS*"# ,50 OUTPUT 718."STB'."60 ENTER 718;ktatui:Byte
70 PRINT Status-byte80 END
Description
Initializes spectrum anal2/zerActivates single-sweep mode.Clears the status bits.i’bkes sweep.Returns the status bits.Puts the spectrum analyzer response in the computer variable,Status-Byte.Displays the result.
The STB command is equivalent to a serial poll command. The RQS and associated bits arecleared in the same way that a serial poll command would clear them. The bits in the statusbyte are explained under the RQS command.
Query Response
5.528 Programming Commands

STDEV Standard Deviation of Trace Amplitudes
STDEVStandard Deviation of Trace AmplitudesReturns the standard deviation of the trace amplitude in measurement units.
Syntax
f u n c t i o n p a t h o n l y
9 u s e r - d e f i n e d t r a c e I
XSTDEV
Item Description/Default RanBe
User-defined trace A trace deEned by the TRDEF command. Any valid trace name.
Trace range A segment of trace A, trace B, trace C, or a user-defined trace.
Prerequisite Commands: TRDEF when using a user-defined trace. TS when using trace data.Related Commands: MEAN, PDA, PDF, VARIANCE.
ExampleThe following program segment finds the standard deviation of the amplitude of trace A.
OUTPUT 718; “IP; ”OUTPUT 718 ; “SNGLS ; ”OUTPUT 718;“CF 300MHZ;SP 2MHZ;RB IOOKHZ;”
OUTPUT 7 18 ; “TS ; ”OUTPUT 718;“STDEV TRA?;”
ENTER 718;Number
PRINT “THE STANDARD DEVIATION OF TRACE A ” ;Number/lOO; “DB”
Initializes spectrum analymActivates single-sweep mode.Changes the center fre-quencg, span, and reso-lution bandwidth.!Rxkes sweep.Finds the standard de-viation of trace A.Get the response fromthe spectrum analyzer:
Programming Commands 5-629
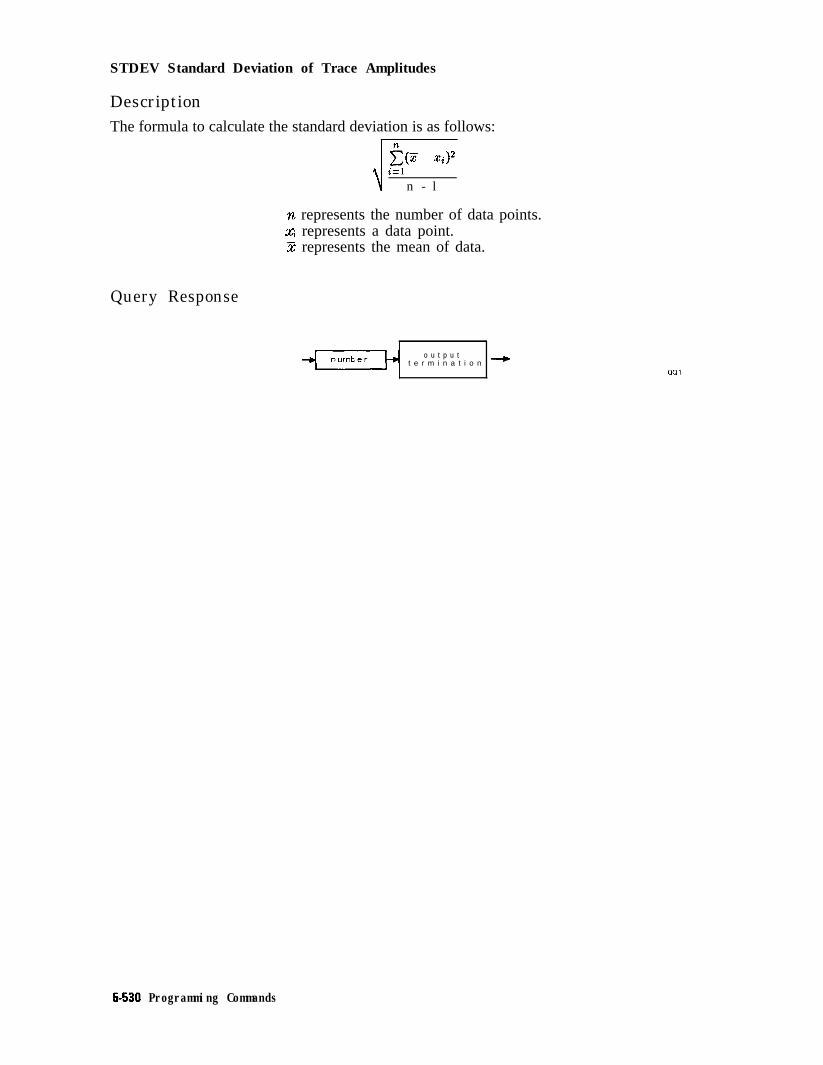
STDEV Standard Deviation of Trace Amplitudes
DescriptionThe formula to calculate the standard deviation is as follows:
J,gz - XiY
n - l
n represents the number of data points.4 represents a data point.5 represents the mean of data.
Query Response
o u t p u tt e r m i n a t i o n +
5-530 Programming Commands
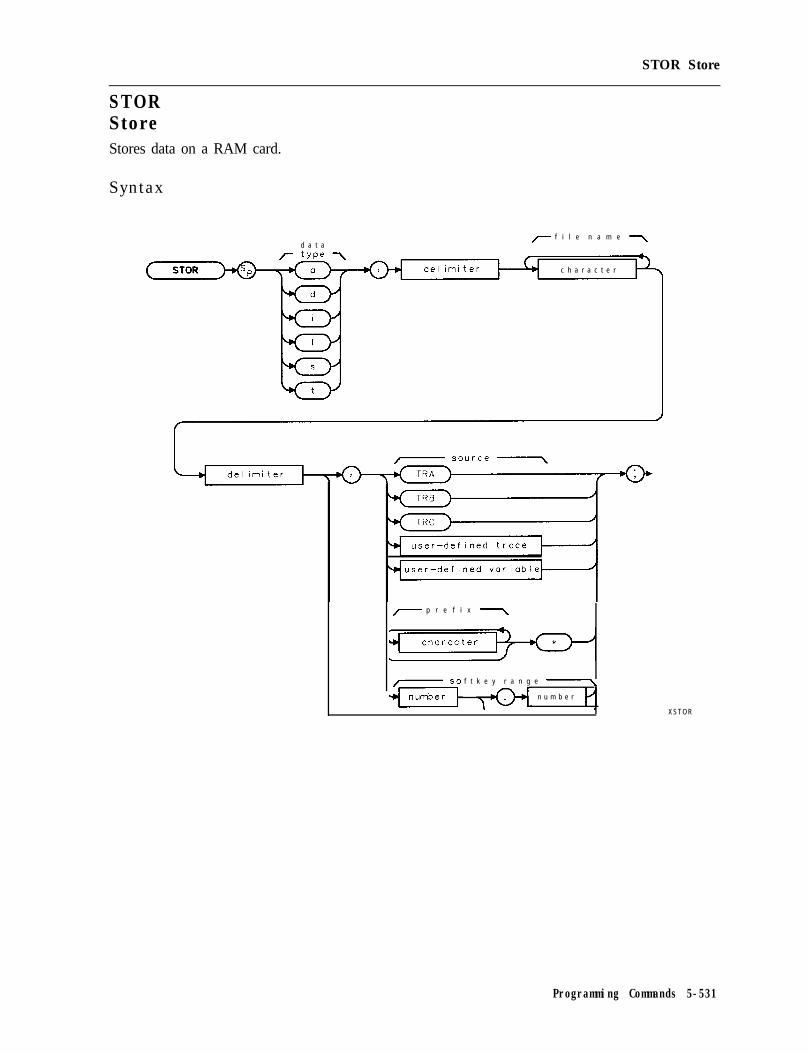
STOR Store
STORStoreStores data on a RAM card.
Syntax
d a t a
r type 7
/- f i l e n a m e 7
c h a r a c t e r
I- p r e f i x 7
f t k e y r a n g e ‘-\
n u m b e r
XSTOR
Programming Commands 5-531

STOR Store
Item
User-defined trace
User-defined variable
zharacter (file name)
Xaracter (prefix)
Vumber
Ielimiter
Description/Default RaneeA trace defined by the TRDEF command. Any valid trace name.A variable deflned by VARDEF or ACTDEF commands. Any valid variable
name.
Any valid character. Characters form the Ele type and file name. File type (lowercase a,c, d, i, 1, s, or t) shouldprecede the file name.File name is 0 to 6characters long, Athrough Z and theunderscore (theunderscore should beused as the secondcharacter of thelabel).
Any valid character.
A valid softkey number range. Use a decimal point to separate 1 to 6, 601 to 1200.the softkey numbers when specifying a softkey range.
Matching characters marking the beginning and end of the list of - 1 \ @ = / ^ $ % ; ! ’ :spectrum analyzer commands. ” &
Option Required: An HP 8590L or HP 8592L spectrum analyzer needs Option 003 installed init to use STOR.Related Commands: CAT, LOAD, PREFX.
Example
OUTPUT 718;"TRDEF N,EW,400;"OUTPUT 718;"MOV N-EW,TRA;"OUTPUT 718;"STOR t,%tF,UNCX%,N,EW;"
OUTPUT 718;"STOR d,%dP,ROG-I%,*;"
OUTPUT 718;"STOR a,%aA,MPDATA,7%;"
OUTPUT 718;"STOR l,%lL~IMITS,l%;"OUTPUT 718;"STOR s,%sS-TATEmIl;"OUTPUT 718;"STOR d,%dK,EYS,l5%,601.606;"
OUTPUT 718;"STOR d,%dK,EY-l%,GOl;"
OUTPUT 718;"STOR d,%dF-ILES,l%,KEN*;"
L%@tes a trace.Moves the contents of trace A into N-EM?Stores NJ3’Wunder thefile name of tFUNCXas trace data.Stores all downloadable programs in thespectrum analyzer memory on the RAMcard.Stores the current amplitude correctionfactors.Stores the current limit-line tables.Stores the spectrum analyzer state.Stores soflkey j3mction.s 601 through 606in thefile dKEYS-1.Stores sofikey function 601 in the jileoY!ZY-1.Stores all downloadable programs withthe pre@ “KEN” on the RAM card.
5432 Programming Commands

STOR Store
DescriptionThe STOR command stores the source data on the RAM card under the specified file name anddata type.
Data type: Use the data type as the first character of the file name in order to catalog the fileby the file type. For example, use tFUNCX instead of FUNCX to catalog it by traces. If thefile type is not specified as the first character of the file name, the file is stored as an ASCIIfile. It is necessary to use the correct data type (a, d, i, 1, s, or t) to load the file into spectrumanalyzer memory correctly. The letters correspond to the data type as shown in the followingtable.
Data Type Description
a Amplitude correction factor table.
d Downloadable program.
i Displays image.
1 Limit-line table.
S Instrument state.
t Trace and instrument state.
Note The STOR saves data on a RAM card. See “SAVET,” “SAVES,” or “SAVRCLN” tosave data in spectrum analyzer memory.
With the memory card reader, the spectrum analyzer can read from either aRAM (random-access memory) card or a ROM (read-only memory card). lbwrite to a memory card, the card must be a RAM card. The spectrum analyzercannot write to a ROM card.
Specifying the sourceWhen storing trace data, enter the location of the trace data (trace A, trace B, trace C, oruser-defined trace) as the source.
Downloadable programs can be stored as follows:
n For storing all downloadable programs in spectrum analyzer memory on a RAM card, use anasterisk as the source.
n For storing all downloadable programs with a certain prefix, use a prefix followed by anasterisk as the source.
H For storing a range of softkey functions, specify the softkey numbers separated with adecimal. Use the downloadable program file type when storing user-defined variables.
Space required: To store a file on a memory card, there must be enough space on the memorycard for the file. See “Determining the Amount of Space on a RAM Card” in Chapter 4 for moreinformation about space requirements.
Programming Commands 5-533

SUBSubtractSubtracts source 2 from source 1, point by point, and sends the difference to the destination.
Syntax
- d e s t i n a t i o n
/
b u s e r - d e f i n e d t r a c e /
b t r a c e range /
b p r e d e f i n e d v a r i a b l e /
u s e r - d e f i n e d v a r i a b l e
Item
User-dehned trace
User-de&red variable
Predellned variable
Predefined function
Trace range
Number
Description/Default BangeA trace defined by the TRDEF command. Any valid trace name.A variable defined by VARDEF or ACTDEF commands. Any valid variable
name.A command that acts as a variable. Refer to Table 5-l.
Function that returns a value. Refer to Table 5-1.
A segment of trace A, trace B, trace C, or a user-defined trace.
Any real or integer number. Real number range.
Prerequisite Commands: TRDEF when using a user-defined trace. ACTDEF or VARDEF for auser-defined variable. TS when using trace data.Related Commands: AMB, AMBPL, BML, LIMITEST, SUM.
5-534 Programming Commands

SUB Subtract
ExampleOUTPUT 718;"SUB TRA,TRB,TRC;" Subtracts trace Cfrom trace B and places the result in
trace A.
DescriptionWhen the source is longer than the destination, the source is truncated to fit. When the sourceis shorter than the destination, the last element is repeated to fill the destination.
Programming Commands 5-535

SUMSum of Trace AmplitudesReturns the sum of the amplitudes of the trace elements in measurement units.
Syntax
f u n c t i o n p a t h o n l y
k u s e r - d e f i n e d t r a c e /
b t r a c e r a n g e /
Item Description/Default tinge
User-defined trace A trace defined by the TRDEF command. Any valid trace name.
Trace range A segment of trace A, trace B, trace C, or a user-defined trace.
Prerequisite Commands: TRDEF when using a user-defined trace. TS when using trace data.Related Commands: ADD, DIV, MEAN, MPY, SUB, TS, VARIANCE.
Example
10 OUTPUT 718;"IP;"20 OUTPUT 718;"SNGLS;TS;"30 OUTPUT 718;"SUM TRA?;"40 ENTER 718;Tracegum
Initializes spectrum analyzer:Activates single-sweep mode, takes sweep.Gets the result.Puts the spectrum analyzer response in thecomputer variable, Trace-sum.
50 DISP Trace,sum;"MEASUREMENT UNITS" Displuystheresult.60 END
Query Response
5-536 Programming Commands

SUMSQR Sum of Squared Trace Amplitudes
SUMSQRSum of Squared Trace AmplitudesReturns the sum of the squares of the amplitude of each trace element in measurement units.
Syntax
f u n c t i o n p a t h o n l y
h u s e r - d e f i n e d t r a c e I
L t r a c e r a n g e J
Item
User-defined trace
Trace range
Description/Default
A trace defined by the TRDEF command.
A segment of trace A, trace B, trace C, or auser-defined trace.
Range
Any valid trace name.
Prerequisite Commands: TRDEF when using a user-defined trace. TS when using trace data.
Example
OUTPUT 718; “IP; ”OUTPUT 718; “SNGLS;TS; ”OUTPUT 718; “SUMSQR TRA?; ”ENTER 718;Trace,sqrsum
Initializes spectrum analyzixActivates single-sweep mode, takes sweep.Gets the result.Puts the spectrum analyzer response in thecomputer variably Trace-sqrsum.
DISP Trace,sqrsum; “MEASUREMENT UNITS” D&plays the result.
Query Response
Programming Commands 5-537

SWPCPLSweep CoupleSelects either a stimulus-response (SR) or spectrum-analyzer (SA) auto-coupled sweep time.
Syntax
Equivalent Softkey: SWP GPLG SR SA .Option Required: Option 010 or 011.Preset State: SWPCPL SA.Related Commands: SRCPWR.
Example10 OUTPUT 718;"IP;SNGLS;"20 OUTPUT 718;"FA 300KHZ;FB IGHZ;"30 OUTPUT 718;"SRCPWR -1ODB;"40 OUTPUT 718;"SWPCPL SR;"50 OUTPUT 718;"SRCTKPK;DONE?;"60 ENTER 718;Done70 LOCAL 71880 END
DescriptionIn stimulus-response mode, auto-coupled sweep times are usually much faster forswept-response measurements. Stimulus-response auto-coupled sweep times are typically validin stimulus-response measurements when the system’s frequency span is less than 20 times thebandwidth of the device under test.
When used as a predefined variable, SWPCPL returns either a “0” or a “1,” depending on thesetting of the SWPCPL parameters. Refer to the following table.
1 Parametees e t t i n g w_ rsfmrned]
5-538 Programming Commands


SYNCMODESynchronize ModeSelects the horizontal and vertical synchronizing constants, (the synchronization) rate forboth the internal monitor of the spectrum analyzer and the video signal that is output to theMONITOR OUTPUT connector.
Syntax
XSYNCMODE
Equivalent Softkey: SYK! EflZM NTSC , DEFAULT SYNC , SYNC EfEtpr PAL.Related Commands: CRTHPOS, CRTVPOS, IP.
Example
OUTPUT 718;"SYNCMODE NTSC15;" Selects the NTSC format for the spectrum analyzermonitor and monitor output.
OUTPUT 718;"IP;" An instrument preset activates the new synchronizingconstants.
DescriptionWhenever you use SYNCMODE to change the synchronizing constants, you must press (PRESET]or execute IP to activate the new synchronizing constants. Changing the vertical scanning ratemay change the location of the time and date display on the spectrum analyzer display.
The SYNCMODE parameters NORMAL and LOAD15 allow you to change the horizontal andvertical synchronizing constants for both the spectrum analyzer’s internal monitor and thevideo signal to the MONITOR OUTPUT connector.
The SYNCMODE parameters NTSC15 and PAL15 allow you to change the vertical scanning ratefor both the spectrum analyzer’s internal monitor and the video signal that is output to theMONITOR OUTPUT connector. The regular vertical scanning rate for the spectrum analyzer’smonitor is 57 Hz; the NTSC15 changes the vertical scanning rate to 60 Hz, and the PAL15changes the vertical scanning rate to 50 Hz. If you want to record the spectrum analyzerdisplay on a video cassette recorder (VCR) that uses the NTSC format, you must use theNTSC15 parameter to change the vertical scanning rate of the spectrum analyzer monitor to 60Hz. If you want to record the spectrum analyzer display on a VCR that uses the PAL format,you must use the PAL15 parameter to change the vertical scanning rate of the spectrumanalyzer monitor to 50 Hz.
5-540 Programming Commands

SYNCMODE Synchronize Mode
The following parameters for SYNCMODE are described:
NORMAL
NTSC15
Restores the previous values for the horizontal and vertical synchronizingconstants of the spectrum analyzer display if SYNCMODE NTSC15 orSYNCMODE PAL15 was previously executed. The previous values for thehorizontal and vertical position are the positions that were set by CRTHPOSand CRTVPOS. SYNCMODE NORMAL is equivalent to SYNC MRM NTSC (withNRM underlined).
Selects the NTSC format for a spectrum analyzer that has an internal monitorwith a horizontal scanning rate of 15.75 kHz (the monitors for the HP 859OL,HP 85913, HP 8592L, HP 85933, HP 85943, HP 85953, and HP 85963 all havehorizontal scanning rates of 15.75 kHz). SYNCMODE NTSC15 is equivalent toSYK! NRM NTSC (with NTSC underlined).
PAL15
LOAD15
Selects the PAL format for a spectrum analyzer that has an internal monitorwith a horizontal scanning rate of 15.75 kHz (the monitors for the HP 859OL,HP 85913, HP 8592L, HP 85933, HP 85943, HP 85953, and HP 85963 all havehorizontal scanning rates of 15.75 kHz). SYNCMODE PAL15 is equivalent toSYI?C NRM PAL (with PAL underlined).
Loads the default constants horizontal and vertical position for the displayof a spectrum analyzer with an internal monitor with 15.75 kHz horizontalscanning (the HP 859OL, HP 85913, HP 8592L, HP 85933, HP 85943,HP 85953, and HP 85963 all have horizontal scanning rates of 15.75 kHz).The default constants are the constants that are stored into the spectrumanalyzer’s read-only memory (ROM). SYNCMODE LOAD15 is equivalent toRRFAUI,T SYNC .
When used as a predefined variable, SYNCMODE returns a number from 0 to 5. The value thatis returned by SYNCMODE depends on the SYNCMODE parameter, as shown in the followingtable.
Programming Commands 5-541

TATransfer AReturns trace A amplitude values from the spectrum analyzer to the controller.
Syntax
( TA
Related Commands: MDS, TB, TDF.
ExampleThis example stores the TA results in array A.
DIM A(4011OUTPUT 718;"IP;"OUTPUT 718;"SNGLS;CF 300MHZ;SP 2MHZ;TS;"
OUTPUT 718;"TDF P;TA;"
FOR N = 1 TO 401
ENTER 718;A(N)NEXT NFOR N = 1 TO 401
PRINT A(N)NEXT N
Description
I&SW memory area for array.Initializes analyzerActivates single-sweep mo& changes cen-ter frequency and span, takes sweep.Changes trace dutu format, outputs traceA.FOR NhXT loop moves each element oftrace A to the computer:
FOR NEXT loop moves the trace valuesfrom the computer to the printerPrints out the results.
The display unit values are transferred in sequential order (from left to right) as seen on thescreen.
Transfer of trace amplitude data should be done only as follows:
1. Select single sweep mode (SNGLS).2. Select desired spectrum analyzer settings.3. lake one complete sweep (TS).4. Transfer data (TA).
This procedure ensures that the current settings of the spectrum analyzer are reflected in thetransferred data.
See Chapter 3, “Different Formats for Trace Data Transfers,” for more information abouttransferring trace data. Items are separated by a comma when in TDF P format.
5.542 Programming Commands

TB Transfer B
TBTransfer BTransfers trace B amplitude values from the spectrum analyzer to the controller.
Syntax
Related Commands: MDS, TA, TDF.
ExampleDIM A(4011OUTPUT 718;"IP;"OUTPUT 718;"SNGLS;CF 300MHZ;SP 2MHZ;TS;"
OUTPUT 718;"TDF P;TB;"
&serves memory area for array.Initializes analyz4xActivates single-sweep mode, changes cen-ter frequency and span, takes sweep.Changes trace data format, outputs traceB
FOR N = 1 TO 401
ENTER 718;A(N)NEXT NFOR N = 1 TO 401
PRINT A(N)NEXT N
FOR NEXT loop m.oves each element oftrace A to the computer:
FOR NEXT loop moves the trace valuesfrom the computer to the printer:Prints out the results.
DescriptionThe operation of TB is similar to the operation of TA.
See Chapter 3, “Different Formats for Trace Data Transfers, n for more information abouttransferring trace data.
Programming Commands 5-543

TDFTrace Data FormatFormats trace information for return to the controller.
Syntax
Related Commands: MDS, MKA, TA, TB, TRA.
Example
DIM A(4011OUTPUT 718;"IP;"OUTPUT 718;"BLANK TRA;CLRW TRB;"OUTPUT 718;"SNGLS;CF 300MHZ;SP 2MHZ;TS;"
OUTPUT 718*"TDF P-TB-"1 lo 401
, #FOR N =
ENTER 718;A(N)NEXT N
FOR N = 1 TO 401PRINT A(N)
NEXT N
DescriptionThe different trace data formats are as follows:
TDF P
XTDF
Holds trace data.Initializes armlymViews trace I3Activates single-sweep mode, changes cen-terfrequency and span.Rwm4zts trace data.Transfer trace data to array A, oneelement at a time.
Loop prints out trace B data.Prints out the results.
Description: TDF P is the real number format. An example of a trace element returned withthe real number format is 10.00 dB. When querying the trace or marker value, the value isreturned using the amplitude unit set by AUNITS (for example, watts or dBm).
Restrictions: The spectrum analyzer must be in log scale to use TDF l? To send the trace databack to the spectrum analyzer, the data must be converted to measurement units.
How data is returned: The following table describes what is transferred when the trace dataformat is set to P, but the AUNITS are changed. In every case, the trace data transfer is endedby a carriage return, and a line feed with an EOI.
5-544 Programming Commands

Trace Data Transfers with TDF P
AUNITSSetting
Watts
dBmV
dBpV
Volts
Example Description
TDF P;AIJNITS W;‘L4;
TDF P;AUNITS DBM;TA;
TDF P;AUNITS DBMV;TA;
TDF P;AUNITS DBUV;TA;
TDF P;AUNITS v;TA;
Transfers 401 real values, in watts, with each value separated by acarriage return and a line feed.
Transfers 401 real values, in dBm, with each value separated by acarriage return and a line feed.
Transfers 401 real values, in dBmV, with each value separated by acarriage return and a line feed.
Transfers 401 real values, in dBpV, with each value separated by acarriage return and a line feed.
Transfers 401 real values, in volts, with each value separated by acarriage return and a line feed.
Example of how data is returned: For example, if the reference level of the spectrumanalyzer is set to -10 dBm, the amplitude scale is set to 10 dB per division, and trace Acontains the following data:
TRA[l] contains 8000 (in measurement units). The value 8000 indicates trace element 1 is atthe reference level.TRA[B] = 7000 measurement units (trace element 2 is -10 dB below the reference level).TRA[3] through TRA[401] each contain 6000 (in measurement units). The value 6000indicates that the trace elements 3 through 401 are all at -20 dB below the reference level.
Querying trace A with the TDF P format and AUNITS set to DBM returns ASCII character codesfor the following:
-lO.OO,-20.00,-30.00,(-30.00 is repeated 398 times),<CR><LF><EOI>
TDF ADescription: TDF A is the A-block data format. With the A-block data format, trace data ispreceded by “#, ” “A,” and a two-byte number (the two byte number indicates the numberof trace data bytes). The setting of the MDS command determines whether the trace data istransferred as one or two g-bit bytes.
Restrictions: To use the A-block format for sending data, you must provide the number ofdata bytes.
How data is returned: The following table describes what is transferred when the trace dataformat is set to A, but the MDS setting is changed.
MDSsetting
Binary
Trace Data Transfers with TDF A
Example Description
TDF A;MDS B;TA;
TDF A;MDS W;TA;
Transfers “#A,” the number of bytes of trace data, then the 401 bytesof trace data. Using MDS B “reduces” each trace value into one byteby dividing (DIV) the trace value by 32. The trace data transfer isended with an EOI.
Transfers “#A,” the number of bytes of trace data, then 802 bytes oftrace data. MDS W uses two bytes per trace element to transfer tracedata. The ilrst byte contains the trace value divided by (DIV) 256, thesecond byte contains the remainder (MOD) of that division. The tracedata transfer is ended with an EOI.
Programming Commands 5-545

TDF Trace Data Format
Example of how data is returned: For the same trace A data that is used in the TDF Pdescription, querying trace A with the TDF A format and MDS set to binary (MDS B) wouldreturn the ASCII character codes for the following:
#A(401 div 256)(401 mod 256)(8000 div 32)(7000 div 32)(6000 div 32)(the number for 6000 div32 is repeated 398 times)<EOI>
Notice that #A is followed by the two bytes that contain the number of trace elements.Because MDS is set to binary, the number of trace elements is 401.
If MDS is set to W, querying trace A with the TDF A format would return the ASCII charactercodes for the following:
#A(802 div 256)(802 mod 256)(8000 div 256)(8000 mod 256)(7000 div 32)(7000 mod 256)(6000div 256)(6000 mod 256)(the number for 6000 div 256, then the number for 6000 mod 256 isrepeated 398 times)
Notice that #A is followed by the two bytes that contain the number of trace elements.Because MDS is set to W (word), the number of trace elements is 802.
TDF IDescription: TDF I is the I-block data format. With the I-block data format, trace data mustbe preceded by “#,” and “I.” The setting of the MDS command determines whether the tracedata is transferred as one or two g-bit bytes. Unlike using the A-block format, you do notprovide the number of data bytes when sending trace data back to the spectrum analyzer.
Restrictions: This format is not recommended for use with an RS-232 interface.
How data is returned: The following table describes what is transferred when the trace dataformat is set to I, but the MDS setting is changed.
Trace Data Transfers with TDF I
MDS Examplesetting
Binary TDF I;MDS B;TA;
Word TDF I;MDS W;TA;
Description
Transfers “#I,” then the 401 bytes of trace data. Using MDS B“reduces” the trace value into 1 byte by dividing (DIV) the trace valueby 32. The trace data transfer is ended with an EOI.
Transfers “#A,” then 802 bytes of trace data. MDS W uses two bytesper trace element to transfer trace data. The ilrst byte contains thetrace value divided by (DIV) 256, the second byte contains theremainder (MOD) of that division. The trace data transfer is endedwith an EOI.
Example of how data is returned: For the same trace A data that is used in the TDF Pdescription, querying trace A with the TDF I format and MDS set to binary (MDS B) wouldreturn the ASCII character codes for the following:
#I(8000 div 32)(7000 div 32)(6000 div 32)(the number for 6000 div 32 is repeated 398 times)
If MDS is set to W, querying trace A with the TDF I format would return the ASCII charactercodes for the following:
#I(8000 div 256)(8000 mod 256)(7000 div 32)(7000 mod 256)(6000 div 256)(6000 mod 256)(thenumber for 6000 div 256, then the number for 6000 mod 256 is repeated 398 times)
5-546 Programming Commands

TDF Trace Data Format
Example of how data is returned: For the same trace A data that is used in the TDF Pdescription, querying trace A with the TDF A format and MDS set to binary (MDS B) wouldreturn the ASCII character codes for the following:
#A(401 div 256)(401 mod 256)(8000 div 32)(7000 div 32)(6000 div 32)(the number for 6000 div32 is repeated 398 times)<EOI>
Notice that #A is followed by the two bytes that contain the number of trace elements.Because MDS is set to binary, the number of trace elements is 401.
If MDS is set to W, querying trace A with the TDF A format would return the ASCII charactercodes for the following:
#A(802 div 256)(802 mod 256)(8000 div 256)(8000 mod 256)(7000 div 32)(7000 mod 256)(6000div 256)(6000 mod 256)(the number for 6000 div 256, then the number for 6000 mod 256 isrepeated 398 times)
Notice that #A is followed by the two bytes that contain the number of trace elements.Because MDS is set to W (word), the number of trace elements is 802.
TDFIDescription: TDF I is the I-block data format. With the I-block data format, trace data mustbe preceded by “#,” and “I.” The setting of the MDS command determines whether the tracedata is transferred as one or two 8-bit bytes. Unlike using the A-block format, you do notprovide the number of data bytes when sending trace data back to the spectrum analyzer.
Restrictions: This format is not recommended for use with an RS-232 interface.
How data is returned: The following table describes what is transferred when the trace dataformat is set to I, but the MDS setting is changed.
Trace Data Transfers with TDF I
BIDS Example DescriptionSeming
BiIUlI-y TDF 1;MDS B;TA; Transfers “#I,” then the 461 bytes of trace data. Using MDS B“reduces” the trace value into 1 byte by dividing (DIV) the trace valueby 32. The trace data transfer is ended with an EOI.
Word TDF 1;MDS W;TA; Transfers “#A,” then 802 bytes of trace data. MDS W uses two bytesper trace element to transfer trace data. The ilrst byte contains thetrace value divided by (DIV) 256, the second byte contains theremainder (MOD) of that division. The trace data transfer is endedwith an EOI.
Example of how data is returned: For the same trace A data that is used in the TDF Pdescription, querying trace A with the TDF I format and MDS set to binary (MDS B) wouldreturn the ASCII character codes for the following:
#I(8000 div 32)(7000 div 32)(6000 div 32)(the number for 6000 div 32 is repeated 398 times)
If MDS is set to W, querying trace A with the TDF I format would return the ASCII charactercodes for the following:
#I(8000 div 256)(8000 mod 256)(7000 div 32)(7000 mod 256)(6000 div 256)(6000 mod 256)(thenumber for 6000 div 256, then the number for 6000 mod 256 is repeated 398 times)
5-546 Programming Commands

TDF Trace Data Format
!IDFB
Description: TDF B enables the binary format. With the binary format, the marker or tracedata is transferred as bytes. Of all the trace data formats, TDF B transfers trace data thefastest. The setting of the MDS command determines whether the trace data is transferred asone or two 8-bit bytes.
Restrictions: The TDF B format cannot be used to send data back to the spectrum analyzer(you must use the A-block format to send data back to the spectrum analyzer).
How data is returned: The following table describes what is transferred when the trace dataformat is set to B, but the MDS setting is changed.
Trace Data Transfers with TDF B
MDS Example DescriptionSetting
Binary TDF B;MDS B;TA; Transfers the 401 bytes of trace data. Using MDS B “reduces” thetrace value into 1 byte by dividing (DIV) the trace value by 32. Thetrace data transfer ls ended with an EOI.
Word TDF B;MDS W;TA; Transfers the 802 bytes of trace data. MDS W uses two bytes per traceelement to transfer trace data. The ilrst byte contains the trace valuedivided by (DIV) 256, the second byte contains the remainder (MOD)of that division. The trace data transfer is ended with an EOI.
Example of how data is returned: For the same trace A data that is used in the TDF Pdescription, querying trace A with the TDF B format and MDS set to binary (MDS B) wouldreturn the ASCII character codes for the following:
(8000 div 32)(7000 div 32)(6000 div 32)(the number for 6000 div 32 is repeated 398 times)
If MDS is set to W, querying trace A with the TDF B format would return the ASCII charactercodes for following:
(8000 div 256)(8000 mod 256)(7000 div 32)(7000 mod 256)(6000 div 256)(6000 mod 256)(thenumber for 6000 div 256, then the number for 6000 mod 256 is repeated 398 times)
T D F M
Description: TDF M is the measurement data format. The measurement data format transferstrace data in measurement units, and the measurement data can range from -32768 to+ 32767.
Restrictions: TDF M cannot be used to send trace data back to the spectrum analyzer.
How trace data is returned: The following table describes what is transferred when the tracedata format is set to M.
Trace Data Transfers with TDF M
Example
TDF M;TA;
Description
Transfers 401 bytes, with each trace value ln measurement units. The trace data transfer isended with a carriage return, a line feed with an EOI.
Example of how data is returned: For the same trace A data that is used in the TDF Pdescription, querying trace A with the TDF M would return the ASCII character codes for thefollowing:
8000,7000,6000,(6000 repeated 398 times),<CR><LF>
Programming Commands 5-547

TDF Trace Data Format
Refer to Chapter 3, “Different Formats for Trace Data Transfers,” for more information abouttransferring trace data.
Query Response
QTDF
5-548 Programming Commands

TEXT Text
TEXTlkxtWrites text on the spectrum analyzer screen at the current pen position.
Syntax
t e x t t o b e/- d i s p l a y e d 7
d e l i m i t e r c h a r a c t e r de i m i t e r
XTEXT
Item Description/Default Range
Delimiter Matching characters marking the beginning and end of the list of - 1 \ @ = / ^ 8 % ; ! ’ :analyzer commands. ” &
Character Any valid character. See “LB” for additional characters available.
Related Commands: DSPLY, LB, PA, PD, PU, PR.
ExampleOUTPUT 718
OUTPUT 718
;"PU;PA 80,80;TEXT%CONNECT ANTENNA%;" Displays CONNECTANTENNAon the analyzer screen.
; “PU; PA 100,100;TEXT%50~~;CHR$(250);"%;" Displays 50n on the analyzerscreen.
DescriptionThe TEXT origin is at the lower-left corner of the first character. The pen is placed to theright of and behind the last character position after the text characters. Line feeds are notautomatically generated for lines that extend past the edge of the screen.
See “LB” for the additional characters available by specifying the ASCII character code. (Seesecond line of the example for an example of using the ASCII character code.)
The TEXT command also enters the text into the display list. See “DA” for more informationabout the display list.
Programming Commands 5-548

THThresholdClips signal responses below the threshold level.
Syntax
TH
XTH
Item Description/Default RwIe
Number Any real or integer number. Default unit is dBm. Range dependent onRL setting.
Equivalent Softkey: TRRESIILD ON OFF .Preset State: Clip off, positioned one division above bottom graticule line.Step Increment: One division.Related Commands: AUTO, DL, MEANTH, MKPK, PEAKS, RL.Restrictions: Not available with Analog+ display mode. See “ANLGPLUS” for moreinformation.
ExampleOUTPUT 718*"TH UP-"9 8 kncreases the threshold level.
DescriptionThe threshold level is eight graticule divisions below the top of the screen unless otherwisespecified. The threshold level is annotated in reference level units at the lower-left corner ofthe spectrum analyzer screen. AUTO deactivates clipping. The TH level is used for next peakmarker movements (see “MKPK”) and the PEAKS command even if the display clipping is off.
Query Response
5-550 Programming Commands

TIMEDATE Time Date
TIMEDATETime DateAllows you to set the time and date for the spectrum analyzer real-time clock in theYYMMDDHHMMSS format.
Syntax
t i m e and dote (YYMMDDHHMMSS
T IMEDATEf-/
XTIMEQATE
Item Description/Default Range
Number A number representing the date and time in the A valid date and time.YYMMDDHHMMSS (24 hour) format.
Related Commands: SETDATE, SETTIME, TIMEDSP.
Example
OUTPUT 718;"TIMEDATE 881231135501;" Sets the analyzer time and date to 1:55:01 PMon 31 December 1988.
Query Response
o u t p u tterminot i o n *
QTIMEDATE
Programming Commands 5-551

TIMEDSPTime DisplayEnables the display of the time and date on the spectrum analyzer screen.
Syntax
OFF /
ON
XT IMEDSP
Equivalent Softkey: TIHERATE 01 OFF .Related Commands: ANNOT, SETDATE, SETTIME, TIMEDATE.
ExampleOUTPUT 718;"TIMEDSP OFF;"
Query Response
t e r m i n a t i o n
5-552 Programming Commands

TITLE Title
TITLETitleActivates the screen title mode. The title is displayed above the top graticule and is leftjustified.
Syntax
t i t l e t o b er dlsplayed 7
T I T L E c h a r a c t e r del i m i t e r
XTITLE
Item Description/Default Range
Delimiter Matching characters marking the beginning and end of the list of - 1 \ @ = / ^ $ % ; ! ’ :analyzer commands. ” &
Character Any valid character. See “LB” for additional characters available. Up to 53 characters.
Equivalent Softkey: Change Title.Related Commands: IP, LB, SAVES, TEXT.
Example
OUTPUT ~I~;I~TITLE XADJUST ANTENNA%;" Displays ‘“‘ADJUST ANTENNA” on the ana-lyzer screen.
DescriptionThis function writes a message at the top of the spectrum analyzer
screen. The full width of the display is available for writing a maximum of 53 characters.However, the marker readout may interfere with the last 26 characters. IP removes themessage.
The SAVET command saves the screen title is along with the trace in the trace register.
Programming Commands 5-553
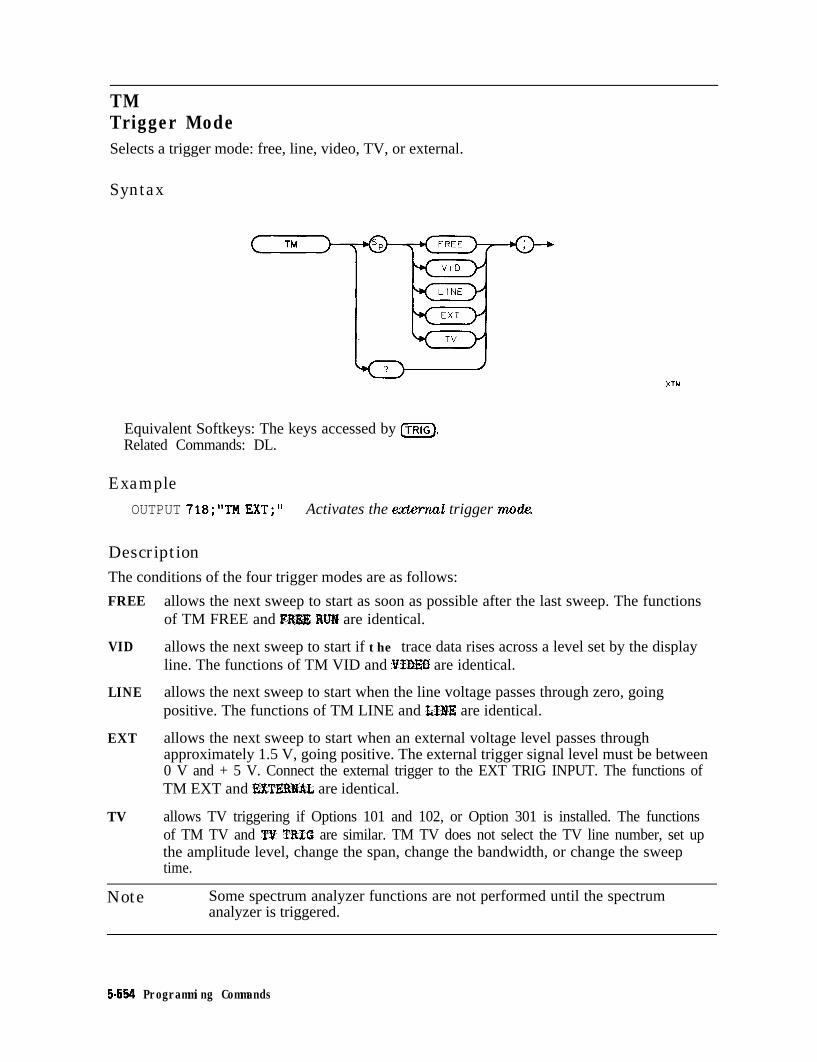
TMTrigger ModeSelects a trigger mode: free, line, video, TV, or external.
Syntax
XTM
Equivalent Softkeys: The keys accessed by L‘TRIG).Related Commands: DL.
ExampleOUTPUT 718;"TM EXT;" Activates the extol trigger mode.
DescriptionThe conditions of the four trigger modes are as follows:
FREE
VID
LINE
EXT
TV
allows the next sweep to start as soon as possible after the last sweep. The functionsof TM FREE and FIZZ RUN are identical.
allows the next sweep to start if the trace data rises across a level set by the displayline. The functions of TM VID and BIDED are identical.
allows the next sweep to start when the line voltage passes through zero, goingpositive. The functions of TM LINE and LIYE are identical.
allows the next sweep to start when an external voltage level passes throughapproximately 1.5 V, going positive. The external trigger signal level must be between0 V and + 5 V. Connect the external trigger to the EXT TRIG INPUT. The functions ofTM EXT and l%l’ERl?AL are identical.
allows TV triggering if Options 101 and 102, or Option 301 is installed. The functionsof TM TV and TV TftIG are similar. TM TV does not select the TV line number, set upthe amplitude level, change the span, change the bandwidth, or change the sweeptime.
Note Some spectrum analyzer functions are not performed until the spectrumanalyzer is triggered.
5-554 Programming Commands
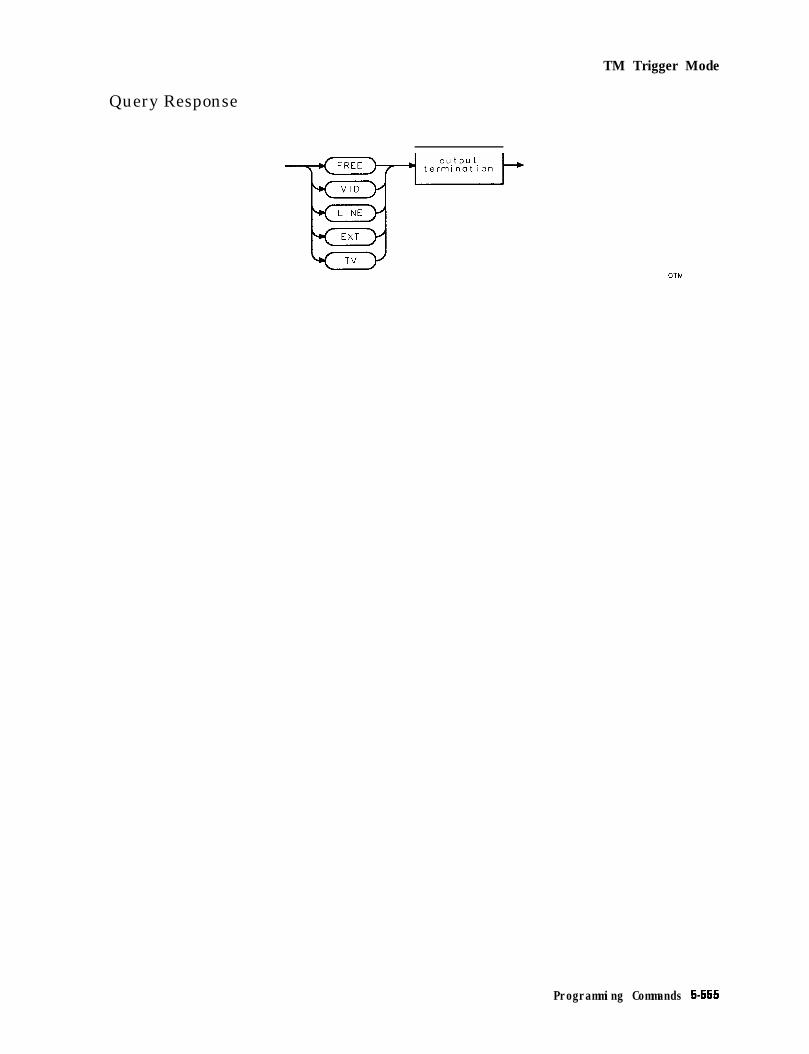
TM Trigger Mode
Query Response
QTM
Programming Commands 5-555

TO1Third-Order Intermodulation MeasurementTurns on or off the third-order inter-modulation (TOI) measurement.
Syntax
Equivalent Softkey: TO1 ClN OFF .Related Commands: AUNITS, MKPX, TH, TOIR.
ExampleOUTPUT 718*"MOV TO1 1.", , ,
OUTPUT 718*"TOIR'."f - ,
ENTER 718;Toi
PRINT 'Third-order intermodulation is ",ToiOUTPUT 718;"MOV TOI,O;"
Description
Tums on the third-order intemnodu-l&ion measurement.Queries TOIR. TOIR contains the re-sults of the third-order intermdula-tion measurement.Stores the value of TOIR in the vari-able lbi.Prints the results.Turns off the third-order interrnodu-l&ion measurement.
Setting TO1 to 1 turns on the third-order intermodulation measurement. Setting TO1 to 0 turnsoff the third-order intermodulation measurement. When the third-order intermodulationmeasurement is turned on, the spectrum analyzer first determines that there are four signalson the spectrum analyzer display; the four signals must be the two fundamental signals andtwo distortion products. All of the signals must be greater than the peak excursion abovethe threshold. If four valid signals could not be found for the third-order intermodulationmeasurement, the value of TOIR is -100. If four valid signals could be found, the spectrumanalyzer does the following:
1. Finds the four highest on-screen signals. (If the four highest on-screen signals are not thetwo signals and two distortion products, the TO1 measurement cannot be performed.)
2. Determines the spacing between the highest two signals. The highest two signals are tone Aand tone B.
3. Verifies that the third and fourth highest signals (distortion A and distortion B) fall aboveand below tone A and tone B by the frequency difference between tone A and tone B.
5-555 Programming Commands

TO1 Third-Order Intermodulation Measurement
4. Measures the levels of the four signals (tone A, tone B, distortion A, and distortion B) andcalculates the third-order intermodulation intercept.
The third-order intermodulation intercept is calculated as follows:
TOI = (2 x LevelTone A - Leve~Di~tortion A + LeVelTone B)
2The frequency of the distortion product (Distortion A) is equal to the following:
Frequewm8tortion A = 2 X FrequencYTone A - FreqwwTone B
You must query TOIR to determine the value of the higher third-order intermodulation product.
The third-order intermodulation measurement is repeated at the end of every sweep (TO1uses the ONEOS command to update the measurement data) until you turn off the third-orderintermodulation measurement.
RestrictionsTurning the TO1 measurement on turns off the following functions: windows display mode(WINON), N dB point measurement (NDBPNT), the FFT menu measurements (FF’IAUTO,FFTCONTS, FFTSNGLS), gate utility functions (GDRVUTIL), marker table (MKTBL), peak table(PKTBL), percent AM (PCTAM), peak zoom (PKZOOM), and power menu measurements (ACP,ACPE, CHP, and OBW).
You can execute the TO1 command two different ways. You can either execute the TO1command directly (for example, “TO1 1; I’) or use the MOV command to move the 1 or 0 intothe TO1 command (for example, “MOV TOI, 1; I’). If you use the MOV command, no text isdisplayed in the active function area during command execution.
Because TO1 is performed at the end of every measurement sweep, you should turn offthe third-order intermodulation measurement (set TO1 to 0) when you are done with thethird-order intermodulation measurement.
Query Response
r Off 70 o u t p u t
’ t e r m i n a t i o n +
QTO I
Programming Commands 5-557

TOIRThird-Order Intermodulation ResponseReturns the intercept point for the highest third-order intermodulation product measured bythe third-order intermodulation measurement (TOI).
Syntax
TOIRXTOIR
Related Commands: AUNITS, MKPX, TH, TOI.
ExampleOUTPUT 718;"MOV TOI,l;"
OUTPUT 718*"TOIR'*"8 - #
ENTER 718;Toi
PRINT "Third-order intermodulation is ",ToiOUTPUT 718;"MOV TOI,O;"
Description
Turns on the third-order intermodu-l&ion nwasurmt.Queries TOIR. TOIR contains the re-sults of the third-order intmnodula-tion wwasurmt.Stores the value of TOIR in the var.6able lbi.Prints the results.Turns ofl the third-order intemwdu-k&on rrumsurmt.
TOIR returns a -100 if the TO1 function has not been turned on, or if four on-screen signals arenot valid or are not present. For TO1 to perform a third-order intermodulation measurement,there needs to be four signals on the spectrum analyzer display, and all four signals must begreater than the peak excursion above the threshold.
Query Response
TOIamp1 1 tude
o u t p u tt e r m i n a t i o n +
QTOIR
5.558 Programming Commands

TRA/TRB/TRC Trace Data Input and Output
TRA/TRB/TRCTrace Data Input and OutputThe TRA/TRB/TRC commands provide a method for returning or storing 16-bit trace values.
Syntax
data b y t e & EOI /
XTRA
Use the same syntax for TRB and TRC as shown for TRA, just substitute TRB or TRC for TRA.
Item
Number
Msb length
Lsb length
Data byte
Data byte & EOI
Related Commands:
1L
Description/Default
Any real or integer number.
Most signiflcant byte of a two-byte word that describes thenumber of bytes transmitted.
Least signiflcant byte of a two-byte word that describes thenumber of bytes transmitted.
S-bit byte containing numeric or character data.
g-bit byte containing numeric or character data followed by END.
dOAD, ONEOS, RCLT, SAVET, STOR, TDF.
Range
nteger number range
Example
10 REAL Trace-a(l:401) Creates a 401-point trace array.20 OUTPUT 718;"IP;" Initializes analym30 OUTPUT 718;"TDF P;" Changes the format for real numbers.40 OUTPUT 718;"SNGLS;"50 OUTPUT 718;"CF 300MHZ;" Changes the center freqwncy.60 OUTPUT 718;"SP 200MHZ;" Changes the span.70 OUTPUT 718;"TS;"80 OUTPUT 718;"MKPK HI;"90 OUTPUT 718;"MKCF;" Mioves peak to center of analyzer screen.100 OUTPUT 718;"TS;" Updates mkmsuremmt trace.110 OUTPUT 718;"TRA?;" Gets the trace data.
Programming Commands 5-558

TRA/TRB/TRC Trace Data Input and Output
120 ENTER 718;Trace-a(*) Sends the trace data to the computer:130 OUTPUT 718;"CONTS;" Activates continuous sweep mode140 END
DescriptionTrace data that is input in the A-block or the I-block format is treated as measurement unitsindependent of trace data format (TDF). Enter words in measurement units only. The outputformat is specified according to TDF and MDS.
The command may be used to input integer data to traces. See “Saving Trace Data” in Chapter3. Because the lengths of trace A, trace B, and trace C are fixed, there are always 401 or 802bytes transferred during binary input or binary output mode, respectively.
Query ResponseThe form of the query response is dependent upon the previously used TDF and MDScommands as follows:
T D F M o r T D F I=, A S C I I/ \
o u t p u t’ t e r m i n o t i o n ?-’
/ T D F A
< # A m s b l e n g t h I s b l e n g t h
/ TDF I \
,- T D F B -\
If Analog+ display mode is turned on, only the 401 or 802 bytes of trace data are returned; thedot display is not returned.
5-566 Programming Commands

TRCMEM Trace Memory
TRCMEMTrace MemoryReturns a nonnegative integer that indicates the total number of trace registers available forSAVET and RCLT.
syntax
f u n c t i o n p a t h o n l y
Related Commands: ACTDEF, DISPOSE, FUNCDEF, RCLT, SAVET, TRDEF
ExampleOUTPUT 718;"TRCMEM?;" Gets the total number of trace registers.ENTER 718;NumberDISP Number
DescriptionThe value of TRCMEM is displayed on the spectrum analyzer display when you save a trace,limit-line table, or table of amplitude correction factors in spectrum analyzer memory withTrace -3 In&stml .
Query Response
Programming Commands 5.561

TRDEFTrace DefineCreates a user-defined trace.
Syntax
TROEF c h a r a c t e r
b p r e d e f i n e d v a r i a b l e /
huuser-defined voriobl A
4 p r e d e f i n e d f u n c t i o n I
G t r a c e e l e m e n t /
Item Description/Default
Character Any valid character.
User-defined variable
Predefined variablePredefined functionTrace element
Number
A variable defined by VARDEF or ACTDEF commands.
A command that acts as a variable. Refer to %ble 5-1.Function that returns a value. Refer to ‘pable 5-l.An element of trace A, trace B, trace C, or a user-defined trace.
Any real or integer number.
Range2 to 11 characterslong, A through Z andthe underscore (theunderscore should beused as the secondcharacter of thelabel).
Any valid variablename.
2 to 2047.
Parameter Value: 2 to 2047.Prerequisite Commands: ACTDEF or VARDEF when using a user-defined variable.Related Commands: DISPOSE.
ExampleOUTPUT 718;"TRDEF NEW,lOO;" LIefines a trace called NEW
5-562 Programming Commands

TRDEF Trace Define
DescriptionThe TRDEF command defines a trace and the number of points the trace will contain. Eachtrace element consists of 16 bits and stores the trace amplitude in measurement units. Seethe description for the TDF M format that is described in “Different Formats for Trace DataTransfers” in Chapter 3 for more information about measurement units.
Query ResponseThe query response returns the number of trace elements in the trace.
Programming Commands 5-563

TRDSPTrace DisplayTurns on or off the display of trace A, B, or C without clearing the trace (measurements canstill be taken).
Syntax
Related Commands: TRPRST, TRSTAT.Restrictions: Not available with Analog+ display mode. See “ANLGPLUS” for moreinformation.
ExampleOUTPUT 718;"TRDSP TRA,OFF;"
DescriptionTRDSP OFF reduces the time duration between sweeps.
5-564 Programming Commands

TRGRPH Trace Graph
TRGRPHTrace GraphDisplays a compressed trace on the spectrum analyzer display.
Syntax
d i s p l a y e x p a n d i n g
u s e r - d e f i n e d t r a c e
Item Description/Default
Number Any valid integer.
Number (expanding factor) Any valid integer.
User-defined trace A trace defined by the TRDEF command.
Range
0 to 4000 for the zcoordinate, 0 to 8000for the y coordinate.
0 to 100.
Any valid trace name.
Prerequisite Commands: TRDEF when using a user-defined trace.Related Commands: COMPRESS, DSPLY.
ExampleOUTPUT 718."IP-"OUTPUT 718;"TRiEF NEW,lOO;"
Initializes analyzerD&n,es a trace called NEW with 100 traceelements.
OUTPUT 718;"CF 300MHZ;SNGLS;" Changes the center frequency, activates single-sweep moo%.
OUTPUT 718;"TS;" ltLkes sweep.OUTPUT 718;"COMPRESS NEW,TRA,POS;" Compresses the contents of trace A into trace
NEWOUTPUT 718;"BLANK TRA;"OUTPUT 718;"TRGRPH 0,0,400,4,NEW;" Redraws trace NEW 400 rneasurernent units
above the baseline, expanded by a factor of 4.
Programming Commands 5-565

TRGRPH Trace Graph
DescriptionThe x and y coordinates specify the position of the first trace element. Each horizontaldivision represents 40 x coordinates. Each vertical division represents 1000 9 coordinates. Thedisplay address is inoperative; it is specified for backward compatibility only. The trace can beexpanded according to the scale determined by the expanding factor.
5-566 Programming Commands

TRMATH Trace Math
TRMATHTrace MathExecutes a list of spectrum analyzer commands at the end of each sweep.
Syntax
/ s t r i n g d a t a f i e l d
A - b l o c k d a t a f i e l d
l - b l o c k d a t a f i e l d -1
c h a r a c t e r c h a r a c t e r & E O I
I t e m
Delimiter
Analyzer Command
Msb length
Lsb length
Character
Character & EOI
Description/Default Range
Matching characters marking the beginning and end of the list of - ) \ @ = / ^ $ % ; ! ’ :analyzer commands. ” &
Any spectrum analyzer command except TS.
Most signilicant byte of a two-byte word that describes thenumber of bytes transmitted.
Least significant byte of a two-byte word that describes thenumber of bytes transmitted.
Any valid character.
Any valid character and END.
Related Commands: LIMITEST, ONDELAY, ONEOS, ONMKR, ONSRQ, ONSWP, ONTIME.
Programming Commands 5.567
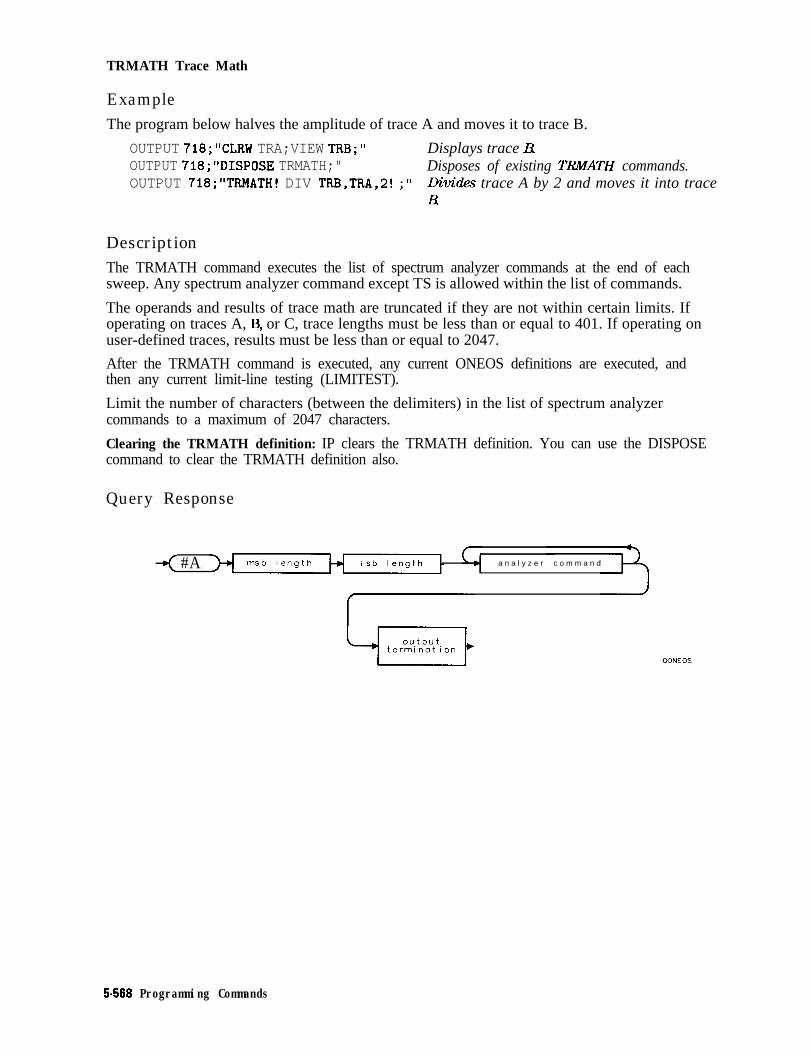
TRMATH Trace Math
ExampleThe program below halves the amplitude of trace A and moves it to trace B.
OUTPUT 718;"CLRW TRA;VIEW TRB;" Displays trace BOUTPUT 718;"DISPOSE TRMATH;" Disposes of existing TRiUATH commands.OUTPUT 718;"TRMATH! DIV TRB,TRA,2! ;" LXwio!.es trace A by 2 and moves it into trace
B
DescriptionThe TRMATH command executes the list of spectrum analyzer commands at the end of eachsweep. Any spectrum analyzer command except TS is allowed within the list of commands.
The operands and results of trace math are truncated if they are not within certain limits. Ifoperating on traces A, B, or C, trace lengths must be less than or equal to 401. If operating onuser-defined traces, results must be less than or equal to 2047.
After the TRMATH command is executed, any current ONEOS definitions are executed, andthen any current limit-line testing (LIMITEST).
Limit the number of characters (between the delimiters) in the list of spectrum analyzercommands to a maximum of 2047 characters.
Clearing the TRMATH definition: IP clears the TRMATH definition. You can use the DISPOSEcommand to clear the TRMATH definition also.
Query Response
< #A a n a l y z e r c o m m a n d
5-566 Programming Commands

TRPRST Trace Preset
TRPRSTTrace PresetSets the trace operations to their preset values.
Syntax
Related Commands: AMB, BLANK, CLRDSP, CLRW, DISPOSE, DL, IP, TH.
ExampleOUTPUT 718;"TRPRST;"
DescriptionTRPRST executes these commands:
AMB OFFAMBPL OFFANLGPLUS OFFBLANK TRBBLANK TRCCLRW TRADISPOSE ONEOSDISPOSE ONSWPDISPOSE TRMATHDL OFFEMTH OFF
Programming Commands 5-569

TRSTATTrace StatusReturns the status of traces A, B, and C: clear write, blank, view, minimum hold, or maximumhold.
Syntax
XTRSTAT
Related Commands: BLANK, CLRW, DET, MINH, TRDSP, VIEW.
ExampleThis example returns the measurement state of traces A, B, and C.
DIM States$[40] Declares arra2/ for results.OUTPUT 718;"TRSTAT?;" Returns the status results to the computer:ENTER 718 USING I'-K";States$PRINT States$ Prints out status of traces.
Query Response
-c ; o u t p u tterminot i o n l
QTRSTAT
5-570 Programming Commands

TS ‘Ihke Sweep
TSThke SweepStarts and completes one full sweep before the next command is executed.
Syntax
XTS
Related Commands: SNGLS, TM.
ExampleOUTPUT 718;"SNGLS;TS;" Activates the single-sweep mode, and performs a take sweep.
DescriptionA take sweep is required for each sweep in the single-sweep mode. TS prevents further inputfrom the interface bus until the sweep is completed to allow synchronization with otherinstruments.
In the example below, the command sequence does not allow sufficient time for a full sweep ofthe specified span before VIEW is executed. Therefore, only the span set by the instrument isdisplayed in trace A.
OUTPUT 718;"IP;SNGLS;CF 400MHZ;SP 20KHZ;VIEW TRA;"
A TS command inserted before VIEW makes the spectrum analyzer take one complete sweepbefore displaying trace A. This allows the spectrum analyzer sufficient time to respond to eachcommand in the
sequence.
OUTPUT 718;"IP;CF 400MHZ;SP 20MHZ;TS;VIEW TRA;"
TS is recommended before transmission of marker data and before executing marker operationssuch as peak search. This is because the active marker is repositioned at the end of eachsweep. When the spectrum analyzer receives a TS command, it is not ready to receive anymore data until one full sweep has been completed. However, when slow sweep speeds arebeing used, the controller can be programmed to perform computations or address otherinstruments while the spectrum analyzer completes its sweep.
On-event commands (ONCYCLE, ONDELAY, ONEOS, ONMKR, ONSRQ, ONSWP, ONTIME, andTRMATH) do not interrupt a take sweep.
Note When MKPAUSE or MKSTOP are activated, TS considers the sweep completewhen it reaches the active marker.
Programming Commands 5-57 1
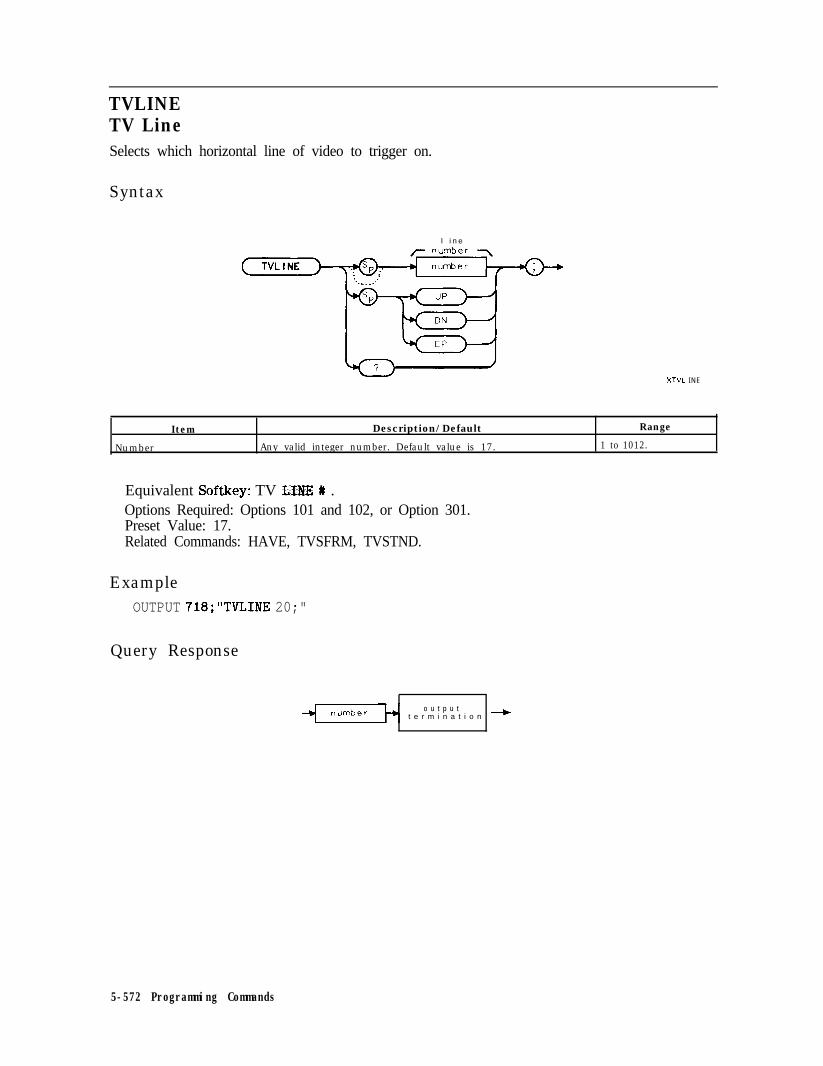
TVLINETV LineSelects which horizontal line of video to trigger on.
Syntax
I i n e
XTVL INE
Item Description/Default Range
Number Any valid integer number. Default value is 17. 1 to 1012.
Equivalent Softkey: TV LIXIZ t .Options Required: Options 101 and 102, or Option 301.Preset Value: 17.Related Commands: HAVE, TVSFRM, TVSTND.
ExampleOUTPUT 718;"TVLINE 20;"
Query Response
o u t p u tt e r m i n a t i o n +
5-572 Programming Commands

TVSFRM TV Frame
TVSFRMTV FrameSelects the type of video frame to trigger on.
Syntax
Options Required: Options 101 and 102, or Option 301.Related Commands: HAVE, TVLINE, TVSYNC.
ExampleOUTPUT 718;"TVSFRM BOTH;"
DescriptionThe ODD and EVEN trigger are for interlaced formats, and VERTICAL is for noninterlaceddisplay formats.
The functions of TVSFRM ODD, TVSFRM EVEN, and TVSFRM BOTH are identical toTV TRIG ODD FLD , TV TRIG EVEN FLD , and TV TRfG VERT INT , respectively. TVSFRMBOTH is the same as TVSFRM VERTICAL.
When used as a predefined variable, TVSFRM returns a number. The number that is returneddepends upon the setting of the TVSFRM parameter, as shown in the following table.
I VERTICAL or BOTH I 0 I
EVEN 1
ODD I I2
Programming Commands 5-573

TVSFRM TV Frame
Query Response
OTVSFRM
5-574 Programming Commands

TVSTND TV Standard
TVSTNDTV StandardSelects the triggering for NTSC, PAL, PAL-M, and SECAM-L formats.
Syntax
XTVSTND
Equivalent Softkey: TV Standard.Options Required: Options 101 and 102, or Option 301.Related Commands: TM, TVLINE, TVSYNC.
ExampleOUTPUT 718;"TVSTND PAL;"
DescriptionTVSTND sets corrections for TVLINE for each standard format. TVSTND sets the polarityto trigger on (positive or negative) automatically; it is necessary to use TVSYNC after usingTVSTND only if you require a non-standard format.
When used as a predefined variable, TVSTND returns a number. The number that is returneddepends upon the setting of the TVSTND parameter, as shown in the following table.
TVSTND Parameter Valuesetting Returned
NTSCNTSC 00
PALMPALM 11
PALPAL 22
SECAMLSECAML 33
Programming Commands 5-575
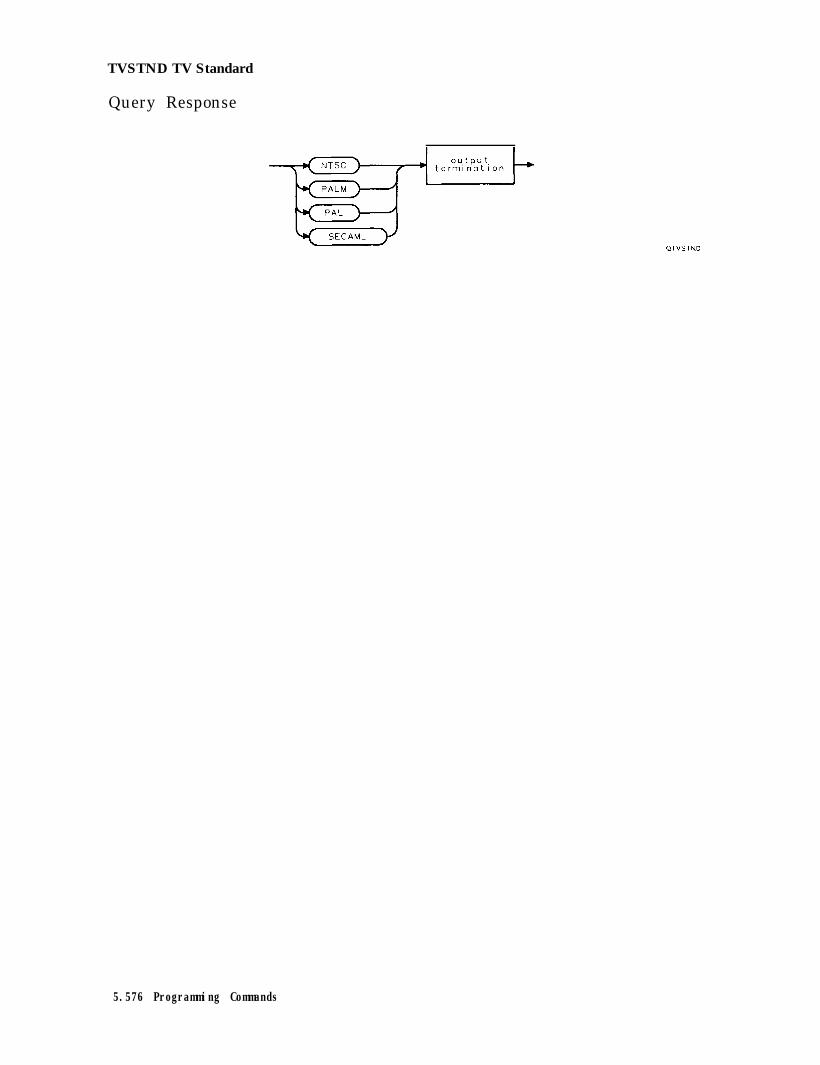
TVSTND TV Standard
Query Response
QTVSTND
5.576 Programming Commands
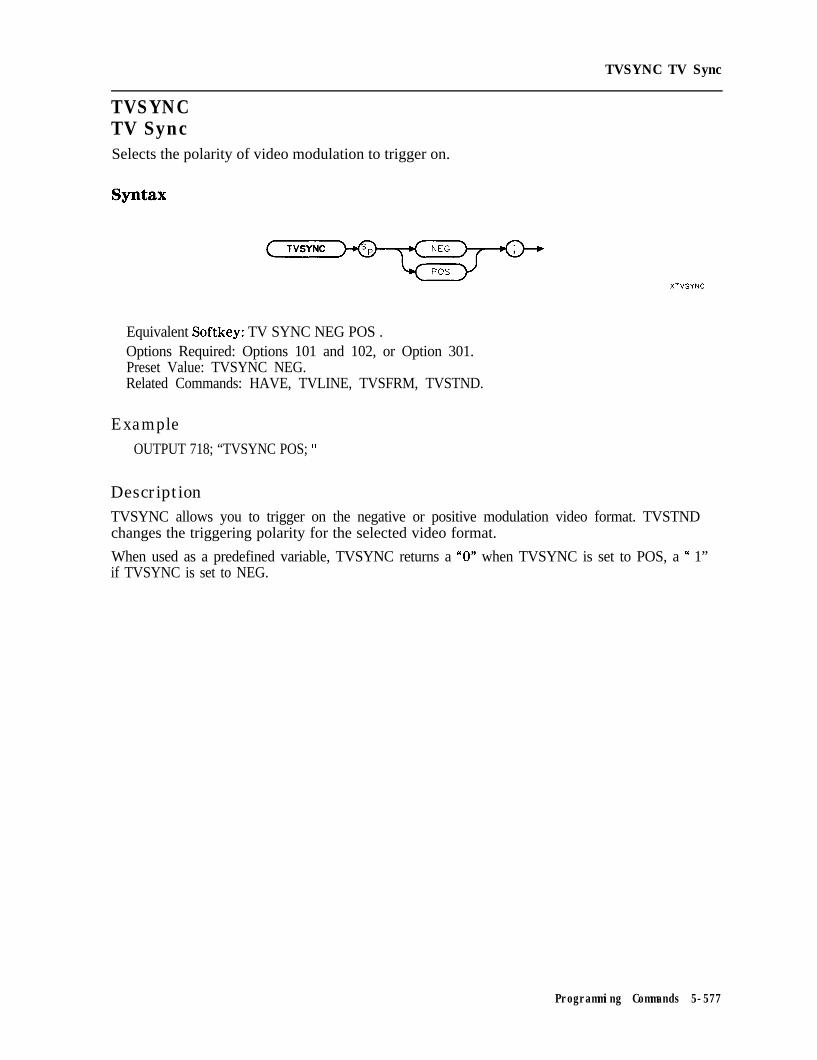
TVSYNC TV Sync
TVSYNCTV SyncSelects the polarity of video modulation to trigger on.
syntax
Equivalent Softkey: TV SYNC NEG POS .Options Required: Options 101 and 102, or Option 301.Preset Value: TVSYNC NEG.Related Commands: HAVE, TVLINE, TVSFRM, TVSTND.
ExampleOUTPUT 718; “TVSYNC POS; ”
DescriptionTVSYNC allows you to trigger on the negative or positive modulation video format. TVSTNDchanges the triggering polarity for the selected video format.
When used as a predefined variable, TVSYNC returns a “0” when TVSYNC is set to POS, a “ 1”if TVSYNC is set to NEG.
Programming Commands 5-577

TWNDOWTrace WindowCreates a window trace array for the fast Fourier transform (FFT) function.
Syntax
T W N D D W
7 d e s t i n a t i o n r w i n d o w
b u s e r - d e f i n e d t r a c e /
b t r a c e r a n g e /
Item Description/Default
User-defined trace A trace defined by the TRDEF command.
Trace Range A segment of trace A, trace B, trace C, or a user-defined trace
Range
Any valid trace name.
Prerequisite Commands: TRDEF when using a user-defined trace. TS when using trace data.Related Commands: FFT.
ExampleConnect calibrator signal to the spectrum analyzer input.
OUTPUT 718;"IP;"OUTPUT 718;"CF 300MHZ;"OUTPUT 718;"SP 0HZ;ST 800MS;"OUTPUT 718;"TRDEF NEW,401;"OUTPUT 718;"TWNDOW NEW,UNIFORM;"OUTPUT 718;"CLRW TRB;"OUTPUT 718;"SNGLS;TS;TS;"OUTPUT 718;"FFT TRA,TRB,NEW;"
OUTPUT 718;"BLANK TRB;"OUTPUT 718;"VIEW TRA;"
Description
Initializes analyzer:Changes the center frequency.Changes span, sweep time.Dq@uxs a trace called NEWTrace NE?Vstores the window algorithm, UNIFORM.
Activates single-sweep mode and updates trace.Performs fast I;burier transform on trace B andstores the results in trace A.
Displays the result.
The trace window function creates a trace array according to three built-in algorithms:UNIFORM, HANNING, or FLATTOP When used with the FFl? command, the three algorithmsgive resultant passband shapes that represent a give-and-take between amplitude uncertainty,sensitivity, and frequency resolution. See “FFT” for more information about these algorithmsand the FFT function.
5-578 Programming Commands

UP up
UPUPIncreases the value of the active function by the applicable step size.
Syntax
( UP
Related Commands: See the list of active functions listed in the description for UP
ExampleOUTPUT 718;"IP;MKN;RB 1OKHZ;MKPK NH;UP;" Increases the resolution bandwidth to
30 kHz because MKPK NH does not changethe active function.
DescriptionBefore executing UP, be sure that the function to be decreased is the active function. Forexample, the programming example increases the resolution bandwidth, because marker peak(MKPK) is not an active function.
The active functions are ACPBW, ACPSP, AT, CF, CRTHPOS, CRTVPOS, DL, DOTDENS, FA,FB, FMGAIN, GD, GL, LG, MKA, MKD, MKFCR, MKN, MKPAUSE, MKPX, ML, NDB, NRL, RB,RCLS, ROFFSET, RL, RLPOS, SAVES, SAVRCLN, SETDATE, SETTIME, SP, SQLCH, SRCALC,SRCAT, SRCPOFS, SRCPSWP, SRCPWR, SRCTK, SS, ST, TH, TVLINE, VB, VBR, and user-definedactive function specified by the ACTDEF command.
Programming Commands 5.579


USTATE User State
Query ResponseUSTATE? returns the user state to the computer. Also returned are instructions required by thespectrum analyzer when the user state information is transmitted to the spectrum analyzer.The contents of user memory can be restored by executing USTATE followed by the A-blockdata retrieved by a previous “USTATE?;” command.
< #A msb l e n g t h Isb l e n g t h c h a r a c t e r
I IQUSTATE
Programming Commands 5.581

VARDEFVariable DefinitionCreates a user-defined variable and assigns it a value.
Syntax
v a r i a b l e name/ \
VARDEF
7 i n i t i a l v a l u e 7
c n u m b e rc
b p r e d e f i n e d v a r i a b l e d
buser-defined variable/
* p r e d e f i n e d f u n c t i o n /
b t r a c e e l e m e n t /XVARDEF
Item
Character
Number
User-defined variable
Predefined variable
Predehned functionlkace element
Description/Default Rwte
Any valid character. 2 to 11 characterslong, A through 2 andthe underscore (theunderscore should beused as the secondcharacter of thelabel).
Any real or integer number. Real number range.A variable defined by VARDEF or ACTDEF commands. Any valid variable
name.A command that acts as a variable. Refer to Table 5-l.Function that returns a value. Refer to Table 5-1.
An element of trace A, trace B, trace C, or a user-defined trace.
Related Commands: DISPOSE, TRDEF’.
5.582 Programming Commands

VARDEF Variable Definition
Example
OUTPUT 718;"VARDEF V-AR,O;"
DISP "ENTER THE VALUE OF THE VARIABLE USINGTHE ANALYZER KEYS"OUTPUT 718;"V,AR EP;"
OUTPUT 718;"V,AR?;"ENTER 718;N
PRINT NOUTPUT 718;"IP;"OUTPUT 718."V AR'."# - *,
ENTER 718;NPRINT N
Description
Lk$nes variable called V-AR and as-signs it a value of 0.
The value of VAR is changed byusing the front-panel controls.
Returns entered value of V-AR to thecomputer:LGpluys value on the computer screen.Initializes analyzer:The value of V-AR changes to itsinitial value afler an I.
The VARDEF command creates a user-defined variable and assigns it a value. User-definedvariables can be used in many of the spectrum-analyzer remote-control processes. Useuser-defined variables wherever “user-defined variable” appears in the syntax diagrams. Aninstrument preset (IP) sets user-defined variables to their initial value (see example).
An error results if a variable name is the same as any reserved word. ‘Ihble 5-2 lists reservedwords.
User-defined variables occupy spectrum analyzer memory. Use the DISPOSE command to clearuser-defined variables from memory.
Programming Commands 5.583

VARIANCEVariance of Trace AmplitudesReturns the amplitude variance of the specified trace, in measurement units.
Syntax
. .VAR I ANCE
Item Description/Default Range
User-defined trace A trace delined by the TRDEF command. Any valid trace name.
Trace range A segment of trace A, trace B, trace C, or a user-defined trace.
Prerequisite Commands: TRDEF when using a user-defined trace. TS when using trace data.Related Commands: MEAN, RMS, STDEV.
ExampleOUTPUT 718;"IP;"OUTPUT 718;"SNGLS;TS;"OUTPUT 718;"VARIANCE TRA?;"ENTER 718;NumberDISP Number;"MEASUREMENT UNITS"
Description
Initializes analyzexActivates single-sweep mode.I&turns variance of trace A to computer:Stores value in computer variable.LXsplu~s the results on computer screen.
‘lkking the square root of a variance yields the standard deviation value.
The formula to calculate the variance is as follows:
n - l
n represents the number of data points.xi represents a data point.X represents the mean of data.
5-584 Programming Commands

VARIANCE Variance of Trace Amplitudes
Query Response
Programming Commands 5-585

VAVGVideo AverageEnables the video-averaging function, which averages trace points to smooth the displayedtrace.
Syntax
X”A”G
Item Description/Default Rwse
Number Any valid integer. Default is 100. 1 to 16384.
Equivalent Softkey: VID AVE ON OFF .Related Commands: AUTO, CLRAVG, IP, SMOOTH.Restrictions: Not available with Analog+ display mode. See “ANLGPLUS” for moreinformation.
Example
OUTPUT 718."VAVG 150.", 3 Video averages the trace.
DescriptionUse VAVG to view low-level signals without slowing the sweep time. Video averaging canlower the noise floor by more than a 30 Hz video bandwidth if a large number of sweeps hasbeen specified for averaging. VAVG may also be used to monitor instrument state changes (forexample, changing bandwidths, center frequencies) while maintaining a low noise floor. Theactive function readout indicates the number of sweeps to be averaged; the default for thenumber of sweeps is 100 unless otherwise specified. Executing “VAVG OFF;” turns off videoaveraging. Executing “VAVG ON;” turns on video averaging.
Query Response
t e r m i n a t i o n ---)
5-586 Programming Commands

VB Video Bandwidth
VBVideo BandwidthSpecifies the video bandwidth, which is a post-detection, low-pass filter.
Syntax
,- f r e q u e n c y -\
(VB 1 3-6‘. P ;’
‘I. ...__..’
Item Description/Default Range
Number Any real or integer number. Default unit is Hz. 30 Hz to 3 MHz.
Equivalent Softkey: VID l3W AUTO NAN.Preset State: 1 MHz.Step Increment: In a 1, 3, 10 sequence.Related Commands: AUTO, RB, SP, ST, VBR.
Example
OUTPUT 718;"VB 10KHZ;" Changes the video bandwidth to 10 kHz.
DescriptionThe resolution bandwidth, video bandwidth, and sweep time are normally coupled to thespan. Executing VB uncouples video bandwidth from resolution bandwidth (it does nothing tothe sweep-time, resolution-bandwidth, and span coupling). Executing AUTO recouples videobandwidth to the resolution bandwidth.
Frequency values other than the values in the 1, 3, 10 sequence are rounded to the nearestpermissible value.
Programming Commands 5.587

VB Video Bandwidth
Query Response
o u t p u tt e r m i n a t i o n +
5-588 Programming Commands

VBR Video Bandwidth Ratio
VBRVideo Bandwidth RatioThe VBR parameter is multiplied by the resolution bandwidth to determine the automaticsetting of video bandwidth.
Syntax
Item Description/Default hnge
Number Any valid real number. 0 to 3000000
Equivalent Softkey: VWW/RBW RATIO .Preset State: 0.300.Step Increment: 1, 3, 10 sequence.Related Commands: AUTO, RB, SP, VB.
ExampleOUTPUT 718;"VBR 1;"
DescriptionRatio values other than the values in the 1, 3, 10 sequence are rounded to the nearestpermissible value.
VBR returns a real number when used as a predefined variable.
Query Response
Programming Commands 5-588

VIEWView TraceDisplays trace A, trace B, or trace C, and stops taking new data into the viewed trace.
Syntax
Equivalent Softkey: VIEW A , VIEW B , and VIEW C .Related Commands: BLANK, CLRW, MINH, MXMH.Restrictions: Not available with Analog+ display mode. See “ANLGPLUS” for moreinformation.
ExampleOUTPUT 718;"VIEW TRA;"
DescriptionIn the VIEW mode the trace is not updated. When VIEW is executed, the contents of the traceare stored in display memory.
5-580 Programming Commands

WAIT Wait
WAITWaitSuspends all spectrum analyzer operation for the specified time duration.
WAIT
/-wait t i m e \
. ../ +
/
p r e d e f i n e d v a r i a b l e
% u s e r - d e f i n e d v a r i a b l e 2
h p r e d e f i n e d f u n c t i o n J
b t r a c e element J
Item Description/Default RuleNumber Any real or integer number. Default unit is seconds. 1 ms to 1000 8.
ExampleUse WAIT to suspend spectrum analyzer operation.
130 OUTPUT 718;"TRDSP TRA,OFF;TS;" Blanks trace A.140 OUTPUT 718;"WAIT 2SC;" Suspends analgwr operation for 2 seconds.150 OUTPUT 718;"TRDSP TRA,ON;" L?ispla~s trace A.
DescriptionThe WAIT command suspends all spectrum analyzer operation for the specified time. Use theONDELAY command if you want the spectrum analyzer to keep taking data during the elapsedtime period.
Programming Commands 5.581

WINNEXTWindow NextWhen using the windows display mode, you can use WINNEXT to select the upper or lowerwindow as the active window.
Syntax
Equivalent Front-Panel Key (HP 85913, HP 85933, HP 85943, HP 85953, or HP 85963 only):@EQ.Related Commands: WINON, WINOFF.
ExampleOUTPUT 718~"WINON~"OUTPUT 718;"WINNE;T;"
Turns on the windows display mode.Selects the window that is currently not active to be the activewindow.
DescriptionWhen the windows display mode is activated, there will be two windows displayed on thespectrum analyzer display. Only one of the windows is active (the currently active window willhave a solid line around the graticule rather than a broken line.) You can use the WINNEXTcommand to select the active window.
5-582 Programming Commands

WINOFF Window Off
WINOFFWindow OffTurns off the windows display mode.
Syntax
WI NOFF
Equivalent Softkey (HP 85913, HP 85933, HP 85943, HP 85953, or HP 85963 only):WINROWS OFF.Related Commands: WINON.
ExampleOUTPUT 718;"WINON;" Turns on the windows display mode.OUTPUT 718; “WINNEXT; ” Selects the window that is currently not active to be the active
window.OUTPUT 718; “WINOFF; ” Turns ofl the windows display mode.
DescriptionWhen you execute WINON, there will be two windows displayed on the spectrum analyzerscreen. You must execute WINOFF to turn the windows off and return to a single display,and the display will have the settings of the last active window. In contrast, WINZOOM alsochanges from two windows to one full screen display but does not exit the windows displaymode; you can still access the second window by executing WINZOOM again.
Programming Commands 5-583

WINONWindow ONDisplays the two windows on the spectrum analyzer display.
Syntax
WINON
Equivalent Front-Panel Key (HP 85913, HP 85933, HP 85943, HP 85953, or HP 85963 only):(ONJ.Related Commands: WINOFF, WINNEXT, WINZOOM.
ExampleOUTPUT 718;"WINON;"
DescriptionWINON activates the windows display mode and the zone marker.
Windows display mode: When the windows display mode is first activated, there will be twowindows displayed on the spectrum analyzer display. Only one of the windows is active (theactive window will have a solid line around the graticule rather than a broken line.) You canuse the WINNEXT command to select the active window. The instrument state of the activewindow can be changed without affecting the state of the inactive window.
Zone marker: The zone marker is shown in the upper window by two vertical lines. Thefrequency span between the two edges of the zone marker is the frequency range of the lowerwindow. The zone marker can be moved and changed by using the ZMKCNTR, ZMKSPAN,ZMKPKNR, or ZMKPKNL programming commands. Changing the span or center frequency ofthe lower window will change the span or location of the zone marker on the upper windowcorrespondingly.
Most programming commands can be executed when the windows display mode is used.Some functions cannot be used with the windows display mode, however. ‘Ihble 5-11 lists theprogramming commands that, when executed, exit the windows display mode.
5.584 Programming Commands

WINON Window ON
‘Ihble 5-11.Programming Commands That Exit The Windows Display Mode
Command
ACP
CAL
CHP
CNF
DISPOSE ALL or ERASE
FFTAUTO, FFTCONTS, FFTSNGL!
GDVRUTIL
IP
LF
NDBPNT
OBW
PCTAM
PKZOOM
TOI
Description
Measures adjacent channel power.
Performs the calibration routines.
Measures channel power.
Performs the confidence test.Disposes of the contents of user memory.
Initiates a FFT measurement.
Accesses the time-Sate functions.
Performs an instrument preset.
Performs an instrument preset into base band
Measures NdB bandwidth.
Measures occupied bandwidth.
Measures the percent AM.
Performs the peak zoom routine.
Makes a third order intercept measurement.
When in the windows display mode, saving the trace or state saves the state of the currentlyactive window only. The recall state function recalls the stored state into the currently activewindow.
You must execute WINOFF to turn the windows off.
Programming Commands 5-595

WINZOOMWindow ZoomWhen using the windows display mode, you can use WINZOOM to either expand the size of theactive window so that it fills the entire spectrum analyzer display, or display both the upperand lower windows on the spectrum analyzer display.
Syntax
Equivalent Front-Panel Key (HP 85913, HP 85933, HP 85943, HP 85953, or HP 85963 only):(ZOOM).Related Commands: WINNEXT, WINON.
Example
OUTPUT 718;"WINON;" Turns on the windows display rmde.OUTPUT 718;"WINZOOM;" Expands the size of the active window.
DescriptionThe first time WINZOOM is executed, it expands the active window. Executing WINZOOM againrestores the windows display mode so that both of the windows are displayed on the spectrumanalyzer display.
5-596 Programming Commands

XCH Exchange
XCHExchangeExchanges the contents of sources 1 and 2.
Syntax
u s e r - d e f i n e d v a r i a b l e
XXCH
Item
User-defined trace
User-defined variable
Predeflned variable
Trace range
Description/Default Range
A trace defined by the TRDEF command. Any valid trace name.
A variable deEned by VARDEF or ACTDEF commands. Any valid variablename.
A command that acts as a variable. Refer to Table 5-l.
A segment of trace A, trace B, trace C, or a user-defined trace.
Prerequisite Commands: TRDEF when using a user-defined trace. ACTDEF or VARDEF for auser-defined variable. TS when using trace data.Related Commands: AXB, BXC.
Programming Commands 5-597

XCH Exchange
Example
OUTPUT 718;"XCH TRA,TRB;" Exchanges the contents of trace A with trace B
DescriptionWhen the source is longer than the destination, the source is truncated to fit. When the sourceis shorter than the destination, the last element is repeated to fill the destination.
5-596 Programming Commands

ZMKCNTR Zone Marker at Center Frequency
ZMKCNTRZone Marker at Center FrequencyPositions the zone marker at the specified frequency.
Syntax
zone m a r k e r f r e q u e n c y\
H Z
/
/
I
.:
..’
...
/
/
XZMKCNTR
Item Description/Default Range
Number Any real or integer number. Default unit is Hz. Frequency range ofthe spectrum analyzer.
Equivalent Softkey (HP 85913, HP 85933, HP 85943, HP 85953, or HP 85963 only):ZONE CENTER .Default value: If a marker is on-screen, the frequency value of the marker. If a marker isnot on-screen, the spectrum analyzer center frequency.Related Commands: CF, SP, WINON, ZMKSPAN.
Example
OUTPUT 718;"WINON;" Turns on the windows display m&e.OUTPUT 718;"ZMKCNTR 300MHZ;" Places the zone marker at 300 MHz
DescriptionZMKCNTR allows you to move the zone marker within the frequency range displayed in theupper window. When the lower window is the active window, changing the center frequency(CF) or frequency span (SP) of the lower window changes the position of zone marker in theupper window.
Restrictions: Use ZMKCNTR only if the window is in non-zero span; ZMKCNTR does not applyif the window is in the time domain. The zone marker can be moved beyond the frequencyrange displayed by the upper window (the zone marker cannot exceed the frequency range ofthe spectrum analyzer, however.) ZMKCNTR should only be used when the windows displaymode is turned on.
You can use ZMKSPAN to change the span of the zone marker.
Programming Commands 5-599

ZMKCNTR Zone Marker at Center Frequency
Query Response
ZO”em a r k e r f r e q u e n c y/ \
o u t p u tt e r m i n a t i o n +
I I QZMKCNTR
5.600 Programming Commands

ZMKPKNL Zone Marker for Next Left Peak
ZMKPKNLZone Marker for Next Left PeakPlaces the zone marker at the next signal peak that is left of the zone marker’s currentposition.
Syntax
XZMKPKNL
Equivalent Softkey (HP 85913, HP 85933, HP 85943, HP 85953, or HP 85963 only):ZONE PK LEFT,Related Commands: MKPX, WINON, ZMKCNTR, ZMKSPAN, ZMKPKNR.
ExampleOUTPUT 718;"WINON;" Turns on the windows display mode.OUTPUT 718;"ZMKPKNL;" PZuces the zone mm&r at the next peak to the left of the cum-ent
position of the zone marker:
DescriptionZMKPKNL does the following:
1. Searches for the next signal peak outside and to the left of the zone marker. ZMKPKNL onlyapplies if the window is in a non-zero span; ZMKPKNL does not apply if the window is inthe time domain.
2. If a peak is found, ZMKPKNL moves the zone marker so that it is centered around the peak.If a signal peak cannot be found, or the window is in zero span, the zone marker is notmoved.
3. Changes the center frequency of the lower window to the frequency of the signal peak.
‘Ib be considered a signal peak, the signal must be greater than the peak excursion (see“MKPX” for more information about the peak excursion).
ZMKPKNL should only be used when the windows display mode is turned on.
Programming Commands 5-601

ZMKPKNRZone Marker for Next Right PeakPlaces the zone marker at the next peak to the right of the zone marker’s current position.
Syntax
XZMKPKNR
Equivalent Softkey (HP 85913, HP 85933, HP 85943, HP 85953, or HP 85963 only):ZOIJE PK RfGHT .Related Commands: MKPX, WINON, ZMKCNTR, ZMKSPAN, ZMKPKNL.
Example
OUTPUT 718;"WINON;" Turns on the windows display wmd.e.OUTPUT 718;"ZMKPKNR;" Places the zone marker at the next peak to the right of the current
position of the zone marker:
DescriptionZMKPKNR does the following:
1. Searches for the next signal peak outside and to the right of the zone marker. ZMKPKNRonly applies if the window is in a non-zero span; ZMKPKNR does not apply if the window isin the time domain.
2. If a peak is found, moves the zone marker so that it is centered around the peak. If a signalpeak cannot be found, or the window is in zero span, the zone marker is not moved.
3. Changes the center frequency of the lower window to the frequency of the signal peak.
To be considered a signal peak, the signal must be greater than the peak excursion (see“MKPX” for more information about the peak excursion).
ZMKPKNR should only be used when the windows display mode is turned on.
5-602 Programming Commands

ZMKSPAN Zone Marker Span
ZMKSPANZone Marker SpanChanges the width of the zone marker.
Syntax
XZMKSPAN
I Item Description/Default ! Range
Number Any real or integer number. Default unit is Hz. 0 to maximumfrequency span of the I
Equivalent Softkey (HP 85913, HP 85933, HP 85943, HP 85953, or HP 85963 only):ZOESE SPAN.Default value: l/10 of the spectrum analyzer’s frequency span.Related Commands: SP, WINON, ZMKCNTR.
Example
OUTPUT 718;"WINON;" Turns on the windows display mode.OUTPUT 718;"ZMKSPAN IOOMHZ;" Sets the span of the zone marker to 100 MHz
DescriptionZMKSPAN allows you to change the frequency span of the zone marker that is displayed inthe upper window. When the lower window is the active window, frequency span (SP) of thelower window changes the frequency span of zone marker in the upper window.
Restrictions: Use ZMKSPAN only if the window is in non-zero span; ZMKSPAN does not applyif the window is in the time domain. ZMKSPAN should only be used when the windows displaymode is turned on.
Programming Commands 5603

ZMKSPAN Zone Marker Span
Query Response
t e r m i n a t i o n ---*QZMKSPAN
5.604 Programming Commands

Spectrum Analyzer Error Messages
Error MessagesThe spectrum analyzer can generate various messages that appear on its screen duringoperation to indicate a problem.
There are three types of messages: hardware error messages (H), user-created error messages(U), and informational messages (M).
H Hardware error messages indicate the spectrum analyzer hardware is probably broken. Referto Chapter 8 in the HP 8590 E-Series and L-Series Spectrum Analyzers User’s Guide for moreinformation.
n User-created error messages appear when the spectrum analyzer is used incorrectly. They areusually generated during remote operation (entering programming commands using either acontroller or the external keyboard).
w Informational messages provide information indicating the spectrum analyzer’s progresswithin a specific procedure.
The messages are listed in alphabetical order on the following pages; each message is defined,and its type is indicated by an (H), (U), or (M).
$75LOCKOFFIndicates slow YTO tuning. This message may appear if the spectrum analyzer is usingdefault correction factors. If this message appears constantly, perform the CAL FREQ routineto try to eliminate this message. 4 LOCK OFF appears briefly during the CAL FREQ routine,during instrument preset, or when the frequency value is changed; this is normal and doesnot indicate a problem. (U) and (H)
ADGBV FAILIndicates a hardware failure. (H)
ADC-GND FAILIndicates a hardware failure. (H)
ADGTIME FAILIndicates a hardware failure. (H) and (U)
CAL:- - -During the self-calibration routine, messages may appear on the display to indicate how thecalibration routines are progressing. For example, sweep, freq, span, MC delay, FM coil,and atten can appear on the spectrum analyzer display. 4 LOCK OFF appears briefly duringthe CAL FREQ self-calibration routine; this is normal and does not indicate a problem. (M)
CAL:- - - : done Press CAL STORE to saveIndicates that the self-calibration routine is finished and that you should press CAL STORE.(MlCAL: cannot execute CALAMP enter: 0 dB PREAMP GAINThe preamplifier gain should be set to 0 dB before the CAL AMPTD routine is performed.
Spectrum Analyzer Error Messages A-l

The preamplifier gain is set by using EXT?BNAL PkRAMPG . This message also sets SRQ 110.UJ)CAL: DATA NOT STORED CAL AMP NEEDEDThe correction factors are corrupt and cannot be stored. You need to perform the CAL FREQ& AMPTD routine before trying to store the correction factors. This message also sets SRQ110. (U)
CAL: FM SPAN SENS FAILThe spectrum analyzer could not set up span sensitivity of the FM coil. (H)
CAL: GAIN FAILIndicates the signal amplitude is too low during the CAL AMPTD routine. This message alsosets SRQ 110. (H)
Cal harmonic > = 5.7 GHz NOT foundIndicates that the CAL YTF routine for an HP 85953 cannot find a harmonic of the 300 MHzcalibration signal. If this happens, ensure that the CAL OUT connector is connected to thespectrum analyzer input, perform the CAL FREQ & AMPTD routine, and then perform theCAL YTF routine again. (U) and (H)
CAL: MAIN COIL SENSE FAILThe spectrum analyzer could not set up span sensitivity of the main coil. If thismessage appears, press [FREQUENCY), -37, (KJ m, Mom 1 of 4, More 2 of 4,DEFAI&T CAL DATA , and perform the CAL FREQ routine again. (H)
CAL: NBW 200 Hz notch amp failedIndicates that the 200 Hz resolution bandwidth is not the correct shape for the calibrationroutine. (H)
CAL: NBW 200 Hz notch failedIndicates that the 200 Hz resolution bandwidth is not the correct shape for the calibrationroutine. (H)
CAL: NBW 200 Hz width failedIndicates that the 200 Hz resolution bandwidth is not the correct bandwidth for thecalibration routine. (H)
CAL: NBW gain failedIndicates that one of the resolution bandwidths is not the correct amplitude for thecalibration routine. (H)
CAL: NBW width failedIndicates that one of the resolution bandwidths is not the correct width for the calibrationroutine. (H)
CAL: PASSCODE NEEDEDIndicates that the function cannot be accessed without the pass code. For the DEFAULT CADATA function, the pass code is setting the center frequency of the spectrum analyzer to-37 Hz. (M)
CAL: RES BW AMPL FAILThe relative insertion loss of the resolution bandwidth is incorrect.SRQ 110. (H)
This message also sets
CAL SIGNAL NOT FOUNDIndicates the calibration signal (CAL OUT) cannot be found. Check that the CAL OUT and
.L
the spectrum analyzer input connectors are connected with an appropriate cable. If thecalibration signal is connected to the spectrum analyzer input but cannot be found, press(FREQUENCY), -37,1Hz), a,M ora 2 of 4 , More 2 of 4 , IlEFAaT GAS DATA . If the
A-2 Spectrum Analyzer Error Messages

calibration signal still cannot be found, press L-1, -37, (Hz) and perform the CALFREQ or CAL FREQ 8~ AMPTD self-calibration routines. This message also sets SRQ 110. (U)and U-UCAL: SPAN SENS FAILThe self-calibration span sensitivity routine failed. This message also sets SRQ 110. (H)
CAL: USING DEFAUIX DA’IAIndicates that the calibration data is corrupt and the default correction factors are beingused. Interruption of the self-calibration routines or an error can cause this problem. (M)
CAL YTF FAILEDIndicates that the CAL YTF routine could not be successfully completed. If this messageappears, ensure that the CAL OUT connector (for the HP 85953) or 100 MHz COMB OUTconnector (for the HP 8592L, HP 85933, or HP 85963) is connected to the spectrum analyzerinput, perform the CAL FREQ & AMPTD routine, and then perform the CAL YTF routineagain. (U) and (H)
CAL: ZERO FAILThe spectrum analyzer could not set up the tuning sensitivity of the main coil. If thismessage appears, press @ZZKYj, -37, (KJ, (CAL, More 2 of 4, More 2 of 4,DEFAULT CIE DATA , and perform the CAL FREQ routine again. (H)
Cannot engage phase lock with current CAL FREQ dataIndicates that the CAL FREQ routine needs to be performed before phase locking can beturned on. (U)
Cannot reach N dB pointsIndicates that the number of dB specified for the N dB PTS function is greater than thedistance of the signal peak from the spectrum analyzer noise floor or peak threshold. (U)
Check trigger inputIndicates that the spectrum analyzer needs an external trigger signal to use the time-gatingfunctions. Before using the time-gating functions, you should ensure there is a trigger pulseconnected to the GATE TRIGGER INPUT connector on the rear panel of spectrum analyzerand that the GATE OUTPUT is connected the EXT TRIG INPUT connector. (U)
Comb harmonic at - _ _ GHz NOT foundIndicates that the CAL YTF routine for the spectrum analyzer cannot find a harmonic of thecomb generator at frequency displayed. If this happens, ensure that the 100 MHz COMB OUTconnector (for an HP 8592L, HP 85933, or HP 85963) or the CAL OUT connector (for anHP 85953) is connected to the spectrum analyzer input with a low-loss, short cable beforethe CAL YTF routine is performed. (U) and (H)
COMB SIGNAL NOT FOUNDThe comb signal cannot be found. Check that 100 MHz COMB OUT is connected to thespectrum analyzer input. The comb generator is available with the HP 8592L, HP 85933, orHP 85963 only. (U) and (H)
CMD ERR:- - -The specified programming command is not recognized by the spectrum analyzer. (U)
CONF TEST FAILIndicates that the confidence test failed. If this happens, ensure that the CAL OUT connectoris connected to the spectrum analyzer input, perform the CAL FREQ & AMPTD routine, andthen perform the confidence test again. This message also sets SRQ 110. (H) and (U)
Factory dlp, not editableIndicates that the downloadable program or variable that you have selected is used by a“personality” and cannot be edited. A personality is a program that is manufactured by
Spectrum Analyzer Error Messages A-3

Hewlett-Packard and is available for use with the HP 8590 Series spectrum analyzer. Anexample of a personality is the HP 85716A CATV system monitor personality. (U)
FAIL:- _ _An error was discovered during the power-up check. The 4-digit by lo-digit code indicatesthe type of error. Error codes are described in the spectrum analyzer’s service guide. (H)
File type incompatibleIndicates that the selected file is not a display image file. The file name for a display imagefile is always preceded by an “i.” (U)
F R E Q U N C A LIf the FREQ UNCAL message appears constantly, it indicates a YTO-tuning error. If thismessage appears constantly, perform the CAL FREQ routine. FREQ UNCAL appears brieflyduring the CAL FREQ routine; this is normal and does not indicate a problem. (U) and (H)W> and V-0
Function not available in current ModeIndicates that the function that you have selected can only be used with the spectrumanalyzer mode. You can use the (-1 key to select the spectrum analyzer mode. (U)
Function not available with analog displayIndicates that the function that you have selected is not compatible with the Analog+display mode. lb use the function, you must first turn off the Analog+ display mode withANALOG* ON OFF. (U)
Gate card not calibratedThis message can indicate that either the CAL AMPTD routine need to be performed beforethe time-gating functions can be used, or that something was connected to the GATETRIGGER INPUT connector during the CAL AMPTD or CAL FREQ & AMPTD routines. Ifyour spectrum analyzer has an Option 105 installed in it, you should ensure that nothing isconnected to the GATE TRIGGER INPUT connector when the CAL AMPTD or CAL FREQ &TD routines are performed. (U) and (H)
INTERNAL LOCKEDThe spectrum analyzer’s internal trace and state registers have been locked. lb unlock thetrace or state registers, press SAV LOCK ON OFF so that OFF is underlined. For remoteoperation, use PSTATE OFF. (U)
INVALID ACTDEF: - - -The specified ACTDEF name is not valid. See the ACTDEF programming command. (U)
INVALID AMPCOR: FREQFor the AMPCOR command, the frequency data must be entered in increasing order. See thedescription for the AMPCOR programming command for more information. (U)
INVALID BLOCK FORMAT: IF STATEMENTAn invalid block format appeared within the IF statement. See the description for the IFTHEN ELSE ENDIF programming command for more information. (U)
INVALID CARDIndicates one of the following conditions: a card reader is not installed, the memory card iswrite-protected (check the position of the switch on the memory card), the memory card is aread-only memory (ROM) card, or a memory card has not been inserted. This message canalso occur if remote programming commands for the memory card capability are executedwith an HP 859OL or HP 8592L that does not have an Option 003. (U)
INVALID CARD: BAD MEDIAIndicates the formatting routine (FOIST CARD ) for the memory card could not be
A-4 Spectrum Analyzer Error Messages
completed. See the description for INVALID CARD above for more information about thepossible causes of this message. (U) and (H)
INVALID CARD: DATA ERRORIndicates the data could not be retrieved from the memory card. (U) and (H)
INVALID CARD: DIRECI?ORYIndicates the memory card has not been formatted. (U)
INVALID CARD: NO CARDIndicates a memory card has not been inserted. (U)
INVALID CARD: TYPEIndicates one of the following conditions: a card reader is not installed, the memory card iswrite-protected (check the position of the switch on the memory card), the memory card is aread-only memory (ROM) card, or a memory card has not been inserted. This message canalso occur if remote programming commands for the memory card capability are executedwith an HP 85901, or HP 8592L that does not have an Option 003. (U)
INVALID CHECKSUM: USTATEThe user-defined state does not follow the expected format. (U)
INVALID COMPARE OPERATORAn IF/THEN or REPEAT/UNTIL routine is improperly constructed. Specifically, the IF orUNTIL operands are incorrect. (U)
INVALID DET: FM or TV option onlyIndicates that the selected detector cannot be used until the appropriate option is installed inthe spectrum analyzer. (U)
INVALID ENTER FORMATThe enter format is not valid. See the appropriate programming command description todetermine the correct format. (U)
INVALID <file name> NOT FOUNDIndicates that the specified file could not be loaded into spectrum analyzer memory orpurged from memory because the file name cannot be found. (U)
INVALID FILENAME _ _ _Indicates the specified file name is invalid. A file name is invalid if there is no file namespecified, if the first letter of the file name is not alphabetic, or if the specified file type doesnot match the type of file. See the description SAVRCLW or STOR programming command formore information. (U)
INVALID FILE: NO ROOMIndicates that there is insufficient space available on the memory card to store the data. (U)
INVALID BP-IB ADRWOPERATIONAn HP-IB operation was aborted due to an incorrect address or invalid operation. Check thatthere is only one controller (the spectrum analyzer) connected to the printer or plotter. (U)
INVALID BP-IB OPERATION REN TRUEThe HP-IB operation is not allowed. (This is usually caused by trying to print or plot when acontroller is on the interface bus with the spectrum analyzer.) lb use the spectrum analyzerprint or plot functions, you must disconnect any other controllers on the HP-IB. If you areusing programming commands to print or plot, you can use an HP BASIC command insteadof disconnecting the controller. See the description for the PRINT command for moreinformation. (U)
INVALID ITEM:- - _Indicates an invalid parameter has been used in a programming command. (U)
Spectrum Analyzer Error Messages A-5

INVALID KEYLBL: _ - -Indicates that the specified key label contains too many characters. A key label is limited to8 printable characters per label line. (U)
INVALID KEYNAME:- - -The specified key name is not allowed. (The key name may have conflicted with a spectrumanalyzer programming command.) lb avoid this problem, use an underscore as the secondcharacter in the key name, or avoid beginning the key name with the following pairs ofletters: LB, OA, OL, TA, TB, TR, MA, MF, TS, OT, and DR. (U)
INVALID OUTPUT FORMATThe output format is not valid. See the appropriate programming command description todetermine the correct format. (U)
INVALID RANGE: Stop < StartIndicates that the first trace element specified for a range of trace elements is larger thatending trace element. When specifying a trace range the starting element must be less thanthe ending element. For example, TRA[2,300] is legal but TRA[300,2] is not. (U)
INVALID REGISTER NUMBERThe specified trace register number is invalid. (U)
INVALID REPEAT MEM OVFLMemory overflow occurred due to a REPEAT routine. This can occur if there is not enoughspectrum analyzer memory for the REPEAT UNTIL declaration, or if the REPEAT UNTILdeclaration exceeds 2047 characters. (U)
INVALID REPEAT NEST LEVELThe nesting level in the REPEAT routine is improperly constructed. This can occur if toomany REPEAT routines are nested. When used within a downloadable program (DLP), themaximum number of REPEAT UNTIL statements that can be nested is 20. (U)
INVALID RS-232 ADRWOPERATIONAn RS-232 operation was aborted due to an invalid operation. (U)
INVALID SAVE REGData has not been saved in the specified state or trace register, or the data is corrupt. (U)
INVALID SCRMOVEIndicates the spectrum analyzer may have a hardware failure. See the spectrum analyzer’sService Guide for more information. (H)
INVALID START INDEXIndicates that the first trace element specified for a range of trace elements is not within thetrace range of the specified trace. (U)
INVALID STOP INDEXIndicates that the ending trace element specified for a range of trace elements is not withinthe trace range of the specified trace. (U)
INVALID STORE DEST: - - -The specified destination field is invalid. (U)
INVALID TRACE: _ _ _The specified trace is invalid. (U)
INVALID TRACE NAME: _ _ _The specified trace name is not allowed. Use an underscore as the second character in thetrace name, or avoid beginning the trace name with the following pairs of letters: LB, OA,OL, TA, TB, TR, MA, MF, TS, OT, and DR. (U)
A-6 Spectrum Analyzer Error Messages
INVALID TRACENAME: - - -Indicates the specified trace could not be saved because the trace name is not allowed. ‘lbavoid this problem, use an underscore as the second character in the trace name, or avoidbeginning the trace name with the following pairs of letters: LB, OA, OL, TA, TB, TR, MA,MF, TS, OT, and DR. (U)
INVALID VALUE PARAMETER: - - -The specified value parameter is invalid. (U)
INVALID VARDEF: - - -The specified variable name is not allowed. ‘Ib avoid this problem, use an underscore asthe second character in the variable label, or avoid beginning the variable label with thefollowing pairs of letters: LB, OA, OL, TA, TB, TR, MA, MF, TS, OT, and DR. (U)
INVALID WINDOW TYPE: _ _ _The specified window is invalid. See the description for the TWNDOW programmingcommand. (U)
LOST SIGNALFor the HP 8592L, HP 85933, or HP 85963, this message indicates that the cable from the100 MHz COMB OUT connector to the spectrum analyzer input is defective or has becomedisconnected during the CAL YTF routine. For the HP 85953, this message indicates that thecable from the CAL OUT connector is defective or has been disconnected during the CALYTF routine. Be sure to use a short, low-loss cable to connect the signal to the spectrumanalyzer input when performing the CAL YTF routine. (U)
LO UNLVLIndicates that the spectrum analyzer’s local oscillator distribution amplifier is not functioningproperly. (H)
Marker Count Reduce SPANIndicates the resolution bandwidth to span ratio is too small to use the marker countfunction. Check the span and resolution bandwidth settings. (U)
Marker Count Widen RES BWIndicates that the current resolution bandwidth setting is too narrow to use with the markercounter function. The marker counter function can be in narrow resolution bandwidths(bandwidths that are less than 1 kHz) with the following procedure:
1. Place the marker on the desired signal.2. Increase the resolution bandwidth to 1 kHz and verify the marker is on the signal peak.3. If the marker in on the signal peak, the marker count function can be used in either the
1 kHz resolution bandwidth or the original narrow resolution bandwidth setting. If themarker is not on the signal peak, it should be moved to the signal peak and the markercounter function should not be used with a resolution bandwidth setting of less than1 kHz.
uJ>MEAS UNCALThe measurement is uncalibrated. Check the sweep time, span, and bandwidth settings, orpress [AUTO COUPLE], AUTO AL+L . (U)
No card foundIndicates that the memory card is not inserted. (U)
No points definedIndicates the specified limit line or amplitude correction function cannot be performedbecause no limit line segments or amplitude correction factors have been defined. (U)
Spectrum Analyzer Error Messages A-7

OVEN COLDIndicates that the spectrum analyzer has been powered up for less than 5 minutes. (Theactual temperature of the precision frequency oven is not measured.) (Option 004 only.) (M)
PARAMETER ERROR: - - -The specified parameter is not recognized by the spectrum analyzer. See the appropriateprogramming command description to determine the correct parameters. (U)
PASSCODE NEEDEDIndicates that the function cannot be accessed without the pass code. (U)
POS-PK FAILIndicates the positive-peak detector has failed. (H)
REF UNLOCKIndicates that the frequency reference is not locked to the external reference input. Checkthat the 10 MHz REF OUT connector is connected to the EXT REF IN connector, or, whenusing an external reference, that an external 10 MHz reference source of sufficient amplitudeis connect to the EXT REF IN connector. (U) and (H)
Require 1 signal > PEAK EXCURSION above THRESHOLDIndicates that the N dB PTS routine cannot locate a signal that is high enough to measure.The signal must be greater than the peak excursion above the threshold level to measure. (U)
Require 3 signals > PEAK EXCURSION above THRESHOLDIndicates that the % AM routine cannot locate three signals that are high enough to measure.The signals must be greater than the peak excursion above the threshold level to measure.w>Require 4 signals > PEAK EXCURSION above THRESHOLDIndicates that the TOI routine cannot locate four signals that are high enough to measure.The signals must be greater than the peak excursion above the threshold level to measure.uJ>Required option not installed Some spectrum analyzer functions require that an optionbe installed in the spectrum analyzer. See the description for the function in the HP 8590E-Series and L-Series Spectrum Analgwrs User’s Guide for more information about whichoption is required. (U)
RES-BW NOISE FAILIndicates the noise floor level is incorrect at the indicated bandwidth. (H)
RES-BW SHAPE FAILIndicates the 3 dB bandwidth is not within specifications. (H)
RF PRESEL ERRORIndicates that the preselector peak routine cannot be performed. (H)
RF PRESEL TIMEOUTIndicates that the preselector peak routine cannot be performed. (H)
SAMPLE FAILIndicates the sample detector has failed. (H)
SETUP ERRORIndicates that the span, channel bandwidth, or channel spacing are not set correctly for theadjacent channel power or channel power measurement. (U)
SIGNAL CLIPPEDIndicates that the current FFT measurement sweep resulted in a trace that is above the topgraticule line on the spectrum analyzer display. If this happens, the input trace (trace A) hasbeen “clipped,” and the FFf data is not valid. (U)
A-8 Spectrum Analyzer Error Messages

Signal not foundIndicates the PEAK ZOOM routine did not find a valid signal. (U)
Signals do not fit expected % AM patternIndicates that the % AM routine cannot perform the percent AM measurement because theon-screen signals do not have the characteristics of a carrier with two sidebands. (U)
Signals do not flt expected TO1 patternIndicates that the TO1 routine cannot perform the third-order intermodulation measurementbecause the on-screen signals do not have the characteristics of two signals and twodistortion products. (U)
SMPLR UNLCKIndicates that the sampling oscillator circuitry is not functioning properly. If this messageappears, check that the external frequency reference is correctly connected to the EXT REFINPUT. (U) and (H)
SOFTKEY OVFLSoftkey nesting exceeds the maximum number of levels. (U)
SRQ _ _ -The specified service request is active. Service requests are a form of informational messageand are explained in Appendix A of the HP 8590 E-Series and LSeries Spectrum AnalyzersUser’s Guide. (M)
STEP GAIN/ATI’N FAILIndicates the step gain has failed. (H)
Stop at marker not available with negative detectionIndicates that the marker counter cannot be used when negative peak detection is selected.‘RI use the marker counter, turn off negative peak detection with DETECTOR PK 5P NG . (U)
EMPTY DLP MEMIndicates that the user-defined items (user-defined functions, user-defined variables,user-defined traces, user-defined softkeys) and any personalities (for example, the HP 85716ACATV System Monitor Personality) in the spectrum analyzer’s memory have been deleted.If this message appears, use ERASE DLP NEM to clear spectrum analyzer memory. If themessage is still displayed, it may indicate a hardware failure. See the spectrum analyzer’sService Guide for more information. (U)
TABLE FULLIndicates the upper or lower table of limit lines contains the maximum number of entriesallowed. Additional entries to the table are ignored. (U)
TG SIGNAL NOT FOUNDIndicates the tracking generator output signal cannot be found. Check that the trackinggenerator output (RF OUT 500 or RF OUT 75Q) is connected to the spectrum analyzer inputconnector with an appropriate cable. (U)
TG UNLVLThis message can indicate the following: that the source power is set higher or lower thanthe spectrum analyzer can provide, that the frequency span extends beyond the specifiedfrequency range of the tracking generator, or that the calibration data for the trackinggenerator is incorrect. See “Stimulus-Response Measurements” in Chapter 4 of the HP 8590E-Series and LSeries Spectrum Analyzers User’s Guide for more information. (U)
Too many signal with valid N dB pointsIndicates the N dB PTS function has located two or more signals that have amplitudes withinthe specified dB from the signal peak. If this happens, you should decrease the span of thespectrum analyzer so that only the signal that you want to measure is displayed. (U)
Spectrum Analyzer Error Messages A-9
Trace A is not availableIndicates that trace A is in the store-blank mode and cannot be used for limit-line testing.Use CLEAR WRfTE A or VIEW A to change trace A from the store-blank mode to the clearwrite mode, and then turn on limit-line testing. (U)
UNDF KEYThe softkey number is not recognized by the spectrum analyzer. (U)
USING DEFAUIXS self cal neededIndicates that the current correction factors are the default correction factors and thatthe CAL FREQ & AMPTD routine needs to be performed. For the HP 8592L, HP 85933,HP 85953, or HP 85963, CAL YTF routine needs to be performed also. (U)
Verify gate trigger input is disconnected before CAL AMPTDThis message is meant to remind you that nothing should be connected to the GATETRIGGER INPUT connector on the spectrum analyzer’s rear panel during the CAL AMPT.Droutine. (U)
VID-BW FAILIndicates the video bandwidths have failed. (H)
Waiting for gate input . . .Indicates that the spectrum analyzer needs an external trigger signal to use the time-gatingfunctions. Before using the time-gating functions, you should ensure there is a trigger pulseconnected to the GATE TRIGGER INPUT connector on the rear panel of spectrum analyzerand that the GATE OUTPUT is connected the EXT TRIG INPUT connector. If you do notwant to use the time-gating functions, press c-1. (U)
YTF is not availableThe YTF is only available for the HP 8592L, HP 85933, HP 85953, and HP 85963. (U)
A-10 Spectrum Analyzer Error Messages

BHP-IB and Parallel Option 041
This appendix tells you how to connect a computer to your HP 8590 Series Option 041spectrum analyzer with the Hewlett-Packard Interface Bus (HP-IB).
Your spectrum analyzer has an HP-IB connector on the rear panel, as shown in Figure B-l.
‘ 0 P A R A L L E L 0@c-j@ @
n
00
n
O P T I O N 0 4 1
Figure B-l. HP-IB Connector
cu133e
The HP-IB system utilizes a party-line bus structure. Devices such as the spectrum analyzerare connected on the party line with HP-IB cables. A computer gives instructions and is the“controller. ” The spectrum analyzer takes orders and is the “listener.” The spectrum analyzeris also capable of transmitting data over the party line. Devices that transmit data back to thecomputer are “talkers. n
Each device on the party line has an address. Device addresses are used by the controller tospecify who talks and who listens. A device’s address is usually set at the factory.
The number 7 preceding the device’s address (for example, Analyzer=718), signifies that theHP-IB interface is selected.
When you turn on the spectrum analyzer, the HP-IB address appears on the screen (forexample, HP-IB ADRS : 18). If necessary, you can reset the address of the spectrum analyzer bypressing @fiFiF], More 2 of 3 , AWLYZER ADDRESS , entering in the address number usingthe front-panel number keys, then pressing Cm]. You may use any address between 0 and30. (Usually, 1 is reserved for printers and 5 for plotters.)
HP-IB and Parallel Option 041 B-1
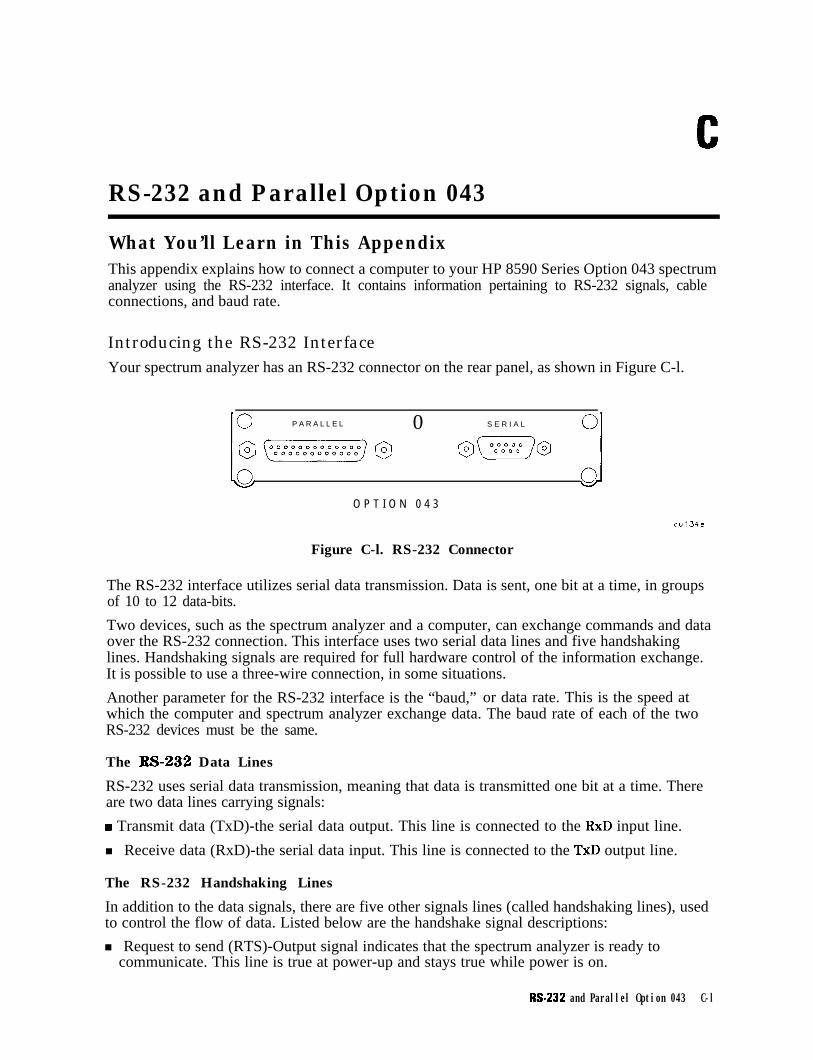
CRS-232 and Parallel Option 043
What You’ll Learn in This AppendixThis appendix explains how to connect a computer to your HP 8590 Series Option 043 spectrumanalyzer using the RS-232 interface. It contains information pertaining to RS-232 signals, cableconnections, and baud rate.
Introducing the RS-232 InterfaceYour spectrum analyzer has an RS-232 connector on the rear panel, as shown in Figure C-l.
lo P A R A L L E L 0 S E R I A L
10. .oJv
O P T I O N 0 4 3
V
cu134e
Figure C-l. RS-232 Connector
The RS-232 interface utilizes serial data transmission. Data is sent, one bit at a time, in groupsof 10 to 12 data-bits.
Two devices, such as the spectrum analyzer and a computer, can exchange commands and dataover the RS-232 connection. This interface uses two serial data lines and five handshakinglines. Handshaking signals are required for full hardware control of the information exchange.It is possible to use a three-wire connection, in some situations.
Another parameter for the RS-232 interface is the “baud,” or data rate. This is the speed atwhich the computer and spectrum analyzer exchange data. The baud rate of each of the twoRS-232 devices must be the same.
The W-232 Data Lines
RS-232 uses serial data transmission, meaning that data is transmitted one bit at a time. Thereare two data lines carrying signals:
w Transmit data (TxD)-the serial data output. This line is connected to the RxD input line.
n Receive data (RxD)-the serial data input. This line is connected to the TxD output line.
The RS-232 Handshaking Lines
In addition to the data signals, there are five other signals lines (called handshaking lines), usedto control the flow of data. Listed below are the handshake signal descriptions:
n Request to send (RTS)-Output signal indicates that the spectrum analyzer is ready tocommunicate. This line is true at power-up and stays true while power is on.
M-232 and Parallel Option 043 C-l

n Clear to send (CTS)-Input signal indicates that the external controller is ready to receivedata.
n Data terminal ready (DTR)-Output signal from the spectrum analyzer. When the input bufferis full, this line goes false.
n Data set ready (DSR)-Is not available.
n Data carrier detect (DCD)-Input to the spectrum analyzer. If DCD is true, the spectrumanalyzer will receive data from the controller. If false, no data will be input. The data willbe ignored.
The spectrum analyzer checks its CTS input before transmitting data to the computer. If theCTS line is false, the spectrum analyzer will not transmit data. The spectrum analyzer transmitsdata when the CTS line is true.
The spectrum analyzer sets the DTR line (PC CTS) false when its input buffer is full.
Baud RateThe speed at which data is exchanged is called the baud rate or data rate, This is usuallyexpressed in baud or bits per second. Common baud rates are 1200 and 9600.
Note Some of the programs in this manual use 1200 baud for proper operation. Ifyour system uses the RS-232 handshake lines, you can use 9600 baud for all ofthe programs.
If you need to change the baud rate, refer to the “Setting the Spectrum Analyzer Baud Rate” inthis appendix.
ProtocolThe RS-232 protocol is as follows:
Baud rate 300 to 57,000 baud.8 bits per character.1 stop bit.No parity.Software handshake-none.Xon/Xoff and ENQ/ACK not supported by the spectrum analyzer.
When BREAK is issued to the spectrum analyzer, the following occurs:
1. The present command is aborted.2. The input buffer is cleared.3. The output buffer is cleared.4. All trace output is stopped.5. The command parser is reinitialized.
BREAK does not perform any of the following:
n Invoke instrument preset.n Clear SRQ off screen.H Clear illegal command off screen.
The RTS signal goes true on power-up and does not go false during any communication. It staystrue while power is on.
Figure C-2 and Figure C-3 lists the signal connections between a personal computer and thespectrum analyzer.
C-2 RS-232 and Parallel Option 043

Person0 c o m p u t e r A n a l y z e r
TxD 2 > > 2 RxD
RxD 3 3 TxD
RTS 4
s
1 DCD
;a; ,” 4 DTR
GND 7
DCD 8
DTR 2 0
n o c o n n e c t i o n 9 RI
cu135e
Figure C-2. HP 245426 25-pin to g-pin Full Handshaking Connection
P e r s o n a l C o m p u t e r A n a l y z e r
DCD 1 < < 7 RTS
RxD 2
TxD 3
DTR 4
GND 5
RTS 7
I:: ,” z
5 GND
1 DCD
4 DTR
RI 9 n o c o n n e c t i o n 9 RI
cu136e
Figure C-3. HP 24542U g-pin to g-pin Full Handshaking Connection
If your computer operates with only three wires, you can use the cable connections inFigure C-4.
Some computers require that the CTS, DSR, and DCD inputs be true before serial transmissioncan occur. lb solve this problem, you can wire these three signals to the personal computerRTS line.
P e r s o n a l C o m p u t e r A n a l y z e r
TxD 2 > > 2 RxD
RxD 3 < < 3 TxD
GND 7 < < 5 GND
E 8 7 1 CTS RTS DCD
cu137e
Figure C-4. 25-pin to O-pin S-Wire Connection
M-232 and Parallel Option 043 C-3

P e r s o n a l C o m p u t e r
RxD 2 <
TxD 3 >
GND 5 <
A n a l y z e r
< 3 TxD
> 2 RxD
< 5 GND
7 RTS
6 CTS
1 DCD
Figure C-5. O-pin to g-pin S-Wire Connection
Connecting a ThinkJet Printerlb connect an HP ThinkJet printer to the spectrum analyzer, use the information in Figure C-6,‘lhble C-l, ‘Iable C-2, and ‘Ihble C-3. Be sure to turn the printer off and then back on u$erchanging the printer settings. See the ThinkJet Printer Manual for more information.
ThinkJet R S - 2 3 2 A n a l y z e r
TxD 2
RxD 3
RTS 4
CTS 5
DSR 6
GND 7
DCD 8
DTR 20
> > 2 RxD
3 TxD
1 DCD
e 4 D T R
n o c o n n e c t i o n 9 RI
cul4le
Figure C-6. 25-pin to g-pin ThinkJet Printer Connection
ThinkJet Printer Mode Switches:
lhble C-l. S !tting of Thinkjet Printer Mode Switches
Comments
Printer performs a carriage return only.Printer performs a line feed only.Sets the printer to skip paper perforations.Sets the printer for a paper length of 11 inches.Sets the printer to HP MODE.
Sets the printer to USASCII.
C-4 RS-232 and Parallel Option 043

able G2. Setting of RS-232 Switches
1 Switch 1 Setting 1 Comments 1Number 1
-
II 1 IUD 1 DTR. I
‘Ihble C-3. Setting the Baud Rate
Baud Setting for Setting forRate Switch 4 Switch 51200 up up2400 up down9600 down down
Connecting a LaserJet Printer‘lb connect an HP LaserJet printer to the spectrum analyzer, use the information in Figure C-7.
L a s e r J e t 4P/4MP AnOlYZer
RTS 1
TxD 2
RxD 3
DSR 4
GND 5
DTR 6
nc 7
DTR 6
nc 9
> > 1 DCD
> > 2 RxD
( < 3 TxD
< < 4 DTR
< < 5 GND
> > 6 DSR
- - - o p t ionol--- 7 RTS
> > 0 C T S
---ootionol--- 7 RI
cu139e
Figure G7. HP C2932A g-pin to g-pin LaserJet Printer Connection
RS-232 and Parallel Option 043 C-5

Connecting a ModemTo connect a modem to the spectrum analyzer, use the information in Figure C-8. Theconnection is for a Hayes 1200 Modem and the spectrum analyzer.
Modem Allalyzer
TxD 2
RrD 3
RTS 4
CTS 5
DSR 6
GND 7
DCD 8
DTR 20
RI 22
< < 3 TxD
> > 2 RxD
< > 7 RTS
\> 8 CTS
< > 6 DSR
< < 5 GND
> > 1 DCD
< < 4 DTR
n o c o n n e c t i o n 9 RI
cu140e
System Settings
Figure C-8. 25-pin to g-pin Modem Connection
Select 1200 baud for both the modem and the spectrum analyzer.
Connecting an HP-GL Plotter‘Lb connect an HP-GL plotter to the spectrum analyzer, use the information in Figure C-9.
P l o t t e r Atlalvzer
GND 1
TxD 2
RxD 3
RTS 4
C T S 5
DSR 6
GND 7
DTR 20
< > 1 GND
> > 3 RxD
< < 2 TxD
8 DCD
F *O DTR
< 7 GND
> > 5 C T S
cul13e
Switch Settings
Figure C-9. HP-GL Plotter Connection
Set the switches on the HP-GL plotter to the following settings. Set the baud rate of the plotterand spectrum analyzer to the same value. After setting the switch positions, turn plotter off,then on again.
Switch Position Switch PositionExpand: 4 Parity: ) (Off)Emulate: 1 Even/Odd: ) (Odd)Stand-alone: 4 Duplex: ) (Full)Monitor Mode: ) (normal) Hardwire: ILocal ) (normal) DTR-Bypass: ) (normal)
C-6 M-232 and Parallel Option 043

Setting the Spectrum Analyzer Baud RateThe baud rates of the spectrum analyzer and the personal computer must be the same. Forexample, to set the spectrum analyzer to 9600 baud, use the following procedure:
1. Press the @5EiZJ Mars 1 of 3 .
2. Press the BAUD RATE softkey.
3. Press these keys: 9600,1Hz). lb set the baud rate to 1200 baud, press these keys: 1200, (KJ.
Note Some of the programs in this manual use 1200 baud for proper operation. Ifyour system uses the RS-232 handshake lines, you can use 9600 baud for all ofthe programs.
RS-232 and Parallel Option 043 C-7

Index
A
A2, 5-9A3, 5-9A4, 5-9A-block format, 3-24ABORT, 5-29
executing ABORT in a DLP, 5-30ABS, 5-31absolute value, 5-31access the DLP editor, 4-16ACP, 5-33ACPBW, 5-35ACPCONTM, 5-37ACPE, 5-38ACPGR, 5-40ACPGRAPH, 5-42ACP manual or auto, 5-44ACPMK, 5-43ACPPAR, 5-44ACPSNGLM, 5-46ACPSP, 5-47ACTDEF, 5-49activate marker, 5-327active function, 5-54, 5-228
decreasing value with DN, 5-137active function definition, 5-49active functions, 5-54ACTVF, 5-54ADD, 5-55address
changing the HP-IB address, B-lHP-IB operation, B- 1
adjacent channel power, 5-33adjacent channel power extended, 5-38ADJ CHAN POWER softkey. See ACPADJ CHAN PWR extd softkey. See ACPEALC INT EXT, ALC MTR INT XTAL softkey.
See SRCALCA ++ B softkey. See AXBalternate commands, 5-9-10AMB, 5-57AMBPL, 5-60% AM commands
percent AM (PCTAM), 5-416percent AM response (PCTAMR), 5-418
A - B -, A ON OFF softkey. See AMB% AM ON OFF softkey. See FFTPCTAM,
PCTAMAMPCOR, 5-62Amp Cor softkey. See AMPCORAMPLEN, 5-64amplitude
marker type, 5-364amplitude correction, 5-62amplitude correction factors. See frequency-
amplitude correction factorsamplitude correction length, 5-64amplitude units, 5-4, 5-71Amptd Units softkey. See AUNITSanalog display emulation, 5-65Analog+ display mode
with AMPCOR, 5-63with LIMIDISP, 5-270
ANALOG + ON OFF softkey. See ANLGPLUSanalog plus, 5-65analyzer command, 5-3ANLGPLUS, 5-65ANNOT, 5-67annotation, 5-67ANNOTATN ON OFF softkey. See ANNOTAPB, 5-68APND CAT ITEM softkey, 4-19AT, 5-69ATTEN AUTO MAN softkey. See ATattenuation, 5-69AUNITS, 3-21, 5-71AUTO, 5-72auto couple, 5-72auxiliary interface control line A, 5-106auxiliary interface control line B, 5-107auxiliary interface control line C, 5-108auxiliary interface control line D, 5-109auxiliary interface control line I, 5-110average, 5-73average detection, 5-l 13average noise level at the marker
MKNOISE, 5-344AVG, 5-73AXB, 5-75
Index-l
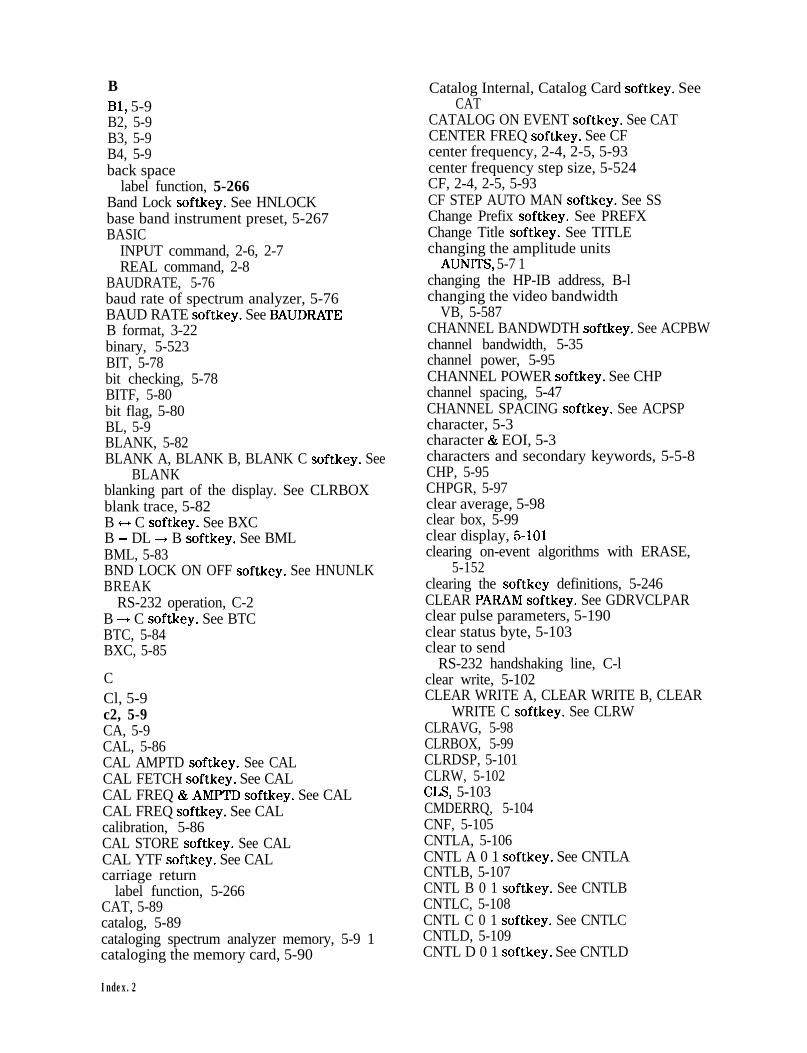
BBl, 5-9B2, 5-9B3, 5-9B4, 5-9back space
label function, 5-266Band Lock softkey. See HNLOCKbase band instrument preset, 5-267BASIC
INPUT command, 2-6, 2-7REAL command, 2-8
BAUDRATE, 5-76baud rate of spectrum analyzer, 5-76BAUD RATE softkey. See BAUDRATEB format, 3-22binary, 5-523BIT, 5-78bit checking, 5-78BITF, 5-80bit flag, 5-80BL, 5-9BLANK, 5-82BLANK A, BLANK B, BLANK C softkey. See
BLANKblanking part of the display. See CLRBOXblank trace, 5-82B * C softkey. See BXCB - DL + B softkey. See BMLBML, 5-83BND LOCK ON OFF softkey. See HNUNLKBREAK
RS-232 operation, C-2B + C softkey. See BTCBTC, 5-84BXC, 5-85
CCl, 5-9c2, 5-9CA, 5-9CAL, 5-86CAL AMPTD softkey. See CALCAL FETCH softkey. See CALCAL FREQ & AMPT.D softkey. See CALCAL FREQ softkey. See CALcalibration, 5-86CAL STORE softkey. See CALCAL YTF softkey. See CALcarriage return
label function, 5-266CAT, 5-89catalog, 5-89cataloging spectrum analyzer memory, 5-9 1cataloging the memory card, 5-90
Catalog Internal, Catalog Card softkey. SeeCAT
CATALOG ON EVENT softkey. See CATCENTER FREQ softkey. See CFcenter frequency, 2-4, 2-5, 5-93center frequency step size, 5-524CF, 2-4, 2-5, 5-93CF STEP AUTO MAN softkey. See SSChange Prefix softkey. See PREFXChange Title softkey. See TITLEchanging the amplitude units
AUNITS, 5-7 1changing the HP-IB address, B-lchanging the video bandwidth
VB, 5-587CHANNEL BANDWDTH softkey. See ACPBWchannel bandwidth, 5-35channel power, 5-95CHANNEL POWER softkey. See CHPchannel spacing, 5-47CHANNEL SPACING softkey. See ACPSPcharacter, 5-3character & EOI, 5-3characters and secondary keywords, 5-5-8CHP, 5-95CHPGR, 5-97clear average, 5-98clear box, 5-99clear display, 5-101clearing on-event algorithms with ERASE,
5-152clearing the softkey definitions, 5-246CLEAR PARAM softkey. See GDRVCLPARclear pulse parameters, 5-190clear status byte, 5-103clear to send
RS-232 handshaking line, C-lclear write, 5-102CLEAR WRITE A, CLEAR WRITE B, CLEAR
WRITE C softkey. See CLRWCLRAVG, 5-98CLRBOX, 5-99CLRDSP, 5-101CLRW, 5-102CLS, 5-103CMDERRQ, 5-104CNF, 5-105CNTLA, 5-106CNTL A 0 1 softkey. See CNTLACNTLB, 5-107CNTL B 0 1 softkey. See CNTLBCNTLC, 5-108CNTL C 0 1 softkey. See CNTLCCNTLD, 5-109CNTL D 0 1 softkey. See CNTLD
Index.2

CNTLI, 5-110CNT RES AUTO MAN softkey. See MKFCRCOMB, 5-111comb generator control
COMB, 5-l 11COMB GEN ON OFF softkey. See COMBcombining two traces, 5-114COM command, 2-3command complete, 5-522command mnemonic, 5-2commands, 2-2command terminators, 5-2commenting programming lines, 2-10compatible commands, 5-9-10COMPRESS, 5- 112compress trace, 5-l 12COMPUTE ACPGRAPH softkey. See
ACPGRAPHcompute the adjacent channel power graph,
5-42CONCAT, 5-l 14concatenate, 5- 114confidence test, 5- 105configuring your computer system, l-lCONF TEST softkey. See CNFconnecting a modem
RS-232 operation, C-6connecting your spectrum analyzer to a
printer or plotter, l-11connection an HP-GL plotter (RS-232
operation), C-6continuous sweep, 5-l 16continuous sweep measurement, 5-37CONTINUS FFT softkey. See FFTCONTSCONT MEAS softkey. See ACPCONTMcontrolling the marker counter, 5-338controlling trace data with a computer, 3-2CONTS, 5-l 16convert to absolute units, 5-121convert to measurement units, 5-123copying the source to a destination
MOV, 5-370COPY key. See PLOT, PRINTcorrection factors on, 5-117CORRECT ON OFF softkey. See CAL, CORREKCORREK, 5-l 17COUPLE, 5-l 18COUPLE AC DC softkey. See COUPLEcouple resolution bandwidth to pulse width,
5-202couple sweep time to pulse repetition interval,
5-206couple video bandwidth to gate length, 5-215CPL RBW ON OFF softkey. See GDRVRBWCPL SWP ON OFF softkey. See GDRVST
CPL VBW ON OFF softkey. See GDRVVBWCR, 5-9create a DLP with the DLP editor, 4-17creating a DLP, 4-2creating a modular DLP, 4-7creating a trace window, 5-578creating a user-defined trace, 5-562creating a user-defined variable, 5-583CRT HORZ POSITION softkey. See CRTHPOSCRTHPOS, 5-l 19CRT VERT POSITION softkey. See CRTVPOSCRTVPOS, 5-120cs, 5-9CT, 5-9CTA, 5-121CTM, 5-123CTS
RS-232 handshaking line, C-lcurrent units, 5-4cv, 5-9
DDA, 5-124data byte, 5-3data byte & EOI, 5-3data carrier detect
RS-232 handshaking line, C-2data entry
disabling, 5-228data lines
RS-232, C-ldata terminal ready
RS-232 handshaking line, C-2date mode, 5-127DATEMODE, 5-127DATEMODE MDY DMY softkey. See
DATEMODEDCD
RS-232 handshaking line, C-2DEFAULT CAL DATA softkey. See CALDEFAULT SYNC softkey. See SYNCMODEdefine function, 5-184define terminator, 5-145delay sweep for time window, 5-209DELETE FILE softkey. See DISPOSE, PURGEdelete limit-line table, 5-269deleting a DLP from analyzer memory, 4-14deleting a file from a RAM card, 5-453deleting on event commands, 5-132deleting softkeys, 5-132delimiter, 5-3delta
marker type, 5-364DEMOD, 5-128DEMOD ON OFF softkey. See DEMOD
Index-3
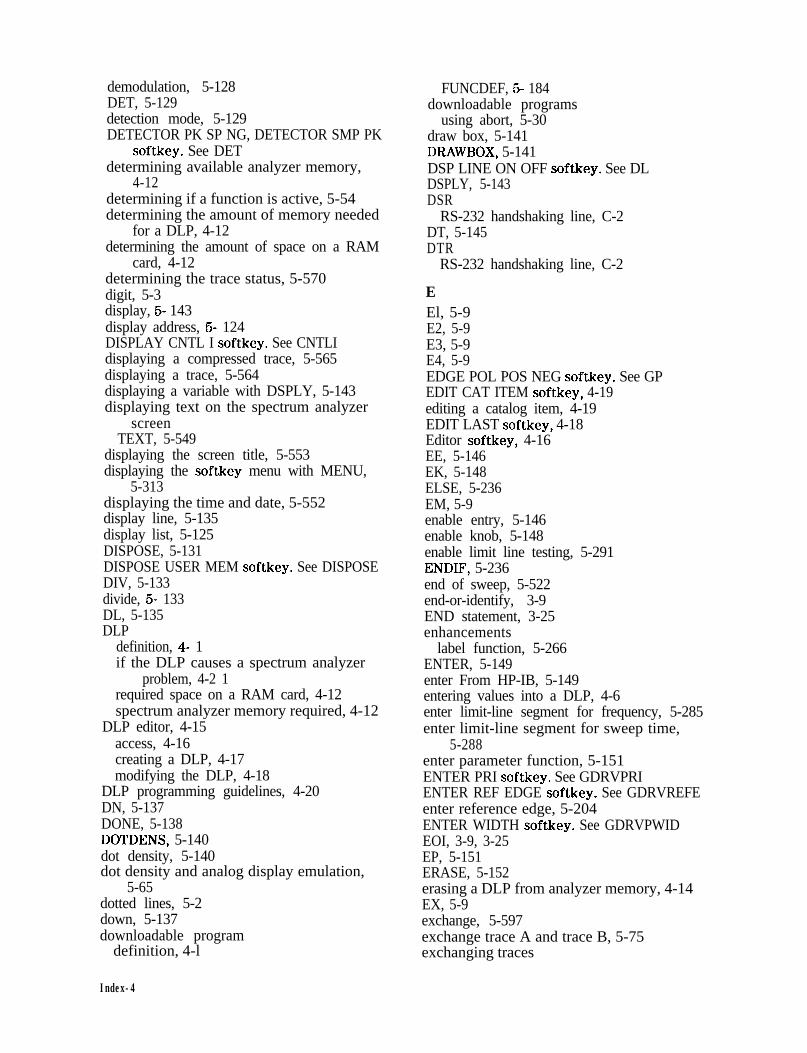
demodulation, 5-128DET, 5-129detection mode, 5-129DETECTOR PK SP NG, DETECTOR SMP PK
softkey. See DETdetermining available analyzer memory,
4-12determining if a function is active, 5-54determining the amount of memory needed
for a DLP, 4-12determining the amount of space on a RAM
card, 4-12determining the trace status, 5-570digit, 5-3display, 5- 143display address, 5- 124DISPLAY CNTL I softkey. See CNTLIdisplaying a compressed trace, 5-565displaying a trace, 5-564displaying a variable with DSPLY, 5-143displaying text on the spectrum analyzer
screenTEXT, 5-549
displaying the screen title, 5-553displaying the softkey menu with MENU,
5-313displaying the time and date, 5-552display line, 5-135display list, 5-125DISPOSE, 5-131DISPOSE USER MEM softkey. See DISPOSEDIV, 5-133divide, 5- 133DL, 5-135DLP
definition, 4- 1if the DLP causes a spectrum analyzer
problem, 4-2 1required space on a RAM card, 4-12spectrum analyzer memory required, 4-12
DLP editor, 4-15access, 4-16creating a DLP, 4-17modifying the DLP, 4-18
DLP programming guidelines, 4-20DN, 5-137DONE, 5-138DOTDENS, 5-140dot density, 5-140dot density and analog display emulation,
5-65dotted lines, 5-2down, 5-137downloadable program
definition, 4-l
FUNCDEF, 5- 184downloadable programs
using abort, 5-30draw box, 5-141DRAWBOX, 5-141DSP LINE ON OFF softkey. See DLDSPLY, 5-143DSR
RS-232 handshaking line, C-2DT, 5-145DTR
RS-232 handshaking line, C-2
EEl, 5-9E2, 5-9E3, 5-9E4, 5-9EDGE POL POS NEG softkey. See GPEDIT CAT ITEM softkey, 4-19editing a catalog item, 4-19EDIT LAST softkey, 4-18Editor softkey, 4-16EE, 5-146EK, 5-148ELSE, 5-236EM, 5-9enable entry, 5-146enable knob, 5-148enable limit line testing, 5-291ENDIF, 5-236end of sweep, 5-522end-or-identify, 3-9END statement, 3-25enhancements
label function, 5-266ENTER, 5-149enter From HP-IB, 5-149entering values into a DLP, 4-6enter limit-line segment for frequency, 5-285enter limit-line segment for sweep time,
5-288enter parameter function, 5-151ENTER PRI softkey. See GDRVPRIENTER REF EDGE softkey. See GDRVREFEenter reference edge, 5-204ENTER WIDTH softkey. See GDRVPWIDEOI, 3-9, 3-25EP, 5-151ERASE, 5-152erasing a DLP from analyzer memory, 4-14EX, 5-9exchange, 5-597exchange trace A and trace B, 5-75exchanging traces
Index-4

XCH, 5-598excursion
marker peak excursion, 5-352executing a DLP, 4-9executing a DLP with a softkey, 4-9executing a DLP within a program, 4-9EXP, 5-153exponent, 5-153external keyboard, 4-15external keyboard installation, 4-15external preamplifier gain, 5-445EXTERNAL softkey. See TMexternal trigger mode, 5-554
FFA, 5-156fast Fourier transform, 5-160
creating a trace window, 5-578marker readout, 5-354
FB, 5-158FFT, 5-160
creating a trace window, 5-578FFTAUTO, 5- 164FFICLIP, 5- 166FFT continuous sweep, 5-167FFTCONTS, 5- 167FFT marker readout, 5-354FFT markers, 5-168FFI’ MARKERS softkey. See FFTMKRFFI’ marker to FFT stop frequency, 5-170FFT marker to midscreen, 5-169FFI’ menu commands
FFI’ continuous sweep (FFI’CONTS), 5-167FFT markers (FFTMKR), 5-168FFI’ marker to FFT stop frequency (FFI’MS),
5-170FFT marker to midscreen (FFTMM), 5-169FFT off (FFTOFF), 5-171FFT percent AM (FFTPCTAM), 5-172FFT percent AM readout (FFTPCTAMR),
5-173FFI’ signal clipped (FFTCLIP), 5-166FFI’ single sweep (FFTSNGLS), 5-174FFI status (FFTSTAT), 5-176FFI’ stop frequency (FFTSTOP), 5-177marker to auto FFI’ (FFI’AUTO), 5-164
FFTMKR, 5-168FFTMM, 5-169FFTMS, 5-170FFT Off, 5-171FFTOFF, 5-171FF”I’ OFF softkey. See FFTOFFFFTPCTAM, 5-172FFTPCTAMR, 5- 173FFI’ percent AM, 5-172
FFT percent AM readout, 5-173FFT signal clipped, 5-166FFT single sweep, 5-174FFTSNGLS, 5-174FFTSTAT, 5-176FFT status, 5-176FFTSTOP, 5-177FFl’ stop frequency, 5-177field width, 5-143field width and decimal places specified
OUTPUT, 5-411finding the absolute value, 5-31finding the maximum
MXM, 5-375finding the minimum value, 5-319fixed
marker type, 5-364FLATTOP filter
FFT, 5-161FM gain, 5-179FMGAIN, 5-179FM GAIN softkey. See FMGAINFOFFSET, 5-180force service request, 5-520FORMAT, 5-182format card, 5-182FORMAT CARD softkey. See FORMATform feed
label function, 5-266frame
selecting the type of video frame, 5-573free-field ASCII format
OUTPUT, 5-411free-field ASCII with carriage return and line
feed terminatorOUTPUT, 5-4 11
free-field ASCII with line feed and an EOIterminator
OUTPUT, 5-4 11free-field format with no terminator
OUTPUT, 5-4 11FREE RUN softkey. See TMfree trigger mode, 5-554FREQ OFFSET softkey. See FOFFSETfrequency
marker readout, 5-354start frequency, 5-157
frequency-amplitude correction factorsnumber of, 5-64
frequency offset, 5-180frequency units, 5-4FS, 5-183full span, 5-183FULL SPAN softkey. See FSFUNCDEF, 5- 184
Index-5

FUNCDEF commandavoiding problems, 4-3
functional index, 5-1, 5-11-28function keys on the external keyboard,
4-16
GGATE, 5-186gate control, 5-187GATECTL, 5-187GATE CTL EDGE LVL softkey. See GATECTLgate delay, 5-189, 5-191GATE DELAY softkey. See GD, GDRVGDELgate length, 5-193GATE LENGTH softkey. See GDRVGLEN,
GLGATE ON OFF softkey. See GATE, GDRVGTgate polarity, 5-222gate preset, 5-188gate time length, 5-221gate trigger to marker position for time
window, 5-196gate utility, 5-213gate utility commands
clear pulse parameters (GDRVCLPAR),5-190
couple resolution bandwidth to pulse width(GDRVRBW), 5-202
couple sweep time to pulse repetitioninterval (GDRVST), 5-206
couple video bandwidth to gate length(GDRVVBW), 5-215
delay sweep for time window(GDRVSWDE), 5-209
enter reference edge (GDRVREFE), 5-204gate delay for the frequency window
(GDRVGDEL), 5-191gate length for the frequency and time
windows (GDRVGLEN), 5-193gate trigger to marker position for time
window (GDRVGTIM), 5-196gate utility (GDRVUTIL), 5-213pulse repetition interval (GDRVPRI), 5-198pulse width (GDRVPWID), 5-200sweep time for the time window
(GDRVSWP), 5-211update the time or frequency window
(GDRVSWAP), 5-208window gate control (GDRVGT), 5-194
GATE UTILITY softkey. See GDRVUTILGC, 5-188GD, 5-189GDRVCLPAR, 5-190GDRVGDEL, 5-191GDRVGLEN, 5-193
GDRVGT, 5- 194GDRVGTIM, 5-196GDRVPRI, 5-198GDRVPWID, 5-200GDRVRBW, 5-202GDRVREFE, 5-204GDRVST, 5-206GDRVSWAP, 5-208GDRVSWDE, 5-209GDRVSWP, 5-2 11GDRVUTIL, 5-2 13GDRVVBW, 5-215Get Plot, 5-217GETPLOT, 5-2 17Get Print, 5-219GETPRNT, 5-2 19GL, 5-221GP, 5-222GR, 5-223graph, 5-223graphics
entering graphics in the display list, 5-125GRAT, 5-224graticule, 5-224GRAT ON OFF softkey. See GRATGW BASIC
OPEN command, 3-5GW BASIC DIM, 3-11
Hhandshaking connection
RS-232 operation, C-2handshaking lines
RS-232, C-lHANNING filter
FFT, 5-161hardware broken, 5-522hardware error messages, A-lharmonic number, 5-229harmonic number lock, 5-230HAVE, 5-225HD, 5-228Hewlett-Packard interface bus, B-lHN, 5-229HNLOCK, 5-230HNUNLK, 5-233hold data entry, 5-228HOLD softkey. See HDhorizontal position of CRT display, 5-119HP 9000 Series 200 technical computers, l-3HP 9000 Series 300 technical computers, l-5HP BASIC
CLEAR command, 2-2CREATE command, 3-4DIM command, 3-9
Index-6

END command, 2-2ENTER, 3-9LOCAL command, 2-2REAL command, 2-6USING command, 3-9
HP-IB interface, l-2HP-IB interface bus, B-lHP Vectra personal computer
HP-IB interface, l-7RS-232 interface, l-9
IIB, 5-234I-block format, 3-25ID, 5-235identify, 5-235IF THEN ELSE ENDIF, 5-236if the spectrum analyzer is not responding,
4-21illegal spectrum analyzer command, 5-522impedance
INZ, 5-241impedance units, 5-4increasing the value
UP, 5-579informational messages, A-linput B, 5-234input impedance, 5-241INPUT Z 503 753 softkey. See INZinstallation, external keyboard, 4-15instrument preset, 2-2, 2-3, 5-242INT, 5-239integer, 5-239integer number range, 5-3interface bus
RS-232, C-lINTERNAL + STATE softkey. See RCLSInternal ---) Trace softkey. See RCLTinterpolated data. See LINFILLinverse sweep time
marker readout, 5-354inverse video
label function, 5-266inverse video for softkey labels, 5-255INZ, 5-241IP, 2-2, 2-3, 5-242
Kkeyboard, external, 4-15key clear, 5-246KEYCLR, 5-246KEYCMD, 5-247key command, 5-247KEYDEF, 5-251KEYENH, 5-255
key enhance, 5-255KEYEXC, 5-260key execute, 5-260key label, 5-261KEYLBL, 5-261knob
enabling knob with EP, 5-148KSA, 5-9KSB, 5-9KSc, 5-9KSC, 5-9KSE, 5-9KSG, 5-9KSH, 5-9KSi, 5-9KSI, 5-9KSm, 5-9KSM, 5-9KSn, 5-9KSo, 5-9KSO, 5-9KSp, 5-9KSZ, 5-9
LLO, 5-9label, 5-263label functions, 5-266last span, 5-301LAST SPAN softkey. See LSPANLB, 5-263LF, 3-9, 5-267LG, 5-268LIMIDEL, 5-269LIMIDISP, 5-270LIMIFAIL, 5-272LIMIFT, 5-274LIMIHI, 5-275LIMILINE, 5-276LIMILO, 5-279LIMIMIRROR, 5-280LIMIMODE, 5-281LIMIREL, 5-283LIMISEG, 5-285LIMISEGT, 5-288LIMITEST, 5-291limit line
entry mode, 5-281limit line display, 5-270limit lines, 5-276
enable limit line testing, 5-291enter limit-line segment for frequency,
5-285enter limit-line segment for sweep time,
5-288
Index-7

limits failed, 5-272mirror limit line, 5-280relative limit lines, 5-283
limits failed, 5-272linear scale, 5-295line-feed, 3-9line feed
label function, 5-266line fill, 5-293line number
TVLINE, 5-572LINE softkey. See TMline trigger mode, 5-554LINFILL, 5-293LMT DISP Y N AUTO softkey. See LIMIDISPLN, 5-295LOAD, 5-296LOAD FILE softkey. See LOADloading a file from the memory card, 5-296loading DLPs from a memory card into
analyzer memory, 4-11LOG, 5-298logarithm, 5-298logarithmic scale, 5-268log to linear conversion, 5-153lower limit line, 5-279lsb length, 5-3LSB length, 3-24LSPAN, 5-301
MMl, 5-10M2, 5-10M3, 5-10M4, 5-378MA, 5-10making the DLP more readable, 4-20MAN TRK ADJUST softkey. See SRCTKMARKER ALL OFF softkey. See MKOFFMarker Amplitude, 5-325MARKER AMPTD softkey. See MKTYPEmarker as the active function, 5-328marker bandwidth, 5-329marker continue, 5-331marker counter, 5-338marker counter resolution, 5-339marker delta, 5-332marker delta display line mode, 5-334marker frequency, 5-336marker frequency output, 5-317marker minimum, 5-341marker noise, 5-344marker normal, 5-342MARKER NORMAL softkey. See MKN
MARKER <number> ON OFF softkey. SeeMKACTV
marker off, 5-346marker pause, 5-349marker peak, 5-351marker peak excursion, 5-352marker position, 5-347marker readout, 5-354marker readout in frequency, 5-354MARKER -, AUTO FFT softkey. See FFTAUTOMARKER -+ CF softkey. See MKCFMARKER + CF STEP softkey. See MKSSMARKER + FFl’ STOP softkey. See FFTMSMARKER ---) MID SCRN softkey. See FFTMMMARKER + REF LVL softkey. See MKRLmarker step size, 5-358marker stop, 5-359marker table, 5-360marker table commands
marker delta display line mode(MKDLMODE), 5-334
marker table (MKTBL), 5-360marker to auto FFl’, 5-164marker to center frequency, 5-330marker to reference level, 5-356marker to span, 5-357marker trace, 5-362marker track, 5-363marker type,, 5-364
amplitude, 5-364delta, 5-364fixed, 5-364position, 5-364
MARKER A softkey. See MKDmarker zoom, 5-378mass storage is, 5-374MAX HOLD A, MAX HOLD B softkey. See
MXMHmaximum, 5-375maximum hold, 5-377MAX MXR LEVEL softkey. See MLMC, 5-10MDS, 3-22, 5-302MDS command
MKF programming example, 5-337MDU, 5-304MEAN, 5-306MEANTH, 5-307MEASOFF, 5-309MEAS OFF softkey. See MEASOFFMEASURE, 5-310measurement data size, 3-22, 5-302measurement data units, 5-304measurement off, 5-309measurement units, 3-26, 5-122
Index-8

range, 3-26measure mode, 5-310measuring harmonic distortion
HP-IB, 3-15-17RS-232, 3-18-19
MEM, 5-312memory
determining the amount needed for a DLP,4-12
memory available, 5-3 12memory card
determining information with HAVE, 5-226MENU, 5-313MERGE, 5-315merge two traces, 5-315MF, 5-317M format, 3-26-27MIN, 5-319MINH, 5-321MIN HOLD C softkey. See MINHminimum, 5-319minimum hold, 5-321minimum position, 5-322minimum trace value
MKMIN, 5-341MINPOS, 5-322MIRROR, 5-323mirror image, 5-323mirror limit line, 5-280mixer level, 5-365MKA, 3-2, 3-3, 5-325MKACT, 5-327MKACTV, 5-328MKBW, 5-329MKCF, 5-330MKCONT, 5-33 1MK COUNT ON OFF softkey. See MKFCMKD, 5-332MKDLMODE, 5-334MKF, 3-2, 3-3, 5-336MKFC, 5-338MKFCR, 5-339MKMIN, 5-341MKN, 5-342MKNOISE, 5-344MK NOISE ON OFF softkey. See MKNOISEMKOFF, 5-346MKP, 5-347MKPAUSE, 5-349MK PAUSE ON OFF softkey. See MKPAUSEMKPK, 5-351MKPK HI, 2-4, 2-5MKPX, 5-352MKREAD, 5-354MK READ F T I P softkey. See MKREAD
MKRL, 5-356MKR A -+ SPAN softkey. See MKSPMKSP, 5-357MKSS, 5-358MKSTOP, 5-359MK TABLE ON OFF softkey. See MKTBLMKTBL, 5-360MKTRACE, 5-362MK TRACE AUTO ABC softkey. See
MKTRACEMKTRACK, 5-363MK TRACK ON OFF softkey. See MKTRACKMKTYPE, 5-364ML, 5-365MOD, 5-367MODE, 5-369modulo, 5-367MOV, 5-370move, 5-370moving the active marker between traces
MKTRACE, 5-362MPY, 5-372msb length, 5-3MSB length, 3-24MSI, 5-374MTO, 5-10MTl, 5-10multiply, 5-372MXM, 5-375MXMH, 5-377
Nnatural exponent, 5-155NDB, 5-380NDBPNT, 5-38 1NDBPNTR, 5-383N dB points, 5-381N dB points bandwidth, 5-383N dB points commands
N dB points bandwidth (NDBPNTR), 5-383N dB points (NDBPNT), 5-381number of dB (NDB), 5-380
N dB PTS ON OFF softkey. See NDBPNTnegative detection, 5-l 13NEW EDIT softkey, 4-17NEXT key. See WINNEXTNEXT PEAK, NEXT PK RIGHT, NEXT PK
LEFT softkey. See MKPKnormal detection, 5-l 13normalization
using AMB, 5-59using AMBPL, 5-61
normalized reference level, 5-384NORMLIZE ON OFF softkey. See AMBPL,
SRCNORM
Index-9

NRL, 5-384NTSC
triggering, 5-575number, 5-3number of dB, 5-380
001, 5-1002, 5-1003, 5-1004, 5-10OA, 5-386OBW, 5-387OBWPCT, 5-389OCC BW % POWER softkey. See OBWPCTOCCUPIED BANDWDTH softkey. See OBWoccupied bandwidth, 5-387occupied bandwidth percent, 5-389octal to binary, 5-523OL, 3-11, 5-390on cycle, 5-391ONCYCLE, 5-391on delay, 5-393ONDELAY, 5-393on end of sweep, 5-395ONEOS, 5-395ON key. See WINONon marker, 5-397on marker update, 5-399ONMKR, 5-397ONMKRU, 5-399ONPWRUP, 5-401on service request, 5-402ONSRQ, 5-402on sweep, 5-404ONSWP, 5-404on time, 5-406ONTIME, 5-406OP, 5-408OUTPUT, 5-409output active function value, 5-386output learn string, 3-l 1, 5-390output parameter, 5-408output termination, 5-3output to HP-IB, 5-409over range for measurement units, 3-26
PPA, 5-412PAL
triggering, 5-575PAL-M
triggering, 5-575Parallel port status, 5-414PARAM AUTO MAN softkey. See ACPPAR
parameter units, 3-21PARSTAT, 5-414party-line bus structure, B-lPause key, 4-16PCTAM, 5-416PCTAMR, 5-418PD, 5-419PDA, 5-420PDF, 5-422peak average detection, 5-113PEAK EXCURSN softkey. See MKPXpeak position, 5-430peak result, 5-431PEAKS, 5-424PEAK SEARCH key. See MKPKpeak sort, 5-433peak table, 5-434peak table commands
peak result (PKRES), 5-431peak sort (PKSORT), 5-433peak table delta display line mode
(PKDLMODE), 5-428peak table (PKTBL), 5-434
peak table delta display line mode, 5-428peak zoom, 5-437peak zoom commands
peak zoom okay (PKZMOK), 5-436peak zoom (PKZOOM), 5-437
peak zoom okay, 5-436PEAK ZOOM softkey. See PKZOOMpen down, 5-419pen up, 5-452Percent AM, 5-416percent AM response, 5-418performing commands after an elapsed time
ONDELAY, 5-393performing commands at a specific time
ONTIME, 5-406performing commands at the beginning of a
sweepONSWP, 5-404
performing commands at the end of a sweepONEOS, 5-395TRMATH, 5-567
performing commands at the markerONMKR, 5-397
performing commands on a service requestONSRQ, 5-402
performing commands periodicallyONCYCLE, 5-392
periodmarker readout, 5-354
P format, 3-20PKDLMODE, 5-428
Index-10

PK MODE oDL NRM softkey. SeePKDLMODE
PKPOS, 5-430PKRES, 5-431PKSORT, 5-433PK SORT FRQ AMP softkey. See PKSORTPK TABLE ON OFF softkey. See PKTBLPKTBL, 5-434PKZMOK, 5-436PKZOOM, 5-437placing a marker
MKP, 5-347placing a marker on a signal peak
MKPK, 5-351PLOT, 5-439plot absolute, 5-412plot relative, 5-444Plotter port, 5-441plotter units, 5-304plotting
from within DLPs, 5-217HP-IB interface, 1-14laserjet, l-22RS-232, 1-18
plotting the analyzer display, 5-125PLTPRT, 5-44 1polarity
TVSYNC, 5-577position
marker type, 5-364positive and negative peaks detection, 5-l 13positive detection, 5-l 13power bandwidth, 5-454power menu commands
ACP manual or auto (ACPPAR), 5-44adjacent channel power (ACP), 5-33adjacent channel power extended (ACPE),
5-38channel bandwidth (ACPBW), 5-35channel power (CHP), 5-95channel spacing (ACPSP), 5-47compute the adjacent channel power graph
(ACPGRAPH), 5-42continuous sweep measurement
(ACPCONTM), 5-37measurement off (MEASOFF), 5-309occupied bandwidth (OBW), 5-387occupied bandwidth percent (OBWPCT),
5-389single sweep measurement (ACPSNGLM),
5-46POWERON, 5-442POWER ON IP LAST softkey. See POWERONpower-on state, 5-442power up time, 5-456
PP, 5-443PR, 5-444PREAMPG, 5-445preamplifier gain, 5-445predefined function, 5-3predefined variable, 5-4prefix, 5-446PREFX, 5-446preselector peak, 5-443PRESEL PEAK softkey. See PPPRESET key. See IPPRINT, 5-447print address, 5-449Printer port, 5-450printing
from within DLl3, 5-219with a LaserJet Printer (RS-232 only), C-5with a ThinkJet Printer (RS-232 only), C-4
printing, HP-IBcentronics converter, l-l 1deskjet, l-l 1epson, l-l 1laserjet, l-l 1paintjet, l-l 1thinkjet, l-l 1
printing, paralleldeskjet, l-20epson, l-20laserjet, l-20paintjet, l-20thinkjet, l-20
printing, RS-232deskjet, 1-16epson , 1-16laserjet , 1-16paintjet , 1-16thinkjet, 1-16
PRNPRT, 5-450PRNTADRS, 5-449probability distribution of amplitude, 5-420probability distribution of frequency, 5-422problems, l-24programming guidelines, 2-10protect state, 5-451protocol
RS-232 protocol, C-2PSTATE, 5-45 1PU, 5-452pulse repetition interval, 5-198pulse width, 5-200PURGE, 5-453purge file, 5-453PURGE LIMITS softkey. See LIMIDELPWRBW , 5-454PWR SWP ON OFF softkey. See SRCPSWP
Index-11
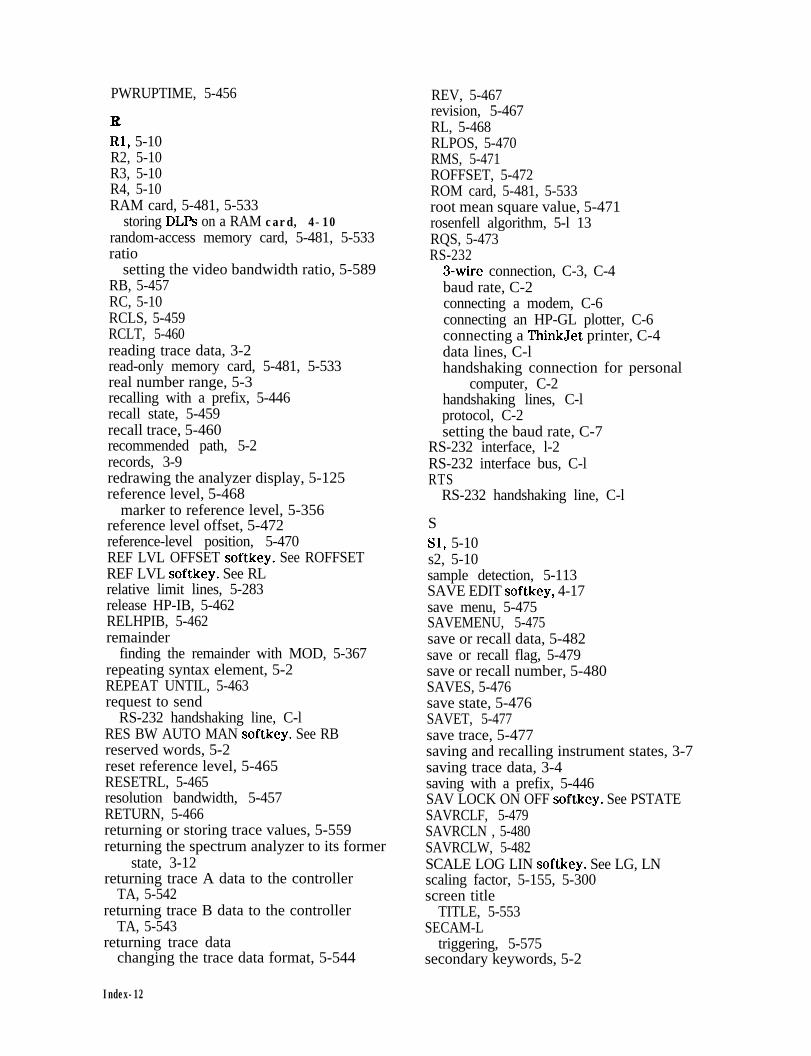
PWRUPTIME, 5-456
ItRl, 5-10R2, 5-10R3, 5-10R4, 5-10RAM card, 5-481, 5-533
storing DLPs on a RAM card, 4-10random-access memory card, 5-481, 5-533ratio
setting the video bandwidth ratio, 5-589RB, 5-457RC, 5-10RCLS, 5-459RCLT, 5-460reading trace data, 3-2read-only memory card, 5-481, 5-533real number range, 5-3recalling with a prefix, 5-446recall state, 5-459recall trace, 5-460recommended path, 5-2records, 3-9redrawing the analyzer display, 5-125reference level, 5-468
marker to reference level, 5-356reference level offset, 5-472reference-level position, 5-470REF LVL OFFSET softkey. See ROFFSETREF LVL softkey. See RLrelative limit lines, 5-283release HP-IB, 5-462RELHPIB, 5-462remainder
finding the remainder with MOD, 5-367repeating syntax element, 5-2REPEAT UNTIL, 5-463request to send
RS-232 handshaking line, C-lRES BW AUTO MAN softkey. See RBreserved words, 5-2reset reference level, 5-465RESETRL, 5-465resolution bandwidth, 5-457RETURN, 5-466returning or storing trace values, 5-559returning the spectrum analyzer to its former
state, 3-12returning trace A data to the controller
TA, 5-542returning trace B data to the controller
TA, 5-543returning trace data
changing the trace data format, 5-544
REV, 5-467revision, 5-467RL, 5-468RLPOS, 5-470RMS, 5-471ROFFSET, 5-472ROM card, 5-481, 5-533root mean square value, 5-471rosenfell algorithm, 5-l 13RQS, 5-473RS-232
3-wire connection, C-3, C-4baud rate, C-2connecting a modem, C-6connecting an HP-GL plotter, C-6connecting a ThinkJet printer, C-4data lines, C-lhandshaking connection for personal
computer, C-2handshaking lines, C-lprotocol, C-2setting the baud rate, C-7
RS-232 interface, l-2RS-232 interface bus, C-lRTS
RS-232 handshaking line, C-l
SSl, 5-10s2, 5-10sample detection, 5-113SAVE EDIT softkey, 4-17save menu, 5-475SAVEMENU, 5-475save or recall data, 5-482save or recall flag, 5-479save or recall number, 5-480SAVES, 5-476save state, 5-476SAVET, 5-477save trace, 5-477saving and recalling instrument states, 3-7saving trace data, 3-4saving with a prefix, 5-446SAV LOCK ON OFF softkey. See PSTATESAVRCLF, 5-479SAVRCLN , 5-480SAVRCLW, 5-482SCALE LOG LIN softkey. See LG, LNscaling factor, 5-155, 5-300screen title
TITLE, 5-553SECAM-L
triggering, 5-575secondary keywords, 5-2
Index-12

SEGDEL, 5-483segment delete, 5-483segment entry for frequency limit lines,
5-485segment entry for sweep time limit lines,
5-488select frequency or time limit line, 5-274selecting a trace window for FFT, 5-578selecting polarity
TVSYNC, 5-577selecting the type of video frame, 5-573selecting triggering for the TV standard
formats, 5-575SENTER, 5-485SENTERT, 5-488SER, 5-491serial number, 5-491service request mask, 5-473set date, 5-492SETDATE, 5-492SET DATE softkey. See SETDATEset time, 5-493SETTIME, 5-493SET TIME softkey. See SETTIMEsetting the baud rate, C-7setting the marker counter resolution, 5-339setting the real-time clock, 5-551setting the spectrum analyzer trigger mode,
5-554setting the threshold level, 5-550setting the time and date, 5-551setting the trace operations to preset values,
5-569setting the TV line number, 5-572setting the video bandwidth
VB, 5-587setting the video bandwidth ratio, 5-589SGL SWP key. See SNGLSSIGNAL TRACK
MKTRACK, 5-363SINGLE FFT softkey. See FFTSNGLSSINGLE MEAS softkey. See ACPSNGLMsingle sweep, 5-496single sweep measurement, 5-46single-sweep mode, 2-2, 2-3SMOOTH, 5-494smooth trace, 5-494SNGLS, 2-2, 2-3, 5-496softkey
underlining and inverse video, 5-255softkeys
clearing with KEYDEF, 5-246source attenuator, 5-506source leveling control, 5-504source normalization, 5-508
source power, 5-515source power-level step size, 5-511source power offset, 5-510source power sweep, 5-513source tracking, 5-5 17source tracking peak, 5-519SP, 2-4, 2-5, 5-497span, 2-4, 2-5, 5-497
marker to span, 5-357SPAN softkey. See SPspan zoom, 5-500SPAN ZOOM softkey. See SPZOOMSPEAKER, 5-499special numbers and characters, 5-2specifying the frequency of the marker
MKF, 5-336spectrum analyzer error messages, A-lspectrum analyzer state, 3-9SPZOOM, 5-500SQLCH, 5-501SQR, 5-502square root, 5-502squelch, 5-501SQUELCH softkey. See SQLCHSRCALC, 5-504SRCAT, 5-506SRC ATN MAN AUTO softkey. See SRCATSRCNORM, 5-508SRCPOFS, 5-510SRCPSTP, 5-511SRCPSWP, 5-513SRCPWR, 5-515SRC PWR OFFSET softkey. See SRCPOFSSRC PWR ON OFF softkey. See SRCPWRSRC PWR STP SIZE softkey. See SRCPSTPSRCTK, 5-517SRCTKPK, 5-519SRQ, 5-520SS, 5-524ST, 5-526standard baud rates, 5-76standard deviation of trace amplitudes, 5-529START FREQ softkey. See FAstart frequency, 5-156STATE --$ INTRNL softkey. See SAVESstatus bits
clearing, 5- 103status byte definition, 5-522status byte query, 5-528status of a trace
TRSTAT, 5-570STB, 5-528STDEV, 5-529step size
decreasing by the step size with DN, 5-137
Index-13

marker step size, 5-358STOP FREQ softkey. See FBstop frequency, 5-158STOR, 5-531store, 5-531storing DLPs on a RAM card, 4-10SUB, 5-534subtract, 5-534SUM, 5-536sum of squared trace amplitudes, 5-537sum of trace amplitudes, 5-536SUMSQR, 5-537sv, 5-10SWEEP CONT SGL softkey. See CONT, SNGLSSweep Couple, 5-538SWEEP DELAY softkey. See GDRVSWDEsweep time, 5-526
marker readout, 5-354sweep time for the time window, 5-211SWEEP TIME softkey. See GDRVSWPSWPCPL, 5-538SWP CPLG SR SA softkey. See SWPCPLSWP TIME AUTO MAN softkey. See STsynchronize mode, 5-540SYNCMODE, 5-540SYNC NRM NTSC, SYNC NRM PAL softkey.
See SYNCMODEsyntax elements, 5-2, 5-3-4
TTO, 5-10Tl, 5-10T2, 5-10T3, 5-10T4, 5-10T7, 5-10T8, 5-10TA, 5-542TABLE ADL NRM softkey. See MKDLMODEtake sweep, 5-571taking a measurement sweep, 5-571TB, 5-543TDF, 3-20, 5-544TDF command
MKF programming example, 5-337test program, l-2text
entering text in the display list, 5-125TEXT, 5-549TH, 5-550THEN, 5-236ThinkJet Printer mode switch settings, l-11,
c-4ThinkJet RS-232 switch settings, C-4
third-order intermodulation measurement,5-556
third-order intermodulation response, 5-558THRESHLD ON OFF softkey. See THthreshold, 5-550time and date
displaying the time and date, 5-552time date, 5-551TIMEDATE, 5-551TIMEDATE ON OFF softkey. See TIMEDSPtime display, 5-552TIMEDSP, 5-552time units, 5-4TITLE, 5-553TM, 5-554to find problems in a DLP, 4-20TOI, 5-556TO1 commands
third-order intermodulation measurement(TOI), 5-556
third-order intermodulation response(TOIR), 5-558
TO1 ON OFF softkey. See TO1TOIR, 5-558TRA, 3-2, 3-3, 5-559trace A minus trace B, 5-57trace A minus trace B plus display line, 5-60trace A plus trace B, 5-68trace B exchange trace C, 5-85trace B minus display line, 5-83trace data format, 5-544
binary, 3-9, 3-11TDF, 2-8, 2-9
trace data formats, 3-20trace data input and output, 5-559trace data transfers, 3-20trace define, 5-562trace display, 5-564trace element, 5-4trace graph, 5-565trace math, 3-26, 5-567trace mean, 5-306trace mean above threshold, 5-307trace memory, 5-561trace preset, 5-569trace range, 5-4trace registers
determining the total number of traceregisters available, 5-561
Trace ---i Intrnl softkey. See SAVETtrace status, 5-570trace window, 5-578TRACKING PEAK softkey. See SRCTKPKtracking the signal
MKTRACK, 5-363
Index-14

transfer A, 5-542transfer B, 5-543transferring trace A data, 5-542transferring trace B data, 5-543transfer trace B to trace C, 5-84TRA/TRB/TRC, 5-559TRB, 5-559TRC, 5-559TRCMEM, 5-561TRDEF, 5-562TRDSP, 5-564TRGRPH, 5-565triggering the spectrum analyzer, 5-554trigger mode, 5-554TRIG key. See TMTRIG MKR ON OFF softkey. See GDRVTIMTRMATH, 5-567TRPRST, 5-569TRSTAT, 5-570TS, 2-2, 2-3, 5-571turning off markers
MKOFF, 5-346TV frame, 5-573TV line, 5-572TVLINE, 5-572TV LINE # softkey. See TVLINETVSFRM, 5-573TV Standard, 5-575TV Standard softkey. See TVSTNDTVSTND, 5-575TV sync, 5-577TVSYNC, 5-577TV SYNC NEG POS softkey. See TVSYNCTV trigger mode, 5-554TV TRIG ODD FLD, TV TRIG EVEN FLD, TV
TRIG VERT INT softkey. See TVSFRMTV TRIG softkey. See TMTWNDOW, 5-578two’s complement, 5-68type of marker
changing the type, 5-364
Uunderlining
label function, 5-266underlining for softkey labels, 5-255UNIFORM filter
FFT, 5-161unit key pressed, 5-522units, 5-4universal HP-IB service request, 5-522unlock harmonic number, 5-233UNTIL, 5-463UP, 5-579update the time or frequency window, 5-208
UPDATE TIMEFREQ softkey. See GDRVSWAPupper limit line, 5-275use of a DLP, 4-luser-created error messages, A-luser-defined function, 5-4, 5-184user-defined functions
using ABORT in user-defined functions,5-29
using CHPGR in user-defined functions,5-97, 5-401
user-defined function within a DLP, 4-3user-defined softkey definition, 5-251user-defined trace, 5-4user-defined trace and use within a DLP,
4-5user-defined variable, 5-4, 5-582user-defined variables and use within a DLP,
4-4user state, 5-580using the DLP editor, 4-15USTATE, 5-580
VVARDEF, 5-582variable definition, 5-582variables, 2-6VARIANCE, 5-584variance of trace amplitudes, 5-584VAVG, 5-586VB, 5-587VBR, 5-589VBW/RBW RATIO softkey. See VBRvertical position of CRT display, 5-120vertical tab
label function, 5-266VID AVG ON OFF softkey. See VAVGVID BW AUTO MAN softkey. See VBvideo average, 5-586video bandwidth, 5-587video bandwidth ratio, 5-589video modulation polarity
TVSYNC, 5-577VIDEO softkey. See TMvideo trigger mode, 5-554VIEW, 5-590VIEW A, VIEW B, VIEW C softkey. See
VIEWviewing a trace
VIEW, 5-590
wWAIT, 5-591what is a DLP, 4-lwhy use a DLP, 4-lwindow gate control, 5-194
Index-l 5
window next, 5-592window off, 5-593window on, 5-594windows commands
WINNEXT, 5-592WINOFF, 5-593WINON, 5-594WINZOOM, 5-596ZMKCNTR, 5-599ZMKPKNL, 5-601ZMKPKNR, 5-602ZMKSPAN, 5-603
WINDOWS OFF softkey. See WINOFFwindow zoom, 5-596WINNEXT, 5-592WINOFF, 5-593WINON, 5-594WINZOOM, 5-596writing your first program, 2-2
X
XCH, 5-597
Z
ZMKCNTR, 5-599ZMKPKNL, 5-601ZMKPKNR, 5-602ZMKSPAN, 5-603ZONE CENTER softkey. See ZMKCNTRzone marker at center frequency, 5-599zone marker for next left peak, 5-601zone marker for next right peak, 5-602zone marker span, 5-603ZONE PK LEFT softkey. See ZMKPKNLZONE PK RIGHT softkey. See ZMKPKNRZONE SPAN softkey. See ZMKSPANZOOM key. See WINZOOM
Index-l 6