Embed Size (px)
Citation preview

Howard County Health & Human Services
Needs Assessment

Conducted by O’Neill Research LLC
& Strategic Development Group,
Inc. • Full reports will be available online at the United
Way website: www.unitedwayhoco.org. Reports may be subject to revision.
• Citations have not been included in the PowerPoint and may be found in the full reports.

1. Executive Summary and Analysis
2. Research Phase
3. Input Phase
4. Service Provider Responses by Agency
5. Vulnerable Population Crosstab Workbook
Reports that Will be Available for Public Review

• Provides summaries of the individual reports and an overall analysis of community needs.
1. Executive Summary and Analysis
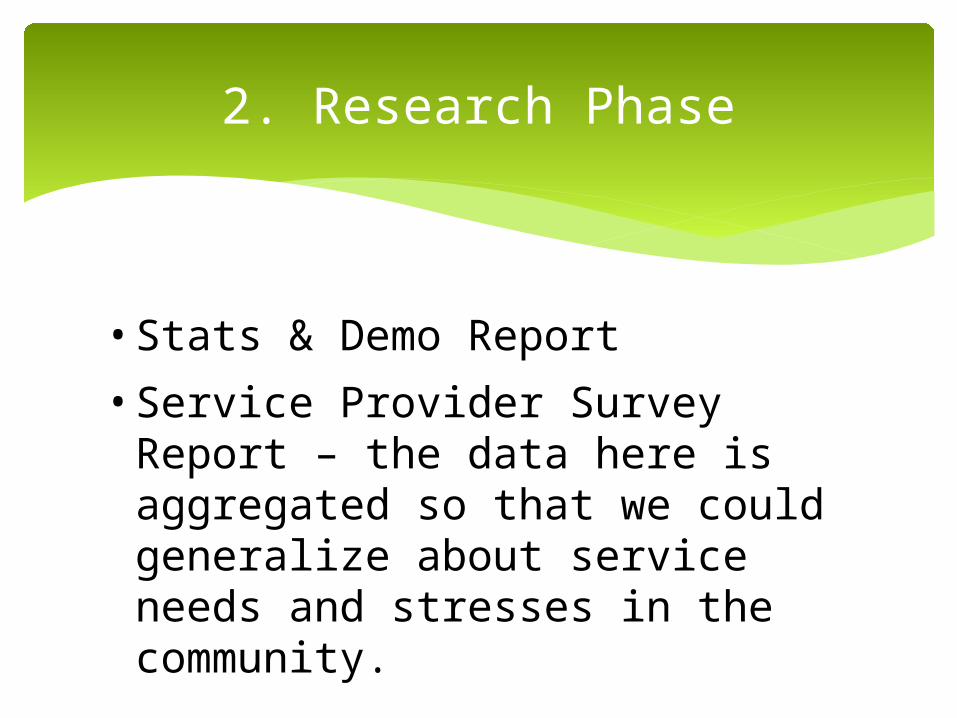
• Stats & Demo Report
• Service Provider Survey Report – the data here is aggregated so that we could generalize about service needs and stresses in the community.
2. Research Phase

• Key Informant Interviews Report
• Focus Groups Report
• Vulnerable Population Survey Report
3. Input Phase

• This data is disaggregated so that decision makers and other interested parties can review the status of each individual agency.
4. Service Provider Responses by Agency

• Data mining asset
• Cross tabulates each demographic category with each needs and human services question
• Resource for grant writing along with Demographic Report
5. Vulnerable Population Crosstab Workbook
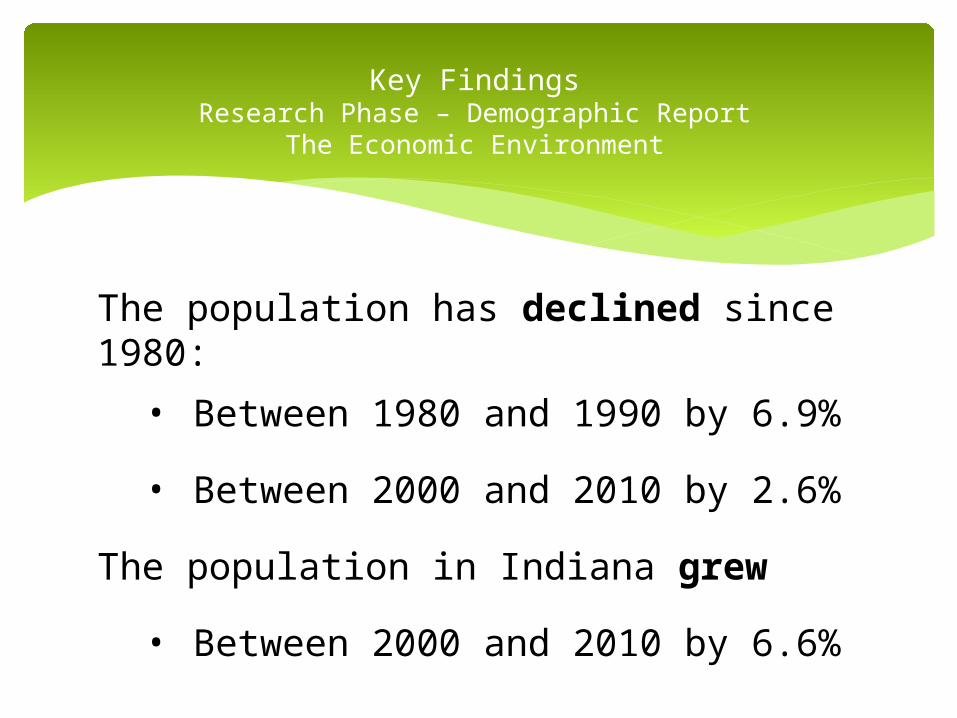
Key FindingsResearch Phase – Demographic Report
The Economic Environment
The population has declined since 1980:
• Between 1980 and 1990 by 6.9%
• Between 2000 and 2010 by 2.6%
The population in Indiana grew
• Between 2000 and 2010 by 6.6%

Key FindingsResearch Phase – Demographic Report
The Economic Environment
• This means: the loss of millions of dollars of disposable income and potential volunteers and civic leaders.
• City efforts to revitalize the downtown and keep anchors like YMCA are a crucial part of turning these commuters into residents.
• 9,435 workers commute in to Howard for jobs (2009)
• 4,025 workers commute out to other counties for jobs (2009)
Key FindingsResearch Phase – Demographic Report
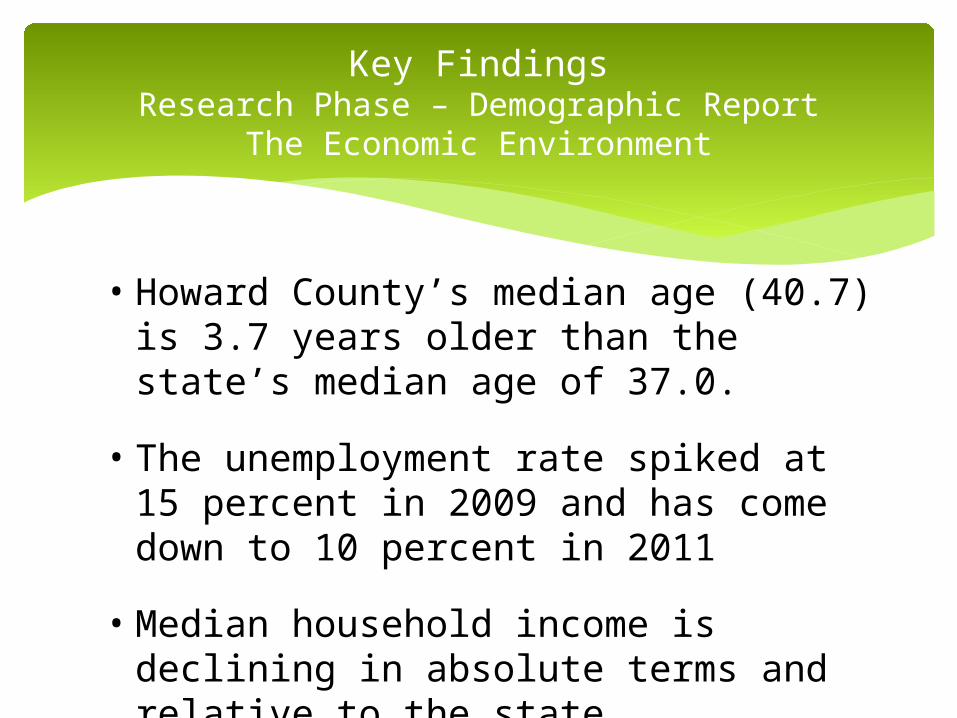
The Economic Environment
• Howard County’s median age (40.7) is 3.7 years older than the state’s median age of 37.0.
• The unemployment rate spiked at 15 percent in 2009 and has come down to 10 percent in 2011
• Median household income is declining in absolute terms and relative to the state.

Key FindingsResearch Phase – Demographic Report
The Economic Environment
• Howard County lags the state at 19.7 percent of workers with a B.A. or higher degree. The national rate is 27.5 percent.
• Good news factoid: Chrysler adds 550 jobs in 2011.
• Even though Howard County remains a manufacturing center, it must continue to diversify its economy which means developing a more educated workforce.

Key FindingsResearch Phase – Demographic Report
The Economic Environment
• The percentage of children under age 18 living in poverty jumped from 13.1% in 2000 to 24.5% in 2010.
• In 2000, Howard County and Indiana had exactly the same poverty rate: 8.8%. By 2010, Howard County’s poverty rate of 16% for all ages was higher than the statewide 15.3%.
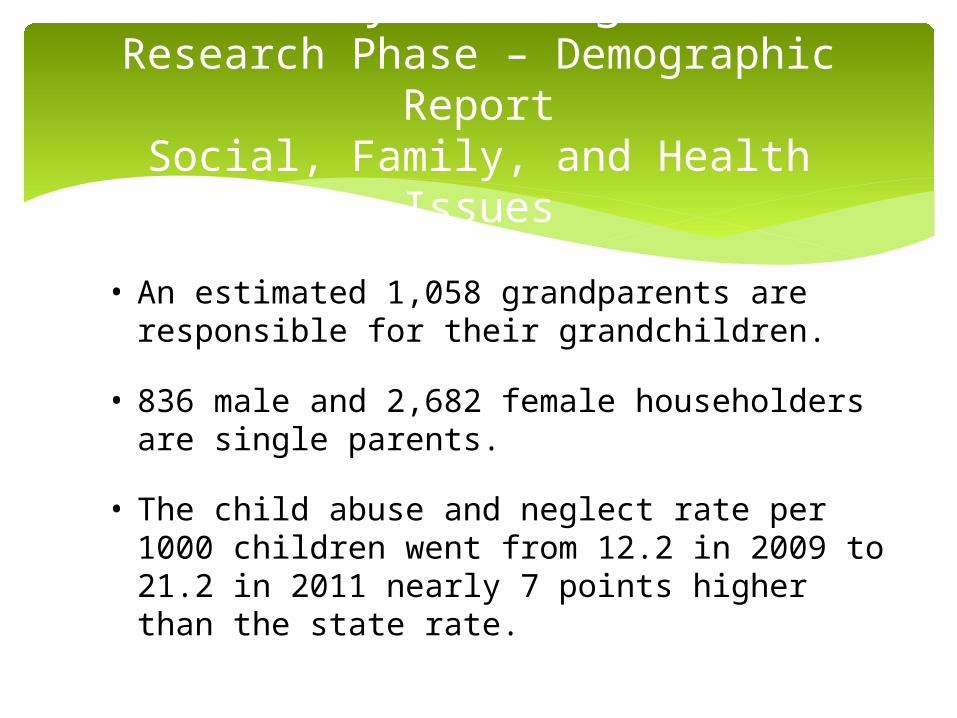
Key FindingsResearch Phase – Demographic Report
Social, Family, and Health Issues
• An estimated 1,058 grandparents are responsible for their grandchildren.
• 836 male and 2,682 female householders are single parents.
• The child abuse and neglect rate per 1000 children went from 12.2 in 2009 to 21.2 in 2011 nearly 7 points higher than the state rate.

Key FindingsResearch Phase – Demographic Report
Social, Family, and Health Issues
• 13,279 people have a disability who are non-institutionalized
• 20.4 percent of people with disabilities live below the poverty line.
• A minimum wage earner (earning $7.25 per hour) can afford monthly rent of no more than $377, but an efficiency apartment (with no bedrooms) in Howard County costs $551.

Key FindingsResearch Phase – Demographic Report
Social, Family, and Health Issues
• Hoosier Assurance Program (HAP) in 2008 served 1,828 people in Howard County for addictions or mental illness
• Based on County Health Rankings, Howard County ranks 64th in the state in terms of health outcomes and 56th in health factors (out of Indiana’s 92 counties).

Key FindingsResearch Phase – Demographic Report
Social, Family, and Health Issues
Death Measures - Includes only areas in which Howard Co exceeds U.SRates are age-adjusted to the year 2000 standard; per 100,000 population.
Death MeasuresHoward County Rate U.S. Rate 2005
Colon Cancer 20.4 17.5Coronary Heart Disease
173.6 154.0
Homicide 7.6 6.1Lung Cancer 62.7 52.6Motor Vehicle Injuries
17.0 14.6
Stroke 59.5 47.0
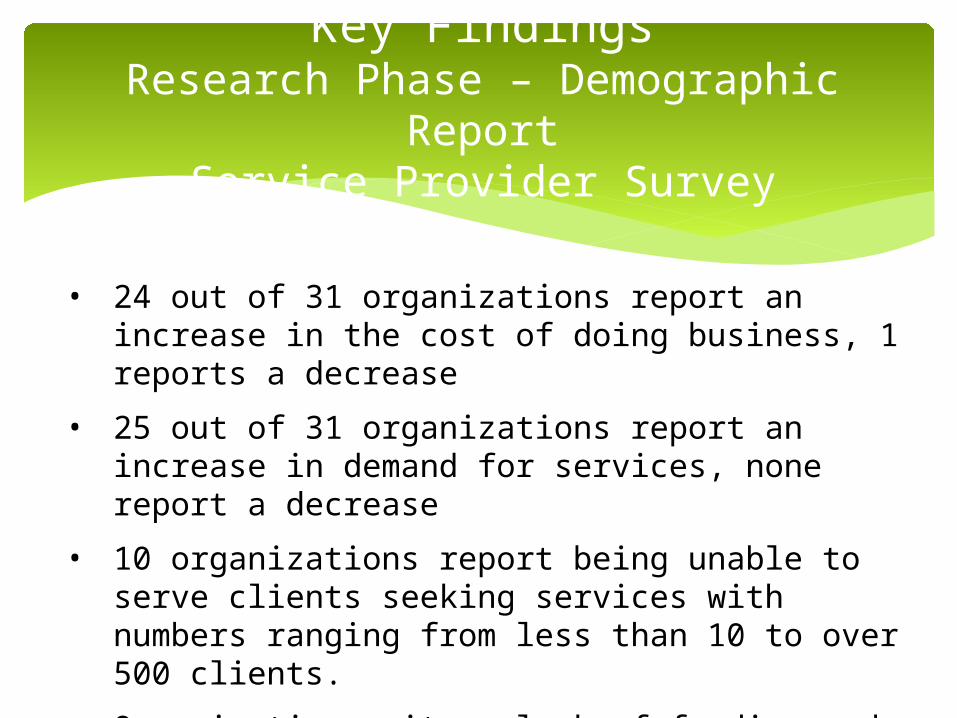
Key FindingsResearch Phase – Demographic
ReportService Provider Survey
• 24 out of 31 organizations report an increase in the cost of doing business, 1 reports a decrease
• 25 out of 31 organizations report an increase in demand for services, none report a decrease
• 10 organizations report being unable to serve clients seeking services with numbers ranging from less than 10 to over 500 clients.
• Organizations cite a lack of funding and an increasing demand for services as top challenges.

Key FindingsResearch Phase
Service Provider Survey
• Agencies providing mental health and housing services report the largest numbers of unserved clients. • All the agencies most
frequently cite employment opportunities/job placement, mental health and housing services as unmet needs for their clients.

Key FindingsInput Phase
Focus Groups & Key Informant Interviews
• 23 key informant interviews were completed with community leaders including: CEOs in the private and public sectors, university chancellors, judges, elected officials, school superintendents, the sheriff, and agency directors.

Key FindingsInput Phase
Focus Groups & Key Informant Interviews
The focus groups had 38 participants in the following sessions:• Justice System
Officials
• Healthcare Providers
• Social Safety Net Providers
• Preschool and Primary Educators
• Business, Labor, and Postsecondary Education Leaders
• Faith-Based Service Providers

Key FindingsInput Phase
Focus Groups & Key Informant Interviews
• Key Informants indicated that economic opportunity was a root issue exacerbating other human service needs.
• There was broad agreement on a set of four paired issues as key human service needs:
o Mental health and addictions
o Family financial crisis and early childhood and child rearing issues

Key FindingsInput Phase
Focus Groups & Key Informant Interviews
• Mental health and addictions were major human service needs.
• Adults, youth, and children were all in need of services in these areas.
There was also strong consensus in the focus groups that:
Key FindingsInput Phase
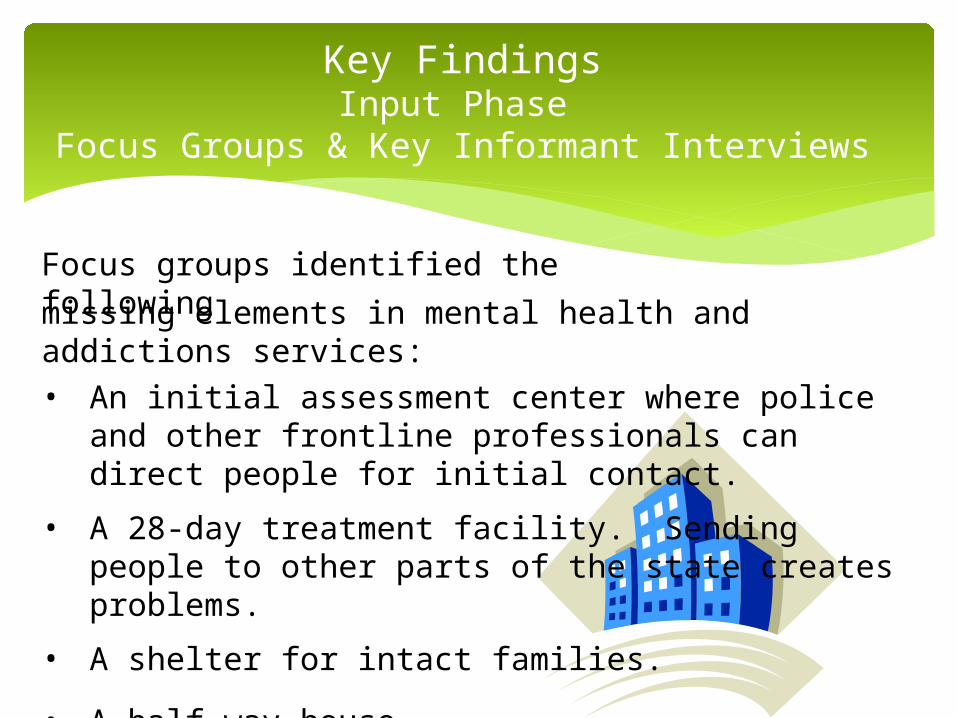
Focus Groups & Key Informant Interviews
missing elements in mental health and addictions services:• An initial assessment center where police and
other frontline professionals can direct people for initial contact.
• A 28-day treatment facility. Sending people to other parts of the state creates problems.
• A shelter for intact families.
• A half-way house.
• A work release program.
Focus groups identified the following

Key FindingsInput Phase
Vulnerable Populations Survey
Demographics
• 71.6 percent of the respondents report that they are women.
• The age demographics are relatively representative of Howard County as whole.
• The population represented on this survey overwhelmingly report very low income households.
• Over half the respondents report that their unemployment is the result of a disability, and approximately one third report that they are simply unable to find work.

Key FindingsInput Phase
Vulnerable Populations Survey
Health and Human Service Needs• Finance related issues top the list for
problems dealt with in the last six months with job problems at 44.7%
• 26.3 % of the respondents also cited mental health as an issue their households experienced in the last six months.

Key FindingsInput Phase
Vulnerable Populations Survey
• Food was by far the need reported as requiring the most assistance followed by medication and transportation.
• The most identified source of help for the respondents’ biggest problems at 30.3 percent was their families and not an agency or institution.

Key FindingsInput Phase
Vulnerable Populations Survey
• The six top diagnoses reported as experienced by respondents over the past year are mental health or behavior affected: high blood pressure (if stress related), high cholesterol (if diet related), depression, anxiety, diabetes (if diet related), and obesity.
• 70 percent of the total respondents indicate that they never or only occasionally exercise. This is extraordinarily low by national standards.

Key FindingsInput Phase
Vulnerable Populations Survey
• Respondents appear much more likely to smoke if they are less than 55 years of age and the lower their income the higher the frequency.
• 27.9 percent of the respondents report that they smoke cigarettes. The national rate is 19 percent.
• Nearly one third of the female respondents report that they smoke cigarettes.

Key FindingsInput Phase
Vulnerable Populations Survey
• Taken together, this information suggests that there may be a significant life threatening behavior primarily affecting women under the age of 55 and their children in the lowest income subgroups.
Key FindingsInput Phase
Vulnerable Populations Survey
• Smoking and lack of exercise are significant health-risk behaviors for the vulnerable populations.
• They may be contributing to the higher rates of morbidity for Howard County in colon cancer, lung cancer, coronary heart disease, and stroke.
• They may be complicated by co-occurring mental illness and other addictions.
Community Needs Profile
• The Community Needs Profile identifies those human service issues which emerged as high concerns taking into account all of our research activities.
• It also discusses those issues which merit consideration although they were not as widely noted.

Community Needs Profile
• Food
• Housing and shelter
• Lack of financial resources
Three basic needs that were consistently identified as critical and pressing across all of our research:

Community Needs Profile
• Mental Health
• Addictions
• Health-risk behaviors
Three health-related needs that were consistently identified as critical and pressing across all of our research:

Community Needs Profile
Three additional issues of importance:
• Disability - 13,279 residents with disabilities; over half the respondents on the vulnerable population survey report having a disability; long waiting lists for Medicaid-waivers
• Transportation – trolley system receives both praise and requests for extended times and routes
• Education and Economic Opportunity – efforts must continue to revitalize the downtown, invest infrastructure, and create a stable, educated workforce.
Community Needs Profile
• k-12 educators and workforce development professionals will have a key role in “rehabilitating” the low income workforce through helping them acquire higher skills.
• Howard County and Kokomo are moving to revitalize the downtown, to improve public transportation, and to diversify the economy through facilities like Inventrek.
• All these efforts will help to develop a sustainable economy with the power to generate a range of jobs for a workforce that retains many unskilled individuals.