Embed Size (px)
Citation preview
1
How to promote "nearly" Zero-Energy Buildings for new and
retrofitting buildings in the municipal context Moderator: Cipriano, Jordi
a.
Speakers: Sartori, Igorb; Santamouris, Mat
c; Cipriano, Xavi
a; Lopez, Jose Santos
a.
a CIMNE International Center of Numerical Methods in Engineering, Barcelona, Spain
b NTNU Norwegian University of Science and Tenchnology, Trondheim, Norway
c National and Kapodistrian University of Athens, Panepistimioupolis, Athens, Greece
Abstract: The main goal of the session is to establish a discussion among energy experts
and public technicians or municipal authorities on how to promote "nearly" Zero-Energy
Buildings in their municipalities. Results of several European projects (AIDA,
SEMANCO), as well as some conclusions on how the nZEB definitions can be included in
urban planning and in Strategic Energy plans, such as the SEAPs of the covenants of
majors, will be presented to the audience.
Keywords: zero-energy, ZEB, nZEB, EPBD, plus-energy, refurbishment, office, embodied energy,
urban microclimate, "heat islands", conservation techniques, passive solar technologies, zero-
energy buildings and settlements, energy efficient urban planning, CO2 emission reduction, multi-
scale perspective, multi-criteria analysis, nZEB action, nZEB criteria accomplishment, Sustanaible
Energy Action Plan, municipal roadmap, Covenant of Mayors
Introduction The new EU Energy Performance of Buildings Directive (EPBD Recast - 2010/21/EU) [1]
strengths the energy performance requirements to the adoption of "nearly" zero-energy
buildings (nZEBs) in the country members within the definition of date limits for the building
construction or full retrofitting as nZEBs by the end of 2018 for only public buildings and the
end of 2020 for all other buildings.
The session document explains the contents referred to nZEBs to be discussed between the
experts and the audience. Relevant pilot experiences at building level (Section 1), how to
achieve nZEBs in the urban plan level (Section 2), simulating intervention scenarios for new
construction and renovation (Section 3) and the municipal roadmaps as a good media for the
promotion of nZEBs (Section 4) are the main subjects to be explained below.
Sections A summary of 6-7 pages for each section is described below:

2
1. Powerhouse Kjørbo: The experience of a Plus-Energy office building in
refurbishment
Speaker: Sartori, Igorb
Abstract: The first Powerhouse renovation building is built at the Kjørbo site in Bærum, and
the two office buildings were ready in spring 2014. A Powerhouse is a building that shall
produce more energy from onsite renewables than it uses in its life cycle. Energy efficiency
measures and materials with low embodied energy have been crucial for obtaining the energy
goal. A very efficient ventilation concept has been developed. A geothermal heat pump, in
addition to waste heat from the data/server room, will cover the heating and cooling demand.
PV panels will balance the energy needed during it’s lifetime. The two buildings will thus
export more electricity than it will use for operation. There will be no export of thermal
energy. Calculations indicate that the energy balance during the building’s lifetime, and
within the defined definition, fulfils the goal of plus-energy.
Keywords: plus-energy, refurbishment, office, embodied energy
1.1. Introduction
“Powerhouse” is a collaborative project that will demonstrate that it is possible to build plus-
energy buildings in cold climates [2]. Powerhouse Kjørbo is a pilot project within the
Research Centre on Zero Emission Buildings [3]. Therefore an aim is also very low
greenhouse gas emissions during the building’s lifetime. Powerhouse Kjørbo in Bærum is a
refurbishment project of two office buildings completed in spring 2014. Bærum is located at
ca. 60° North latitude, with annual mean outdoor temperature of about 6°C and annual mean
horizontal irradiation of about 955 kWh/m².
The office buildings were built in 1980. Each of the buildings has heated useful floor area of
about 2500 m2, divided on three or four floors. The energy consumption of the buildings
before renovation was about 250 kWh/m2y. In addition to the plus-energy goal, Powerhouse
Kjørbo obtained the classification “Outstanding” (highest level) in BREEAM-NOR, which is
the assessment method for sustainable buildings suited for Norwegian climate, standards and
criteria.
1.2. Methodology
The main definition of a Powerhouse is a building that shall produce more energy from on-
site renewables than it uses in its life cycle. For the first Powerhouse projects, a realistic aim
is achieving an energy balance including the energy use related to operation (excluding
electrical equipment), materials (including maintenance) and the construction phase. For later
projects, the aim is that the energy use related to the demolition also shall be included in the

3
balance account. For renovation projects, only the materials added during renovation (but
including maintenance and replacement during the building’s lifetime), are included. In
addition, the exported energy shall in average not have less quality than the imported energy.
This implies that produced and exported electricity can offset corresponding amount of
imported energy for both electricity and thermal purposes, while produced and exported
thermal energy cannot offset imported electricity. The building shall also as a minimum fulfil
all the requirements of the Norwegian Passive House standard [4].
1.3. Case studies
The plus-energy goal has been the definitive most important factor from the early start of the
design of Powerhouse Kjørbo. This multidisciplinary design has been crucial for achieving
the energy goal, and other qualities such as the building’s adaptation to the site and
surroundings, its functionality, esthetical qualities and indoor environment in general. As the
most costly measure is the on-site electricity production, the effort concentrated on measures
for energy efficiency, including minimizing the embodied energy for materials.
Energy need for ventilation normally represents a large share of the energy budget in office
buildings. In Powerhouse Kjørbo ventilation energy is reduced by means of using low
emitting materials to reduce the ventilation demand, demand control, displacement
ventilation, low pressure design to minimize fan energy, and highly efficient heat recovery.
During normal operation, the average ventilation air volume will be about 3 m3/m2h
wintertime, and about 6 m3/m2h summertime (on warm days).
Embodied energy related to the production of all new materials constitutes nearly the same
quantity as the energy needed for the operation of the building.
Architecture
The Kjørbo office site consists of a total of nine similar cubical blocks, of which two are
refurbished, surrounded by a park. The exterior expression had to be preserved as similar to
the original as possible, impling no change of shape and color. The façades before renovation
were covered with black glass, which has been replaced by a charred wood cladding in order
to preserve the dark aesthetic and reduce embodied energy and need for maintenance, see
Picture 1.
Picture 1: Left) Aerial view of the Kjørbo site; Photo: Entra Eiendom. Right) façade after refurbishment; Photo:
Chris Aadland.
Building envelope

4
The building envelope is highly insulated and air tight. The U-values and the level of air
tightness are shown in Table 1: below.
Table 1: Thermal properties of the building envelope, before and after renovation.
Ventilation
The ventilation concept is based on a system with extremely low pressure drop over the
components and in the ventilation ducts. Components with high pressure drop, such as the
heat recovery unit, are bypassed when not in use. The system utilizes displacement
ventilation, which is a more efficient way to ventilate spaces than the more traditional mixing
ventilation method.
The air handling unit is placed between the north-west façade and a central (existing) shaft on
the upper floors. In order to reduce the velocity and pressure drop as much as possible, the
existing shaft in each of the blocks will be converted to pure supply air shafts. From the shafts
the supply air will be distributed to the different zones via spacious designed ventilation
ducts. The concept is further based on overflow from cell offices to landscape, and further to
secondary functions before the air is extracted out via the stairwell (in block 5) and a central
atrium (in block 4). A spacious designed mixing battery will be utilized for free cooling of the
ventilation air during the summer, and for preheating during the winter. In addition, the users
will always have the possibility to open windows in the office areas. The airing via the
windows will be a supplement to the mechanical ventilation system.
Picture 2: Left) Open space office with exposed concrete ceiling and hanging sound absorbtion panels. Right)
the stariwell used as exhaust air shaft in block 5. Photos: Chris Aadland.
Heating system
Due to the very good insulated and air tight building envelope, the heating demand is very
low. Simulations show (measurements not yet available) that the requirements to thermal
comfort in the cell offices will be satisfied without local heat sources. However, during the
coldest days and when the cell offices are not used, the heating strategy is based on leaving
the doors open towards the office landscape. The radiator plant will be limited to centrally
placed and larger heating units in the office landscapes. The result is reduced heat loss,
reduced energy for pumps, fewer components, less embodied energy and reduced costs.
Lighting

5
Electric lighting comprises a large share of the energy demand in new office buildings. An
energy efficient lighting concept is therefore of high importance for Powerhouse Kjørbo.
Efficient daylight utilization contributes to good indoor environment and minimal use of
artificial lighting. The windows are designed for high level of daylight transmission and
distribution in to the rooms. All work places are located in areas along the facades. Artificial
lighting has low energy demand. The lighting system is locally controlled; in the landscapes a
typical lighting zone covers four work stations (about 15 m2) and there is full illumination
only in the work areas.
Energy supply system
For all thermal purposes, the building will benefit from 10 and 200 meter deep energy wells,
in which liquid is circulated in a closed circuit. The tempered liquid will be directly utilized
for free cooling during summer, and for heating during winter. Two heat pumps are installed,
designed to cover the total heat demand, including hot tap water.
For the two office buildings, a server room with 15 kW cooling capacity is planned. Expected
peak at normal use is 10 kW. The installation is designed for utilization of free cooling via the
energy wells in the summer season. In addition, the waste heat from the server room will be
utilized for preheating of tap water and space heating when needed.
An installation of about 1,400 m2 PV panels placed on the roof of the two office blocks and a
common garage is expected to produce between 210,000 and 230,000 kWh/y. Due to the
requirements from the municipality of keeping the shape of the buildings unchanged, the PV
installation has to be kept more or less invisible from the ground. The tilt of the installation is
therefore limited to 10° towards South, and with a certain mutual distance to avoid inter-row
shading. Using thermal solar energy was assessed, but was not considered to be suitable due
to the lack of match between heat demand and the production of solar heat.
Materials and embodied energy
Embodied energy is traditionally not taken into consideration in building projects but is
included in the Powerhouse Kjørbo energy balance account, and shall be balanced by energy
production. Hence, a considerable effort has been taken to reduce the embodied energy in the
building. All existing reinforcing steel and concrete constructions remained. In addition, the
existing glass façade panels are reused as interior panels in the refurbished buildings. The old
façades are replaced with energy efficient windows and cladding made of charred wood, with
long lifetime and marginal need for maintenace.
Embodied energy calculations are mainly based on information from energy product
declarations (EPD), but also the database EcoInvent and several professional reports and
6
scientific articles. Due to lack of transparency and consistence in much of the documentation,
there are large uncertainties associated with the calculated figure of embodied energy.
The total embodied energy, including replacement and maintenance over 60 years and
expressed in primary energy, is distributed on the different building elements as seen in Table
2: below.
Table 2: Embodied primary energy into different building elements, normalized per year.
1.4. Discussion of results
Based on a high degree of energy efficiency measures, and a presumption of an optimal operation of
the technical installations, the calculated demand for energy (energy need, delivered energy) is shown
in Table 3: below. The simulations are carried out with the dynamic energy simulation tool SIMIEN
[5], and are in accordance with the Norwegian Standard NS 3031 [6]. However, energy use for
lighting and equipment is in accordance with expected real use, but for a normalized operation period.
Table 3: Energy use in operation.
The embodied energy for the materials is given in primary energy, so both operation energy
and energy production is converted into primary energy in order to asses the total energy
balance. The primary energy factors have been developed by the research center ZEB, based
on the same principles as for the CO2 factors for electricity [7]. The primary energy factor for
electricity is progressively reduced towards the end of the building's (assumed) lifetime due to
expected increased share of renewables in the European electricity production mix, as shown
in Table 4:.
Table 4: Primary energy factors for electricity.
The PV installation is assumed to be replaced after 30 years, and then with 50% higher
efficiency. At the same time, increased efficiency is weighted by a lower mean primary
energy factor for the last 30 years, resulting in a lower primary energy contribution than for
the first period. In Table 5, the total primary energy account for the Powerhouse Kjørbo is
shown.
Table 5: Primary energy account for Powerhouse Kjørbo (Operational energy use excluding equipment)
The result shows that the project, during its lifetime, will produce more renewable energy
than it will consume. The construction phase is included. When it comes to the demolition
phase, there has so far been no time in the project studying the amount of this contribution to

7
the balance account. However, the surplus in the account is expected to cover the demolition
phase with a high margin.
1.5. Conclusions
The refurbishment project Powerhouse Kjørbo shows that a plus-energy level, including the
construction phase and embodied energy for materials, is achievable for the two office blocks
in Norway. Necessary strategies for achieving this high ambition are a significant level of
energy efficiency (e.g. passive house standard, innovative ventilation strategies), high focus
on materials used, and optimized energy supply system for production of thermal energy and
electricity onsite. The project is expected to be an important demonstration project for plus-
energy buildings, both in Norway and worldwide.
Acknowledgement: The Powerhouse alliance was established by Entra Eiendom, Skanska,
Snøhetta, the environmental organisation ZERO and the aluminium company Hydro in 2011.
Entra Eiendom is the owner of the two Powerhouse Kjørbo office buildings. Skanska is the
contractor and the company’s energy experts lead the energy concept development. Snøhetta
is the architect. Asplan Viak is the engineering company, which is also the renter of the
renovated buildings, and has been part of the design team. The energy concept, and in
particular the work with estimating embodied energy figures, has been carried out in close
cooperation with the research center ZEB.
2. Zero-Energy Urban Buildings and Zero-Energy Communities
Speaker: Santamouris, Matc
Abstract: The present paper aims to discuss the main problems and features of urban
buildings. The characteristics of the actual energy consumption, the main challenges on the
urban built environment and the future prospects are discussed and analysed. The main
technological and political priorities regarding the implementation of urban zero-energy
buildings and settlements are discussed.
Keywords: urban microclimate, "heat islands", conservation techniques, passive solar
technologies, zero-energy buildings and settlements
2.1. Introduction
The built environment is not just the collection of buildings, it is in fact the physical result of
various economic, social and environmental processes strongly related to the society
8
standards and needs. Economic pressures related to property and labour market, investment
and equity, household income and the production and distribution of goods, in combination
with social aspects related to culture, security, identity, accessibility and basic needs, and
finally, in association with environmental influences related to the use of land, energy and
materials, define and determine the built environment we live in.
The continuously increased urbanization, combined with the degradation of the urban climate
and the recent upsurge of concern for the environment as well as the recent technological
developments in the field of new energy technologies, defines the major priorities and
considerations for urban buildings and structures and offers major technological and financial
opportunities.
Increased industrialization and urbanization of the recent years have affected dramatically the
number of the urban buildings with major effects on the energy consumption of this sector. It
is expected that 700 million people will move to urban areas during the last decade of this
century[1]. The number of urban dwellers has risen from 600 million in 1990 to 2 billion in
1986 and if this growth continues, more than one - half of the world’s population will live in
cities by the end of this century, while 100 years ago, only 14 percent lived in cities and in
1950, less than 30 per cent of the world population was urban. Today, at least 170 cities
support more than one million inhabitants each. As estimated [8], in the United States, 90
percent of the population is expected to be living in, or around, urban areas by the year 2000.
The situation will be even more dramatic in developing countries. Already, twenty three of
the thirty four cities with more than 5 millions inhabitants are in developing countries.
In EEC countries primary energy consumption in buildings represents a mean percentage of
the total energy consumption close to 40 percent. Energy consumption of buildings have
enormous economic and environmental implications. A very high part of this energy is
produced from conventional fuels that will not be available to the future generations. Also,
conversion of fuels into energy have an important effect to the environment through the
emissions they cause
Environmental quality of indoor spaces should be seen as a compromise between building
physics applied during the building's design, energy consumption and outdoor conditions.
Indoor environmental quality can be seen as a combination of acceptable indoor air quality
along with satisfactory thermal, visual and acoustic comfort conditions.
Research and development on the field of advanced energy systems, solar energy and energy
conservation in buildings started with a relatively simple mandate : reduce oil dependence.
Three decades later that goal has partly achieved, although the demand for zero-energy
buildings offering an improved environmental quality of indoor spaces is emerging. Improved
9
living standards and increased outdoor pollution especially in urban environments put the
emphasis mainly on aspects related to minimization of the energy consumption, indoor
quality and comfort as well as to their relation with the urban environment.
Although indoor air quality is almost a direct function of the outdoor environmental quality,
comfort in general is a more complex notion dealing with the physiological and psychological
well being of the inhabitants and not necessarily the result of some thermal and visual
parameters [9], having however a very serious impact to the specific energy consumption of
buildings. New findings concerning appropriate comfort standards especially for the summer
period, can result in high energy savings. It is suggested that, nominally, the same task can be
achieved for different expenditure of energy [10].
The interrelation of all parameters defining indoor environmental quality should therefore be
seen from an holistic view in the framework of an environmental sound energy strategy for
near zero-energy buildings and settlements that is the absolute prerequisite to a sustainable
society.
2.2. Methodology
Alternative energy production techniques, passive heating, cooling and daylighting
technologies based on the optimised use of solar resources combined with cooling strategies
based on improved thermal protection of the building envelope, and on the dissipation of
building's thermal load to a lower temperature heat sink, are in our days very effective. These
strategies and techniques have already reached a very high level of architectural and industrial
acceptance. Where advanced active and passive techniques are being considered as
alternatives to conventional energy sources they offer important environmental quality,
health, financial, and operational benefits.
Recent knowledge gained through intensive research and appropriate applications on the field
of energy efficiency and solar utilisation, offer the necessary products, tools and techniques
that permit the design of outstanding structures revealing ambitious architectural concepts,
characterized by the minimum of energy necessary for heating, cooling and lighting as well as
from the best indoor environmental quality
On the other hand, urban microclimates are characterized by heightened air temperatures,
unique wind flow patterns, noise, and pollution. Deficiencies in development controls have,
unfortunately, important consequences. The size of housing plots has been reduced increasing
thus densities and the potential for traffic congestion. Increasing number of buildings has
crowded out vegetation and trees. For example, as Athens has grown, open spaces have been
reduced to 2.7 square meter per capita while the corresponding number for Paris, Rome,
10
London and Vienna are 8.4, 9.9 and 15 respectively. Also, it is reported that New York City
has lost 175000 trees, or 20 percent of its urban forest, in the past ten years [8].
As a result of the evolution of urban areas, cities across the planet are getting progressively
hotter than their surrounding areas. Since the turn of the century, average annual temperatures
in many cities have increased by as much as 2.8 C. Increased urban temperatures have a direct
effect on the energy consumption and the outdoor air quality while increased morbidity and
loss of productivity have been shown to result from the stress caused by “heat islands” in
large cities. The Intergovernmental Panel on Climate Change, (IPCC) reported as “major
findings” that the populations which are most vulnerable to climatic change include the urban
poor living in shanty towns, especially in mega-cities. IPCC concluded that a principal issue
is the impact of climate change on human settlement and related socioeconomic activity.
In fact it is found that higher urban temperatures increase the electricity demand and the
production of carbon dioxide and other pollutants. Heat island effect in warm to hot climates
exacerbates cooling energy use in summer. It is reported, that for US cities with population
larger than 100000 the peak electricity load will increase 1.5 to 2 percent for every 0.55 C
increase in temperature. Estimations show that for Los Angeles almost 300 MW are needed
additionally for 0.55 C temperature increase. Taking into account that urban temperatures
during summer afternoons in US have increased by 0.6 to 2.1 C during the last forty years, it
can be assumed that 3 to 8 percent of the current urban electricity demand is used to
compensate for the heat island effect alone. Calculations shown that electricity costs for
summer heat islands alone could be as much as $1 million per hour, or over $1 billion per
year.
It is therefore evident that energy consumption and environmental quality of urban buildings
as well as the corresponding measures for energy conservation merit to be examined
independently to the other types of buildings and energy and environmental studies for urban
buildings should be considered in a more extended framework. This framework involves
except of the classical building science, advanced notions of urban building climatology, air
pollution engineering, urban planning, energy management, urban biometeorology and
ecology, as well as scientific notions on legal, economic and financial aspects related to urban
environments.
For sure, there is a big list of ideas on how to decrease the energy consumption of buildings in
our cities. However, and according to the author view and opinion, the main concerns and
technological ideas that may be well thought-out in priority are :
a) Improve the Urban Microclimate, fight heat island and reduce the energy needs for
additional cooling.

11
b) Use of sustainable energy supply systems for buildings based on the use of renewable
sources like solar and biomass district heating and cooling.
c) Use of demand side management techniques to control and regulate the energy
consumption of big consumers.
d) Integration of passive and active solar systems in the envelope of new and existing
buildings, and use of high energy performance supply and management equipment
e) Application of appropriate city planning techniques when new settlements are designed.
The idea of compact city, reducing the needs for transport as well as the energy
consumption of buildings is gaining an increasing acceptance. Ideas like these developed
by the New Urbanism movement, based on mixed land uses, greater dependence on public
transports, cycling and walking, decentralization of employment location, etc, may be
further developed and applied to create a more sustainable urban environment.
In parallel, a series of institutional, economic and regulatory actions are foreseen as important.
The more important of them may be :
f) The development of a new more efficient legislative frame on the energy performance of
buildings setting mandatory targets for energy conservation and use of renewable energy.
g) Integration of the environmental cost in the price of goods and services
h) Adoption of ‘green consumption’ principle by the urban citizens
i) Adoption of the principle of ‘fair trade’ by the citizens and their institution in order to
reduce exploitation of people mainly in less developed countries.
j) Application of new ecological principles on the production and management of energy
related systems and components, like the principle of natural capitalism.
k) Strength the involvement of local authorities on the production, maintenance and
management of the energy systems on the city level.
2.3. Discussion
Based on the existing knowledge several questions appear to be dominant in the whole
scientific discussion.
• How environmental programs in cities can improve the living conditions and the
economic potential of the population and especially of the low income citizens ? In
particular how measures to improve environmental conditions in cities have to be
designed to create jobs locally and generate an important financial outcome ? Recent
projects aiming to improve the energy and environmental conditions in buildings and
open urban areas, have shown that it is possible to improve considerably outdoor
thermal conditions during summer, enhance comfort conditions, fight local pollution,
decrease or minimize the energy consumption and generate local jobs. In parallel, the

12
whole design procedure allows to educate young engineers and scientists on
bioclimatic technologies. Finally, new developments allow the demonstration of new
and advanced materials and techniques, while they offer opportunities for alternative
industrial procedures
• Is it possible and how to generate additional economic outcome and create new jobs
through the application of innovative environmental technologies in cities, like zero-
energy buildings and settlements, etc, ? Various mitigation techniques to decrease the
energy consumption of buildings, fight heat island and improve environmental
conditions have been proposed. Selection of appropriate technologies and materials to
be used in the urban fabric and buildings can contribute to the improvement of the
urban microclimate, the decrease of the energy loads of the buildings and the
reduction of air pollution.
• Is retrofitting of existing buildings and open urban spaces, the most powerful
procedure to enhance economic activity in cities, generate wealth and new jobs while
improving the quality of life of urban citizens ?
2.4. Conclusions
The energy consumption of the building's sector is considerably high and important energy
savings can be achieved using advanced conservation techniques and passive solar
technologies. Zero-energy buildings and zero carbon settlements is a huge challenge for the
scientific community that already works towards this direction. The deterioration of the
outdoor environment creates important energy and environmental problems and asks for a
more profound examination of the urban environment and their impact to buildings as well as
to an extended application of passive heating, cooling and daylighting techniques.
Appropriate research actions and pilot applications should aim to understand better micro
climate around buildings, to understand and describe comfort requirements under transient
conditions especially during the summer period, to improve quality aspects, and to develop
alternative heating and cooling systems and techniques towards the optimization of the
technical and economic parameters that define zero-energy buildings and settlements.
Past and present research on the buildings sector has permitted to achieve a certain maturity
especially regarding passive solar heating and cooling technologies. To pass from research to
practice is always a slow process and requires a favourable social, financial, legislative and
technical environment. The undertaken actions contribute towards this goal and the first
important results are now clear. Appropriate design of future research actions in order to face
the new major energy and environmental problems in urban buildings and settlements,
consolidation of the existing research and development as well as continuation of the
dissemination processes to further inform, educate and convince building designers and

13
operators define the necessary strategy for future less consuming, near zero-energy, and more
comfortable buildings. It is characteristic that a recent study carried out in Greece has shown
that the financial investment potential for retrofitting of the existing building stock exceeds 20
billion euros, may result in an energy conservation of about 15 ΤWh, and a decrease of the
peak electricity demand close to 1.7 GW, while it may generate up to 100000 new jobs.
3. Simulating intervention scenarios for carbon reduction in urban planning
(SEMANCO Project)
Speaker: Cipriano, Xavia
Abstract: The aim of this section is to present the web-based platform developed by the
SEMANCO project. The platform facilitates the access to dispersed information on building
characteristics, systems and occupation, and uses it to calculate the energy performance of
buildings and urban areas. It also enables the user to create energy efficient interventions
and to evaluate and compare them using a multidimensional set of performance indicators. In
this way, the platform helps to meet the challenges of energy efficient urban planning and
CO2 emission reduction.
Keywords: energy efficient urban planning, CO2 emission reduction, multi-scale perspective,
multi-criteria analysis
3.1. Introduction
The energy performance of buildings depends on multiple aspects: the buildings envelope, its
geometry, systems, occupation and use. Moreover, the urban environment plays an important
role in the energy performance of buildings due to the impact of surroundings, such as
shadow casting over them. Urban planners should consider all these aspects in order to
perform an energy efficient urban planning aimed at reducing energy consumption and CO2
emissions. However, to access and use this information is far to be an easy task: data is often
not available, or when it is, it is dispersed or unrelated to other data, or not available in the
required formats that are necessary to understand the environmental and socioeconomic
impact of energy efficient measures.
The SEMANCO project has developed a 3D web-based platform which allows the user to
implement a methodology proposed for simulating different energy improvements in a city or
in a area by using semantic data modelling. It enables to look-up the stored information in
different sources and facilitates the analysis of results within a determined number of
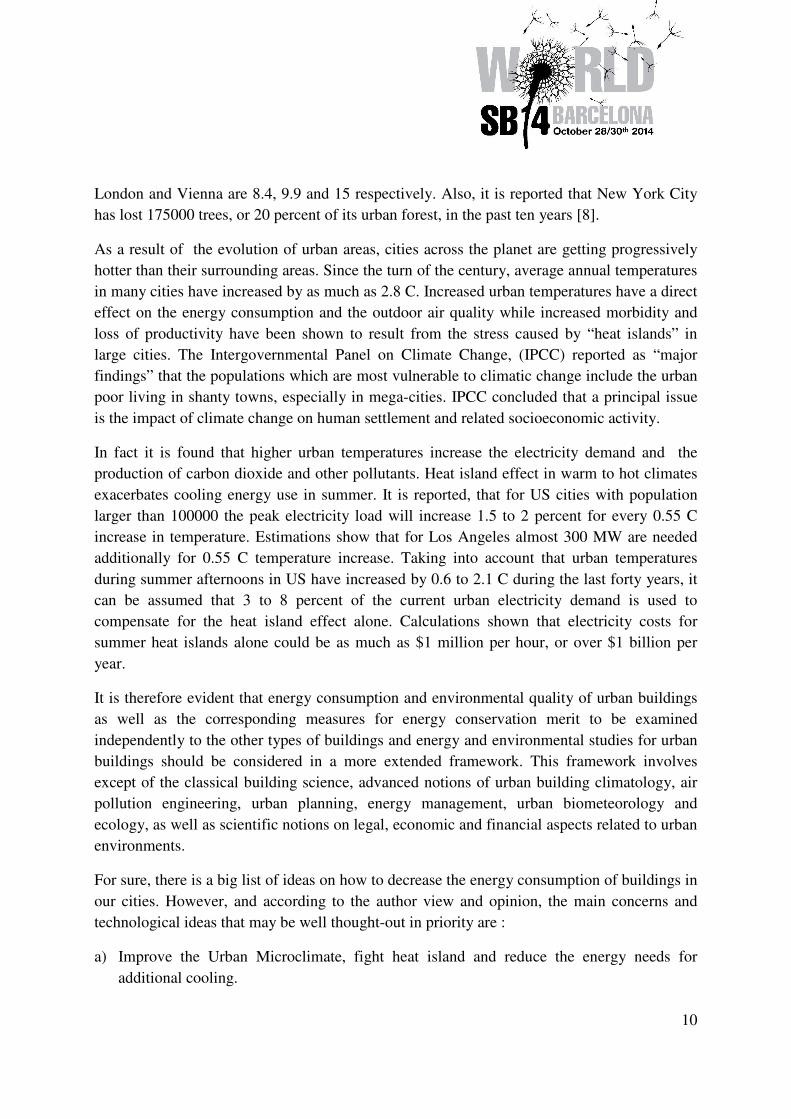
embedded tools to calculate the energy performance of different scenarios. See Picture 3
below.
14
Picture 3: a)Filtering buildings according to year of construction, energy need and built surface, b) building
selection in the Platform interface Source: SEMANCO platform (2014) [19].
This platform allows creating multiple scenarios through the definition of urban energy
models, plans and projects. Each urban energy model is a result of the combination of
available input data like cadastre, GIS, climate, census and typologies (classified and stored in
the Semantic Energy Information Framework (SEIF)) with the specific energy tools (i.e.
URSOS in Spain, SAP in UK), defined by different user's profile. See Picture 4 below.
Picture 4: Relation of embedded energy tools with scenario creation.�Source: SEMANCO project (2014) [18] .
3.2. Methodology
The methodology was performed to simulate and compare the energy performance of an
urban energy system and is based on simplified hourly simulation methods to calculate the
energy demand and consumption of both individual and groups of buildings.
First of all, the user has to define an Urban Energy Model, which encompasses by entering the
name of the model, defining the available data to be used and the tools that interact with the
data. For instance, in the case of Spain, the selected tool for energy simulation at urban level
is URSOS which is based on an energy balance method for each building considering the
influence of shadows.
These tools and data are used to create the baseline of the urban energy system at a particular
time. After that, the platform shows a 3D map of the city presenting the baseline of the energy
performance of the city and the target urban area. In order to do so, the user selects an
indicator (e.g. energy demand, CO2 emissions) and the platform shows the building coloured
according to their performance under the selected indicator. Also, the user can click on each
building and the platform retrieves information from the building data table and visualizes it
in a pop-up window. In this way, the user is able to identify the building or urban area
presenting poor energy performance. Also, the user can filter the buildings according to
ranges (minimum and maximum values) of each indicator and to show the buildings that are
between those ranges.
Then, the objectives of an energy efficient urban planning are defined by the user, who creates
a Plan and add the selected the building/s or changes to this plan. These building are the target

15
for energy efficient interventions aimed at improving the energy performance of buildings and
the urban area as well. The Plan is related to the urban energy model selected/created
previously and, within this plan, the user defines a set of Projects aimed at fulfilling the
objectives of the Plan.
The projects may encompass different energy efficient interventions, such as improvements in
windows, insulation or heating and cooling systems or even changes in geometry, shape or
configuration of streets and buildings. The user can create several projects, whose energy
performance is calculated by the platform followed by a visulazation of a pre-defined set of
multidimensional indicators.
Finally, the user can proceed to compare the projects by means of a multi-criteria tool. That
is, a tool that compares the projects according to the scores of the set of indicators, without
reducing their values to a single unit of measurement. The user is also able to add new
indicators and their values to include, for instance, other aspects not considered by the
platform (e.g. costs, social acceptance). The outcome of the multi-criteria tool is a ranking of
projects that support decision making in energy efficient urban planning.
3.3. Case studies
The SEMANCO project considered 3 case studies, which have been planned to define the
functionalities of the platform. Moreover, these case studies consider different data, tools and
users as it is explained bellow:
a. Copenhangen, Denmark –This case encompasses a tool developed in an Excel
spreadsheet with data requirements based on representative typologies. That is, the
energy intensity of the buildings depends on their use and year of construction
b. Newcastle, United Kingdom. This case incorporates the Standard Assessment
Procedure (SAP) tool, defined as the National calculation method of building energy
performance in the UK. The SAP tool has typical parameters required in the Energy
Performance Certificates (EPC) like geometry, HVAC systems or even pictures from
façades.
c. Manresa, Spain. This case has embedded the Urban Planning and Sustainability
(URSOS) software to the platform. URSOS is a simulating software which gathers all
information before (typologies and EPC parameters) combined with more specific
data like climate, occupation, thermal transmittance, infiltration, cross-ventilation.
The 3 proposed case studies pretend to automate the calculation of the same indicators
through different calculation methods. So that, the achievement of results will depend on the
sophistication and complexity level required in each urban energy model.
16
3.4. Discussion of results
3.4.1. Description of the URSOS testing sample
The case of the city of Manresa is the selected testing sample for the integration of URSOS
tool. The aim of this case study is to assess the energy performance and CO2 emissions in an
area of the Casc Antic District (old town of the city) based on the building refurbishment
which had already taken place over the last 10 years and then it can be used to develop a
future better urban energy model.
The first step is to gather the required information to perform an energy model for the
baseline scenario. There are proposed two levels of work in this case: building and
neighbourhood.
Regarding the building level, the energy assessment proposed is a comparison between the
improved buildings (new and retrofitted scenarios) and the other old buildings (baseline). In
this case different energy models are considered to validate new intervention scenarios.
Regarding the neighbourhood level, the definition of building typologies will be necessary to
up-scale an energy consumption analysis from the building to neighbourhood scales.
3.4.2. Integration of visualization tools
A map sufficiently detailed of the city is generated from the online connexion to the
municipal cadastre and allows to show a friendly 3D viewing of the GIS. The online tools
combine interactive 3D models, tables and diagrams to display energy related data.
Each energy model can be applied to a group of buildings in a selected area or to the whole
city. The simulation results will be shown in the 3D Map or other different information
windows thanks to an ontology created to access the same energy-related information from
different sources.
3.4.3. Integration of URSOS
URSOS is specially used to assess and compare the energy and environmental performance of
buildings in an determined urban area. It also simulates the thermal behaviour of buildings or
residential areas according to climate conditions, thermal characteristics of enclosures,
ventilation rates and volume. Moreover, can result an reliable energy modelling method that
allows urban planners to optimise energy demand and provide results at different scales: one
individual building or a screen-selected group of buildings.
This tool has been embedded in the SEMANCO platform with the support of their own
developers [16]. The result is a calculation engine offered to end-users as a “integrated tool
17
service” in the same platform. Once URSOS is selected, input data will be automatically
provided by SEIF, but with the possibility of changing specific values manually in the XML
input file. Once the calculation is performed, the whole URSOS output file can be
downloaded as seen in Picture 5 below.
Picture 5: Workflow of URSOS integration with SEMANCO Platform. Source: SEMANCO project (2014) [18] .
3.4.4. Comparison with scenarios
Regarding the study case of Manresa, a first level of work shall consider a comparison
between different situations based on the level of refurbishment. Within the Multi-Criteria
Development Analysis tool (MCDA) the user will allow to compare different projects from a
list of indicators. The user decision will be based on the selection of indicators with absolute
or intensive values (e.g. surface or time, respectively) or additionally, defining a “user
indicator” with values according to the user’s knowledge.
Afterwards, user shall configure his/her respective preferences of weights and thresholds for
each indicator and then, perform the multi-criteria analysis by clicking on the corresponding
button.
The results of the MCDA tool will be shown in a ranking list according to the selected
indicators. For instance, an example of results is provided in the next Picture 6:
Picture 6: Example of ranking list obtained with the MCDA tool. Source: SEMANCO platform (2014) [19].
From Picture 6, from 5 different situations, the best scenario is determined by a project of
windows improvement. In second and third position are respectively the partial and full
retrofitting projects. In fourth place, there is the baseline situation: do nothing. And the last
rank is for the boiler renewal project. Finally, a pop-up window appears when the cursor is
passing over each project with information about the selected indicators, in this case they are:
energy need, energy demand, CO2 emissions, energy and investment costs.
3.5. Conclusions
The SEMANCO platform is designed to allow adding new data sources and tools to other
study cases related to urban areas from other cities. This procedure is not automatic and shall

18
follow the same process of data semantic modelling with a new ontology and tools. Once the
methodology is established, the new stored data will be automatically enriched from the
different external data sources.
This platform represents a very innovative way of allowing end-users to access information
and analysis from a urban energy model, adapted to their needs, through the various
interfaces, diagrams and tables, in an intuitive way. It is very useful to help in the
development of future urban plans related to nZEBs.
4. The nZEB promotion within SEAP (AIDA Project)
Speaker: Lopez, Jose Santosa
Abstract: A methodology have been developed to promote public buildings as nZEBs within
municipal roadmaps. It is based in the definition of needed actions to obtain the
accomplishment of nZEB targets in urban scale mentioned by the EPBD Recast [1]. It mainly
proposes to use different simplified analysis techniques at building level and then gives an
orientation of values to achieve regional nZEB criteria for each construction whether for new
buildings or renovations.
Keywords: nZEB action, nZEB criteria accomplishment, Sustanaible Energy Action Plan,
municipal roadmap, Covenant of Mayors
4.1. Introduction
The Covenant of Mayors [15] involves many local and regional authorities to reach and try to
exceed the implementation of sustainable energy policies in the European Union. Within the
Sustainable Energy Action Plan (SEAP), each municipality can define its CO2 reduction
objectives by at least 20% to achieve in 2020. This document is a municipal roadmap which
includes the scheduled activities with the corresponding future measures and deadlines to
obtain these objectives. And it is composed by the two main templates:
• Baseline Emission Inventory (BEI): It quantifies a reference for CO2 emissions based
on energy consumption generated by all economic sectors (residential, commercial,
industrial, municipal, transportation, etc.) and then it allows comparing to future
scenarios.
• Sustainable Energy Action Plan: It collects all the actions aimed to reduce gas
emissions in 2020 and also including energy production using Renewable Energy
Sources (RES). Here each action or measure shall be described in detail and calculated
from the economic cost results with the corresponding savings to energy and CO2
emissions.

19
In consequence, nZEBs become a valid option for the CO2 reduction target predefined in
SEAPs due to they generate a very low level of energy consumption an thus low CO2
emissions.
4.2. Methodology
Within the AIDA project, a “nearly” Zero-Energy Building action involves a measure of
public awareness campaign to promote nZEBs at municipal and regional levels. The proposed
actions shall describe common SEAP indicators like economic cost, renewable production,
energy saving and CO2 emission reduction, as well as other more specific such as payback
period and abatement cost.
The methodology proposed to calculate a nZEB action is following the next steps:
1. First of all, selecting the scale level to perform the calculation is required. For
instance, a building section, whole building, a park of buildings or with a more widely
way, a target area.
2. A detailed data sheet of the selection will serve to gather all the necessary information
to perform the calculations for the action indicators.
3. An energy assessment for the bioclimatic measures and renewable production to have
a result about the suitability of the selection (e.g. building) to the nZEB criteria
achievement defined (see in Case studies).
4. Costs and other economic indicators due to satisfy the bioclimatic measures and
renewable production defined.
5. Summary of the action within a table which shows the results of indicators.
An excel datasheet is available to ease in obtaining the result values of the action indicators
(see in Discussion of results)).
4.3. Case studies
A “nearly” Zero-Energy Building is defined as a building with a high-energy performance
which leads to low consumption level. And the remaining energy demand has to be mostly
covered by energy from renewable sources produced ‘on site’.
Regarding the energy balance, there are several ways to define a building as nZEB. Within
SEAP procurements, the best nZEB concept adaptation can be followed by the ‘Nearly Net
ZEB’ from the definitions are shown in Picture 7 below:

20
Picture 7: Suggested definitions of nZEB coming from the NZEB [22]: The main differences regard the balance
metric, balance boundaries and generation systems localization. Source: SHC Task 40 - Net ZEB Evaluation
Tool [21].
To have a successful implementation for the actions to promote nZEBs and ensure coherence
with the new Directive is necessary to start defining reasonable boundaries for the scope of
SEAPs. These boundaries were recently determined as principles for “nearly” Zero-Energy
Buildings defined by the BPIE study [23]. According to these principles, different nZEB
criteria can be proposed for the calculations considering as relevant parameters: climatic zone
and type of building, which are relevant for energy consumption level (observed in
experiences like the Ecofys study report [24]).
Therefore, regional nZEB criteria shall be implemented at least according to each climatic
area and type of building for the possible case studies. In the AIDA project, each partner will
consider these criteria as a country level. The proposed nZEB criteria for Spain are:
a. The building must achieve the energy rating of Class A
b. The energy balance in primary consumption must be covered at least between 50 and
70% with renewable energy production.
c. The total primary energy consumption has to be between 50-60 kWh/m2year with a
maximum emission of 3 Kg CO2/m2year.
The AIDA project limits the promotion of nZEBs on a preliminary and voluntary
achievement of nZEBs across public sector and then leading it as an example to have a better
involvement of the other tertiary and residential sectors.
There are two types of SEAP actions can be dealed:
• New building: In accomplishment with the criteria defined to reach nZEBs and considering an Integrated Energy Design (IED) methodology for all construction stages, from design and construction until the building usage.
• Partial or full refurbishment: Focused in determining an existing building
renovation having in consideration its current energy consumption, building
architecture and equipment.
4.4. Discussion of results
4.4.1. Proposed calculation tools
There are proposed different open-source simplified tools which allow to obtain reliable and
quick results to perform the energy calculations required by SEAPs:

21
a. Energy certification tools in Spain: CES-CERMA[25] (new buildings), CE3-CE3X
[26] (existing buildings).
b. Energy audits: GENERATION [27], EQUEST [28], SIMEB [29].
c. Renewable energy design: PVGIS [30] (solar PV), CHEQ4 [31] (solar Thermal),
BIOHOUSING [32] (Biomass).
4.4.2. Template used to calculate a nZEB action
There are 4 main available sections to help user:
1. Building / Target Area Datasheet
2. Energy Assessment of the nZEB Refurbishment or Criteria Accomplishment
3. Economic Assessment of the nZEB Refurbishment or Criteria Accomplishment
4. Summary of the nZEB Action
In the next Picture 8 and Picture 9 , it appears an example of applied information like type of
nZEB action, building features and energy results:
Picture 8: Description of the building or target area. Source: CIMNE (2014) [20].
Picture 9: Achievement of the highest energy efficient class without the contribution of RES. Source: CIMNE
(2014) [20]
Once the white spaces (blue-coloured numbers) are filled, the tool will provide the results of
the action. An example of obtained results is shown as following Picture 10 and Picture 11:
Picture 10: “nearly” Zero-Energy consumption and very low CO2 emission results. Source: CIMNE (2014)
[20].
Picture 11: Summary of main indicators for the nZEB action. Source: CIMNE (2014) [20].
As the picture above shows, the values of main indicators for the nZEB action can be
exported to the municipal SEAP document and used to design for the future measures.
4.4.3. Implemented results in Spain

22
The updated list to the middle of 2014 is in below.
Picture 12: List of nZEB implemented in Spain within SEAPs. Source: CIMNE (2014) [20].
4.5. Conclusions
Depending on the type of action, the information requested is different. In the case of a new
building, the action is oriented to a reference situation applied for the same building to
standard requirements according to national building codes. In the other case, an existing
building, the information required is more detailed in order to have a suitable energy
efficiency improvement regarding the current situation. In both cases, results shall be
provided with the same roadmap indicators.
A SEAP can ensure a good nZEB promotion because municipality is involved with its
roadmap and due to the recent European directives can be used to share results to other
interested sectors.
Overall conclusion of the session
Different points of view are boarded:
Strenghts
• Within high ambition retrofit strategies (e.g. passive house standard, innovative
ventilation strategies) by using high-efficient materials and the optimization of energy
supply systems for production of thermal energy and electricity onsite, there is a high
possibility to achieve a zero-energy level.
• Zero-energy buildings and zero-carbon settlements are a huge challenge for the
scientific community that already works towards advanced conservation techniques
and passive solar technologies in order to reduce the issue of high energy consumption
in the present building sector.
• The simulation of intervention scenarios boosts the future development for urban plans
with the nZEB achievement even more realistic and consistent than individually
performed at building level.
23
• SEAP encourages municipal authorities to fulfill the commitment of 20% reduction in
CO2 and promote the “nearly” Zero-Energy Buildings construction in the near future
according to the energy performance of building directives.
Weaknesses
• Despite past and present research and pilot actions have been performed and can solve
major energy and environmental problems, to assimilate them in the practice is always
a slow process and it involves favourable mecanisms to achieve relevant results in the
future.
• Simplified software tools are not accurate to perform reliably energy simulations and
they can easily lead to error. Expert knowledge is required to modify the predefined
values.
• An energy audit of the existing building is required to obtain better results on energy
efficiency measures and consequently, to calculate the suitable energy consumption
balances for the achievement of nZEB retrofitting.
• Spain is one of the countries there are more municipalities with SEAPs subscribed in
the Covenant of Mayors. This reality seems to be nearer to be eligible for possible
funding opportunities instead of reaching the objectives of reducing CO2 emissions or
having in consideration the nZEB as a worthwhile investment.
New developments towards nZEBs
• Net ZEB Evaluation Tool: http://task40.iea-shc.org/Data/Sites/11/documents/net-
zeb/Net-ZEB-Evaluation-Tool2.xlsm
• SEMANCO Platform for simulating urban scenarios:
http://arcdev.housing.salle.url.edu/semanco/platform_prototype5/
• Implementation guide for including actions to promote nZEB within SEAP:
http://aidaproject.eu/
• Energy Accounting and Management System - SIE (Sistema de Información y gestión
Energética) (online payment tool): http://www.inergybcn.com/sie-sistema-
dinformacio-i-gestio-energetica/?lang=en
References [1] Directive 2010/31/UE of the European Parliament and of the Council of 19 May 2010
on the energy performance of buildings (recast). Accessed online: 2014-06-30.
Download link: http://eur-
lex.europa.eu/LexUriServ/LexUriServ.do?uri=OJ:L:2010:153:0013:0035:EN:PDF
24
[2] www.powerhouse.no
[3] www.zeb.no
[4] NS 3701:2012. Kriterier for passivhus og lavenergibygninger. Yrkesbygninger
[5] SIMIEN, ”Simulering av energibruk og inneklima i Bygninger” from
Programbyggerne
[6] Norsk Standard NS 3031:2007, Beregning av bygningers energiytelse. Metode og data
[7] Dokka, T.H., Sartori, I., Thyholt, M., Lien, K. and Lindberg, K.B. (2013) A
Norwegian Zero Emission Building Definition, Nordic Passive House conference, 15-
17 Oct., Göteborg, SE.
[8] Brown L. R : State of the World : A World Watch Institute Report on Progress
Toward a Sustainable Society. New York, N.Y. W.W. Norton. Chapter 3.
[9] United States Environmental Protection Agency : Cooling Our Communities. A
Guidebook on Tree Planting and Light Coloured Surfacing. January 1992.
[10] E. de Oliveira Fernandes : The Relationship Comfort-Energy - IAQ. Proc. of the
Workshop on Indoor Air Quality Management, C.A. Roulet, (Ed), The Commission of
the European Communities, Directorate General XII for Science, Research and
Development, p.p. 95-102. Lausanne.
[11] N. Baker and M. Styvensen : PASCOOL Final Report on Comfort, Commission of the
European Communities, Directorate General for Research. November 1995.
[12] Eurostat 2012. Energy balance sheets 2009-2010. Eurostat Statistical books. Accessed
online: 2014-01-31. Download link:
http://epp.eurostat.ec.europa.eu/cache/ITY_OFFPUB/KS-EN-12-001/EN/KS-EN-12-
001-EN.PDF
[13] Directive 2009/28/EC of the European Parliament and of the Council of 23 April 2009
on the promotion of the use of energy from renewable sources and amending and
subsequently repealing Directives 2001/77/EC and 2003/30/EC. Accessed online:
2014-06-30. Download link: http://eur-lex.europa.eu/legal-
content/EN/TXT/PDF/?uri=CELEX:02009L0028-
20130701&qid=1405438470919&from=EN
[14] Directive 2012/27/EU of the European Parliament and of the Council of 25 October
2012 on energy efficiency, amending Directives 2009/125/EC and 2010/30/EU and
repealing Directives 2004/8/EC and 2006/32/EC. Accessed online: 2014-06-30.
Download link: http://eur-
lex.europa.eu/LexUriServ/LexUriServ.do?uri=OJ:L:2012:315:0001:0056:EN:PDF
[15] Covenant of Mayors. Accessed online: 2014-06-30. Download link:
http://www.covenantofmayors.eu/index_en.html
[16] URSOS: Urban Planning and Sustainability software. Download link to URSOS:
http://ursos.es/descargas/
[17] AIDA Project: http://www.aidaproject.eu/

25
[18] SEMANCO Project: http://semanco-project.eu/
[19] SEMANCO Platform:
http://arcdev.housing.salle.url.edu/semanco/platform_prototype6/
[20] CIMNE-Beegroup team: http://www.cimne.com/beegroup/
[21] SHC Task 40: Proposed definitions of the Net ZEB Evaluation Tool. Accessed online:
2014-06-30. Download link: http://task40.iea-shc.org/Data/Sites/11/documents/net-
zeb/Net-ZEB-Evaluation-Tool2.xlsm
[22] I. Sartori, et al., Net zero-energy buildings: A consistent definition framework, Energy
Buildings (2012). Accessed online: 2014-06-30. Download link:
http://www.sciencedirect.com/science/article/pii/S0378778812000497
[23] BPIE study: Principles for “nearly” Zero-Energy Buildings (November 2011).
Proposed principles and approaches for implementation. Accessed online: 2014-06-30.
Download link:
http://www.bpie.eu/documents/BPIE/publications/LR_nZEB%20study.pdf
[24] Ecofys study report: Definition of common principles under the EPBD (February
2013). Accessed online: 2014-06-30. Download link:
http://ec.europa.eu/energy/efficiency/buildings/doc/nzeb_full_report.pdf
[25] General simplified software for Energy Performance Certification of buildings in
Spain. Download link to CES:
http://faen.es/nueva/controler.php?id=8&idDetalle=774&idIdioma=ES. Download
link to CERMA:
http://www.minetur.gob.es/energia/desarrollo/EficienciaEnergetica/CertificacionEnerg
etica/DocumentosReconocidos/Paginas/Procedimientossimplificadosparaedificiosdevi
viendas.aspx
[26] Simplified software for Energy Performance Certification of existing buildings in
Spain. Download link to CE3/CE3X:
http://www.minetur.gob.es/energia/desarrollo/EficienciaEnergetica/CertificacionEnerg
etica/DocumentosReconocidos/Paginas/Procedimientossimplificadosparaedificiosexist
entes.aspx
[27] GENERATION Simplified Energy Audit tool. Download link
http://www.provincia.modena.it/page.asp?IDCategoria=7&IDSezione=3640&ID=794
58
[28] DOE2 simplified: the Quick Energy Simulation Tool (eQUEST). Download link:
http://www.doe2.com/equest/
[29] Simulation énergétique des bâtiments (SIMEB). Download link:
https://www.simeb.ca/
[30] Photovoltaic Geographical Information System (PVGIS). Link to online access:
http://re.jrc.ec.europa.eu/pvgis/

26
[31] CHEQ4: software tool to validate solar thermal facilities in Spain: Download link:
http://www.idae.es/index.php/id.683/mod.pags/mem.detalle
[32] BIOHOUSING Heating tool from European project. Link to online access:
http://www.biohousing.eu.com/heatingtool/default.asp?lang=spa