Embed Size (px)
Citation preview

`
How PLN could Adapt to
Energy Transition
DIVISI ENERGI BARU DAN TERBARUKAN
PT PLN (PERSERO) KANTOR PUSAT

www.pln.co.id |
Important Issues
1. Reduce Global Emission
2. Limited Resources of Fossil Fuel
3. Fossil Fuel for Generation
Utilizing New Technology:
- Huge Capacity of Steam Power Plant Nuclear Power Plant
- Fossil for Power Plant Operation Bxx or CPO
- Natural Gas Synthetic Gas ?

www.pln.co.id |
Preparation of First Nuclear Power Plant
1. PLN involved in Feasibility Study for Bangka Nuclear
Power Plant Ready for other Area
2. PLN welcome if appointed as Owner of Nuclear Power
Plant
3. PLN also ready as off-taker

www.pln.co.id |
Implementation of Bxx, CPO and Biomass
1. Bxx B20 and B30 already implemented by PLN (Diesel)
2. CPO already testing CPO for Diesel/Gas Machine.
3. Co-Firing Testing Jeranjang Steam Power Plant

www.pln.co.id |
Distributed Generation
1. Distributed Generation can be encourage to supply
electricity On-Grid and Isolated
2. Bioenergy can be used as Fuel for Distributed Generation

www.pln.co.id |
3.858
10.060
6.351
7.439 7.237
6.226
7.475
2.174 2.423 3.152
-
2.000
4.000
6.000
8.000
10.000
12.000
2019 2020 2021 2022 2023 2024 2025 2026 2027 2028
PLT EBT Lain
PS
PLTA
PLTM
PLTG/MG
PLTGU
PLTP
PLTU
Jumlah
6
Type of Power Plant
Power Plant Development Plan
56,4
GW
Power Plant Developers
56,4
GW
3.858
10.060
6.351
7.439 7.237
6.226
7.475
2.174 2.423 3.152
-
2.000
4.000
6.000
8.000
10.000
12.000
2019 2020 2021 2022 2023 2024 2025 2026 2027 2028
PLN IPP Murni IPP AP Kerja Sama Antar Wilus Unallocated Jumlah
Total RE: 30%

www.pln.co.id |
Status and Ownership of NRE Power Plant RUPTL 2019-2028
IPP
8,8GW PLN
3,4GW Unallocated
4,4GW
No Power Plant IPP PLN Unallocated Total
1 Planning 4,453 1,888 4,461 10,802
2 PPA 149 149
3 Financing 2,109 150 2,259
4 Construction 2,133 1,421 1 3,555
8843 3460 4462 16,765 Total
Planning 50%
PPA 2%
Financing 24%
Construction 24%
Planning 55%
Financing 4%
Construction 41%
Planning 99.97%
Construction 0.03%

www.pln.co.id |
Summary
The transition of energy will be next challenge of PLN in
circumstance of electricity secure.

www.pln.co.id |
TERIMA KASIH
2 9
Current Policies

www.pln.co.id
SCHEME OF NRE BUSINESS DEVELOPMENT
Business Scheme
IPP
Excess Power
Solar PV Rooftop
IPP
• MEMR Decree No. 50/ 2017
• PPA start from 20 years up to 30 years
Excess Power
• MEMR Decree No. 19/ 2017
• PPA up to 2 years
Solar PV Rooftop
• MEMR Decree No. 49/ 2018
• Net Metering, Ratio 1 : 0.65

www.pln.co.id
NATIONAL ENERGY POLICY
NRE 6.28%
Coal ; 30,52%
Oil,
42.51%
Gas, 20.69%
PRIMARY ENERGY MIX @ 2025
Gas
Coal Oil
NRE
400 MTOE
GEOTHERMAL TARGET: 7.2 GW
ACTUAL : 1.95 GW
HYDRO
TARGET : 17.9 GW
ACTUAL : 5.18 GW
MINIHYDRO TARGET : 3 GW
ACTUAL : 0.31 GW
BIOENERGY TARGET : 5.5 GW
ACTUAL : 1.858 GW
SOLAR PV TARGET : 6.5 GW
ACTUAL : 0.104 GWp
WIND
TARGET : 1.8 GW ACTUAL : 0.075 GW
BIOMASSA TARGET : 8.4 M TON
ACTUAL: N/A
BIOGAS TARGET :489.8 Mio M3 ACTUAL: 25.67 Mio M3
C B M TARGET : 46.0 MMSCFD
ACTUAL: -
BIOFUEL TARGET :13.8 M Kl ACTUAL : 3.75 M KL
92.2 MTOE
23.0 MTOE
45.2 GW
69.2 MTOE
NON-ELECTRICITY ELECTRICITY
~~
Source: HEESI
OTHERS
TARGET : 3.1 GW
PRIMARY ENERGY MIX @ 2017

Summary RUPTL
2019-2029

www.pln.co.id |
3.858
10.060
6.351
7.439 7.237
6.226
7.475
2.174 2.423 3.152
-
2.000
4.000
6.000
8.000
10.000
12.000
2019 2020 2021 2022 2023 2024 2025 2026 2027 2028
PLT EBT Lain
PS
PLTA
PLTM
PLTG/MG
PLTGU
PLTP
PLTU
Jumlah
14
Type of Power Plant
Power Plant Development Plan
56,4
GW
Power Plant Developers
56,4
GW
3.858
10.060
6.351
7.439 7.237
6.226
7.475
2.174 2.423 3.152
-
2.000
4.000
6.000
8.000
10.000
12.000
2019 2020 2021 2022 2023 2024 2025 2026 2027 2028
PLN IPP Murni IPP AP Kerja Sama Antar Wilus Unallocated Jumlah
Total RE: 30%

www.pln.co.id | 15
2025
Energy
Mix
Target
Energy Mix Projection
Type RUPTL 2018-2027
RUPTL 2019-2028
NRE 23,0% 23,0%
Gas 22,2% 22,0%
Coal 54,4% 54,6%
Oil 0,4% 0,4%
Total 100% 100%
EBT 23,2% To maintain the RE mix of 23.2% in 2026-2028, it is necessary
to add rooftop solar PV about 3,200 MW (equivalent to 1.6
million rooftop PV customers @ 2 kW).
The target can be achieved with community participation and
Government support in developing RE, especially rooftop PV,
whose prices are expected to decline further in the future.
Gas 22%
RUPTL 2019-2028

www.pln.co.id |
2019 2020 2021 2022 2023 2024 2025 2026 2027 2028
PLT AL
PLT Bio/Sa
PLTB
PLTS
PLTM
PLTA
PLTP
NRE Additional Power plant RUPTL 2019-2028
No Pembangkit 2019 2020 2021 2022 2023 2024 2025 2026 2027 2028 Jumlah
1 PLTP 190 151 147 455 245 415 2.759 45 145 55 4.607,00
2 PLTA 154 326 755 - 182 1.484 3.047 129 466 1.467 8.009,80
3 PLTM 140 238 479 200 168 232 27 20 20 10 1.533,74
4 PLTS 63 78 219 109 250 4 250 - 2 2 978,40
5 PLTB - - 30 380 220 50 150 - - 5 835,00
6 PLT Bio/S 12 139 60 357 50 103 19 5 15 35 794,10
7 PLT AL - - 7 - - - - - - - 7,00
559,565 932,580 1697,435 1501,000 1114,680 2287,270 6251,500 199,000 648,000 1574,000 16765,03Jumlah
16,76 GW
PLTP 27%
PLTA 48%
PLTM 9%
PLTS 6%
PLTB 5%
PLT Bio/Sa 5%
PLT AL 0,04%

www.pln.co.id |
Status and Ownership of NRE Power Plant RUPTL 2019-2028
IPP
8,8GW PLN
3,4GW Unallocated
4,4GW
No Power Plant IPP PLN Unallocated Total
1 Planning 4,453 1,888 4,461 10,802
2 PPA 149 149
3 Financing 2,109 150 2,259
4 Construction 2,133 1,421 1 3,555
8843 3460 4462 16,765 Total
Planning 50%
PPA 2%
Financing 24%
Construction 24%
Planning 55%
Financing 4%
Construction 41%
Planning 99.97%
Construction 0.03%

www.pln.co.id |
Global Criteria for NRE Development & VRE Grid Requirements
Supply Demand Balance
System Readiness
Economic Feasibility
Funding Capability
Source : RUPTL 2019-2028
VRE Grid Integration Requirements 1. Weather Forecast
Integration of weather sensor and forecast of VRE power plant with control centre
2. Intermittent Anticipation (Buffering) Installation of AGC, operational of high ramping rate power plant, and installation of battery energy storage system
3. Inertia Resources Maintain conventional power plant only for inertia, virtual inertia feature from inverter and introduction of scattered synchronous condenser
4. Technical Minimum Loading Minimum TML establishment for base load power plant both technically and contractually and gas contract
5. Inverter Features LVRT, LFRT, Reactive Power Support, and Half Active Power Support

System Condition
www.pln.co.id
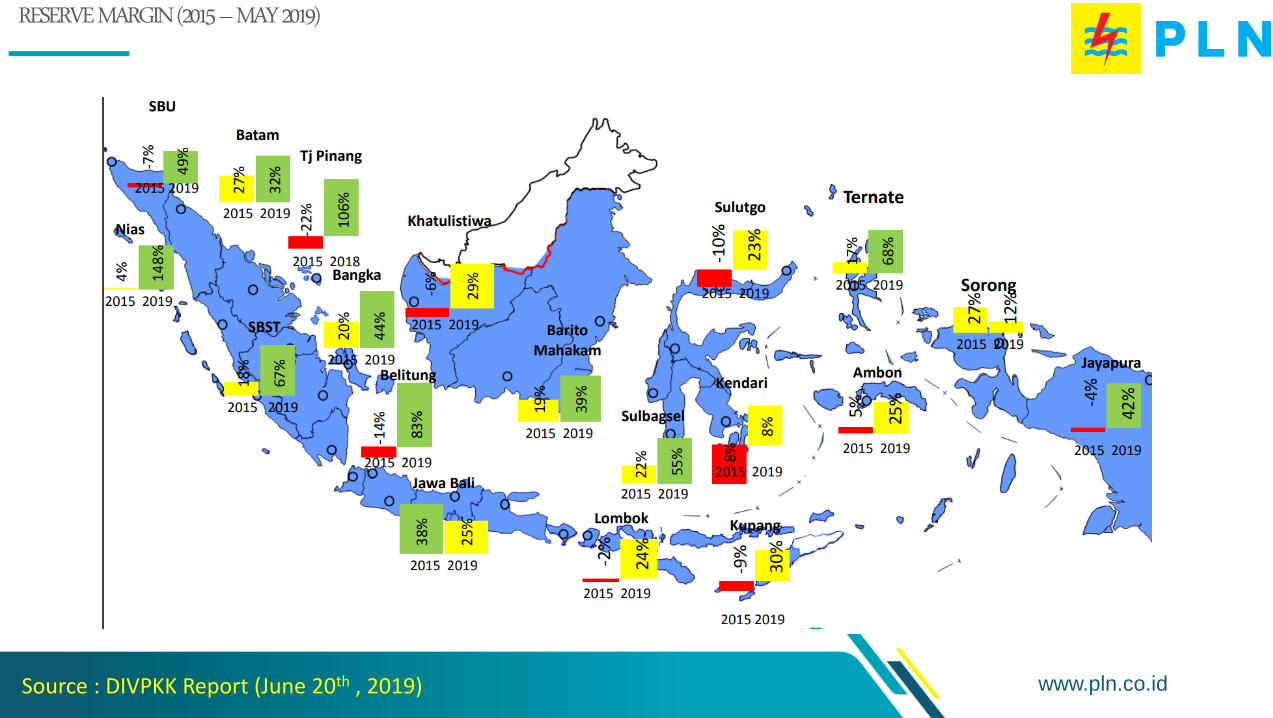
RESERVE MARGIN (2015 – MAY 2019)
Source : DIVPKK Report (June 20th , 2019)

Listrik untuk Kehidupan yang Lebih Baik
THANK YOU

www.pln.co.id
CURRENT GOVERNMENT POLICIES
CONSTITUTION NO. 30/ 2007 ABOUT ENERGY
GOVERNMENT REGULATION NO. 79/ 2014 ABOUT NATIONAL ENERGY POLICY
PRECIDENTIAL DECREE NO. 22/ 2017 ABOUT NATIONAL ENERGY GENERAL PLAN
MEMR DECREE NO. 50/ 2017 j.o. NO. 53/ 2018 ABOUT UTILIZATION OF NEW AND RENEWABLE ENERGY SOURCES FOR ELECTRICITY SUPPLY
MEMR DECREE NO. 39K/20/MEM/2019 ABOUT RATIFICATION OF PT PLN (PERSERO) ELECTRICITY SUPPLY BUSINESS PLAN (RUPTL) YEAR 2019 TO 2028

www.pln.co.id |
Summary of RUPTL 2019-2028
Transmission Lines Development
57,293 kms
Substation Development
124,341 MVA
Electricity Demand Growth
6.42 %
Total Customers Addition
16.9 million
Power Plant Capacity Development
56,395 MW RUPTL 2018-2027 : 56,024 MW
RUPTL 2018-2027 : 63,855 kms
RUPTL 2018-2027 : 151,424 MVA
RUPTL 2018-2027 : 6.9 %
RUPTL 2018-2027 : 526,391 kms
RUPTL 2018-2027 : 25.5 million
Energy Mix in 2025
Renewable 23.0 %
Gas 22.0 %
Coal 54.6 %
Oil 0.4 %
RUPTL 2018-
2027:
Renewable
23.0%
Gas 22.2%
Coal 54.4%
Oil 0.4%
Distribution Network Development
472,795 kms
23 Source : RUPTL 2019-2028

www.pln.co.id |
Status NRE Additional Power plant RUPTL 2019-2028
16,76 GW
OWNER COMPOSITION
IPP 53%
PLN 21%
Unallocated 26%
No Power Plant 2019 2020 2021 2022 2023 2024 2025 2026 2027 2028 Ttal
1 Planning 18 209 494 1,155 806 990 4,858 159 538 1,574 10,801.895
2 PPA 3 39 107 148.520
3 Financing 23 41 154 296 165 170 1,260 40 110 2,259.460
4 Construction 515 644 942 50 143 1,127 134 3,555.155
559.565 932.580 1697.435 1501.000 1114.680 2287.270 6251.500 199.000 110.000 1574.000 16765.030Total
2019 2020 2021 2022 2023 2024 2025 2026 2027 2028
Konstruksi
Pendanaan
PPA
Perencanaan

www.pln.co.id |
PLTP 4%
PLTA/PS 74%
PLTM 16%
PLTS 1%
PLTB 3%
PLTSa 1%
PLT Bio 1%
PLTA/PS 51%
PLTM 10%
PLTS 1%
PLTB 15%
PLT Bio 23%
PLTP 31%
PLTA/PS 44%
PLTM 4%
PLTS 5%
PLTB 1%
PLTS/B 11%
PLTSa 1%
PLT Bio 3%
PLT AL 0%
NRE Additional Power plant Per Regional RUPTL 2019-2028
JBTBN
2,6GW
KAL
0,4GW
SUL
2,1GW
MP
0,2GW
No Power Plant SUM JBB JBT JBTBN KAL SUL MP Total
1 PLTP 1,960 150 1,555 820 75 47 4,607
2 PLTA/PS 2782 2,190 1,154 235 1,559 90 8,010
3 PLTM 621 35 359 95 47 336 40 1,534
4 PLTS 58 145 123 4 29 11 370
5 PLTB 5 20 70 60 155
6 PLTS/B 320 665 304 1,289
7 PLTSa 26 125 63 25 20 259
8 PLT Bio 247 5 71 105 30 79 536
9 PLT AL 7 7
5698.33 629.70 4982.31 2618.86 460.87 2108.82 266.15 16765.03Total
PLTP 34%
PLTA/PS
49%
PLTM 11%
PLTS 1%
PLTB 0%
PLTSa 1%
PLT Bio 4%
PLTP 24%
PLTM 5%
PLTS/B 51%
PLTSa 20%
PLTP 31%
PLTA/PS 44%
PLTM 7%
PLTS 3%
PLTS/B 14%
PLTSa 1%
PLT Bio 0%
PLTP 18%
PLTA/PS 34%
PLTM 15%
PLTS 4%
PLT Bio 29%
JBB
0,63GW
SUM
5,6GW
JBT
4,9GW

www.pln.co.id |
Strategies
Source : RUPTL 2019-2028
NRE
Hydro
Geothermal
Photovoltaic
Bioenergy
Optimization of NRE development especially for the biggest potential energy: Geothermal, Hydro, Bioenergy, & Solar
Optimization of local NRE to increase the electrification ratio in Eastern Indonesia
Hybrid system for the existing diesel power plant
Smart grid development to increase the NRE penetration in the system
Biofuel utilization for the existing diesel generation
Consider the utilization of tidal energy and wind generation in the Eastern Indonesia
Encourage the PV Rooftop Development to support energy mix (23% in 2025)
Excess power option for Bioenergy Development (PLTBm & PLTBg) related to BOOT scheme

www.pln.co.id
INSTALLED CAPACITY PER TYPE OF POWER PLANT (MW) 2014 – MAY 2019

www.pln.co.id
SYSTEM BACKUP
OPTIMUM HYDRO-THERMAL GENERATION MIX STATIC OPTIMIZATION THE ECONOMY OF A PUMP STORAGE HEPP
HYPOTHETICAL ALL-THERMAL FUEL COST

Scheme of
Business
Development
www.pln.co.id |
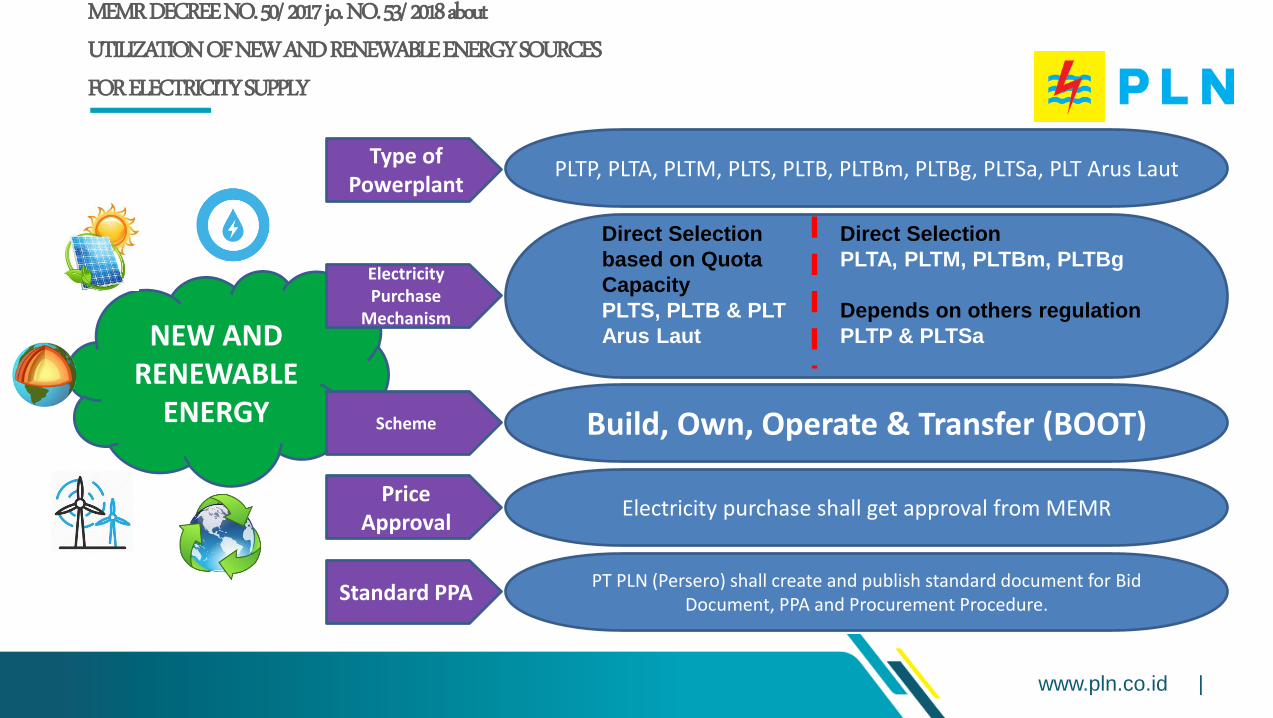
MEMR DECREE NO. 50/ 2017 j.o. NO. 53/ 2018 about UTILIZATION OF NEW AND RENEWABLE ENERGY SOURCES FOR ELECTRICITY SUPPLY
PLTP, PLTA, PLTM, PLTS, PLTB, PLTBm, PLTBg, PLTSa, PLT Arus Laut
Direct Selection
based on Quota
Capacity
PLTS, PLTB & PLT
Arus Laut
Direct Selection
PLTA, PLTM, PLTBm, PLTBg
Depends on others regulation
PLTP & PLTSa
Build, Own, Operate & Transfer (BOOT)
Electricity purchase shall get approval from MEMR
PT PLN (Persero) shall create and publish standard document for Bid Document, PPA and Procurement Procedure.
NEW AND RENEWABLE
ENERGY
Type of Powerplant
Electricity Purchase
Mechanism
Scheme
Price Approval
Standard PPA

www.pln.co.id |
Excess Power
Reference : • MEMR Decree No. 19/ 2017 about Pemanfaatan Batubara untuk Pembangkit Listrik dan Pembelian Kelebihan Tenaga Listrik (Excess Power) • PLN Director Decree No. 0005/ 2018 about Guidelines for Purchasing Excess Power by PT PLN (Persero)
•Purchases are made by Regional PLN / Distribution •Regional PLN / Distribution conducts Assessment by making KKP •Procurement uses the applicable operational guidelines •Before the contract, must get a Price Agreement from MESDM
• Reducing BPP System • Strengthening the System • Up to 2 years, can be extend
• If to strengthen the system, the maximum price is 90% of the local BPP • If to reduce the system BPP, the maximum price is 70% local BPP
Criteria Time Period
Purchasing Price Mechanism

www.pln.co.id |
Solar PV Rooftop Key Point MEMR Decree No. 49/2018
32
1. The value of energy from Solar PV Rooftop that are exported to PLN which is rated at 65% of what is measured in kWh meters of export-import (exim)
2. Solar PV Rooftop capacity is maximum 100% of the customer's contract power
3. In the event that the amount of electricity released is greater than that issued in the current month, the excess (balance) will be accumulated and calculated for the next bill and will be reset to zero at the end of each quarter
4. For Industrial Customers who install Solar PV Rooftop on grid with the PLN network will be subject to emergency capacity and energy costs in accordance with the laws and regulations (Parallel Operation)
5. Minimum Account Provisions remain valid.
6. Solar PV Rooftop customers are postpaid customers
7. Solar PV Rooftop system must have SLO. Up to 25kWp has become part of SLO TR. Can be used above 25 kWp, there must be a new SLO.


![II. DODATKOWE INFORMACJE I OBJAŚNIENIA DO ......Struk-[PLN]: [w PLN]: [w PLN]: [w PLN]: [w PLN]: tura: - W tym Lp. Pozycja bilansowa: Wartość USD Struk-tura: EUR Struk-tura: GBP](https://img.dokumen.tips/doc/110x75/60ad945b6f07f82471767448/ii-dodatkowe-informacje-i-objanienia-do-struk-pln-w-pln-w-pln.jpg)