Embed Size (px)
Citation preview

HOW ENERGY EFFICIENCY CUTS COSTS FOR A 2-DEGREE FUTURE
FRAUNHOFER INSTITUTE FOR SYSTEMS AND INNOVATION RESEARCH ISI

Publisher:Fraunhofer Institute for Systems and Innovation Research ISIBreslauer Strasse 4876139 KarlsruheGermanywww.isi.fraunhofer.deContact: Dr. Jakob Wachsmuth, [email protected]
Co-publishers:• Center for Energy and Environmental Policy Research, Institute of Policy and Management, Chinese Academy of Sciences• European Council for an Energy Efficient Economy• Pontifical Catholic University of Rio de Janeiro
The research was commissioned and funded by: ClimateWorks Foundation, San Francisco, CA
The research was carried out by:• Fraunhofer Institute for Systems and Innovation Research ISI (lead), Jakob Wachsmuth, Vicki Duscha, Matthias Reuter• NewClimate Institute, Hanna Fekete, Markus Hagemann, Niklas Höhne• The Greenwerk, Björn Dransfeld, Felix Röben
Steering Committee of the project:• Nils Borg, European Council for an Energy Efficient Economy• Fabián Gaioli, Coralia Enviromental • Dian Grueneich, Stanford University• Steven Nadel, American Council for an Energy-Efficient Economy• Joachim Schleich, Grenoble Ecole de Management• James Wolf, independent consultant
Local experts involved: • Reinaldo Castro Souza and Rodrigo Flora Canili, Pontifical Catholic University of Rio de Janeiro • Ying Fan and Jin-Hua Xu, Institute of Policy and Management, Chinese Academy of Science • Wolfgang Eichhammer, Fraunhofer Institute for Systems and Innovation Research ISI • Neha Pahuja, The Energy and Resources Institute India, Centre For Global Environment Research • Juan Ignacio Navarrete Barbosa, Comisión Nacional para el Uso Eficiente de la Energía • Steven Nadel, American Council for an Energy Efficient Economy
Acknowledgements:We are very grateful to McKinsey & Company for granting us access to their data on marginal abatement costs and allowing the publi-cation of our aggregated findings. We would also like to thank the steering committee, the local experts, and the following for their helpful comments on an earlier version of this report: Branca Americano (Instituto clima e sociedad), Russell Bishop (New Climate Economy), Smita Chandiwala (Shakti Foundation), Stephane de la Ru Can (Lawrence Berkeley National Laboratory), Amandine Denis (ClimateWorks Australia), John Dulac (International Energy Agency), Dan Hamza-Goodacre (ClimateWorks Foundation), Nicholas Howarth (King Abdullah Petroleum Studies and Research Center), Patty Fong (European Climate Foundation), Shashank Jain (Shakti Foundation), Eberhard Jochem (Institute for Resource Efficiency and Energy Strategies), Seth Monteith (ClimateWorks Foundation), Prodipto Roy (ClimateWorks Foundation) and Devra Wang (Energy Foundation).
DisclaimerThe Fraunhofer Institute for Systems and Innovation Research ISI is solely responsible for the correctness of the findings in this re-port. The conclusions do not necessarily agree with the positions of any the persons and organizations listed above.
Copyright: Fraunhofer Institute for Systems and Innovation Research ISI, Karlsruhe, Germany, 2015

Table of contents I
Table of contents
List of figures ............................................................................................................................... III List of tables ................................................................................................................................. V List of Acronyms ......................................................................................................................... VII
Executive Summary ...................................................................................................................... 1
1 Introduction .......................................................................................................................... 5
2 Role of energy efficiency within decarbonization scenarios .......................................... 7
2.1 Detailed methodology and assumptions ........................................................... 9 2.2 Detailed comparison of 2°scenarios ................................................................ 10
2.2.1 Economy-wide result ....................................................................................... 10 2.2.2 Industry ............................................................................................................ 11 2.2.3 Transport ......................................................................................................... 11 2.2.4 Buildings .......................................................................................................... 11 2.2.5 Power production ............................................................................................. 11 2.2.6 Costs in 2°C scenarios .................................................................................... 12
3 The historical role of energy efficiency ........................................................................... 15
3.1 Historical development of regional energy intensities ..................................... 15 3.2 Historical EE policies and their impacts .......................................................... 17
3.2.1 European Union ............................................................................................... 18 3.2.2 United States ................................................................................................... 19 3.2.3 China ............................................................................................................... 20 3.2.4 India ................................................................................................................. 21 3.2.5 Brazil ................................................................................................................ 22 3.2.6 Mexico ............................................................................................................. 23
4 Cost savings due to EE in reaching the 2°C target ........................................................ 24
4.1 Approach ......................................................................................................... 24 4.2 Potentials, costs and related policies .............................................................. 26
4.2.1 European Union ............................................................................................... 28 4.2.2 United States ................................................................................................... 30 4.2.3 China ............................................................................................................... 31 4.2.4 India ................................................................................................................. 33 4.2.5 Brazil ................................................................................................................ 34 4.2.6 Mexico ............................................................................................................. 35
5 Conclusions and outlook .................................................................................................. 37 6 References .......................................................................................................................... 40

II How Energy Efficiency Cuts Costs for a 2-Degree Future
Annex .......................................................................................................................................... 45
A.1 Supplementary material to Section 2 ............................................................... 45 A.2 Supplementary material to Section 3 ............................................................... 54 A.3 Supplementary material to Section 4 ............................................................... 65

List of figures III
List of figures
Figure 1: Overview of annual emissions reductions, cost savings and most important
additional EE measures of the energy efficiency pathway by
region ........................................................................................................... 3
Figure 2: Trade-off between supply transformation and efficiency improvements in the
Global Energy Assessment (GEA 2012). .................................................... 7
Figure 3: Global final energy demand and non-fossil energy supply (incl. RE, nuclear
and CCS) for an illustrative selection of 2°C-compatible
scenarios (EE = energy efficiency, RE = renewable energies,
colors of the curves indicate different scenarios) ........................................ 8
Figure 4: Development of energy intensity compared to carbon intensity of energy
supply in selected scenarios (Left: IAM runs with low energy
intensity, middle: IAM runs with no limitations on technologies,
right: bottom-up models) ............................................................................ 14
Figure 5: Historical development of electrical efficiency of thermal power plants from
1990 – 2014 (own calculation based on Enerdata). .................................. 15
Figure 6: Historical development of energy consumption per capita in the buildings
sector from 1990-2014 (own calculation based on Enerdata). .................. 16
Figure 7: Historical development of energy consumption per capita in the transport
sector from 1990 – 2014 (own calculation based on Enerdata). ............... 16
Figure 8: Historical development of industrial energy intensity per GDP from 1990 –
2014 (own calculation based on Enerdata). .............................................. 17
Figure 9: The corridors from the review of 2°C scenarios are used to frame the energy
intensive and the energy efficient pathway. Their total abatement
costs are compared. .................................................................................. 25
Figure 10: Illustration of efficiency potentials by sector in a marginal abatement cost
curve that separates EE and non-EE levers (own representation)............ 37
Figure 11: Transport sector - Development of energy intensity compared to carbon
intensity of energy supply in chosen scenarios (Left: IAM runs
with low energy intensity, middle: IAM runs with no limitations on
technologies, right: bottom-up models) ...................................................... 45
Figure 12: Building sector – Development of energy intensity compared to carbon
intensity of energy supply in chosen scenarios (Left: IAM runs
with low energy intensity, middle: IAM runs with no limitations on
technologies, right: bottom-up models) ...................................................... 46
Figure 13: Industry sector - Development of energy intensity compared to carbon
intensity of energy supply in chosen scenarios (Left: IAM runs
with low energy intensity, middle: IAM runs with no limitations on
technologies, right: bottom-up models) ...................................................... 47
Figure 14: Area under MAC curve in chosen IAM models (left: LowEI sc., right:
FullTech scenarios) .................................................................................... 50
Figure 15: GDP loss in chosen IAM models (left: LowEI scenarios, right: FullTech
scenarios)................................................................................................... 50
IV How Energy Efficiency Cuts Costs for a 2-Degree Future
Figure 16: Additional energy costs in chosen models (left: IAM LowEI scenarios and
The Energy Report, right: IAM FullTech scenarios) ................................... 51
Figure 17: Operational and capital expenditures in The Energy Report Source:
(Barney et al. 2011).................................................................................... 51
Figure 18: Consumption loss in chosen IAM models (left: LowEI scenarios, right:
FullTech scenarios) .................................................................................... 52
Figure 22: Historical development of industrial energy intensity per value added from
1990-2013 (own calculation based on Enerdata). ..................................... 54
Figure 23: Historical development of energy intensity of transport per GDP from 1990-
2013 (own calculation based on Enerdata). .............................................. 54
Figure 24: Historical development of electricity consumption of households per private
consumption from 1990-2013 (own calculation based on
Enerdata). .................................................................................................. 54
List of tables V
List of tables
Table 1: Annual savings of the energy-efficient pathway in comparison to the energy-
intensive pathway by region in 2030 (based on McKinsey &
Company, see Section 4)............................................................................. 2
Table 2: Energy intensity indicators in different sectors and scenario groups (choice of
indicators based on data availability). Final energy includes
electricity consumption. Data sources: IAMC AR5 Scenario
Database, IEA 2014, Greenpeace International 2012, Barney
2011. ............................................................................................................ 8
Table 3: Indicators of energy and carbon intensity (noise factors are other influences
impacting the indicators besides energy and carbon intensity) ................. 10
Table 4: Ranges used to reflect direct rebound effects by sector (own compilation
based on Economic Consulting Associates 2014 and Nadel
2012) .......................................................................................................... 26
Table 5: Savings of the energy-efficient pathway in comparison to the energy-intensive
pathway in 2030 (own calculations based on McKinsey &
Company (forthcoming)) ............................................................................ 27
Table 6: Energy intensity in 2°C scenarios per region and sector ............................................... 48
Table 7: Overview of main energy efficiency policies in BRAZIL by sector ................................. 55
Table 8: Overview of main energy efficiency policies in China by sector .................................... 56
Table 9: Overview of main energy efficiency policies in the EU by sector .................................. 57
Table 10: Overview of main energy efficiency policies in INDIA by sector .................................. 58
Table 11: Overview of main energy efficiency policies in Mexico by sector ................................ 59
Table 12: Overview of main energy efficiency policies in the US by sector ................................ 60
Table 13: Impact assessment of historic, current and upcoming EE policies in China
(own calculations based on sources listed in Section 6 under
“Databases” and “China”) .......................................................................... 61
Table 14: Impact assessment of historic, current and upcoming EE policies in the EU
(own calculations based on sources listed in Section 6 under
“Databases” and “EU”) ............................................................................... 62
Table 15: Impact assessment of historic, current and upcoming EE policies in the US
(own calculations based on sources listed in Section 6 under
“Databases” and “US”) ............................................................................... 64
Table 16: Overview of the levers included in the global Energy Efficient and Energy
Intensive Pathway for low level of rebound effects .................................... 65
Table 17: Overview of the levers included in the Efficiency and Energy intensive
pathways for China, the EU and the US for low level of rebound
effects......................................................................................................... 70
Table 18: Overview of the levers included in the Efficiency and Energy intensive
pathways for Brazil, India and Mexico for low level of rebound
effects......................................................................................................... 76

VI How Energy Efficiency Cuts Costs for a 2-Degree Future
Table 19: Comparison of energy savings, abatements and costs of the global Energy
Efficient and the Energy Intensive pathway for 2020 (own
calculations based on McKinsey & Company forthcoming) ....................... 82
Table 20: Comparison of energy savings, abatements and costs of the global Energy
Efficient and the Energy Intensive pathway for 2030 (own
calculations based on McKinsey & Company forthcoming) ....................... 83
Table 21: Comparison of energy savings, abatements and costs of the Efficiency and
the Energy intensive pathway for Brazil (own calculations based
on McKinsey) ............................................................................................. 84
Table 22: Comparison of energy savings, abatements and costs of the Efficiency and
the Energy intensive pathway for China (own calculations based
on McKinsey) ............................................................................................. 85
Table 23: Comparison of energy savings, abatements and costs of the Efficiency and
the Energy intensive pathway for the EU (own calculations based
on McKinsey) ............................................................................................. 86
Table 24: Comparison of energy savings, abatements and costs of the Efficiency and
the Energy intensive pathway for India (own calculations based
on McKinsey) ............................................................................................. 87
Table 25: Comparison of energy savings, abatements and costs of the Efficiency and
the Energy intensive pathway for Mexico (own calculations based
on McKinsey) ............................................................................................. 88
Table 26: Comparison of energy savings, abatements and costs of the Efficiency and
the Energy intensive pathway for the US (own calculations based
on McKinsey) ............................................................................................. 89

List of Acronyms VII
List of Acronyms BAU business-as-usual
bUSD – billion US-Dollar
CO2e the equivalent of one metric ton of CO2
CCS carbon capture & storage
EE energy efficiency
EffPath energy efficient pathway
EJ Exajoule = 1018 Joule
ETS emissions trading system
GDP gross domestic product
GEA Global Energy Assessment
GHG greenhouse gas emissions
GJ Gigajoule = 109 Joule
Gt Gigatonnes = 109 metric tons
HDVs heavy-duty vehicles
IAM integrated assessment model
IEA International Energy Agency
IntPath energy intensive pathway
IPCC Intergovernmental Panel on Climate Change
LDVs light-duty vehicles
MACC marginal abatement cost curves
MDVs medium-duty vehicles
Mt Megatonnes = 106 metric tons
PJ Petajoule = 1015 Joule
pp percentage points
RE renewable energy
USD05 US-Dollar in constant values of 2005
USD05ppp US-Dollar in power purchasing parities of 2005


Executive Summary 1
Executive Summary About 40% of global greenhouse gas (GHG) emissions originate from energy use in industry, transport, and buildings, and another 25% from power generation (IPCC 2014). A highly efficient use of energy is thus fundamental to limit GHG emissions. Yet, energy efficiency receives much less attention than the decarbonization of the energy supply. A recent report by the International Ener-gy Agency states that global energy efficiency (EE) investments since 1990 have avoided more than 870 MtCO2e (megatons of CO2-equivalent emissions) in 2014, while reducing fuel costs by 550 billion US Dollar (IEA 2015). For this reason, the IEA calls EE the “first fuel” in the context of decarbonization. This study indicates that scenarios with higher EE mostly show lower abatement costs. This was the result of evaluating the large number of existing scenarios that comply with the internationally agreed 2°C target until 2050. The societal costs of decarbonization in these scenarios vary strongly and a detailed assessment of the potential cost reductions due to EE is lacking. In order to close this gap, this study estimates the global cost savings up to 2030 associated with a decarbonization pathway with a strong focus on EE measures. Based on an unpublished update of McKinsey’s bottom-up estimates of the potentials and costs of EE options and alternative decarbonization measures (McKinsey & Company forthcoming), this study compares the costs of an energy-efficient pathway with an energy-intensive pathway that focuses on decarbonizing the en-ergy supply and only uses EE to the extent additionally required to keep emissions in line with the 2°C target. In accordance with the scenario from the World Energy Outlook considered to be in line with the 2°C target (IEA 2012), both pathways reduce the global level of annual energy-related GHG emissions in 2030 by 15.4 GtCO2e compared to a business-as-usual (BAU) scenario, implying an emission mitigation of about 115 GtCO2e between 2015 and 2030. In-depth meta-analyses of McKinsey’s estimates yield the following central findings:
Both the energy-intensive pathway and the energy-efficient pathway require significant shares of EE measures and decarbonization of the energy supply. When compared to the BAU scenario, EE options mainly have negative net societal costs, while most alter-natives like renewable energies (RE) show decreasing but still positive net societal costs.
In the BAU scenario, the global primary energy consumption in buildings (including appli-ances), industry and transport is about 450 exajoules in 2030. Even the energy-intensive pathway requires reducing the primary energy consumption of these sectors by 7%. The energy-efficient pathway more than doubles the energy savings to 17% of global consumption.
The total societal costs in the energy-efficient pathway are 2.5 – 2.8 trillion USD (constant 2005) lower than in the energy-intensive pathway in the period 2015 – 2030 (excluding transaction costs). The energy savings of the energy-intensive pathway still result in net cost savings of 1.2 – 1.6 trillion USD compared to the BAU scenario for the same period, with annual savings of approximately 0.2% of the global GDP in 2030. Both pathways are thus more than able to cover any transaction costs associated with EE.
The costs of a pathway in line with the 2°C target in the period 2015 – 2030 have been reduced by more than 750 billion US Dollar by historical EE policies in China, the EU and the US since 1990.
Significant saving potentials exist in all end-use sectors. Their exploitation results in a much greater flexibility when choosing options for decarbonizing the energy supply. The cost estimates assume a strong focus on the cheapest abatement options until 2030. To avoid possible lock-in costs after 2030, it may be important to address more costly abatement options before 2030 as well, depend-ing on the region. The ranges in all the estimates reflect the uncertain impact of direct rebound
2 How Energy Efficiency Cuts Costs for a 2-Degree Future
effects, which increase the demand for energy services due to the lower cost per unit of energy services. It is of the utmost importance to address why many of the cost savings due to EE are not yet being realized by markets, private investors and households. It is well-known that financial barriers are partly to blame, but there are also several important non-financial barriers including lack of information, bounded rationality, uncertainty about revenues and the involvement of numerous end-users and actors (Sorrell et al. 2004). To overcome these barriers, it is important to choose the right mix of policy instruments that specif-ically addresses the potentials and barriers (Allcott and Greenstone 2012). Standard economic measures such as removing subsidies for fossil fuels and pricing carbon are important pillars for the realization of EE measures, but are not sufficient. Non-financial instruments include lower-ing transaction costs and supporting the diffusion of EE measures via capacity building, net-works and energy service companies, but also promoting measures for the cost efficiency of EE measures other than payback periods such as the internal rate of return. Incentives that lower up-front investments may be required, especially where large up-front investments are concerned such as for the retrofit of existing buildings. The study also provides region-specific pathways and estimates for six focus regions, which accounted for more than 60% of global GHG emissions in 2010, namely the US, the EU, China, India, Brazil, and Mexico:
For each region, the additional cost savings of the energy-efficient pathway are sig-nificant with respect to domestic GDP. The shares vary between 0.1% and 0.4% (see Table 1) and are roughly equivalent to the current annual investments in renewable ener-gies in those regions (Frankfurt School-UNEP Centre/BNEF 2014).
On average, the specific cost savings are 20 – 23 US Dollar per tCO2e. The specific cost savings are slightly lower in China and India, because the gap between EE and the decarbonization of the energy supply is smaller here, i.e. the energy-intensive and the en-ergy-efficient pathways overlap strongly.
Sensitivity to rebound effects is relatively high in India and China due to rising levels of living standards and mobility here. This underlines that most of the reduced savings are not lost, but result in a higher level of service to end-users.
In addition to these savings, EE measures bring additional substantial societal benefits by reducing the cost of bringing power to the under-served, and fostering the domestic economy (IEA 2014).
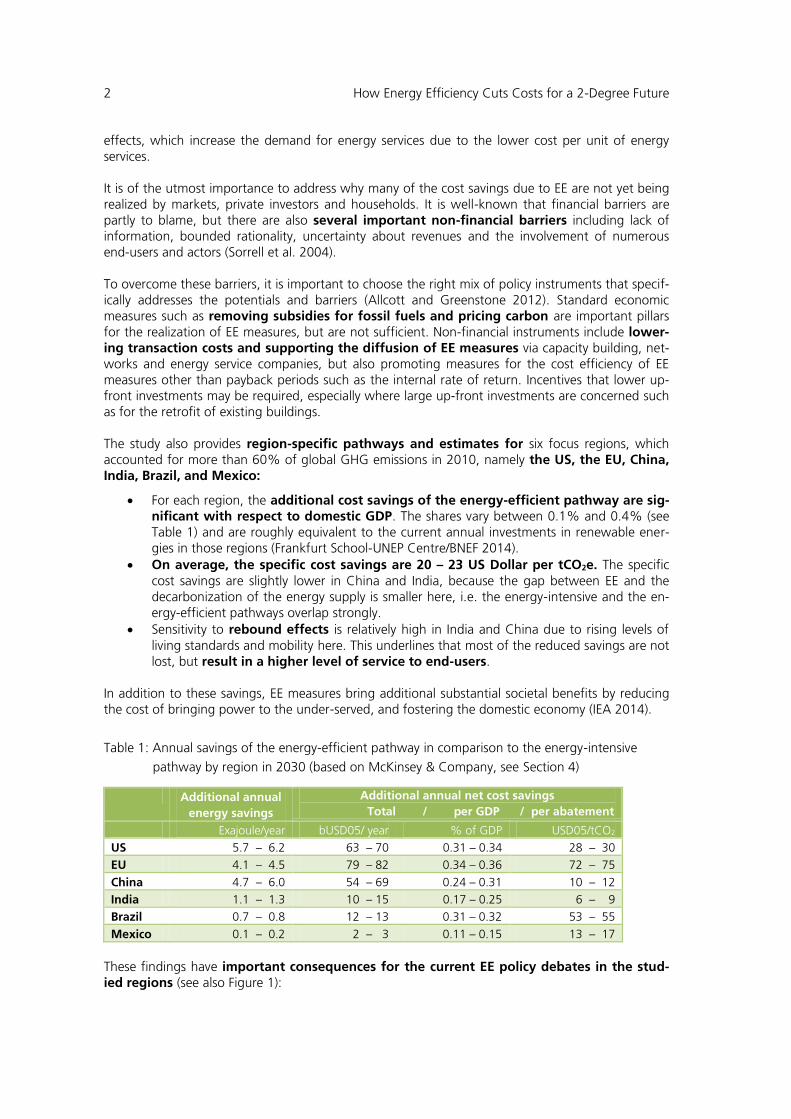
Table 1: Annual savings of the energy-efficient pathway in comparison to the energy-intensive
pathway by region in 2030 (based on McKinsey & Company, see Section 4)
Additional annual
energy savings
Additional annual net cost savings
Total / per GDP / per abatement
Exajoule/year bUSD05/ year % of GDP USD05/tCO2
US 5.7 – 6.2 63 – 70 0.31 – 0.34 28 – 30
EU 4.1 – 4.5 79 – 82 0.34 – 0.36 72 – 75
China 4.7 – 6.0 54 – 69 0.24 – 0.31 10 – 12
India 1.1 – 1.3 10 – 15 0.17 – 0.25 6 – 9
Brazil 0.7 – 0.8 12 – 13 0.31 – 0.32 53 – 55
Mexico 0.1 – 0.2 2 – 3 0.11 – 0.15 13 – 17
These findings have important consequences for the current EE policy debates in the stud-ied regions (see also Figure 1):
Executive Summary 3
In the US, tightening and expanding fuel economy standards and crediting of EE in the Clean Power Plan represent major steps forward to realizing the cost savings from EE. Nevertheless, incentives are still lacking for significant retrofits of existing buildings, and the reduction of fuel consumption in energy-intensive industries.
The EU is on the right path with the revision of its Energy Efficiency Directive and implementa-tion of the 3rd National EE Action Plans. However, standards for the retrofit of existing build-ings are insufficient to exploit the existing potentials, which can be seen as a major shortcom-ing. Other options for improvement lie in stricter fuel economy standards for cars and stronger policies for freight transport.
Over the last decade, China has embarked on fostering EE polices and measures in all the rele-vant sectors. The growth of energy-intensive industries and the rising demand for mobility will require even greater efforts, in particular in supporting changes to industrial processes and modal shifts in transport. These issues are planned to be addressed in the upcoming Five-Year Plan.
In India, Brazil, and Mexico, power production, industry and the transport sector hold vast potentials for cost savings via numerous EE measures. This is partially indicated by these coun-tries’ Intended Nationally Determined Contributions to the UNFCCC. However, only a limited number of measures are being implemented or considered for these sectors. The potentials in buildings are already targeted by many on-going and planned activities, but are not fully ad-dressed.
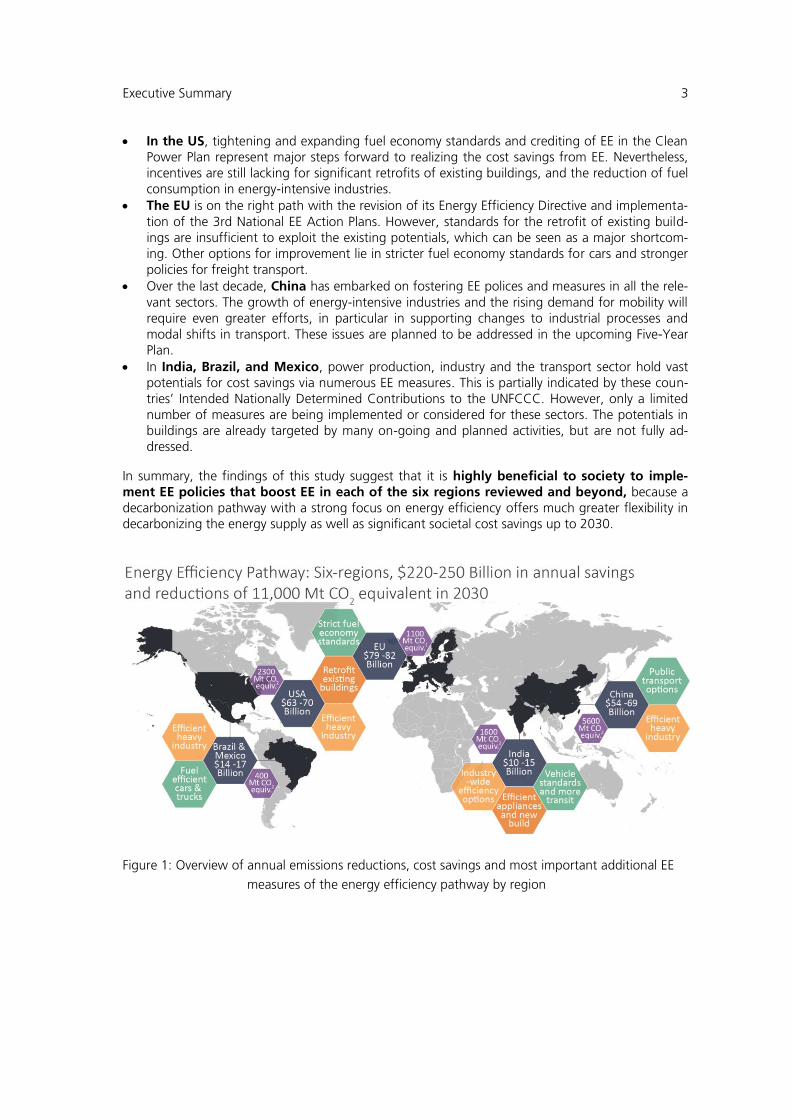
In summary, the findings of this study suggest that it is highly beneficial to society to imple-ment EE policies that boost EE in each of the six regions reviewed and beyond, because a decarbonization pathway with a strong focus on energy efficiency offers much greater flexibility in decarbonizing the energy supply as well as significant societal cost savings up to 2030.
Figure 1: Overview of annual emissions reductions, cost savings and most important additional EE
measures of the energy efficiency pathway by region

4 How Energy Efficiency Cuts Costs for a 2-Degree Future

Introduction 5
1 Introduction
Burning fossil fuels to generate energy is the primary source of global GHG emissions: About 25% of global GHG emissions are emitted during the production of electricity and heat; another 40% are discharged in the sectors of industry, transport, and buildings. Managing the demand for en-ergy is therefore an important lever for reducing GHG emissions. Implementing EE measures can help to reduce energy consumption while maintaining a constant level of energy-use services. Fur-ther, improving EE enables a higher level of services from the same energy input. This is vital given that industrial activity is expected to increase significantly in the coming decades in developing countries and emerging economies. EE is one cornerstone in the decarbonization scenarios that comply with the 2°C target. Yet, in contrast to other measures such as renewable energy production, nuclear power or CCS, the con-tribution energy efficiency can make to reducing GHG emissions is more complex due to the in-volvement of so many actors and the relatively small impact of the individual measures. It is also difficult to make cost estimates of EE’s contribution due to the complexity of the measures and their dependence on additional factors such as energy prices and energy demand developments. Differences in payback times and the lifetime of technologies also play an important role. Further, the contribution of EE measures has been questioned because of rebound effects that may reduce their effectiveness in lowering energy demand. A recent report of the IEA (IEA 2015), however, provides evidence that EE investments made since 1990 avoided more than 870 MtCO2e in 2014 while reducing fuel costs by bUSD 550. Hence, the IEA calls EE the “first fuel” in the context of decarbonization. This study aims to make the role EE plays in GHG emission reductions more transparent. The analy-ses are based on existing estimates of EE in different countries and the associated reductions in energy use. This is coupled with information on alternative decarbonization measures to estimate the cost saving potentials in 2030 associated with a decarbonization pathway that strongly pro-motes EE. The study focuses on the USA and EU as well as China, India, Brazil and Mexico as emerging economies with a significant (and rising) share in global energy demand. Altogether, these countries accounted for more than 60% of GHG emission in 2010. The approach taken in this study consists of three steps:
1. Evaluation of the role of EE within decarbonization scenarios 2. Assessment of historical EE policies and their impacts 3. Evaluation of the cost reductions due to EE for reaching the 2°C target
Local experts from the different regions performed an additional quality review of the findings. These local experts were:
Brazil: Pontifical Catholic University of Rio de Janeiro, Mr. Reinaldo Castro Souza and Mr. Rodrigo Flora Canili
China: Chinese Academy of Science, Institute of Policy and Management (CAS-IPM), Ms. Ying Fan and Ms. Jin-Hua Xu
EU: Fraunhofer Institute for Systems and Innovation Research (Fraunhofer ISI), Mr. Wolf-gang Eichhammer
India: The Energy and Resources Institute India (TERI), Centre For Global Environment Re-search, Ms. Neha Pahuja
Mexico: Comisión Nacional para el Uso Eficiente de la Energía (CONUEE), Juan Ignacio Na-varrete Barbosa
US: American Council for an Energy Efficient Economy, Mr. Steven Nadel
In Section 2, this study analyzes existing 2°C scenarios to illustrate the relative importance of EE compared to decarbonizing the energy supply. One result of these analyses is that upper bounds

6 How Energy Efficiency Cuts Costs for a 2-Degree Future
are derived for the future development of energy intensities by sector and region that are necessary to comply with the 2°C target. This section also gives an overview of cost estimates in the scenarios to determine whether increased EE can decrease overall mitigation costs. In Section 3, this study documents the main historical EE policies in the six focus regions, differenti-ated by sectors. Based on sector- and country-/region-specific data, the historical and future energy savings triggered by the existing policies are estimated. Energy intensities are used instead of abso-lute energy use (measured per capita for the sectors buildings (incl. appliances) and transport, and per GDP for the industrial sector). The results show the trends in energy intensities for sectors and countries resulting from historical and current policies from 1990 to 2014 The collective impact of existing policies is then assessed as far as individual impact assessments are available.
In Section 4, the results from the preceding sections are used to estimate the EE improvements needed in addition to current policies in order to meet the 2°C target For this, a suitable 2°C target is chosen. To do so, this study compares the costs of an energy efficient pathway that strongly promotes energy efficiency with those of a energy intensive pathway that focuses on decarbonizing the energy supply and only uses as much EE as required to reduce emissions in line with the 2°C target. We estimate the costs of these additional increases in EE based on existing abatement cost curves that include information on the abatement costs of EE measures in different sectors. This is complemented by information on EE policies in the sectors to identify which measures are likely driven by existing and which by additional EE policies. Rebound effects may render realized energy savings from EE measures lower than expected savings, but empirical evidence is scarce and the results vary widely across and within sectors and countries. We carry out a sensitivity analysis to highlight the impact of rebound effects. The final section provides a summary of the major findings and examines the consequences for current policy debates. Detailed information on all the intermediate steps and results is provided in the annex.
Role of energy efficiency within decarbonization scenarios 7
2 Role of energy efficiency within decarbonization scenarios
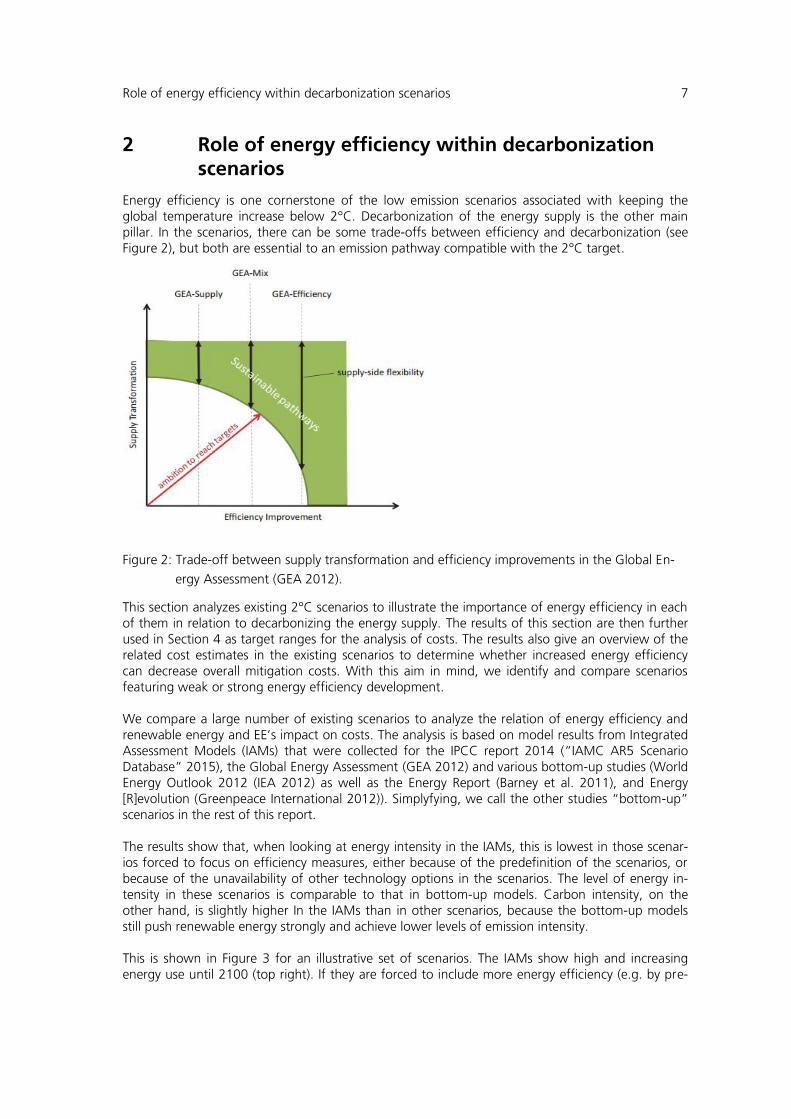
Energy efficiency is one cornerstone of the low emission scenarios associated with keeping the global temperature increase below 2°C. Decarbonization of the energy supply is the other main pillar. In the scenarios, there can be some trade-offs between efficiency and decarbonization (see Figure 2), but both are essential to an emission pathway compatible with the 2°C target.
Figure 2: Trade-off between supply transformation and efficiency improvements in the Global En-
ergy Assessment (GEA 2012).
This section analyzes existing 2°C scenarios to illustrate the importance of energy efficiency in each of them in relation to decarbonizing the energy supply. The results of this section are then further used in Section 4 as target ranges for the analysis of costs. The results also give an overview of the related cost estimates in the existing scenarios to determine whether increased energy efficiency can decrease overall mitigation costs. With this aim in mind, we identify and compare scenarios featuring weak or strong energy efficiency development. We compare a large number of existing scenarios to analyze the relation of energy efficiency and renewable energy and EE’s impact on costs. The analysis is based on model results from Integrated Assessment Models (IAMs) that were collected for the IPCC report 2014 (“IAMC AR5 Scenario Database” 2015), the Global Energy Assessment (GEA 2012) and various bottom-up studies (World Energy Outlook 2012 (IEA 2012) as well as the Energy Report (Barney et al. 2011), and Energy [R]evolution (Greenpeace International 2012)). Simplyfying, we call the other studies “bottom-up” scenarios in the rest of this report. The results show that, when looking at energy intensity in the IAMs, this is lowest in those scenar-ios forced to focus on efficiency measures, either because of the predefinition of the scenarios, or because of the unavailability of other technology options in the scenarios. The level of energy in-tensity in these scenarios is comparable to that in bottom-up models. Carbon intensity, on the other hand, is slightly higher In the IAMs than in other scenarios, because the bottom-up models still push renewable energy strongly and achieve lower levels of emission intensity. This is shown in Figure 3 for an illustrative set of scenarios. The IAMs show high and increasing energy use until 2100 (top right). If they are forced to include more energy efficiency (e.g. by pre-

8 How Energy Efficiency Cuts Costs for a 2-Degree Future
defining energy intensity indicators, or by excluding other technology options), they show stabiliz-ing energy demand and therefore less absolute use of non-fossil energy (middle). The bottom-up models actively push energy efficiency and already reach high levels of renewables by the middle of the century (bottom). The bottom-up scenarios are often more flexible about implementing tech-nology changes. They also focus on the time period up to 2050, so they do not allow to compen-sate a lack of ambition early on with very low emissions in the second half of the century. This ex-plains why their overall level of ambition tends to be higher.
Figure 3: Global final energy demand and non-fossil energy supply (incl. RE, nuclear and CCS) for
an illustrative selection of 2°C-compatible scenarios (EE = energy efficiency, RE = renewa-
ble energies, colors of the curves indicate different scenarios)
Table 2 illustrates the results of different scenario groups for energy intensity by sector. Ideally, sectoral indicators should include data that better describes the energy intensity development in the sector, as GDP mainly reflects development at country level. Unfortunately, such data is not avail-able for most scenarios, so that they cannot be compared.
Table 2: Energy intensity indicators in different sectors and scenario groups (choice of indicators
based on data availability). Final energy includes electricity consumption. Data sources:
IAMC AR5 Scenario Database, IEA 2014, Greenpeace International 2012, Barney 2011.
Sector Indicator Unit Year IAMs
(min/max)
Bottom-up
(min/max)
Economy
wide
Primary energy intensity
per GDP
PJ/bUSD 2030 3.1 / 5.4 3.1 / 4.2
2050 1.7 / 3.7 1.8 / 2.1
Transport Final energy consump-
tion in transport
per capita
GJ/cap 2030 9.7 / 17.1 9.3 / 13.2
2050 10.5 / 18.9 6.4 / 7.9
Buildings Final energy consump-
tion in buildings
per capita
GJ/cap 2030 10 / 20 15 / 17
2050 10 / 24 12 / 15
Industry Final energy consump-
tion in industry per GDP
PJ/bUSD 2030 0.6 / 1.5 1.1 / 1.3
2050 0.2 / 0.8 0.7 / 0.7
0
100
200
300
400
500
600
700
800
0 100 200 300 400 500
Fin
al e
ne
rgy
de
man
d [
EJ/a
]
Non-fossil Energy Supply [EJ/a]
MERGE_EMF27_EMF27-450-FullTechIMAGE_GEA_high_450
MERGE_EMF27_EMF27-450-LowEIEcofys Energy Model_TER2011
WEO2014
More EE
More RE
EE reduces needfor non-fossils
IAMs withlimited EE
IAMs with exo-geneous high EE
Bottom upassessments

Role of energy efficiency within decarbonization scenarios 9
Annex A.1 shows the detailed results by country. The regional ranges are used as input for design-ing the decarbonization pathways in Section 4.
2.1 Detailed methodology and assumptions
This chapter relies fully on available scenario data. It combines and illustrates certain indicators to show the impact of energy efficiency in 2°C. The IPCC AR5 scenario database provided data from Integrated Assessment Models (IAMs), whereas other global studies were used as a source of bottom-up scenarios. For the purpose of this study, we filtered out the scenarios that lead to long-term stabilization levels of GHG at 450 ppm. Our analysis focuses on global scenarios, but the data collected also provide some insights into regional developments. Different definitions of regions and a lack of detail at country level, how-ever, make it difficult to analyze individual countries. While the main scope of this study is 2030, we also look at 2050 to illustrate scenario results, as some developments are clouded when looking at 2030 only. In particular, IAMs are driven mainly by assumptions about delayed policy implemen-tation up to 2030. All the scenarios considered comply with keeping the global temperature increase below 2°C but have different ways of achieving this target. Some rely more on decarbonization, while others have a stronger focus on reducing energy intensity. The report aims to isolate the effect of different EE assumptions by comparing different scenario groups with each other:
Bottom-up scenarios approach individual technologies separately and generally in more detail. They are also characterized by greater regional detail which allows them to reflect the devel-opment of energy efficiency more accurately.
Integrated Assessment Models take a more top-down view of technological development and, depending on the settings, they can force specific indicators to develop in a specific way. They are better able to take account of economic feedback effects but, as a trade-off, are less de-tailed at the level of technology.
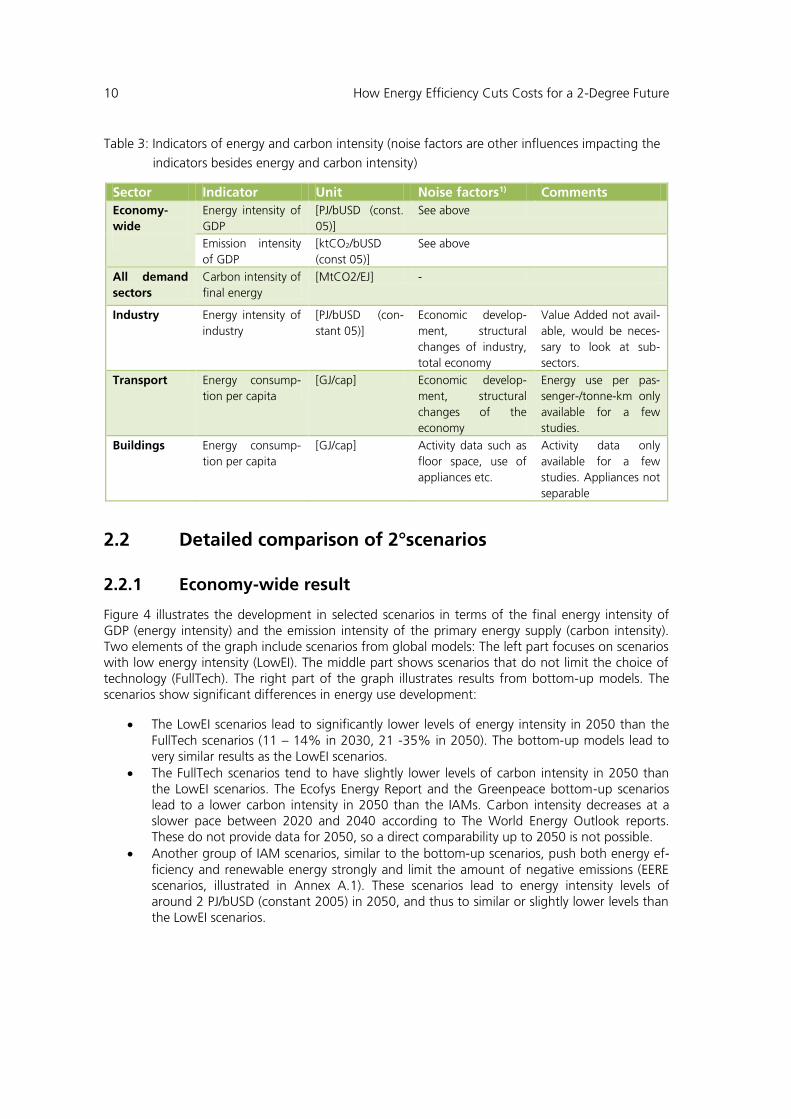
Our analysis of IAMs focuses on two scenario types in the IPCC scenario database: “Full Technol-ogy” (FullTech) scenarios and “Low Energy Intensity” (LowEI) scenarios. FullTech scenarios allow all technologies without limitations (including, for example, CCS and nuclear). We expect such scenar-ios to feature fewer EE measures to keep emissions below levels required to limit the global tem-perature increase to below 2°C. In contrast, LowEI scenarios force EE to develop particularly rapidly. For these two scenario types, we extract data from the IPCC database. The Global Energy Assess-ment, which also builds on IAMs, represents an additional data source not included in the IPCC. This assessment is of particular interest to this report because, unlike most other modelling exer-cises, it models the investment costs related to energy efficiency measures. For sectors and the overall economy, we derive indicators to illustrate the development of EE and the carbon intensity of the energy used. Table 3 lists the indicators used. The sectoral indicators referring to total national GDP as the activity are sub-optimal, as they do not directly reflect the activity in the sector. Specific sectoral activity data would be preferable, such as value added for industry, or distance travelled for the transport sector. While industrial activity may decrease, for example, the total national GDP can still grow. This is the case in many countries, where a shift of economic activity away from industry towards the service sector can be observed. The exact impacts of such structural changes are difficult to determine beforehand, and the data available from the scenarios used does not disclose the underlying assumptions. To assess the im-pact of EE thoroughly, structural changes would need to be separated from the development of EE.
10 How Energy Efficiency Cuts Costs for a 2-Degree Future
Table 3: Indicators of energy and carbon intensity (noise factors are other influences impacting the
indicators besides energy and carbon intensity)
Sector Indicator Unit Noise factors1) Comments
Economy-
wide
Energy intensity of
GDP
[PJ/bUSD (const.
05)]
See above
Emission intensity
of GDP
[ktCO2/bUSD
(const 05)]
See above
All demand
sectors
Carbon intensity of
final energy
[MtCO2/EJ] -
Industry Energy intensity of
industry
[PJ/bUSD (con-
stant 05)]
Economic develop-
ment, structural
changes of industry,
total economy
Value Added not avail-
able, would be neces-
sary to look at sub-
sectors.
Transport Energy consump-
tion per capita
[GJ/cap] Economic develop-
ment, structural
changes of the
economy
Energy use per pas-
senger-/tonne-km only
available for a few
studies.
Buildings Energy consump-
tion per capita
[GJ/cap] Activity data such as
floor space, use of
appliances etc.
Activity data only
available for a few
studies. Appliances not
separable
2.2 Detailed comparison of 2°scenarios
2.2.1 Economy-wide result
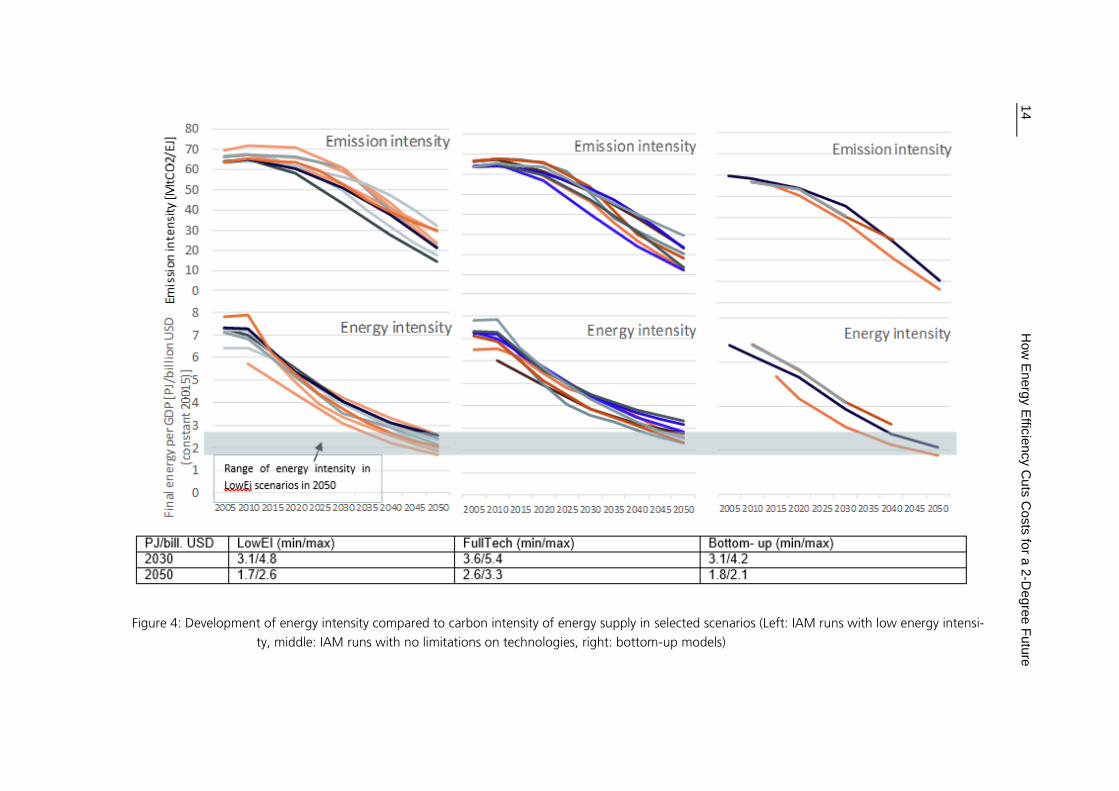
Figure 4 illustrates the development in selected scenarios in terms of the final energy intensity of GDP (energy intensity) and the emission intensity of the primary energy supply (carbon intensity). Two elements of the graph include scenarios from global models: The left part focuses on scenarios with low energy intensity (LowEI). The middle part shows scenarios that do not limit the choice of technology (FullTech). The right part of the graph illustrates results from bottom-up models. The scenarios show significant differences in energy use development:
The LowEI scenarios lead to significantly lower levels of energy intensity in 2050 than the FullTech scenarios (11 – 14% in 2030, 21 -35% in 2050). The bottom-up models lead to very similar results as the LowEI scenarios.
The FullTech scenarios tend to have slightly lower levels of carbon intensity in 2050 than the LowEI scenarios. The Ecofys Energy Report and the Greenpeace bottom-up scenarios lead to a lower carbon intensity in 2050 than the IAMs. Carbon intensity decreases at a slower pace between 2020 and 2040 according to The World Energy Outlook reports. These do not provide data for 2050, so a direct comparability up to 2050 is not possible.
Another group of IAM scenarios, similar to the bottom-up scenarios, push both energy ef-ficiency and renewable energy strongly and limit the amount of negative emissions (EERE scenarios, illustrated in Annex A.1). These scenarios lead to energy intensity levels of around 2 PJ/bUSD (constant 2005) in 2050, and thus to similar or slightly lower levels than the LowEI scenarios.
Role of energy efficiency within decarbonization scenarios 11
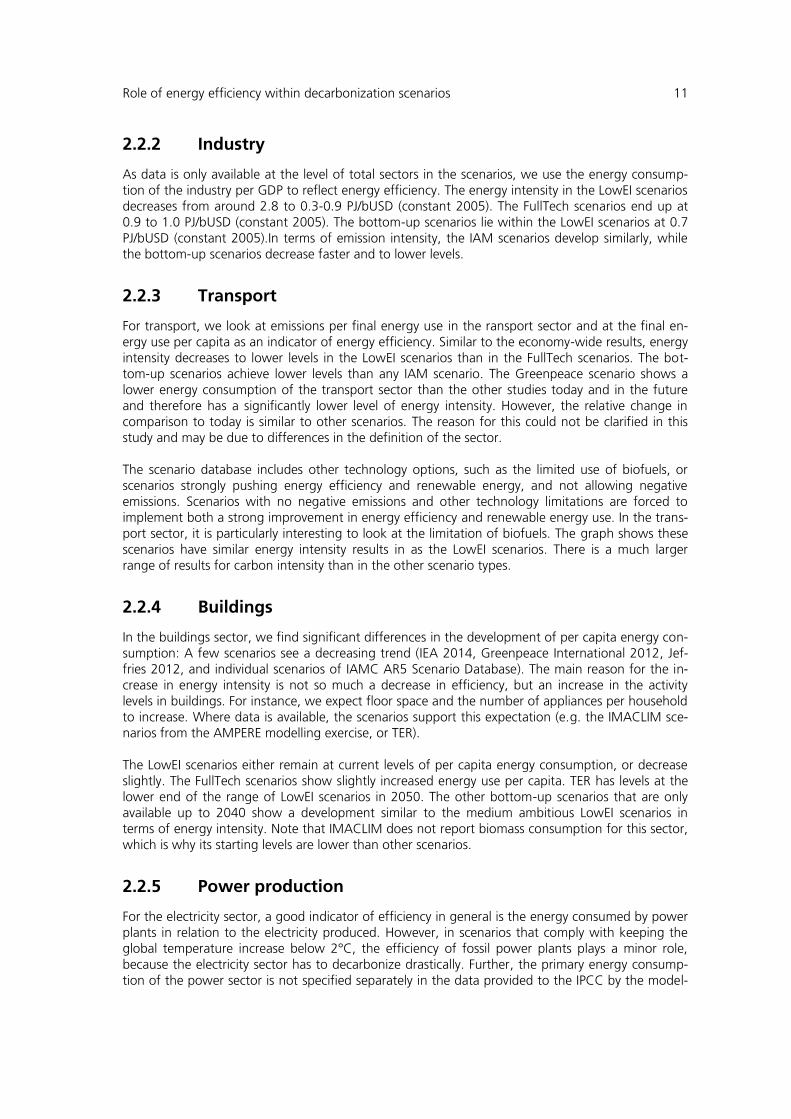
2.2.2 Industry
As data is only available at the level of total sectors in the scenarios, we use the energy consump-tion of the industry per GDP to reflect energy efficiency. The energy intensity in the LowEI scenarios decreases from around 2.8 to 0.3-0.9 PJ/bUSD (constant 2005). The FullTech scenarios end up at 0.9 to 1.0 PJ/bUSD (constant 2005). The bottom-up scenarios lie within the LowEI scenarios at 0.7 PJ/bUSD (constant 2005).In terms of emission intensity, the IAM scenarios develop similarly, while the bottom-up scenarios decrease faster and to lower levels.
2.2.3 Transport
For transport, we look at emissions per final energy use in the ransport sector and at the final en-ergy use per capita as an indicator of energy efficiency. Similar to the economy-wide results, energy intensity decreases to lower levels in the LowEI scenarios than in the FullTech scenarios. The bot-tom-up scenarios achieve lower levels than any IAM scenario. The Greenpeace scenario shows a lower energy consumption of the transport sector than the other studies today and in the future and therefore has a significantly lower level of energy intensity. However, the relative change in comparison to today is similar to other scenarios. The reason for this could not be clarified in this study and may be due to differences in the definition of the sector. The scenario database includes other technology options, such as the limited use of biofuels, or scenarios strongly pushing energy efficiency and renewable energy, and not allowing negative emissions. Scenarios with no negative emissions and other technology limitations are forced to implement both a strong improvement in energy efficiency and renewable energy use. In the trans-port sector, it is particularly interesting to look at the limitation of biofuels. The graph shows these scenarios have similar energy intensity results in as the LowEI scenarios. There is a much larger range of results for carbon intensity than in the other scenario types.
2.2.4 Buildings
In the buildings sector, we find significant differences in the development of per capita energy con-sumption: A few scenarios see a decreasing trend (IEA 2014, Greenpeace International 2012, Jef-fries 2012, and individual scenarios of IAMC AR5 Scenario Database). The main reason for the in-crease in energy intensity is not so much a decrease in efficiency, but an increase in the activity levels in buildings. For instance, we expect floor space and the number of appliances per household to increase. Where data is available, the scenarios support this expectation (e.g. the IMACLIM sce-narios from the AMPERE modelling exercise, or TER). The LowEI scenarios either remain at current levels of per capita energy consumption, or decrease slightly. The FullTech scenarios show slightly increased energy use per capita. TER has levels at the lower end of the range of LowEI scenarios in 2050. The other bottom-up scenarios that are only available up to 2040 show a development similar to the medium ambitious LowEI scenarios in terms of energy intensity. Note that IMACLIM does not report biomass consumption for this sector, which is why its starting levels are lower than other scenarios.
2.2.5 Power production
For the electricity sector, a good indicator of efficiency in general is the energy consumed by power plants in relation to the electricity produced. However, in scenarios that comply with keeping the global temperature increase below 2°C, the efficiency of fossil power plants plays a minor role, because the electricity sector has to decarbonize drastically. Further, the primary energy consump-tion of the power sector is not specified separately in the data provided to the IPCC by the model-

12 How Energy Efficiency Cuts Costs for a 2-Degree Future
ling groups. For these two reasons, we do not consider the efficiency of this sector in more detail in this section of the report. Nevertheless, it is important to note that, according to the IPCC, the share of non-fossil energy in the power sector should increase to 80% in 2050 from its current 30% (IPCC 2014). Applying linear interpolation results in a share of 55% in 2030 (the target year of the report), with the remaining 45% still based on fossil fuels. The efficiency of these plants therefore does matter for emissions in this time horizon. In terms of emission intensity, the scenarios are relatively similar in terms of their decarbonization of the sector. The models agree that changes are already needed around the middle of this century to decarbonize this sector. From this we can conclude that, in comparison to other sectors, the flexibil-ity to achieve greater efficiency does not lower the need for major decarbonization.
2.2.6 Costs in 2°C scenarios
Various cost indicators are provided by the IPCC scenario database:
GDP losses: The comparison of GDP losses results from analyzing the policy impact on the total economy. This includes imports, investments, government spending etc. Bottom-up models are typically not able to conduct this analysis, as they do not integrate economic models.
Marginal abatement costs: Marginal abatement costs (MAC) indicate the costs of an addi-tional unit of emission reduction. The area under the MAC curve measures the total eco-nomic cost of reducing emissions (Kolstad et al. 2014). It depends on the model the curve is drawn from, if this indicator captures economy-wide effects.
Consumption losses: This measures changes in the total amount of money consumers are able to spend on goods and services. Compared to GDP loss, this is a more direct way of measuring welfare in a country or region
Additional energy system costs: additional energy system costs are defined as the differ-ence of (levelized) capital and operational costs between mitigation and reference scenario.
Energy expenditures: energy expenditures are defined as the sum of total energy invest-ments and operation& maintenance expenditures (including fuel costs).
The different parameters are not directly comparable, and the models make very different cost assumptions, so comparing them is difficult (see (Kolstad et al., 2014)). However, we can draw conclusions by comparing the different scenarios within one model. The information on costs in bottom-up scenarios is very limited. Only The Energy Report provides comparable data. We find that costs are lower for scenarios that focus on energy efficiency throughout all the IAMs considered here and the types of cost indicators analyzed. In most cases this results from the fact that energy efficiency is set in the models as an input and no measures are calculated for it, so no costs are attributed to the lower energy demand. Naturally, it is less costly to meet the energy de-mand in these scenarios, so their overall costs are lower. One exception is the Global Energy As-sessment, which includes demand-side investments. The Global Energy Assessment has three sce-narios: one with comparatively low energy demand (GEA-Efficiency), one with intermediate de-mand (GEA-Mix), and one with high demand (GEA-Supply). The results show that the model runs based on GEA-Supply are significantly more costly than scenarios with lower energy use. The dif-ference between model runs based on GEA-Mix and GEA-Efficiency is less marked. The difference is also more apparent in developed regions (see Annex A.1). This reflects the fact that regions that already have a high use of energy services (high per capita consumption) experience a greater change when moving their energy intensity towards a 2°C pathway. Regions with a current low energy consumption per capita would not increase to the current high levels of developed coun-tries, but leapfrog some developments under such scenarios. Even under business-as-usual scenar-ios, they would likely develop more energy-efficiently given technology improvements.

Role of energy efficiency within decarbonization scenarios 13
As mentioned above, the Energy Report is one bottom-up scenario that does illustrate costs: It shows strong front-loading of costs, meaning there are large investments early on, but negative costs already occur from 2040 onwards. Bottom-up models are engineering-based partial models of the energy converting and using sectors which explicitly model different technologies and their improvement over time to capture all energy saving possibilities. Since bottom-up models neglect market failures, uncertainty and rebound ef-fects , i.e. that lower prices for energy savings as a result of technological change will stimulate demand, the costs calculated for climate change policies tend to be low. Typically, bottom up mod-els calculate the least-cost combination of a set of available or expected technologies for meeting given production and emission targets. By contrast, top-down models represent the general econ-omy and include all the economic effects of price changes, including income and substitution ef-fects, and also consider impacts on employment, exports, or GDP. Concluding we find that as a tendency, scenarios focusing on EE are in a tendency less costly than others, nevertheless a broader basis of modelling results would be necessary to back up this trend, as the definition and approaches of many scenarios predefines the results. Further details on the results are available in Annex A.1.
14
H
ow
Energ
y E
fficie
ncy C
uts
Costs
for a
2-D
egre
e F
utu
re
Figure 4: Development of energy intensity compared to carbon intensity of energy supply in selected scenarios (Left: IAM runs with low energy intensi-
ty, middle: IAM runs with no limitations on technologies, right: bottom-up models)
The historical role of energy efficiency 15
3 The historical role of energy efficiency
This section focuses on historical improvements of EE and the role of EE policies versus other factors such as fossil fuel prices, changes in living standards or sector shifts in the EU and the US, China and India, as well Brazil and Mexico. The analysis is divided into a statistical description of energy consumption trends by sector and assessment of the main regional EE policies and their impacts.
3.1 Historical development of regional energy intensities
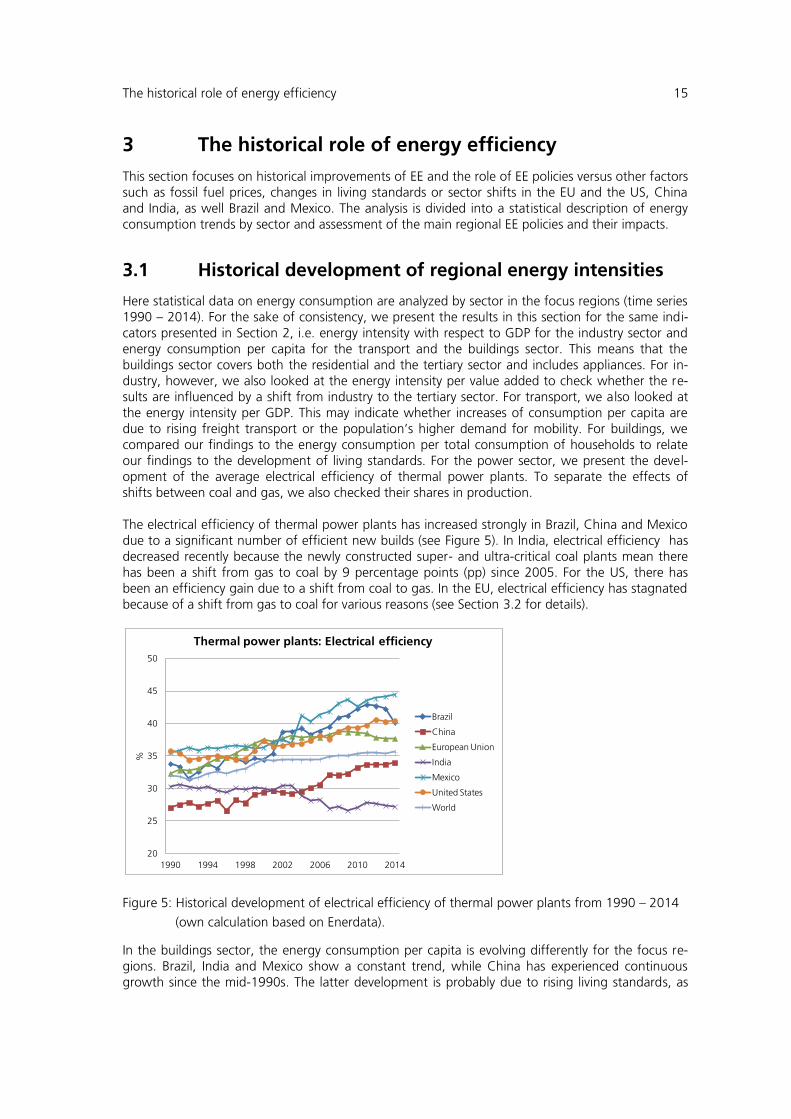
Here statistical data on energy consumption are analyzed by sector in the focus regions (time series 1990 – 2014). For the sake of consistency, we present the results in this section for the same indi-cators presented in Section 2, i.e. energy intensity with respect to GDP for the industry sector and energy consumption per capita for the transport and the buildings sector. This means that the buildings sector covers both the residential and the tertiary sector and includes appliances. For in-dustry, however, we also looked at the energy intensity per value added to check whether the re-sults are influenced by a shift from industry to the tertiary sector. For transport, we also looked at the energy intensity per GDP. This may indicate whether increases of consumption per capita are due to rising freight transport or the population’s higher demand for mobility. For buildings, we compared our findings to the energy consumption per total consumption of households to relate our findings to the development of living standards. For the power sector, we present the devel-opment of the average electrical efficiency of thermal power plants. To separate the effects of shifts between coal and gas, we also checked their shares in production. The electrical efficiency of thermal power plants has increased strongly in Brazil, China and Mexico due to a significant number of efficient new builds (see Figure 5). In India, electrical efficiency has decreased recently because the newly constructed super- and ultra-critical coal plants mean there has been a shift from gas to coal by 9 percentage points (pp) since 2005. For the US, there has been an efficiency gain due to a shift from coal to gas. In the EU, electrical efficiency has stagnated because of a shift from gas to coal for various reasons (see Section 3.2 for details).
Figure 5: Historical development of electrical efficiency of thermal power plants from 1990 – 2014
(own calculation based on Enerdata).
In the buildings sector, the energy consumption per capita is evolving differently for the focus re-gions. Brazil, India and Mexico show a constant trend, while China has experienced continuous growth since the mid-1990s. The latter development is probably due to rising living standards, as
20
25
30
35
40
45
50
1990 1994 1998 2002 2006 2010 2014
%
Thermal power plants: Electrical efficiency
Brazil
China
European Union
India
Mexico
United States
World
16 How Energy Efficiency Cuts Costs for a 2-Degree Future
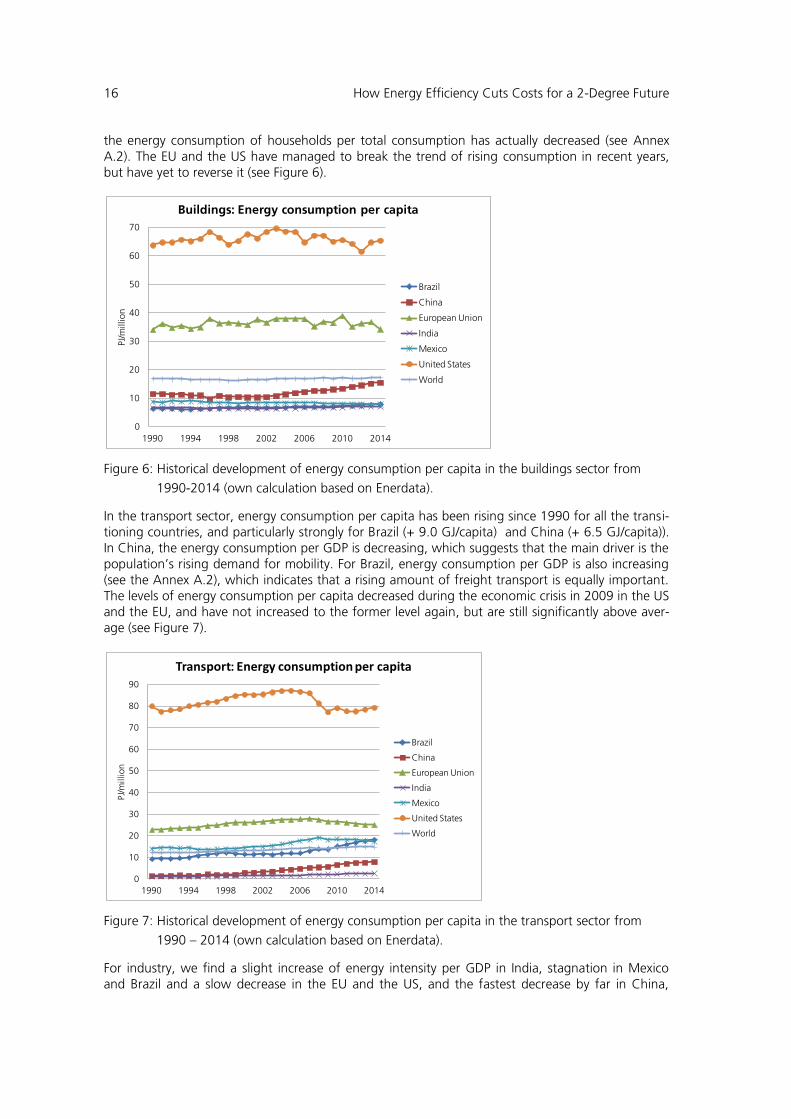
the energy consumption of households per total consumption has actually decreased (see Annex A.2). The EU and the US have managed to break the trend of rising consumption in recent years, but have yet to reverse it (see Figure 6).
Figure 6: Historical development of energy consumption per capita in the buildings sector from
1990-2014 (own calculation based on Enerdata).
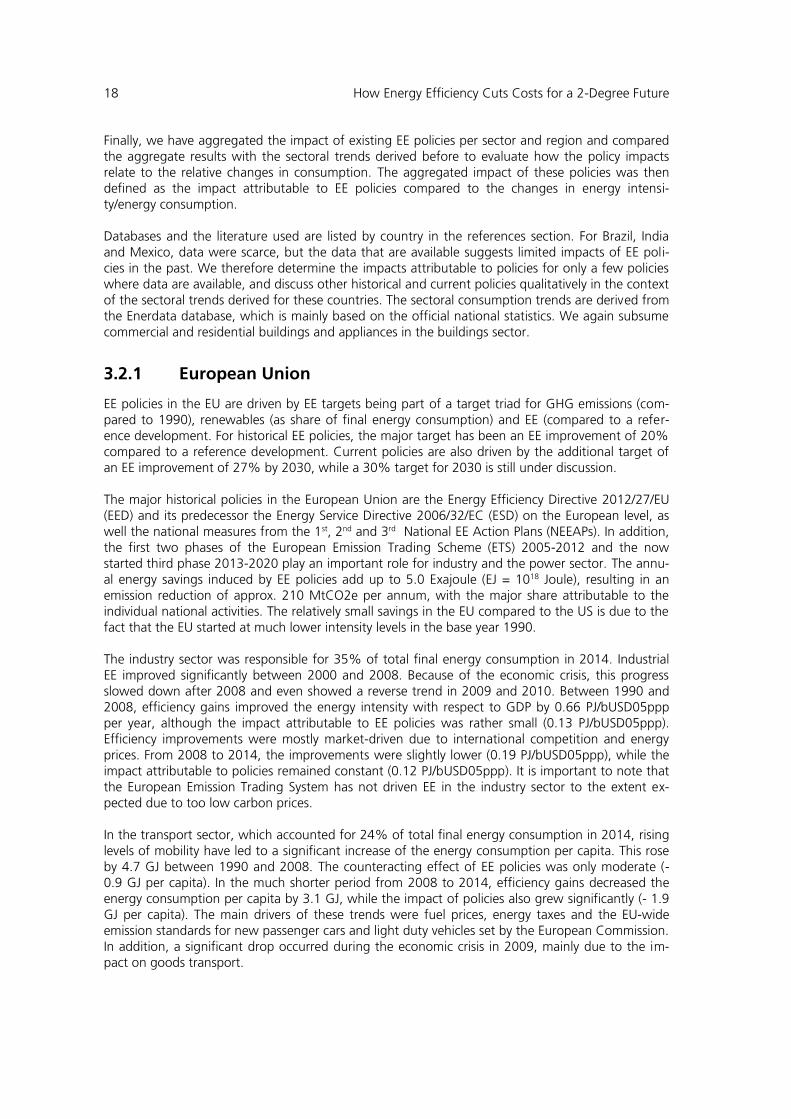
In the transport sector, energy consumption per capita has been rising since 1990 for all the transi-tioning countries, and particularly strongly for Brazil (+ 9.0 GJ/capita) and China (+ 6.5 GJ/capita)). In China, the energy consumption per GDP is decreasing, which suggests that the main driver is the population’s rising demand for mobility. For Brazil, energy consumption per GDP is also increasing (see the Annex A.2), which indicates that a rising amount of freight transport is equally important. The levels of energy consumption per capita decreased during the economic crisis in 2009 in the US and the EU, and have not increased to the former level again, but are still significantly above aver-age (see Figure 7).
Figure 7: Historical development of energy consumption per capita in the transport sector from
1990 – 2014 (own calculation based on Enerdata).
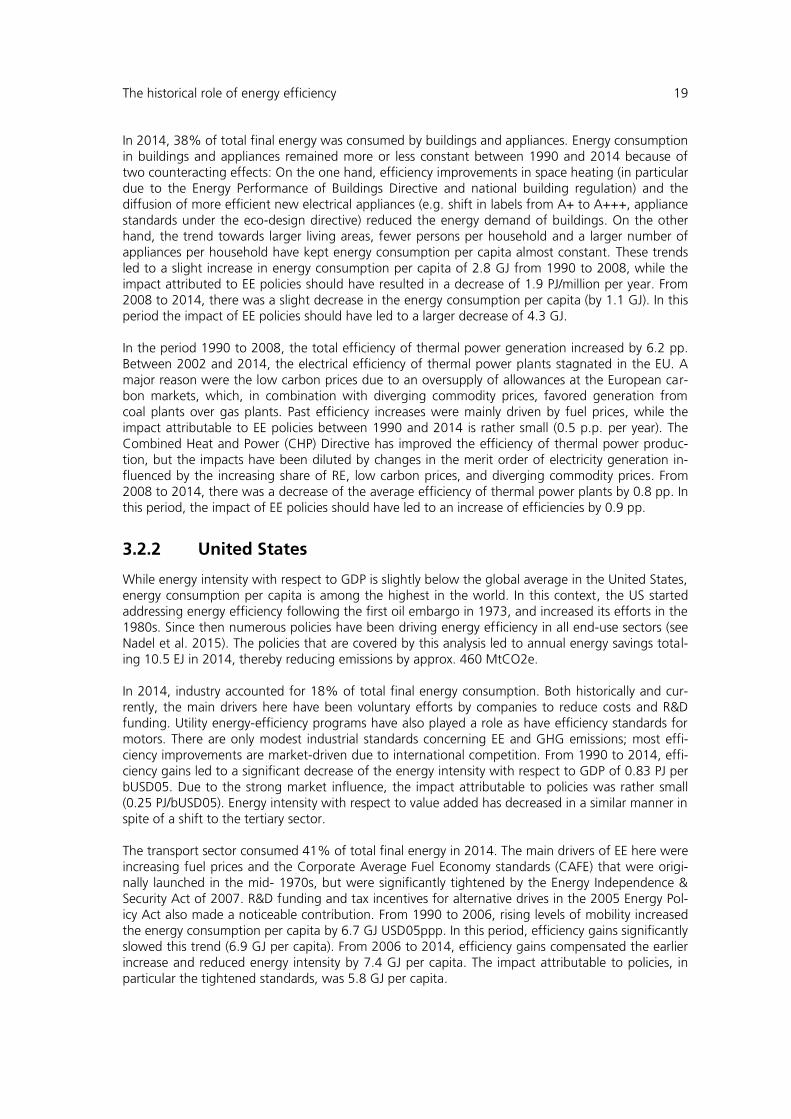
For industry, we find a slight increase of energy intensity per GDP in India, stagnation in Mexico and Brazil and a slow decrease in the EU and the US, and the fastest decrease by far in China,
0
10
20
30
40
50
60
70
1990 1994 1998 2002 2006 2010 2014
PJ/m
illio
n
Buildings: Energy consumption per capita
Brazil
China
European Union
India
Mexico
United States
World
0
10
20
30
40
50
60
70
80
90
1990 1994 1998 2002 2006 2010 2014
PJ/m
illio
n
Transport: Energy consumption per capita
Brazil
China
European Union
India
Mexico
United States
World

The historical role of energy efficiency 17
which also started at the highest level (see Figure 8). It is noteworthy that China managed to return to a constant decrease in 2006 following a few years in the early 2000s with a rising tendency. It has experienced a non-monotonic development in recent years. These developments are mirrored in China’s energy intensity with respect to value added in the industry sector (see Annex A.2). Thus the decrease cannot be due only to a shift to the tertiary sector, but must reflect a lower energy intensity in industry itself. The more recent non-monotonic development raises the question whether China will be able to reach the global average in the longer term.
Figure 8: Historical development of industrial energy intensity per GDP from 1990 – 2014 (own
calculation based on Enerdata).
3.2 Historical EE policies and their impacts
In this subsection, we present the results of compiling historical EE policies and their impacts by sector and region, and discuss these in the context of the statistical trends determined in the pre-ceding section. We compiled a database of historical and current policy measures based on the policy databases of the IEA, the World Energy Council, the Institute for Industrial Productivity and regional databases (e.g. MURE for the EU), and distinguished by sector, namely industry, transport, households, ter-tiary, power generation and cross-cutting as a residual category. We included all the measures ad-dressing energy intensity or energy consumption per capita, but not policies that only support the use of renewable energies in end-use sectors. We included policy impact assessments wherever available from literature research. As annual im-pacts we took the total energy savings in a year due to the policies (not only the incremental sav-ings). To estimate associated emission reductions, we derived sectoral emission intensities in tCO2e/PJ again from the Enerdata database, which is based on official national statistics. The avail-able impact assessment of policies – both ex-ante and ex-post – typically provide only a few impact years. In this case, we have assumed a linear growth between impact years and a constant impact after the last available year. Where the impact assessments of cross cutting measure could not be attributed to specific sectors, we distributed the impacts among sectors proportionally to the de-mand share. The local experts involved (see Section 1) checked that the main EE policies and availa-ble impact assessments were covered and provided additional impact assessments where possible.
0
1
2
3
4
5
6
1990 1994 1998 2002 2006 2010 2014
PJ/B
$0
5p
pp
Industry: Energy intensity per GDP
Brazil
China
European Union
India
Mexico
United States
World
18 How Energy Efficiency Cuts Costs for a 2-Degree Future
Finally, we have aggregated the impact of existing EE policies per sector and region and compared the aggregate results with the sectoral trends derived before to evaluate how the policy impacts relate to the relative changes in consumption. The aggregated impact of these policies was then defined as the impact attributable to EE policies compared to the changes in energy intensi-ty/energy consumption. Databases and the literature used are listed by country in the references section. For Brazil, India and Mexico, data were scarce, but the data that are available suggests limited impacts of EE poli-cies in the past. We therefore determine the impacts attributable to policies for only a few policies where data are available, and discuss other historical and current policies qualitatively in the context of the sectoral trends derived for these countries. The sectoral consumption trends are derived from the Enerdata database, which is mainly based on the official national statistics. We again subsume commercial and residential buildings and appliances in the buildings sector.
3.2.1 European Union
EE policies in the EU are driven by EE targets being part of a target triad for GHG emissions (com-pared to 1990), renewables (as share of final energy consumption) and EE (compared to a refer-ence development. For historical EE policies, the major target has been an EE improvement of 20% compared to a reference development. Current policies are also driven by the additional target of an EE improvement of 27% by 2030, while a 30% target for 2030 is still under discussion. The major historical policies in the European Union are the Energy Efficiency Directive 2012/27/EU (EED) and its predecessor the Energy Service Directive 2006/32/EC (ESD) on the European level, as well the national measures from the 1st, 2nd and 3rd National EE Action Plans (NEEAPs). In addition, the first two phases of the European Emission Trading Scheme (ETS) 2005-2012 and the now started third phase 2013-2020 play an important role for industry and the power sector. The annu-al energy savings induced by EE policies add up to 5.0 Exajoule (EJ = 1018 Joule), resulting in an emission reduction of approx. 210 MtCO2e per annum, with the major share attributable to the individual national activities. The relatively small savings in the EU compared to the US is due to the fact that the EU started at much lower intensity levels in the base year 1990. The industry sector was responsible for 35% of total final energy consumption in 2014. Industrial EE improved significantly between 2000 and 2008. Because of the economic crisis, this progress slowed down after 2008 and even showed a reverse trend in 2009 and 2010. Between 1990 and 2008, efficiency gains improved the energy intensity with respect to GDP by 0.66 PJ/bUSD05ppp per year, although the impact attributable to EE policies was rather small (0.13 PJ/bUSD05ppp). Efficiency improvements were mostly market-driven due to international competition and energy prices. From 2008 to 2014, the improvements were slightly lower (0.19 PJ/bUSD05ppp), while the impact attributable to policies remained constant (0.12 PJ/bUSD05ppp). It is important to note that the European Emission Trading System has not driven EE in the industry sector to the extent ex-pected due to too low carbon prices. In the transport sector, which accounted for 24% of total final energy consumption in 2014, rising levels of mobility have led to a significant increase of the energy consumption per capita. This rose by 4.7 GJ between 1990 and 2008. The counteracting effect of EE policies was only moderate (- 0.9 GJ per capita). In the much shorter period from 2008 to 2014, efficiency gains decreased the energy consumption per capita by 3.1 GJ, while the impact of policies also grew significantly (- 1.9 GJ per capita). The main drivers of these trends were fuel prices, energy taxes and the EU-wide emission standards for new passenger cars and light duty vehicles set by the European Commission. In addition, a significant drop occurred during the economic crisis in 2009, mainly due to the im-pact on goods transport.
The historical role of energy efficiency 19
In 2014, 38% of total final energy was consumed by buildings and appliances. Energy consumption in buildings and appliances remained more or less constant between 1990 and 2014 because of two counteracting effects: On the one hand, efficiency improvements in space heating (in particular due to the Energy Performance of Buildings Directive and national building regulation) and the diffusion of more efficient new electrical appliances (e.g. shift in labels from A+ to A+++, appliance standards under the eco-design directive) reduced the energy demand of buildings. On the other hand, the trend towards larger living areas, fewer persons per household and a larger number of appliances per household have kept energy consumption per capita almost constant. These trends led to a slight increase in energy consumption per capita of 2.8 GJ from 1990 to 2008, while the impact attributed to EE policies should have resulted in a decrease of 1.9 PJ/million per year. From 2008 to 2014, there was a slight decrease in the energy consumption per capita (by 1.1 GJ). In this period the impact of EE policies should have led to a larger decrease of 4.3 GJ. In the period 1990 to 2008, the total efficiency of thermal power generation increased by 6.2 pp. Between 2002 and 2014, the electrical efficiency of thermal power plants stagnated in the EU. A major reason were the low carbon prices due to an oversupply of allowances at the European car-bon markets, which, in combination with diverging commodity prices, favored generation from coal plants over gas plants. Past efficiency increases were mainly driven by fuel prices, while the impact attributable to EE policies between 1990 and 2014 is rather small (0.5 p.p. per year). The Combined Heat and Power (CHP) Directive has improved the efficiency of thermal power produc-tion, but the impacts have been diluted by changes in the merit order of electricity generation in-fluenced by the increasing share of RE, low carbon prices, and diverging commodity prices. From 2008 to 2014, there was a decrease of the average efficiency of thermal power plants by 0.8 pp. In this period, the impact of EE policies should have led to an increase of efficiencies by 0.9 pp.
3.2.2 United States
While energy intensity with respect to GDP is slightly below the global average in the United States, energy consumption per capita is among the highest in the world. In this context, the US started addressing energy efficiency following the first oil embargo in 1973, and increased its efforts in the 1980s. Since then numerous policies have been driving energy efficiency in all end-use sectors (see Nadel et al. 2015). The policies that are covered by this analysis led to annual energy savings total-ing 10.5 EJ in 2014, thereby reducing emissions by approx. 460 MtCO2e. In 2014, industry accounted for 18% of total final energy consumption. Both historically and cur-rently, the main drivers here have been voluntary efforts by companies to reduce costs and R&D funding. Utility energy-efficiency programs have also played a role as have efficiency standards for motors. There are only modest industrial standards concerning EE and GHG emissions; most effi-ciency improvements are market-driven due to international competition. From 1990 to 2014, effi-ciency gains led to a significant decrease of the energy intensity with respect to GDP of 0.83 PJ per bUSD05. Due to the strong market influence, the impact attributable to policies was rather small (0.25 PJ/bUSD05). Energy intensity with respect to value added has decreased in a similar manner in spite of a shift to the tertiary sector. The transport sector consumed 41% of total final energy in 2014. The main drivers of EE here were increasing fuel prices and the Corporate Average Fuel Economy standards (CAFE) that were origi-nally launched in the mid- 1970s, but were significantly tightened by the Energy Independence & Security Act of 2007. R&D funding and tax incentives for alternative drives in the 2005 Energy Pol-icy Act also made a noticeable contribution. From 1990 to 2006, rising levels of mobility increased the energy consumption per capita by 6.7 GJ USD05ppp. In this period, efficiency gains significantly slowed this trend (6.9 GJ per capita). From 2006 to 2014, efficiency gains compensated the earlier increase and reduced energy intensity by 7.4 GJ per capita. The impact attributable to policies, in particular the tightened standards, was 5.8 GJ per capita.

20 How Energy Efficiency Cuts Costs for a 2-Degree Future
Concerning the built environment, which accounted for 34% of total final energy consumption in 2014, the continuous updating of appliance standards and building energy codes (particularly after 2002) have been major drivers of efficiency improvements. Also utility-sector driven efficiency im-provements and R&D funding have played an important role. In total, this has led to a significant decrease of energy intensity with respect to private consumption, but the continuing trend towards more single households, larger living areas and high diffusion rates of new appliances has kept the energy consumption per capita relatively constant. From 1990 to 2014, these developments re-sulted in a slight increase of the energy consumption by 1.7 GJ per capita, while the impact attrib-utable to policies would have corresponded to a decrease by 17.9 GJ per capita. Historically, the efficiency increase in thermal power production was mainly market-driven (by com-petition and fuel prices). There have been only modest efforts concerning EE and GHG emissions, but air pollution standards have had an important impact. After their launch in 2001, non-financial incentives by the CHP partnership have played an important role in increasing the use of CHP. From 1990 to 2014, efficiency improvements resulted in a 5.6 pp increase in the average efficiency of thermal power plants. The impact attributable to policies is only 0.9 pp.
3.2.3 China
While China has pushed measures to foster economic growth and efficiency for decades, the pro-motion of EE in a more prominent fashion has only featured on the political agenda since the early 2000s. Energy efficiency measures were incorporated and launched under the 11th and 12th five-year plans (FYP). Governmental regulation led to mostly mandatory standards, labels and the clo-sure of inefficient plants. The “Top 10,000 companies” program under the 12th FYP includes EE measures affecting two-thirds of the country´s energy consumption. Most sectors have been ad-dressed; power generation standards, appliance standards, building standards and industry stand-ards have been implemented. The transport sector has also been targeted within an “automotive industry development plan”. The major measures from the 11th and 12th FYPs achieved annual energy savings of 10.5 EJ, with an equivalent emission reduction of approx. 530 MtCO2e per year. When evaluating the EE policies and measures in China, there is a wealth of historical data for indi-vidual measures regarding energy savings under the 11th FYP. Prior to the 11th FYP, however, energy efficiency was not a specific policy goal, while data on more recent activities are still lacking to a large extent. It is therefore difficult to derive predictions about future savings and the potential of ongoing measures based on bottom-up data. Industry is the largest energy-consuming sector in China (51% of total energy consumption in 2014). The main EE drivers are the “Top 1,000 companies” program under the 11th FYP (2005-2010) and the “Top 10,000 companies” program started under the 12th FYP (2011-2015). These programs aim to improve energy efficiency in the country’s biggest companies. Other measures include the closure of small and ineffective plants as well as the so called“10 Key Projects”, particu-larly efficiency upgrades for electric motors and coal-burning industrial boilers and kilns. Industrial energy intensity has decreased with regard to GDP; this dropped by 4.42 PJ/bUSD05ppp between 1990 and 2014. The impact attributable to the 11th and 12th FYP is -1.1 PJ/bUSD05ppp. Transport has just started to be targeted by policies on a bigger scale as a large and fast growing sector (13% of total energy consumption in 2014). The most relevant policies are captured by the “Development plan of ‘12th Five-Year Plan’ for transportation” and the “Medium and long-term planning of energy conservation for highway and waterway transportation”. In addition, subsidies for hybrid and electric vehicles, the consolidation of vehicle charging standards and the promotion of fuel-efficient cars have recently been introduced. An important challenge is coping with the growth in the demand for private cars. It seems probable that the trend of decreasing energy inten-sity in this sector will be very difficult to maintain, because demand is growing faster than the
The historical role of energy efficiency 21
economy. In total, the energy consumption in the transport sector has increased by 6.5 GJ per capi-ta since 1990. Historical EE policies have had only a limited impact here (- 0.2 GJ/capita). The buildings sector held a significant 26% share in the country’s total energy consumption in 2014. Building codes in private buildings as well as public institutions have been a major driver of efficiency improvements. Furthermore, energy-efficient lighting is one of the “10 Key Projects”, and appliance standards have also fostered EE. In total, energy consumption per capita in this sec-tor decreased until the year 2002 (- 1.1 GJ/capita). From 2002 onwards, however, there has been a clearly rising trend (+ 5.1 GJ/capita until 2014). Historical EE policies had a moderate damping ef-fect (- 1.5 GJ/capita in 2002-2014). China’s power production has been targeted by four projects within the “10 Key Projects”: the “Direct Level Combined Heat and Power”, the “Waste Heat and Pressure Utilization”, “Oil Conser-vation and Substitution” and the “Renovation of Coal-fired Industrial Boilers”. This sector is the focus of current policies and measures and shows efficiency gains, because economic growth has led to a constant expansion in the installed capacity of thermal power plants. The electrical efficien-cy of thermal power plants increased by 6.93 pp between 1990 and 2014, which can be attributed almost completely to EE policies.
3.2.4 India
India has recognized the importance of fostering EE measures and embarked on a progressive EE agenda in early 2000, with a strong focus on the residential sector. Appliance regulations and la-beling have already been implemented, and further actions in this field have the potential for more EE. The transport sector and power production also have a large potential for EE, because there have only been limited measures here so far, which have not resulted yet in a notable EE improve-ment (Sathaye 2011). Industry is the second largest energy consuming sector in India (approx. 35% in 2014), 70% of which is energy-intensive. Important measures comprise mandatory energy audits that require companies to scrutinize their energy profiles. The Energy Conservation Act requires the government to introduce energy conservation norms for industries. Industrial energy intensity per GDP de-creased by 0.8 PJ/bUSD05ppp from 1990 until 2014. The transport sector was responsible for 14% of total final energy consumption in 2014. The light vehicle fleet is expected to triple during the next decade. The most relevant policies are standards developed by the Bureau of Energy Efficiency (BEE), such as a Corporate Fuel Conservation Stand-ard, Passenger Car Efficiency Standards (since 2011), and the Auto Fuel Policy that first introduced emission norms in 2003. In total, the energy intensity in the transport sector has increased slightly by 1.5 GJ per capita since 1990. The buildings sector is the largest energy-consuming sector in India (approx. 38% in 2014). It is addressed by the Energy Conservation Act of 2001 that created the regulatory mandate for pro-moting energy efficiency, e.g. through standards and labeling as well as building codes. This has been translated into numerous activities targeting the residential sector. Lighting accounts for about 20% of total electricity consumption in India. The Overarching Standards & Labeling Pro-gram, the energy-efficient lighting program “Bachat Lamp Yojana (BLY), and the Super-Efficient Equipment Program addressing ceiling fans were all established by the BEE. A further comprehen-sive program for lighting is the LED Domestic Efficient Lighting Programme. Central EE policiesfor buildings are the Energy Conservation Building Code (ECBC) & Energy Efficiency in Existing Building program (BEE); since 2010, commercial buildings (>100KW) also fall under the ECBC. In the context of rising living standards, however, the policy impact has been marginal. There has been a slight increase of the energy consumption per capita by 0.6 GJ since 1990.
22 How Energy Efficiency Cuts Costs for a 2-Degree Future
India’s power production is characterized by a high share of thermal power plants (> 70%), of which coal constitutes more than 85%. 90% of coal plants apply sub-critical technology with a thermal efficiency below 30%, which holds a huge potential for improvement. The main EE measures comprise legislation to drive a shift towards modern technology (supercritical and ultra-supercritical coal-fired plants). Furthermore, the industry is facing the introduction of a “coal tax” under the National Clean Energy Fund, investing inter alia in EE projects. The electrical efficiency of thermal power plants has decreased by 3.1 pp since 1990.
3.2.5 Brazil
Energy-efficiency measures have been applied in Brazil for more than two decades, with a particu-larly strong focus on the residential sector. Governmental regulation paved the way for voluntary as well as mandatory standards and labels (of which the most important is the PROCEL Seal), and capacity building measures. Industry is the largest energy consuming sector in Brazil (approx. 37% in 2014), but was not tar-geted in the past by EE measures. Minimum energy performance standards (MEPS) were introduced in the late 1990s only for electrical motors. Awareness raising and training programs are in place, however (PROCEL Industry/Commerce). In 2001, law 10.295/013 was introduced and laid the foundations for regulating further devices. Industrial energy intensity increased slightly with regard to GDP by 0.06 PJ/bUSD05ppp between 1990 and 2014. In 2014, energy consumption in the transport sector caught up with industry (also approx. 37% of total energy consumption), but this fact must be regarded in the context of Brazil’s spatial dimen-sions. Main drivers have been both the population’s rising demand for mobility and a rising amount of freight transport. 98% of energy consumed in the transport sector is from fuels (of which etha-nol only accounts for approx. 15%), 92% of this is from road transportation. The most relevant policies are the “CONPET Program” that aims to improve end-user fuel management (e.g. trainings and R&D), and the “PROCONVE Program” that is a car labeling approach. The latter is deemed a success (in 2011, 50% of all cars were labeled). The biggest challenges to improving EE in the transport sector are the absence of a rail network (apart from mineral lines to ports), the advanced age of the road truck fleet, and limited transport infrastructures, particularly in remote areas. More generally, an efficient system for urban and long-distance mobility needs to come up with an effi-cient mix of modes for both passenger and freight transport. In total, energy consumption in the transport sector has increased by 9.0 GJ per capita since 1990, with a stronger increase after 2000 due to the above mentioned income effects. The buildings sector, which accounted for 16% of total final energy consumption in 2014, has been a focus of the Brazilian Government’s EE efforts since the 1980s. Buildings’ programs have been pushing efficiency since the 1990s, with the main drivers being the PROCEL Label (Appliances) and the ENCE label for commercial buildings (2005). The PROCEL label has been mandatory since 2001, and covers an expanding range of appliances (further promoted by the 2001 Energy Efficien-cy Law). The impact attributable to the PROCEL Program in the buildings sector amounted to 0.15 GJ per capita until 2014. In addition, the CONPET program includes a label for gas-/ petroleum-fired appliances in place. Numerous activities exist for phasing out incandescent light bulbs, and for shifting to CFL and/or LEDs. In the last few years, however, there has been an increase in the use of air conditioning and more powerful electric showers. In total, energy consumption in buildings has increased by 1.7 GJ per capita since 1990. Brazilian power production is characterized by a high share of hydro plants (approx. 70% of elec-tricity generation compared to 5% oil and 5% coal). However, there have been recent additions of thermal capacity due to the ongoing underperformance of hydro plants caused by droughts. These

The historical role of energy efficiency 23
efficient new builds have increased the average electrical efficiency of fossil fuel-fired power plants by 6.4 pp since 1990.
3.2.6 Mexico
The Mexican government recognized the relevance of EE measures decades ago, and started intro-ducing measures in the early 1990s. The main instruments are standards, so-called “Norms of Mex-ico” (NOM) and the “PROgrama Nacional para el Aprovechamiento Sustainable de la Energía” (PRONASE). The NOMs have contributed significantly to improving EE in Mexico, while the first PRONASE that ran from 2009 to 2012 was not able to reach its goals. PRONASE 2013 – 2018 has thus been created to promote the development towards enhanced EE (PROSENER 2014, CONUEE 2014). Industry is the second largest energy-consuming sector in Mexico (approx. 26% in 2014). The main driver of EE here are the official NOMs, with the first norm introduced in 1995. The government tried to address EE in larger programs, such as the PRONASE, from 2009. Its impacts were assessed during PRONASE 2009-2012 and it was found that the defined goals were not achieved, e.g. the two big national companies PEMEX and CFE were not affected. Industrial energy intensity per GDP showed an aggregated decrease by 0.49 PJ/bUSD05ppp between 1990 and 2014. The transport sector was Mexico’s largest energy consumer in 2014 (approx. 43%), but has so far not been targeted by EE measures. Two NOMs address the transport sector, which focus on street lighting and the carbon dioxide emissions of light vehicles. Further goals for the transport sector will be developed under PRONASE 2013 – 2018, but details have yet to be published. In the con-text of increased freight transport and a rising demand for mobility, the energy consumption in the transport sector has increased by 4.5 GJ per capita since 1990. The buildings sector has been addressed under several NOMs. The final energy consumption of the residential sector has a share of approx. 20% of Mexico’s total final energy consumption. Most of the NOMs target appliances, primarily air conditioning and refrigerators. Additionally, the “Programa de Ahorro y Eficiencia Energética Empresarial” (PAEEEM), also known as Eco-Crédito Empresarial (2011) supports the private sector in replacing inefficient equipment with efficient technologies. In total, these policies led to a decrease of the energy consumption by 0.8 GJ per capita until 2014. The impact attributable to the NOMs amounts to 0.2 GJ per capita. The main driver of energy efficiency in Mexico’s power production is the Special Program for Cli-mate Change (PECC 2014-2018): PECC is reflected in more than 40 actions in the energy sector concerning adaptation to climate change and the mitigation of greenhouse gases, with specific measures to increase energy efficiency and energy generation using cleaner technologies. The ob-jective is to achieve an efficiency level of at least 51% compared to 46% in 2012 with the national regulation of energy efficiency. The electrical efficiency of thermal power plants has increased by 8.9 pp since 1990.

24 How Energy Efficiency Cuts Costs for a 2-Degree Future
4 Cost savings due to EE in reaching the 2°C target
In this section, we turn to estimating the contribution of EE to reducing the costs of decarbonization in each of the six focus regions. In addition, we discuss the extent to which current policies are likely to realize these cost savings.
4.1 Approach
Our approach is based on an evaluation of bottom-up marginal abatement cost curves (MACC). Such MACCs rank technology-based levers by their net annual costs to reduce emissions by one ton of CO2e, while at the same time specifying the corresponding total abatement potential. The costs are calculated as the difference in full costs (i.e. investments and operation & maintenance costs incl. fuels) to a reference technology in a business-as-usual scenario (see McKinsey & Compa-ny 2009). Hence, MACCs provide transparency by revealing the potentials and costs of specific abatement options. In our analysis, we used the latest MACC v3.0 provided by McKinsey & Company (forthcoming). It covers the status quo of the technologies and markets in each of our focus regions in detail using 2010 as the base year. The MACC v3.0 calculates abatement potentials and costs relative to a business-as-usual scenario (BAU) that is based on the assumptions in the World Energy Outlook. For the sake of consistency, the emission reductions we consider are taken as the difference between the current policies scenario and the 450ppm scenario in the World Energy Outlook 2012 (IEA 2012) and are provided in Table 5 below. It is important to note that the BAU already contains some EE improvements, e.g. market-driven heat rate improvements of individual thermal power plants. As before, we focus on energy-related emissions in the industry, transport, buildings and power sectors. We thus exclude the land-use abatement options from our analysis, which have been the subject of critical debate (Ekins et al. 2011). Abatement options with specific costs above 200 USD/tCO2e were also excluded before-hand. Furthermore, technology-based MACCs require addi-tional efforts to reflect sectoral interactions. For this reason, an extension of the MACC v3.0 comes with six different scenarios, which also take sectoral interactions, structural changes and income effects into account (see Swiss RE 2013). Our analysis is based on the scenario ‘Slow greening of the economy’, which assumes moderate technology development, GDP growth (2.9% on global average) and oil price (100-130 USD). To check the sensitivity of our estimates with respect to these two important factors, we also evaluated the scenarios with the lowest and highest GDP growth and oil price, respectively. As a macroeconomic perspective is taken, the costs do not reflect any transaction costs or national taxes, and real interest rates are assumed to be 4% in general. For the power sector, we define the EE levers as those that increase the average efficiency of ther-mal power plants. For the end-use sectors, EE levers are those that reduce energy consumption (see 6A.3). Given the leeway between 2°C scenarios with lower and higher energy intensities (compare Section 2), the approach we used to estimate the cost savings from a focus on EE abatement op-tions in the EU and the US, China and India, Brazil and Mexico was the following (see Figure 9):
1. We considered a reduction of the global annual level of energy-related GHG emissions by 15.4 GtCO2e in 2030, in accordance with the World Energy Outlook 2012 (IEA 2012). We determined an emission reduction level that complied with the 2°C scenario in 2030 for each of the six regions.
2. For each region, we chose two region-specific sets of abatement options from the MACCs for 2030: the energy intensive pathway (IntPath) reaches only the minimal required reduc-tion in energy intensities (see Table 6 in Annex A.1) and compensates this by a strong de-crease of emission intensities (mainly by expansion of RE and nuclear power, but also bio-
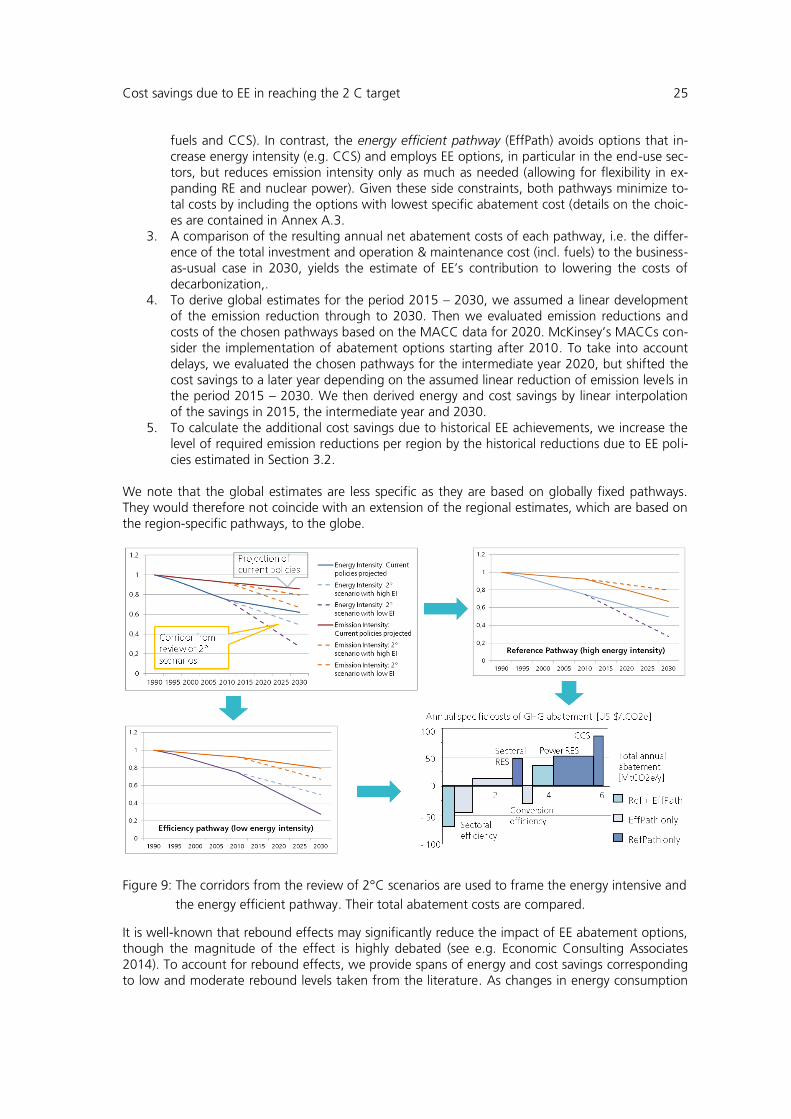
Cost savings due to EE in reaching the 2 C target 25
fuels and CCS). In contrast, the energy efficient pathway (EffPath) avoids options that in-crease energy intensity (e.g. CCS) and employs EE options, in particular in the end-use sec-tors, but reduces emission intensity only as much as needed (allowing for flexibility in ex-panding RE and nuclear power). Given these side constraints, both pathways minimize to-tal costs by including the options with lowest specific abatement cost (details on the choic-es are contained in Annex A.3.
3. A comparison of the resulting annual net abatement costs of each pathway, i.e. the differ-ence of the total investment and operation & maintenance cost (incl. fuels) to the business-as-usual case in 2030, yields the estimate of EE’s contribution to lowering the costs of decarbonization,.
4. To derive global estimates for the period 2015 – 2030, we assumed a linear development of the emission reduction through to 2030. Then we evaluated emission reductions and costs of the chosen pathways based on the MACC data for 2020. McKinsey’s MACCs con-sider the implementation of abatement options starting after 2010. To take into account delays, we evaluated the chosen pathways for the intermediate year 2020, but shifted the cost savings to a later year depending on the assumed linear reduction of emission levels in the period 2015 – 2030. We then derived energy and cost savings by linear interpolation of the savings in 2015, the intermediate year and 2030.
5. To calculate the additional cost savings due to historical EE achievements, we increase the level of required emission reductions per region by the historical reductions due to EE poli-cies estimated in Section 3.2.
We note that the global estimates are less specific as they are based on globally fixed pathways. They would therefore not coincide with an extension of the regional estimates, which are based on the region-specific pathways, to the globe.
Figure 9: The corridors from the review of 2°C scenarios are used to frame the energy intensive and
the energy efficient pathway. Their total abatement costs are compared.
It is well-known that rebound effects may significantly reduce the impact of EE abatement options, though the magnitude of the effect is highly debated (see e.g. Economic Consulting Associates 2014). To account for rebound effects, we provide spans of energy and cost savings corresponding to low and moderate rebound levels taken from the literature. As changes in energy consumption

26 How Energy Efficiency Cuts Costs for a 2-Degree Future
due to income effects (indirect rebound effects) are covered by the macroeconomic model used in the production of McKinsey’s scenarios, we here focus on direct rebound effects (an increase in energy service demand due to lower per unit costs of energy services). To incorporate the direct rebound effects, we decreased the energy and emission savings of the EE levers by the sectoral rates given in Table 4 and accordingly adapted the specific abatement costs. These were compiled on the basis of two meta-studies of rebound effects (Economic Consulting Associates 2014 and Nadel 2012, see Table 4).
Table 4: Ranges used to reflect direct rebound effects by sector (own compilation based on Eco-
nomic Consulting Associates 2014 and Nadel 2012)
Rebound
level
Industry Transport Buildings: high-income
countries
Buildings: low- and medi-
um-income countries
Lower range 0% 0% 6% 13%
Median level 4% 6% 12% 21%
McKinsey’s data on the different abatement options, which we adopt unaltered, include assump-tions about technological development which can, of course, be questioned (Ekins et al. 2011), in particular for technologies far from maturity like CCS but also for currently maturing technologies like renewable energies (RE). The EE technologies we focus on, however, are mostly already mature today and only incremental improvements are assumed. On the other hand, the cost degression of renewable has been faster than expected in the recent years. Therefore our analyses may partly overestimate the cost differences of the pathways. Still, when compared to the BAU scenario the EE options mainly have negative net societal costs, while the alternative options like renewable ener-gies (RE) show decreasing but still positive net societal costs.
4.2 Potentials, costs and related policies
In accordance with the 450 ppm scenario of the World Energy Outlook 2012 (IEA 2012), both the energy-intensive pathway and the energy-efficient pathway reduce the global level of annual en-ergy-related GHG emissions in 2030 by 15.4 GtCO2e compared to 2010, thereby saving about 115 GtCO2e between 2015 and 2030. According to our analysis, both pathways require significant shares of EE measures and decarbonization of the energy supply. In the BAU scenario, the global primary energy consumption in buildings (including appliances), industry and transport is about 450 exajoules in 2030. Even the IntPath requires reducing the primary energy consumption of these sectors by 7%. The EffPath more than doubles the energy savings to 17% of global consumption. The annual net societal costs of the EffPath in 2030, i.e. the difference in the total investment and operation & maintenance costs (including fuels) to the business-as-usual case in 2030, are 440 – 480 billion USD (constant 2005) lower than the net societal costs of the energy-intensive pathway in 2030 (excluding transaction costs). When we evaluate the development of annual cost savings in the period 2015 – 2030, the total cost savings add up to 2.5 – 2.8 trillion USD. Compared to BAU, the energy savings of the energy-intensive pathway also result in annual net cost savings of 240 – 280 billion USD in 2030, which correspond to 0.2% of the global GDP in the BAU scenario in 2030. These add up to 1.2 – 1.6 trillion USD for the period 2015 – 2030. Both pathways thus include significant leeway to cover transaction costs: Net societal cost savings result if transaction costs are lower than 15 USD/tCO2e for the energy-intensive pathway or lower than 44 USD/tCO2e for the energy-efficient pathway.
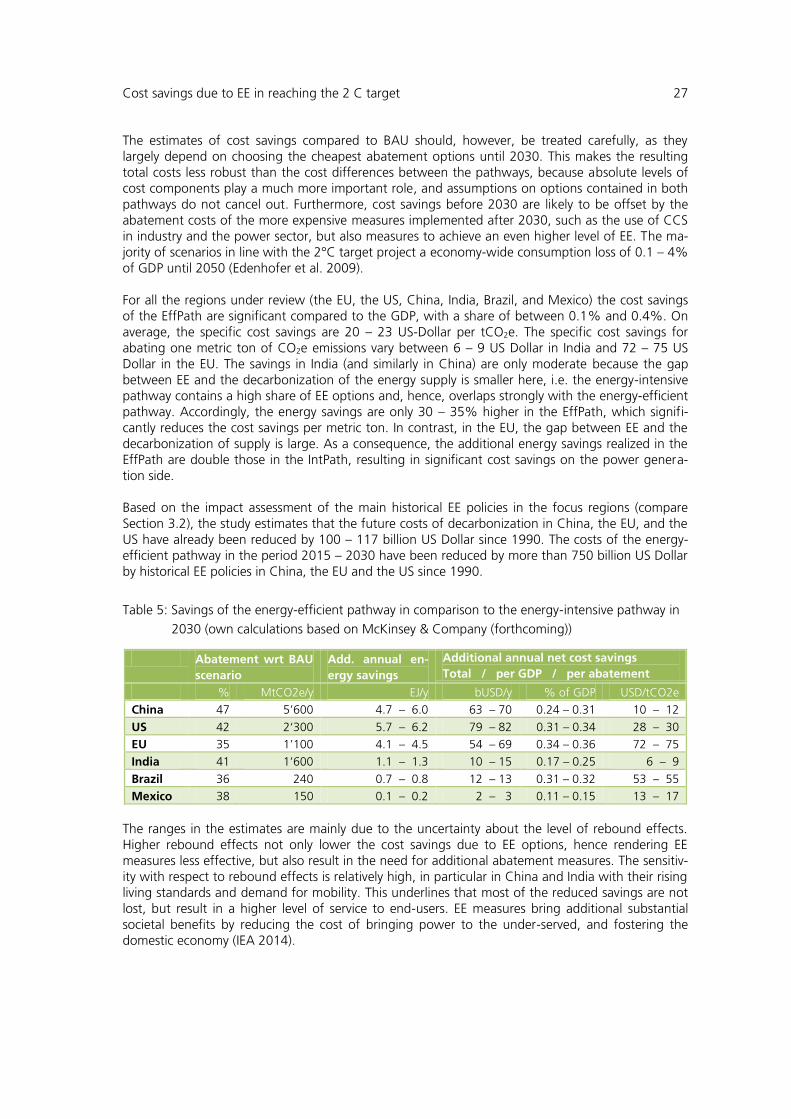
Cost savings due to EE in reaching the 2 C target 27
The estimates of cost savings compared to BAU should, however, be treated carefully, as they largely depend on choosing the cheapest abatement options until 2030. This makes the resulting total costs less robust than the cost differences between the pathways, because absolute levels of cost components play a much more important role, and assumptions on options contained in both pathways do not cancel out. Furthermore, cost savings before 2030 are likely to be offset by the abatement costs of the more expensive measures implemented after 2030, such as the use of CCS in industry and the power sector, but also measures to achieve an even higher level of EE. The ma-jority of scenarios in line with the 2°C target project a economy-wide consumption loss of 0.1 – 4% of GDP until 2050 (Edenhofer et al. 2009). For all the regions under review (the EU, the US, China, India, Brazil, and Mexico) the cost savings of the EffPath are significant compared to the GDP, with a share of between 0.1% and 0.4%. On average, the specific cost savings are 20 – 23 US-Dollar per tCO2e. The specific cost savings for abating one metric ton of CO2e emissions vary between 6 – 9 US Dollar in India and 72 – 75 US Dollar in the EU. The savings in India (and similarly in China) are only moderate because the gap between EE and the decarbonization of the energy supply is smaller here, i.e. the energy-intensive pathway contains a high share of EE options and, hence, overlaps strongly with the energy-efficient pathway. Accordingly, the energy savings are only 30 – 35% higher in the EffPath, which signifi-cantly reduces the cost savings per metric ton. In contrast, in the EU, the gap between EE and the decarbonization of supply is large. As a consequence, the additional energy savings realized in the EffPath are double those in the IntPath, resulting in significant cost savings on the power genera-tion side. Based on the impact assessment of the main historical EE policies in the focus regions (compare Section 3.2), the study estimates that the future costs of decarbonization in China, the EU, and the US have already been reduced by 100 – 117 billion US Dollar since 1990. The costs of the energy-efficient pathway in the period 2015 – 2030 have been reduced by more than 750 billion US Dollar by historical EE policies in China, the EU and the US since 1990.
Table 5: Savings of the energy-efficient pathway in comparison to the energy-intensive pathway in
2030 (own calculations based on McKinsey & Company (forthcoming))
Abatement wrt BAU
scenario
Add. annual en-
ergy savings
Additional annual net cost savings
Total / per GDP / per abatement
% MtCO2e/y EJ/y bUSD/y % of GDP USD/tCO2e
China 47 5’600 4.7 – 6.0 63 – 70 0.24 – 0.31 10 – 12
US 42 2‘300 5.7 – 6.2 79 – 82 0.31 – 0.34 28 – 30
EU 35 1’100 4.1 – 4.5 54 – 69 0.34 – 0.36 72 – 75
India 41 1’600 1.1 – 1.3 10 – 15 0.17 – 0.25 6 – 9
Brazil 36 240 0.7 – 0.8 12 – 13 0.31 – 0.32 53 – 55
Mexico 38 150 0.1 – 0.2 2 – 3 0.11 – 0.15 13 – 17
The ranges in the estimates are mainly due to the uncertainty about the level of rebound effects. Higher rebound effects not only lower the cost savings due to EE options, hence rendering EE measures less effective, but also result in the need for additional abatement measures. The sensitiv-ity with respect to rebound effects is relatively high, in particular in China and India with their rising living standards and demand for mobility. This underlines that most of the reduced savings are not lost, but result in a higher level of service to end-users. EE measures bring additional substantial societal benefits by reducing the cost of bringing power to the under-served, and fostering the domestic economy (IEA 2014).
28 How Energy Efficiency Cuts Costs for a 2-Degree Future
Compared to rebound effects, the impact of GDP growth and the development of fuel prices are smaller. The estimates of energy and cost savings vary by less than 5% when evaluating alternative scenarios featuring changes of more than 10% in economic growth rates and the oil price. This may be an additional argument in favor of EE, as the cost savings seem independent of GDP growth and the development of fuel prices. The following effects can be found on a sector level:
In industry, efficiency gains have huge cost saving potentials, in particular in energy-intensive subsectors like cement, chemicals, iron & steel as well as petroleum & gas, but also for industrial cross-cutting technologies such as industrial steam boilers and electric motors. On average, the increase of industrial EE has significantly lower abatement costs than the abatement options for process emissions, in particular the use of CCS. Still, there are important differences between the regions, which have to be reflected in the regional choice of abatement options.
In the transport sector, increasing the fuel economy of all kinds of vehicles is highly cost-effective and has large abatement potentials. In contrast, the abatement potential of using biofuels is comparatively small. Modal shifts in public and freight transport can also lower demand significantly, but their cost-effectiveness is strongly dependent on the specific re-gion because of different pre-existing infrastructures.
For buildings, highly efficient new builds and retrofitting existing buildings both harbor enormous abatement potentials; the latter is crucial in industrialized regions. The cost-effectiveness of the different abatement options varies strongly: More efficient appliances and lighting in the commercial and residential sectors are typically associated with net cost savings, while better insulation of buildings is cost-effective only up to a certain region-specific level and the cost-effectiveness of replacing inefficient water heaters depends on the region and the type of heater.
In the power sector, the fast phase-out of fossil fuels required by the 2°C target limits the future cost savings from more efficient conversion in thermal power plants. The abatement potential from expanding renewable energies and nuclear power is much larger, but its full exploitation will be expensive. In this context, using high EE in end-use sectors to reduce power demand grants significant flexibility in expanding RE and nuclear. Moreover, this completely avoids the expensive use of Carbon Capture & Storage in power plants until 2030.
In the following, we present details for the EffPath and IntPath by region. We also compare the findings with the results of the literature research on current EE policies in the focus regions (com-pare Section 3.2) and qualitatively assess to which extent the most important EE saving potentials are already addressed. Finally, based on consultations with the local experts involved, we point to existing gaps and resulting policy needs. While proprietary rights prohibit publication of the data related to individual abatement options, we do provide lists of the abatement options included in the two pathways in Annex A.3 as well as the aggregated energy and cost savings by sector for each of the six regions. .
4.2.1 European Union
For the EU, the following insights result from comparing the EffPath and IntPath:
Compared to BAU, the IntPath reduces annual energy consumption by approx. 4.2 – 4.5 EJ until 2030. The EffPath achieves additional energy savings in the order of 4.1 – 4.5 EJ until 2030, depending on rebound effects in buildings and the transport sector.
Cost savings due to EE in reaching the 2 C target 29
Implementing the EffPath can reduce the annual net costs of decarbonization by 79 – 82 billion USD in 2030, which corresponds to a saving of 72 – 75 USD/tCO2e, or 0.34 – 0.36% of the annual European GDP in 2030 in the projections.
In addition, the EE policies covered in Section 3.2 have already decreased the future net costs of decarbonization by approx. 8 – 10 billion USD per annum.
Historical savings are relatively low, because the EU started at low levels compared to the US in 1990, which also allowed lower savings in absolute terms. Future abatement requirements are also low compared to China, which also means lower additional costs for additional abatement meas-ures in the future. Comparing the main potentials of the EffPath to upcoming EE policies, we find:
The revision of the Energy Efficiency Directive with a concrete EE target for 2030, and the implementation of measures from the 3rd National EE Action Plans are steadily driving EE. In addition, the Ecodesign directive will play a relevant role for appliances and heating equipment in buildings and for electrical appliances in industry. Details of their impacts are given below.
Realizing the EffPath in the industry and power sector mainly depends on successful reform of the European Emission Trading System.The lack of EU-wide standards for retrofits of buildings, the low use of building certificates in building transactions, insufficient fuel economy standards for private cars, and the absence of strong policies for freight transport leave room for further improvements.
The EffPath and the IntPath are designed such that the energy-related annual GHG emissions are reduced by 1.1 GtCO2e relative to the BAU scenario, which corresponds to a reduction by 35% in 2030 in accordance with WEO 2012. It should be noted that this is more ambitious than the politi-cal target of a 40% reduction in GHG compared to 1990. In the industry sector, the IntPath avoids the use of CCS, but has to exploit at least some efficiency potentials by continuous improvements in all sectors and significant efforts in the most energy-intensive subsectors like clinker substitution in the cement sector in order to stay in the range of the existing 2°C scenarios. This reduces energy intensity by 0.06 PJ/bUSD until 2030. The EffPath ex-ploits additional efficiency potentials with the largest contribution in the chemicals sector. In total, this leads to a reduction in industrial energy intensity by 0.09 PJ/bUSD. In our bottom-up projec-tions of the future impact of current policies, we see an intermediate decrease of energy intensity with respect to GDP of 0.05 PJ/bUSD. Whether the saving potential will be realized depends mostly on the reform of the European Emissions Trading System (ETS), as industry is affected by the cur-rent ETS phase III (2013-2020) and the upcoming phase IV (2021-2028) besides the obligatory energy audits for large enterprises under Article 8 of the EED, and national policies aiming at link-ing energy tax exemptions to EE improvements (e.g. in Germany). In the transport sector, the IntPath requires a strong decrease of average fuel consumption of me-dium-duty vehicles (MDVs) and heavy-duty vehicles (HDVs) and the expansion of electric and plug-in hybrid light-duty vehicles (LDVs). The energy intensity decreases by 6.2 GJ per capita until 2030. The EffPath leads to a decrease by 9.5 GJ per capita by capturing additional saving potentials, in particular those offered by fuel efficient conventional LDVs as well as modal shifts in freight and public transport. The abatement costs related to modal shifts are low when compared to the other focus regions. The bottom-up policy projections show a medium decrease of energy consumption by 1.2 GJ per capita until 2030. EE potentials in the transport sector are mainly addressed by the continuation of existing policies such as the reduction in CO2-emissions of new passenger cars, promotion of clean and energy-efficient road transport vehicles, car labelling and energy labelling of tyres. Emission standards for road traffic will be extended to HDVs, but only decrease in the or-der of magnitude that is expected from market drivers anyway. Hence, there remain additional saving potentials to be exploited.
30 How Energy Efficiency Cuts Costs for a 2-Degree Future
In the buildings sector, the IntPath does not exploit the large existing saving potentials, so does not reduce energy intensity at all. The main saving potentials used in the EffPath are from retrofitting building envelopes and HVACs, both residential and commercial. This results in a decrease of ener-gy consumption per capita by 4.4 GJ per capita. Rebound effects of up to 0.4 GJ per capita can significantly lower the achievable savings simply due to the sheer size of the buildings sector in the EU. With regard to current policies, stricter building energy codes, the greater diffusion of more efficient appliances triggered by the existing directives, in particular the Energy Performance of Buildings Directive (EPBD), together with improved national thermal building regulations will help to exploit a significant share of the saving potentials. For 2014 to 2030, this is projected to result in a decrease of the energy consumption per capita by 3.2 GJ. After 2020, new buildings in the EU must be 'nearly zero' energy ones. Existing buildings in most EU countries are only affected to a minor extent (under the energy performance certificates obligation of the EPBD and, in specific cases of larger construction changes), which can be seen as a major shortcoming. In the power sector, the IntPath has to compensate low emission reductions in the end-use sectors by very strong decarbonization that exploits all the available options, including wind, nuclear and solar power as well as biomass and CCS. For the EffPath, a moderate expansion of RE in combina-tion with the large emission reductions in end-use sectors are able to avoid the expansion of nucle-ar power and the use of biomass and CCS until 2030. For the period 2014 to 2030, the bottom-up analysis projects an increase of electrical efficiency by 2.6 percentage points, mainly driven by the expansion of CHP. These gains could be boosted by successful reform of the European ETS.
4.2.2 United States
For the US, analyzing the EffPath and the IntPath leads to the following results:
Compared to BAU, the IntPath realizes a reduction of annual energy consumption of about 3.8 EJ until 2030. The EffPath achieves additional energy savings in the order of 6.0 – 6.3 EJ until 2030, mainly depending on the degree of rebound effects in the buildings sector.
Realization of the EffPath would reduce the net costs of decarbonization by 66 – 72 billion USD, which corresponds to a saving of 29 – 33 USD/tCO2e and 0.05 – 0.06% of the GDP projected to 2030.
In addition, the energy intensity reductions due to the historical EE policies covered in Sec-tion 3.2 have already decreased the net costs of decarbonization by 40 – 43 billion USD per annum, mainly in buildings, and the transport sector.
These consequences result for current policy debates:
The Clean Power Plan as well as the updates of Corporate Average Fuel Economy stand-ards and building energy codes are likely to boost energy efficiency throughout all sectors, thereby exploiting a significant share of the main potentials on the EffPath.
Achieving significant retrofits of existing buildings is probably the biggest challenge for EE policy-making in order to realize all the cost savings of the EffPath.
Other challenges include reducing fuel intensity in the energy-intensive industry subsectors and maintaining the support for continued improvements in vehicle and appliance effi-ciency standards.
The EffPath and the IntPath have been designed in such a way that the energy-related annual GHG emissions are reduced by 2.3 GtCO2e relative to the baseline, which corresponds to a reduction of 42% below the baseline in 2030 in accordance with the 450ppm scenario in WEO 2012. In the industry sector, the IntPath shifts fuels to gas and biomass and reduces non-CO2 emissions mainly in the chemicals sector. This avoids the use of most of the industrial efficiency potentials and even results in a marginal increase of energy intensity until 2030. The EffPath achieves a reduction

Cost savings due to EE in reaching the 2 C target 31
of 0.16 PJ/bUSD by exploiting large saving potentials through continuous improvements in all sub-sectors, as well as additional options in the energy-intensive industry sectors such as clinker substi-tution in the cement sector, and procedural improvements in the chemicals and petroleum & gas sectors. In our bottom-up projections of current policies, energy intensity in the industry sector drops moderately by 0.13 PJ per bUSD until 2030. The major share is attributable to the expansion of small-scale CHP and the crediting of EE in the Clean Power Plan (CPP). Yet, the CPP will only help to reduce the power intensity of the industry sector, but not its fuel intensity. In particular, clinker substitution in the cement sector, and procedural improvements in the petroleum & gas sector are only weakly incentivized at present. Any stronger incentives here would presumably re-quire assigning carbon emissions a value, e.g. via an emissions trading scheme. In the transport sector, even the IntPath requires a strong decrease in the average fuel consumption of MDVs and HDVs as well as the expansion of electric and plug-in hybrid LDVs in order to comply with 2°C target. The EI decreases by 7.3 GJ until 2030. The EffPath leads to a decrease by 10.0 GJ by capturing additional saving potentials, in particular those from fuel efficient conventional LDVs, and from modal shifts in freight and public transport. The abatement costs related to modal shifts are moderate compared to those in the other focus regions. With regard to current policies, the CAFE standards for road traffic will be tightened even more, especially for MDVs and HDVs. The attributed impact is projected to be 14.6 GJ per capita. Affirmation of previously adopted CAFE standards from 2022 onwards would increase this to 20.0 GJ per capita. However, additional sav-ing potentials from a modal shift in both public and freight transport remain largely unaddressed. In the buildings sector, the IntPath has to make use of some of the large efficiency potentials, the most important of which are efficient appliances and lighting. This results in a reduction of EI by 2.9 GJ per capita until 2030. The main additional saving potentials used in the EffPath are from retrofitting building envelopes and HVACs, both residential and commercial. This results in a de-crease of EI by 9.1 GJ per capita in the EffPath. Average rebound effects can lower savings by up to 0.5 GJ per capita simply due to the sheer size of energy use in the buildings sector in the US. With regard to current policies, the adoption of certain building energy codes is now mandatory and appliance standards are continuously updated, which results in a projected intensity decrease of 2.2 GJ per capita by 2030. Further tightening of mandatory building energy codes may increase this to 6.8 GJ per capita. To realize these savings, however, the barriers to retrofitting existing buildings will have to be lowered significantly by policy measures in the future. In the power sector, the IntPath has to compensate low emission reductions in the end-use sectors by very strong decarbonization that exploits all the available options, including wind, nuclear and solar power as well as biomass and CCS. For the EffPath, a strong expansion of wind, solar and nuclear power in combination with the large emission reductions in end-use sectors avoids the use of biomass and CCS. Projecting current EE policies results in an efficiency gain of thermal power plants of only 1.8%. This could increase to 7.2% due to significant heat rate improvements from using more natural gas combined-cycle plants instead of coal power plants that may be driven by the CPP
4.2.3 China
For China, the analyses indicate that:
Compared to BAU, the IntPath realizes a reduction of annual energy consumption of more than 14 EJ until 2030. The EffPath achieves additional annual energy savings in the order of 4.7 - 6.0 EJ by 2030, depending on the level of rebound effects in buildings and the in-dustry sector.

32 How Energy Efficiency Cuts Costs for a 2-Degree Future
The realisation of the EffPath would thereby reduce the annual net costs of decarbonization by 54 - 69 billion USD, which corresponds to a saving of 10 - 12 USD/tCO2e and 0.24 - 0.31% of the annual Chinese GDP in 2030 in the baseline scenario.
In addition, the large historical reductions by the EE policies covered in Section 3.2, in par-ticular in the industry sector (TOP 1000 and TOP 10000 program), have already decreased the net costs of decarbonization by approx. 52 – 64 billion USD per annum.
Comparing the major EE potentials with the scope of policies included in the current Five-Year Plan reveals the following:
Industry and the transport sector still hold potential for significant EE gains, although a certain share is already being targeted by policies and measures. The potentials in the buildings sector are already addressed in many ongoing and planned activities.
There are large unaddressed potentials especially in the chemical industry and the iron & steel sector, as well as in petroleum processing and coking. The transport sector will re-quire additional efforts to reduce fuel consumption, especially in HDVs, but also a modal shift in public and freight transport.
The average efficiency of coal plants is increasing rapidly due to efficient new-builds and the expansion of cogeneration. Retrofits of existing plants triggered, e.g. by air-pollution standards, leave scope for improvement.
The EffPath and the IntPath have been designed such that the energy-related GHG emissions are reduced by 5.6 GtCO2e/y relative to the baseline, which corresponds to a reduction by 47% in 2030. Again, this is in accordance with the 450ppm scenario in WEO 2012. In the industry sector, the IntPath assumes the application of CCS, in particular in the iron & steel and the cement sector. In order to stay in the range of the existing 2°C scenarios, however, it is also necessary to use cogeneration in the iron & steel sector and clinker substitution in the cement sector, and to exploit at least some efficiency potentials by continuous improvements in all sectors, thereby reducing the energy intensity by 0.47 PJ/bUSD until 2030. The EffPath reaches a reduction of 0.63 PJ/bUSD by including additional saving potentials in the biggest industry sectors, in particu-lar a BF/BOF to EAF-DRI shift in the iron & steel sector and waste heat recovery in the chemicals sector. These are costly because of the required infrastructure investments, but still provide cost savings compared to the use of CCS in industrial processes. Though rebound effects in industry are relatively small, they can become relevant due to the sheer size of the sector. In the transport sector, even the IntPath requires a strong decrease in the average fuel consumption of all vehicles in road transport, with the most significant contribution attributable to HDVs. The energy intensity decreases by 2.1 GJ per capita until 2030. The EffPath leads to a decrease by 3.1 GJ per capita by capturing additional saving potentials, in particular those from modal shifts in freight and public transport. The related abatement costs are moderate compared to those in other regions. In the buildings sector, the IntPath has to make use of some of the efficiency potentials, the most important ones being efficient appliances and lighting. This results in a reduction of energy intensi-ty by 0.7 GJ per capita until 2030. The EffPath exploits further saving potentials, particularly the large savings potentials from retrofitting commercial buildings and HVAC systems. In total, EI de-creases by 1.4 GJ per capita. These savings may be reduced by up to 0.14 GJ per capita due to rebound effects related to the rising living standards in China. In the power sector, the IntPath has to compensate lower emission reductions in the end-use sec-tors by very strong decarbonization based mainly on nuclear, wind and solar power as well as large-scale application of CCS. The EffPath also requires the use of these potentials, but permits much less aggressive expansion in the order of 70 nuclear plants. In contrast to other EE options, any

Cost savings due to EE in reaching the 2 C target 33
efficiency gains from shifting to gas from coal would probably increase the costs of decarbonization in China. Since the next Five-Year Plan is largely unknown to the public, there are no impact assessments of upcoming EE policies. The available data on current policies only cover a fraction of the measures in place. Projections based on these data show only marginal increases of efficiency and thus call for additional efforts to be made.
4.2.4 India
For India, analyzing the EffPath and the IntPath shows:
Compared to BAU, the IntPath realizes a reduction of annual energy consumption of approx. 3.9 EJ until 2030. The EffPath achieves additional energy savings in the order of 1.1 – 1.3 EJ/y with uncertainties due to possible rebound effects across all end-use sectors.
The EffPath would reduce the annual net costs of decarbonization by 10 – 15 billion USD, which corresponds to a saving of 6 – 9 USD/tCO2e and 0.17 – 0.25% of the annual Indian GDP in 2030 in the baseline scenario.
The reductions of energy intensity by the EE policies covered in Section 3.2 have been assessed as marginal. We therefore did not estimate the corresponding cost savings. A comparison of current policies with the EffPath reveals that:
All sectors still hold potentials for numerous EE measures, because only a limited number is being implemented.
In particular, the industry sector harbors additional cost saving potentials in iron & steel production, while the transport sector has potential for reduced fuel consumption (mainly HDVs).
Both efficient new-builds and replacing existing cooling systems offer large saving poten-tials in the buildings sector.
Decarbonizing power production could be made more flexible by shifting from coal to gas in the medium term.
Compliance with the 450ppm scenario in WEO 2012 requires that the energy-related annual GHG emissions are reduced by 1.6 GtCO2e in the EffPath and the IntPath relative to the baseline, which corresponds to a reduction by 41%. In the industry sector, the IntPath assumes the use of the large but costly potentials for CCS, mainly in the iron & steel sector. In order to comply with 2°C target, it is also necessary to exploit at least some efficiency potentials by continuous improvements in all sectors, as well as to make use of cogeneration in the iron & steel sector and clinker substitution in the cement sector, thereby reduc-ing the energy intensity by 0.42 PJ/bUSD. The EffPath achieves a reduction of 0.59 PJ/bUSD by ex-ploiting additional saving potentials in the biggest industry sectors, in particular, by a BF/BOF to EAF-DRI shift in the iron & steel sector. These are costly because of the required infrastructure in-vestments, but still provide cost savings compared to the use of CCS in industrial processes. In the transport sector, the IntPath requires – similar to China – a decrease of the average fuel con-sumption in road transport with the most significant contribution attributable to HDVs. The energy intensity decreases by 0.6 GJ per capita until 2030. The EffPath leads to a decrease by 0.8 GJ per capita by capturing additional saving potentials, in particular those from the use of low GWP MVACs and a modal shift in public transport. A modal shift in freight transport will be relatively expensive in India due to the required infrastructure.
34 How Energy Efficiency Cuts Costs for a 2-Degree Future
In the buildings sector, the IntPath has to make use of some of the efficiency potentials, the most important being efficient appliances and lighting. This results in a reduction of energy intensity by 0.1 GJ per capita until 2030. The EffPath exploits various additional saving potentials, in particular the large potentials from replacing inefficient air conditioning and HVACs, but also those offered by efficient new-builds. This yields a decrease in energy intensity by 0.2 GJ per capita. In the power sector, the IntPath has to greatly expand the use of nuclear, wind and solar power as well as CCS to compensate for the lower emission reductions in the end-use sectors. The EffPath can reduce the use of these options to five average-sized nuclear power plants by the shift from coal to gas. 15 – 25% of energy use in India is estimated to be avoidable (IPEEC 2012, Teri 2010). Due to its huge EE potential, the industry sector is expected to improve its energy savings. Currently, the Gov-ernment of India prepares to issue Energy Efficiency Certificates for trading and offsetting (Perform, Achieve and Trade Scheme, PAT). For transport, the growing economy and population in India, the potentials for a modal shift to rail and for a more efficient road fleet indicate large energy efficiency increases over the next decade. For the residential sector, electricity consumption is anticipated to increase significantly in the near future. The sector is being targeted by numerous DSM measures so that EE increases are expected in the next decade(s). India is still highly dependent on thermal power (mainly coal), and has to satisfy its growing hunger for energy. Within this coal dependency, the country is starting to back efficient technologies, so overall efficiency gains are expected in the next decade. The data basis for estimating the potential impacts of existing and planned policies and measures is poor for the period from 2015 to 2030, which makes robust estimations difficult.
4.2.5 Brazil
For Brazil, analyzing the EffPath and the IntPath indicates that:
Compared to BAU, the IntPath realizes a reduction of annual energy consumption of about 1.6 EJ until 2030. The EffPath achieves additional energy savings in the order of 0.7 – 0.8 EJ until 2030, mainly depending on rebound effects in the transport and industry sectors.
The EffPath would reduce the annual net costs of decarbonization by 13 billion USD, which corresponds to a saving of 54 – 55 USD/tCO2e and to 0.32% of the annual Brazilian GDP in 2030 in the baseline scenario.
The reductions of energy intensity by the EE policies covered in Section 3.2 have been assessed as marginal. Therefore, no estimates were made of the corresponding cost savings. Comparing the potentials of the EffPath with current policies shows that:
The industry sector holds the potential for numerous EE measures, in particular in the iron & steel sector, but also throughout all other subsectors, while only a limited number of measures is already implemented or under consideration.
For the transport sector, strict fuel economy standards and infrastructure investments sup-porting a modal shift seem to be necessary additions to the existing labeling of cars.
A significant share of the potentials in the buildings sector is already targeted by ongoing and planned activities, particularly within the PROCEL program, but retrofits of HVACs and air-conditioning call for additional measures.
In accordance with the 450ppm scenario in WEO 2012, both the EffPath and the IntPath have been designed in such a way that the energy-related annual GHG emissions are reduced by 0.24 GtCO2e relative to the baseline, which corresponds to a reduction by 36% in 2030. In the industry sector, compliance with the 2° scenarios requires both the IntPath and the EffPath to exploit all efficiency potentials by continuous improvements in all sectors, as well as to make use of
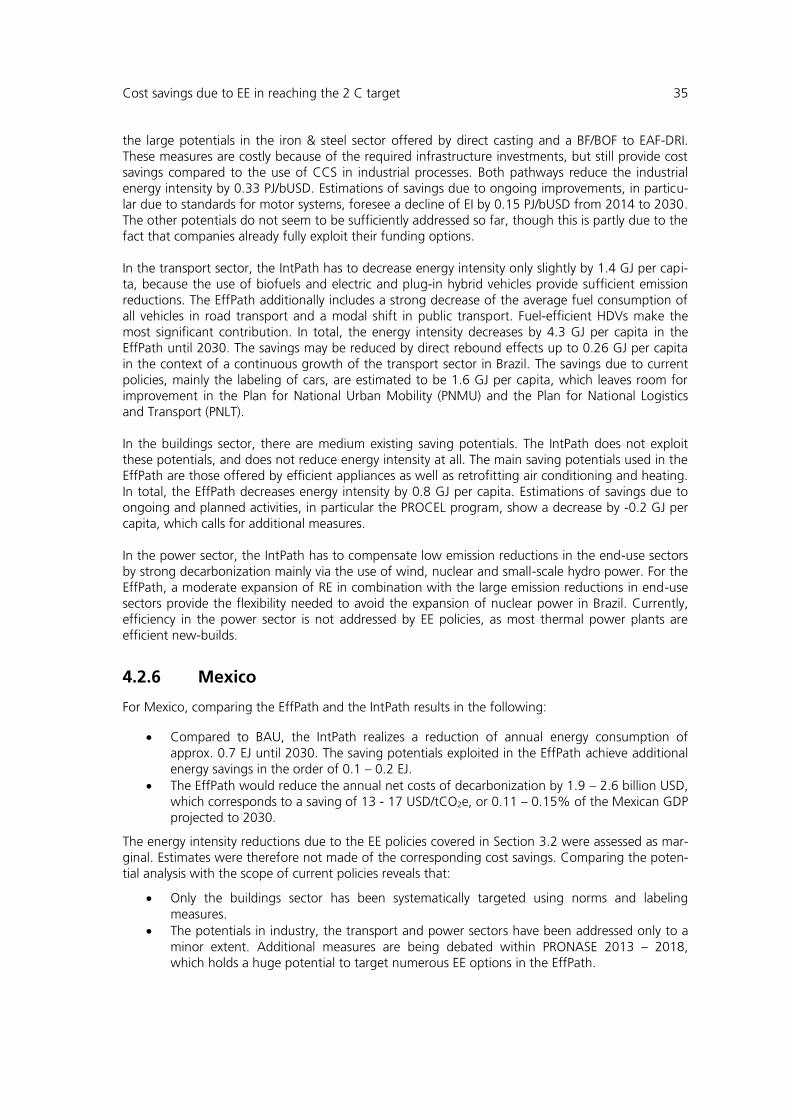
Cost savings due to EE in reaching the 2 C target 35
the large potentials in the iron & steel sector offered by direct casting and a BF/BOF to EAF-DRI. These measures are costly because of the required infrastructure investments, but still provide cost savings compared to the use of CCS in industrial processes. Both pathways reduce the industrial energy intensity by 0.33 PJ/bUSD. Estimations of savings due to ongoing improvements, in particu-lar due to standards for motor systems, foresee a decline of EI by 0.15 PJ/bUSD from 2014 to 2030. The other potentials do not seem to be sufficiently addressed so far, though this is partly due to the fact that companies already fully exploit their funding options. In the transport sector, the IntPath has to decrease energy intensity only slightly by 1.4 GJ per capi-ta, because the use of biofuels and electric and plug-in hybrid vehicles provide sufficient emission reductions. The EffPath additionally includes a strong decrease of the average fuel consumption of all vehicles in road transport and a modal shift in public transport. Fuel-efficient HDVs make the most significant contribution. In total, the energy intensity decreases by 4.3 GJ per capita in the EffPath until 2030. The savings may be reduced by direct rebound effects up to 0.26 GJ per capita in the context of a continuous growth of the transport sector in Brazil. The savings due to current policies, mainly the labeling of cars, are estimated to be 1.6 GJ per capita, which leaves room for improvement in the Plan for National Urban Mobility (PNMU) and the Plan for National Logistics and Transport (PNLT). In the buildings sector, there are medium existing saving potentials. The IntPath does not exploit these potentials, and does not reduce energy intensity at all. The main saving potentials used in the EffPath are those offered by efficient appliances as well as retrofitting air conditioning and heating. In total, the EffPath decreases energy intensity by 0.8 GJ per capita. Estimations of savings due to ongoing and planned activities, in particular the PROCEL program, show a decrease by -0.2 GJ per capita, which calls for additional measures. In the power sector, the IntPath has to compensate low emission reductions in the end-use sectors by strong decarbonization mainly via the use of wind, nuclear and small-scale hydro power. For the EffPath, a moderate expansion of RE in combination with the large emission reductions in end-use sectors provide the flexibility needed to avoid the expansion of nuclear power in Brazil. Currently, efficiency in the power sector is not addressed by EE policies, as most thermal power plants are efficient new-builds.
4.2.6 Mexico
For Mexico, comparing the EffPath and the IntPath results in the following:
Compared to BAU, the IntPath realizes a reduction of annual energy consumption of approx. 0.7 EJ until 2030. The saving potentials exploited in the EffPath achieve additional energy savings in the order of 0.1 – 0.2 EJ.
The EffPath would reduce the annual net costs of decarbonization by 1.9 – 2.6 billion USD, which corresponds to a saving of 13 - 17 USD/tCO2e, or 0.11 – 0.15% of the Mexican GDP projected to 2030.
The energy intensity reductions due to the EE policies covered in Section 3.2 were assessed as mar-ginal. Estimates were therefore not made of the corresponding cost savings. Comparing the poten-tial analysis with the scope of current policies reveals that:
Only the buildings sector has been systematically targeted using norms and labeling measures.
The potentials in industry, the transport and power sectors have been addressed only to a minor extent. Additional measures are being debated within PRONASE 2013 – 2018, which holds a huge potential to target numerous EE options in the EffPath.

36 How Energy Efficiency Cuts Costs for a 2-Degree Future
For Mexico, the EffPath and the IntPath have both been designed in such a way that the energy-related GHG emissions are reduced by 0.15 GtCO2e/y, which corresponds to an average reduction by 38% relative to the baseline in WEO 2012. In the industry sector, compliance with existing 2°C scenarios requires both the IntPath and the EffPath to exploit the whole range of efficiency potentials by improvements in all sectors with the largest contribution from upstream procedural changes in the petroleum & gas sector. This leads to a reduction of energy intensity by 0.26 PJ/bUSD in both pathways. Under the new PRONASE 2013 – 2018, clear targets are set for improvements in all sectors regarding the design and implementa-tion of energy efficiency programs from production to final use. However, the data basis for esti-mating the potential impacts of existing and planned measures is poor for the period 2014 – 2030, which makes robust estimations difficult. In the transport sector, again, even the IntPath requires a decrease of the average fuel consumption of MDVs and HDVs. The energy intensity decreases by 1.8 GJ per capita until 2030. The EffPath leads to a decrease by 3.0 GJ per capita by capturing additional saving potentials, in particular by reducing the average fuel consumption of HDVs even further, as wells as using efficient MVACs and promoting a modal shift in public transport. In contrast, a modal shift in freight transport would be extremely expensive due to the missing infrastructures. In the buildings sector, the IntPath has to use some of the medium-sized efficiency potentials, the most important being efficient appliances and lighting controls. This results in a reduction of energy intensity by 0.5 GJ per capita until 2030. The EffPath achieves a slightly stronger decrease of energy intensity by 0.6 GJ per capita, in particular due to efficient lighting and retrofitting air-conditioning systems. The existing impact assessments of current and planned standards predict a reduction of less than 0.1 GJ per capita from 2015 to 2030, which leaves much scope for improvements. PRONASE 2013 - 2018 “Policy 5” aims to increase the number of people receiving information about EE measures and the benefits of sustainable energy use by 3% compared to 2012. In the power sector, the IntPath requires very strong decarbonization driven mainly by the use of geothermal, wind and concentrated solar power, but also a moderate application of CCS. The higher emission reductions in the end-use sectors in the EffPath provide the option to avoid the use of CCS and relax the necessary expansion of RE in the order of 4’000 large wind power plants.
Conclusions and outlook 37
5 Conclusions and outlook
This study estimated that the global energy savings associated with a decarbonization pathway that strongly promotes energy efficiency add up to 17% of global primary energy consumption in build-ings (including appliances), industry and transport in 2030. The annual net societal costs of decar-bonization – which would otherwise be largely dominated by technologies with net positive abatement costs such as renewable energies or CCS - can be reduced by 440 – 480 billion USD (excluding transaction costs). For the period 2015 – 2030, these cost savings add up to 2.5 – 2.8 trillion USD, which provides significant leeway in covering transaction costs. For all the regions under study (EU, the US, China, India, Brazil, and Mexico), the cost savings are significant compared to the GDP with a share of between 0.1% and 0.4%. This is roughly equiva-lent to the current annual investments in renewable energies. In addition, this study estimated that the future costs of decarbonization in the period 2015 – 2030 have been reduced by more than 750 billion US Dollar by historical EE policies since 1990. The sensitivity to rebound effects is rela-tively high, in particular in China and India due to their rising levels of living standards and mobility. This underlines that most of the reduced savings are not lost, but result in a higher level of service to end-users. EE measures bring additional substantial societal benefits by reducing the cost of bringing power to the under-served, and fostering the domestic economy (IEA 2014). Significant saving potentials exist in all end-use sectors. (see Figure 2).
Figure 10: Illustration of efficiency potentials by sector in a marginal abatement cost curve that
separates EE and non-EE levers (own representation).
In the transport sector, increased fuel economy in all kinds of vehicles is highly cost-effective and associated with large emission abatement potentials. The abatement potential from the use of biofuels is comparatively small. Modal shifts in public and freight transport can also lower demand significantly, but their cost-effectiveness is heavily dependent on the respective region because of different pre-existing infrastructures. For buildings, there are enormous abatement potentials in both highly efficient new-builds and the retrofit of existing buildings. The latter is crucial in the US and the EU (due to the longer lifetime of buildings and lower building activity), but also non-negligible in China and India. The cost-effectiveness of the different abatement options varies strongly: More efficient appliances and
PowerIndustry
010 30
Total annual abatement [GtCO2e/y]
50
100
-50
-100
20
Annual specific costs of GHG abatement [USD/tCO2e] Transport
Highly efficient buildings come withlarge abatement potentials. Cost-effectiveness varies between options.
The abatement potentials of RE and nuclear power are by far the largest, but the costs offully exploiting them will be high. High efficiency in end-use sectors lowers the costsof decarbonizing supply significantly and grants flexibility in choosing options.
Until 2030, expensive use ofCarbon Capture & Storage both for power generationand industrial processes isavoidable by reducing power demand and deploying RE.
Buildings Efficiency
Efficiency gains in industry show hugesaving potentials, in particular in energy-intensive subsectors.
Increasing the fueleconomy ofvehicles is highlycost-effective andoffers much larger abatement potentialsthan biofuels.
$Benefit
$Cost
emissions reduction

38 How Energy Efficiency Cuts Costs for a 2-Degree Future
lighting in the commercial and residential sectors are typically associated with net cost savings, while better insulation is cost-effective only up to a certain region-specific level, and the cost-effectiveness of replacing water heaters depends on both the region and type of system. In industry, efficiency gains show large saving potentials, in particular for industrial cross-cutting technologies such as industrial steam boilers and electric motors, but also in the energy-intensive subsectors of cement, chemicals, iron & steel, and as petroleum & gas. On average, the abatement costs for increasing industrial EE are significantly lower than the abatement options for process emissions, in particular the use of CCS. In fact, these costs are mostly negative which even yields abatement benefits. Still, there are important differences between the regions, which have to be reflected in the regional choice of abatement options. In the power sector, the fast phase-out of fossil fuels required by the 2°C target limits the cost savings from more efficient thermal power plants. The abatement potential from expanding RE and nuclear power is much larger, but its full exploitation will be expensive. In this context, strongly reducing the demand for power by boosting EE in the end-use sectors achieves greater flexibility with regard to expanding RE and nuclear power. Moreover, this makes the expensive use of Car-bon Capture & Storage in power plants avoidable until 2030. These findings have the following important consequences with regard to current policy debates:
In the US, tightening and expanding fuel economy standards and crediting of EE in the Clean Power Plan represent major steps forward to realizing the cost savings from EE. Nev-ertheless, measures are still lacking to achieve significant retrofits of existing buildings, and the additional saving potentials from a modal shift in both public and freight transport re-main largely unaddressed. Moreover, procedural improvements in the energy-intensive in-dustry sectors are currently only weakly incentivized.
In the EU, the revision of the Energy Efficiency Directive and the implementation of the 3rd National EE Action Plans are steadily driving EE. In addition, the Ecodesign directive will play an important role, especially for heating equipment in buildings and electric appli-ances in industry, the residential and services sectors. However, the policy impacts of stan-dards for the retrofit of existing buildings (neither at EU nor at national level) are too weak, which can be seen as a major shortcoming. The subsidy programmes for existing buildings that are seen as an alternative to regulation may be insufficient, especially in countries with economic slowdown. Other options for improvement lie in stricter fuel economy standards for cars and stronger policies for freight transport.
China has embarked on fostering EE policies in all the relevant sectors in its 11th and 12th Five-Year Plans. Still, the additional potential in the industry sector is considered to be huge, in particular in chemicals and the iron & steel sector. In spite of existing fuel econo-my standards, the energy intensity of transport is likely to increase due to rising private demand. It might be possible to slow this trend by continuously tightening standards, in particular for HDVs, and by supporting a modal shift. Also the steady increase in the ener-gy consumption of buildings calls for further measures. The average efficiency of coal plants is increasing rapidly due to efficient new builds, but retrofits of existing plants could be boosted. China’s Intended Nationally Determined Contribution (INDC) (Government of China 2015) promotes the general value of EE without specifying concrete measures.
In its INDC to the UNFCCC (Government of India 2015), India promotes its existing plans to address EE measures in the sectors of power production, transport, industry and buildings. Currently, India has embarked on fostering EE polices and measures mainly in the residen-tial sector – the other sectors, however, harbor vast EE potentials, in particular fuel econo-my standards in the transport sector and procedural changes in the iron & steel sector.
In spite of vast potentials in all sectors, Brazil has fostered EE policies mainly in its PROCEL program for buildings. However, retrofits of HVACs and air-conditioning call for additional measures, for instance under the National Energy Efficiency Plan. Strict fuel economy
Conclusions and outlook 39
standards and infrastructure investments supporting a modal shift are to be addressed by the Plan for National Urban Mobility (PNMU) and the Plan for National Logistics and Transport (PNLT). The industry sector holds potential for numerous EE measures, in particu-lar in the iron & steel sector, but also throughout all other subsectors, but only a limited number have already been implemented or are under consideration. The Brazilian INDC acknowledges these potentials to some extent by aiming at 10% efficiency gains in elec-tricity consumption by 2030 (Government of Brazil 2015).
Mexico has also embarked on fostering EE polices and measures mainly in the buildings sector. Other detailed goals for HVACs and lighting controls but also for transport and in-dustry are being developed under PRONASE 2013 – 2018. Due to the low penetration of the sector and its huge EE potential, the PRONASE program holds large potential for EE gains in the industry sector in the near future. The same is true for the transport sector, where an average fuel consumption is required of MDVs and HDVs. Mexico’s INDC (Gov-ernment of Mexico 2015) remains vague about implementing EE measures.
In all regions, it is of the utmost importance to address why many of the cost savings due to EE are not yet being realized by markets, private investors and households. It is well-known that financial barriers are partly to blame, but there are also several important non-financial barriers, including lack of information, bounded rationality, uncertainty about revenues and the involvement of nu-merous end-users and actors such as consulting engineers, wholesalers, OEMs, manufacturers, banks, insurances, professional training institutions, energy agencies, and administrations (Sorrell et al. 2004). To overcome these barriers, it is important to choose the right mix of policy instruments that specif-ically addresses the potentials and barriers (Allcott and Greenstone 2012). Standard economic measures such as removing subsidies for fossil fuels and pricing carbon are important pillars for the realization of EE measures, but are not sufficient. Non-financial instruments include lowering trans-action costs and supporting the diffusion of EE measures. The concept of social learning can play a key role here. Studies of recent developments have shown that the formation of local EE networks can significantly boost the diffusion of EE in all areas, and lower the transaction costs for the actors. Among the hundreds of existing EE networks, Rohde et al. (2015) evaluated 30 such networks which include 360 companies. They found that approx. 80% would not have implemented an important share of the identified EE measures without the net-work approach. On the other hand, most private investors – whether companies or private con-sumers – still require short payback periods. This barrier has to be addressed by promoting options other than payback periods to improve the cost efficiency of EE measures such as the internal rate of return. However, to some extent, this may also require financial support for the required up-front investments, especially where large up-front investments are concerned such as for the retro-fit of existing buildings. To remedy this, policy makers can use investment incentives that shorten payback periods and lower up-front investments, but also support a market for energy service companies that share the cost burdens and benefits with end-users in EE joint ventures. Classical energy suppliers and distributors can also participate in such energy service markets, for example, through instruments such as energy saving obligations, or energy efficiency tenders, and may evolve themselves into energy service companies. In summary, the findings of this study suggest that it is highly beneficial to society to implement EE policies that boost EE in each of the six regions reviewed and beyond, because a decarbonization pathway with a strong focus on energy efficiency offers much greater flexibility in decarbonizing the energy supply as well as significant societal cost savings up to 2030. This study, however, could only touch upon transactions costs of the implementation of EE policies. It is very important that future research addresses the question how transaction costs can be minimized and takes a closer at the different EE potentials and policies across regions.

40 How Energy Efficiency Cuts Costs for a 2-Degree Future
6 References
Databases:
ENERDATA (2014): Global Energy & CO2 Data, http://www.enerdata.net/enerdatauk/knowledge/subscriptions/database/energy-market-
data-and-co2-emissions-data.php.
IAMC AR5 Scenario Database (2015): https://secure.iiasa.ac.at/web-apps/ene/AR5DB/dsd?Action=htmlpage&page=about.
Industrial Efficiency Policy Database (July 2015): http://iepd.iipnetwork.org/policy/
International Energy Agency (2015): EE Policies and Measures Database, http://www.iea.org/policiesandmeasures/energyefficiency/.
McKinsey & Company (forthcoming): Global GHG Abatement Cost Curve v3.0. Version 2.1 is available at: http://www.mckinsey.com/client_service/sustainability/latest_thinking/greenhouse_gas_aba
te-
ment_cost_curveshttp://www4.unfccc.int/submissions/INDC/Published%20Documents/Indi
a/1/INDIA%20INDC%20TO%20UNFCCC.pdf.
MURE Database: http://www.measures-odyssee-mure.eu/.
World Energy Council (July 2015): http://www.worldenergy.org/data/energy-efficiency-
policies-and-measures/.
General:
Allcott, H., Greenstone, M. (2012): Is There an Energy Efficiency Gap? Journal of Economic Perspectives, 26(1): 3-28.
Barney, J., Deng Y., Cornelissen, S., Wesselink, B., and Blok K. (2011): The Energy Report: 100% Renewable Energy by 2050. Gland. http://wwf.panda.org/what_we_do/footprint/climate_carbon_energy/energy_solutions22/renewable_energy/sustainable_energy_report/.
Economic Consulting Associates (2014): Phase 1 final report: The rebound effect for devel-oping countries, http://www.evidenceondemand.info/phase-1-final-report-the-rebound-
effect-for-developing-countries.
Edenhofer, O., Carraro, C., Hourcade, J.-C., Neuhoff, K., Luderer G., Flachsland, C., Jakob, M., Popp, A., Steckel, J., Strohschein, J., Bauer, N., Brunner, S., Leimbach, M., Lotze-Campen, H., Bosetti, V., de Cian, E., Tavoni, M., Sassi, O., Waisman, H., Crassous-Doerfler, R., Monjon, S., Dröge, S., van Essen, H., del Río, P. and Türk, A. (2009): The Economics of Decarbonisation. Report of the RECIPE Project. Potsdam: Potsdam Institute for Climate Impact Research.
Ekins, P., Kesicki, F., Smith, A. Z. P. (2011): Marginal Abatement Cost Curves: A call for caution. http://www.bartlett.ucl.ac.uk/energy/news/documents/ei-news-290611-macc.pdf
Frankfurt School-UNEP Centre/BNEF (2015): Global Trends in Renewable Energy Invest-ment, http://www.fs-unep-centre.org
GEA (2012): Global Energy Assessment – Toward a Sustainable Future. Cambridge University Press, Cambridge, UK and New York, NY, USA and the International Institute for Applied Systems Analysis, Laxenburg, Austria.
Greenpeace International (2012): Energy [r]evolution – A Sustainable World Energy Outlook. Amsterdam; Brussels. http://www.greenpeace.org/international/Global/international/publications/climate/2012/Energy Revolution 2012/ER2012.pdf.
IEA (2012): World Energy Outlook 2012, IEA, Paris, DOI: http://dx.doi.org/10.1787/weo-2012-en

References 41
IEA (2014): Capturing the Multiple Benefits of Energy Efficiency. http://www.iea.org/publications/freepublications/publication/Captur_the_MultiplBenef_ofEnergyEficiency.pdf
IEA (2015): Energy Efficiency Market Report 2015, http://www.iea.org/publications/freepublications/publication/MediumTermEnergyefficiency
MarketReport2015.pdf.
IPCC (2014): Climate Change 2014: Mitigation of Climate Change. Contribution of Working Group III to the Fifth Assessment Report of the Intergovernmental Panel on Climate Change Edenhofer, O., Pichs-Madruga, R., Sokona, Y., Farahani, E., Kadner, S., Seyboth, K., Adler, A., Baum, I., Brunner, S., Eickemeier, P., Kriemann, B., Savolainen, J., Schlömer, S., von Stechow, C., Zwickel, T., and Minx, J.C. (eds.)]. Cambridge University Press, Cambridge, United Kingdom and New York, NY, USA.
Kolstad C., Urama, K., Broome, J., Bruvoll, A., Cariño Olvera, M., Fullerton, D., Gollier, C., Hanemann, W. M., Hassan, R., Jotzo, F., Khan, M. R., Meyer, L., and Mundaca, L. (2014): Social, Economic and Ethical Concepts and Methods. In: Climate Change 2014: Mitigation of Climate Change. Contribution of Working Group III to the Fifth Assessment Report of the Intergovernmental Panel on Climate Change. Edenhofer, O., et al. (eds.). Cambridge University Press, Cambridge, United Kingdom and New York, NY, USA.
McKinsey & Company (2009), Pathways to a low-carbon economy: Version 2 of the global greenhouse gas abatement cost curve http://www.mckinsey.com/~/media/McKinsey/dotcom/client_service/Sustainability/cost%20
curve%20PDFs/Pathways_lowcarbon_economy_Version2.ashx.
Nadel, S. (2012): The Rebound Effect: Large or Small? ACEEE White Paper, http://aceee.org/sites/default/files/pdf/white-paper/rebound-large-and-small.pdf.
Rohde, C., Köwener, D., Nabitz, L. Mielicke U. (2015): Learning Energy Efficiency Networks - Evidence based experiences from Germany, ACEEE summer study, http://aceee.org/files/proceedings/2015/data/papers/6-48.pdf.
Sorrell, S., O'Malley, Schleich, J. and Scott, S. (2004): The economics of energy efficiency: Barriers to cost-effective investment. Edward Elgar, Cheltenham, UK.
Swiss RE (2013): Building a sustainable energy future: risks and opportunities, http://www.swissre.com/media/news_releases/nr_20130121_climate_energy_future.html#i
nline.
Brazil:
Government of Brazil (2015): Intended Nationally Determined Contribution of Brazil – INDC 2015, http://www4.unfccc.int/submissions/INDC/Published%20Documents/Brazil/1/BRAZIL%20iN
DC%20english%20FINAL.pdf.
International Partnership for Energy Efficiency Cooperation – IPEEC (2014): Energy Effi-ciency Report Brazil, http://www.ipeec.org/site/download/fid/37/type/members.html.
Programa Nacional de Conservação de Energia Elétrica – PROCEL (2014): Official Website of PROCEL, http://www.procelinfo.com.br/main.asp.
China:
Government of China (2015): Intended Nationally Determined Contribution of China – INDC 2015: http://www4.unfccc.int/submissions/INDC/Published%20Documents/China/1/China's%20I
NDC%20-%20on%2030%20June%202015.pdf.
Levine, M.D., Price, L., Zhou N., Fridley, D., Aden, N., Lu, H., McNeil, M., Zheng, N., Yining, Q. (2010): Assessment of China’s Energy-Saving and Emission-Reduction Accomplishments and Opportunities During the 11th Five Year Plan.

42 How Energy Efficiency Cuts Costs for a 2-Degree Future
http://eetd.lbl.gov/sites/all/files/publications/lbl-3385e-11fyp-accomplishments-
assessmentapril-2010.pdf.
Xu J.-H., Fan Y., Yu, S.-M. (2014): Energy conservation and CO2 Emission reduction in China’s 11th Five-Year Plan: A performance evaluation. Energy Economics, 46(6): 348-359.
EU:
Faberi, S., Paolucci, L., Lapillonne, B., Pollier K. (2015): Trends and policies for energy sav-ings and emissions in transport. http://www.odyssee-mure.eu/publications/br/energy-efficiency-trends-policies-
transport.pdf.
Gynther, L., Lapillonne, B., Pollier, K. (2012): Energy Efficiency Trends and Policies in the Household and Tertiary Sectors. http://www.odyssee-mure.eu/publications/br/energy-
efficiency-trends-policies-buildings.pdf.
Lapillonne, B., Pollier K., Sebi, C. (2015): Energy Efficiency Trends in industry in the EU. http://www.odyssee-mure.eu/publications/br/Industry-indicators-brochure.pdf.
India:
Government of India (2015): Intended Nationally Determined Contribution of India - INDC 2015. Intended Nationally Determined Contribution.
International Partnership for Energy Efficiency Cooperation - IPEEC (2012): Energy Effi-ciency Report India. http://www.ipeec.org/site/download/fid/41/type/members.html.
Sathaye, Jayant (2011): India’s Energy Efficiency and Renewable Energy Potential: Policies and Programs. http://transatlanticenergyefficiency.eu/sites/default/files/India_Sathaye_0.pdf.
The Energy and Resources Institute – TERI (2010): Teri Energy Data Yearbook 2010, New Delhi.
Mexico:
CONUEE (2014ª): PRONASE 2014-2018, Programa nacional para el aprovechamiento sus-tainable de la energía; Sectretario de energía. http://www.conuee.gob.mx/work/sites/Conuee/resources/LocalContent/182/4/PRONASE20
142018FINAL.pdf.
CONUEE (2014b): ETRONASE, Estrategia de transición para promover el uso de tecnologías y combustibles más limpios; CONUEE, Sectretario de energía. http:
//www.conuee.gob.mx/pdfs/pronase/ETPRONASE_Conue_VF05122014.pdf.
CONUEE (2014c): Assessment of the impact of standards and labelling programs in Mex-ico; SEAD, Clean Energy ministerial, CONUEE workshop 02/2014.
Government of Mexico (2015): Intended Nationally Determined Contribution of Mexico – INDC 2015. http://www4.unfccc.int/submissions/INDC/Published%20Documents/Mexico/1/MEXICO%2
0INDC%2003.30.2015.pdf.
Sectretario de energía SENER (2013): PROSENER 2013-2018, Programa sectorial de energ-ía; Sectretario de energía. http://sener.gob.mx/res/PROSENER.pdf.
Sectretario de energía (2015): Programa especial de cambio climatic. http://www.energia.gob.mx/portal/Default.aspx?id=3146^.
US:
Carvallo, J.P., Larsen, P.H., Goldman, C.A. (2014): Estimating customer electricity savings
from projects installed by the U.S. ESCO industry, Lawrence Berkeley National Laboratory.
http://emp.lbl.gov/sites/all/files/lbnl-6877e.pdf.

References 43
CLIMATE PROTECTION PARTNERSHIPS 2013 REPORT, EPA (2015).
http://www.energystar.gov/ia/partners/publications/pubdocs/ENERGYSTAR_2013AnnualRe
port-508.pdf?94c4-0edf.
Department of Energy, DOE/EE-0968 (2013): Better Plants Program progress report fall
2013, http://energy.gov/sites/prod/files/2014/03/f11/bp_progress_ report_fall_2013.pdf.
Gold, R., Nadel, S. (2011): Assessing the harvest: Implementation of the energy efficiency
provisions in the Energy Policy Act of 2005.
http://aceee.org/sites/default/files/publications/researchreports/E113.pdf.
Hayes, S., Herndon, G., Barrett, J.P., Mauer, J., Molina, M., Neubauer, M., Trombley, D.,
Ungar, L. (2014): Change is in the Air: How States Can Harness Energy Efficiency to
Strengthen the Economy and Reduce Pollution. http://aceee.org/research-report/e1401.
Livingston, O.V., Cole, P.C., Elliott, D.B., Bartlett, R. (2013): Building Energy Codes Pro-
gram: National Benefits Assessment, 1992-2040.
http://www.greenbuildinglawblog.com/uploads/file/DOE%20Building%20Energy%20Code
%20Savings%20Report%20Oct%202013%281%29.pdf.
Nadel, S., Neal, E., Langer, T. (2015): Energy Efficiency in the United States: 35 Years and
Counting, Report E1502.
http://aceee.org/sites/default/files/publications/researchreports/e1502.pdf.

44 How Energy Efficiency Cuts Costs for a 2-Degree Future
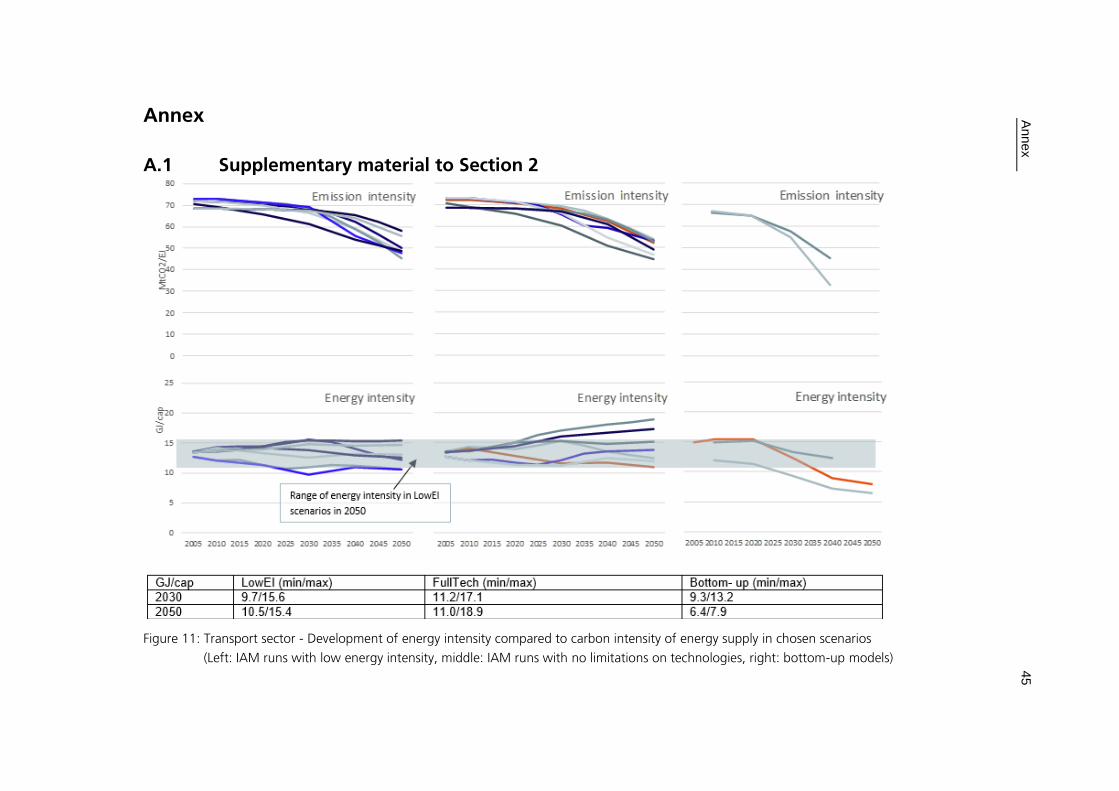
Ann
ex
45
Annex
A.1 Supplementary material to Section 2
Figure 11: Transport sector - Development of energy intensity compared to carbon intensity of energy supply in chosen scenarios
(Left: IAM runs with low energy intensity, middle: IAM runs with no limitations on technologies, right: bottom-up models)
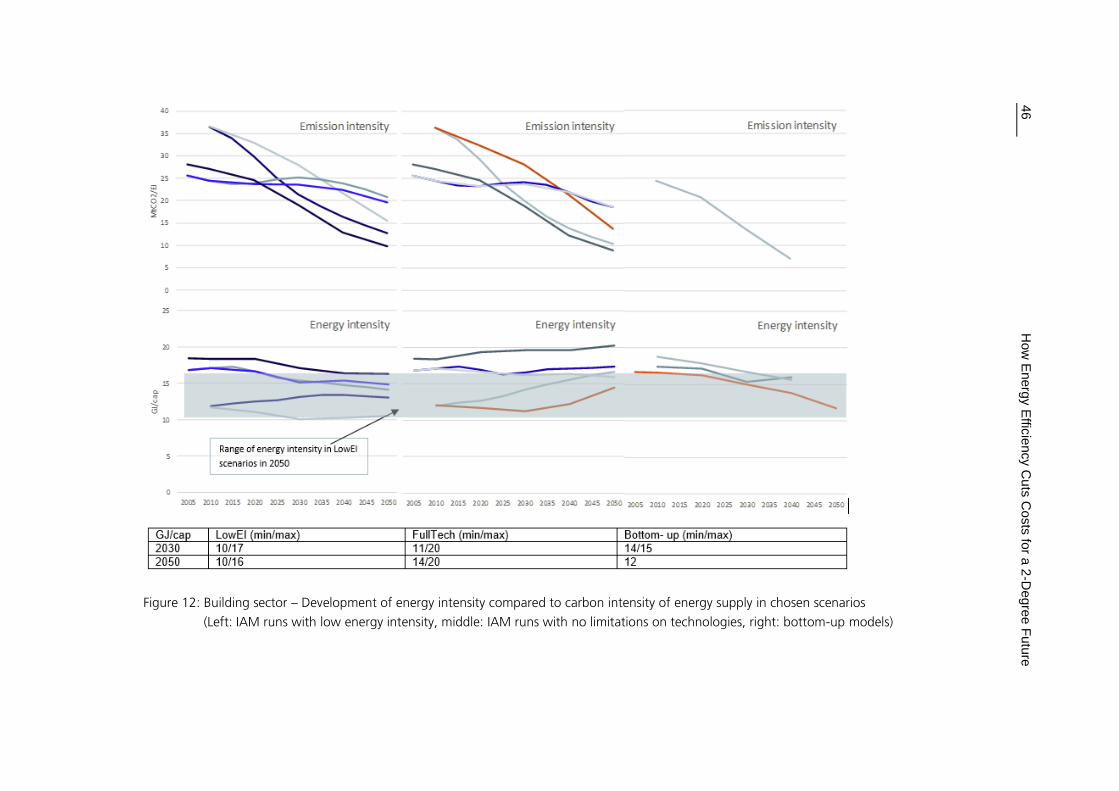
46
H
ow
Energ
y E
fficie
ncy C
uts
Costs
for a
2-D
egre
e F
utu
re
Figure 12: Building sector – Development of energy intensity compared to carbon intensity of energy supply in chosen scenarios
(Left: IAM runs with low energy intensity, middle: IAM runs with no limitations on technologies, right: bottom-up models)
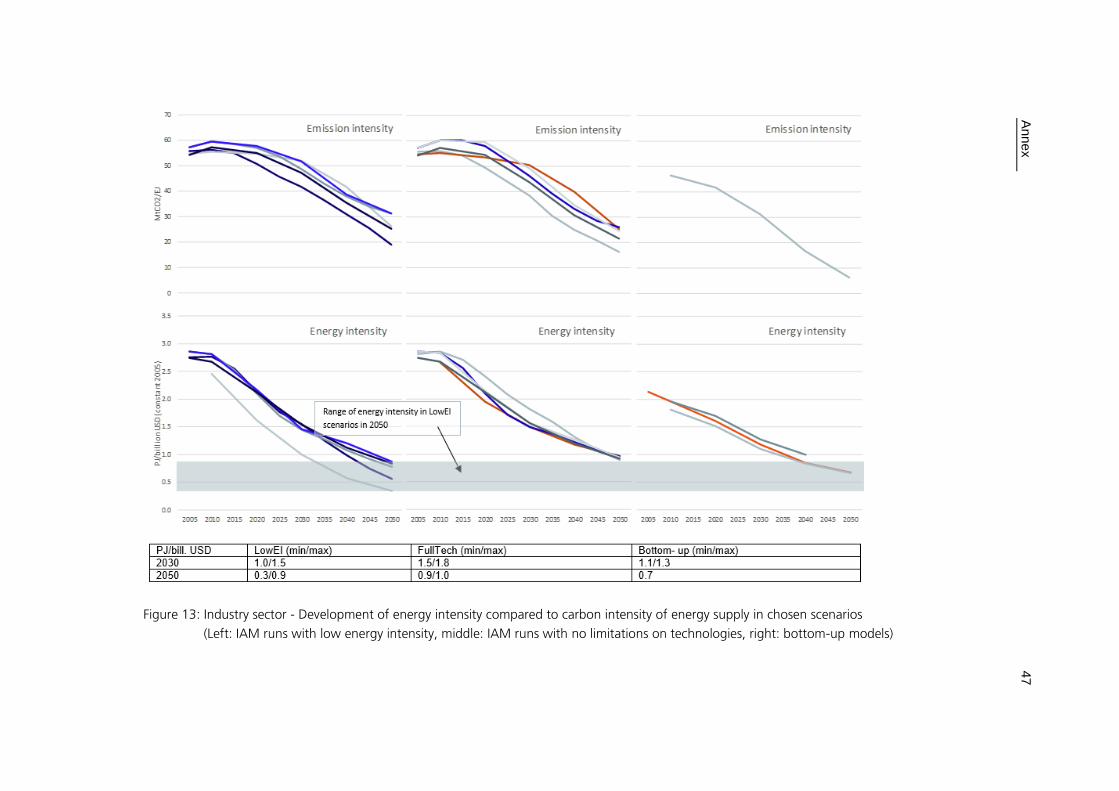
Ann
ex
47
Figure 13: Industry sector - Development of energy intensity compared to carbon intensity of energy supply in chosen scenarios
(Left: IAM runs with low energy intensity, middle: IAM runs with no limitations on technologies, right: bottom-up models)

48
H
ow
Energ
y E
fficie
ncy C
uts
Costs
for a
2-D
egre
e F
utu
re
Table 6: Energy intensity in 2°C scenarios per region and sector

Ann
ex
49

50 How Energy Efficiency Cuts Costs for a 2-Degree Future
Costs in 2°scenarios Only few scenarios provide data for the area under the MAC curve (IMAGE and POLES). Figure 14 illustrates this indicator for LowEI and FullTech scenarios of the two models. The two models vary strongly between each other. Comparing the LowEI to the FullTech scenarios of the same model, we see that for the scenarios with a low energy intensity, the area under the MAC curve is smaller, meaning that the overall mitigation costs are lower.
Figure 14: Area under MAC curve in chosen IAM models (left: LowEI sc., right: FullTech scenarios)
The GDP loss increases in most scenarios, both LowEI and FullTech. The levels are slightly lower for LowEI scenarios. The REMIND EMF27 scenario even leads to negative costs in the LowEI run, while it has positive costs in the FullTech scenario. The IMACLIM EMF27 scenario peaks around 2040.
Figure 15: GDP loss in chosen IAM models (left: LowEI scenarios, right: FullTech scenarios)
0
1000
2000
3000
4000
5000
6000
7000
8000
9000
2005 2010 2015 2020 2025 2030 2035 2040 2045 2050
Are
aM
AC
curv
e [b
illi
on
US$
20
05
/yr]
IMAGE 2.4_AMPERE2-450-LowEI-OPT
IMAGE 2.4_EMF27-450-LowEI
POLES EMF27_EMF27-450-LowEI
0
1000
2000
3000
4000
5000
6000
7000
8000
9000
2005 2010 2015 2020 2025 2030 2035 2040 2045 2050
Are
aM
AC
curv
e [b
illi
on
US$
20
05
/yr]
IMAGE 2.4_AMPERE2-450-FullTech-OPT
IMAGE 2.4_EMF27-450-FullTech
POLES EMF27_EMF27-450-FullTech
-8000
2000
12000
22000
32000
42000
2005201020152020202520302035204020452050
GD
Plo
ss [b
illio
n U
S$2
00
5/y
r]
IMACLIM v1.1_AMPERE2-450-LowEI-OPT
IMACLIM v1.1_EMF27-450-LowEI
MERGE_EMF27_EMF27-450-LowEI
REMIND 1.5_AMPERE2-450-LowEI-OPT
REMIND 1.5_EMF27-450-LowEI
WITCH_AMPERE_AMPERE2-450-LowEI-OPT
-8000
2000
12000
22000
32000
42000
2005201020152020202520302035204020452050
GD
Plo
ss [b
illio
n U
S$2
00
5/y
r]
IMACLIM v1.1_AMPERE2-450-FullTech-OPT
IMACLIM v1.1_EMF27-450-FullTech
REMIND 1.5_AMPERE2-450-FullTech-OPT
REMIND 1.5_EMF27-450-FullTech
WITCH_AMPERE_AMPERE2-450-FullTech-OPT
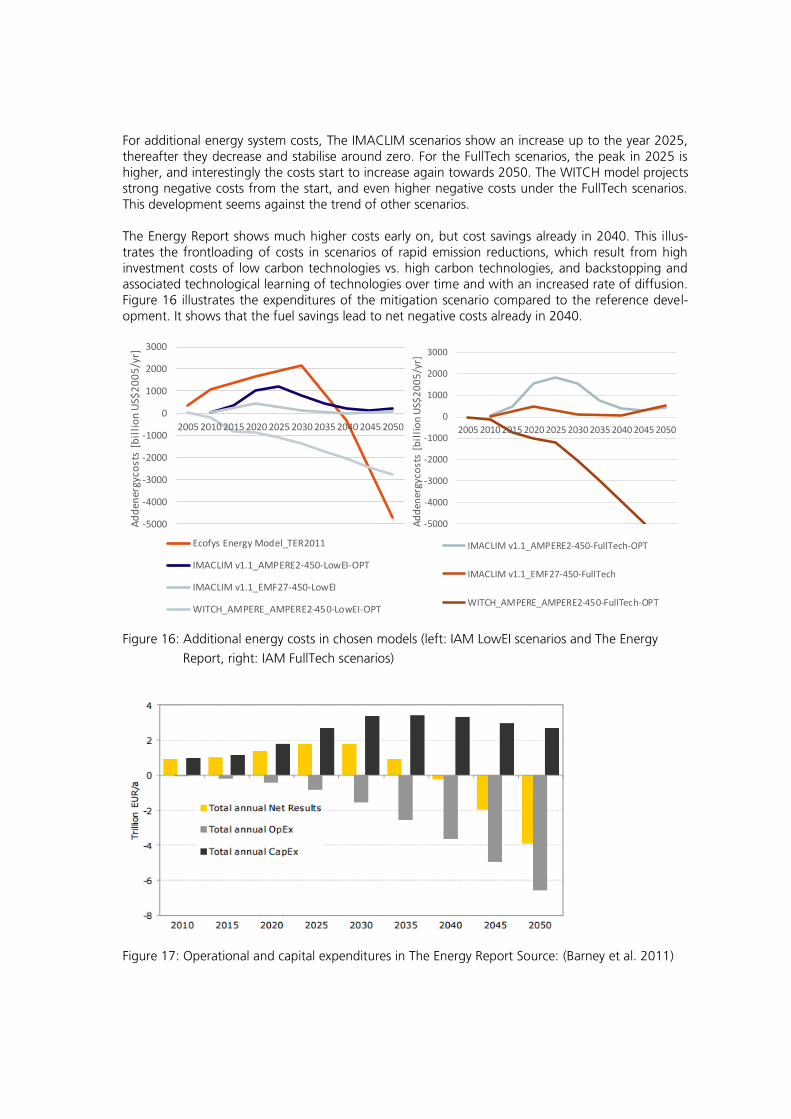
Ann
ex
51
For additional energy system costs, The IMACLIM scenarios show an increase up to the year 2025, thereafter they decrease and stabilise around zero. For the FullTech scenarios, the peak in 2025 is higher, and interestingly the costs start to increase again towards 2050. The WITCH model projects strong negative costs from the start, and even higher negative costs under the FullTech scenarios. This development seems against the trend of other scenarios. The Energy Report shows much higher costs early on, but cost savings already in 2040. This illus-trates the frontloading of costs in scenarios of rapid emission reductions, which result from high investment costs of low carbon technologies vs. high carbon technologies, and backstopping and associated technological learning of technologies over time and with an increased rate of diffusion. Figure 16 illustrates the expenditures of the mitigation scenario compared to the reference devel-opment. It shows that the fuel savings lead to net negative costs already in 2040.
Figure 16: Additional energy costs in chosen models (left: IAM LowEI scenarios and The Energy
Report, right: IAM FullTech scenarios)
Figure 17: Operational and capital expenditures in The Energy Report Source: (Barney et al. 2011)
-5000
-4000
-3000
-2000
-1000
0
1000
2000
3000
2005 2010 2015 2020 2025 2030 2035 2040 2045 2050
Ad
den
ergy
cost
s [b
illi
on
US$
20
05
/yr]
Ecofys Energy Model_TER2011
IMACLIM v1.1_AMPERE2-450-LowEI-OPT
IMACLIM v1.1_EMF27-450-LowEI
WITCH_AMPERE_AMPERE2-450-LowEI-OPT
-5000
-4000
-3000
-2000
-1000
0
1000
2000
3000
2005 2010 2015 2020 2025 2030 2035 2040 2045 2050
Ad
den
ergy
cost
s [b
illi
on
US$
20
05
/yr]
IMACLIM v1.1_AMPERE2-450-FullTech-OPT
IMACLIM v1.1_EMF27-450-FullTech
WITCH_AMPERE_AMPERE2-450-FullTech-OPT

52 How Energy Efficiency Cuts Costs for a 2-Degree Future
Figure 18 shows similar results for the consumption loss: In all scenarios, they increase over time, under the FullTech scenarios faster than under the LowEI scenarios. IMACLIM AMPERE shows a slightly disruptive curve, and in the LowEI scenarios abruptly peaks in 2045.
Figure 18: Consumption loss in chosen IAM models (left: LowEI scenarios, right: FullTech scenarios)
For the GEA, scenarios with a high energy demand are significantly more costly than scenarios with lower energy use. There is less of a difference between the intermediate and the low energy de-mand (compare Figure 19to Figure 20 and Figure 21).
Figure 19: Energy investments in the GEA high energy demand scenarios
0
2000
4000
6000
8000
10000
12000
14000
16000
2005 2010 2015 2020 2025 2030 2035 2040 2045 2050
Co
nsu
mp
tio
nLo
ss [b
illi
on
US$
20
05
/yr]
IMACLIM v1.1_AMPERE2-450-LowEI-OPTIMACLIM v1.1_EMF27-450-LowEIMERGE_EMF27_EMF27-450-LowEIREMIND 1.5_AMPERE2-450-LowEI-OPTREMIND 1.5_EMF27-450-LowEIWITCH_AMPERE_AMPERE2-450-LowEI-OPT
0
2000
4000
6000
8000
10000
12000
14000
16000
2005 2010 2015 2020 2025 2030 2035 2040 2045 2050C
on
sum
pti
on
Loss
[bil
lio
n U
S$2
00
5/y
r]IMACLIM v1.1_AMPERE2-450-FullTech-OPT
IMACLIM v1.1_EMF27-450-FullTech
REMIND 1.5_AMPERE2-450-FullTech-OPT
REMIND 1.5_EMF27-450-FullTech
WITCH_AMPERE_AMPERE2-450-FullTech-OPT
0
2000
4000
6000
8000
10000
12000
14000
16000
18000
20000
20052010202020302040205020602070208020902100
Ener
gy i
nve
stm
ents
[b
illi
on
USD
(20
05
)/a
]
GEA_geaha_450_atr_full
GEA_geaha_450_atr_limbe
GEA_geaha_450_atr_limir
GEA_geaha_450_atr_nbecs
GEA_geaha_450_atr_nonuc
GEA_geaha_450_atr_nsink
GEA_geaha_450_btr_full
GEA_geaha_450_btr_nonuc

Ann
ex
53
Figure 20: Energy investments in the GEA medium energy demand scenarios
Figure 21: Energy investments in the GEA low energy demand scenarios
0
2000
4000
6000
8000
10000
12000
14000
16000
18000
20000
20052010202020302040205020602070208020902100
Ener
gy i
nve
stm
ents
[b
illi
on
USD
(20
05
)/a
]
GEA_geama_450_atr_fullGEA_geama_450_atr_limbeGEA_geama_450_atr_limirGEA_geama_450_atr_nbecsGEA_geama_450_atr_noccsGEA_geama_450_atr_nonucGEA_geama_450_atr_nsinkGEA_geama_450_btr_fullGEA_geama_450_btr_limbeGEA_geama_450_btr_limirGEA_geama_450_btr_nbecsGEA_geama_450_btr_nonucGEA_geama_450_btr_nsink
0
2000
4000
6000
8000
10000
12000
14000
16000
18000
20000
20052010202020302040205020602070208020902100
Ener
gy i
nve
stm
ents
[b
illi
on
USD
(20
05
)/a
]
GEA_geala_450_atr_fullGEA_geala_450_atr_limbeGEA_geala_450_atr_limbe_limirGEA_geala_450_atr_limirGEA_geala_450_atr_nbecsGEA_geala_450_atr_nbecs_nsink_limbeGEA_geala_450_atr_noccsGEA_geala_450_atr_noccs_nonucGEA_geala_450_atr_nonucGEA_geala_450_atr_nsinkGEA_geala_450_btr_fullGEA_geala_450_btr_limbeGEA_geala_450_btr_limbe_limir

54 How Energy Efficiency Cuts Costs for a 2-Degree Future
A.2 Supplementary material to Section 3
Figure 22: Historical development of industrial energy intensity per value added from 1990-2013
(own calculation based on Enerdata).
Figure 23: Historical development of energy intensity of transport per GDP from 1990-2013 (own
calculation based on Enerdata).
Figure 24: Historical development of electricity consumption of households per private consumption
from 1990-2013 (own calculation based on Enerdata).
0.000
0.050
0.100
0.150
0.200
0.250
0.300
0.350
0.400
1990 2000 2005 2009 2013
ko
e/$
05p
Energy intensity of industry (at ppp)
World
EU
USA
Brazil
Mexico
China
India
0.000
0.010
0.020
0.030
0.040
0.050
0.060
0.070
1990 2000 2005 2009 2013
ko
e/$
05p
Energy intensity of transport (at ppp)
World
EU
USA
Brazil
Mexico
China
India
0.000
1000.000
2000.000
3000.000
4000.000
5000.000
1990 2000 2005 2009 2013
kW
h/c
ap
Electricity consumption of households
World
EU
USA
Brazil
Mexico
China
India

Ann
ex
55
Table 7: Overview of main energy efficiency policies in BRAZIL by sector
Sector 1990 – 2002:
Historic policies
2002 – 2014:
Current policies
2014 – 2030:
Upcoming policies
Cross-cutting Labels: Procel Reluz: Efficient
Public Lighting and Traffic
Signals/Public Lighting
Capacity building: PROCEL
Education; PROCEL GEM:
Municipal Energy Manage-
ment
Regulation: Energy Efficiency
Program for Distribution Utili-
ties – PEE
Other instruments:
Management Committee of
Energy Efficiency Indicators –
CGIEE
Pre-payment for end-users:
ANEEL Normative Resolution
610/2014 - Pre-payment to
low voltage costumers
Electricity Tariffs:
White tariff to low voltage
costumers (DSM)
Soft Loans for EE:
PROESCO – Credit line for
ESCOs (BNDES – National
Development Bank)
Continuation of most histori-
cal policies
Electricity Tariffs:
Despatch nº
1.365/2015 – Flag tariff
for electricity costumers
(under discussion 2015)
(DSM)
Continuation of histori-
cal and current policies
Industry Capacity building:
PROCEL Commerce and In-
dustry
Standards:
Minimum Energy Perfor-
mance Standards for indus-
trial Electric motors
Introduction of 3 projects
under the Clean Develop-
ment Mechanism
Continuation of PROCEL
Commerce & Industry
Continuation of histori-
cal and current policies
Transport Regulation:
National Programme for Ener-
gy Efficient Use of Petroleum
and Natural Gas Derivatives –
CONPET
Standards for cars:
Air Polution Program by Vehi-
cles - PROCONVE
Voluntary Label: PBE-
V/PROCONVE Seal for Cars
Regulation:
National Plan for Urban
Mobility – PNMU
National Plan for Logistic and
Transport – PNLT
Continuation of most histori-
cal policies
Regulation: Activities
resulting from:
National Plan for Urban
Mobility – PNMU
National Plan for Lo-
gistic and Transport –
PNLT
Continuation of current
policies
Buildings Various Measures: PROCEL
Edifica: buildings; PROCEL
EPP: Public Buildings
Continuation of historical
policies
Continuation of histori-
cal and current policies
Appliances Labels/MEPS:
PROCEL Seal
ENCE – National Energy Con-
servation Label
CONPET Seal for
gas/petroleum using applianc-
es
Capacity Building:
Procel Sanear: Environmental
Sanitation
Regulation:
Normative instruction
nº2/2014 – Federal Public
buildings
Continuation of historical
policies
Continuation of histori-
cal and current policies
Power produc-
tion
N/A N/A N/A

56 How Energy Efficiency Cuts Costs for a 2-Degree Future
Table 8: Overview of main energy efficiency policies in China by sector
Sector 1990 – 2002:
Historic policies
2002 – 2014:
Current policies
2014 – 2030:
Upcoming policies
Cross-cutting 7. to 9. Five-Year Plan (FYP)
Binding energy targets (11th
and 12th FYP),
11th FYP sets target of reducing
energy intensity by 20% by
2010.
Ten Key Projects Program (11th
and 12th FYP)
The “Ten Key Projects” target-
ed technological improvements
in ten areas
13. to 15. “five year
plan”
45% reduction in
CO2 intensity by 2020
compared with 2005.
Industry N/A Top 1,000 companies (11th FYP)
The program targeted the
largest 1,000 energy consum-
ing industrial enterprises in the
country.
Small plant closures
Shut down inefficient plants
Top 10,000 companies (12th
FYP)
Is modeled after the “Top
1.000 companies” program but
adds an order of magnitude of
companies to the mix.
N/A
Transport N/A Energy saving and new energy automotive industry de-
velopment plan (2012-2020)
Subsidies for hybrid and electric vehicles and consolida-
tion of vehicle charging standards
Promotion of fuel efficient cars
Buildings Buildings Energy Efficiency
for civil buildings and public
institutions
Continuation of historical
policies
Appliances Appliance Standards; Energy
Efficient Lighting
Continuation of historical
policies
Power produc-
tion
Direct Level CHP
Waste Heat and Pressure
Utilization
Oil Conservation Law
Continuation of current
policies

Ann
ex
57
Table 9: Overview of main energy efficiency policies in the EU by sector
Sector 1990 – 2008: Historic policies
2008 – 2014: Current policies
2014 – 2030: Upcoming policies
Cross-cutting Community framework for
the taxation of energy prod-
ucts and electricity
(Directive 2003/96/EC)
Energy End-use Efficiency
and Energy Services (ESD)
(2006/32/EC)
Energy Efficiency Directive
(EED) (2012/27/EU)
Revision of EED (Upcom-
ing)
National level:
Article 7 notifications
3rd NEEAP
Industry EU Emission Trading Scheme
Phase I+II (Directive
2003/87/EC)
EU Emission Trading Scheme
Phase III
(Directive 2009/29/EC)
EU ETS Phase IV
Transport Passenger Car Labelling on
Fuel Economy Rating (Di-
rective 1999/94/EC)
Directive on the installation
and use of speed limitation
devices for certain categories
of motor vehicles
(Directive 2002/85/EC)
Reduction in CO2emissions of
new passenger cars
(Regulation 443/2009/EC)
Promotion of clean and energy-
efficient road transport vehicles
(Directive 2009/33/EC)
Energy labelling of tyres (Regu-
lation 1222/2009/EC)
Continuation of histori-
cal and current policies
Buildings Performance of Heat Gener-
ators for Space Heating/Hot
Water (92/42/EEC)
Energy Performance of Build-
ings Directive (EPBD)
(2002/91/EC)
EPBD Recast (2010/31/EU)
Continuation of histori-
cal and current policies
Appliances Energy Consumption Label-
ling of Household Appliances
(92/75/EC)
Energy Labelling Office Equip-
ment (Energy Star)
(Directive 2012/27/EU)
Revised Directive for Labelling
of Energy-related Products
(Directive 2010/30/EU)
Energy-using Products Directive
(Directive 2005/32/EG)
Ecodesign Directive for Energy-
related Products (Directive
2009/125/EG)
Revision of Labelling
Directive (Upcoming)
Continuation of histori-
cal and current policies
Power pro-
duction
EU Emission Trading Scheme
Phase I+II
Combined Heat Power Di-
rective (CHP) (Directive
2004/8/EC)
EU Emission Trading Scheme
Phase III
EU ETS Phase IV
Continuation of current
policies

58 How Energy Efficiency Cuts Costs for a 2-Degree Future
Table 10: Overview of main energy efficiency policies in INDIA by sector
Sector 1990 – 2002:
Historic policies
2002 – 2014:
Current policies
2014 – 2030:
Upcoming policies
Cross-cutting N/A Energy Conservation Act, also
establishing BEE
Numerous DSM programs
(municipal, agriculture, etc)
Awareness raising campaigns
Continuation of policies
Industry N/A Market based Mechanism:
PAT Scheme
Legislation:
Mandatory energy audits
Continuation of current
policies
Transport
Norms:
Auto fuel policy
Standards:
Corporate and light vehicle
efficiency standards
Continuation of current
policies
Buildings N/A Building Code:
Energy Conservation Building
Code & Energy Efficiency in
Existing Building program
Star rating of buildings
Continuation of current
policies
Appliances N/A Standards & Labels:
Bachat Lamp Yojana (BLY)
Lighting Programme
Super Efficient Equipment
Program
Various further BEE Standards
& Labels
Continuation of current
policies
Power pro-
duction
Legislation:
Electricity Act
Economic Instrument: “Coal
Tax” diverting finance
through the National Clean
Energy fund
Legislation:
Shift to modern technology
(supercritical and beyond)
Continuation of current
policies
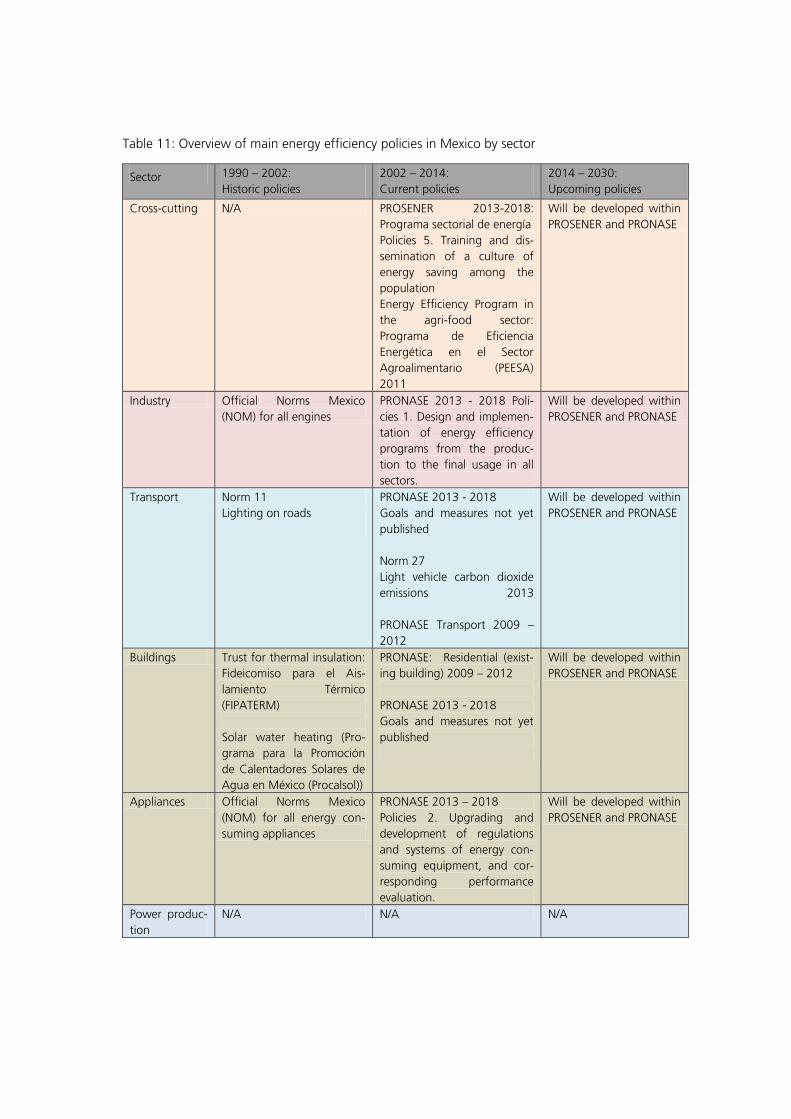
Ann
ex
59
Table 11: Overview of main energy efficiency policies in Mexico by sector
Sector 1990 – 2002:
Historic policies
2002 – 2014:
Current policies
2014 – 2030:
Upcoming policies
Cross-cutting N/A PROSENER 2013-2018:
Programa sectorial de energía
Policies 5. Training and dis-
semination of a culture of
energy saving among the
population
Energy Efficiency Program in
the agri-food sector:
Programa de Eficiencia
Energética en el Sector
Agroalimentario (PEESA)
2011
Will be developed within
PROSENER and PRONASE
Industry Official Norms Mexico
(NOM) for all engines
PRONASE 2013 - 2018 Poli-
cies 1. Design and implemen-
tation of energy efficiency
programs from the produc-
tion to the final usage in all
sectors.
Will be developed within
PROSENER and PRONASE
Transport Norm 11
Lighting on roads
PRONASE 2013 - 2018
Goals and measures not yet
published
Norm 27
Light vehicle carbon dioxide
emissions 2013
PRONASE Transport 2009 –
2012
Will be developed within
PROSENER and PRONASE
Buildings Trust for thermal insulation:
Fideicomiso para el Ais-
lamiento Térmico
(FIPATERM)
Solar water heating (Pro-
grama para la Promoción
de Calentadores Solares de
Agua en México (Procalsol))
PRONASE: Residential (exist-
ing building) 2009 – 2012
PRONASE 2013 - 2018
Goals and measures not yet
published
Will be developed within
PROSENER and PRONASE
Appliances Official Norms Mexico
(NOM) for all energy con-
suming appliances
PRONASE 2013 – 2018
Policies 2. Upgrading and
development of regulations
and systems of energy con-
suming equipment, and cor-
responding performance
evaluation.
Will be developed within
PROSENER and PRONASE
Power produc-
tion
N/A N/A N/A

60 How Energy Efficiency Cuts Costs for a 2-Degree Future
Table 12: Overview of main energy efficiency policies in the US by sector
Sector 1990 – 2006:
Historic policies
2006 – 2014:
Current policies
2014 – 2030:
Upcoming policies
Cross-
cutting
Utility-sector driven vol-
untary agreements (Utility
Sector EE Programs; En-
ergy Saving Perf. Contr.)
Utility-sector driven volun-
tary agreements (Utility
Sector EE Programs; Ener-
gy Saving Perf. Contr.)
Mandatory federal
carbon emissions
targets with EE part of
compliance (Clean
Power Plan)
Industry Voluntary frontrunners
(Climate VISION)
R&D funding (lost foam +
recycling tech.)
Voluntary frontrunners
(Save Energy Now, Better
Buildings, Better Plants)
Performance labels
(ENERGY STAR Industry)
Utility-sector driven EE
programs (industry
credited under Clean
Power Plan)
Continued R&D fund-
ing
Transport Fuel economy standards
(CAFE: Corporate Avg.
Fuel Economy 1975)
R&D funding (i.e. hybrid/
e-vehicles)
Fuel economy standards
(tightening of CAFE by
EISA 2007)
Tax incentives for hybrid
/e-vehicles (EPAct of ‘05)
Fuel economy stand-
ards (passenger vehi-
cles and medi-
um/heavy trucks)
Buildings State Building Energy
Codes (MEC 83/86;
Standard 90.1-1989)
Labels (ENERGY STAR
Residential + Commercial)
R&D funding (electr.
ballasts + low-emiss.
glass)
State Building Energy
Codes (IECC 2009; Stand-
ard 90.1-06/10/12)
Continued improve-
ments in state Building
Energy Codes (credit-
ed under Clean Power
Plan)
Appliances MEP-Standards (NAECA
1987/88; EPAct of 1992)
R&D funding (i.e. efficient
refrigerators)
Labels (ENERGY STAR
Certified Products)
MEP-Standards (EISA ’07,
regular DOE updates)
R&D funding (i.e. LED
lighting)
Tax incentives for best
avail. tech. (EPAct of ‘05)
MEP-Standards (regu-
lar DOE updates)
Power
production
Pollution standards (Clean
Air Act 1990)
Pollution standards (NOx
and Mercury)
Non-financial incentives
for CHP (CHP partnership)
Emission standards
(New Sources Perfor-
mance Standards;
Clean Power Plan)
Non-financial incen-
tives CHP (exec. order
13624)
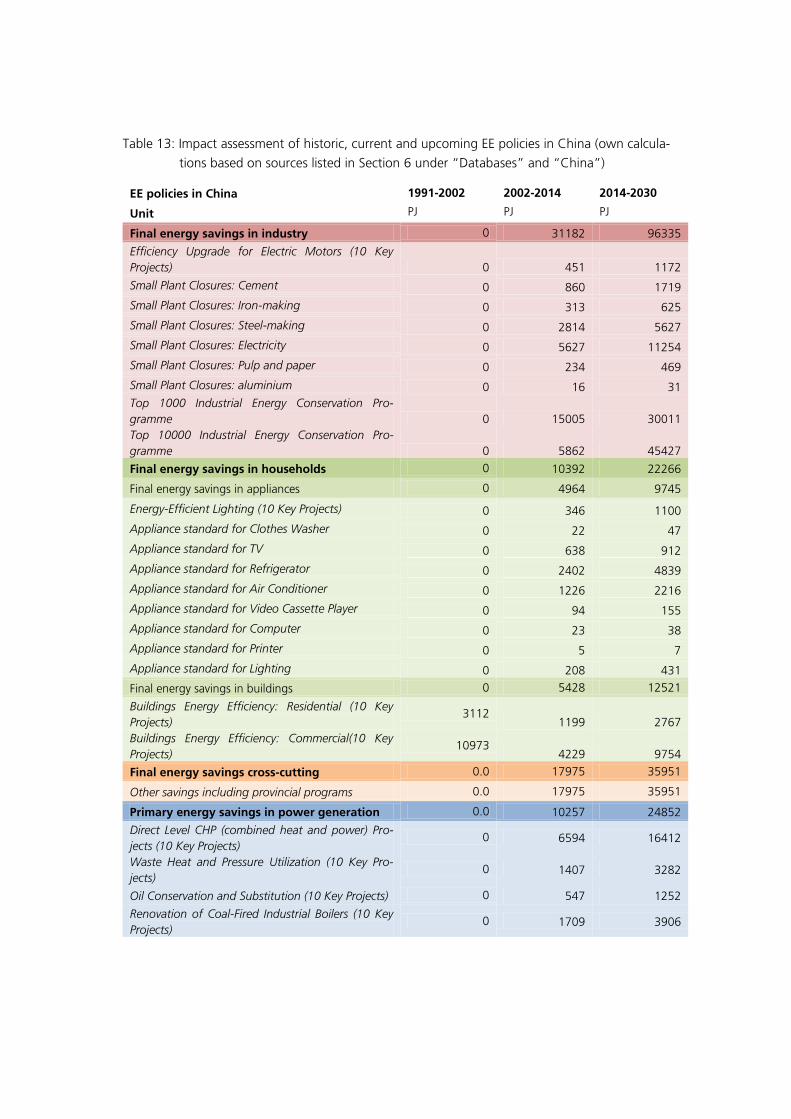
Ann
ex
61
Table 13: Impact assessment of historic, current and upcoming EE policies in China (own calcula-
tions based on sources listed in Section 6 under “Databases” and “China”)
EE policies in China 1991-2002 2002-2014 2014-2030
Unit PJ PJ PJ
Final energy savings in industry 0 31182 96335
Efficiency Upgrade for Electric Motors (10 Key
Projects) 0 451 1172
Small Plant Closures: Cement 0 860 1719
Small Plant Closures: Iron-making 0 313 625
Small Plant Closures: Steel-making 0 2814 5627
Small Plant Closures: Electricity 0 5627 11254
Small Plant Closures: Pulp and paper 0 234 469
Small Plant Closures: aluminium 0 16 31
Top 1000 Industrial Energy Conservation Pro-
gramme 0 15005 30011
Top 10000 Industrial Energy Conservation Pro-
gramme 0 5862 45427
Final energy savings in households 0 10392 22266
Final energy savings in appliances 0 4964 9745
Energy-Efficient Lighting (10 Key Projects) 0 346 1100
Appliance standard for Clothes Washer 0 22 47
Appliance standard for TV 0 638 912
Appliance standard for Refrigerator 0 2402 4839
Appliance standard for Air Conditioner 0 1226 2216
Appliance standard for Video Cassette Player 0 94 155
Appliance standard for Computer 0 23 38
Appliance standard for Printer 0 5 7
Appliance standard for Lighting 0 208 431
Final energy savings in buildings 0 5428 12521
Buildings Energy Efficiency: Residential (10 Key
Projects) 3112
1199 2767
Buildings Energy Efficiency: Commercial(10 Key
Projects) 10973
4229 9754
Final energy savings cross-cutting 0.0 17975 35951
Other savings including provincial programs 0.0 17975 35951
Primary energy savings in power generation 0.0 10257 24852
Direct Level CHP (combined heat and power) Pro-
jects (10 Key Projects) 0 6594 16412
Waste Heat and Pressure Utilization (10 Key Pro-
jects) 0 1407 3282
Oil Conservation and Substitution (10 Key Projects) 0 547 1252
Renovation of Coal-Fired Industrial Boilers (10 Key
Projects) 0 1709 3906

62 How Energy Efficiency Cuts Costs for a 2-Degree Future
Table 14: Impact assessment of historic, current and upcoming EE policies in the EU (own calcula-
tions based on sources listed in Section 6 under “Databases” and “EU”)
EE policies in the EU 1991-2002 2002-2014 2015-2030
Unit PJ PJ PJ
Final energy savings in industry 951 5497 15567
Community framework for the taxation of energy prod-
ucts and electricity (Directive 2003/96/EC) - Ecological tax
reform
52 77 102
EU Emission Trading Scheme (2003/87/EC) 0 23 222
Community framework for the taxation of energy prod-
ucts and electricity (Directive 2003/96/EC) - Climate
Change Levy
3 99 256
Sum over all national measures 896 5298 14997
Final energy savings in transport sector 1293 7365 28339
Emission performance standards new passenger cars
(Regulation 443/2009/EC) 0 415 3182
Community framework for the taxation of energy prod-
ucts and electricity (Directive 2003/96/EC) - Ecological Tax
Reform (Energy and Electricity Tax)
0 333 1176
CO2 Standards for Light Duty Vehicles - Voluntary
Agreement 0 220 1329
Sum over all national measures 1293 6397 22652
Final energy savings in households 136 6949 25095
Final energy savings in appliances 14 3560 8839
Energy Labelling of Household Appliances (Directive
92/75/EC) 14 110 658
Ecodesign Directive for Energy-using Products (Directive
2005/32/EC) 0 47 292
Revised Directive for Labelling of Energy-related Products
(Directive 2010/30/EU) 0 2 93
Recast Ecodesign Directive for Energy-related Products
(Directive 2009/125/EC) - Energy Efficient Lighting 0 10 69
Sum over all national measures 0 3390 7726
Final energy savings in buildings 45 2601 13770
Energy Performance of Buildings (Directive 2002/91/EC) 0 629 3343
EU-related: Performance of Heat Generators for Space
Heating/Hot Water (Directive 92/42/EEC) 0 1 8
EU-related: Energy Performance of Buildings EPBD Recast
(Directive 2010/31/EU) 0 36 3004
Sum over all national measures 45 1935 8416
Final energy savings residual 77 788 2485
Sum over all national measures 77 788 2485

Ann
ex
63
EE policies in the EU (continued) 1991-2002 2002-2014 2015-2030
Unit PJ PJ PJ
Final energy savings in services sector 73 8191 40900
Final energy savings in appliances + lighting 3 1949 9769
Ecodesign Directive for Energy-using Products (Directive
2005/32/EC) 0 63 554
Community framework for the taxation of energy prod-
ucts and electricity (Directive 2003/96/EC) - Climate
Change Levy
3 99 256
Sum over all national measures 0 1787 8959
Final energy savings in buildings 12 3298 20362
EU-related: Energy Performance of Buildings (Directive
2002/91/EC) 11 728 2868
EU-related: Energy Performance of Buildings EPBD Recast
(Directive 2010/31/EU) 0 36 1131
EU-related: Energy Performance of Buildings - Action Plan
2005-2007 0 281 563
Sum over all national measures 1 2253 15800
Final energy savings residual 58 2943 10768
Sum over all national measures 58 2943 10768
Final energy savings cross-cutting 93 1373 10775
Final energy savings in appliances + lighting 0 10 243
Ecodesign Directive for Energy-using Products (Directive
2005/32/EC) 0 10 202
Sum over all national measures 0 0 42
Final energy savings in buildings 0 296 2011
Energy End-use Efficiency and Energy Services ESD (Di-
rective 2006/32/EC) - Mandatory energy efficiency control
for boilers and air-conditioning systems
0 1 3
Energy Efficiency Directive (EED) - Directive 2012/27/EU -
Strategy for mobilising investment in the renovation of
the national stock of residential and commercial build-
ings, both public and private
0 2 152
Sum over all national measures 0 293 1856
Final energy savings residual 93 1067 8521
Energy Efficiency Directive (EED) - Directive 2012/27/EU -
Energy Efficiency Obligation Scheme 0 0 428
Energy Efficiency Directive (EED) - Directive 2012/27/EU -
Development of energy services/ESCO market 0 0 153
Sum over all national measures 93 1067 7940
Primary energy savings in power generation 5 1078 2069
Combined Heat Power (Cogeneration) (Directive
2004/8/EC) 0 106 545
EU Emission Trading Scheme (2003/87/EC) 0 840 1152
Sum over all national measures 5 132 363

64 How Energy Efficiency Cuts Costs for a 2-Degree Future
Table 15: Impact assessment of historic, current and upcoming EE policies in the US (own calcula-
tions based on sources listed in Section 6 under “Databases” and “US”)
EE policies in the US 1991-2002 2002-2014 2015-2030
Unit PJ PJ PJ
Final energy savings in industry 276 2785 10935
ENERGY STAR Industry 0 1780 4772
Utility Sector Energy Efficiency Programs 276 529 1981
Climate Voluntary Sector Initiatives (LEADER, "Better Buildings,
Better Plants") 0 475 2195
Clean Power Plan: CHP incentives 0 0 1987
Final energy savings in transport sector 11620 26903 111709
CAFE standards (EPCA 1975 & EISA 2007) 11619 26695 110670
Tax incentives (Energy Policy Act of 2005) 0 207 1034
Utility Sector Energy Efficiency Programs 1 1 5
Augural CAFE standards 0 0 4613
Final energy savings in households 916 2625 7351
Final energy savings in buildings 177 1208 2046
ENERGY STAR residential 39 178 373
Building Energy Codes (MEC 83-95, IECC 1998-2015) 105 105 1674
Final energy savings residual 739 1417 5304
Utility Sector Energy Efficiency Programs 739 1417 5304
Final energy savings in services sector 2511 8970 19356
Final energy savings in buildings 1832 7667 14480
ENERGY STAR commercial 1607 5874 11540
Building Energy Codes Standard 90 184 184 2940
Final energy savings residual 680 1303 4877
Utility Sector Energy Efficiency Programs 680 1303 4877
Final energy savings cross-cutting 7629 32218 132553
Final energy savings in appliances 4551 25674 77448
Appliance standards (National Appliance Energy Conservation
Act + regular updates) 4084 18213 54669
Tax incentives (Energy Policy Act of 2005) 0 827 4136
ENERGY STAR certified products 468 6633 18644
Final energy savings in buildings 0 377 10518
Tax incentives (Energy Policy Act of 2005) 0 377 2317
Clean Power Plan: New Building Energy Codes 0 0 8202
Final energy savings residual 3078 6168 44587
Energy Saving Performance Contracts 968 968 1290
R&D in low-carbon technologies 2110 5200 24417
Clean Power Plan: Energy saving targets 0 0 18879
Primary energy savings in power generation new policies 10 859 6894
Combined Heat & Power Partnership 10 859 1747
Heat rate improvements (CPP, New Sources Perf. Stds) 0 0 5147
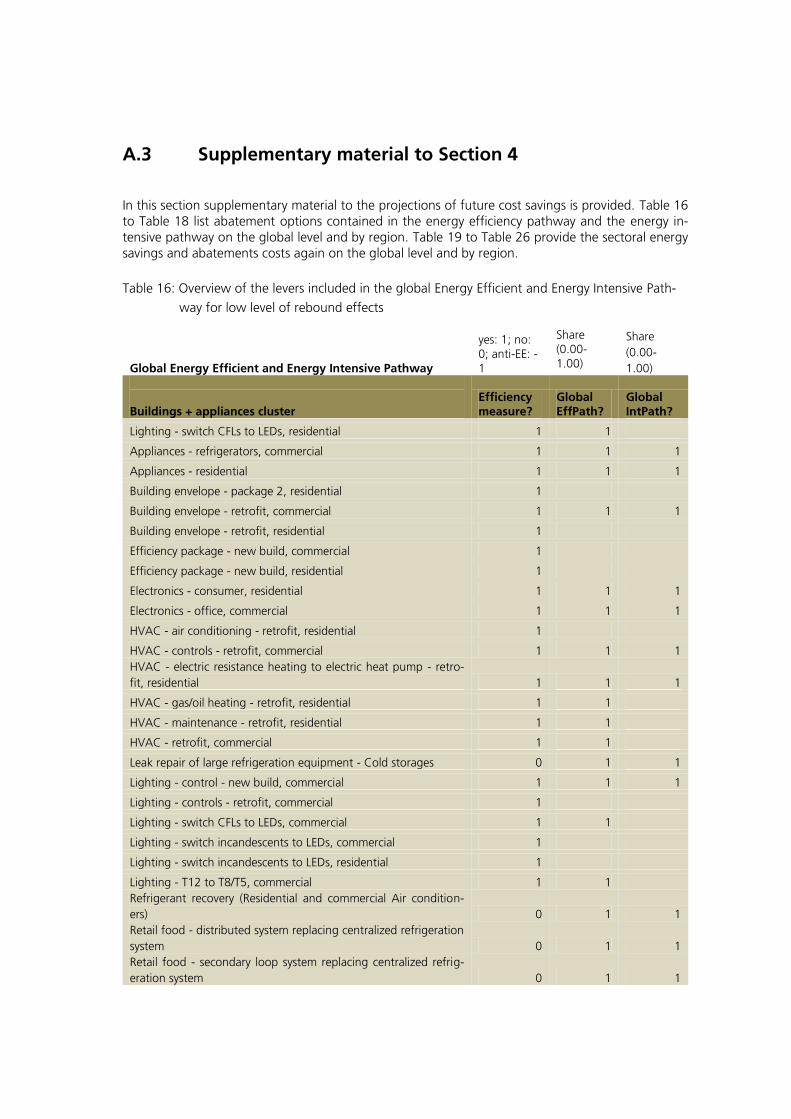
Ann
ex
65
A.3 Supplementary material to Section 4 In this section supplementary material to the projections of future cost savings is provided. Table 16 to Table 18 list abatement options contained in the energy efficiency pathway and the energy in-tensive pathway on the global level and by region. Table 19 to Table 26 provide the sectoral energy savings and abatements costs again on the global level and by region.
Table 16: Overview of the levers included in the global Energy Efficient and Energy Intensive Path-
way for low level of rebound effects
Global Energy Efficient and Energy Intensive Pathway
yes: 1; no: 0; anti-EE: -1
Share (0.00-1.00)
Share
(0.00-
1.00) Buildings + appliances cluster
Efficiency measure?
Global EffPath?
Global IntPath?
Lighting - switch CFLs to LEDs, residential 1 1
Appliances - refrigerators, commercial 1 1 1
Appliances - residential 1 1 1
Building envelope - package 2, residential 1
Building envelope - retrofit, commercial 1 1 1
Building envelope - retrofit, residential 1
Efficiency package - new build, commercial 1
Efficiency package - new build, residential 1
Electronics - consumer, residential 1 1 1
Electronics - office, commercial 1 1 1
HVAC - air conditioning - retrofit, residential 1
HVAC - controls - retrofit, commercial 1 1 1
HVAC - electric resistance heating to electric heat pump - retro-
fit, residential 1 1 1
HVAC - gas/oil heating - retrofit, residential 1 1
HVAC - maintenance - retrofit, residential 1 1
HVAC - retrofit, commercial 1 1
Leak repair of large refrigeration equipment - Cold storages 0 1 1
Lighting - control - new build, commercial 1 1 1
Lighting - controls - retrofit, commercial 1
Lighting - switch CFLs to LEDs, commercial 1 1
Lighting - switch incandescents to LEDs, commercial 1
Lighting - switch incandescents to LEDs, residential 1
Lighting - T12 to T8/T5, commercial 1 1
Refrigerant recovery (Residential and commercial Air condition-
ers) 0 1 1
Retail food - distributed system replacing centralized refrigeration
system 0 1 1
Retail food - secondary loop system replacing centralized refrig-
eration system 0 1 1
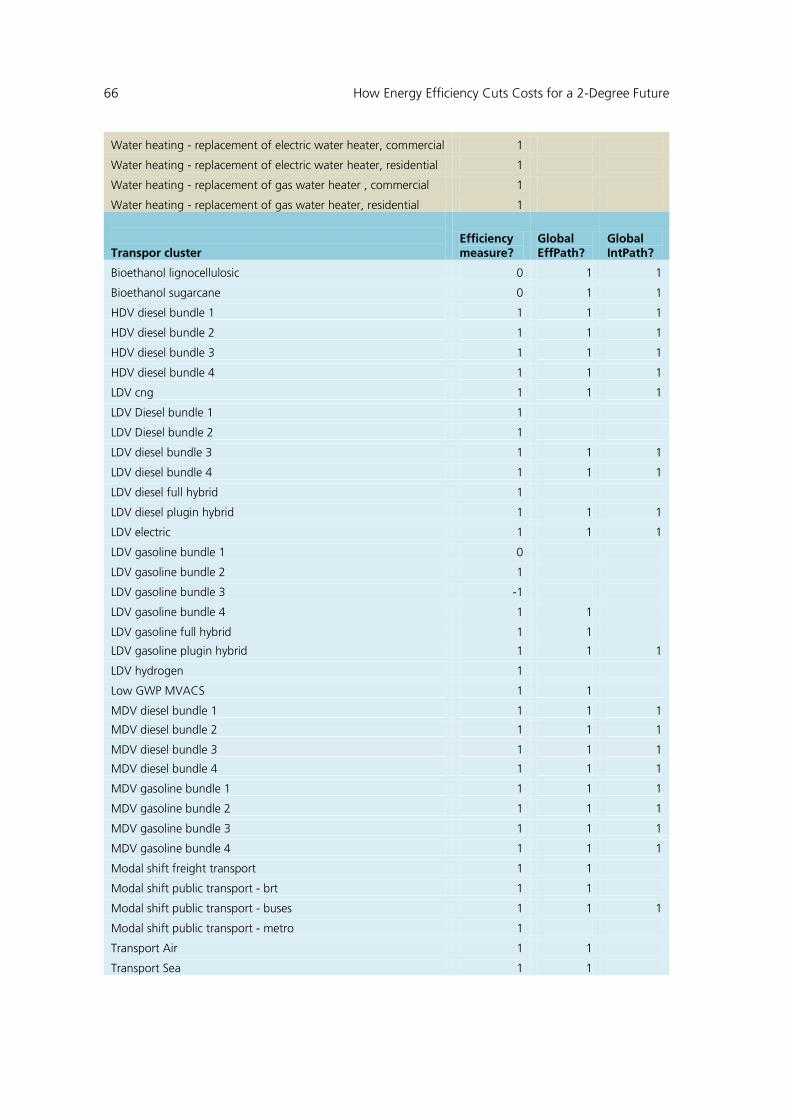
66 How Energy Efficiency Cuts Costs for a 2-Degree Future
Water heating - replacement of electric water heater, commercial 1
Water heating - replacement of electric water heater, residential 1
Water heating - replacement of gas water heater , commercial 1
Water heating - replacement of gas water heater, residential 1
Transpor cluster Efficiency measure?
Global EffPath?
Global IntPath?
Bioethanol lignocellulosic 0 1 1
Bioethanol sugarcane 0 1 1
HDV diesel bundle 1 1 1 1
HDV diesel bundle 2 1 1 1
HDV diesel bundle 3 1 1 1
HDV diesel bundle 4 1 1 1
LDV cng 1 1 1
LDV Diesel bundle 1 1
LDV Diesel bundle 2 1
LDV diesel bundle 3 1 1 1
LDV diesel bundle 4 1 1 1
LDV diesel full hybrid 1
LDV diesel plugin hybrid 1 1 1
LDV electric 1 1 1
LDV gasoline bundle 1 0
LDV gasoline bundle 2 1
LDV gasoline bundle 3 -1
LDV gasoline bundle 4 1 1
LDV gasoline full hybrid 1 1
LDV gasoline plugin hybrid 1 1 1
LDV hydrogen 1
Low GWP MVACS 1 1
MDV diesel bundle 1 1 1 1
MDV diesel bundle 2 1 1 1
MDV diesel bundle 3 1 1 1
MDV diesel bundle 4 1 1 1
MDV gasoline bundle 1 1 1 1
MDV gasoline bundle 2 1 1 1
MDV gasoline bundle 3 1 1 1
MDV gasoline bundle 4 1 1 1
Modal shift freight transport 1 1
Modal shift public transport - brt 1 1
Modal shift public transport - buses 1 1 1
Modal shift public transport - metro 1
Transport Air 1 1
Transport Sea 1 1
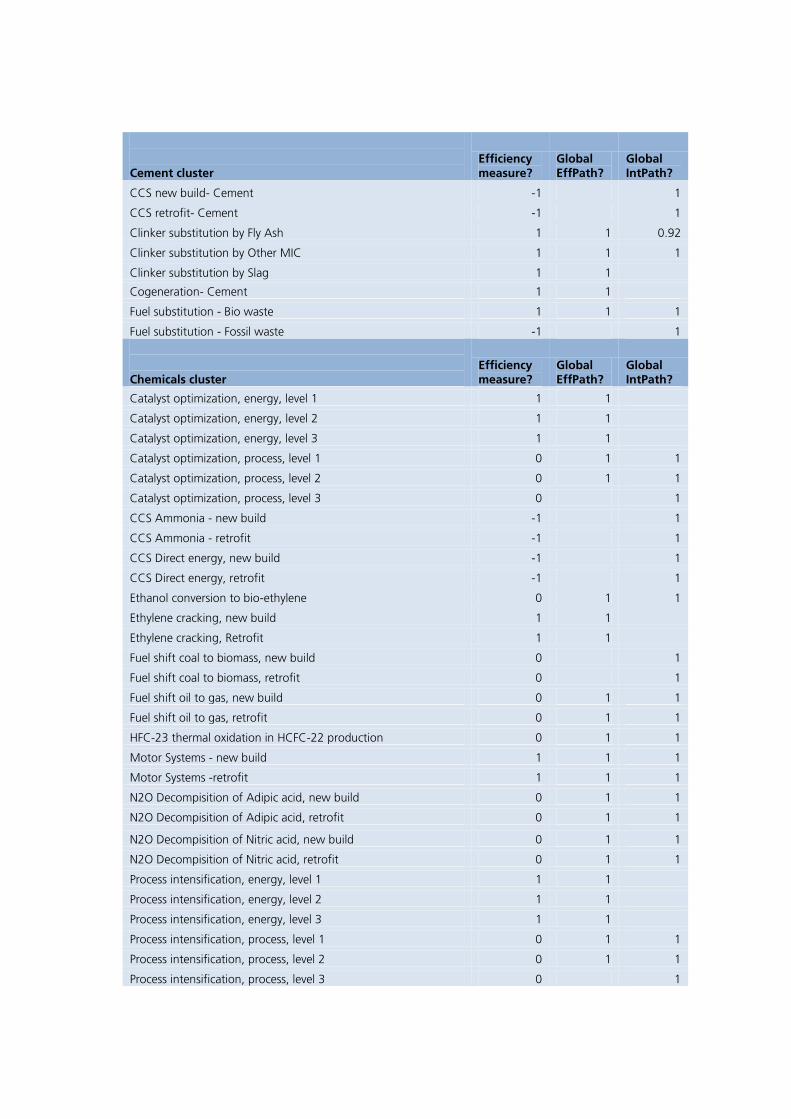
Ann
ex
67
Cement cluster Efficiency measure?
Global EffPath?
Global IntPath?
CCS new build- Cement -1 1
CCS retrofit- Cement -1 1
Clinker substitution by Fly Ash 1 1 0.92
Clinker substitution by Other MIC 1 1 1
Clinker substitution by Slag 1 1
Cogeneration- Cement 1 1
Fuel substitution - Bio waste 1 1 1
Fuel substitution - Fossil waste -1 1
Chemicals cluster Efficiency measure?
Global EffPath?
Global IntPath?
Catalyst optimization, energy, level 1 1 1
Catalyst optimization, energy, level 2 1 1
Catalyst optimization, energy, level 3 1 1
Catalyst optimization, process, level 1 0 1 1
Catalyst optimization, process, level 2 0 1 1
Catalyst optimization, process, level 3 0 1
CCS Ammonia - new build -1 1
CCS Ammonia - retrofit -1 1
CCS Direct energy, new build -1 1
CCS Direct energy, retrofit -1 1
Ethanol conversion to bio-ethylene 0 1 1
Ethylene cracking, new build 1 1
Ethylene cracking, Retrofit 1 1
Fuel shift coal to biomass, new build 0 1
Fuel shift coal to biomass, retrofit 0 1
Fuel shift oil to gas, new build 0 1 1
Fuel shift oil to gas, retrofit 0 1 1
HFC-23 thermal oxidation in HCFC-22 production 0 1 1
Motor Systems - new build 1 1 1
Motor Systems -retrofit 1 1 1
N2O Decompisition of Adipic acid, new build 0 1 1
N2O Decompisition of Adipic acid, retrofit 0 1 1
N2O Decompisition of Nitric acid, new build 0 1 1
N2O Decompisition of Nitric acid, retrofit 0 1 1
Process intensification, energy, level 1 1 1
Process intensification, energy, level 2 1 1
Process intensification, energy, level 3 1 1
Process intensification, process, level 1 0 1 1
Process intensification, process, level 2 0 1 1
Process intensification, process, level 3 0 1

68 How Energy Efficiency Cuts Costs for a 2-Degree Future
Waste Heat recovery, new build- Chemicals 1 1
Waste Heat recovery, retrofit- Chemicals 1 1
Iron & Steel cluster Efficiency measure?
Global EffPath?
Global IntPath?
BF/BOF to EAF-DRI shift, new build 1 1
CCS new build - Iron & Steel -1 1
CCS retrofit- Iron & Steel -1 1
Cogeneration - Iron & Steel 1 1 1
Coke dry quenching 1 1
Coke substitution 0 1 1
Direct casting 1 1 1
Energy efficiency 1 1 1
Energy efficiency 2 1 1
Energy efficiency 3 1 1 1
Energy efficiency 4 1 1 1
Smelt reduction 1
Top gas recycling -1 1
Petroleum & Gas cluster Efficiency measure?
Global EffPath?
Global IntPath?
CCS - downstream -1 1
CCS - upstream 0 1
Cogeneration - downstream 1 1
Demand Reduction 1 1 1
Distribution Maintenance - midstream 1 1
Energy efficiency projects requiring CAPEX at process unit level -
downstream 1 1 1
Energy efficiency projects requiring CAPEX at process unit level -
upstream 1 1 1
Improved maintenance and process control - downstream 1 1 1
Improved planning - midstream 1 1 1
Maintain compressors - midstream 1 1
More energy efficient new builds - upstream 1 1 1
Preventing venting during pipeline maintenance - midstream 1 1
Procedural changes - downstream 1 1 1
Procedural changes and improved maintenance and process
control - upstream 1 1
Reduced flaring - upstream 1 1
Replace seals – midstream 1 1
Other industry Efficiency measure?
Global EffPath?
Global IntPath?
Energy efficiency 1 1
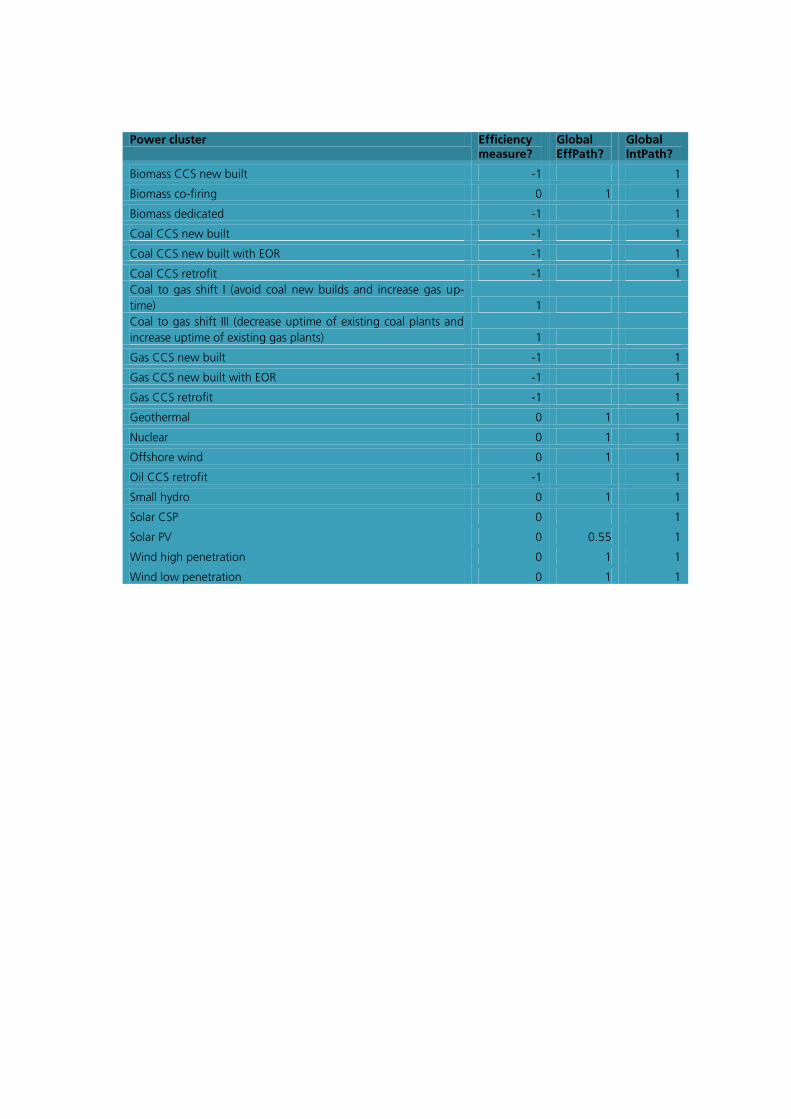
Ann
ex
69
Power cluster Efficiency measure?
Global EffPath?
Global IntPath?
Biomass CCS new built -1 1
Biomass co-firing 0 1 1
Biomass dedicated -1 1
Coal CCS new built -1 1
Coal CCS new built with EOR -1 1
Coal CCS retrofit -1 1
Coal to gas shift I (avoid coal new builds and increase gas up-
time) 1
Coal to gas shift III (decrease uptime of existing coal plants and
increase uptime of existing gas plants) 1
Gas CCS new built -1 1
Gas CCS new built with EOR -1 1
Gas CCS retrofit -1 1
Geothermal 0 1 1
Nuclear 0 1 1
Offshore wind 0 1 1
Oil CCS retrofit -1 1
Small hydro 0 1 1
Solar CSP 0 1
Solar PV 0 0.55 1
Wind high penetration 0 1 1
Wind low penetration 0 1 1

70
H
ow
Energ
y E
fficie
ncy C
uts
Costs
for a
2-D
egre
e F
utu
re
Table 17: Overview of the levers included in the Efficiency and Energy intensive pathways for China, the EU and the US for low level of rebound effects
Efficiency and Energy intensive pathways for China, the EU and the US for low level of rebound effects
yes: 1; no: 0; anti-EE: -1
Share (0.00-1.00)
Share
(0.00-
1.00)
Share
(0.00-
1.00)
Share
(0.00-
1.00)
Share
(0.00-
1.00)
Share
(0.00-
1.00)
Buildings + appliances cluster Efficiency measure?
EffPath in China?
IntPath in China?
EffPath in the EU?
IntPath in the EU?
EffPath in the US?
IntPath in the US?
Lighting - switch CFLs to LEDs, residential 1 1 1 1
Appliances - refrigerators, commercial 1 1 1 1 1
Appliances - residential 1 1 1 1 1
Building envelope - package 2, residential 0
Building envelope - retrofit, commercial 1 1 1 1 0.55
Building envelope - retrofit, residential 1 1 1
Efficiency package - new build, commercial 1 1
Efficiency package - new build, residential 1
Electronics - consumer, residential 1 1 1 1 1 1
Electronics - office, commercial 1 1 1 1 1 1
HVAC - air conditioning - retrofit, residential 1 1
HVAC - controls - retrofit, commercial 1 1 1 1 HVAC - electric resistance heating to electric heat pump - retrofit, residential 1 1 1 1
HVAC - gas/oil heating - retrofit, residential 1 1 1 1
HVAC - maintenance - retrofit, residential 1 1 1 1
HVAC - retrofit, commercial 1 1 1 1
Leak repair of large refrigeration equipment - Cold storages 0 1 1 1 1 1 1
Lighting - control - new build, commercial 1 1 1 1 1 1
Lighting - controls - retrofit, commercial 1 1
Lighting - switch CFLs to LEDs, commercial 1 1 1 1
Lighting - T12 to T8/T5, commercial 1 1 1 1
Refrigerant recovery (Residential and commercial Air conditioners) 0 1 1 1 1 1 1

Ann
ex
71
Retail food - distributed system replacing centralized refrigeration system 0 1 1 1 1 1 Retail food - secondary loop system replacing centralized refrigera-tion system 0 1 1 1 1 1
Water heating - replacement of electric water heater, commercial 1 1
Water heating - replacement of electric water heater, residential 1
Water heating - replacement of gas water heater , commercial 1 1 1
Water heating - replacement of gas water heater, residential 1 1 1
Transpor cluster Efficiency measure?
EffPath in China?
IntPath in China?
EffPath in the EU?
IntPath in the EU?
EffPath in the US?
IntPath in the US?
Bioethanol lignocellulosic 0 1 1 1 1 0.96 1
Bioethanol sugarcane 0 1 1 1 1 1 1
HDV diesel bundle 1 1 1 1 1 1 1 1
HDV diesel bundle 2 1 1 1 1 1 1 1
HDV diesel bundle 3 1 1 1 1 1 1 1
HDV diesel bundle 4 1 1 1 1 1 1 1
LDV cng 1 1 1
LDV diesel bundle 3 1 1 1 1 1
LDV diesel bundle 4 1 1 1 1 1
LDV diesel full hybrid 1 1
LDV diesel plugin hybrid 1 1 1 1 1
LDV electric 1 1 1 1 1 1 1
LDV gasoline bundle 3 -1 1
LDV gasoline bundle 4 1 1 1
LDV gasoline full hybrid 1 1 1 1
LDV gasoline plugin hybrid 1 1 1 1 1 1 1
LDV hydrogen 0
Low GWP MVACS 1 1 1 1
MDV diesel bundle 1 1 1 1 1 1 1 1
MDV diesel bundle 2 1 1 1 1 1 1 1

72
H
ow
Energ
y E
fficie
ncy C
uts
Costs
for a
2-D
egre
e F
utu
re
MDV diesel bundle 3 1 1 1 1 1 1
MDV diesel bundle 4 1 1 1 1 1 1
MDV gasoline bundle 1 1 1 1 1 1 1 1
MDV gasoline bundle 2 1 1 1 1 1 1 1
MDV gasoline bundle 3 1 1 1 1 1 1
MDV gasoline bundle 4 1 1 1 1 1 1
Modal shift freight transport 1 1 1 1
Modal shift public transport - brt 1 1 1
Modal shift public transport - buses 1 1 1 1
Modal shift public transport - metro 1
Cement Cluster Efficiency measure?
EffPath in China?
IntPath in China?
EffPath in the EU?
IntPath in the EU?
EffPath in the US?
IntPath in the US?
CCS new build- Cement -1 1
CCS retrofit- Cement -1
Clinker substitution by Fly Ash 0 1 1 1 1 1
Clinker substitution by Other MIC 0 1 1
Clinker substitution by Slag 0 1 1 1 1
Cogeneration- Cement 1 1 1
Fuel substitution - Bio waste -1 1 1 1 1 1 1
Fuel substitution - Fossil waste -1 1 1 1 1
Chemicals cluster Efficiency measure?
EffPath in China?
IntPath in China?
EffPath in the EU?
IntPath in the EU?
EffPath in the US?
IntPath in the US?
Catalyst optimization, energy, level 1 1 1 1 1 1 1
Catalyst optimization, energy, level 2 1 1 1 1
Catalyst optimization, energy, level 3 1 1 1
Catalyst optimization, process, level 1 0 1 1 1 1 1 1
Catalyst optimization, process, level 2 0 1 1 1 1 1
Catalyst optimization, process, level 3 0 1 1 1 1 1
CCS Ammonia - new build -1 1
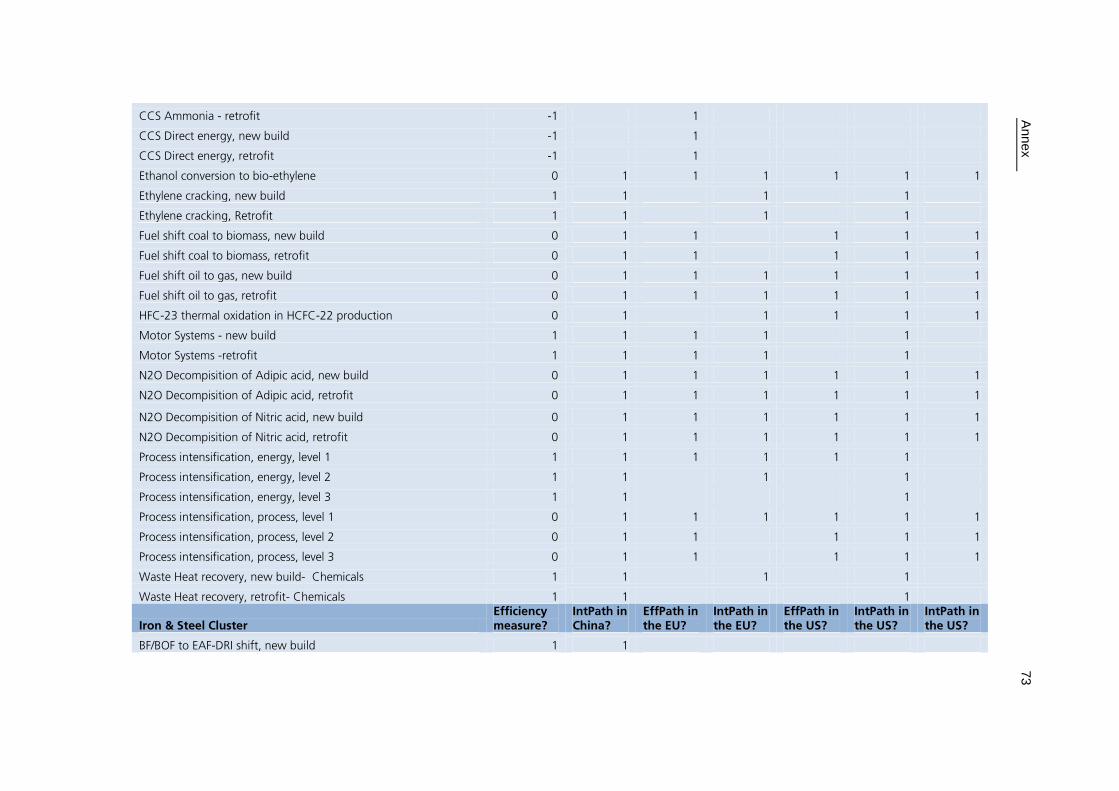
Ann
ex
73
CCS Ammonia - retrofit -1 1
CCS Direct energy, new build -1 1
CCS Direct energy, retrofit -1 1
Ethanol conversion to bio-ethylene 0 1 1 1 1 1 1
Ethylene cracking, new build 1 1 1 1
Ethylene cracking, Retrofit 1 1 1 1
Fuel shift coal to biomass, new build 0 1 1 1 1 1
Fuel shift coal to biomass, retrofit 0 1 1 1 1 1
Fuel shift oil to gas, new build 0 1 1 1 1 1 1
Fuel shift oil to gas, retrofit 0 1 1 1 1 1 1
HFC-23 thermal oxidation in HCFC-22 production 0 1 1 1 1 1
Motor Systems - new build 1 1 1 1 1
Motor Systems -retrofit 1 1 1 1 1
N2O Decompisition of Adipic acid, new build 0 1 1 1 1 1 1
N2O Decompisition of Adipic acid, retrofit 0 1 1 1 1 1 1
N2O Decompisition of Nitric acid, new build 0 1 1 1 1 1 1
N2O Decompisition of Nitric acid, retrofit 0 1 1 1 1 1 1
Process intensification, energy, level 1 1 1 1 1 1 1
Process intensification, energy, level 2 1 1 1 1
Process intensification, energy, level 3 1 1 1
Process intensification, process, level 1 0 1 1 1 1 1 1
Process intensification, process, level 2 0 1 1 1 1 1
Process intensification, process, level 3 0 1 1 1 1 1
Waste Heat recovery, new build- Chemicals 1 1 1 1
Waste Heat recovery, retrofit- Chemicals 1 1 1
Iron & Steel Cluster Efficiency measure?
IntPath in China?
EffPath in the EU?
IntPath in the EU?
EffPath in the US?
IntPath in the US?
IntPath in the US?
BF/BOF to EAF-DRI shift, new build 1 1
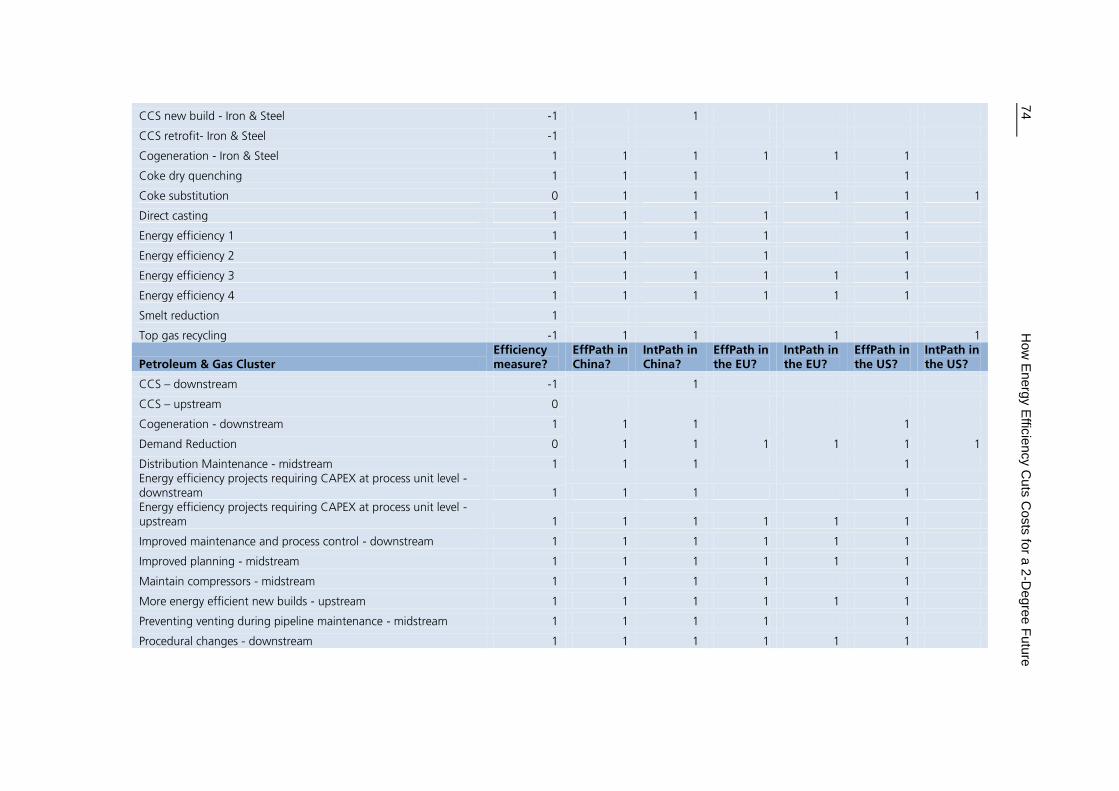
74
H
ow
Energ
y E
fficie
ncy C
uts
Costs
for a
2-D
egre
e F
utu
re
CCS new build - Iron & Steel -1 1
CCS retrofit- Iron & Steel -1
Cogeneration - Iron & Steel 1 1 1 1 1 1
Coke dry quenching 1 1 1 1
Coke substitution 0 1 1 1 1 1
Direct casting 1 1 1 1 1
Energy efficiency 1 1 1 1 1 1
Energy efficiency 2 1 1 1 1
Energy efficiency 3 1 1 1 1 1 1
Energy efficiency 4 1 1 1 1 1 1
Smelt reduction 1
Top gas recycling -1 1 1 1 1
Petroleum & Gas Cluster Efficiency measure?
EffPath in China?
IntPath in China?
EffPath in the EU?
IntPath in the EU?
EffPath in the US?
IntPath in the US?
CCS – downstream -1 1
CCS – upstream 0
Cogeneration - downstream 1 1 1 1
Demand Reduction 0 1 1 1 1 1 1
Distribution Maintenance - midstream 1 1 1 1 Energy efficiency projects requiring CAPEX at process unit level - downstream 1 1 1 1 Energy efficiency projects requiring CAPEX at process unit level - upstream 1 1 1 1 1 1
Improved maintenance and process control - downstream 1 1 1 1 1 1
Improved planning - midstream 1 1 1 1 1 1
Maintain compressors - midstream 1 1 1 1 1
More energy efficient new builds - upstream 1 1 1 1 1 1
Preventing venting during pipeline maintenance - midstream 1 1 1 1 1
Procedural changes - downstream 1 1 1 1 1 1

Ann
ex
75
Procedural changes and improved maintenance and process con-trol – upstream 1 1 1 1 1 1
Reduced flaring - upstream 1 1 1 1 1
Replace seals - midstream 1 1 1 1 1
Other industry Efficiency measure?
EffPath in China?
IntPath in China?
EffPath in the EU?
IntPath in the EU?
EffPath in the US?
IntPath in the US?
Energy efficiency 1 1 1 1 1 1
Power cluster Efficiency measure?
EffPath in China?
IntPath in China?
EffPath in the EU?
IntPath in the EU?
EffPath in the US?
IntPath in the US?
Biomass CCS new built -1 1 1 1 1
Biomass co-firing 0 1 1 1 1 1
Biomass dedicated 0 1 1 0.33 0.83
Coal CCS new built -1 0.61 1 1 1
Coal CCS new built with EOR -1 1 1 1 1
Coal CCS retrofit -1 1
Coal to gas shift (avoid coal new builds and increase gas uptime) 0 1
Gas CCS new built -1 1 1
Gas CCS new built with EOR -1 1 1
Gas CCS retrofit -1 1 1 1
Geothermal 0 1 1 1 1 1 1
Nuclear 0 1 1 0.2 1 1 1
Offshore wind 0 1 1 1
Oil CCS retrofit 0 1
Small hydro 0 1 1 1 1 1
Solar CSP -1 1 1
Solar PV 0 1 1 1 1 1
Wind high penetration 0 1 1 1 1 1
Wind low penetration 0 1 1 1 1 1 1

76
H
ow
Energ
y E
fficie
ncy C
uts
Costs
for a
2-D
egre
e F
utu
re
Table 18: Overview of the levers included in the Efficiency and Energy intensive pathways for Brazil, India and Mexico for low level of rebound effects
Efficiency and Energy intensive pathways for Brazil, India and Mexico for low level of rebound effects
yes: 1; no: 0; anti-EE: -1
Share (0.00-1.00)
Share
(0.00-
1.00)
Share
(0.00-
1.00)
Share
(0.00-
1.00)
Share
(0.00-
1.00)
Share
(0.00-
1.00)
Buildings + appliances cluster Efficiency measure?
EffPath in Brazil?
IntPath in Brazil?
EffPath in India?
IntPath in India?
EffPath in Mexico?
IntPath in Mexico?
Lighting - switch CFLs to LEDs, residential 1 1 1
Appliances - refrigerators, commercial 1 1 1 1 1 1
Appliances – residential 1 1 1 1 1 1
Building envelope - package 2, residential 0
Building envelope - retrofit, commercial 1 1 1 1
Building envelope - retrofit, residential 1
Efficiency package - new build, commercial 1 1
Efficiency package - new build, residential 1
Electronics - consumer, residential 1 1 1 1 1 1
Electronics - office, commercial 1 1 1 1 1 1
HVAC - air conditioning - retrofit, residential 1 1 1 1
HVAC - controls - retrofit, commercial 1 1 1 1 1 HVAC - electric resistance heating to electric heat pump - retrofit, residential 1
HVAC - gas/oil heating - retrofit, residential 1
HVAC - maintenance - retrofit, residential 1
HVAC - retrofit, commercial 1 1 1
Leak repair of large refrigeration equipment - Cold storages 0 1 1 1 1 1
Lighting - control - new build, commercial 1 1 1 1 1 1
Lighting - controls - retrofit, commercial 1 1 1 1 1
Lighting - switch CFLs to LEDs, commercial 1 1 1
Lighting - T12 to T8/T5, commercial 1 1 1
Refrigerant recovery (Residential and commercial Air conditioners) 0 1 1 1 1 1
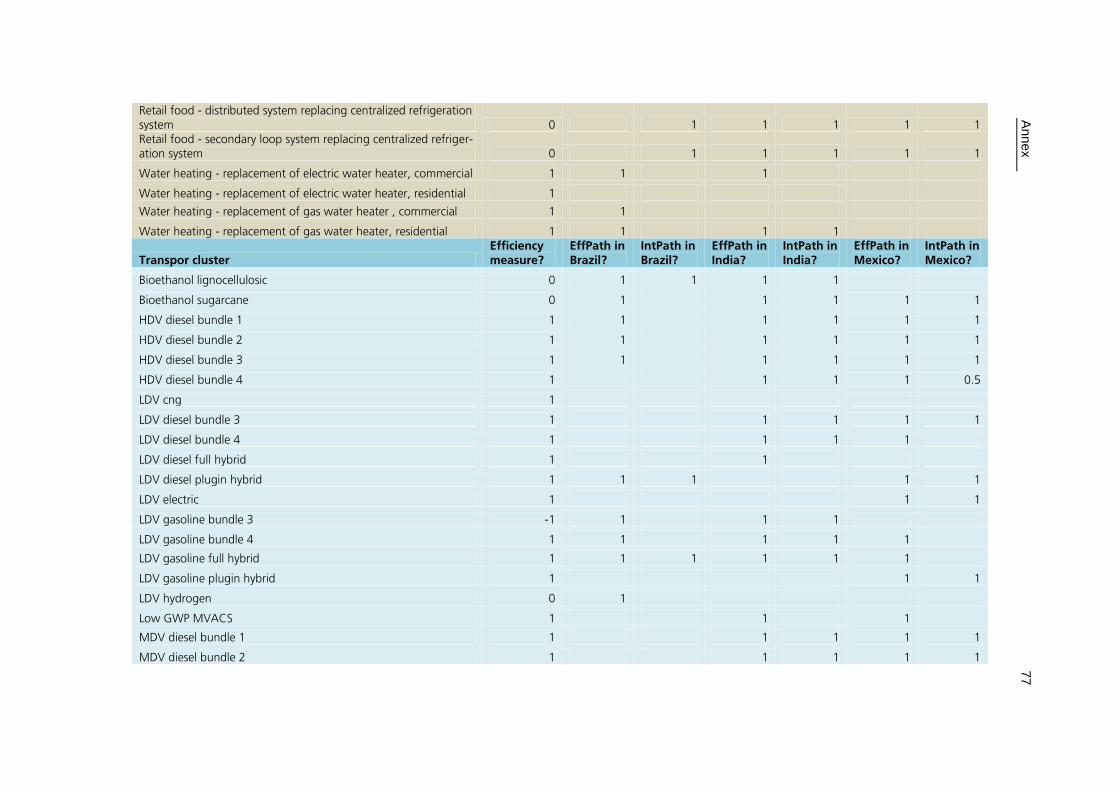
Ann
ex
77
Retail food - distributed system replacing centralized refrigeration system 0 1 1 1 1 1 Retail food - secondary loop system replacing centralized refriger-ation system 0 1 1 1 1 1
Water heating - replacement of electric water heater, commercial 1 1 1
Water heating - replacement of electric water heater, residential 1
Water heating - replacement of gas water heater , commercial 1 1
Water heating - replacement of gas water heater, residential 1 1 1 1
Transpor cluster Efficiency measure?
EffPath in Brazil?
IntPath in Brazil?
EffPath in India?
IntPath in India?
EffPath in Mexico?
IntPath in Mexico?
Bioethanol lignocellulosic 0 1 1 1 1
Bioethanol sugarcane 0 1 1 1 1 1
HDV diesel bundle 1 1 1 1 1 1 1
HDV diesel bundle 2 1 1 1 1 1 1
HDV diesel bundle 3 1 1 1 1 1 1
HDV diesel bundle 4 1 1 1 1 0.5
LDV cng 1
LDV diesel bundle 3 1 1 1 1 1
LDV diesel bundle 4 1 1 1 1
LDV diesel full hybrid 1 1
LDV diesel plugin hybrid 1 1 1 1 1
LDV electric 1 1 1
LDV gasoline bundle 3 -1 1 1 1
LDV gasoline bundle 4 1 1 1 1 1
LDV gasoline full hybrid 1 1 1 1 1 1
LDV gasoline plugin hybrid 1 1 1
LDV hydrogen 0 1
Low GWP MVACS 1 1 1
MDV diesel bundle 1 1 1 1 1 1
MDV diesel bundle 2 1 1 1 1 1

78
H
ow
Energ
y E
fficie
ncy C
uts
Costs
for a
2-D
egre
e F
utu
re
MDV diesel bundle 3 1 1 1 1
MDV diesel bundle 4 1 1 1 1
MDV gasoline bundle 1 1 1 1
MDV gasoline bundle 2 1 1 1
MDV gasoline bundle 3 1 1
MDV gasoline bundle 4 1 1
Modal shift freight transport 1 1 1
Modal shift public transport - brt 1 1 1 0.5
Modal shift public transport - buses 1 1 1 1 1
Modal shift public transport - metro 1
Cement cluster Efficiency measure?
EffPath in Brazil?
IntPath in Brazil?
EffPath in India?
IntPath in India?
EffPath in Mexico?
IntPath in Mexico?
CCS new build- Cement -1 1
CCS retrofit- Cement -1 1
Clinker substitution by Fly Ash 0 1 1 1 1
Clinker substitution by Other MIC 0 1 1 1 1
Clinker substitution by Slag 0 1 1
Cogeneration- Cement 1 1 1 1 1 1 1
Fuel substitution - Bio waste -1 1 1 1 1 1 1
Fuel substitution - Fossil waste -1 1 1
Chemicals Cluster Efficiency measure?
EffPath in Brazil?
IntPath in Brazil?
EffPath in India?
IntPath in India?
EffPath in Mexico?
IntPath in Mexico?
Catalyst optimization, energy, level 1 1 1 1 1 1 1 1
Catalyst optimization, energy, level 2 1 1 1 1 1 1
Catalyst optimization, energy, level 3 1 1 1 1 1 1
Catalyst optimization, process, level 1 0 1 1 1 1 1
Catalyst optimization, process, level 2 0 1 1
Catalyst optimization, process, level 3 0 1 1
CCS Ammonia - new build -1 1

Ann
ex
79
CCS Ammonia - retrofit -1 1
CCS Direct energy, new build -1 1
CCS Direct energy, retrofit -1 1
Ethanol conversion to bio-ethylene 0 1 1 1 1 1 1
Ethylene cracking, new build 1 1 1 1 1 1
Ethylene cracking, Retrofit 1 1 1 1 1 1
Fuel shift coal to biomass, new build 0 1 1
Fuel shift coal to biomass, retrofit 0 1 1
Fuel shift oil to gas, new build 0 1 1 1 1 1 1
Fuel shift oil to gas, retrofit 0 1 1 1 1 1 1
HFC-23 thermal oxidation in HCFC-22 production 0 1 1 1 1 1
Motor Systems - new build 1 1 1 1 1 1 1
Motor Systems -retrofit 1 1 1 1 1 1 1
N2O Decompisition of Adipic acid, new build 0
N2O Decompisition of Adipic acid, retrofit 0
N2O Decompisition of Nitric acid, new build 0 1 1 1 1
N2O Decompisition of Nitric acid, retrofit 0 1 1 1 1
Process intensification, energy, level 1 1 1 1 1 1 1 1
Process intensification, energy, level 2 1 1 1 1 1 1
Process intensification, energy, level 3 1 1 1 1 1 1
Process intensification, process, level 1 0 1 1 1 1 1
Process intensification, process, level 2 0 1 1
Process intensification, process, level 3 0 1 1
Waste Heat recovery, new build- Chemicals 1 1 1 1 1 1
Waste Heat recovery, retrofit- Chemicals 1 1 1 1 1 1
Iron & Steel Cluster Efficiency measure?
EffPath in Brazil?
IntPath in Brazil?
EffPath in India?
IntPath in India?
EffPath in Mexico?
IntPath in Mexico?
BF/BOF to EAF-DRI shift, new build 1 1 1 1 1 1

80
H
ow
Energ
y E
fficie
ncy C
uts
Costs
for a
2-D
egre
e F
utu
re
CCS new build - Iron & Steel -1 1
CCS retrofit- Iron & Steel -1 1
Cogeneration - Iron & Steel 1 1 1 1 1 1 1
Coke dry quenching 1 1 1 1 1 1 1
Coke substitution 0 0.5 1 1
Direct casting 1 1 1 1 1 1 1
Energy efficiency 1 1 1 1 1 1 1
Energy efficiency 2 1 1 1 1 1 1
Energy efficiency 3 1 1 1 1 1 1 1
Energy efficiency 4 1 1 1 1 1 1 1
Smelt reduction 1
Top gas recycling -1 1 1
Petroleum & Gas Cluster Efficiency measure?
EffPath in Brazil?
IntPath in Brazil?
EffPath in India?
IntPath in India?
EffPath in Mexico?
IntPath in Mexico?
CCS - downstream -1 1
Cogeneration - downstream 1 1 0.1 1 1
Demand Reduction 0 1 1 1 1 1 1
Distribution Maintenance - midstream 1 1 1 1 1 1 1 Energy efficiency projects requiring CAPEX at process unit level - downstream 1 1 1 1 1 1 1 Energy efficiency projects requiring CAPEX at process unit level - upstream 1 1 1 1 1 1 1
Improved maintenance and process control - downstream 1 1 1 1 1 1 1
Improved planning - midstream 1 1 1 1 1 1 1
Maintain compressors - midstream 1 1 1 1 1 1 1
More energy efficient new builds - upstream 1 1 1 1 1 1 1
Preventing venting during pipeline maintenance - midstream 1 1 1 1 1 1 1
Procedural changes - downstream 1 1 1 1 1 1 1 Procedural changes and improved maintenance and process control - upstream 1 1 1 1 1 1 1
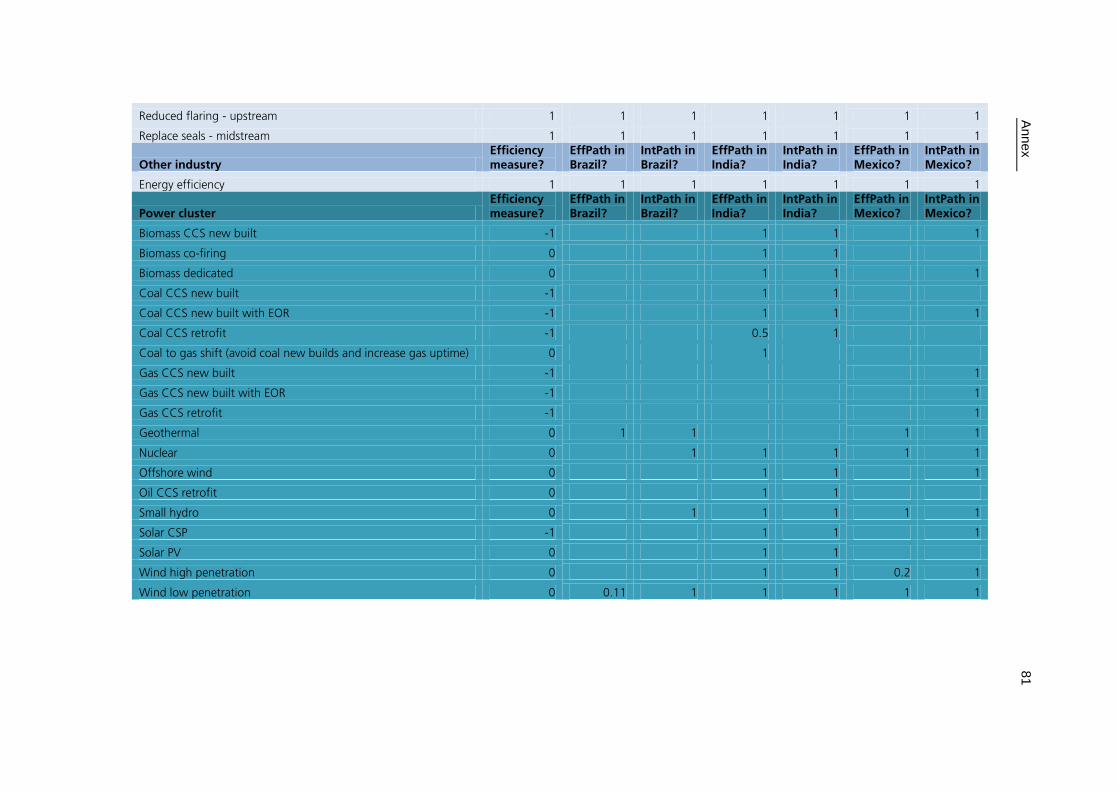
Ann
ex
81
Reduced flaring - upstream 1 1 1 1 1 1 1
Replace seals - midstream 1 1 1 1 1 1 1
Other industry Efficiency measure?
EffPath in Brazil?
IntPath in Brazil?
EffPath in India?
IntPath in India?
EffPath in Mexico?
IntPath in Mexico?
Energy efficiency 1 1 1 1 1 1 1
Power cluster Efficiency measure?
EffPath in Brazil?
IntPath in Brazil?
EffPath in India?
IntPath in India?
EffPath in Mexico?
IntPath in Mexico?
Biomass CCS new built -1 1 1 1
Biomass co-firing 0 1 1
Biomass dedicated 0 1 1 1
Coal CCS new built -1 1 1
Coal CCS new built with EOR -1 1 1 1
Coal CCS retrofit -1 0.5 1
Coal to gas shift (avoid coal new builds and increase gas uptime) 0 1
Gas CCS new built -1 1
Gas CCS new built with EOR -1 1
Gas CCS retrofit -1 1
Geothermal 0 1 1 1 1
Nuclear 0 1 1 1 1 1
Offshore wind 0 1 1 1
Oil CCS retrofit 0 1 1
Small hydro 0 1 1 1 1 1
Solar CSP -1 1 1 1
Solar PV 0 1 1
Wind high penetration 0 1 1 0.2 1
Wind low penetration 0 0.11 1 1 1 1 1

82
H
ow
Energ
y E
fficie
ncy C
uts
Costs
for a
2-D
egre
e F
utu
re
Table 19: Comparison of energy savings, abatements and costs of the global Energy Efficient and the Energy Intensive pathway for 2020 (own calcula-
tions based on McKinsey & Company forthcoming)
Comparison of the global EffPath and IntPath for 2020
EffPath –
Energy
saving
EffPath –
Abatement
EffPath – In-
tensity reduc-
tion
EffPath – Net
annual cost
IntPath –
Energy sav-
ing
IntPath –
Abatement
IntPath - In-
tensity reduc-
tion
IntPath – Net
annual cost
Measure cluster
GWh/y MtCO2e/y GJ/capita or
PJ/bUSD05
mUSD05/y GWh/y MtCO2e/y GJ/capita or
PJ/bUSD05
mUSD05/y
Total 9'809'454 6'591 -148'287 3'837'265 5'299 -38'255
Difference 5'972'188 -110'032
Power cluster 0 2'315 109'238 0 2'741 164'088 EE + nuclear + RE levers 0 2'315 109'238 0 2'719 161'735
CCS levers 0 0 0 0 22 2'352
Buildings cluster 1'267'114 538 21.0 -58'416 1'011'079 450 16.8 -56'944
EE levers 256'035
Non-EE levers 1'267'114 468 21.0 -58'704 1'011'079 380 16.8 -57'232
Transport cluster 0 69 0.0 288 0 69 0.0 288
EE levers 3'266'895 1'174 55.2 -38'327 1'795'856 718 30.8 -34'765
Non-EE levers 2'819'601 900 46.7 -71'052 1'348'562 444 22.4 -67'491
Industry cluster 0 157 0.0 -18'536 0 157 0.0 -18'536
EE levers 5'275'444 2'564 4.68 -160'782 1'030'330 1'390 0.70 -110'633
Non-EE levers 5'275'444 2'171 4.68 -158'410 1'030'330 670 0.91 -122'866

Ann
ex
83
Table 20: Comparison of energy savings, abatements and costs of the global Energy Efficient and the Energy Intensive pathway for 2030 (own calcula-
tions based on McKinsey & Company forthcoming)
Comparison of global EffPath and IntPath for 2030
EffPath –
Energy
saving
EffPath –
Abatement
EffPath – In-
tensity reduc-
tion
EffPath – Net
annual cost
IntPath –
Energy sav-
ing
IntPath –
Abatement
IntPath – In-
tensity reduc-
tion
IntPath – Net
annual cost
Measure cluster
GWh/y MtCO2e/y GJ/capita or
PJ/bUSD05
mUSD05/y GWh/y MtCO2e/y GJ/capita or
PJ/bUSD05
mUSD05/y
Total 21'400'991 15'406 -761'339 8'767'398 15'401 -277'740
Difference 12'633'594 -483'598
Power cluster 0 5'961 174'187 0 8'585 393'753 EE + nuclear + RE levers 0 5'961 174'187 0 6'670 239'888
CCS levers 0 0 0 0 1'915 153'866
Buildings cluster 2'553'822 1'236 1.1 -130'646 2'047'909 1'071 0.9 -125'046
EE levers 2'553'822 933 1.1 -132'131 2'047'909 768 0.9 -126'531
Non-EE levers 0 303 0.0 1'485 0 303 0.0 1'485
Transport cluster 8'159'226 3'107 3.5 -351'176 4'653'666 1'951 2.0 -335'350
EE levers 8'159'226 2'522 3.5 -311'580 4'653'666 1'365 2.0 -295'755
Non-EE levers 0 585 0.0 -39'595 0 585 0.0 -39'595
Industry cluster 10'687'944 5'102 0.31 -453'704 2'065'822 3'795 0.04 -211'098
EE levers 10'687'944 4'430 0.31 -452'005 2'065'822 1'387 0.06 -396'213
Non-EE levers 0 672 0.00 -1'699 0 2'408 -0.02 185'115

84
H
ow
Energ
y E
fficie
ncy C
uts
Costs
for a
2-D
egre
e F
utu
re
Table 21: Comparison of energy savings, abatements and costs of the Efficiency and the Energy intensive pathway for Brazil (own calculations based
on McKinsey)
Comparison of EffPath and IntPath for Brazil
EffPath –
Energy
saving
EffPath -
Abatement
EffPath - In-
tensity reduc-
tion
EffPath - Net
annual cost
IntPath –
Energy sav-
ing
IntPath –
Abatement
IntPath - In-
tensity reduc-
tion
IntPath – Net
annual cost
Measure cluster
GWh/y MtCO2e/y GJ/capita or
PJ/bUSD05
mUSD05/y GWh/y MtCO2e/y GJ/capita or
PJ/bUSD05
mUSD05/y
Total 679'761 239 -46'842 461'299 239 -33'723
Difference 218'463 -13'119
Power cluster 0 3 -136 0 56 -1'408 EE + nuclear + RE levers 0 3 -136 0 56 -1'408
CCS levers 0 0 0 0 0 0
Buildings cluster 45'700 11 0.8 -2'759 0 8 0.0 18
EE levers 45'700 11 0.8 -2'759 0 0 0.0 0
Non-EE levers 0 0 0.0 0 0 8 0.0 18
Transport cluster 259'255 114 4.3 -25'778 86'493 55 1.4 -14'388
EE levers 259'255 92 4.3 -21'558 86'493 33 1.4 -10'168
Non-EE levers 0 22 0.0 -4'220 0 22 0.0 -4'220
Industry cluster 374'806 111 0.33 -18'169 374'806 120 0.33 -17'944
EE levers 374'806 106 0.33 -17'252 374'806 106 0.33 -17'252
Non-EE levers 0 4 0.00 -916 0 13 0.00 -692
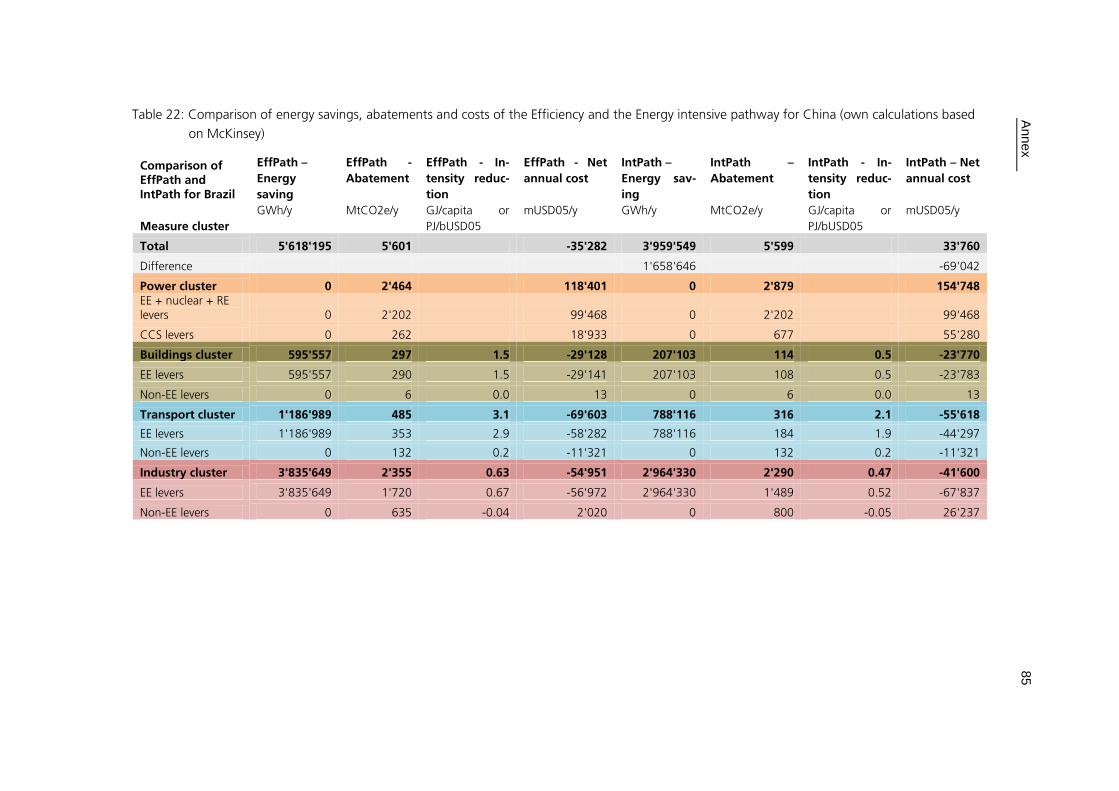
Ann
ex
85
Table 22: Comparison of energy savings, abatements and costs of the Efficiency and the Energy intensive pathway for China (own calculations based
on McKinsey)
Comparison of EffPath and IntPath for Brazil
EffPath –
Energy
saving
EffPath -
Abatement
EffPath - In-
tensity reduc-
tion
EffPath - Net
annual cost
IntPath –
Energy sav-
ing
IntPath –
Abatement
IntPath - In-
tensity reduc-
tion
IntPath – Net
annual cost
Measure cluster
GWh/y MtCO2e/y GJ/capita or
PJ/bUSD05
mUSD05/y GWh/y MtCO2e/y GJ/capita or
PJ/bUSD05
mUSD05/y
Total 5'618'195 5'601 -35'282 3'959'549 5'599 33'760
Difference 1'658'646 -69'042
Power cluster 0 2'464 118'401 0 2'879 154'748 EE + nuclear + RE levers 0 2'202 99'468 0 2'202 99'468
CCS levers 0 262 18'933 0 677 55'280
Buildings cluster 595'557 297 1.5 -29'128 207'103 114 0.5 -23'770
EE levers 595'557 290 1.5 -29'141 207'103 108 0.5 -23'783
Non-EE levers 0 6 0.0 13 0 6 0.0 13
Transport cluster 1'186'989 485 3.1 -69'603 788'116 316 2.1 -55'618
EE levers 1'186'989 353 2.9 -58'282 788'116 184 1.9 -44'297
Non-EE levers 0 132 0.2 -11'321 0 132 0.2 -11'321
Industry cluster 3'835'649 2'355 0.63 -54'951 2'964'330 2'290 0.47 -41'600
EE levers 3'835'649 1'720 0.67 -56'972 2'964'330 1'489 0.52 -67'837
Non-EE levers 0 635 -0.04 2'020 0 800 -0.05 26'237

86
H
ow
Energ
y E
fficie
ncy C
uts
Costs
for a
2-D
egre
e F
utu
re
Table 23: Comparison of energy savings, abatements and costs of the Efficiency and the Energy intensive pathway for the EU (own calculations based
on McKinsey)
Comparison of EffPath and IntPath for Brazil
EffPath –
Energy
saving
EffPath -
Abatement
EffPath - In-
tensity reduc-
tion
EffPath - Net
annual cost
IntPath –
Energy sav-
ing
IntPath –
Abatement
IntPath - In-
tensity reduc-
tion
IntPath – Net
annual cost
Measure cluster
GWh/y MtCO2e/y GJ/capita or
PJ/bUSD05
mUSD05/y GWh/y MtCO2e/y GJ/capita or
PJ/bUSD05
mUSD05/y
Total 2'477'466 1'100 -209'426 1'236'227 1'100 -127'149
Difference 1'241'239 -82'277
Power cluster 0 99 -1'116 0 455 17'148 EE + nuclear + RE levers 0 83 -1'450 0 271 7'499
CCS levers 0 16 333 0 184 9'648
Buildings cluster 621'575 183 4.4 -16'393 0 22 0.0 48
EE levers 621'575 161 4.4 -16'441 0 0 0.0 0
Non-EE levers 0 22 0.0 48 0 22 0.0 48
Transport cluster 1'341'015 562 9.5 -174'042 878'319 372 6.2 -128'036
EE levers 1'341'015 491 9.5 -153'564 878'319 301 6.2 -107'558
Non-EE levers 0 71 0.0 -20'479 0 71 0.0 -20'479
Industry cluster 514'876 256 0.08 -17'874 357'907 250 0.05 -16'308
EE levers 514'876 162 0.08 -8'775 357'907 115 0.06 -8'289
Non-EE levers 0 94 0.00 -9'099 0 135 0.00 -8'019

Ann
ex
87
Table 24: Comparison of energy savings, abatements and costs of the Efficiency and the Energy intensive pathway for India (own calculations based on
McKinsey)
Comparison of EffPath and IntPath for Brazil
EffPath –
Energy
saving
EffPath -
Abatement
EffPath - In-
tensity reduc-
tion
EffPath - Net
annual cost
IntPath –
Energy sav-
ing
IntPath –
Abatement
IntPath - In-
tensity reduc-
tion
IntPath – Net
annual cost
Measure cluster
GWh/y MtCO2e/y GJ/capita or
PJ/bUSD05
mUSD05/y GWh/y MtCO2e/y GJ/capita or
PJ/bUSD05
mUSD05/y
Total 1'448'444 1'600 -12'810 1'088'515 1'600 2'044
Difference 359'929 -14'854
Power cluster -3'004 817 42'890 0 805 39'897 EE + nuclear + RE levers -3'004 660 34'010 0 643 30'618
CCS levers 0 157 8'880 0 162 9'279
Buildings cluster 99'979 66 0.2 -2'688 52'447 33 0.1 -4'721
EE levers 47'533
Non-EE levers 99'979 61 0.2 -2'741 52'447 28 0.1 -4'774
Transport cluster 0 6 0.0 54 0 6 0.0 54
EE levers 330'096 145 0.8 -16'373 238'875 106 0.6 -17'778
Non-EE levers 91'221
Industry cluster 330'096 119 0.8 -13'713 238'875 80 0.6 -15'119
EE levers 0 26 0.0 -2'660 0 26 0.0 -2'660
Non-EE levers 1'021'373 572 0.6 -36'640 797'194 657 0.4 -15'354
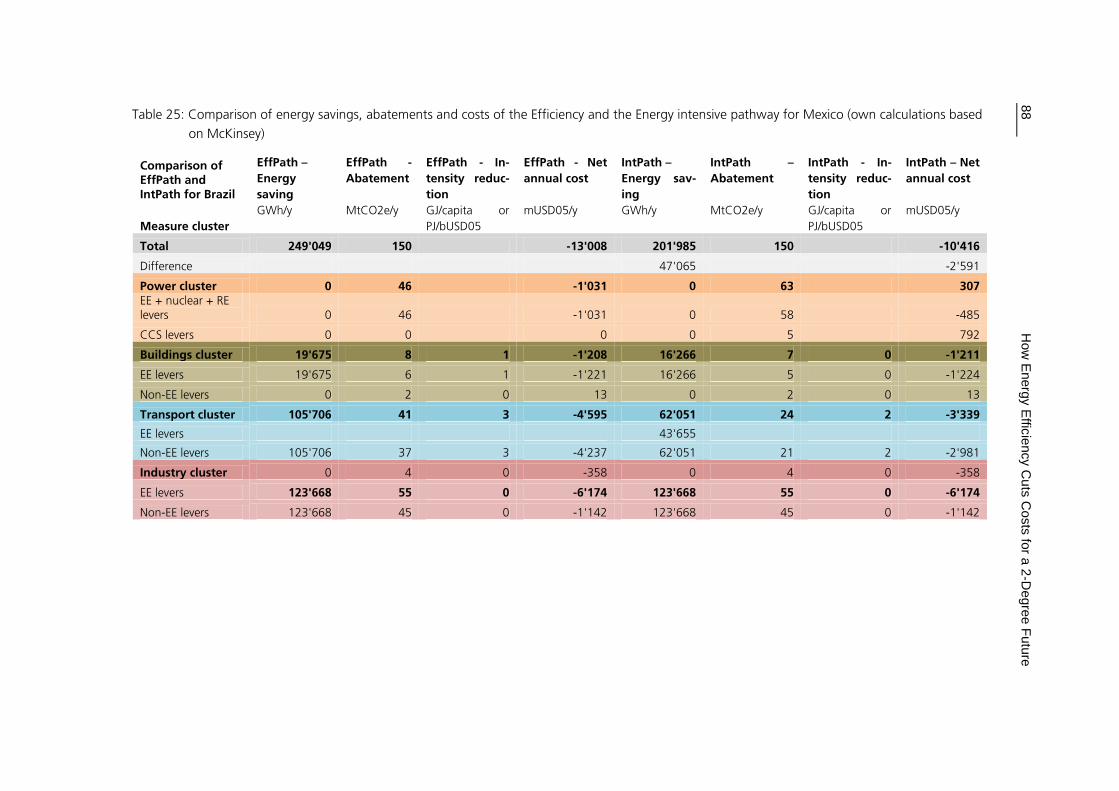
88
H
ow
Energ
y E
fficie
ncy C
uts
Costs
for a
2-D
egre
e F
utu
re
Table 25: Comparison of energy savings, abatements and costs of the Efficiency and the Energy intensive pathway for Mexico (own calculations based
on McKinsey)
Comparison of EffPath and IntPath for Brazil
EffPath –
Energy
saving
EffPath -
Abatement
EffPath - In-
tensity reduc-
tion
EffPath - Net
annual cost
IntPath –
Energy sav-
ing
IntPath –
Abatement
IntPath - In-
tensity reduc-
tion
IntPath – Net
annual cost
Measure cluster
GWh/y MtCO2e/y GJ/capita or
PJ/bUSD05
mUSD05/y GWh/y MtCO2e/y GJ/capita or
PJ/bUSD05
mUSD05/y
Total 249'049 150 -13'008 201'985 150 -10'416
Difference 47'065 -2'591
Power cluster 0 46 -1'031 0 63 307 EE + nuclear + RE levers 0 46 -1'031 0 58 -485
CCS levers 0 0 0 0 5 792
Buildings cluster 19'675 8 1 -1'208 16'266 7 0 -1'211
EE levers 19'675 6 1 -1'221 16'266 5 0 -1'224
Non-EE levers 0 2 0 13 0 2 0 13
Transport cluster 105'706 41 3 -4'595 62'051 24 2 -3'339
EE levers 43'655
Non-EE levers 105'706 37 3 -4'237 62'051 21 2 -2'981
Industry cluster 0 4 0 -358 0 4 0 -358
EE levers 123'668 55 0 -6'174 123'668 55 0 -6'174
Non-EE levers 123'668 45 0 -1'142 123'668 45 0 -1'142
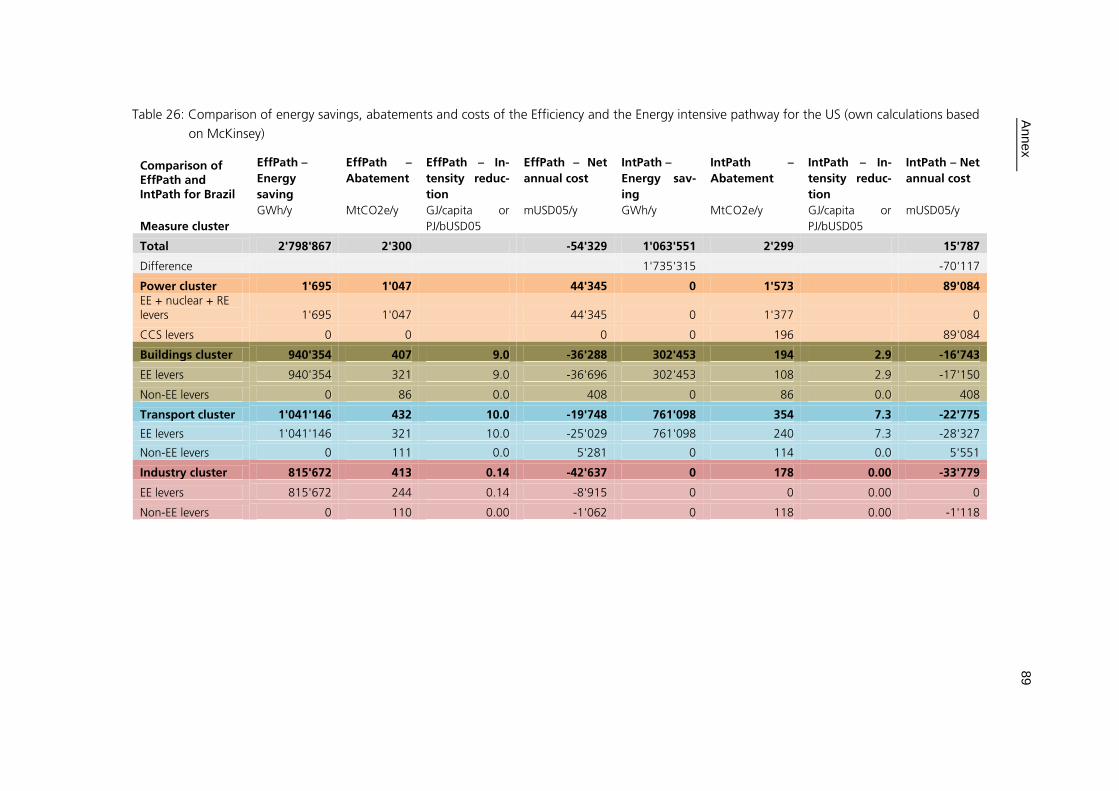
Ann
ex
89
Table 26: Comparison of energy savings, abatements and costs of the Efficiency and the Energy intensive pathway for the US (own calculations based
on McKinsey)
Comparison of EffPath and IntPath for Brazil
EffPath –
Energy
saving
EffPath –
Abatement
EffPath – In-
tensity reduc-
tion
EffPath – Net
annual cost
IntPath –
Energy sav-
ing
IntPath –
Abatement
IntPath – In-
tensity reduc-
tion
IntPath – Net
annual cost
Measure cluster
GWh/y MtCO2e/y GJ/capita or
PJ/bUSD05
mUSD05/y GWh/y MtCO2e/y GJ/capita or
PJ/bUSD05
mUSD05/y
Total 2'798'867 2'300 -54'329 1'063'551 2'299 15'787
Difference 1'735'315 -70'117
Power cluster 1'695 1'047 44'345 0 1'573 89'084 EE + nuclear + RE levers 1'695 1'047 44'345 0 1'377 0
CCS levers 0 0 0 0 196 89'084
Buildings cluster 940'354 407 9.0 -36'288 302'453 194 2.9 -16'743
EE levers 940'354 321 9.0 -36'696 302'453 108 2.9 -17'150
Non-EE levers 0 86 0.0 408 0 86 0.0 408
Transport cluster 1'041'146 432 10.0 -19'748 761'098 354 7.3 -22'775
EE levers 1'041'146 321 10.0 -25'029 761'098 240 7.3 -28'327
Non-EE levers 0 111 0.0 5'281 0 114 0.0 5'551
Industry cluster 815'672 413 0.14 -42'637 0 178 0.00 -33'779
EE levers 815'672 244 0.14 -8'915 0 0 0.00 0
Non-EE levers 0 110 0.00 -1'062 0 118 0.00 -1'118