Embed Size (px)
Citation preview

The Cryosphere, 12, 1987–2003, 2018https://doi.org/10.5194/tc-12-1987-2018© Author(s) 2018. This work is distributed underthe Creative Commons Attribution 4.0 License.
How does the ice sheet surface mass balance relate to snowfall?Insights from a ground-based precipitation radar in East AntarcticaNiels Souverijns1, Alexandra Gossart1, Irina V. Gorodetskaya2, Stef Lhermitte3, Alexander Mangold4,Quentin Laffineur4, Andy Delcloo4, and Nicole P. M. van Lipzig1
1Department of Earth and Environmental Sciences, KU Leuven, Leuven, Belgium2CESAM – Centre for Environmental and Marine Studies, Department of Physics, University of Aveiro, Aveiro, Portugal3Department of Geoscience and Remote Sensing, Delft University of Technology, Delft, The Netherlands4Observations Department, Royal Meteorological Institute of Belgium, Uccle, Belgium
Correspondence: Niels Souverijns ([email protected])
Received: 2 November 2017 – Discussion started: 4 December 2017Revised: 22 March 2018 – Accepted: 29 May 2018 – Published: 12 June 2018
Abstract. Local surface mass balance (SMB) measurementsare crucial for understanding changes in the total mass ofthe Antarctic Ice Sheet, including its contribution to sea levelrise. Despite continuous attempts to decipher mechanismscontrolling the local and regional SMB, a clear understand-ing of the separate components is still lacking, while snowfallmeasurements are almost absent. In this study, the differentterms of the SMB are quantified at the Princess Elisabeth(PE) station in Dronning Maud Land, East Antarctica. Fur-thermore, the relationship between snowfall and accumula-tion at the surface is investigated. To achieve this, a uniquecollocated set of ground-based and in situ remote sensinginstrumentation (Micro Rain Radar, ceilometer, automaticweather station, among others) was set up and operated for atime period of 37 months. Snowfall originates mainly frommoist and warm air advected from lower latitudes associatedwith cyclone activity. However, snowfall events are not al-ways associated with accumulation. During 38 % of the ob-served snowfall cases, the freshly fallen snow is ablated bythe wind during the course of the event. Generally, snowstorms of longer duration and larger spatial extent have ahigher chance of resulting in accumulation on a local scale,while shorter events usually result in ablation (on average 17and 12 h respectively). A large part of the accumulation atthe station takes place when preceding snowfall events wereoccurring in synoptic upstream areas. This fresh snow is eas-ily picked up and transported in shallow drifting snow layersover tens of kilometres, even when wind speeds are relativelylow (< 7 ms−1). Ablation events are mainly related to kata-
batic winds originating from the Antarctic plateau and themountain ranges in the south. These dry winds are able toremove snow and lead to a decrease in the local SMB. Thiswork highlights that the local SMB is strongly influenced bysynoptic upstream conditions.
1 Introduction
The Antarctic Ice Sheet (AIS), being currently the largest icebody on earth, is an important regulator of present and futuresea level and the global water cycle (Vaughan et al., 2013;Previdi and Polvani, 2016). In order to assess its contribu-tion to sea level rise, understanding the surface mass balance(SMB) of the AIS is of crucial importance. Climate models(potentially coupled to an ocean or ice sheet model) play animportant role in understanding and quantifying the contribu-tion of the AIS to sea level (rise) (Gregory and Huybrechts,2006; Rignot et al., 2011; Ligtenberg et al., 2013; DeContoand Pollard, 2016). Yet, despite their importance, they sim-plify the different components of the SMB. It has been notedby several authors that, in order to fully understand the im-pact of the AIS on future sea level rise, information on the in-dividual components of the present-day AIS SMB, includingsnowfall measurements, is indispensable (van Lipzig et al.,2002; Rignot et al., 2011; Shepherd et al., 2012; Agosta et al.,2013; Gorodetskaya et al., 2015; Lenaerts et al., 2016; Grazi-oli et al., 2017a, b; Souverijns et al., 2017). A lack of ob-servations of the present behaviour of these different com-
Published by Copernicus Publications on behalf of the European Geosciences Union.
1988 N. Souverijns et al.: Local surface mass balance of East Antarctica
ponents prevents the validation of climate models. As such,most studies rely on stake and other measurements that reg-ister only the total change in snow height (Vaughan et al.,1999; van Lipzig et al., 2004; Genthon et al., 2005; Magandet al., 2007; Eisen et al., 2008; Agosta et al., 2012; Favieret al., 2013; Wang et al., 2016; Favier et al., 2017). Gorodet-skaya et al. (2015) quantified the different terms of the localSMB in a systematic way for the Princess Elisabeth (PE) sta-tion and determined snowfall from radar measurements. Inthis study we focus on the relationship and interactions be-tween snowfall and accumulation in order to understand andassess the local SMB components in more detail.
The local SMB is influenced by several processes and canbe expressed as the sum of snowfall (S), surface sublimation(SUs), drifting snow sublimation (SUds), surface melt (ME)and wind-induced accumulation or ablation by drifting andblowing snow (ERds) (van den Broeke et al., 2004):
SMB= S+SUs+SUds+ME+ERds. (1)
Although previous studies proposed a variety of tech-niques to calculate the local SMB, most are confined to mea-suring the sum of all components (net height change at thesurface) using stake measurements and ice cores (Vaughanet al., 1999; Rotschky et al., 2007; Favier et al., 2013; Wanget al., 2016; Thomas et al., 2017) or one-dimensional snowmodels (Groot Zwaaftink et al., 2013). Generally, separatelymeasuring any of the components of the local SMB is consid-ered a difficult task (King and Turner, 1997; Vaughan et al.,1999; van Lipzig et al., 2002; van den Broeke et al., 2004;Eisen et al., 2008; Gorodetskaya et al., 2015; Amory et al.,2017; Grazioli et al., 2017a).
Traditional snowfall measurements using precipitationgauges are inhibited by high wind speeds over the AIS lead-ing to undercatchment, whereas ice cores and stake measure-ments are poor proxies for snowfall, as they are affected byother components of the local SMB, e.g. blowing snow (seeEq. 1; Bromwich, 1988; van den Broeke et al., 2004; GrootZwaaftink et al., 2013; Das et al., 2013). Again this indicatesthe importance of separately measuring the snowfall compo-nent and the existence of a non-linear relationship betweenthe local SMB and snowfall amounts. In recent years, remotesensing applications offer new possibilities regarding the de-termination of snowfall amounts on remote locations such asthe AIS. A first estimate of snowfall rates over the AIS wasderived from the CloudSat satellite (Palerme et al., 2014). Itslow overpass frequency, narrow swath width and ground clut-ter are limiting factors (Battaglia and Delanoë, 2013; Maahnet al., 2014; Casella et al., 2017). More locally, the operationof ground-based precipitation radars has proven to be an effi-cient way to detect snowfall over the AIS at several locations(Gorodetskaya et al., 2015; Souverijns et al., 2017; Grazioliet al., 2017a, b).
Wind-induced accumulation and ablation by blowing ordrifting snow over the AIS has a significant impact on the lo-cal SMB (Bromwich et al., 2004; Scarchilli et al., 2010; Palm
et al., 2017). The ERds component can, however, only bemeasured accurately using a network of snowdrift instrumen-tation (Nishimura and Nemoto, 2005; Leonard et al., 2012;Nishimura and Ishimaru, 2012; Barral et al., 2014; Trouvil-liez et al., 2014; Amory et al., 2017) and it is difficult to takeinto account in Antarctic-wide SMB estimates (Genthon andKrinner, 2001; van den Broeke et al., 2004; Das et al., 2013).Atmospheric models have been adapted to take these pro-cesses into account (Lenaerts and van den Broeke, 2012a;Gallée et al., 2013; Amory et al., 2015) but depend on param-eterisations. Thresholds for drifting snow initiation are veryvariable and depend on both the meteorological conditionsand the snow particle characteristics (Li and Pomeroy, 1997;Bintanja and Reijmer, 2001). Blowing and drifting snow canshape the relief of the ice sheet on a small spatial scale (i.e.sastrugi formation), local scale (i.e. barchan dunes) or kilo-metre scale (i.e. blue ice zones) (Amory et al., 2017). Theseprocesses potentially result in a large variability in snowheight on the decametre scale (Libois et al., 2014). Due tothe difficulty in measuring ERds, it is often considered theleftover term in the local SMB over the AIS (Gorodetskayaet al., 2015). Recently, some new remote sensing techniqueshave been developed to detect ERds based on satellite-bornelidar and ground-based ceilometer measurements, adding tothe understanding of the ERds component in the SMB (Palmet al., 2011; Gossart et al., 2017).
Both surface and drifting snow sublimation have beenquantified for the PE station (Thiery et al., 2012). On a lo-cal scale, the significance of the processes can be fairly large(e.g. King et al., 2001; Bliss et al., 2011; Gorodetskaya et al.,2015; Grazioli et al., 2017b). For the PE station, sublimationwas found to remove 10 % of the total precipitation (Thieryet al., 2012). In this study, the focus is mainly on the rela-tionship between accumulation, ablation and snowfall. Thesublimation terms, together with melt, which is only relevantat coastal areas and ice shelves (Lenaerts et al., 2017), aretherefore only quantified and not investigated in great depth.
Snow height (changes) can be measured by an automaticweather station (AWS), which is equipped with an acousticheight ranger (van den Broeke et al., 2004). The main advan-tage of the AWS is that it combines snow height and meteo-rological observations.
Synoptic- and meso-scale meteorology have a strong im-pact on the local SMB. For example, cyclone activity in theAntarctic circumpolar trough (5–70◦ S) results in moist airpenetrating into the atmosphere above the AIS. This leadsto snowfall events and high wind speeds at both coastal andinland locations (King and Turner, 1997; Simmonds et al.,2003; Schlosser et al., 2010; Hirasawa et al., 2013; Gorodet-skaya et al., 2013). If large amounts of moisture are trans-ported, these events are identified as atmospheric rivers hav-ing a profound impact on the local SMB (Gorodetskaya et al.,2014). Nevertheless, the independent measurement of thesnowfall component and the local SMB over the AIS are lim-ited. Gorodetskaya et al. (2015) showed that snowfall events
The Cryosphere, 12, 1987–2003, 2018 www.the-cryosphere.net/12/1987/2018/
N. Souverijns et al.: Local surface mass balance of East Antarctica 1989
at the PE station do not necessarily contribute to accumula-tion or an increase in snow height.
This study uses 37 months of independent snowfall andSMB measurements in order to statistically assess the rela-tionship between snowfall and the local SMB. This analy-sis therefore determines the representativeness of stake mea-surements as a proxy for snowfall on a local scale and definesthe frequency and conditions when snowfall leads to accu-mulation or ablation. In addition, changes in the local SMBtake place without snowfall. A thorough analysis of meteoro-logical conditions during these events adds to the understand-ing of the behaviour of the ERds component and its impact onthe evolution of the local SMB over the AIS.
2 Material and methods
2.1 Site description and instrumentation
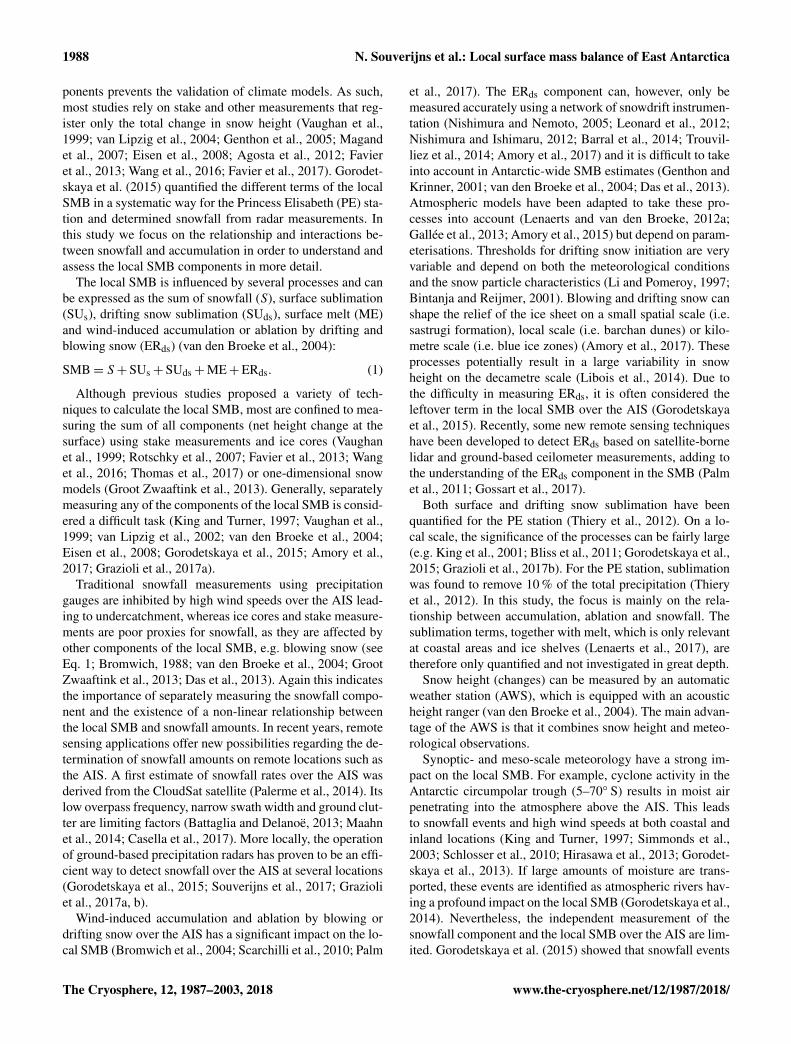
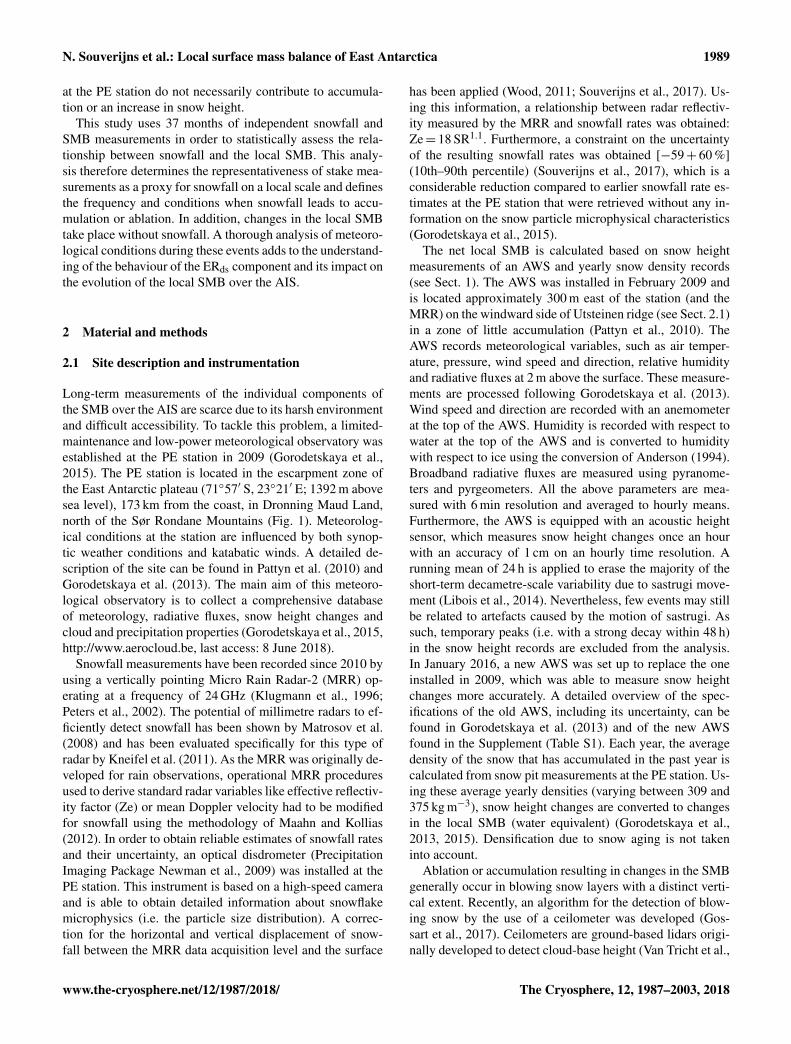
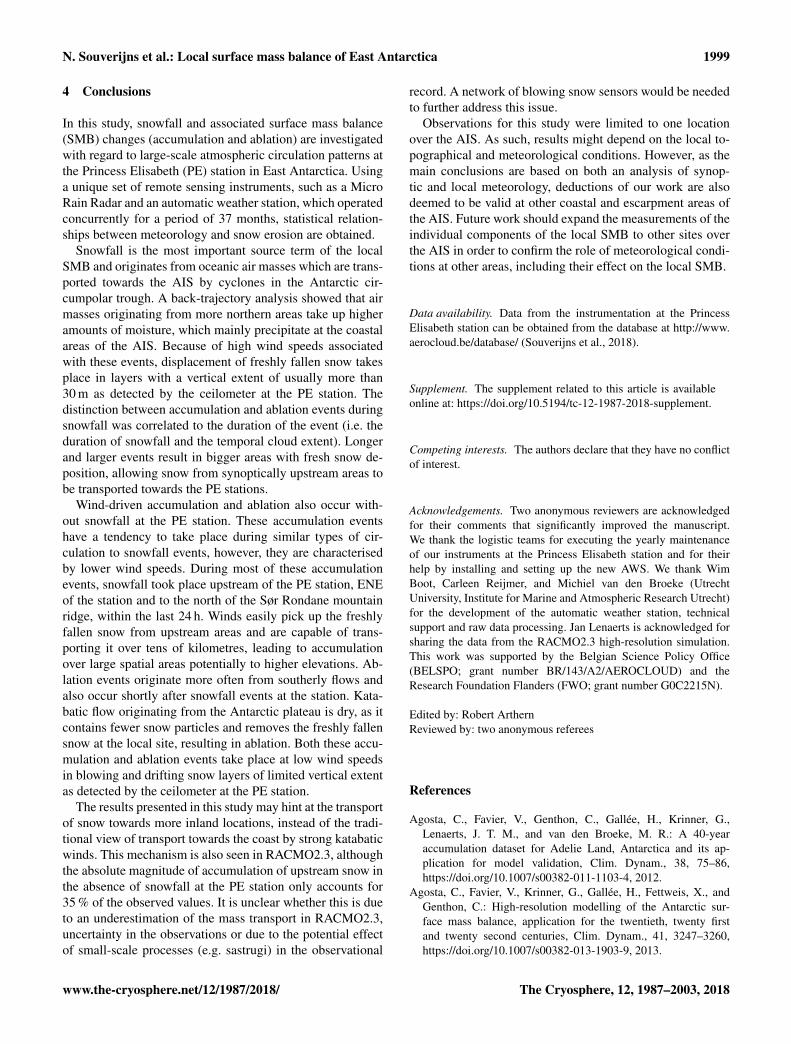
Long-term measurements of the individual components ofthe SMB over the AIS are scarce due to its harsh environmentand difficult accessibility. To tackle this problem, a limited-maintenance and low-power meteorological observatory wasestablished at the PE station in 2009 (Gorodetskaya et al.,2015). The PE station is located in the escarpment zone ofthe East Antarctic plateau (71◦57′ S, 23◦21′ E; 1392 m abovesea level), 173 km from the coast, in Dronning Maud Land,north of the Sør Rondane Mountains (Fig. 1). Meteorolog-ical conditions at the station are influenced by both synop-tic weather conditions and katabatic winds. A detailed de-scription of the site can be found in Pattyn et al. (2010) andGorodetskaya et al. (2013). The main aim of this meteoro-logical observatory is to collect a comprehensive databaseof meteorology, radiative fluxes, snow height changes andcloud and precipitation properties (Gorodetskaya et al., 2015,http://www.aerocloud.be, last access: 8 June 2018).
Snowfall measurements have been recorded since 2010 byusing a vertically pointing Micro Rain Radar-2 (MRR) op-erating at a frequency of 24 GHz (Klugmann et al., 1996;Peters et al., 2002). The potential of millimetre radars to ef-ficiently detect snowfall has been shown by Matrosov et al.(2008) and has been evaluated specifically for this type ofradar by Kneifel et al. (2011). As the MRR was originally de-veloped for rain observations, operational MRR proceduresused to derive standard radar variables like effective reflectiv-ity factor (Ze) or mean Doppler velocity had to be modifiedfor snowfall using the methodology of Maahn and Kollias(2012). In order to obtain reliable estimates of snowfall ratesand their uncertainty, an optical disdrometer (PrecipitationImaging Package Newman et al., 2009) was installed at thePE station. This instrument is based on a high-speed cameraand is able to obtain detailed information about snowflakemicrophysics (i.e. the particle size distribution). A correc-tion for the horizontal and vertical displacement of snow-fall between the MRR data acquisition level and the surface
has been applied (Wood, 2011; Souverijns et al., 2017). Us-ing this information, a relationship between radar reflectiv-ity measured by the MRR and snowfall rates was obtained:Ze= 18 SR1.1. Furthermore, a constraint on the uncertaintyof the resulting snowfall rates was obtained [−59+ 60 %](10th–90th percentile) (Souverijns et al., 2017), which is aconsiderable reduction compared to earlier snowfall rate es-timates at the PE station that were retrieved without any in-formation on the snow particle microphysical characteristics(Gorodetskaya et al., 2015).
The net local SMB is calculated based on snow heightmeasurements of an AWS and yearly snow density records(see Sect. 1). The AWS was installed in February 2009 andis located approximately 300 m east of the station (and theMRR) on the windward side of Utsteinen ridge (see Sect. 2.1)in a zone of little accumulation (Pattyn et al., 2010). TheAWS records meteorological variables, such as air temper-ature, pressure, wind speed and direction, relative humidityand radiative fluxes at 2 m above the surface. These measure-ments are processed following Gorodetskaya et al. (2013).Wind speed and direction are recorded with an anemometerat the top of the AWS. Humidity is recorded with respect towater at the top of the AWS and is converted to humiditywith respect to ice using the conversion of Anderson (1994).Broadband radiative fluxes are measured using pyranome-ters and pyrgeometers. All the above parameters are mea-sured with 6 min resolution and averaged to hourly means.Furthermore, the AWS is equipped with an acoustic heightsensor, which measures snow height changes once an hourwith an accuracy of 1 cm on an hourly time resolution. Arunning mean of 24 h is applied to erase the majority of theshort-term decametre-scale variability due to sastrugi move-ment (Libois et al., 2014). Nevertheless, few events may stillbe related to artefacts caused by the motion of sastrugi. Assuch, temporary peaks (i.e. with a strong decay within 48 h)in the snow height records are excluded from the analysis.In January 2016, a new AWS was set up to replace the oneinstalled in 2009, which was able to measure snow heightchanges more accurately. A detailed overview of the spec-ifications of the old AWS, including its uncertainty, can befound in Gorodetskaya et al. (2013) and of the new AWSfound in the Supplement (Table S1). Each year, the averagedensity of the snow that has accumulated in the past year iscalculated from snow pit measurements at the PE station. Us-ing these average yearly densities (varying between 309 and375 kg m−3), snow height changes are converted to changesin the local SMB (water equivalent) (Gorodetskaya et al.,2013, 2015). Densification due to snow aging is not takeninto account.
Ablation or accumulation resulting in changes in the SMBgenerally occur in blowing snow layers with a distinct verti-cal extent. Recently, an algorithm for the detection of blow-ing snow by the use of a ceilometer was developed (Gos-sart et al., 2017). Ceilometers are ground-based lidars origi-nally developed to detect cloud-base height (Van Tricht et al.,
www.the-cryosphere.net/12/1987/2018/ The Cryosphere, 12, 1987–2003, 2018
1990 N. Souverijns et al.: Local surface mass balance of East Antarctica
Figure 1. Location of the meteorological observatory at the Belgian Princess Elisabeth station, north of the Sør Rondane Mountains. Source:Landsat Image Mosaic of Antarctica (LIMA) Project, http://lima.usgs.gov/ (last access: 8 June 2018). Colours in the inset and contours onthe main figure denote topography height (metres).
2014; Gossart et al., 2017). This instrument is able to detectblowing snow particles based on the backscatter signal andis operational during all types of weather conditions (cloudy,snowfall conditions and at night). As such, it complementssatellite retrievals of blowing snow from the CALIPSO satel-lite (Palm et al., 2011). The minimum height of the blowingsnow layer that is detected by the ceilometer equals 30 m atthe PE station. The temporal resolution equals 15 s, while thevertical height resolution is 10 m. The quantification of blow-ing snow particle density, shape or number from the ceilome-ter attenuated backscatter signal is very uncertain (Wiegneret al., 2014). As such, this study is limited to the determina-tion of the blowing snow frequency. Results show that 78 %of the detected events by the ceilometer are in agreementwith visual observations at Neumayer III station and thatblowing snow occurrence strongly depends on fresh snowavailability in addition to wind speed (Gossart et al., 2017).
Surface and snowdrift sublimation are quantified using theapproach of Thiery et al. (2012), which determine their mag-nitude based on parameterisations using meteorological ob-servations such as relative humidity and wind speed (e.g.Bintanja and Reijmer, 2001; Déry and Yau, 2001). The nec-essary data are provided by the AWS. Based on the AWSaccuracy, the uncertainty of the surface sublimation termequals approximately 47 %, while for snowdrift sublima-tion, it equals 20 % based on differences between parame-terisations (both 2 standard deviations) (Gorodetskaya et al.,2015).
The sampling period of our study is limited to time peri-ods in which both the AWS and MRR were operational be-tween 2010 and 2016. These time frames are almost alwaysrestricted to austral summer months in which the station ismanned (Fig. S1 in the Supplement). Data acquisition duringthe austral winter season is often hampered by power fail-ures at the PE station. The MRR was installed in the season2009–2010 and a total record of seven austral summer sea-sons is available for analysis. For austral winter, only oneseason is available in which both MRR and AWS were op-erating continuously, i.e. 2012. Apart from this, in January2015, a problem with the wind vane of the AWS was de-tected. This problem persisted until December 2015, leadingto erroneous wind direction measurements. The year 2015is therefore also discarded from our analysis. In the end, 37months of collocated precipitation, total SMB and meteoro-logical data are available at the same location, which is un-precedented for the Antarctic region.
2.2 Snowfall, accumulation and ablation events
The local SMB is composed of the sum of different compo-nents (Eq. 1). Snowfall amounts are measured by a MicroRain Radar, while the two sublimation terms are calculatedbased on meteorological data from the AWS (see Sect. 2.1).The ERds term is not measured directly at the PE station.Nevertheless, since the total SMB can be deduced from theAWS (see Sect. 1), ERds can be calculated as the residualterm after inverting Eq. (1) (Gorodetskaya et al., 2015). Its
The Cryosphere, 12, 1987–2003, 2018 www.the-cryosphere.net/12/1987/2018/

N. Souverijns et al.: Local surface mass balance of East Antarctica 1991
uncertainty is therefore based on the uncertainty of all othercomponents of the local SMB (Eq. 1; Gorodetskaya et al.,2015) and is mainly determined by the uncertainty of thesnowfall component at the PE station, as this term has thehighest uncertainty range (see Sect 2.1) and absolute contri-bution to the SMB.
Snowfall is generally considered the main positive termof the local SMB (Davis et al., 2005). One would thereforeexpect that snowfall results in accumulation or an increasein height. However, this is not necessarily true locally overthe AIS, where snowfall often coincides with strong winds.Consequently, snowfall events with strong redistribution canresult in a net snow removal on a local scale. As stated inSect. 1, accumulation and ablation also occur during non-precipitating conditions. In order to define the conditions forthese episodes and to assess a relationship between snowfalland accumulation, different types of events were discrimi-nated based on local SMB measurements from the AWS andsnowfall records from the MRR:
– accumulation during snowfall (SMB +, S +)
– ablation during snowfall (SMB −, S +)
– accumulation without snowfall (SMB +, S 0)
– ablation without snowfall (SMB −, S 0).
An event is confined to the period between the start ofsnowfall, accumulation or ablation and the moment at whichno more snowfall, accumulation or ablation is observed. Thetime step and duration of an event have an hourly time reso-lution. Snowfall events are defined as exceeding the thresh-old of 1 mm w.e. during the continuous duration of snowfallmeasured by the MRR. As the AWS measures snow heightchanges with a sensitivity of 1 cm, an increase in surfaceheight larger than 1 cm over the duration of an event is con-sidered to be an accumulation event, while an ablation eventoccurs when a decrease in surface height of more than 1 cmis recorded.
2.3 Local- and large-scale meteorology
In order to understand the mechanisms resulting in snow-fall and wind-induced accumulation or ablation, the mete-orological conditions of the four types of events defined inSect. 2.2 are evaluated. For all members within these fourtypes of events, average meteorological conditions are cal-culated. Wind speed and direction, humidity and radiativefluxes are obtained from the AWS. Snowfall amounts areobtained by applying a relation converting radar reflectivitymeasurements from the MRR to snowfall rates specificallydeveloped for the PE station using observations from an op-tical disdrometer (see Sect. 2.1).
Further, the temporal extent of the cloud system is investi-gated using two different data products. Firstly, cloudy con-ditions are estimated based on long-wave downward radia-tion measurements of the AWS. For this, the clear-sky index
based on the methodology of Marty and Philipona (2000)and Dürr and Philipona (2004) is used, which calculates theratio between the apparent and clear-sky long-wave down-ward radiation. The apparent long-wave downward radiationis calculated using observations of the AWS. For the clear-sky long-wave downward radiation, local coefficients (seeEq. 3 and Sect. 3 in Marty and Philipona, 2000) are op-timised for the PE station by comparing calculated clear-sky and observed long-wave downward radiation during vi-sually detected cloud-free conditions (based on camera im-ages and ceilometer data). As a result, based on the ratioof apparent and clear-sky long-wave downward radiation,one can discriminate between cloudy and clear-sky condi-tions. Secondly, the temporal extent of the cloud system atthe PE station was estimated from ERA-Interim (Dee et al.,2011). ERA-Interim is generally considered the best reanaly-sis product over Antarctica (Bracegirdle and Marshall, 2012).Cloudy conditions over the station are defined as having a to-tal cloud fraction of more than 95 % in the pixel over the PEstation. Sensitivity studies have been executed on this thresh-old (varying between 80 and 100 %) and account for onlysmall relative differences not influencing the general con-clusions significantly. Ceilometer cloud observations are notused to determine the temporal extent of the cloud system, asthe collocated time period of corresponding measurements isinsufficient.
Apart from these local meteorological variables, an anal-ysis of the large-scale circulation over Dronning Maud Land(including a large part of the Southern Ocean) was per-formed. A cluster analysis was applied to 500 hPa geopo-tential ERA-Interim reanalysis data covering the period ofobservations at the PE station (2010–2016). This gives anoverview of the climatology and the typical circulation thatis present over the region.
Several algorithms are available for a cluster analysis(Philipp et al., 2010). In recent studies, thorough evaluationswere performed for each of these algorithms, and the bestperformance regarding circulation clustering was indicatedfor optimisation algorithms over different parts of the world(Huth et al., 2008; Beck and Philipp, 2010; Casado et al.,2010; Souverijns et al., 2016). From these optimisation algo-rithms, the simulated annealing and diversified randomisa-tion (SANDRA) algorithm was chosen, which is based onk-means clustering (Philipp et al., 2007) as it is adequatefor different applications over the world regarding circula-tion clustering (Huth et al., 2008; Beck and Philipp, 2010;Casado et al., 2010; Souverijns et al., 2016). In addition tochoosing the classification algorithm, it is necessary to definethe total number of circulation patterns that cover the full cli-matology over Dronning Maud Land. For a range between2 and 27 total circulation patterns, the quality of the SAN-DRA algorithm is tested. Using the fast silhouette index, theability of the SANDRA algorithm to maximise the separa-bility between the members of different circulation patternswhile minimising the variances within each circulation pat-
www.the-cryosphere.net/12/1987/2018/ The Cryosphere, 12, 1987–2003, 2018

1992 N. Souverijns et al.: Local surface mass balance of East Antarctica
tern was investigated (Rousseeuw, 1987). In this study, a to-tal of six circulation patterns was selected. The fast silhouetteindex indicates a local minimum value as a further increasein the total number of circulation patterns shows no signifi-cant improvement (i.e. decrease) regarding the classificationskill (Fig. S2). Based on this climatology, the dominant cir-culation present during the four types of events resulting ina change in the local SMB defined in Sect. 2.2 are deter-mined. This cluster analysis method has similar results to thelocal meteorological regimes defined by Gorodetskaya et al.(2013) but increases insight into the large-scale circulationpatterns and source regions of air advection.
In addition to this cluster analysis, a back-trajectory anal-ysis was performed for all individual events in order to getinsights into the origin and history of the air masses. For this,the FLEXPART software, a Lagrangian transport and disper-sion model which makes use of ERA-Interim data is used ata spatial resolution of 0.75◦× 0.75◦ (Stohl et al., 1995; Stohland Seibert, 1998).
Changes in snow height are measured by the AWS at asingle location, 300 m east of the PE station. However, snowheight is highly variable in space and time over the AIS(Frezzotti et al., 2005; Eisen et al., 2008). Observations fromthe Antarctic plateau show large decametre-scale variabil-ity in snow heights due to the formation and movement ofsastrugi, highly impacting the snow height record (Liboiset al., 2014). In this study, the focus is mainly on accumu-lation and ablation over larger spatial areas. In order to vali-date the spatial scale of accumulation and ablation, snow ero-sion output from the state-of-the-art high-resolution (5.5 kmgrid) RACMO2.3 simulation is analysed (Lenaerts et al.,2014, 2017; van Wessem et al., 2014), which is coupled to asnow model including drifting snow (Lenaerts and van denBroeke, 2012a). The RACMO2.3 simulation is driven byERA-Interim and adequately simulates both climatologicaland meteorological conditions near the surface (e.g. Lenaertset al., 2014). By selecting the time periods during which ac-cumulation and ablation occurred in the RACMO2.3 simu-lation, an overview of snow erosion spatial structures duringthese events is achieved.
3 Results and discussion
3.1 Local surface mass balance
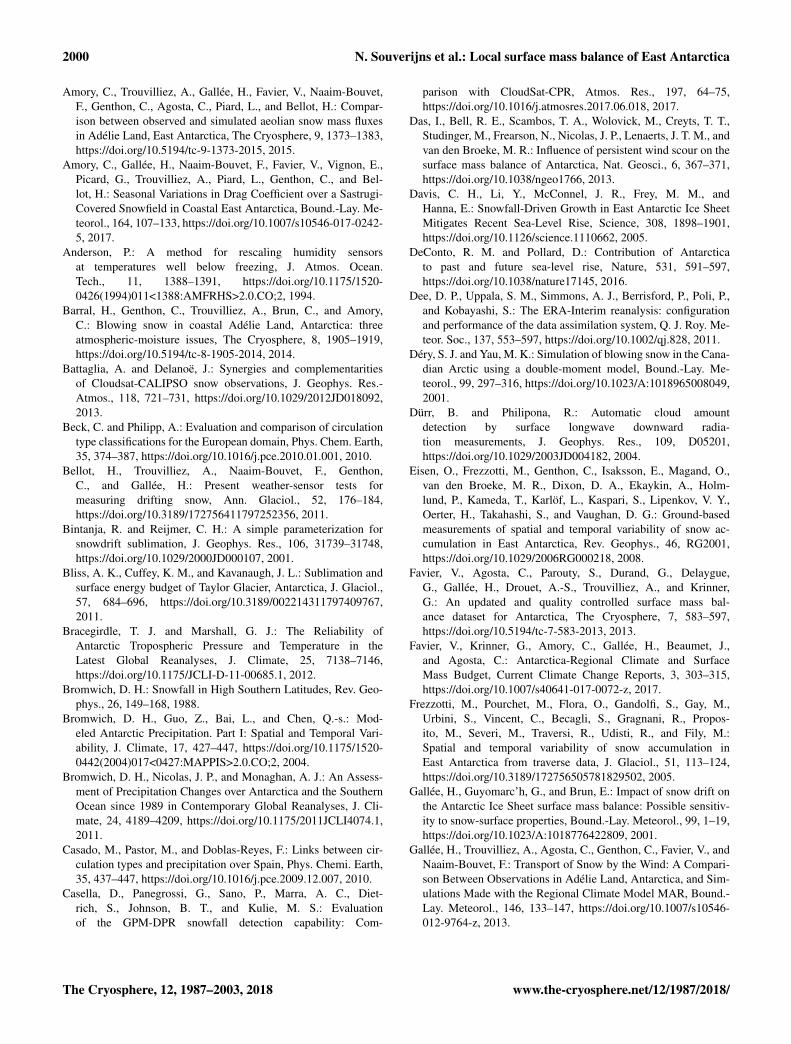
The four components of the local SMB, snowfall, surfacesublimation, drifting snow sublimation and wind-induced ac-cumulation and ablation, are converted to water equivalentvalues (see Sect. 1; Gorodetskaya et al., 2013, 2015). Whensnow height measurements are available the local SMB canbe closed (treating ERds as a residual term; see Eq. 1). Forthe year 2012, both the AWS and MRR operated year-round,allowing the evolution of the different components throughtime to be visualised in a cumulative way (Fig. 2; see also
Figure 2. Cumulative daily surface mass balance components dur-ing 2012 at the Princess Elisabeth station: snowfall (S), surface sub-limation (SUs), drifting snow sublimation (SUds), wind-induced ac-cumulation and ablation (ERds), and accumulation and ablation de-duced from measured snow height changes since 1 January 2012(SMB; adapted from Gorodetskaya et al., 2015). SUs and SUds areplotted as ablation terms. ERds is calculated and plotted as a resid-ual term by inverting Eq. (1). Red crosses at the bottom indicatedays of missing MRR data, while blue crosses at the top denotemissing AWS data. Letters on the x axis mark the first day of eachmonth. Examples of the four types of events defined in Sect. 2.2 areindicated with black rectangles.
Gorodetskaya et al., 2015). Snowfall (S) is identified as astrictly positive term and the stepwise function indicates thatthe total yearly precipitation amount is strongly influenced byseveral intense precipitation events per year. The local SMBis denoted by the green line and shows several peaks in boththe upper and lower directions (indicating distinct accumu-lation and ablation events respectively). These events occurboth with or without snowfall and allow for easy identifica-tion of the individual accumulation and ablation events. Fur-thermore, it can also be noted that surface and drifting snowsublimation (SUs and SUds respectively) are both ablationterms. The rest of the study ignores these two components,as in this study we focus on the contribution of the ERds term.
For each of the four types of events defined in Sect. 2.2one example is highlighted in Fig. 2. It can be seen that somesnowfall events account for accumulation (SMB+, S +), butthat this is not strictly the case (Gorodetskaya et al., 2015).Wind can also remove mass from the site during a snowfallevent, leading to a net removal of mass (SMB−, S +). Addi-tionally, even during time periods without any snowfall, snowheight varies continuously and several accumulation (SMB+, S 0) and ablation (SMB −, S 0) events can be identifiedwithout the presence of snowfall.
3.2 Large-scale meteorology
Using the SANDRA circulation pattern classification algo-rithm, it is possible to define the climatology of large-scalecirculation over Dronning Maud Land and the nearby South-
The Cryosphere, 12, 1987–2003, 2018 www.the-cryosphere.net/12/1987/2018/
N. Souverijns et al.: Local surface mass balance of East Antarctica 1993
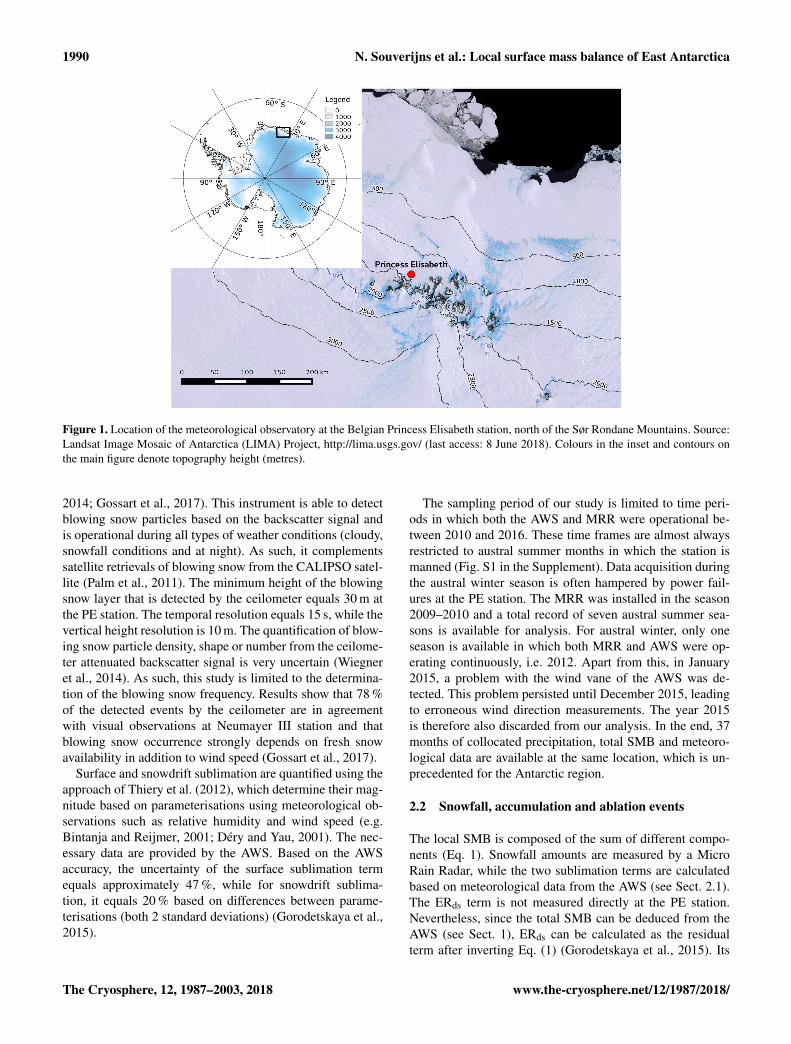
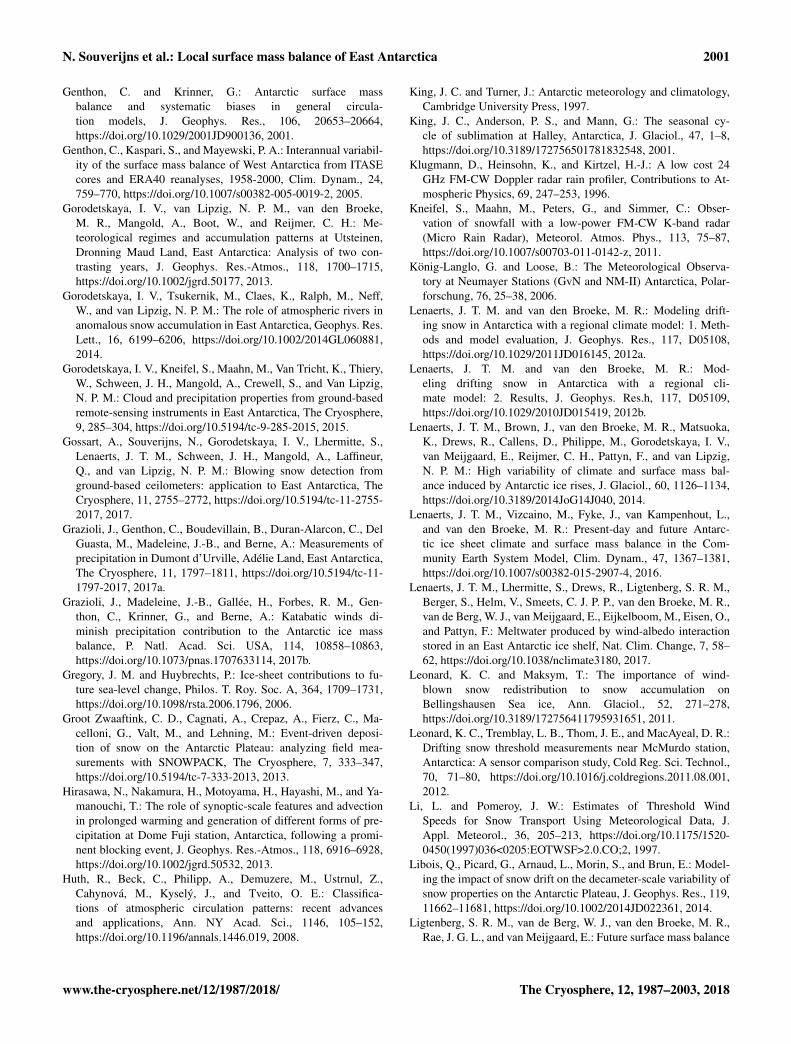
Figure 3. Weather atlas illustrating the circulation climatology over Dronning Maud Land. Thick lines denote the 500 hPa geopotentialfields, while blue colours show average precipitation amounts linked to this circulation. The red dot indicates the location of the PrincessElisabeth station, while the green dot denotes the location over the ocean used for calculating the pressure gradient (Sect. 3.3). The Antarcticcircumpolar trough is identified. The depiction sequence of the circulation types describes the typical west–east movement of the cyclones.
ern Ocean (Fig. 3). Large-scale circulation over DronningMaud Land is typically characterised by an anticyclone closeto the pole and cyclones at latitudes between 50 and 70◦ S,north or near the coast of the AIS. These low-pressure sys-tems form a ring around the Antarctic continent (Antarcticcircumpolar trough), resulting in a high variability in mete-orological regimes at the coastal areas of the AIS (King andTurner, 1997; van den Broeke and van Lipzig, 2003; König-Langlo and Loose, 2006; Gorodetskaya et al., 2013; Hira-sawa et al., 2013). The sequence of circulation patterns de-picted in Fig. 3 is typical for the Antarctic region (Simmondset al., 2003). In circulation type 1 (C1) the Antarctic circum-polar trough is clearly visible, showing a high-pressure bulgeover Dronning Maud Land. To the east and west, we can seetwo low-pressure cells. In C2–C5 the typical movement of alow-pressure cyclone from the west to the east is depicted,largely influencing meteorological conditions at the surface.Apart from the circulation, the average precipitation amountsassociated with each circulation pattern are shown (Fig. 3).Precipitation estimates are obtained from ERA-Interim, cur-rently considered the best Antarctic-wide precipitation prod-uct, but are still strongly biased (Bromwich et al., 2011).Misrepresentations of large-scale atmospheric flow and pre-cipitation might therefore impact the results. A strong linkbetween the locations of the cyclone and precipitation is
present. The cyclone is capable of transporting marine air to-wards the AIS. These marine air masses have the potential totake up moisture, potentially resulting in precipitation at thecontinent. A detailed description of each circulation patterncan be retrieved from the Supplement.
3.3 Snowfall
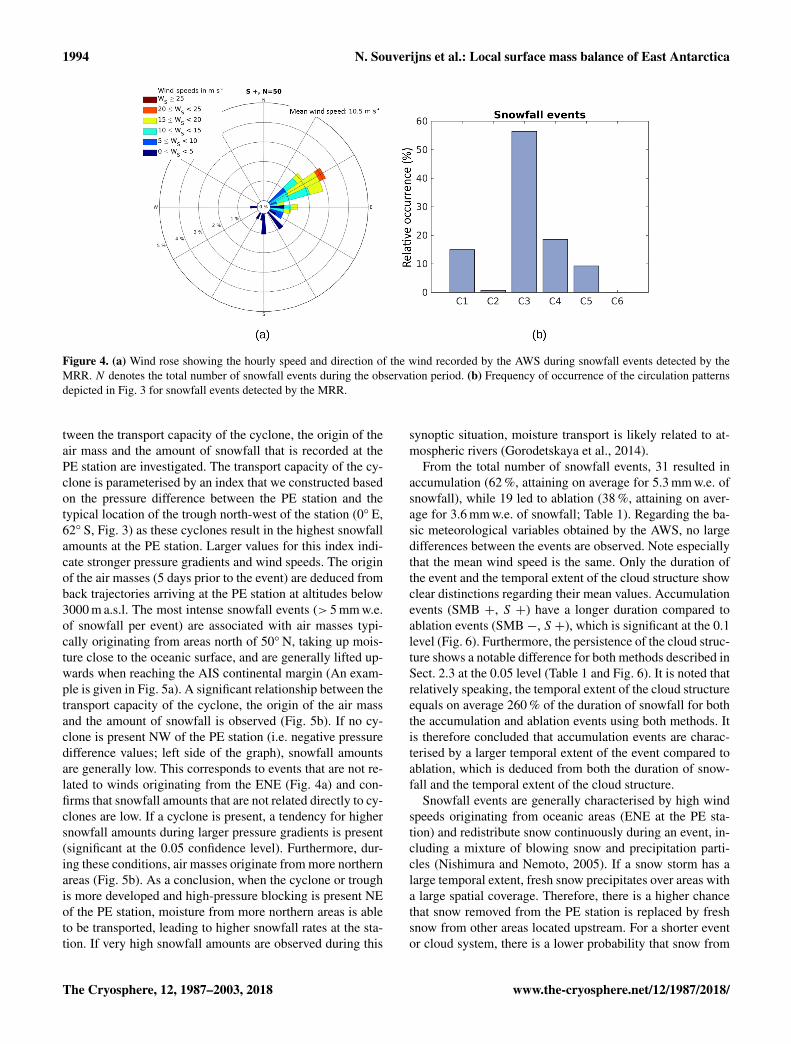
Snowfall is the main positive contributor to the local SMB.During the observational period 2010–2016, a total of 50 in-dependent snowfall episodes were detected resulting in atleast 1 mm w.e. at the PE station. Snowfall events are char-acterised by high wind speeds originating mainly from theeast-north-east (ENE; Table 1 and Fig. 4a). Only a limitednumber of snowfall events correspond to near-surface windsfrom other directions. This complies with the literature, stat-ing that moist air and precipitation are transported via cy-clone activity in the Antarctic circumpolar trough towards theAIS (Sect. 1) and is also confirmed by our cluster analysis.A fraction of more than 70 % of all snowfall events coincidewith cyclone activity (Fig. 4b). Over the AIS, these winds areslanted towards the east at the surface due to friction and thelocation of the PE station in the escarpment zone (Fig. 1).
In order to validate the relationship between large snowfallevents and these meteorological conditions, interactions be-
www.the-cryosphere.net/12/1987/2018/ The Cryosphere, 12, 1987–2003, 2018
1994 N. Souverijns et al.: Local surface mass balance of East Antarctica
Figure 4. (a) Wind rose showing the hourly speed and direction of the wind recorded by the AWS during snowfall events detected by theMRR. N denotes the total number of snowfall events during the observation period. (b) Frequency of occurrence of the circulation patternsdepicted in Fig. 3 for snowfall events detected by the MRR.
tween the transport capacity of the cyclone, the origin of theair mass and the amount of snowfall that is recorded at thePE station are investigated. The transport capacity of the cy-clone is parameterised by an index that we constructed basedon the pressure difference between the PE station and thetypical location of the trough north-west of the station (0◦ E,62◦ S, Fig. 3) as these cyclones result in the highest snowfallamounts at the PE station. Larger values for this index indi-cate stronger pressure gradients and wind speeds. The originof the air masses (5 days prior to the event) are deduced fromback trajectories arriving at the PE station at altitudes below3000 m a.s.l. The most intense snowfall events (> 5 mm w.e.of snowfall per event) are associated with air masses typi-cally originating from areas north of 50◦ N, taking up mois-ture close to the oceanic surface, and are generally lifted up-wards when reaching the AIS continental margin (An exam-ple is given in Fig. 5a). A significant relationship between thetransport capacity of the cyclone, the origin of the air massand the amount of snowfall is observed (Fig. 5b). If no cy-clone is present NW of the PE station (i.e. negative pressuredifference values; left side of the graph), snowfall amountsare generally low. This corresponds to events that are not re-lated to winds originating from the ENE (Fig. 4a) and con-firms that snowfall amounts that are not related directly to cy-clones are low. If a cyclone is present, a tendency for highersnowfall amounts during larger pressure gradients is present(significant at the 0.05 confidence level). Furthermore, dur-ing these conditions, air masses originate from more northernareas (Fig. 5b). As a conclusion, when the cyclone or troughis more developed and high-pressure blocking is present NEof the PE station, moisture from more northern areas is ableto be transported, leading to higher snowfall rates at the sta-tion. If very high snowfall amounts are observed during this
synoptic situation, moisture transport is likely related to at-mospheric rivers (Gorodetskaya et al., 2014).
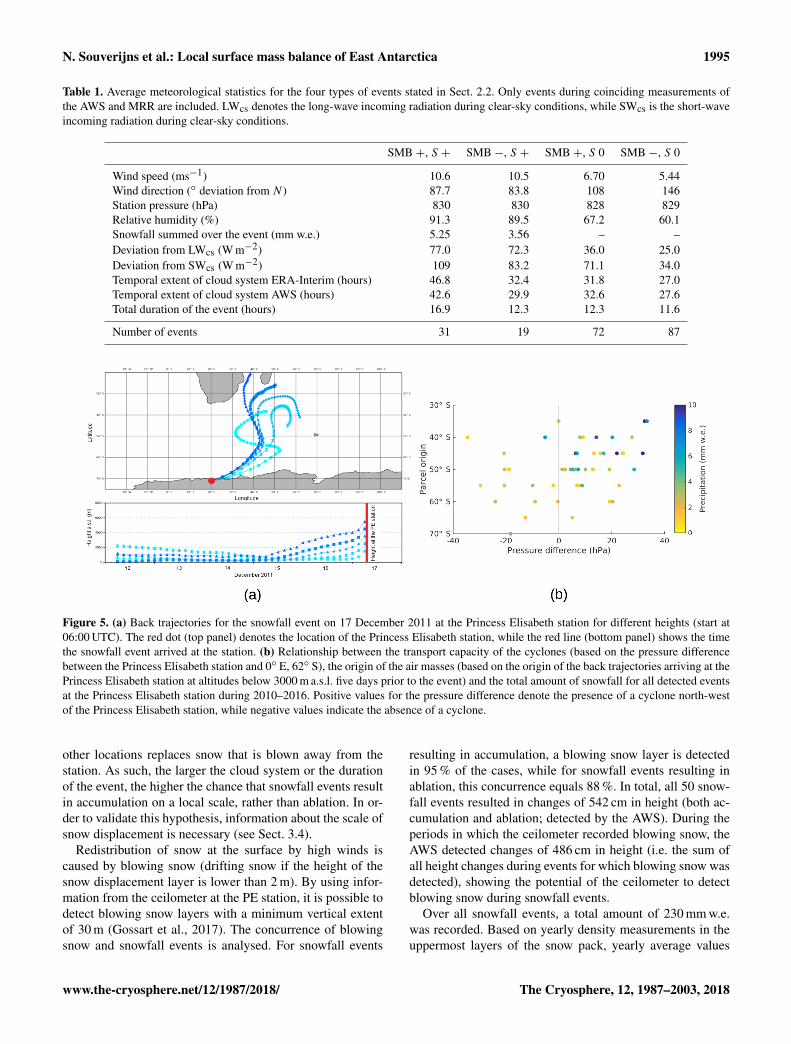
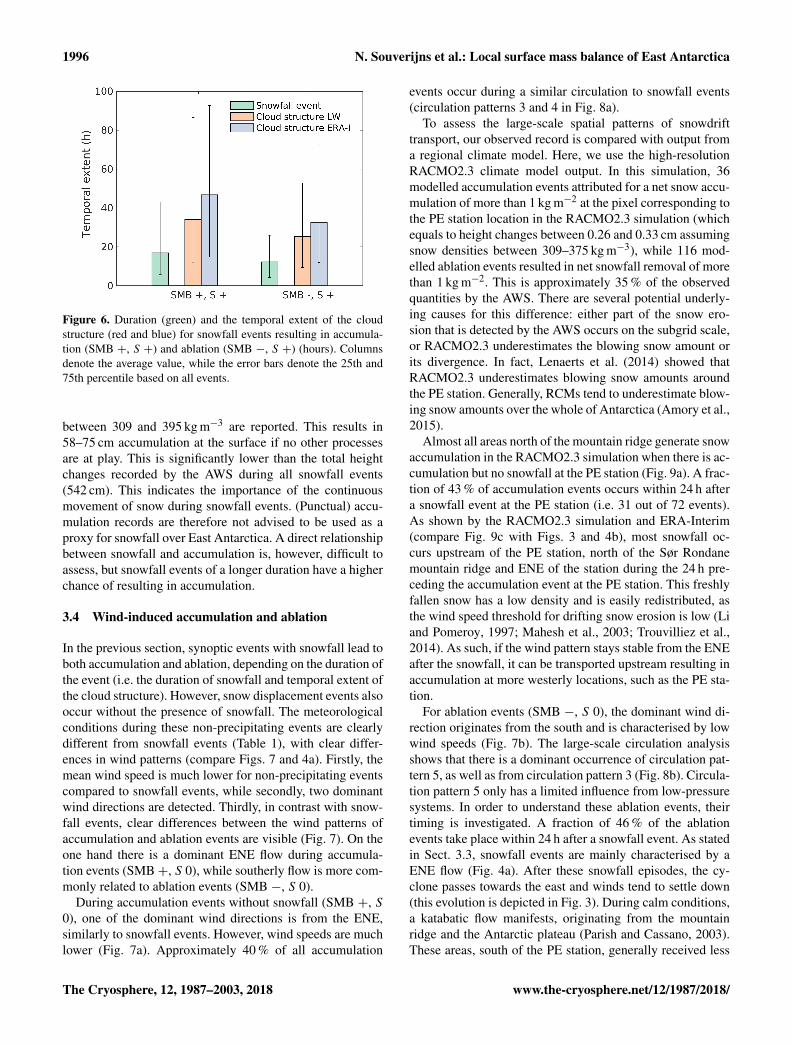
From the total number of snowfall events, 31 resulted inaccumulation (62 %, attaining on average for 5.3 mm w.e. ofsnowfall), while 19 led to ablation (38 %, attaining on aver-age for 3.6 mm w.e. of snowfall; Table 1). Regarding the ba-sic meteorological variables obtained by the AWS, no largedifferences between the events are observed. Note especiallythat the mean wind speed is the same. Only the duration ofthe event and the temporal extent of the cloud structure showclear distinctions regarding their mean values. Accumulationevents (SMB +, S +) have a longer duration compared toablation events (SMB−, S +), which is significant at the 0.1level (Fig. 6). Furthermore, the persistence of the cloud struc-ture shows a notable difference for both methods described inSect. 2.3 at the 0.05 level (Table 1 and Fig. 6). It is noted thatrelatively speaking, the temporal extent of the cloud structureequals on average 260 % of the duration of snowfall for boththe accumulation and ablation events using both methods. Itis therefore concluded that accumulation events are charac-terised by a larger temporal extent of the event compared toablation, which is deduced from both the duration of snow-fall and the temporal extent of the cloud structure.
Snowfall events are generally characterised by high windspeeds originating from oceanic areas (ENE at the PE sta-tion) and redistribute snow continuously during an event, in-cluding a mixture of blowing snow and precipitation parti-cles (Nishimura and Nemoto, 2005). If a snow storm has alarge temporal extent, fresh snow precipitates over areas witha large spatial coverage. Therefore, there is a higher chancethat snow removed from the PE station is replaced by freshsnow from other areas located upstream. For a shorter eventor cloud system, there is a lower probability that snow from
The Cryosphere, 12, 1987–2003, 2018 www.the-cryosphere.net/12/1987/2018/
N. Souverijns et al.: Local surface mass balance of East Antarctica 1995
Table 1. Average meteorological statistics for the four types of events stated in Sect. 2.2. Only events during coinciding measurements ofthe AWS and MRR are included. LWcs denotes the long-wave incoming radiation during clear-sky conditions, while SWcs is the short-waveincoming radiation during clear-sky conditions.
SMB +, S + SMB −, S + SMB +, S 0 SMB −, S 0
Wind speed (ms−1) 10.6 10.5 6.70 5.44Wind direction (◦ deviation from N ) 87.7 83.8 108 146Station pressure (hPa) 830 830 828 829Relative humidity (%) 91.3 89.5 67.2 60.1Snowfall summed over the event (mm w.e.) 5.25 3.56 – –Deviation from LWcs (W m−2) 77.0 72.3 36.0 25.0Deviation from SWcs (W m−2) 109 83.2 71.1 34.0Temporal extent of cloud system ERA-Interim (hours) 46.8 32.4 31.8 27.0Temporal extent of cloud system AWS (hours) 42.6 29.9 32.6 27.6Total duration of the event (hours) 16.9 12.3 12.3 11.6
Number of events 31 19 72 87
Figure 5. (a) Back trajectories for the snowfall event on 17 December 2011 at the Princess Elisabeth station for different heights (start at06:00 UTC). The red dot (top panel) denotes the location of the Princess Elisabeth station, while the red line (bottom panel) shows the timethe snowfall event arrived at the station. (b) Relationship between the transport capacity of the cyclones (based on the pressure differencebetween the Princess Elisabeth station and 0◦ E, 62◦ S), the origin of the air masses (based on the origin of the back trajectories arriving at thePrincess Elisabeth station at altitudes below 3000 m a.s.l. five days prior to the event) and the total amount of snowfall for all detected eventsat the Princess Elisabeth station during 2010–2016. Positive values for the pressure difference denote the presence of a cyclone north-westof the Princess Elisabeth station, while negative values indicate the absence of a cyclone.
other locations replaces snow that is blown away from thestation. As such, the larger the cloud system or the durationof the event, the higher the chance that snowfall events resultin accumulation on a local scale, rather than ablation. In or-der to validate this hypothesis, information about the scale ofsnow displacement is necessary (see Sect. 3.4).
Redistribution of snow at the surface by high winds iscaused by blowing snow (drifting snow if the height of thesnow displacement layer is lower than 2 m). By using infor-mation from the ceilometer at the PE station, it is possible todetect blowing snow layers with a minimum vertical extentof 30 m (Gossart et al., 2017). The concurrence of blowingsnow and snowfall events is analysed. For snowfall events
resulting in accumulation, a blowing snow layer is detectedin 95 % of the cases, while for snowfall events resulting inablation, this concurrence equals 88 %. In total, all 50 snow-fall events resulted in changes of 542 cm in height (both ac-cumulation and ablation; detected by the AWS). During theperiods in which the ceilometer recorded blowing snow, theAWS detected changes of 486 cm in height (i.e. the sum ofall height changes during events for which blowing snow wasdetected), showing the potential of the ceilometer to detectblowing snow during snowfall events.
Over all snowfall events, a total amount of 230 mm w.e.was recorded. Based on yearly density measurements in theuppermost layers of the snow pack, yearly average values
www.the-cryosphere.net/12/1987/2018/ The Cryosphere, 12, 1987–2003, 2018
1996 N. Souverijns et al.: Local surface mass balance of East Antarctica
Figure 6. Duration (green) and the temporal extent of the cloudstructure (red and blue) for snowfall events resulting in accumula-tion (SMB +, S +) and ablation (SMB −, S +) (hours). Columnsdenote the average value, while the error bars denote the 25th and75th percentile based on all events.
between 309 and 395 kg m−3 are reported. This results in58–75 cm accumulation at the surface if no other processesare at play. This is significantly lower than the total heightchanges recorded by the AWS during all snowfall events(542 cm). This indicates the importance of the continuousmovement of snow during snowfall events. (Punctual) accu-mulation records are therefore not advised to be used as aproxy for snowfall over East Antarctica. A direct relationshipbetween snowfall and accumulation is, however, difficult toassess, but snowfall events of a longer duration have a higherchance of resulting in accumulation.
3.4 Wind-induced accumulation and ablation
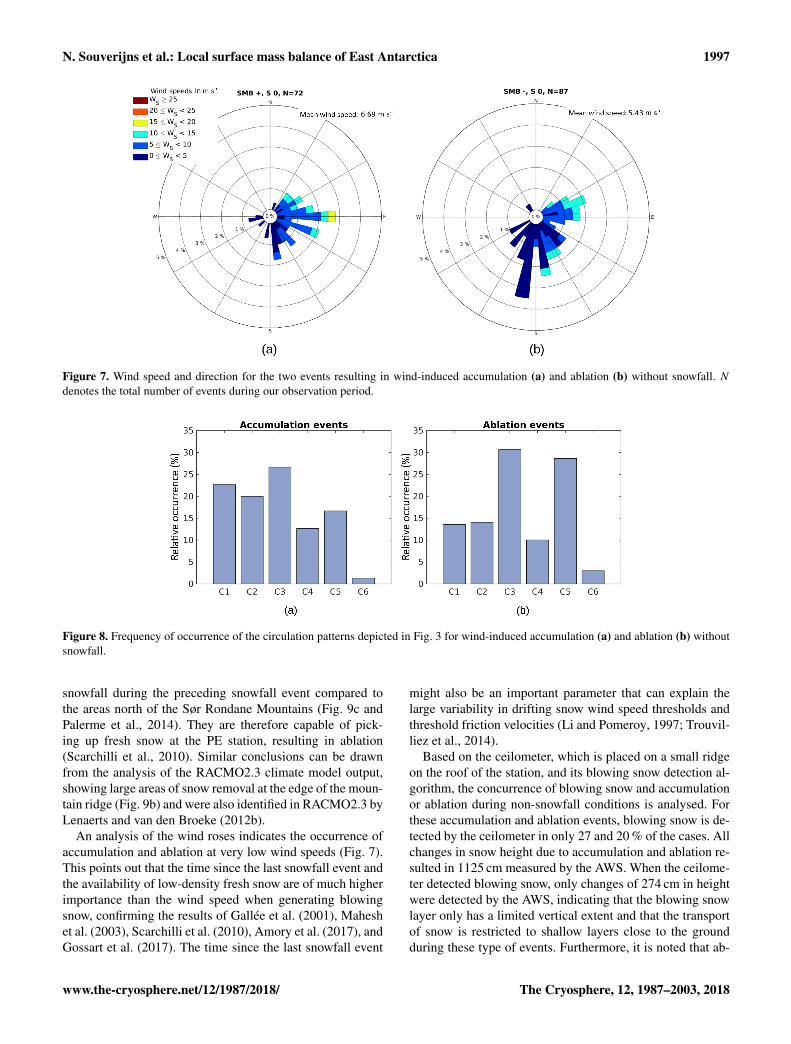
In the previous section, synoptic events with snowfall lead toboth accumulation and ablation, depending on the duration ofthe event (i.e. the duration of snowfall and temporal extent ofthe cloud structure). However, snow displacement events alsooccur without the presence of snowfall. The meteorologicalconditions during these non-precipitating events are clearlydifferent from snowfall events (Table 1), with clear differ-ences in wind patterns (compare Figs. 7 and 4a). Firstly, themean wind speed is much lower for non-precipitating eventscompared to snowfall events, while secondly, two dominantwind directions are detected. Thirdly, in contrast with snow-fall events, clear differences between the wind patterns ofaccumulation and ablation events are visible (Fig. 7). On theone hand there is a dominant ENE flow during accumula-tion events (SMB+, S 0), while southerly flow is more com-monly related to ablation events (SMB −, S 0).
During accumulation events without snowfall (SMB +, S
0), one of the dominant wind directions is from the ENE,similarly to snowfall events. However, wind speeds are muchlower (Fig. 7a). Approximately 40 % of all accumulation
events occur during a similar circulation to snowfall events(circulation patterns 3 and 4 in Fig. 8a).
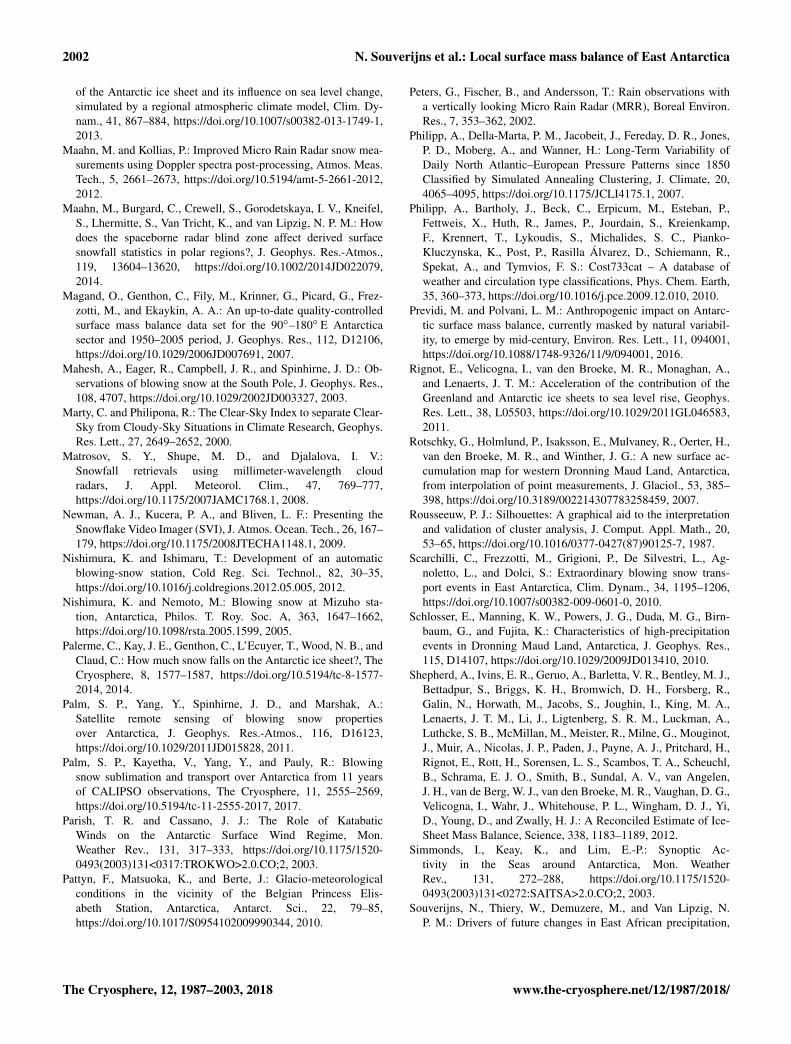
To assess the large-scale spatial patterns of snowdrifttransport, our observed record is compared with output froma regional climate model. Here, we use the high-resolutionRACMO2.3 climate model output. In this simulation, 36modelled accumulation events attributed for a net snow accu-mulation of more than 1 kg m−2 at the pixel corresponding tothe PE station location in the RACMO2.3 simulation (whichequals to height changes between 0.26 and 0.33 cm assumingsnow densities between 309–375 kg m−3), while 116 mod-elled ablation events resulted in net snowfall removal of morethan 1 kg m−2. This is approximately 35 % of the observedquantities by the AWS. There are several potential underly-ing causes for this difference: either part of the snow ero-sion that is detected by the AWS occurs on the subgrid scale,or RACMO2.3 underestimates the blowing snow amount orits divergence. In fact, Lenaerts et al. (2014) showed thatRACMO2.3 underestimates blowing snow amounts aroundthe PE station. Generally, RCMs tend to underestimate blow-ing snow amounts over the whole of Antarctica (Amory et al.,2015).
Almost all areas north of the mountain ridge generate snowaccumulation in the RACMO2.3 simulation when there is ac-cumulation but no snowfall at the PE station (Fig. 9a). A frac-tion of 43 % of accumulation events occurs within 24 h aftera snowfall event at the PE station (i.e. 31 out of 72 events).As shown by the RACMO2.3 simulation and ERA-Interim(compare Fig. 9c with Figs. 3 and 4b), most snowfall oc-curs upstream of the PE station, north of the Sør Rondanemountain ridge and ENE of the station during the 24 h pre-ceding the accumulation event at the PE station. This freshlyfallen snow has a low density and is easily redistributed, asthe wind speed threshold for drifting snow erosion is low (Liand Pomeroy, 1997; Mahesh et al., 2003; Trouvilliez et al.,2014). As such, if the wind pattern stays stable from the ENEafter the snowfall, it can be transported upstream resulting inaccumulation at more westerly locations, such as the PE sta-tion.
For ablation events (SMB −, S 0), the dominant wind di-rection originates from the south and is characterised by lowwind speeds (Fig. 7b). The large-scale circulation analysisshows that there is a dominant occurrence of circulation pat-tern 5, as well as from circulation pattern 3 (Fig. 8b). Circula-tion pattern 5 only has a limited influence from low-pressuresystems. In order to understand these ablation events, theirtiming is investigated. A fraction of 46 % of the ablationevents take place within 24 h after a snowfall event. As statedin Sect. 3.3, snowfall events are mainly characterised by aENE flow (Fig. 4a). After these snowfall episodes, the cy-clone passes towards the east and winds tend to settle down(this evolution is depicted in Fig. 3). During calm conditions,a katabatic flow manifests, originating from the mountainridge and the Antarctic plateau (Parish and Cassano, 2003).These areas, south of the PE station, generally received less
The Cryosphere, 12, 1987–2003, 2018 www.the-cryosphere.net/12/1987/2018/
N. Souverijns et al.: Local surface mass balance of East Antarctica 1997
Figure 7. Wind speed and direction for the two events resulting in wind-induced accumulation (a) and ablation (b) without snowfall. N
denotes the total number of events during our observation period.
Figure 8. Frequency of occurrence of the circulation patterns depicted in Fig. 3 for wind-induced accumulation (a) and ablation (b) withoutsnowfall.
snowfall during the preceding snowfall event compared tothe areas north of the Sør Rondane Mountains (Fig. 9c andPalerme et al., 2014). They are therefore capable of pick-ing up fresh snow at the PE station, resulting in ablation(Scarchilli et al., 2010). Similar conclusions can be drawnfrom the analysis of the RACMO2.3 climate model output,showing large areas of snow removal at the edge of the moun-tain ridge (Fig. 9b) and were also identified in RACMO2.3 byLenaerts and van den Broeke (2012b).
An analysis of the wind roses indicates the occurrence ofaccumulation and ablation at very low wind speeds (Fig. 7).This points out that the time since the last snowfall event andthe availability of low-density fresh snow are of much higherimportance than the wind speed when generating blowingsnow, confirming the results of Gallée et al. (2001), Maheshet al. (2003), Scarchilli et al. (2010), Amory et al. (2017), andGossart et al. (2017). The time since the last snowfall event
might also be an important parameter that can explain thelarge variability in drifting snow wind speed thresholds andthreshold friction velocities (Li and Pomeroy, 1997; Trouvil-liez et al., 2014).
Based on the ceilometer, which is placed on a small ridgeon the roof of the station, and its blowing snow detection al-gorithm, the concurrence of blowing snow and accumulationor ablation during non-snowfall conditions is analysed. Forthese accumulation and ablation events, blowing snow is de-tected by the ceilometer in only 27 and 20 % of the cases. Allchanges in snow height due to accumulation and ablation re-sulted in 1125 cm measured by the AWS. When the ceilome-ter detected blowing snow, only changes of 274 cm in heightwere detected by the AWS, indicating that the blowing snowlayer only has a limited vertical extent and that the transportof snow is restricted to shallow layers close to the groundduring these type of events. Furthermore, it is noted that ab-
www.the-cryosphere.net/12/1987/2018/ The Cryosphere, 12, 1987–2003, 2018

1998 N. Souverijns et al.: Local surface mass balance of East Antarctica
Figure 9. Wind-driven snow accumulation and ablation during the two regimes at PE: (a) accumulation regime without snowfall (SMB +,S 0) and (b) ablation regime without snowfall (SMB −, S 0); (c) average amount of snowfall during the 24 h preceding both regimes. Thefields are based on RACMO2.3 simulation. The purple dot indicates the location of the PE station, while the contours denote the topographyin metres.
lation and accumulation events can significantly compensateeach other (the total accumulation on a yearly basis due tosnowfall and snowdrift is a lot smaller and has a large inter-annual variability ranging between 23 and 230 mm w.e. at thePE station).
Almost half of the accumulation and ablation events with-out snowfall occurred shortly after a snowfall event. Fur-thermore, wind speeds were found to be lower during theseevents compared to snowfall episodes. In both cases, freshsnow is easily transported towards or away from the station.During these types of events, the vertical extent of the blow-ing snow layer does not generally reach 30 m and most of
the transport of this freshly fallen snow including accumula-tion and ablation occurs in shallow layers at moderate windspeeds. As such, in order to get a good idea of accumula-tion and ablation during non-precipitating time periods andtheir influence on the local SMB, near-ground observationsof drifting and blowing snow are indispensable (Takahashi,1985; Nishimura and Nemoto, 2005; Bellot et al., 2011;Leonard and Maksym, 2011; Leonard et al., 2012; Nishimuraand Ishimaru, 2012; Barral et al., 2014; Libois et al., 2014;Trouvilliez et al., 2014).
The Cryosphere, 12, 1987–2003, 2018 www.the-cryosphere.net/12/1987/2018/
N. Souverijns et al.: Local surface mass balance of East Antarctica 1999
4 Conclusions
In this study, snowfall and associated surface mass balance(SMB) changes (accumulation and ablation) are investigatedwith regard to large-scale atmospheric circulation patterns atthe Princess Elisabeth (PE) station in East Antarctica. Usinga unique set of remote sensing instruments, such as a MicroRain Radar and an automatic weather station, which operatedconcurrently for a period of 37 months, statistical relation-ships between meteorology and snow erosion are obtained.
Snowfall is the most important source term of the localSMB and originates from oceanic air masses which are trans-ported towards the AIS by cyclones in the Antarctic cir-cumpolar trough. A back-trajectory analysis showed that airmasses originating from more northern areas take up higheramounts of moisture, which mainly precipitate at the coastalareas of the AIS. Because of high wind speeds associatedwith these events, displacement of freshly fallen snow takesplace in layers with a vertical extent of usually more than30 m as detected by the ceilometer at the PE station. Thedistinction between accumulation and ablation events duringsnowfall was correlated to the duration of the event (i.e. theduration of snowfall and the temporal cloud extent). Longerand larger events result in bigger areas with fresh snow de-position, allowing snow from synoptically upstream areas tobe transported towards the PE stations.
Wind-driven accumulation and ablation also occur with-out snowfall at the PE station. These accumulation eventshave a tendency to take place during similar types of cir-culation to snowfall events, however, they are characterisedby lower wind speeds. During most of these accumulationevents, snowfall took place upstream of the PE station, ENEof the station and to the north of the Sør Rondane mountainridge, within the last 24 h. Winds easily pick up the freshlyfallen snow from upstream areas and are capable of trans-porting it over tens of kilometres, leading to accumulationover large spatial areas potentially to higher elevations. Ab-lation events originate more often from southerly flows andalso occur shortly after snowfall events at the station. Kata-batic flow originating from the Antarctic plateau is dry, as itcontains fewer snow particles and removes the freshly fallensnow at the local site, resulting in ablation. Both these accu-mulation and ablation events take place at low wind speedsin blowing and drifting snow layers of limited vertical extentas detected by the ceilometer at the PE station.
The results presented in this study may hint at the transportof snow towards more inland locations, instead of the tradi-tional view of transport towards the coast by strong katabaticwinds. This mechanism is also seen in RACMO2.3, althoughthe absolute magnitude of accumulation of upstream snow inthe absence of snowfall at the PE station only accounts for35 % of the observed values. It is unclear whether this is dueto an underestimation of the mass transport in RACMO2.3,uncertainty in the observations or due to the potential effectof small-scale processes (e.g. sastrugi) in the observational
record. A network of blowing snow sensors would be neededto further address this issue.
Observations for this study were limited to one locationover the AIS. As such, results might depend on the local to-pographical and meteorological conditions. However, as themain conclusions are based on both an analysis of synop-tic and local meteorology, deductions of our work are alsodeemed to be valid at other coastal and escarpment areas ofthe AIS. Future work should expand the measurements of theindividual components of the local SMB to other sites overthe AIS in order to confirm the role of meteorological condi-tions at other areas, including their effect on the local SMB.
Data availability. Data from the instrumentation at the PrincessElisabeth station can be obtained from the database at http://www.aerocloud.be/database/ (Souverijns et al., 2018).
Supplement. The supplement related to this article is availableonline at: https://doi.org/10.5194/tc-12-1987-2018-supplement.
Competing interests. The authors declare that they have no conflictof interest.
Acknowledgements. Two anonymous reviewers are acknowledgedfor their comments that significantly improved the manuscript.We thank the logistic teams for executing the yearly maintenanceof our instruments at the Princess Elisabeth station and for theirhelp by installing and setting up the new AWS. We thank WimBoot, Carleen Reijmer, and Michiel van den Broeke (UtrechtUniversity, Institute for Marine and Atmospheric Research Utrecht)for the development of the automatic weather station, technicalsupport and raw data processing. Jan Lenaerts is acknowledged forsharing the data from the RACMO2.3 high-resolution simulation.This work was supported by the Belgian Science Policy Office(BELSPO; grant number BR/143/A2/AEROCLOUD) and theResearch Foundation Flanders (FWO; grant number G0C2215N).
Edited by: Robert ArthernReviewed by: two anonymous referees
References
Agosta, C., Favier, V., Genthon, C., Gallée, H., Krinner, G.,Lenaerts, J. T. M., and van den Broeke, M. R.: A 40-yearaccumulation dataset for Adelie Land, Antarctica and its ap-plication for model validation, Clim. Dynam., 38, 75–86,https://doi.org/10.1007/s00382-011-1103-4, 2012.
Agosta, C., Favier, V., Krinner, G., Gallée, H., Fettweis, X., andGenthon, C.: High-resolution modelling of the Antarctic sur-face mass balance, application for the twentieth, twenty firstand twenty second centuries, Clim. Dynam., 41, 3247–3260,https://doi.org/10.1007/s00382-013-1903-9, 2013.
www.the-cryosphere.net/12/1987/2018/ The Cryosphere, 12, 1987–2003, 2018
2000 N. Souverijns et al.: Local surface mass balance of East Antarctica
Amory, C., Trouvilliez, A., Gallée, H., Favier, V., Naaim-Bouvet,F., Genthon, C., Agosta, C., Piard, L., and Bellot, H.: Compar-ison between observed and simulated aeolian snow mass fluxesin Adélie Land, East Antarctica, The Cryosphere, 9, 1373–1383,https://doi.org/10.5194/tc-9-1373-2015, 2015.
Amory, C., Gallée, H., Naaim-Bouvet, F., Favier, V., Vignon, E.,Picard, G., Trouvilliez, A., Piard, L., Genthon, C., and Bel-lot, H.: Seasonal Variations in Drag Coefficient over a Sastrugi-Covered Snowfield in Coastal East Antarctica, Bound.-Lay. Me-teorol., 164, 107–133, https://doi.org/10.1007/s10546-017-0242-5, 2017.
Anderson, P.: A method for rescaling humidity sensorsat temperatures well below freezing, J. Atmos. Ocean.Tech., 11, 1388–1391, https://doi.org/10.1175/1520-0426(1994)011<1388:AMFRHS>2.0.CO;2, 1994.
Barral, H., Genthon, C., Trouvilliez, A., Brun, C., and Amory,C.: Blowing snow in coastal Adélie Land, Antarctica: threeatmospheric-moisture issues, The Cryosphere, 8, 1905–1919,https://doi.org/10.5194/tc-8-1905-2014, 2014.
Battaglia, A. and Delanoë, J.: Synergies and complementaritiesof Cloudsat-CALIPSO snow observations, J. Geophys. Res.-Atmos., 118, 721–731, https://doi.org/10.1029/2012JD018092,2013.
Beck, C. and Philipp, A.: Evaluation and comparison of circulationtype classifications for the European domain, Phys. Chem. Earth,35, 374–387, https://doi.org/10.1016/j.pce.2010.01.001, 2010.
Bellot, H., Trouvilliez, A., Naaim-Bouvet, F., Genthon,C., and Gallée, H.: Present weather-sensor tests formeasuring drifting snow, Ann. Glaciol., 52, 176–184,https://doi.org/10.3189/172756411797252356, 2011.
Bintanja, R. and Reijmer, C. H.: A simple parameterization forsnowdrift sublimation, J. Geophys. Res., 106, 31739–31748,https://doi.org/10.1029/2000JD000107, 2001.
Bliss, A. K., Cuffey, K. M., and Kavanaugh, J. L.: Sublimation andsurface energy budget of Taylor Glacier, Antarctica, J. Glaciol.,57, 684–696, https://doi.org/10.3189/002214311797409767,2011.
Bracegirdle, T. J. and Marshall, G. J.: The Reliability ofAntarctic Tropospheric Pressure and Temperature in theLatest Global Reanalyses, J. Climate, 25, 7138–7146,https://doi.org/10.1175/JCLI-D-11-00685.1, 2012.
Bromwich, D. H.: Snowfall in High Southern Latitudes, Rev. Geo-phys., 26, 149–168, 1988.
Bromwich, D. H., Guo, Z., Bai, L., and Chen, Q.-s.: Mod-eled Antarctic Precipitation. Part I: Spatial and Temporal Vari-ability, J. Climate, 17, 427–447, https://doi.org/10.1175/1520-0442(2004)017<0427:MAPPIS>2.0.CO;2, 2004.
Bromwich, D. H., Nicolas, J. P., and Monaghan, A. J.: An Assess-ment of Precipitation Changes over Antarctica and the SouthernOcean since 1989 in Contemporary Global Reanalyses, J. Cli-mate, 24, 4189–4209, https://doi.org/10.1175/2011JCLI4074.1,2011.
Casado, M., Pastor, M., and Doblas-Reyes, F.: Links between cir-culation types and precipitation over Spain, Phys. Chemi. Earth,35, 437–447, https://doi.org/10.1016/j.pce.2009.12.007, 2010.
Casella, D., Panegrossi, G., Sano, P., Marra, A. C., Diet-rich, S., Johnson, B. T., and Kulie, M. S.: Evaluationof the GPM-DPR snowfall detection capability: Com-
parison with CloudSat-CPR, Atmos. Res., 197, 64–75,https://doi.org/10.1016/j.atmosres.2017.06.018, 2017.
Das, I., Bell, R. E., Scambos, T. A., Wolovick, M., Creyts, T. T.,Studinger, M., Frearson, N., Nicolas, J. P., Lenaerts, J. T. M., andvan den Broeke, M. R.: Influence of persistent wind scour on thesurface mass balance of Antarctica, Nat. Geosci., 6, 367–371,https://doi.org/10.1038/ngeo1766, 2013.
Davis, C. H., Li, Y., McConnel, J. R., Frey, M. M., andHanna, E.: Snowfall-Driven Growth in East Antarctic Ice SheetMitigates Recent Sea-Level Rise, Science, 308, 1898–1901,https://doi.org/10.1126/science.1110662, 2005.
DeConto, R. M. and Pollard, D.: Contribution of Antarcticato past and future sea-level rise, Nature, 531, 591–597,https://doi.org/10.1038/nature17145, 2016.
Dee, D. P., Uppala, S. M., Simmons, A. J., Berrisford, P., Poli, P.,and Kobayashi, S.: The ERA-Interim reanalysis: configurationand performance of the data assimilation system, Q. J. Roy. Me-teor. Soc., 137, 553–597, https://doi.org/10.1002/qj.828, 2011.
Déry, S. J. and Yau, M. K.: Simulation of blowing snow in the Cana-dian Arctic using a double-moment model, Bound.-Lay. Me-teorol., 99, 297–316, https://doi.org/10.1023/A:1018965008049,2001.
Dürr, B. and Philipona, R.: Automatic cloud amountdetection by surface longwave downward radia-tion measurements, J. Geophys. Res., 109, D05201,https://doi.org/10.1029/2003JD004182, 2004.
Eisen, O., Frezzotti, M., Genthon, C., Isaksson, E., Magand, O.,van den Broeke, M. R., Dixon, D. A., Ekaykin, A., Holm-lund, P., Kameda, T., Karlöf, L., Kaspari, S., Lipenkov, V. Y.,Oerter, H., Takahashi, S., and Vaughan, D. G.: Ground-basedmeasurements of spatial and temporal variability of snow ac-cumulation in East Antarctica, Rev. Geophys., 46, RG2001,https://doi.org/10.1029/2006RG000218, 2008.
Favier, V., Agosta, C., Parouty, S., Durand, G., Delaygue,G., Gallée, H., Drouet, A.-S., Trouvilliez, A., and Krinner,G.: An updated and quality controlled surface mass bal-ance dataset for Antarctica, The Cryosphere, 7, 583–597,https://doi.org/10.5194/tc-7-583-2013, 2013.
Favier, V., Krinner, G., Amory, C., Gallée, H., Beaumet, J.,and Agosta, C.: Antarctica-Regional Climate and SurfaceMass Budget, Current Climate Change Reports, 3, 303–315,https://doi.org/10.1007/s40641-017-0072-z, 2017.
Frezzotti, M., Pourchet, M., Flora, O., Gandolfi, S., Gay, M.,Urbini, S., Vincent, C., Becagli, S., Gragnani, R., Propos-ito, M., Severi, M., Traversi, R., Udisti, R., and Fily, M.:Spatial and temporal variability of snow accumulation inEast Antarctica from traverse data, J. Glaciol., 51, 113–124,https://doi.org/10.3189/172756505781829502, 2005.
Gallée, H., Guyomarc’h, G., and Brun, E.: Impact of snow drift onthe Antarctic Ice Sheet surface mass balance: Possible sensitiv-ity to snow-surface properties, Bound.-Lay. Meteorol., 99, 1–19,https://doi.org/10.1023/A:1018776422809, 2001.
Gallée, H., Trouvilliez, A., Agosta, C., Genthon, C., Favier, V., andNaaim-Bouvet, F.: Transport of Snow by the Wind: A Compari-son Between Observations in Adélie Land, Antarctica, and Sim-ulations Made with the Regional Climate Model MAR, Bound.-Lay. Meteorol., 146, 133–147, https://doi.org/10.1007/s10546-012-9764-z, 2013.
The Cryosphere, 12, 1987–2003, 2018 www.the-cryosphere.net/12/1987/2018/
N. Souverijns et al.: Local surface mass balance of East Antarctica 2001
Genthon, C. and Krinner, G.: Antarctic surface massbalance and systematic biases in general circula-tion models, J. Geophys. Res., 106, 20653–20664,https://doi.org/10.1029/2001JD900136, 2001.
Genthon, C., Kaspari, S., and Mayewski, P. A.: Interannual variabil-ity of the surface mass balance of West Antarctica from ITASEcores and ERA40 reanalyses, 1958-2000, Clim. Dynam., 24,759–770, https://doi.org/10.1007/s00382-005-0019-2, 2005.
Gorodetskaya, I. V., van Lipzig, N. P. M., van den Broeke,M. R., Mangold, A., Boot, W., and Reijmer, C. H.: Me-teorological regimes and accumulation patterns at Utsteinen,Dronning Maud Land, East Antarctica: Analysis of two con-trasting years, J. Geophys. Res.-Atmos., 118, 1700–1715,https://doi.org/10.1002/jgrd.50177, 2013.
Gorodetskaya, I. V., Tsukernik, M., Claes, K., Ralph, M., Neff,W., and van Lipzig, N. P. M.: The role of atmospheric rivers inanomalous snow accumulation in East Antarctica, Geophys. Res.Lett., 16, 6199–6206, https://doi.org/10.1002/2014GL060881,2014.
Gorodetskaya, I. V., Kneifel, S., Maahn, M., Van Tricht, K., Thiery,W., Schween, J. H., Mangold, A., Crewell, S., and Van Lipzig,N. P. M.: Cloud and precipitation properties from ground-basedremote-sensing instruments in East Antarctica, The Cryosphere,9, 285–304, https://doi.org/10.5194/tc-9-285-2015, 2015.
Gossart, A., Souverijns, N., Gorodetskaya, I. V., Lhermitte, S.,Lenaerts, J. T. M., Schween, J. H., Mangold, A., Laffineur,Q., and van Lipzig, N. P. M.: Blowing snow detection fromground-based ceilometers: application to East Antarctica, TheCryosphere, 11, 2755–2772, https://doi.org/10.5194/tc-11-2755-2017, 2017.
Grazioli, J., Genthon, C., Boudevillain, B., Duran-Alarcon, C., DelGuasta, M., Madeleine, J.-B., and Berne, A.: Measurements ofprecipitation in Dumont d’Urville, Adélie Land, East Antarctica,The Cryosphere, 11, 1797–1811, https://doi.org/10.5194/tc-11-1797-2017, 2017a.
Grazioli, J., Madeleine, J.-B., Gallée, H., Forbes, R. M., Gen-thon, C., Krinner, G., and Berne, A.: Katabatic winds di-minish precipitation contribution to the Antarctic ice massbalance, P. Natl. Acad. Sci. USA, 114, 10858–10863,https://doi.org/10.1073/pnas.1707633114, 2017b.
Gregory, J. M. and Huybrechts, P.: Ice-sheet contributions to fu-ture sea-level change, Philos. T. Roy. Soc. A, 364, 1709–1731,https://doi.org/10.1098/rsta.2006.1796, 2006.
Groot Zwaaftink, C. D., Cagnati, A., Crepaz, A., Fierz, C., Ma-celloni, G., Valt, M., and Lehning, M.: Event-driven deposi-tion of snow on the Antarctic Plateau: analyzing field mea-surements with SNOWPACK, The Cryosphere, 7, 333–347,https://doi.org/10.5194/tc-7-333-2013, 2013.
Hirasawa, N., Nakamura, H., Motoyama, H., Hayashi, M., and Ya-manouchi, T.: The role of synoptic-scale features and advectionin prolonged warming and generation of different forms of pre-cipitation at Dome Fuji station, Antarctica, following a promi-nent blocking event, J. Geophys. Res.-Atmos., 118, 6916–6928,https://doi.org/10.1002/jgrd.50532, 2013.
Huth, R., Beck, C., Philipp, A., Demuzere, M., Ustrnul, Z.,Cahynová, M., Kyselý, J., and Tveito, O. E.: Classifica-tions of atmospheric circulation patterns: recent advancesand applications, Ann. NY Acad. Sci., 1146, 105–152,https://doi.org/10.1196/annals.1446.019, 2008.
King, J. C. and Turner, J.: Antarctic meteorology and climatology,Cambridge University Press, 1997.
King, J. C., Anderson, P. S., and Mann, G.: The seasonal cy-cle of sublimation at Halley, Antarctica, J. Glaciol., 47, 1–8,https://doi.org/10.3189/172756501781832548, 2001.
Klugmann, D., Heinsohn, K., and Kirtzel, H.-J.: A low cost 24GHz FM-CW Doppler radar rain profiler, Contributions to At-mospheric Physics, 69, 247–253, 1996.
Kneifel, S., Maahn, M., Peters, G., and Simmer, C.: Obser-vation of snowfall with a low-power FM-CW K-band radar(Micro Rain Radar), Meteorol. Atmos. Phys., 113, 75–87,https://doi.org/10.1007/s00703-011-0142-z, 2011.
König-Langlo, G. and Loose, B.: The Meteorological Observa-tory at Neumayer Stations (GvN and NM-II) Antarctica, Polar-forschung, 76, 25–38, 2006.
Lenaerts, J. T. M. and van den Broeke, M. R.: Modeling drift-ing snow in Antarctica with a regional climate model: 1. Meth-ods and model evaluation, J. Geophys. Res., 117, D05108,https://doi.org/10.1029/2011JD016145, 2012a.
Lenaerts, J. T. M. and van den Broeke, M. R.: Mod-eling drifting snow in Antarctica with a regional cli-mate model: 2. Results, J. Geophys. Res.h, 117, D05109,https://doi.org/10.1029/2010JD015419, 2012b.
Lenaerts, J. T. M., Brown, J., van den Broeke, M. R., Matsuoka,K., Drews, R., Callens, D., Philippe, M., Gorodetskaya, I. V.,van Meijgaard, E., Reijmer, C. H., Pattyn, F., and van Lipzig,N. P. M.: High variability of climate and surface mass bal-ance induced by Antarctic ice rises, J. Glaciol., 60, 1126–1134,https://doi.org/10.3189/2014JoG14J040, 2014.
Lenaerts, J. T. M., Vizcaino, M., Fyke, J., van Kampenhout, L.,and van den Broeke, M. R.: Present-day and future Antarc-tic ice sheet climate and surface mass balance in the Com-munity Earth System Model, Clim. Dynam., 47, 1367–1381,https://doi.org/10.1007/s00382-015-2907-4, 2016.
Lenaerts, J. T. M., Lhermitte, S., Drews, R., Ligtenberg, S. R. M.,Berger, S., Helm, V., Smeets, C. J. P. P., van den Broeke, M. R.,van de Berg, W. J., van Meijgaard, E., Eijkelboom, M., Eisen, O.,and Pattyn, F.: Meltwater produced by wind-albedo interactionstored in an East Antarctic ice shelf, Nat. Clim. Change, 7, 58–62, https://doi.org/10.1038/nclimate3180, 2017.
Leonard, K. C. and Maksym, T.: The importance of wind-blown snow redistribution to snow accumulation onBellingshausen Sea ice, Ann. Glaciol., 52, 271–278,https://doi.org/10.3189/172756411795931651, 2011.
Leonard, K. C., Tremblay, L. B., Thom, J. E., and MacAyeal, D. R.:Drifting snow threshold measurements near McMurdo station,Antarctica: A sensor comparison study, Cold Reg. Sci. Technol.,70, 71–80, https://doi.org/10.1016/j.coldregions.2011.08.001,2012.
Li, L. and Pomeroy, J. W.: Estimates of Threshold WindSpeeds for Snow Transport Using Meteorological Data, J.Appl. Meteorol., 36, 205–213, https://doi.org/10.1175/1520-0450(1997)036<0205:EOTWSF>2.0.CO;2, 1997.
Libois, Q., Picard, G., Arnaud, L., Morin, S., and Brun, E.: Model-ing the impact of snow drift on the decameter-scale variability ofsnow properties on the Antarctic Plateau, J. Geophys. Res., 119,11662–11681, https://doi.org/10.1002/2014JD022361, 2014.
Ligtenberg, S. R. M., van de Berg, W. J., van den Broeke, M. R.,Rae, J. G. L., and van Meijgaard, E.: Future surface mass balance
www.the-cryosphere.net/12/1987/2018/ The Cryosphere, 12, 1987–2003, 2018
2002 N. Souverijns et al.: Local surface mass balance of East Antarctica
of the Antarctic ice sheet and its influence on sea level change,simulated by a regional atmospheric climate model, Clim. Dy-nam., 41, 867–884, https://doi.org/10.1007/s00382-013-1749-1,2013.
Maahn, M. and Kollias, P.: Improved Micro Rain Radar snow mea-surements using Doppler spectra post-processing, Atmos. Meas.Tech., 5, 2661–2673, https://doi.org/10.5194/amt-5-2661-2012,2012.
Maahn, M., Burgard, C., Crewell, S., Gorodetskaya, I. V., Kneifel,S., Lhermitte, S., Van Tricht, K., and van Lipzig, N. P. M.: Howdoes the spaceborne radar blind zone affect derived surfacesnowfall statistics in polar regions?, J. Geophys. Res.-Atmos.,119, 13604–13620, https://doi.org/10.1002/2014JD022079,2014.
Magand, O., Genthon, C., Fily, M., Krinner, G., Picard, G., Frez-zotti, M., and Ekaykin, A. A.: An up-to-date quality-controlledsurface mass balance data set for the 90◦–180◦ E Antarcticasector and 1950–2005 period, J. Geophys. Res., 112, D12106,https://doi.org/10.1029/2006JD007691, 2007.
Mahesh, A., Eager, R., Campbell, J. R., and Spinhirne, J. D.: Ob-servations of blowing snow at the South Pole, J. Geophys. Res.,108, 4707, https://doi.org/10.1029/2002JD003327, 2003.
Marty, C. and Philipona, R.: The Clear-Sky Index to separate Clear-Sky from Cloudy-Sky Situations in Climate Research, Geophys.Res. Lett., 27, 2649–2652, 2000.
Matrosov, S. Y., Shupe, M. D., and Djalalova, I. V.:Snowfall retrievals using millimeter-wavelength cloudradars, J. Appl. Meteorol. Clim., 47, 769–777,https://doi.org/10.1175/2007JAMC1768.1, 2008.
Newman, A. J., Kucera, P. A., and Bliven, L. F.: Presenting theSnowflake Video Imager (SVI), J. Atmos. Ocean. Tech., 26, 167–179, https://doi.org/10.1175/2008JTECHA1148.1, 2009.
Nishimura, K. and Ishimaru, T.: Development of an automaticblowing-snow station, Cold Reg. Sci. Technol., 82, 30–35,https://doi.org/10.1016/j.coldregions.2012.05.005, 2012.
Nishimura, K. and Nemoto, M.: Blowing snow at Mizuho sta-tion, Antarctica, Philos. T. Roy. Soc. A, 363, 1647–1662,https://doi.org/10.1098/rsta.2005.1599, 2005.
Palerme, C., Kay, J. E., Genthon, C., L’Ecuyer, T., Wood, N. B., andClaud, C.: How much snow falls on the Antarctic ice sheet?, TheCryosphere, 8, 1577–1587, https://doi.org/10.5194/tc-8-1577-2014, 2014.
Palm, S. P., Yang, Y., Spinhirne, J. D., and Marshak, A.:Satellite remote sensing of blowing snow propertiesover Antarctica, J. Geophys. Res.-Atmos., 116, D16123,https://doi.org/10.1029/2011JD015828, 2011.
Palm, S. P., Kayetha, V., Yang, Y., and Pauly, R.: Blowingsnow sublimation and transport over Antarctica from 11 yearsof CALIPSO observations, The Cryosphere, 11, 2555–2569,https://doi.org/10.5194/tc-11-2555-2017, 2017.
Parish, T. R. and Cassano, J. J.: The Role of KatabaticWinds on the Antarctic Surface Wind Regime, Mon.Weather Rev., 131, 317–333, https://doi.org/10.1175/1520-0493(2003)131<0317:TROKWO>2.0.CO;2, 2003.
Pattyn, F., Matsuoka, K., and Berte, J.: Glacio-meteorologicalconditions in the vicinity of the Belgian Princess Elis-abeth Station, Antarctica, Antarct. Sci., 22, 79–85,https://doi.org/10.1017/S0954102009990344, 2010.
Peters, G., Fischer, B., and Andersson, T.: Rain observations witha vertically looking Micro Rain Radar (MRR), Boreal Environ.Res., 7, 353–362, 2002.
Philipp, A., Della-Marta, P. M., Jacobeit, J., Fereday, D. R., Jones,P. D., Moberg, A., and Wanner, H.: Long-Term Variability ofDaily North Atlantic–European Pressure Patterns since 1850Classified by Simulated Annealing Clustering, J. Climate, 20,4065–4095, https://doi.org/10.1175/JCLI4175.1, 2007.
Philipp, A., Bartholy, J., Beck, C., Erpicum, M., Esteban, P.,Fettweis, X., Huth, R., James, P., Jourdain, S., Kreienkamp,F., Krennert, T., Lykoudis, S., Michalides, S. C., Pianko-Kluczynska, K., Post, P., Rasilla Álvarez, D., Schiemann, R.,Spekat, A., and Tymvios, F. S.: Cost733cat – A database ofweather and circulation type classifications, Phys. Chem. Earth,35, 360–373, https://doi.org/10.1016/j.pce.2009.12.010, 2010.
Previdi, M. and Polvani, L. M.: Anthropogenic impact on Antarc-tic surface mass balance, currently masked by natural variabil-ity, to emerge by mid-century, Environ. Res. Lett., 11, 094001,https://doi.org/10.1088/1748-9326/11/9/094001, 2016.
Rignot, E., Velicogna, I., van den Broeke, M. R., Monaghan, A.,and Lenaerts, J. T. M.: Acceleration of the contribution of theGreenland and Antarctic ice sheets to sea level rise, Geophys.Res. Lett., 38, L05503, https://doi.org/10.1029/2011GL046583,2011.
Rotschky, G., Holmlund, P., Isaksson, E., Mulvaney, R., Oerter, H.,van den Broeke, M. R., and Winther, J. G.: A new surface ac-cumulation map for western Dronning Maud Land, Antarctica,from interpolation of point measurements, J. Glaciol., 53, 385–398, https://doi.org/10.3189/002214307783258459, 2007.
Rousseeuw, P. J.: Silhouettes: A graphical aid to the interpretationand validation of cluster analysis, J. Comput. Appl. Math., 20,53–65, https://doi.org/10.1016/0377-0427(87)90125-7, 1987.
Scarchilli, C., Frezzotti, M., Grigioni, P., De Silvestri, L., Ag-noletto, L., and Dolci, S.: Extraordinary blowing snow trans-port events in East Antarctica, Clim. Dynam., 34, 1195–1206,https://doi.org/10.1007/s00382-009-0601-0, 2010.
Schlosser, E., Manning, K. W., Powers, J. G., Duda, M. G., Birn-baum, G., and Fujita, K.: Characteristics of high-precipitationevents in Dronning Maud Land, Antarctica, J. Geophys. Res.,115, D14107, https://doi.org/10.1029/2009JD013410, 2010.
Shepherd, A., Ivins, E. R., Geruo, A., Barletta, V. R., Bentley, M. J.,Bettadpur, S., Briggs, K. H., Bromwich, D. H., Forsberg, R.,Galin, N., Horwath, M., Jacobs, S., Joughin, I., King, M. A.,Lenaerts, J. T. M., Li, J., Ligtenberg, S. R. M., Luckman, A.,Luthcke, S. B., McMillan, M., Meister, R., Milne, G., Mouginot,J., Muir, A., Nicolas, J. P., Paden, J., Payne, A. J., Pritchard, H.,Rignot, E., Rott, H., Sorensen, L. S., Scambos, T. A., Scheuchl,B., Schrama, E. J. O., Smith, B., Sundal, A. V., van Angelen,J. H., van de Berg, W. J., van den Broeke, M. R., Vaughan, D. G.,Velicogna, I., Wahr, J., Whitehouse, P. L., Wingham, D. J., Yi,D., Young, D., and Zwally, H. J.: A Reconciled Estimate of Ice-Sheet Mass Balance, Science, 338, 1183–1189, 2012.
Simmonds, I., Keay, K., and Lim, E.-P.: Synoptic Ac-tivity in the Seas around Antarctica, Mon. WeatherRev., 131, 272–288, https://doi.org/10.1175/1520-0493(2003)131<0272:SAITSA>2.0.CO;2, 2003.
Souverijns, N., Thiery, W., Demuzere, M., and Van Lipzig, N.P. M.: Drivers of future changes in East African precipitation,
The Cryosphere, 12, 1987–2003, 2018 www.the-cryosphere.net/12/1987/2018/
N. Souverijns et al.: Local surface mass balance of East Antarctica 2003
Environ. Res. Lett., 11, 114011, https://doi.org/10.1088/1748-9326/11/11/114011, 2016.
Souverijns, N., Gossart, A., Lhermitte, S., Gorodetskaya, I. V.,Kneifel, S., Maahn, M., Bliven, F. L., and van Lipzig, N.P. M.: Estimating radar reflectivity – Snowfall rate relation-ships and their uncertainties over Antarctica by combining dis-drometer and radar observations, Atmos. Res., 196, 211–223,https://doi.org/10.1016/j.atmosres.2017.06.001, 2017.
Souverijns, N., Gossart, A., Gorodetskaya, I. V., and van Lipzig, N.P. M.: Aerosol, Cloud and Precipitation database at the PrincessElisabeth station, Dronning Maud Land, Antarctica, available at:http://www.aerocloud.be/database/, last access: 8 June 2018.
Stohl, A. and Seibert, P.: Accuracy of trajectories asdetermined from the conservation of meteorologi-cal tracers, Q. J. Roy. Meteor. Soc., 124, 1465–1484,https://doi.org/10.1002/qj.49712454907, 1998.
Stohl, A., Wotawa, G., Seibert, P., and Kromp-Kolb, H.:Interpolation Errors in Wind Fields as a Function ofSpatial and Temporal Resolution and Their Impact onDifferent Types of Kinematic Trajectories, J. Appl. Me-teorol., 34, 2149–2165, https://doi.org/10.1175/1520-0450(1995)034<2149:IEIWFA>2.0.CO;2, 1995.
Takahashi, S.: Characteristics of drifting snow atMizuho Station, Antarctica, Ann. Glaciol., 6, 71–75,https://doi.org/10.1017/S0260305500010028, 1985.
Thiery, W., Gorodetskaya, I. V., Bintanja, R., Van Lipzig, N.P. M., Van den Broeke, M. R., Reijmer, C. H., and KuipersMunneke, P.: Surface and snowdrift sublimation at Princess Elis-abeth station, East Antarctica, The Cryosphere, 6, 841–857,https://doi.org/10.5194/tc-6-841-2012, 2012.
Thomas, E. R., van Wessem, J. M., Roberts, J., Isaksson, E.,Schlosser, E., Fudge, T. J., Vallelonga, P., Medley, B., Lenaerts,J., Bertler, N., van den Broeke, M. R., Dixon, D. A., Frezzotti,M., Stenni, B., Curran, M., and Ekaykin, A. A.: Regional Antarc-tic snow accumulation over the past 1000 years, Clim. Past, 13,1491–1513, https://doi.org/10.5194/cp-13-1491-2017, 2017.
Trouvilliez, A., Naaim-Bouvet, F., Genthon, C., Piard, L., Favier,V., Bellot, H., Agosta, C., Palerme, C., Amory, C., and Gal-lée, H.: A novel experimental study of aeolian snow transportin Adelie Land (Antarctica), Cold Reg. Sci. Technol., 108, 125–138, https://doi.org/10.1016/j.coldregions.2014.09.005, 2014.
van den Broeke, M. R. and van Lipzig, N. P. M.: Fac-tors Controlling the Near-Surface Wind Field in Antarctica,Mon. Weather Rev., 131, 733–743, https://doi.org/10.1175/1520-0493(2003)131<0733:FCTNSW>2.0.CO;2, 2003.
van den Broeke, M. R., Reijmer, C. H., and Van de Wal, R. S. W.:A study of the surface mass balance in Dronning Maud Land,Antarctica, using automatic weather stations, J. Glaciol., 50,565–582, https://doi.org/10.3189/172756504781829756, 2004.
van Lipzig, N. P. M., van Meijgaard, E., and Oerlemans, J.: Thespatial and temporal variability of the surface mass balance inAntarctica: results from a regional atmospheric climate model,Int. J. Climatol., 22, 1197–1217, https://doi.org/10.1002/joc.798,2002.
van Lipzig, N. P. M., King, J. C., Lachlan-Cope, T. A.,and van den Broeke, M. R.: Precipitation, sublimation, andsnow drift in the Antarctic Peninsula region from a re-gional atmospheric model, J. Geophys. Res., 109, D24106,https://doi.org/10.1029/2004JD004701, 2004.
Van Tricht, K., Gorodetskaya, I. V., Lhermitte, S., Turner, D. D.,Schween, J. H., and Van Lipzig, N. P. M.: An improved algorithmfor polar cloud-base detection by ceilometer over the ice sheets,Atmos. Meas. Tech., 7, 1153–1167, https://doi.org/10.5194/amt-7-1153-2014, 2014.
van Wessem, J. M., Reijmer, C. H., Lenaerts, J. T. M., van deBerg, W. J., van den Broeke, M. R., and van Meijgaard, E.: Up-dated cloud physics in a regional atmospheric climate model im-proves the modelled surface energy balance of Antarctica, TheCryosphere, 8, 125–135, https://doi.org/10.5194/tc-8-125-2014,2014.
Vaughan, D., Comiso, J., Allison, I., Carrasco, J., Kaser, G., Kwok,R., Mote, P., Murray, T., Paul, F., Ren, J., Rignot, E., Solom-ina, O., Steffen, K., and Zhang, T.: Observations: Cryosphere,in: Climate Change 2013: The Physical Science Basis, Contribu-tion of Working Group I to the Fifth Assessment Report of theIntergovernmental Panel on Climate Change, edited by: Stocker,T., Qin, D., Plattner, G.-K., Tignor, M., Allen, S., Boschung, J.,Nauels, A., Xia, Y., Bex, V., and Midgley, P., Cambridge Uni-versity Press, Cambridge, United Kingdom and New York, NY,USA, https://doi.org/10.1017/CBO9781107415324.012, 317–382, 2013.
Vaughan, D. G., Bamber, J. L., Giovinetto, M., Rus-sell, J., and Cooper, A. P. R.: Reassessment ofNet Surface Mass Balance in Antarctica, J. Cli-mate, 12, 933–946, https://doi.org/10.1175/1520-0442(1999)012<0933:RONSMB>2.0.CO;2, 1999.
Wang, Y., Ding, M., van Wessem, J. M., Schlosser, E., Altnau,S., van den Broeke, M. R., Lenaerts, J. T., Thomas, E. R.,Isaksson, E., Wang, J., and Sun, W.: A comparison of Antarc-tic ice sheet surface mass balance from atmospheric climatemodels and in situ observations, J. Climate, 29, 5317–5337,https://doi.org/10.1175/JCLI-D-15-0642.1, 2016.
Wiegner, M., Madonna, F., Binietoglou, I., Forkel, R., Gasteiger, J.,Geiß, A., Pappalardo, G., Schäfer, K., and Thomas, W.: Whatis the benefit of ceilometers for aerosol remote sensing? Ananswer from EARLINET, Atmos. Meas. Tech., 7, 1979–1997,https://doi.org/10.5194/amt-7-1979-2014, 2014.
Wood, N. B.: Estimation of snow microphysical properties with ap-plication to millimeter-wavelength radar retrievals for snowfallrate, PhD thesis, Colorado State University, Colorado, availableat: http://hdl.handle.net/10217/48170 (last access: 8 June 2018),2011.
www.the-cryosphere.net/12/1987/2018/ The Cryosphere, 12, 1987–2003, 2018