Embed Size (px)
Citation preview

Ann Reg Sci (2010) 45:87–108DOI 10.1007/s00168-009-0292-9
SPECIAL ISSUE PAPER
How does industry specialization affectthe efficiency of regional innovation systems?
Michael Fritsch · Viktor Slavtchev
Received: 23 January 2009 / Accepted: 23 January 2009 / Published online: 22 February 2009© The Author(s) 2009. This article is published with open access at Springerlink.com
Abstract This study analyzes the relationship between the specialization of a regionin certain industries and the efficiency of the region in generating new knowledge.The efficiency measure is constructed by relating regional R&D input and output. Aninversely u-shaped relationship is found between regional specialization and R&Defficiency, indicating the presence of externalities of both Marshall and Jacobs’ type.Further factors influencing efficiency are externalities resulting from high R&D inten-sity of the local private sector as well as knowledge from local public research insti-tutions. The impact of both the specialization and the additional factors is, however,different for regions at different efficiency levels.
JEL Classification O31 · O18 · R12
1 Introduction
The supposition that agglomerations are well suited for innovation activities has a longtradition in economics and economic geography. The idea behind this conjecture is
M. Fritsch (B)School of Economics and Business Administration,Friedrich Schiller University Jena, Carl-Zeiss-Str. 3, 07743 Jena, Germanye-mail: [email protected]
M. FritschGerman Institute of Economic Research (DIW-Berlin), 10108 Berlin, Germany
M. Fritsch · V. SlavtchevMax Planck Institute of Economics, Kahlaische Strasse 10, 07745 Jena, Germany
V. Slavtcheve-mail: [email protected]
123
88 M. Fritsch, V. Slavtchev
rather simple. First, innovative activities may be stimulated by the easy availability ofinputs that is typical for agglomerated regions. Second, innovating firms are not iso-lated, self-sustained entities but rather are highly linked to their environment. Accord-ingly, innovative processes are characterized by pronounced degrees of labor divisionand knowledge flows so that spatial proximity to other innovating actors is important.Therefore, a certain degree of agglomeration or clustering of innovators within a par-ticular area should be conducive to innovation activities (Porter 1998). In particular,there are two prominent hypotheses that pertain to the industry structure of the regionalenvironment. One of these hypotheses states that the geographic concentration, i.e.,the co-localization of firms that belong to the same industry or to related industries isconducive to innovation. Another hypothesis assumes that it is the diversity of indus-tries and activities in a region, not the concentration in a certain industry that has astimulating effect.
In this study, we test these two hypotheses by linking industry specialization of aregion to its innovative performance. The next two sections elaborate on the theoret-ical background of the two hypotheses (Sect. 2) and review the empirical evidenceattained thus far (Sect. 3). Section 4 introduces our concept of efficiency of a region ingenerating new knowledge, and Sect. 5 deals with data and measurement issues. Wethen give an overview on the efficiency of German regions (Sect. 6) and investigatethe role of industry specialization (Sect. 7). Section 8 concludes.
2 Why should industry specialization of a region stimulate or impedeinnovation?
Innovation activity is characterized by interactions and flows of knowledge betweenactors and institutions. It can be regarded as a collective learning process taking placein a system of interconnected actors. The efficiency of the system may, therefore, beinfluenced by both the availability of actors as well as by the intensity of interac-tion and the respective knowledge flows. Interactions of a particular kind can occurbetween all the elements (or actors) constituting the system such as innovating privatefirms, public research institutes, suppliers of innovative inputs and services as well aspublic policy. For instance, the importance of backward and forward linkages has beenpointed out by Kline (1985) and Kline and Rosenberg (1986), while Hippel (1986)and Urban and Hippel (1988) have referred particularly to the importance of leadusers for inducing innovation. Hence, the density and industrial composition of theregional actors, the accessibility of the region as well as the technological, industrial,and institutional infrastructure may play an important role. Accordingly, differencesin the socio-economic conditions that shape the creation of knowledge may lead todiverging innovative performance across regions (Cooke et al. 1997). Moreover, theinteractions between the different elements of a regional innovation system (RIS) gen-erate partly self-enforcing systemic effects that may result in region specific knowledgeas well as in specific technologies and methods of problem solving (Gertler 2003),which can be expected to affect the workability of the system (Leydesdorff and Fritsch2006).
123

How does industry specialization affect the efficiency of regional innovation systems? 89
The specialization of a certain region in particular industries, typically measured bythe co-location of a larger number of firms operating in similar or related technologicalfields is believed to be conducive to innovation activities of these firms since:
• the aggregate demand of a relatively large amount of firms of an industry mayresult in a pool of regional workforce with certain industry-specific skills that canbe utilized by all firms belonging to that particular industry and located in theregion (Marshall 1890; Ellison and Glaeser 1999);
• this aggregate demand of the regional firms can also induce a rich regional supplyof other relevant inputs such as specialized business services, financial institutionsor certain kinds of infrastructure (Bartelsman et al. 1994);
• the industry specialization of a region may stimulate intensive knowledge flowsbetween the firms which are sharing the same technological base (Mowery et al.1998; Beaudry and Breschi 2003);
• geographically bounded knowledge flows may be conductive for local collectivelearning processes (Lawson and Lorenz 1999; Maskell and Malmberg 1999).
These benefits of specialization within a certain industry are external to the firmbelonging to that industry but remain largely internal to the particular region. Sucheffects that result from the specialization of regional economic activities in the sameindustry are labeled Marshall-Arrow-Romer externalities1 (MAR externalities)according to the authors who have made this concept popular (Glaeser et al. 1992).
However, the concentration of firms of the same industry in a region can also bedisadvantageous if it leads to lock-in effects. Such lock-in effects may occur if the spe-cialization of the regional knowledge and resources deter the emergence and evolutionof other fields of innovation (Grabher 1993). In particular, narrow technological spe-cialization may hamper the creation of novel knowledge. As argued by Jacobs (1969),many ingenious ideas are born in the exchange process that occurs between differentfields of knowledge. This means that diversity may lead to advantages for innovationactivity which are comprised of different, but complementary technological fields.Hence, it may be the industrial variety in a region that is conducive to innovationactivity. Such effects of industrial variety are also labeled Jacobs’ externalities andare supposed to be external to the firms and industries but internal to the respectivegeographical location. Moreover, as pointed out by Jacobs (1969), these effects can beexpected to be greater in densely populated regions. Therefore, regions with diversekinds of activities and a high degree of agglomeration, particularly cities, may have acomparative advantage over less densely populated areas which are usually character-ized by a lesser variety of actors, institutions, and industries. Henderson (1997) showsfor the USA that although a number of certain industries tend to be concentrated inagglomerations and large cities, these locations still remain more diversified.
3 Empirical evidence
The answer to the question if specialization or diversity in a region is conducive toinnovation activity is still largely unclear. For example, Glaeser et al. (1992) found
1 Based on Marshall (1890), Arrow (1962), and Romer (1986).
123
90 M. Fritsch, V. Slavtchev
that diversity rather than regional specialization has a positive impact on employ-ment growth in US-American cities. The study was, however, not directly linked toinnovative activities. Feldman and Audretsch (1999) analyzed the effect of industryspecialization on innovative output on the basis of innovation counts, which wereattributed to four-digit SIC industries at the city level. The authors found that inno-vative output of an industry tends to be lower in cities which are specialized in thatparticular industry. This result supports the idea that diversity rather than specializationplays a major role. In other studies for the USA, Audretsch and Feldman (1996a,b)found that the geographical concentration of production is not a sufficient determinantfor explaining the geographical concentration of innovative output. Obviously, Jacobs’thesis seems to hold for the US and can, according to Duranton and Puga (2000), beregarded as a stylized fact.
Many of the respective studies for European regions explicitly tested for both typesof externalities. Paci and Usai (2000a) provided clear evidence for a significantlypositive relationship between industry specialization and innovative output at the levelof European NUTS-1 regions. The authors conclude that innovations occur in loca-tions with pronounced manufacturing activities. However, there are typically a numberof different knowledge sources (e.g., universities and other public R&D laboratories)and other supporting facilities in such locations that are not included in their analysis.In the case of Italy, Paci and Usai (1999, 2000b) found evidence for both Jacobs’ exter-nalities as well as MAR externalities. With respect to the latter, the authors concludethat innovative activities in a certain industry, as measured by the number of patents,tend to be higher in geographic locations which are specialized in that particular indus-try. In a more recent study, Greunz (2004) tested the relationship between industryspecialization and the number of patents at the level of European NUTS-2 regionsand confirms these results. There is also some evidence from other European coun-tries. For the Netherlands, van Oort (2002) and Ouwersloot and Rietveld (2000) foundpositive relationship between regional diversification and innovation in manufactur-ing industries. Also for the Netherlands, van der Panne (2004) identifies a positiverelationship between regional specialization and the probability of firms to announcea new product, while diversification was insignificant. For Sweden, Andersson et al.(2005) conclude that there is a negative relationship between regional diversity andthe innovative performance of firms. Also studies at the firm level provide ambiguousevidence (Baptista and Swann 1998; Beaudry and Breschi 2003).
Overall, previous analyses do not provide an unambiguous answer to the questionwhether industry specialization or diversity in a region stimulates innovation activi-ties. In contrast to previous studies that focus on the impact of MAR- and Jacobs’-externalities on the number of innovations or patents, we use the efficiency of regions ingenerating new knowledge as a performance indicator. Moreover, our analysis focusesnot only on the role of specialization or diversity, but it also accounts for other keydeterminants of the efficiency of RIS.
4 Assessing the efficiency of RIS
The term efficiency is used in a variety of ways. Our understanding of the effi-ciency of RIS corresponds to the concept of technical efficiency as introduced by
123
How does industry specialization affect the efficiency of regional innovation systems? 91
Farrell (1957). Technical efficiency is defined as the generation of a maximum outputfrom a given amount of resources. A firm is regarded as being technically inefficientif it fails to obtain the possible maximum output. Reasons for technical inefficiencycan be manifold and comprise all kinds of mismanagement such as inappropriatework organization and improper use of technology (Fritsch and Mallok 2002), bottle-necks in regard to certain inputs as well as X-inefficiency as exposed by Leibenstein(1966) seminal work. Applying this definition to a regional concept means that aregion is technically efficient if it is able to produce a possible maximum of innova-tive output from a given amount of innovative input. Accordingly, the inefficiency ofa region results from the failure to meet the best practice of conducting innovationactivity.
We assume that inventions do not come out of thin air but result predominantlyfrom systematic R&D efforts, i.e.,
R&D output = f (R&D input). (1)
Adopting the Cobb-Douglas form of a production function (Griliches 1979; Jaffe1989), the basic relationship between regional R&D output and input can be writ-ten as
R&D outputr = Ar × R&D inputβrr , (2)
where the term A represents a constant factor, β denotes the output elasticity of theinput to the R&D process and r is a regional index.
The output of the regional R&D process may differ because of two reasons: theoutput elasticity of R&D input, βr , and the constant term, Ar . For example, an increasein the quality of inputs to the R&D process or more pronounced spillovers from theR&D activities of other actors in the region may lead to a rising output elasticityof R&D. Differences between regions in regard to the constant term indicate higherinnovative output at any level of input. Such differences in the constant term may beexplained by all kinds of characteristics of a region that influence average productivityof R&D input but do not necessarily affect marginal productivity. Since, in practice,we are only able to assess the relevant knowledge stock rather incompletely, differ-ences in regard to the constant term may also reflect a misspecification or incompletemeasurement of the input variable. We, therefore, restrict ourselves here to the assess-ment based on the marginal productivity of R&D input. Analyses of the two measuresshow that they lead to a quite similar assessment of the innovative performance ofregions (Fritsch and Slavtchev 2006).2 Based on the estimates of the output elastic-ity of R&D input in each region, the efficiency Er of the region r is then calculatedas
Er =(β̂r /maxβ̂r
)× 100 [%]. (3)
2 See Fritsch and Slavtchev (2009a) for an alternative approach.
123
92 M. Fritsch, V. Slavtchev
According to this approach, at least one region will meet the benchmark value and theremaining regions will have efficiency values between 0 and 100% of this benchmarkvalue.3
5 Data and measurement issues
In this study, we use the number of disclosed corporate patent applications as an indi-cator of the innovative output of regions. The patent applications are assigned to themain residence of inventors. Information on the yearly number of disclosed patentapplications is available for the 1995–2000 period from Greif and Schmiedl (2002).A patent application indicates that an invention has been made which is expected tohave some economic value. However, using patents as an indicator of new knowledgehas some shortcomings (Brouwer and Kleinknecht 1996; Acs et al. 2002; Griliches1990). On the one hand, patents may underestimate the output of R&D activity forseveral reasons. One of these reasons is that the results of basic research cannot bepatented in Germany. Moreover, firms may not file all of their inventions for patent-ing or, in some cases, do not patent at all (Cohen et al. 2000). In this context, it iswell known that firms tend to patent product innovations rather than process innova-tions. On the other hand, the actual R&D output may also be overestimated on thebasis of patent data in the event that the firms file blocking patents, which are typi-cally applied around one core invention in a fairly new technological field and wherethere may be many potential applications which are not yet known. Although patentsas an indicator of innovation have such shortcomings, we follow previous studiesby assuming that patents are the best indicator of innovative output that is currentlyavailable.
Studies that analyze the innovation output of private firms at a regional level typ-ically consider, in addition to corporate R&D inputs, also a number of variables fordeterminants external to the firm such as university research, policy measures andregional characteristics (Fritsch and Slavtchev 2007, 2009b for details). The typicallyapplied equation (cf. Eq. 2) does not actually indicate how firms internally innovatebut rather implicitly assumes that such variables have direct impact on corporate inno-vation output. In our study we consider the number of private sector R&D employeesas the main knowledge input. We thereby assume that other factors such as publicresearch, interregional spillovers, etc. which might be important for the innovativeactivities of local firms do not impact regional innovative output directly but ratheroperate through the local private sector R&D employees. Information on the num-ber of R&D employment in the private sector stems from the German Social Insur-ance Statistics (Statistik der sozialversicherungspflichtig Beschaeftigten) as describedand documented by Fritsch and Brixy (2004). Employees are classified as working
3 However, as we consider that differences in the innovative performance of regions are only due to regionaldifferences in the output elasticity of R&D input, our measure of efficiency slightly differs from Farell’soriginal concept (see for discussion Kalirajan and Shand 1999).
123
How does industry specialization affect the efficiency of regional innovation systems? 93
in R&D if they have a tertiary degree and are employed as engineers or as naturalscientists.4
When relating knowledge input to innovation output we have to assume that thereis a time lag between the respective indicators for two reasons. Firstly, R&D activityrequires time for attaining a patentable result (Griliches 1979). Secondly, patent appli-cations are disclosed only about 12–18 months after submission (Greif and Schmiedl2002). This is the time necessary for the patent office to verify whether an applica-tion fulfills the basic preconditions for being granted a patent. The patent applicationhas to be disclosed 18 months after submission (Hinze and Schmoch 2004). Hence,at least 2–3 years should be an appropriate time lag between input and output of theR&D process.5 However, since reliable data on R&D employment in East Germanyare only available for the years 1996 onwards, a time lag of 2 or 3 years would resultin too few observations per region for estimating a region-specific efficiency. In orderto have more observations available, we reduce the time lag between R&D input andthe patent application to a period of 1 year.6 In other words, R&D output in the periodfrom 1997 to 2000 is related to R&D input between 1996 and 1999.
The spatial pattern used for the analysis is given by the 97 German planningregions.7 The spatial concept of planning regions considers commuter distances; there-fore, they account for travel to work areas and are well suited to represent functionalspatial economic entities. In general, planning regions consist of several districts andinclude at least one core city as well as its surroundings. For historical reasons, thecities of Berlin, Hamburg, and Bremen are defined as planning regions even thoughthey are not functional economic units. In order to create functional units, we mergethese cities with adjacent planning regions for the analysis. Berlin was merged withthe region Havelland-Flaeming, Hamburg with the region Schleswig-Holstein South,Bremen with Bremerhaven and with the region Bremen-Umland. Hence, the esti-mation approach applied in this study is based on observations for 93 regions over4 years.
To estimate the efficiency of regions, we include a binary dummy variable for eachregion, Dr , which is multiplied with the respective number of private sector R&Demployees. As this dummy variable assumes the value one for the respective regionand otherwise has the value zero, the estimation of the region specific efficiency mea-sure, βr , can be done by using only one equation. The constant term, Ar , is assumed
4 Private sector employees with tertiary degree working as engineers or as natural scientists are only a proxyfor the actual R&D employees. However, this measure is highly correlated with the actual R&D employeesof private sector firms (about 0.95). Unfortunately, the actual number of private sector R&D employees isnot publicly available for the period of investigation in this study.5 Fritsch and Slavtchev (2006, 2007) relate patenting activities in West Germany to R&D activities 3 yearsago. Acs et al. (2002) report that US innovation records in 1982 resulted from inventions that had beenmade 4.3 years earlier. Fischer and Varga (2003) use a 2-year lag between R&D efforts and patent countsin Austria in 1993. Ronde and Hussler (2005) link the innovative output, the number of patents between1997 and 2000, to R&D efforts in 1997.6 Bode (2004) also uses a time lag of 1 year when relating patent output to R&D employment across Germanplanning regions.7 For this definition of the planning regions, see the Federal Office for Building and Regional Planning(Bundesamt fuer Bauwesen und Raumordnung, BBR 2003).
123
94 M. Fritsch, V. Slavtchev
to be the same for all regions (Ar = A). Hence, after taking logarithms of both sides,the Eq. 2 can be rewritten as
ln(Number of patentsr
) = ln A +∑
r
βr × Dr × ln(R&D privr
) + εr , (4)
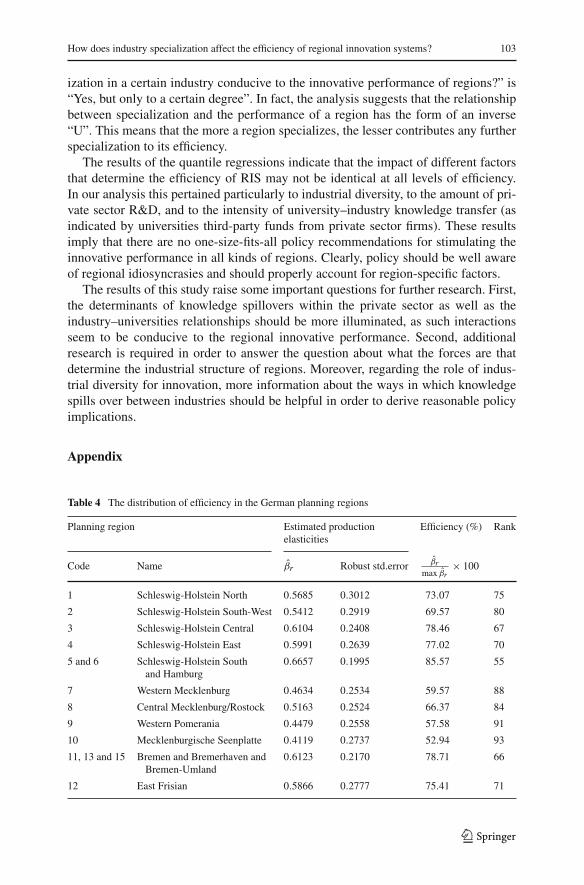
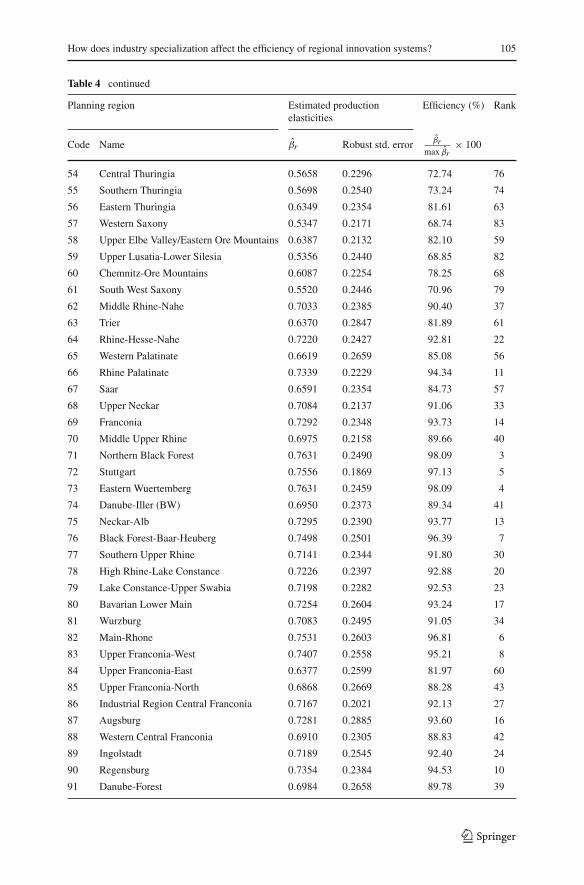
where βr is a measure of the output elasticity of private sector R&D employment inthe r th region (r = 1, . . . , 93). The output elasticity of R&D in the region, βr , isestimated by means of robust negative-binomial regression technique.8 The data havebeen pooled. The efficiency measure, Er , is then computed according to Eq. 3. Theresults are reported in Table 4 in the Appendix.
6 The distribution of efficiency across German regions
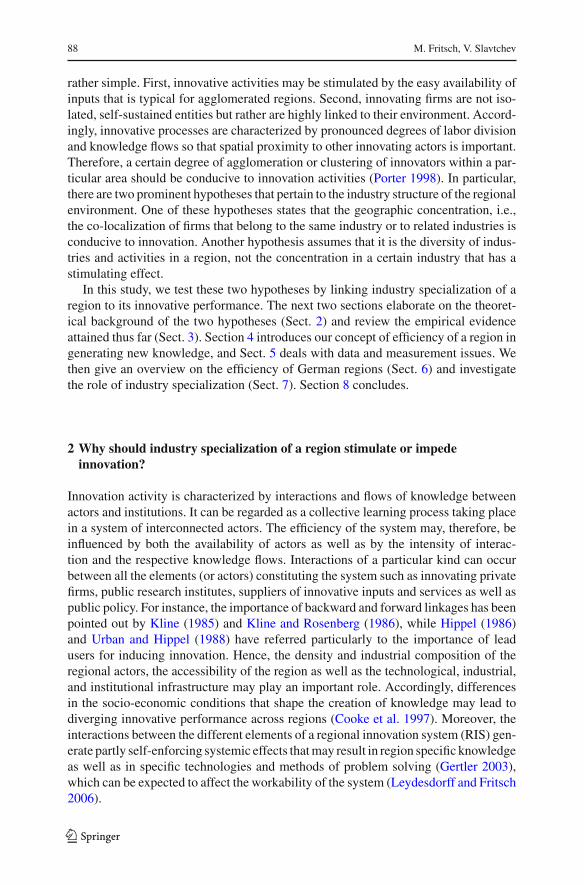
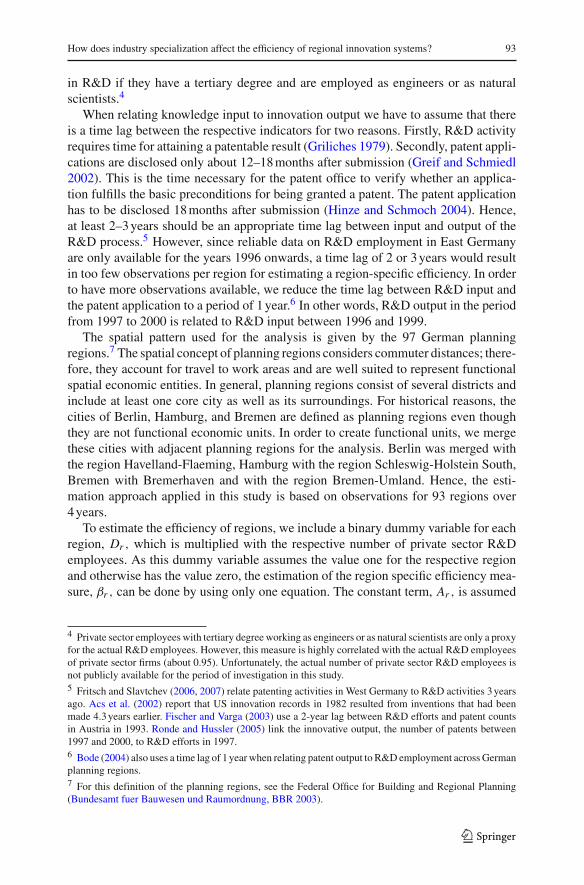
There is a wide dispersion of RIS efficiency among the planning regions. The valuesfor efficiency are within the range between 53 and 100%, meaning that productivityof private R&D input in the best practice region is about twice the productivity in theleast efficient region (Fig. 1).
Generally, the efficiency values tend to be higher in regions with large, denselypopulated agglomerations such as Munich, Stuttgart, Cologne, Frankfurt, andHamburg. The lowest efficiency estimates are found for regions in the northeast such as“Mecklenburgische Seenplatte”, “Vorpommern”, and “Altmark” located in EastGermany, the former German Democratic Republic. The Berlin region, showing arelatively high efficiency, is an exception in the East German innovation landscape.The relatively low efficiency values in East Germany indicate that the innovation pro-cesses in this part of the country tend to be rather inefficient. Most of the relativelyefficient regions are located in the southern and in the western part of the country. Thissuggests that the German innovation system is spatially divided into different regimes.
7 Industry specialization and the efficiency of RIS
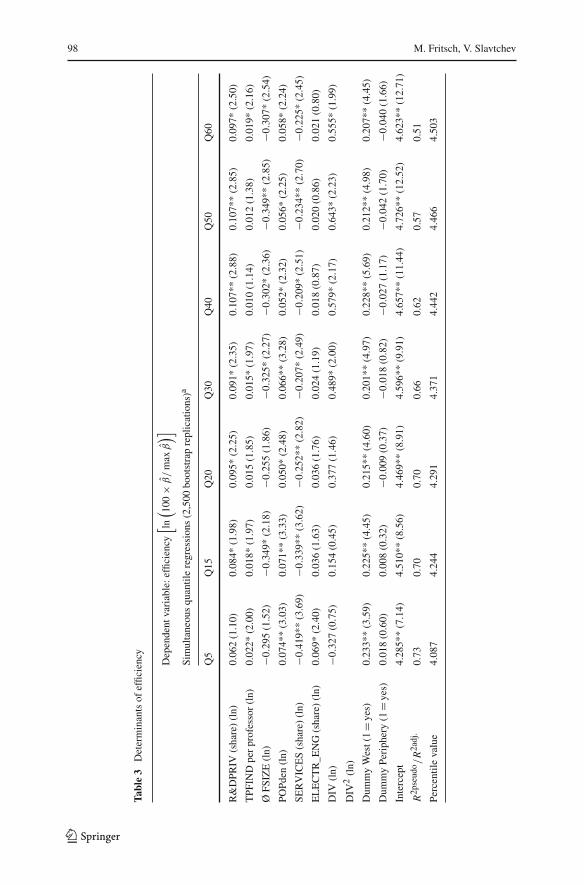
To estimate the relative impact of different determinants of the efficiency of RIS, arobust OLS cross-section regression technique can be applied. A critical assumption ofsuch an empirical approach is that whatever the sources of efficiency are, they operateidentically in all regions whether they are highly efficient or not. However, the relativeimportance of the possible determinants of RIS’s efficiency may differ for regionsat different efficiency levels. We, therefore, apply simultaneous quantile regressionsfor analyzing this question. Differences in the effects between regions imply that therespective policy recommendations may only hold for certain types of regions.
8 See Greene (2003), pp 931–939. We find at least one patent per year for each region in our data; thus,the problem of having “too many zero values” does not apply. In the presence of over dispersion, i.e.,the pronounced skewness to the left of the distribution of patent records, the negative binomial estimationtechnique is strongly favored over Poisson regression technique.
123
How does industry specialization affect the efficiency of regional innovation systems? 95
<= 73%
73% <= 85%
85% <= 90%
90% <= 93%
93% <
Berlin
Hamburg
Munich
Stuttgart
Frankfurt
Cologne
<= 73%
73% <= 85%
85% <= 90%
90% <= 93%
93% <
Berlin
Hamburg
Munich
Stuttgart
Frankfurt
Cologne
Fig. 1 The distribution of efficiency in German planning regions
Quantile regression was originally discussed in Koenker and Bassett (1982) andRogers (1993) as a robust regression technique alternative to OLS. This techniquediffers from OLS in the estimation of the coefficients of the equation as it minimizesthe sum of absolute error values rather than the sum of squared errors. More importantfor the problem here is that the coefficients can be estimated for a particular point qin the distribution of the dependent variable:
Qq (y) = αq + βq,1x1 + · · · + βq,n xn . (5)
Thus, assertions for different stages on the efficiency scale can be made. Althoughthe estimated coefficients refer to a particular point in the distribution, all observa-tions are used in calculating the coefficients for that particular quantile. For example,
123
96 M. Fritsch, V. Slavtchev
concerning median regression all residuals become equally weighted; while when fit-ting the qth quantile, negative residuals are weighted by 2(1−q) and positive residualsby 2q. Here we apply a simultaneous quantile regression technique. The differenceto a standard quantile regression is that the equations are estimated simultaneouslyand an estimate of the entire variance–covariance matrix is obtained by bootstrapping(Gould 1992). A main advantage of this method is that the estimated coefficients canbe easily compared across equations (quantiles).
Although the main focus of this study is on the relationship between industry spe-cialization in a region and productivity of R&D employment, a number of furtherimportant determinants of efficiency as well as a number of control variables areincluded. Table 1 gives an overview on the definition of variables and respective datasources. Descriptive statistics are presented in Table 2 while Table 3 shows the regres-sion results. Correlation coefficients for the relationship between the variables aregiven in Table 5 in the Appendix.
A significantly positive impact on efficiency of RIS can be found for the shareof private sector R&D employment. The estimated coefficient provides evidence forscale economies. This means that an increase in the share of private sector R&D
Table 1 Definition of variables and data sources
Variable Description Definition Source
Patents Number of disclosedpatent applications inthe region, 1997–2000
German Patent andTrademark Office(DPMA)
R&DPRIV Number of private sectorR&D employees in theregion, 1996–1999
Number of employees withtertiary degree workingas engineers or naturalscientists in the region
German SocialInsurance Statistics
Efficiency Efficiency of RIS, See Eq. 3 See Eq. 31997–2000 average
R&DPRIV (share) Share of private sectorR&D employees in theregion, 1996–1999average
Number of employeeswith tertiary degree inengineering and naturalsciences in theregion/number ofemployees in the region
German SocialInsurance Statistics
TPFIND per professor Universities third-partyfunds from privatecompanies perprofessor in the region,1996–1999 average
Volume of third-partyfunds that universities inthe region gain fromprivate sector actors[1,000 Euro]/number ofprofessors at universitiesin the region
German UniversityStatistics availableat the FederalStatistical Office
Ø FSIZE Average firm size in theregion, 1996–1999average
Number of employees inthe region/number offirms in the region
German SocialInsurance Statistics
POPden Population density in theregion, 1996–1999average
Number of inhabitantsper km2
Federal Office forBuilding andRegional Planning
123
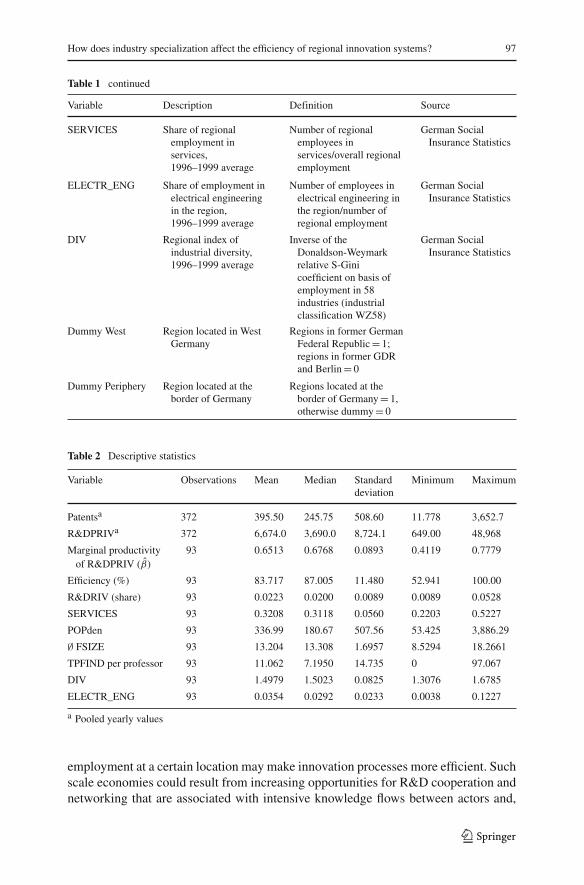
How does industry specialization affect the efficiency of regional innovation systems? 97
Table 1 continued
Variable Description Definition Source
SERVICES Share of regionalemployment inservices,1996–1999 average
Number of regionalemployees inservices/overall regionalemployment
German SocialInsurance Statistics
ELECTR_ENG Share of employment inelectrical engineeringin the region,1996–1999 average
Number of employees inelectrical engineering inthe region/number ofregional employment
German SocialInsurance Statistics
DIV Regional index ofindustrial diversity,1996–1999 average
Inverse of theDonaldson-Weymarkrelative S-Ginicoefficient on basis ofemployment in 58industries (industrialclassification WZ58)
German SocialInsurance Statistics
Dummy West Region located in WestGermany
Regions in former GermanFederal Republic = 1;regions in former GDRand Berlin = 0
Dummy Periphery Region located at theborder of Germany
Regions located at theborder of Germany = 1,otherwise dummy = 0
Table 2 Descriptive statistics
Variable Observations Mean Median Standard Minimum Maximumdeviation
Patentsa 372 395.50 245.75 508.60 11.778 3,652.7
R&DPRIVa 372 6,674.0 3,690.0 8,724.1 649.00 48,968
Marginal productivity 93 0.6513 0.6768 0.0893 0.4119 0.7779of R&DPRIV (β̂)
Efficiency (%) 93 83.717 87.005 11.480 52.941 100.00
R&DRIV (share) 93 0.0223 0.0200 0.0089 0.0089 0.0528
SERVICES 93 0.3208 0.3118 0.0560 0.2203 0.5227
POPden 93 336.99 180.67 507.56 53.425 3,886.29
∅ FSIZE 93 13.204 13.308 1.6957 8.5294 18.2661
TPFIND per professor 93 11.062 7.1950 14.735 0 97.067
DIV 93 1.4979 1.5023 0.0825 1.3076 1.6785
ELECTR_ENG 93 0.0354 0.0292 0.0233 0.0038 0.1227
a Pooled yearly values
employment at a certain location may make innovation processes more efficient. Suchscale economies could result from increasing opportunities for R&D cooperation andnetworking that are associated with intensive knowledge flows between actors and,
123
98 M. Fritsch, V. Slavtchev
Tabl
e3
Det
erm
inan
tsof
effic
ienc
y
Dep
ende
ntva
riab
le:e
ffici
ency
[ ln( 10
0×
β̂/
max
β̂)]
Sim
ulta
neou
squ
antil
ere
gres
sion
s(2
,500
boot
stra
pre
plic
atio
ns)a
Q5
Q15
Q20
Q30
Q40
Q50
Q60
R&
DPR
IV(s
hare
)(l
n)0.
062
(1.1
0)0.
084*
(1.9
8)0.
095*
(2.2
5)0.
091*
(2.3
5)0.
107*
*(2
.88)
0.10
7**
(2.8
5)0.
097*
(2.5
0)
TPF
IND
per
prof
esso
r(l
n)0.
022*
(2.0
0)0.
018*
(1.9
7)0.
015
(1.8
5)0.
015*
(1.9
7)0.
010
(1.1
4)0.
012
(1.3
8)0.
019*
(2.1
6)
ØFS
IZE
(ln)
−0.2
95(1
.52)
−0.3
49*
(2.1
8)−0
.255
(1.8
6)−0
.325
*(2
.27)
−0.3
02*
(2.3
6)−0
.349
**(2
.85)
−0.3
07*
(2.5
4)
POPd
en(l
n)0.
074*
*(3
.03)
0.07
1**
(3.3
3)0.
050*
(2.4
8)0.
066*
*(3
.28)
0.05
2*(2
.32)
0.05
6*(2
.25)
0.05
8*(2
.24)
SER
VIC
ES
(sha
re)
(ln)
−0.4
19**
(3.6
9)−0
.339
**(3
.62)
−0.2
52**
(2.8
2)−0
.207
*(2
.49)
−0.2
09*
(2.5
1)−0
.234
**(2
.70)
−0.2
25*
(2.4
5)
EL
EC
TR
_EN
G(s
hare
)(l
n)0.
069*
(2.4
0)0.
036
(1.6
3)0.
036
(1.7
6)0.
024
(1.1
9)0.
018
(0.8
7)0.
020
(0.8
6)0.
021
(0.8
0)
DIV
(ln)
−0.3
27(0
.75)
0.15
4(0
.45)
0.37
7(1
.46)
0.48
9*(2
.00)
0.57
9*(2
.17)
0.64
3*(2
.23)
0.55
5*(1
.99)
DIV
2(l
n)
Dum
my
Wes
t(1
=ye
s)0.
233*
*(3
.59)
0.22
5**
(4.4
5)0.
215*
*(4
.60)
0.20
1**
(4.9
7)0.
228*
*(5
.69)
0.21
2**
(4.9
8)0.
207*
*(4
.45)
Dum
my
Peri
pher
y(1
=ye
s)0.
018
(0.6
0)0.
008
(0.3
2)−0
.009
(0.3
7)−0
.018
(0.8
2)−0
.027
(1.1
7)−0
.042
(1.7
0)−0
.040
(1.6
6)
Inte
rcep
t4.
285*
*(7
.14)
4.51
0**
(8.5
6)4.
469*
*(8
.91)
4.59
6**
(9.9
1)4.
657*
*(1
1.44
)4.
726*
*(1
2.52
)4.
623*
*(1
2.71
)
R2p
seud
o/
R2a
dj.
0.73
0.70
0.70
0.66
0.62
0.57
0.51
Perc
entil
eva
lue
4.08
74.
244
4.29
14.
371
4.44
24.
466
4.50
3
123
How does industry specialization affect the efficiency of regional innovation systems? 99
Tabl
e3
cont
inue
d
Dep
ende
ntva
riab
le:e
ffici
ency
[ ln( 10
0×
β̂/
max
β̂)]
OL
S,ro
bust
cova
rian
cem
atri
xes
timat
orb
Sim
ulta
neou
squ
antil
ere
gres
sion
s(2
,500
boot
stra
pre
plic
atio
ns)
a
Q70
Q80
Q85
Q95
R&
DPR
IV(s
hare
)(l
n)0.
108*
*(2
.66)
0.07
0(1
.52)
0.07
8(1
.58)
0.01
6(0
.25)
0.09
7**
(4.1
7)0.
090*
*(4
.04)
TPF
IND
per
prof
esso
r(l
n)0.
016*
(2.0
4)0.
009
(0.8
9)0.
007
(0.6
2)−0
.005
(0.3
5)0.
019*
(2.5
1)0.
017*
(2.0
7)
ØFS
IZE
(ln)
−0.2
79*
(2.2
8)−0
.270
*(2
.11)
−0.3
02*
(2.4
2)−0
.249
*(1
.96)
−0.3
16**
(3.4
1)−0
.288
**(3
.06)
POPd
en(l
n)0.
062*
(2.5
4)0.
060*
(2.6
3)0.
055*
(2.5
1)0.
032
(1.2
8)0.
064*
*(4
.46)
0.06
0**
(3.6
9)
SER
VIC
ES
(sha
re)
(ln)
−0.3
02**
(3.2
6)−0
.235
*(2
.53)
−0.2
14*
(2.3
1)−0
.112
(0.9
3)−0
.259
**(5
.00)
−0.2
50**
(4.8
0)
EL
EC
TR
_EN
G(s
hare
)(l
n)0.
021
(0.8
0)0.
055*
(2.2
5)0.
053*
(2.3
3)0.
033
(1.4
1)0.
035*
(2.4
1)0.
035*
(2.3
9)
DIV
(ln)
0.33
3(1
.39)
−0.0
64(0
.18)
0.00
9(0
.02)
−0.4
62(1
.00)
0.37
5*(2
.17)
2.76
3*(2
.35)
DIV
2(l
n)−2
.967
*(2
.03)
Dum
my
Wes
t(1
=ye
s)0.
186*
*(3
.99)
0.17
2**
(4.1
2)0.
172*
*(4
.35)
0.16
6**
(4.4
2)0.
197*
*(7
.35)
0.19
1**
(7.0
8)
Dum
my
Peri
pher
y(1
=ye
s)−0
.025
(1.1
1)−0
.021
(1.0
3)−0
.035
(1.6
5)−0
.002
(0.0
9)−0
.022
(1.5
7)−0
.020
(1.3
9)
Inte
rcep
t4.
614*
*(1
2.29
)4.
685*
*(1
1.06
)4.
846*
*(1
1.29
)4.
953*
*(1
2.59
)4.
624*
*(1
6.33
)4.
093*
*(9
.81)
R2p
seud
o/
R2a
dj.
0.47
0.42
0.41
0.42
0.81
0.82
Perc
entil
eva
lue
4.52
14.
533
4.54
04.
579
Num
ber
ofob
serv
atio
ns:9
3*
Stat
istic
ally
sign
ific
anta
tthe
5%le
vel,
**st
atis
tical
lysi
gnif
ican
tatt
he1%
leve
la
Boo
tstr
apt-
stat
istic
sin
pare
nthe
ses
bR
obus
tt-s
tatis
tics
inpa
rent
hese
s
123

100 M. Fritsch, V. Slavtchev
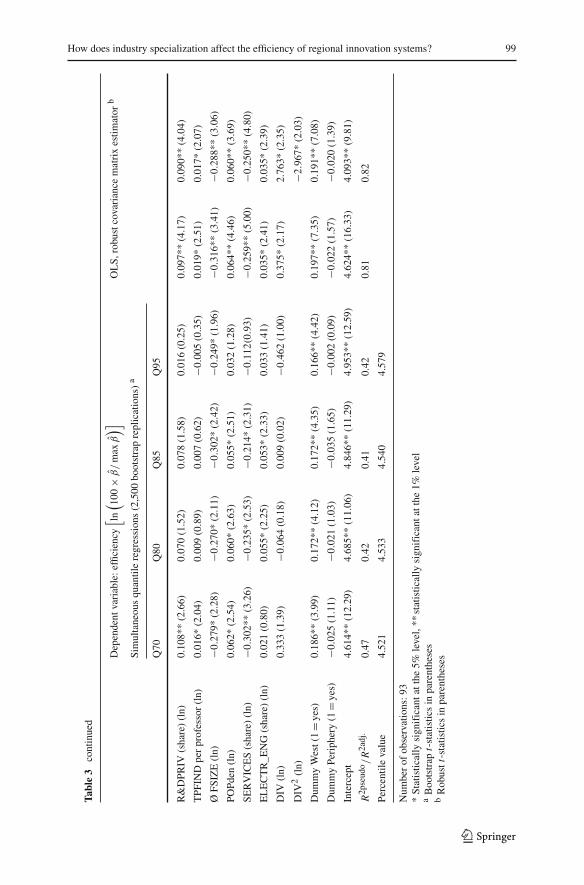
therefore, may lead to a relatively high level of productivity. However, as indicatedby the quantile regressions, this pertains mainly to regions with a medium level ofefficiency since regions at both ends of distribution do not seem to benefit from suchpositive externalities.
The average amount of third-party funds from private sector firms per univer-sity professor (TPFIND) has a positive impact on the RIS efficiency. Universities’third-party funds in general can be regarded as an indicator of the quality of theirresearch. The main reason is that the allocation of universities’ third-party funds isusually based on some competitive procedure and is, therefore, largely dependenton the quality of the research conducted. According to Hornbostel (2001), there isa distinct correspondence between indicators that are based on third-party funds andbibliometric indicators for high quality research such as SCI publications. Funds fromprivate sector firms, in particular, can be regarded as compensation for academic R&Dor for other services that universities perform for private companies. Hence, these rev-enues are well suited to indicate the relevance of academic research for commercialapplications as well as the intensity of formal university–industry linkages (Fritsch andSlavtchev 2007, 2009b). In order to avoid possible scale effects of large universities,which are likely to attract larger amounts of third-party funds from private firms, weuse the average amount of third-party funds from private sector firms per universityprofessor. Overall, the results for TPFIND suggest that the intensity of knowledgeflows from universities due to formal university–industry linkages (e.g., R&D con-tracts) is conducive to the efficiency of local corporate innovation activity. Accordingto the quantile regressions, such a positive impact of university–industry relations onthe efficiency of RIS is found for regions at the lower end and at the upper mid-range ofthe efficiency distribution. The impact of the intensity of university–industry interac-tions is less pronounced and becomes insignificant for regions with efficiency valuesbelonging to the upper end of the distribution.
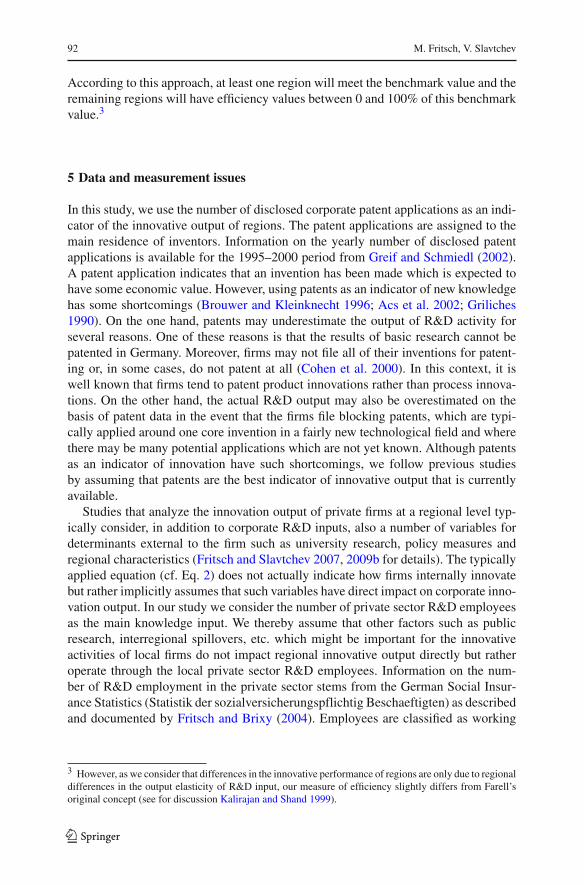
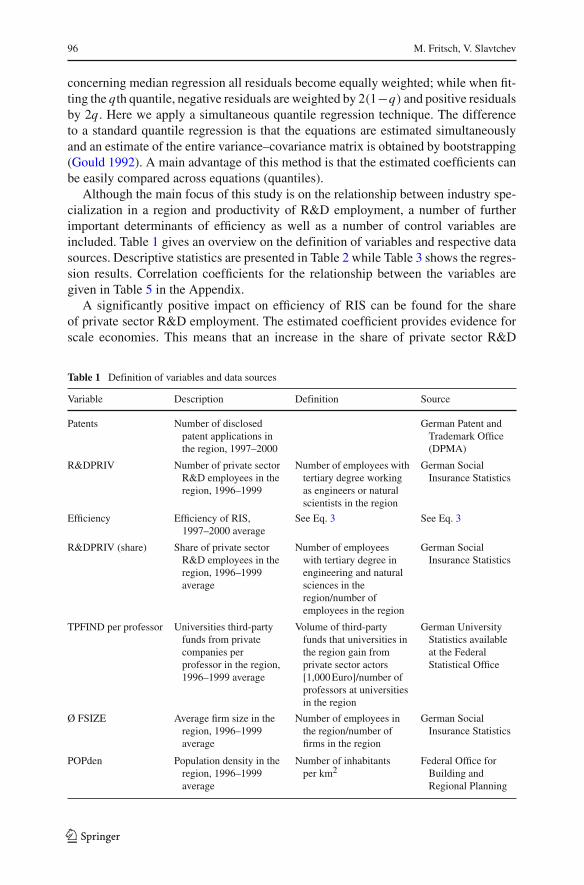
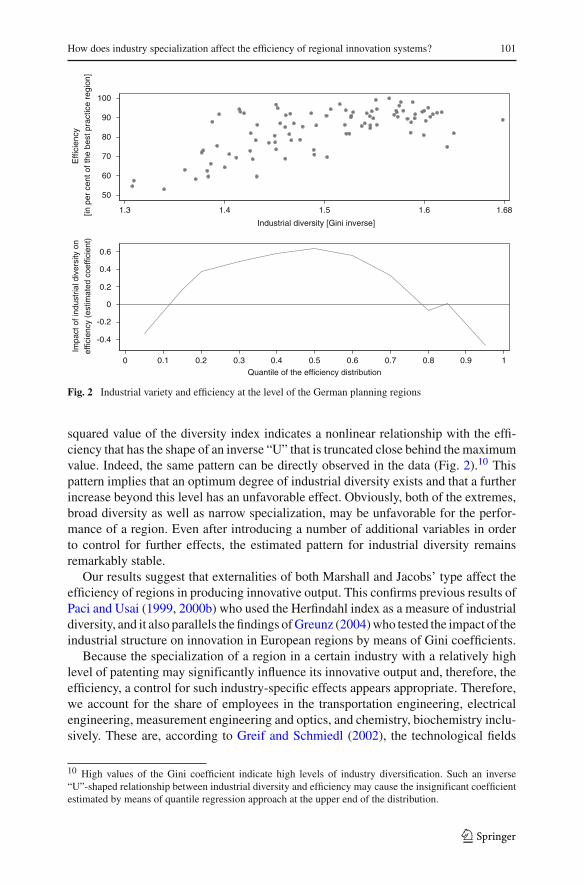
The industrial diversity index is the inverse value of the Gini coefficient calculatedon the basis of the number of employees in 58 different industries. Considering thequantile regression approach, we find that the efficiency increases with industrial vari-ety only for regions with relatively low efficiency up to the median value. Accordingto Table 3, the estimated coefficients for industrial diversity are not statistically sig-nificant for relatively less efficient regions as well as for regions at the upper end ofthe distribution. This pattern suggests that the impact of the industrial diversity differsfor regions at different efficiency levels (Fig. 2).
The OLS approach also provides evidence for nonlinear relationship between thedegree of industrial diversity and the innovative performance of a region when intro-ducing the inverse of the Gini coefficient and its squared value.9 The positive signfor the industrial diversity index suggests that the efficiency of regional innovationactivity increases with the variety of industries in the region and that interaction ofactors with different knowledge endowments stimulates the generation of new ideasrather than specialization (Jacobs’ externalities). However, the negative sign for the
9 No relationship of third or higher polynomial order can be found between the degree of industrial diver-sity and efficiency. Furthermore, there is no significant relationship of second or higher polynomial orderbetween any other explanatory variables and the efficiency.
123
How does industry specialization affect the efficiency of regional innovation systems? 101
50
60
70
80
90
100
Effi
cien
cy[in
per
cen
t of t
he b
est p
ract
ice
regi
on]
1.3 1.4 1.5 1.6 1.68
Industrial diversity [Gini inverse]
-0.4
-0.2
0
0.2
0.4
0.6
Impa
ct o
f ind
ustr
ial d
iver
sity
on
effic
ienc
y (e
stim
ated
coe
ffici
ent)
0 0.1 0.2 0.3 0.4 0.5 0.6 0.7 0.8 0.9 1
Quantile of the efficiency distribution
Fig. 2 Industrial variety and efficiency at the level of the German planning regions
squared value of the diversity index indicates a nonlinear relationship with the effi-ciency that has the shape of an inverse “U” that is truncated close behind the maximumvalue. Indeed, the same pattern can be directly observed in the data (Fig. 2).10 Thispattern implies that an optimum degree of industrial diversity exists and that a furtherincrease beyond this level has an unfavorable effect. Obviously, both of the extremes,broad diversity as well as narrow specialization, may be unfavorable for the perfor-mance of a region. Even after introducing a number of additional variables in orderto control for further effects, the estimated pattern for industrial diversity remainsremarkably stable.
Our results suggest that externalities of both Marshall and Jacobs’ type affect theefficiency of regions in producing innovative output. This confirms previous results ofPaci and Usai (1999, 2000b) who used the Herfindahl index as a measure of industrialdiversity, and it also parallels the findings of Greunz (2004) who tested the impact of theindustrial structure on innovation in European regions by means of Gini coefficients.
Because the specialization of a region in a certain industry with a relatively highlevel of patenting may significantly influence its innovative output and, therefore, theefficiency, a control for such industry-specific effects appears appropriate. Therefore,we account for the share of employees in the transportation engineering, electricalengineering, measurement engineering and optics, and chemistry, biochemistry inclu-sively. These are, according to Greif and Schmiedl (2002), the technological fields
10 High values of the Gini coefficient indicate high levels of industry diversification. Such an inverse“U”-shaped relationship between industrial diversity and efficiency may cause the insignificant coefficientestimated by means of quantile regression approach at the upper end of the distribution.
123

102 M. Fritsch, V. Slavtchev
in which most of the patent applications in Germany are generated.11 However, onlyregional specialization in electrical engineering appears to have a significant effect onRIS efficiency. The OLS approach as well as the quantile regressions suggest that thereis a concentration of electrical engineering industry in high efficiency regions. Theestimates for transportation engineering, measurement engineering, and optics as wellas for chemistry are not statistically significant and, therefore, are not reported here.
Since firms in different industries tend to differ with respect to their minimum effi-cient size, we include the average firm size in the region in order to control for furtherindustry-specific effects that are yet not captured. As indicated by the significantlynegative coefficient for average firm size, efficiency of innovation activity tends tobe lower in regions that are dominated by large scale industries. This confirms otherstudies which suggest that the number of patents per unit of R&D input is higherin smaller firms than in larger ones (Acs and Audretsch 1990; Cohen and Klepper1996).
Another common assumption in the innovation literature is that services, particu-larly knowledge intensive business services (KIBS), may produce and diffuse knowl-edge that is crucial for innovation processes (Muller and Zenker 2001; Anselin et al.2000). In order to test the impact of the service supply in a region on the efficiency, weinclude the size of that sector (in terms of employment) into the model. However, ourresults indicate that the share of the service sector always has a negative impact on theefficiency of regions. This suggests that despite their supporting function, resourcesallocated to the service sector are less productive in terms of patenting (Bode 2004).This corresponds to the relatively low share of patents in services.
The positive coefficient for population density indicates the presence of urbani-zation economies. This means that densely populated regions provide a variety ofopportunities for interaction in addition to often abundant supplies of input as well asa rich physical and institutional infrastructure, which may be advantageous for eco-nomic and innovation activity (Ciccone and Hall 1996; Crescenzi et al. 2007; Carlinoet al. 2007).
The results of the analysis provide robust evidence that regions located in thewestern part of Germany are more efficient than regions located in the eastern part ofthe country. This suggests the presence of further region-specific factors (e.g., orga-nization of the R&D process, institutions, etc.) which also influence the efficiency ofthe R&D processes. The statistically insignificant coefficient for the dummy variablefor location at the periphery indicates that such regions do not tend to be relativelyinefficient in comparison to the non-peripheral areas.
8 Conclusions
This study investigates the effect of a region’s specialization in certain industries on itsefficiency in producing knowledge. Our answer to the question “Is regional special-
11 In the 1995–2000 period, about 9.6% of all patent applications have been submitted in the field of trans-portation engineering, 13% in electrical engineering, and 7.4% in measurement engineering/optics (Greifand Schmiedl 2002).
123
How does industry specialization affect the efficiency of regional innovation systems? 103
ization in a certain industry conducive to the innovative performance of regions?” is“Yes, but only to a certain degree”. In fact, the analysis suggests that the relationshipbetween specialization and the performance of a region has the form of an inverse“U”. This means that the more a region specializes, the lesser contributes any furtherspecialization to its efficiency.
The results of the quantile regressions indicate that the impact of different factorsthat determine the efficiency of RIS may not be identical at all levels of efficiency.In our analysis this pertained particularly to industrial diversity, to the amount of pri-vate sector R&D, and to the intensity of university–industry knowledge transfer (asindicated by universities third-party funds from private sector firms). These resultsimply that there are no one-size-fits-all policy recommendations for stimulating theinnovative performance in all kinds of regions. Clearly, policy should be well awareof regional idiosyncrasies and should properly account for region-specific factors.
The results of this study raise some important questions for further research. First,the determinants of knowledge spillovers within the private sector as well as theindustry–universities relationships should be more illuminated, as such interactionsseem to be conducive to the regional innovative performance. Second, additionalresearch is required in order to answer the question about what the forces are thatdetermine the industrial structure of regions. Moreover, regarding the role of indus-trial diversity for innovation, more information about the ways in which knowledgespills over between industries should be helpful in order to derive reasonable policyimplications.
Appendix
Table 4 The distribution of efficiency in the German planning regions
Planning region Estimated production Efficiency (%) Rankelasticities
Code Name β̂r Robust std.error β̂rmax β̂r
× 100
1 Schleswig-Holstein North 0.5685 0.3012 73.07 75
2 Schleswig-Holstein South-West 0.5412 0.2919 69.57 80
3 Schleswig-Holstein Central 0.6104 0.2408 78.46 67
4 Schleswig-Holstein East 0.5991 0.2639 77.02 70
5 and 6 Schleswig-Holstein South 0.6657 0.1995 85.57 55and Hamburg
7 Western Mecklenburg 0.4634 0.2534 59.57 88
8 Central Mecklenburg/Rostock 0.5163 0.2524 66.37 84
9 Western Pomerania 0.4479 0.2558 57.58 91
10 Mecklenburgische Seenplatte 0.4119 0.2737 52.94 93
11, 13 and 15 Bremen and Bremerhaven and 0.6123 0.2170 78.71 66Bremen-Umland
12 East Frisian 0.5866 0.2777 75.41 71
123

104 M. Fritsch, V. Slavtchev
Table 4 continued
Planning region Estimated production Efficiency (%) Rankelasticities
Code Name β̂r Robust std. error β̂rmax β̂r
× 100
14 Hamburg-Umland-South 0.6778 0.2669 87.12 46
16 Oldenburg 0.6008 0.2683 77.22 69
17 Emsland 0.5823 0.2705 74.85 72
18 Osnabruck 0.6767 0.2550 86.99 48
19 Hanover 0.6691 0.2136 86.01 53
20 Suedheide 0.6290 0.2780 80.85 65
21 Luneburg 0.5726 0.3003 73.60 73
22 Brunswick 0.7250 0.2178 93.19 18
23 Hildesheim 0.6713 0.2566 86.29 50
24 Gottingen 0.6817 0.2601 87.62 45
25 Prignitz-Obehavel 0.4859 0.2630 62.46 87
26 Uckermark-Barnim 0.4542 0.2716 58.38 90
27 Oderland-Spree 0.4899 0.2574 62.98 86
28 Lusatia-Spreewald 0.5389 0.2314 69.28 81
29 and 30 Havelland-Flaeming and Berlin 0.6833 0.1915 87.83 44
31 Altmark 0.4247 0.3065 54.59 92
32 Magdeburg 0.5550 0.2300 71.34 78
33 Dessau 0.4634 0.2474 59.56 89
34 Halle/Saale 0.5604 0.2273 72.04 77
35 Muenster 0.7112 0.2255 91.42 31
36 Bielefeld 0.7150 0.2233 91.91 28
37 Paderborn 0.6673 0.2556 85.78 54
38 Arnsberg 0.6692 0.2516 86.03 52
39 Dortmund 0.6403 0.2276 82.31 58
40 Emscher-Lippe 0.6768 0.2413 87.01 47
41 Duisburg/Essen 0.6714 0.2077 86.31 49
42 Duesseldorf 0.7335 0.1964 94.29 12
43 Bochum/Hagen 0.7171 0.2215 92.18 26
44 Cologne 0.7018 0.2008 90.21 38
45 Aachen 0.7237 0.2235 93.02 19
46 Bonn 0.7149 0.2418 91.90 29
47 Siegen 0.7049 0.2571 90.61 35
48 Northern Hesse 0.6353 0.2399 81.66 62
49 Central Hesse 0.7282 0.2366 93.61 15
50 Eastern Hesse 0.6306 0.2843 81.07 64
51 Rhine-Main 0.7107 0.1920 91.36 32
52 Starkenburg 0.7185 0.2141 92.35 25
53 Northern Thuringia 0.5008 0.2697 64.37 85
123
How does industry specialization affect the efficiency of regional innovation systems? 105
Table 4 continued
Planning region Estimated production Efficiency (%) Rankelasticities
Code Name β̂r Robust std. error β̂rmax β̂r
× 100
54 Central Thuringia 0.5658 0.2296 72.74 76
55 Southern Thuringia 0.5698 0.2540 73.24 74
56 Eastern Thuringia 0.6349 0.2354 81.61 63
57 Western Saxony 0.5347 0.2171 68.74 83
58 Upper Elbe Valley/Eastern Ore Mountains 0.6387 0.2132 82.10 59
59 Upper Lusatia-Lower Silesia 0.5356 0.2440 68.85 82
60 Chemnitz-Ore Mountains 0.6087 0.2254 78.25 68
61 South West Saxony 0.5520 0.2446 70.96 79
62 Middle Rhine-Nahe 0.7033 0.2385 90.40 37
63 Trier 0.6370 0.2847 81.89 61
64 Rhine-Hesse-Nahe 0.7220 0.2427 92.81 22
65 Western Palatinate 0.6619 0.2659 85.08 56
66 Rhine Palatinate 0.7339 0.2229 94.34 11
67 Saar 0.6591 0.2354 84.73 57
68 Upper Neckar 0.7084 0.2137 91.06 33
69 Franconia 0.7292 0.2348 93.73 14
70 Middle Upper Rhine 0.6975 0.2158 89.66 40
71 Northern Black Forest 0.7631 0.2490 98.09 3
72 Stuttgart 0.7556 0.1869 97.13 5
73 Eastern Wuertemberg 0.7631 0.2459 98.09 4
74 Danube-Iller (BW) 0.6950 0.2373 89.34 41
75 Neckar-Alb 0.7295 0.2390 93.77 13
76 Black Forest-Baar-Heuberg 0.7498 0.2501 96.39 7
77 Southern Upper Rhine 0.7141 0.2344 91.80 30
78 High Rhine-Lake Constance 0.7226 0.2397 92.88 20
79 Lake Constance-Upper Swabia 0.7198 0.2282 92.53 23
80 Bavarian Lower Main 0.7254 0.2604 93.24 17
81 Wurzburg 0.7083 0.2495 91.05 34
82 Main-Rhone 0.7531 0.2603 96.81 6
83 Upper Franconia-West 0.7407 0.2558 95.21 8
84 Upper Franconia-East 0.6377 0.2599 81.97 60
85 Upper Franconia-North 0.6868 0.2669 88.28 43
86 Industrial Region Central Franconia 0.7167 0.2021 92.13 27
87 Augsburg 0.7281 0.2885 93.60 16
88 Western Central Franconia 0.6910 0.2305 88.83 42
89 Ingolstadt 0.7189 0.2545 92.40 24
90 Regensburg 0.7354 0.2384 94.53 10
91 Danube-Forest 0.6984 0.2658 89.78 39
123
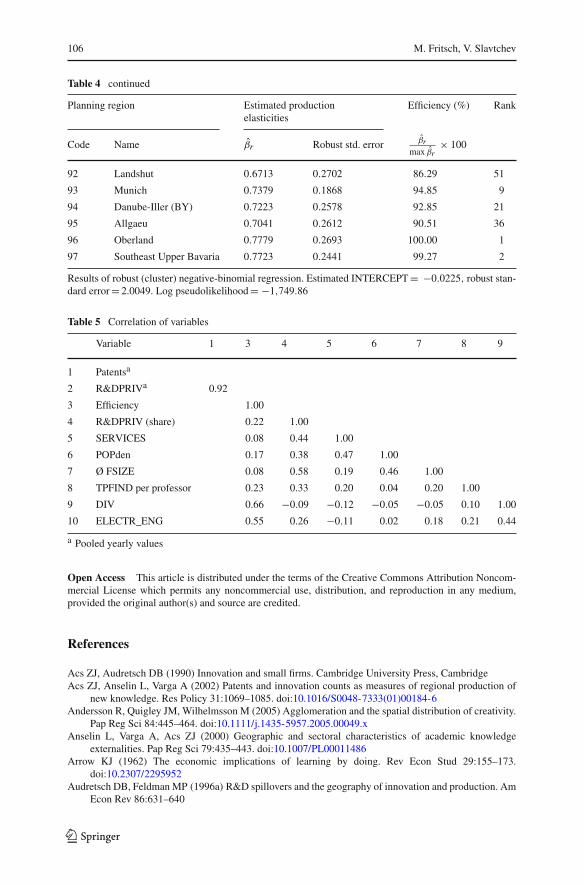
106 M. Fritsch, V. Slavtchev
Table 4 continued
Planning region Estimated production Efficiency (%) Rankelasticities
Code Name β̂r Robust std. error β̂rmax β̂r
× 100
92 Landshut 0.6713 0.2702 86.29 51
93 Munich 0.7379 0.1868 94.85 9
94 Danube-Iller (BY) 0.7223 0.2578 92.85 21
95 Allgaeu 0.7041 0.2612 90.51 36
96 Oberland 0.7779 0.2693 100.00 1
97 Southeast Upper Bavaria 0.7723 0.2441 99.27 2
Results of robust (cluster) negative-binomial regression. Estimated INTERCEPT = −0.0225, robust stan-dard error = 2.0049. Log pseudolikelihood = −1,749.86
Table 5 Correlation of variables
Variable 1 3 4 5 6 7 8 9
1 Patentsa
2 R&DPRIVa 0.92
3 Efficiency 1.00
4 R&DPRIV (share) 0.22 1.00
5 SERVICES 0.08 0.44 1.00
6 POPden 0.17 0.38 0.47 1.00
7 Ø FSIZE 0.08 0.58 0.19 0.46 1.00
8 TPFIND per professor 0.23 0.33 0.20 0.04 0.20 1.00
9 DIV 0.66 −0.09 −0.12 −0.05 −0.05 0.10 1.00
10 ELECTR_ENG 0.55 0.26 −0.11 0.02 0.18 0.21 0.44
a Pooled yearly values
Open Access This article is distributed under the terms of the Creative Commons Attribution Noncom-mercial License which permits any noncommercial use, distribution, and reproduction in any medium,provided the original author(s) and source are credited.
References
Acs ZJ, Audretsch DB (1990) Innovation and small firms. Cambridge University Press, CambridgeAcs ZJ, Anselin L, Varga A (2002) Patents and innovation counts as measures of regional production of
new knowledge. Res Policy 31:1069–1085. doi:10.1016/S0048-7333(01)00184-6Andersson R, Quigley JM, Wilhelmsson M (2005) Agglomeration and the spatial distribution of creativity.
Pap Reg Sci 84:445–464. doi:10.1111/j.1435-5957.2005.00049.xAnselin L, Varga A, Acs ZJ (2000) Geographic and sectoral characteristics of academic knowledge
externalities. Pap Reg Sci 79:435–443. doi:10.1007/PL00011486Arrow KJ (1962) The economic implications of learning by doing. Rev Econ Stud 29:155–173.
doi:10.2307/2295952Audretsch DB, Feldman MP (1996a) R&D spillovers and the geography of innovation and production. Am
Econ Rev 86:631–640
123
How does industry specialization affect the efficiency of regional innovation systems? 107
Audretsch DB, Feldman MP (1996b) Innovative clusters and the industry life cycle. Rev Ind Organ 11:253–273. doi:10.1007/BF00157670
Baptista R, Swann P (1998) Do firms in clusters innovate more? Res Policy 27:525–540.doi:10.1016/S0048-7333(98)00065-1
Bartelsman EJ, Caballero RJ, Lyons RK (1994) Customer- and supplier-driven externalities. Am Econ Rev84:1075–1084
Beaudry C, Breschi S (2003) Are firms in clusters really more innovative? Econ Innov N Technol 12:325–342. doi:10.1080/10438590290020197
Bode E (2004) The spatial pattern of localized R&D spillovers: an empirical investigation for Germany.J Econ Geogr 4:43–64. doi:10.1093/jeg/4.1.43
Brouwer E, Kleinknecht A (1996) Determinants of innovation: a microeconomic analysis of three alterna-tive innovation indicators. In: Kleinknecht A (ed) Determinants of innovation: the message from newindicators. Macmillan, Basingstoke
Bundesamt fuer Bauwesen und Raumordnung—BBR (2003) Aktuelle Daten zur Entwicklung der Staedte,Kreise und Gemeinden 17. BBR, Bonn
Carlino GA, Chatterjee S, Hunt RM (2007) Urban density and the rate of invention. J Urban Econ 61:389–419. doi:10.1016/j.jue.2006.08.003
Ciccone A, Hall RE (1996) Productivity and the density of economic activity. Am Econ Rev 86:54–70Cohen WM, Klepper S (1996) A reprise of size and R&D. Econ J 106:925–951. doi:10.2307/2235365Cohen WM, Nelson RR, Walsh JP (2000) Protecting their intellectual assets: appropriability conditions and
why US manufacturing firms patent (or not). NBER working paper series no. 7552Cooke P, Uranga MG, Etxebarria G (1997) Regional innovation systems: institutions and organisational
dimensions. Res Policy 26:475–491. doi:10.1016/S0048-7333(97)00025-5Crescenzi R, Rodriguez-Pose A, Storper M (2007) The territorial dynamics of innovation: a Europe–United
States comparative analysis. J Econ Geogr 7:673–709. doi:10.1093/jeg/lbm030Duranton G, Puga D (2000) Diversity and specialization in cities. Why, where and when does it matter?
Urban Stud 37:533–555. doi:10.1080/0042098002104Ellison G, Glaeser EL (1999) The geographic concentration of industry: does natural advantages explain
agglomeration. Am Econ Rev 89:301–316Farrell MJ (1957) The measurement of productive efficiency. J R Stat Soc Ser A 120:253–282. doi:10.2307/
2343100Feldman MP, Audretsch DB (1999) Innovation in cities: science-base diversity, specialization and localized
competition. Eur Econ Rev 43:409–429. doi:10.1016/S0014-2921(98)00047-6Fischer MM, Varga A (2003) Spatial knowledge spillovers and university research: evidence from Austria.
Ann Reg Sci 37:303–322. doi:10.1007/s001680200115Fritsch M, Mallok J (2002) Machinery and productivity-A comparison of East and West German manufac-
turing plants. In: Schaetzl L, Diez JR (eds) Technological change and regional development in Europe.Physica, Berlin
Fritsch M, Brixy U (2004) The establishment file of the German social insurance statistics. SchmollersJahrbuch/J Appl Soc Sci Stud 124:183–190
Fritsch M, Slavtchev V (2006) Measuring the efficiency of regional innovation systems—an empiricalassessment. Working paper 8/2006, Faculty of Economics and Business Administration. TechnicalUniversity Bergakademie Freiberg, Freiberg
Fritsch M, Slavtchev V (2007) Universities and innovation in Space. Ind Innov 14:201–218. doi:10.1080/13662710701253466
Fritsch M, Slavtchev V (2009a) Determinants of the efficiency of regional innovation systems. Reg Stud(forthcoming). doi:10.1080/00343400802251494
Fritsch M, Slavtchev V (2009b) Local knowledge sources, spillovers and innovation, School of Economicsand Business Administration. Friedrich-Schiller-University Jena, Germany
Gertler MS (2003) Tacit knowledge and the economic geography of context, or the undefinable tacitnessof being (there). J Econ Geogr 3:75–99. doi:10.1093/jeg/3.1.75
Glaeser EL, Kallal HD, Scheinkam JA, Shleifer A (1992) Growth in cities. J Polit Econ 100:1126–1152.doi:10.1086/261856
Gould WW (1992) Quantile regression with bootstrapped standard errors. Stata Tech Bull 9:19–21Grabher G (1993) The weakness of strong ties: the lock-in of regional developments in the Ruhr area.
In: Grabher G (ed) The embedded firm—on the socioeconomics of industrial networks. Routledge,London
123
108 M. Fritsch, V. Slavtchev
Greene WH (2003) Econometric analysis. Prentice Hall, New YorkGreif S, Schmiedl D (2002) Patentatlas Deutschland. Deutsches Patent- und Markenamt, MunichGreunz L (2004) Industrial structure and innovation—evidence from European regions. J Evol Econ 14:
563–592. doi:10.1007/s00191-004-0234-8Griliches Z (1979) Issues in assessing the contribution of research and development to productivity growth.
Bell J Econ 10:92–116. doi:10.2307/3003321Griliches Z (1990) Patent statistics as economic indicators: a survey. J Econ Lit 28:1661–1707Henderson V (1997) Medium size cities. Reg Sci Urban Econ 27:583–612. doi:10.1016/
S0166-0462(96)02169-2Hinze S, Schmoch U (2004) Analytical approaches and their impact on the outcome of statistical patent
analysis. In: Moed HF, Glaenzel W, Schmoch U (eds) Handbook of quantitative science and technologyresearch: the use of publication and patent statistics in studies of S&T systems. Kluwer, Dordrecht
Hippel E (1986) Lead user: a source of novel product concepts. Manage Sci 32:791–805.doi:10.1287/mnsc.32.7.791
Hornbostel S (2001) Third party funding of German universities. An indicator of research activity.Scientometrics 50:523–537. doi:10.1023/A:1010566916697
Jacobs J (1969) The economy of cities. Vintage, New YorkJaffe A (1989) Real effects of academic research. Am Econ Rev 79:957–970Kalirajan KP, Shand RT (1999) Frontier production functions and technical efficiency measures. J Econ
Surv 13:149–172. doi:10.1111/1467-6419.00080Kline SJ (1985) Innovation is not a linear process. Res Manage 28:36–45Kline SJ, Rosenberg N (1986) An overview of innovation. In: Landau R, Rosenberg N (eds) The positive
sum strategy. National Academy Press, Washington pp 275–305Koenker R, Bassett G (1982) Robust tests for heteroscedasticity based on regression quantiles. Econometrica
50:43–61. doi:10.2307/1912528Lawson C, Lorenz E (1999) Collective learning, tacit knowledge and regional innovative capacity. Reg Stud
33:305–317. doi:10.1080/713693555Leibenstein H (1966) Allocative efficiency vs. “X-efficiency”. Am Econ Rev 56:392–415Leydesdorff L, Fritsch M (2006) Measuring the knowledge base of regional innovation systems in Germany
in terms of a triple helix dynamics. Res Policy 35:1538–1553. doi:10.1016/j.respol.2006.09.027Marshall A (1890) Principles of economics. Macmillan, LondonMaskell P, Malmberg A (1999) Localized learning and industrial competitiveness. Camb J Econ 23:167–185.
doi:10.1093/cje/23.2.167Mowery DC, Oxley JE, Silverman BS (1998) Technological overlap and interfirm cooperation: implications
for the resource-based view of the firm. Res Policy 27:507–523. doi:10.1016/S0048-7333(98)00066-3Muller E, Zenker A (2001) Business services as actors of knowledge transformation: the
role of KIBS in regional and national innovation systems. Res Policy 30:1501–1516.doi:10.1016/S0048-7333(01)00164-0
Ouwersloot H, Rietveld P (2000) The geography of R&D: tobit analysis and a Bayesian approach to mappingR&D activities in the Netherlands. Environ Plan A 32:1673–1688. doi:10.1068/a3336
Paci R, Usai S (1999) Externalities, knowledge spillovers and the spatial distribution of innovation. Geo J49:381–390. doi:10.1023/A:1007192313098
Paci R, Usai S (2000a) Technological enclaves and industrial districts: an analysis of the regional distributionof innovative activity in Europe. Reg Stud 34:97–114. doi:10.1080/00343400050006032
Paci R, Usai S (2000b) The role of specialization and diversity externalities in the agglomeration of inno-vative activities. Riv Ital Econ 2:237–268
Porter ME (1998) Clusters and the new economics of competition. Harv Bus Rev 76:77–90Rogers WH (1993) Calculation of quantile regression standard errors. Stata Tech Bull 13:18–19Romer PM (1986) Increasing returns and long run growth. J Polit Econ 94:1002–1037. doi:10.1086/261420Ronde P, Hussler C (2005) Innovation in regions: what does really matter? Res Policy 34:1150–1172.
doi:10.1016/j.respol.2005.03.011Urban GL, Hippel E (1988) Lead user analyses for the development of new industrial products. Manage
Sci 34:569–582. doi:10.1287/mnsc.34.5.569van der Panne G (2004) Agglomeration externalities: Marshall versus Jacobs. J Evol Econ 14:593–604.
doi:10.1007/s00191-004-0232-xvan Oort F (2002) Innovation and agglomeration economies in the Netherlands. J Econ Soc Geogr 93:
344–360
123