Embed Size (px)
Citation preview

Ben Rosser Corn Specialist, OMAFRA
Nicole Rabe Land Resource Specialist, OMAFRA
How Do You Evaluate Precision
Ag Strategies On‐Farm?
Lessons Learned from the GFO
Precision Ag Project

Co-operator yield
data submitted
+
collect other base
data layers to fill gaps
Goals: wireless
data transfer &
analyze data layers
with transparent
mathematics for
teaching farmers
Rx maps:
implemented with
validation built in
& industry
support
Project Scope:
This project was funded in part through Growing Forward 2, a federal-
provincial-territorial initiative.
The Agricultural Adaptation Council assists in the delivery of Growing
Forward 2 in Ontario.

• ~50 acres committed to a full rotation (corn, soybeans, wheat)
• good drainage
• average to medium base levels P & K
• Manure history: project would have to document & monitor for impacts
• Farmer had to have VR equipment for at least 1 project operation (seed or fertilizer )
Total of 20-25 fields (constant), 3 year study (2015-2017)

Precision Ag in a nutshell:
• Yield (y) results from natural processes described by f: • The function is made up of :
– things that the farmer does control = x (e.g. seed / fertilizer type, source, rate etc)
– field characteristics = c that a farmer does not control and they vary spatially (e.g.
soil type, topography – slope)
– vector z - the farmer does not control & this varies temporally (principally weather
variables)
Y=f(x,c,z)
So far the case studies explored here are missing a couple of
field characteristics (C) (e.g. soil chemistry, landforms) &
weather (z) was not incorporated into variable rate prescriptions
Conceptual formula courtesy: Dr. David Bullock, Ag Economist, Ohio State University

Historical Yield based
Management Zones
• 2008 Wheat
• 2009 Corn
• 2011 Wheat
• 2012 Corn
• 2014 Wheat
• 2015 Corn
• Project started with yield data
acknowledging most farmers would
have some sitting on a drive in office
somewhere
• Research Crop Portal:
– includes fully and semi automated cleaning
tools for yield data
– transparent math to relay the message that
maps aren’t pretty pictures!
• Yield Potential Index (YPI): best to work
with single crops over time (e.g. 3yrs
corn, 3yrs wheat, 3yrs of soybeans)
– pairing corn and wheat maintains consistent
zone geometry
– soybeans do not have same yield response
distribution (likely to due to disease)
http://cropportal.niagararesearch.ca/

Research Crop Portal - 2017 additions:
- Delta cleaning tool
- Elevation & Topographic analysis tools to create
landform classes
4 Landforms
Red = Tops of knolls
Green = depressions

-0.15
-0.10
-0.05
0.00
0.05
0.10
0.15
0.20
0.25
0.30
0.35
0-2
0%
0-4
0%
0-7
0%
0-1
00
%
Dif
fere
nce
Bet
we
en
Ove
r an
d U
nd
er
Pe
rfo
rmin
g C
ells
Percentage of Yield Points
Over and Under Performing Gaps For 4 Landform Classes
Knolls
Upper Sideslopes
Lower Sideslopes
Depressions
Yield performance is consistent across the full distribution of yield. Landform 3 always outperforms (in the data we have collected so far)
$
$
$
$
Yield Performance per Landform
Slide courtesy of: Dr. Mike Duncan, NSERC Prec Ag Research Chair, Niagara College
8
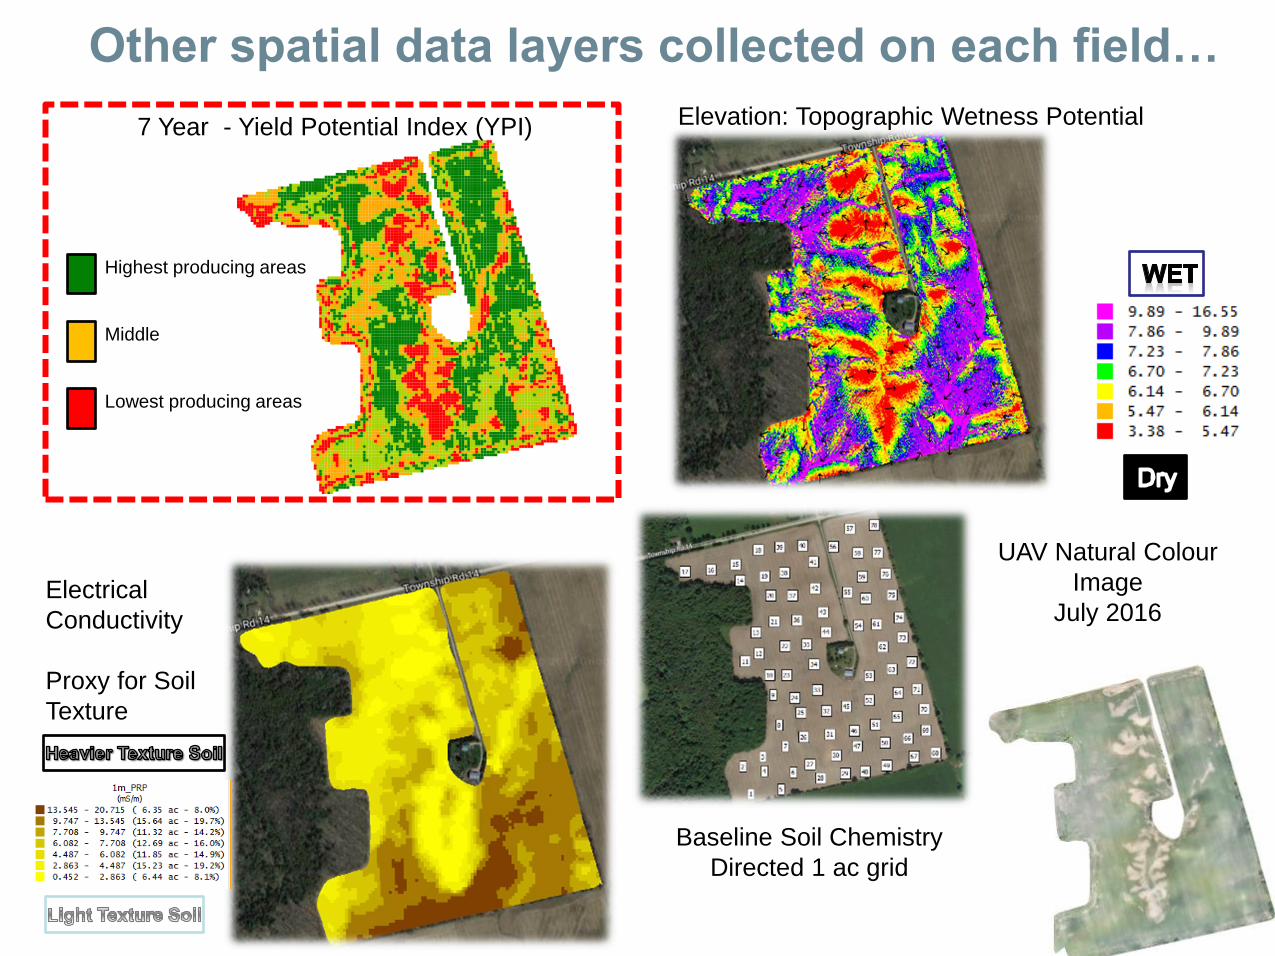
Elevation: Topographic Wetness Potential 7 Year - Yield Potential Index (YPI)
UAV Natural Colour
Image
July 2016 Electrical
Conductivity
Proxy for Soil
Texture
Highest producing areas
Middle
Lowest producing areas
Baseline Soil Chemistry
Directed 1 ac grid
Other spatial data layers collected on each field…

Validating Precision Ag Strategies

2016
Strip Trial
Examples Variable Rate Nitrogen
VR Soybean Population
Validating Precision Ag Strategies

2016 “Learning Stamp” Example
11
Prescription Maps
Yield Potential Index
based so far…
As-Applied
Verification of Equipment
Cleaned Yield Data

The dilemma of incorporating as-applied data and learning stamps or blocks…
Smart Rectangles
Points
Data representation ,
block orientation, delays, offsets, and
equipment footprint?

Size of blocks v.s. replication
180x180 ft blocks = 170-200yld points
Simple Block
Fully automated randomized and replicated
60ft aligned grid 5 acre blocks

Did the YPI based management zones show up in both
2015 and 2016?
• Seed & Nitrogen Corn trials: on 5 fields zones no SD, 6 fields showed
only two distinct zones, and 4 fields showed all three zones were distinct
(Type 1 Error: 10%)
• VR Soybean Population Trials: on 2 fields zones no SD, 4 fields
showed only two distinct zones, and 3 fields showed all three zones
were distinct (Type 1 Error: 10%)
• Potential Reasons:
– not enough historical yield data for reliable zone creation
– medium zone stability not well defined in the YPI algorithm
– extreme seasonal conditions (dry or wet)
– good soil health/type
– genetics masks crop response
YPI = Yield potential Index SD = statistical difference

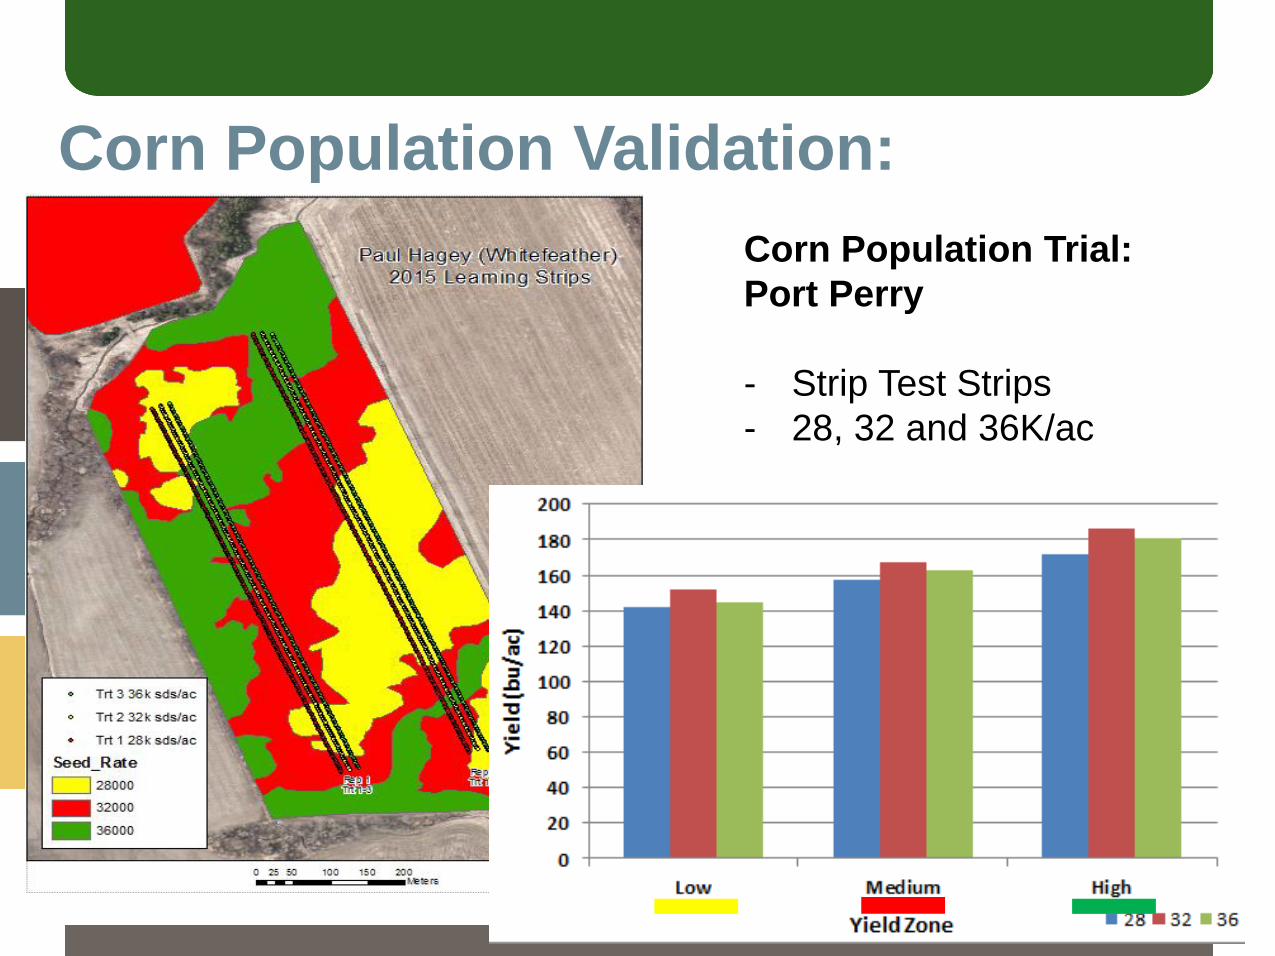
Corn Population Validation:
Corn Population Trial:
Port Perry
- Strip Test Strips
- 28, 32 and 36K/ac

Corn Population Validation:
Corn Population Trial:
Port Perry
- Strip Test Strips
- 28, 32 and 36K/ac
1 Rep of High Yield Zone Response
1 Rep of Med Yield Zone Response
1 Rep of Low Yield Zone Response
Corn Population Validation:
Corn Population Trial:
Port Perry
- Strip Test Strips
- 28, 32 and 36K/ac

Corn Population Validation:
Corn Population Trial:
Guelph
- Rate Blocks
- 28, 32 and 36K/ac

Corn Population Validation:
Corn Population Trial:
Guelph
- Rate Blocks
- 28, 32 and 36K/ac

Corn Population Validation:
Soil Conductivity Readings
Low conductivity
High conductivity
- Often correlated to yield
- Sometimes positive
- Sometimes negative
Corn Population Validation:

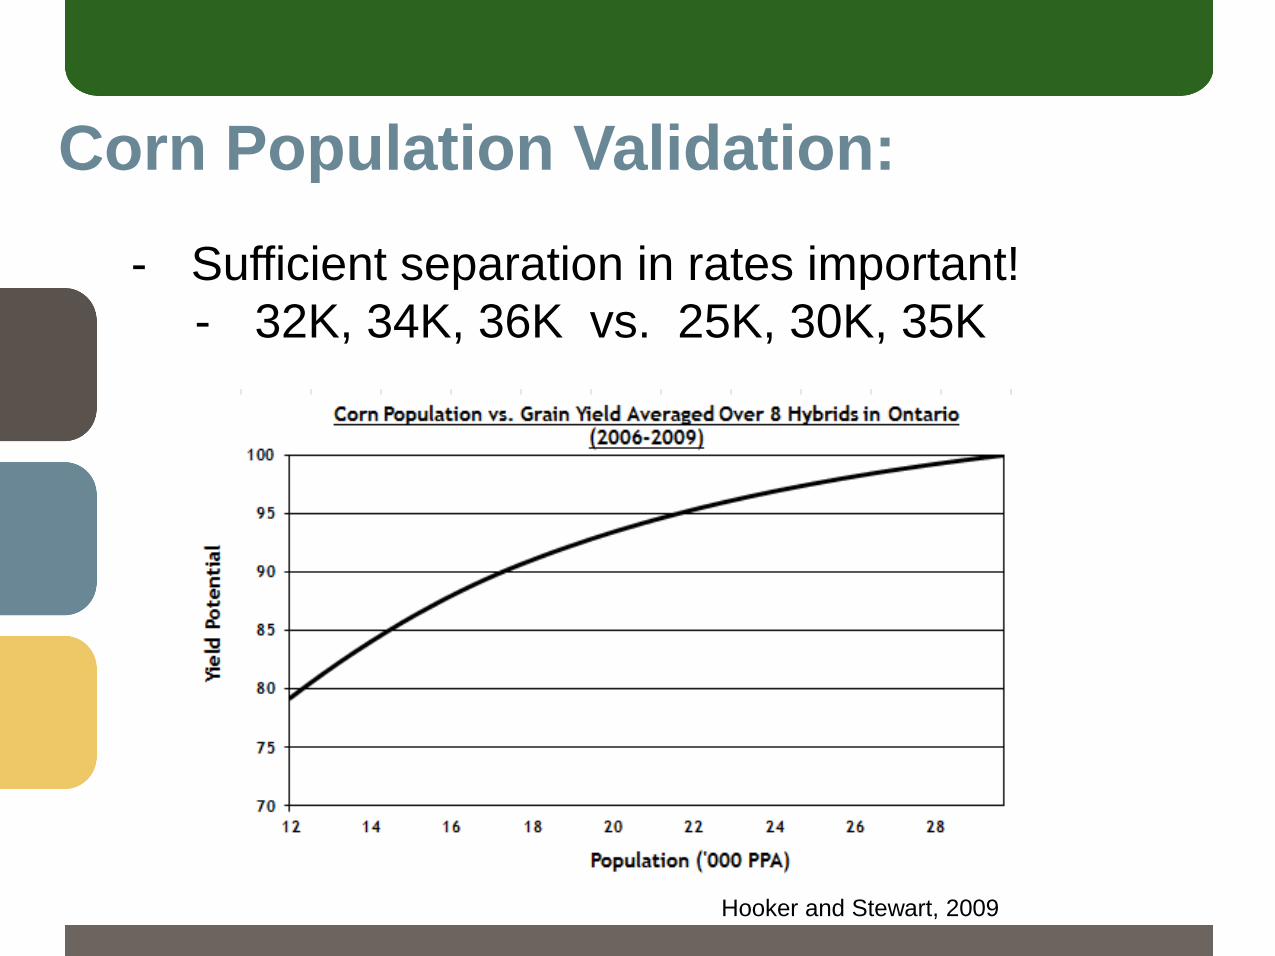
Corn Population Validation:
- Sufficient separation in rates important!
- 32K, 34K, 36K vs. 25K, 30K, 35K
Corn Population Validation:
- Sufficient separation in rates important!
- 32K, 34K, 36K vs. 25K, 30K, 35K
Hooker and Stewart, 2009

Corn Population Validation:
- Sufficient separation in rates important!
- 32K, 34K, 36K vs. 25K, 30K, 35K
- Enough rates to make a conclusion
- 25K and 35K vs. 25K, 30K, 35K

Corn Population Validation:
- Sufficient separation in rates important!
- 32K, 34K, 36K vs. 25K, 30K, 35K
- Enough rates to make a conclusion
- 25K and 35K vs. 25K, 30K, 35K
- Consistency of rates across all zones of
the field
- Shouldn’t prejudge expected optimum
rate in each zone

Corn Nitrogen Validation:
Low Yield
High Yield
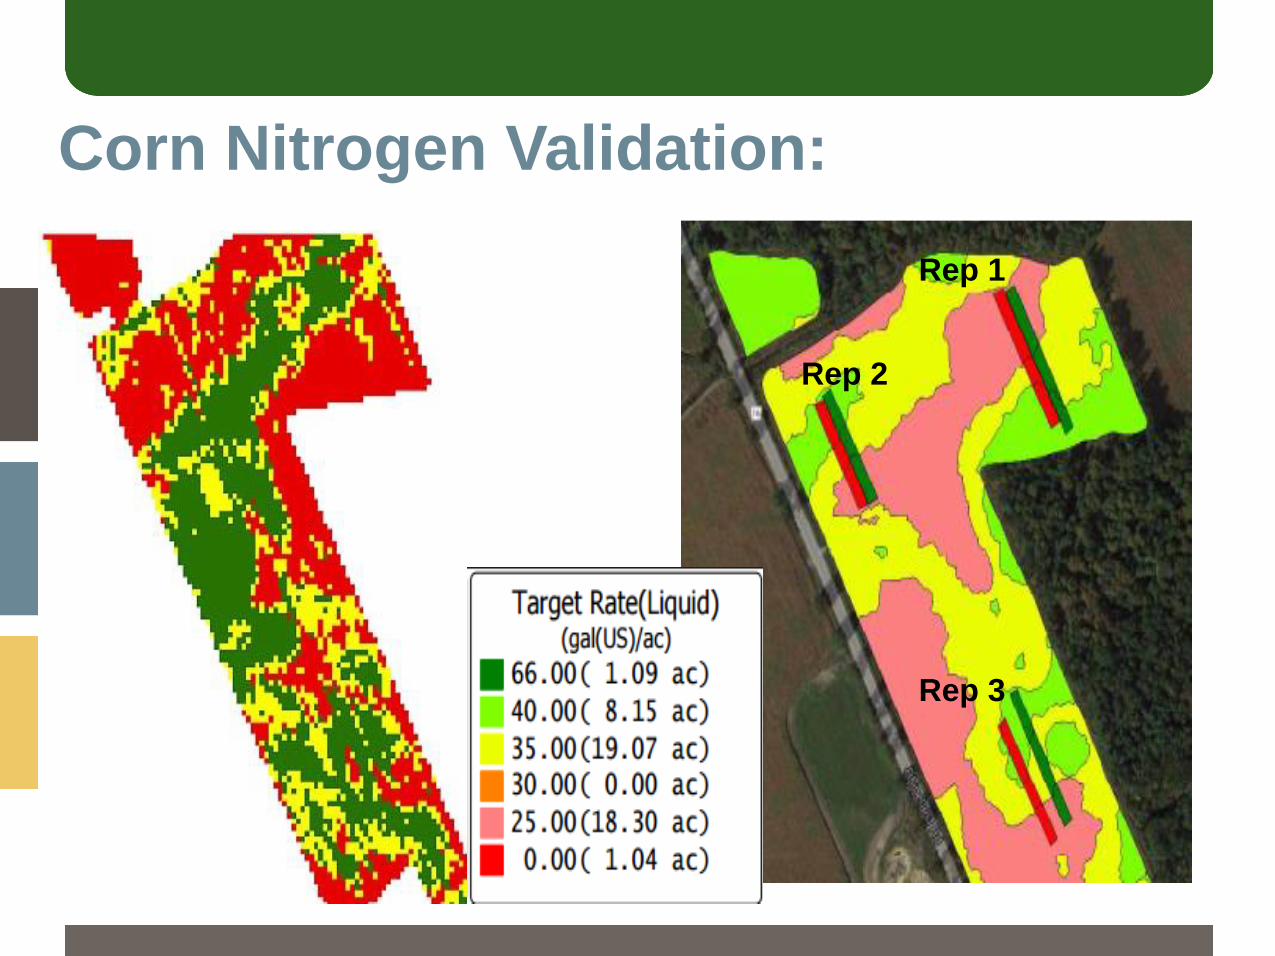
Corn Nitrogen Validation:
Rep 1
Rep 2
Rep 3

Corn Nitrogen Validation:
Rep 1
Rep 2
Rep 3

Corn Nitrogen Validation:
Rep 1
Rep 2
Rep 3

Common Grower Comments With
Validation
- Zero nitrogen rate prescriptions
- Validation blocks are lined up with
equipment passes
- Rate transitions
- Be familiar with prescription setup and
loading
- Equipment setup for wide range of rates, or
adjust speed

What is the value of the other spatial data layers in
explaining yield variability?
If a farmer doesn’t have good repository of historical yield data
then could they start with elevation or soil sensing to develop
management zones?
• Table below shows 2015 snapshot of nitrogen corn strips trials &
the % improvement in explaining yield variability by adding YPI,
elevation or electrical conductivity (EC) to the regression model
Data Layer Field 1
(Vernon)
Field 2
(Ottawa)
Field 3
(Hensall)
Field 4
(Exeter)
Field 5
(Tillsonburg)
Notes:
YPI 20% 12% 10% 4% 60% Yield increases as YPI increases
Elevation 22% 12% 1% n/a 43% Highest yields associated with
mid-regions
EC
(shallow)
n/a 7% n/a n/a 70% As EC decreases across all N
rates - yield decreases
EC (deep)
Related to
parent
material
21% 7% n/a n/a 70% As EC decreases across all N
rates - yield decreases
Clay loams Clay loam / silt loams Loamy sands
/ sand

Future Work 2018
• Include baseline soil chemistry (directed 1 ac grid) – best interpolation method?
• Add topographic derivatives: potential wetness index, landform classes etc.
• In-season imagery: include 2017 UAV imagery into the analysis as additional layer of
information to explain yield variability
• Determine best statistical approach to comparing field trial areas to growers normal
practice within a growing season
• Relationship to soil health parameters – subset of 10 fields
NDVI
Red Edge NDVI
Green NDVI
Acknowledge UAV Partner:

Acknowledgements
Ian McDonald (Crop Innovation Specialist)
Ken Janovicek (UofG – Research Assistant)
Thank-you!
More information on the project:
http://gfo.ca/Research/Understanding-Precision-Ag