Embed Size (px)
Citation preview

How do immigrants respond to discrimination? The case of
Germans in the US during World War I
Vasiliki Fouka∗
May 2017
Abstract
I study the effect of taste-based discrimination on the assimilation decisions of immigrant
minorities. Do discriminated minority groups increase their assimilation efforts in order
to avoid discrimination and public harassment or do they become alienated and retreat in
their own communities? I exploit an exogenous shock to native attitudes, anti-Germanism
in the United States during World War I, to empirically identify the reactions of German
immigrants to increased native hostility. I use two measures of assimilation efforts: nam-
ing patterns and petitions for naturalization. In the face of increased discrimination, Ger-
mans increase their assimilation investments by Americanizing their own and their children’s
names and filing more petitions for US citizenship. Heterogeneity results suggest that these
responses are stronger for immigrants who are initially more invested in the host society.
∗Department of Political Science, Stanford University. Email: [email protected]. I thank Steve Haber,David Laitin, Agustina Paglayan, Alain Schlaepfer, Tetyana Surovtseva and seminar participants at Stanford,Berkeley, the Ohio State University, the Berkeley CPD Faculty/Graduate Working Group and the 2017 ASRECconference in Boston for helpful comments and suggestions.
1

1 Introduction
Discrimination on the basis of ethnicity and religion has been identified as one of the key
impediments to the economic and social integration of immigrants. A large number of studies
document this phenomenon, but significantly less research has been devoted to understanding
how immigrants react to discrimination and how they modify their efforts to assimilate. This
is a question of both theoretical interest and policy relevance, with an answer that is not
clear a priori: some members of discriminated minority groups make costly investments in
assimilation, but for others, low returns to this investment can discourage assimilation and
feed back into the majority further discriminating against them. In some extreme cases,
minorities may even react by radicalizing and undertaking explicit oppositional actions to
reaffirm their identity (Bisin et al., 2011).
Empirically, it is hard to disentangle the reactions of minorities from the effects of dis-
crimination. Discrimination is usually endogenous to a minority group’s characteristics and
pre-existing assimilation trends. Even when there is an exogenous shock to discrimination,
such as in the case of Islamophobia after the 9/11 attacks (Davila and Mora, 2005; Neeraj,
Kaestner and Reimers, 2005; Gould and Klor, 2015), the observed effects on the labor market
and socioeconomic indicators of immigrants are equilibrium outcomes, partly owed to the re-
sponse of Muslims to the discrimination against them and partly due to mainstream backlash
against the Muslim community.
This paper deals with these empirical challenges and identifies conditions under which
immigrant minorities respond to discrimination by either intensifying or reducing their efforts
to assimilate. I do this by using the case study of German Americans in early 20th century
US. Germans constituted a large and fairly well integrated group of immigrants until the
outbreak of World War I, when they became the target of nationalist sentiment and widespread
discrimination and harassment. I examine the effect of the war on the assimilation patterns
of German Americans using two measures of assimilation effort: choices of first names for
children and petitions for naturalization. Unlike other measures of assimilation, such as
wages or intermarriage patterns, these outcomes reflect the decisions of immigrants and not
the constraints of the native environment. I compare Germans to other nationalities before
and after WWI in a difference-in-differences framework and find that Germans respond to
2

increasing suspicion on the part of the native population by intensifying their assimilation
efforts. The first names of children born during and after the war are less distinctively
German than those of earlier cohorts, and the number of petitions for naturalization filed by
Germans increases after 1917. Furthermore, in naturalization documents filed during and after
the war, German immigrants are more likely to Americanize their first names. I construct
two measures of the intensity of anti-German sentiment at the state level. The first one is
based on patterns of support for Woodrow Wilson in the presidential election of 1916. Wilson
not only openly supported the Allied cause, but he was also a vocal enemy of “hyphenated
Americans” and to a large extent fomented anti-German propaganda and contributed to the
persecution of German Americans suspected of disloyalty. Additionally, I compile a list of
incidents of anti-German hostility reported in the press during the period 1917–1918. In states
where democratic vote shares in the 1916 presidential election increased relative to previous
elections, and where more harassment incidents relative to the total population took place,
names of German children become more American-sounding at the start of WWI.
The pattern of intensified assimilation efforts is not uniform. Parents who choose less
German-sounding names for their children have on average lived longer in the US and are
more likely to be naturalized US citizens. Endogamous German couples are less likely to
assimilate than mixed ones and much of the increase in both declarations and petitions for
naturalization after 1917 comes from German nationals who are older and have been in the
country longer at the time of application. This indicates that assimilation responses are larger
for groups that are already better integrated into US society. These groups have lower costs of
assimilation effort and also face potentially larger losses from discrimination, because they are
more invested in the host country. However, even among the newer immigrant arrivals and
endogamous couples, there is no evidence that hostility during World War I led to alienation
or reduced assimilation.
Discrimination against immigrants has been documented by a number of studies. There is
evidence that immigrants, particularly those of a different religious background, are discrimi-
nated against in hiring decisions (Duguet et al., 2010; Oreopoulos, 2011), by party gatekeepers
who influence access to political representation (Dancygier et al., 2015), and during the process
of application for citizenship (Hainmueller and Hangartner, 2013). The idea that immigrants
may respond to such behavior by investing less in assimilation and retreating into their own
3

ethnic enclaves has found some empirical support. Adida, Laitin and Valfort (2014) iden-
tify a “discriminatory equilibrium” in France, whereby Muslims react to discrimination with
alienation and mistrust toward natives. Schildkraut (2005) documents a correlation between
Latinos’ perceptions of discrimination and low political participation. A few studies find an
association between native hostility and radicalization among Muslims in the US and Europe
(Lyons-Padilla et al., 2015; Mitts, 2016). Gould and Klor (2015) find that the increase in
hate crimes after 9/11 reduced the integration of Muslims in the US along dimensions such
as intermarriage, female labor force participation, and English language skills. The latter is
the only study that exploits a temporally exogenous increase in discrimination to investigate
minority assimilation patterns. I exploit a similar historical case study but focus instead on
measures of assimilation effort and not general equilibrium outcomes such as intermarriage
and labor force participation that are influenced only partly by immigrants’ decisions.
At the same time, research indicates that minorities do exercise their option of assimilating
to avoid discrimination. “Passing” for white was a strategy for improving one’s economic
situation that was sometimes employed among blacks in the US during the Jim Crow era
(Mill and Stein, 2015; Nix and Qian, 2015). Immigrants during the era of mass migration
Americanized their names and in so doing achieved better labor market outcomes, a fact
that implies that there was a penalty on foreign-sounding names (Biavaschi, Giulietti and
Siddique, 2013; Algan, Mayer and Thoenig, 2013; Abramitzky, Boustan and Eriksson, 2016).
Apart from purely rational motivations for assimilating in the face of discrimination, there
are also psychological ones: ostracism from a group can drive excluded members to reduce
investment in group identity, but also often leads to compensatory behavior and extreme
identification with the group. The direction of the response is shown to depend on initial
degree of group identification (Williams and Sommer, 1997; Gomez et al., 2011). This pattern
can potentially explain why, for example, Muslims, one of the groups targeted by xenophobic
sentiment in the West today, report on average a high degree of identification with their
host countries. More than other religions, Muslims in France report feeling closer to French
people than members of their own religion or nationality (OIP polls, 1998-2001), and the
vast majority of British-born Muslims identify as British first (Manning and Roy, 2010). To
the extent that these self-reported identity measures reflect desirability bias, the difference
between Muslims and other groups could also be interpreted as a measure of assimilation
4

effort. The current study contributes to the literature in two ways: unlike correlational
studies, it uses an exogenous change in hostile native attitudes that is unrelated to previous
assimilation patterns to identify immigrant responses. Unlike studies that exploit the effect of
9/11, it uses measures of assimilation that are purely under the control of the discriminated
group and thus can isolate immigrant responses from the constraints that natives impose on
immigrants in social and economic settings.
The rest of the paper proceeds as follows: Section 2 discusses the historical background
of German immigration in the United States and anti-German sentiment during World War
I. Section 3 presents the data and empirical strategy. Section 4 examines the effect of the
war on German assimilation, and section 5 presents heterogeneity in responses by immigrant
characteristics. Section 6 discusses the implications of the findings for theories of assimilation
and discrimination, and finally, section 7 concludes.
2 World War I and anti-germanism in the United States
The mass presence of Germans in the US dates back to the 1850s (Conzen, 1980). By 1910,
they were the largest immigrant group in the country, and unlike the newer arrivals of Italians
and other Southern Europeans, they were fairly established and well integrated. Abramitzky,
Boustan and Eriksson (2014) compute occupational-based earnings penalties for different
nationalities in the US and find first-generation Germans to have one of the lowest differences
compared to natives, and one that practically disappears for those who have been in the
country for over 30 years. According to Higham (1998), “Public opinion had come to accept
the Germans as one of the most assimilable and reputable of immigrant groups. Repeatedly,
older Americans praised them as law-abiding, speedily assimilated, and strongly patriotic... In
1908, a group of professional people, in rating the traits of various immigrant nationalities,
ranked the Germans above the English and in some respects judged them superior to the native
whites.”
The outbreak of World War I and Germany’s aggressions towards Belgium increased sup-
port for the Allies in the US, though did not immediately lead to suspicion against German
Americans. In fact, German American leaders, churches, and associations such as the Na-
tional German American Alliance were vocal supporters of US neutrality in the first years of
5

WWI and campaigned for it with rallies, fundraisers, and bazaars for the German Red Cross
(Luebke, 1999). Public opinion against Germans in the country first started to shift after the
sinking of the ocean liner RMS Lusitania by a German U-boat in 1915, which resulted in the
death of hundreds of American passengers. With the entry of the US in the war in 1917, this
opinion shift turned into full-blown hostility.
Numerous incidents of harassment of German Americans are recorded during the war pe-
riod, the most infamous of which was the lynching of Robert Praeger, a German national, by
a large mob in Collinsville, Illinois in 1918. Germans all over the country were forced to buy
liberty bonds or publicly declare their loyalty to the country by kissing the American flag and
denouncing the Kaiser (Luebke, 1974). The Bureau of Investigation, and its “citizens’ auxil-
iary” American Protective League, a large network of volunteer spies who numbered 250,000
members in its peak in 1918, mobilized to monitor disloyalty among the German American
population. These efforts were assisted by many other nationalist and patriotic organizations
of the time, such as the National Security League or the American Defense Society. Thou-
sands of non-naturalized Germans were arrested and interned during WWI. Moser (2012)
finds evidence of discrimination in the New York Stock Exchange, where applications to trade
were more frequently rejected when submitted by applicants with German-sounding names.
Kazal (2004), in his study of Philadelphia Germans, mentions countless incidents of job loss
for individuals who were perceived to be supportive of Germany or to have made disloyal
statements. During the peak of anti-German hysteria, states banned the German language in
their schools, towns removed German books from libraries, and hamburgers briefly became
“liberty steaks.”
Most historical sources agree that German Americans responded to this generalized hos-
tility by hiding their ethnic identity. Many German associations removed any reference to
Germany from their titles, as in the case of Germania Life Insurance Company of New York,
which became Guardian Life Insurance Company (Sowell, 1996). Germans changed their
names to hide their ethnic background. Second-generation Philadelphian German George
Washington Ochs (a man with an already rather patriotic first name) changed his last name
to Oakes. His petition to the court reads: “Your petitioner has no purpose or reason in
changing the spelling of his father’s name, except the desire to relieve his sons of a Teutonic
appellation which he believes will arouse hostility and prove an unnecessary burden in their
6

future social, personal, commercial, and professional relations” (Kazal, 2004). Similar motiva-
tions drove the actions of many other German Americans. The following sections investigate
these behaviors more systematically.
3 Measuring assimilation effort
I use the first names given by German parents to their US-born children as a proxy of assim-
ilation effort. Names are markers of culture and have been shown to systematically differ for
different ethnic, racial, and social groups (Lieberson, 2000; Head and Mayer, 2008; Cook, Lo-
gan and Parman, 2013). Unlike intermarriage or other indicators of integration that depend
on native attitudes and behavior, the naming choice is fully under the control of the parents.
Furthermore, to the degree that parents are attached to their culture, choosing a non-ethnic
name for one’s children is a costly signal of assimilation. Several studies show that there is
a labor market penalty associated with foreign-sounding names (Abramitzky, Boustan and
Eriksson, 2016; Algan, Mayer and Thoenig, 2013). If immigrant parents are aware of this
– and extensive name Americanization among immigrants to the US indicates that they are
(Biavaschi, Giulietti and Siddique, 2013) – then this penalty can proxy for the monetary value
they assign to their children having a name indicative of their ethnic origin.
To capture the ethnic content of names, I compute an index of name distinctiveness that
was first used by Fryer and Levitt (2004), and more recently by Abramitzky, Boustan and
Eriksson (2016) and Fouka (2016), to measure cultural assimilation among immigrants in
the US. The index measures the frequency of a name within an ethnic group relative to its
frequency in the population at large. For Germans, it is computed as follows:
GNIname,c =Pr(name|Germanc)
Pr(name|Germanc) + Pr(name|non−Germanc)∗ 100
A value of zero implies that a name is never found among individuals of German origin,
while a value of 100 implies instead that a name is never encountered among non-Germans.
I use the 1920 and 1930 1% IPUMS samples (Ruggles et al., 2010) to compute the GNI of
men born in the US between 1880 and 1930 who had at least one parent born in Germany.
The subscript c denotes a birth cohort. For each year of birth, the information used for the
computation of the index comes only from people born before that year. The aim is to capture
7

what parents perceived as a German name when they made their naming decisions, without
contamination from changes in naming patterns in later generations. Table 1 lists the highest
scoring names encountered at least 50 times among second-generation Germans in the sample
who were born before (left panel) and after (right panel) the US entered World War I. While
most names are distinctively German, they become less so after 1917. This partly captures a
general assimilation trend among Germans in the US, but, as will be shown later, it is also
reflective of a sharper break around the start of the war, which was not experienced by other
immigrant groups. Table 2 presents summary statistics for other characteristics of the sample
of second-generation Germans.
To more systematically examine name changes and compare Germans to other nationali-
ties, I create a Foreign Name Index (FNI), computed in the same way as the GNI for each of
the following immigrant groups: Italian, Irish, Belgian, French, Swiss, Portuguese, English,
Scottish, Welsh, Danish, Norwegian, Swedish, Finnish, Austrian, and Russian. I define a US-
born person’s ethnicity on the basis of his father’s birthplace, unless his father is born in the
US and his mother is born abroad. In such cases, I assign to second-generation immigrants
the ethnicity of the mother. Figure 1 shows averages of the FNI by ethnicity in the IPUMS
data. My empirical strategy then amounts to a difference-in-differences specification of the
form:
FNIigc = α+ βTigc + λg + θc + εigc (1)
where Tigc is an indicator for German-origin individuals born in or after 1917, the year
when the US entered World War I, and λg and θc are ethnic group and birth cohort fixed
effects, respectively. The interaction coefficient β captures the differential effect of World War
I on the ethnic content of names given to children by parents of German origin.
The second outcome I examine is the number of petitions for naturalization filed by Ger-
man nationals during and after the war. Naturalization petitions are a good proxy for assimi-
lation effort because they allow for a separate observation of the decision of the immigrant to
apply for citizenship from the decision of the courts to grant it. In 1906, the path to citizen-
ship for immigrants was standardized by the Bureau of Immigration and Naturalization, and
8

most naturalization cases were handled by federal courts. Immigrants would usually file a
Declaration of Intention (known as “first papers”) upon arrival or shortly thereafter. Within
five years, they were eligible to file a petition for naturalization (“second papers”), which was
the last step required of the immigrant before the court finalized the naturalization process.
I use data on the number of petitions filed by immigrants between 1911 and 1925 from the
genealogical website Ancestry.com. Ancestry makes available a large catalogue of digitized
images of naturalization petitions from several US states, searchable online via a number of
criteria. I create counts of petitions filed by nationality, year of petition, state of residence
(in which the petition was filed), and year of immigration to the US. The unit of observation
in the final dataset is a nationality-year-state-immigration year cell. Information is available
for four states: California, Maryland, Pennsylvania, and Virginia. Although the collection
of Ancestry contains records from other states as well, it is only for these four states that
one is able to search separately for naturalization petitions as opposed to other naturaliza-
tion documents that are less relevant to the pertinent study question, such as certificates
of arrival and naturalization certificates issued after a petition has been approved. I collect
information for the major nationalities represented in the Ancestry.com collections: Austria-
Hungary, Belgium, Bulgaria, Canada, Denmark, England, Finland, France, Germany, Greece,
the Netherlands, Ireland, Italy, Norway, Poland, Portugal, Romania, Russia, Scotland, Spain,
Sweden, Switzerland, Turkey, and Wales. Figure 2 shows the total numbers of petitions in
the Ancestry.com collections by nationality for the entire 1911-1925 period.
Additionally, I extract a sample of 3,101 naturalization records from the collections of the
District Court for the Eastern Division of the northern district of Illinois, and the District
Court for the eastern district of Pennsylvania, which have been made publicly available in
the form of scanned images by FamilySearch.org. In particular, for each year between 1911
and 1925, I extract a 1 percent random sample of the total number of naturalization peti-
tions filed in that year in the state, as reported in the Annual Reports of the Commissioner
of Naturalization. Together with each petition, I transcribe the corresponding declaration
of intention and certificate of arrival whenever available. This dataset allows me to observe
the entire naturalization process and the evolution of applicants’ characteristics, including
reported names, over time. To systematically assess name Americanization as a proxy for
assimilation effort, I use the 1920 and 1930 1% IPUMS sample to create an Americanization
9

Index (AMI), following Biavaschi, Giulietti and Siddique (2013). Unlike the GNI, this index
does not capture distinctiveness, but the frequency of a name in the American-born popula-
tion, and is thus a simpler measure of conformity with American naming norms.1 An increase
in the AMI from the time of arrival to the US to the time an immigrant files his or her first
papers denotes the adoption of a name that is more common among native-born Americans
than the immigrant’s given name. In practice, that is often the Americanized version of a
foreign name (e.g., a change from Josef to Joseph), but it can also be an unrelated generic
American name (e.g., a change from Utka to Louis). The Americanization Index is computed
as:
AMIic =Sic
max(S1c, ..., SKc)
where
Sic =∑k
1(Namei = Namek)
The numerator denotes the number of native-born Americans who have the same name
as immigrant i in the 1920 and 1930 census, and the denominator denotes the maximum
frequency of a first name among native-born Americans in 1920 and 1930. The index is
bounded between zero and one, with higher values denoting more American names. The
subscript c denotes a birth cohort. As with the GNI, I compute the AMI using information on
names of individuals born before the year a declaration was filed, to capture what immigrants
perceived to be an American name at the time they filed their first papers.
Figure 3 plots counts of naturalization documents from the Illinois and Pennsylvania
collections over time, and Table 3 presents summary statistics for those immigrants for whom
both a declaration of intention and a petition for naturalization are found in the court records.
1An additional reason to use the frequency-based AMI instead of the FNI is because many immigrantnames in the naturalization data never appear in the census. Although I assign the AMI a zero value for thosenames, their respective FNI is missing. Intuitively, a name cannot be distinctive of any nationality if neitherimmigrants nor natives in the census have that name. Any results reported using the AMI are similar whenthe FNI is used instead but are often insignificant because the number of observations is substantially lower inthe latter case.
10

4 Results
4.1 Main estimates
The main finding is illustrated graphically in Figure 4. The left panel plots the average and
the right panel the median GNI by birth cohort for US-born male children with at least one
German parent. There is a clear assimilation trend throughout the period of reference, from
1880 on, which is, however, punctuated by a break roughly coinciding with the entry of the
US in the war. A similar pattern is revealed by the evolution of the median GNI: this is
fairly stable until 1918, when it drops precipitously and remains at a low level until the late
1920s. Figure 5 presents the results of a more systematic effort to identify a breakpoint in the
GNI time series. The figure plots p-values from a Wald test for a break in the linear trend
in each of the years 1900-1925. A range of low p-values identifies the period 1918–1921 as a
structural break in naming patterns. The sharp reaction of names to the war validates their
use as a measure of assimilation effort that reflects a choice on the part of the parents. A slow
response of naming patterns to the war could reflect, for example, changes in intermarriage
rates among Germans, which could be endogenous to native attitudes. Instead, an abrupt
change is more consistent with a change in immigrant behavior.
I then proceed to compare Germans to other ethnic groups in the US. Table 4 reports
the results of a difference-in-differences estimation, as specified in equation 1. Column (1)
reports a simple comparison between cohorts born before and after 1917 across Germans and
other ethnicities. Column (2) additionally controls for a linear trend in naming patterns.
Germans have on average a lower FNI than other ethnic groups. This partly reflects the
overlap in naming patterns among Germans and other ethnicities, such as Anglo-Saxons
or Scandinavians, and partly the fact that many third- or higher generation Germans with
potentially German-sounding names are classified as natives in the census. This was less likely
for less-established immigrant groups from Eastern or Southern Europe. The interaction
coefficient indicates a higher drop in the FNI for Germans born during and after WWI.
Columns (3) and (4) progressively introduce birth cohort and ethnicity fixed effects. The
magnitude of the interaction coefficient implies a change equivalent to that from Werner or
Julius – both names in the 90th percentile of the pre-war GNI distribution – to a name such as
Carl, the Americanized version of the German Karl that is much less indicative of a German
11
origin. To account for potential differences in naming trends across ethnicities, in column (5),
I use as a dependent variable the residual of the FNI from a linear ethnicity-specific trend,
fitted to the pre-war period. While this reduces the size of the coefficient, the effect of the war
remains large and significant. In column (6), I control for state-of-birth fixed effects. This
does not change the estimated interaction effect by much.2
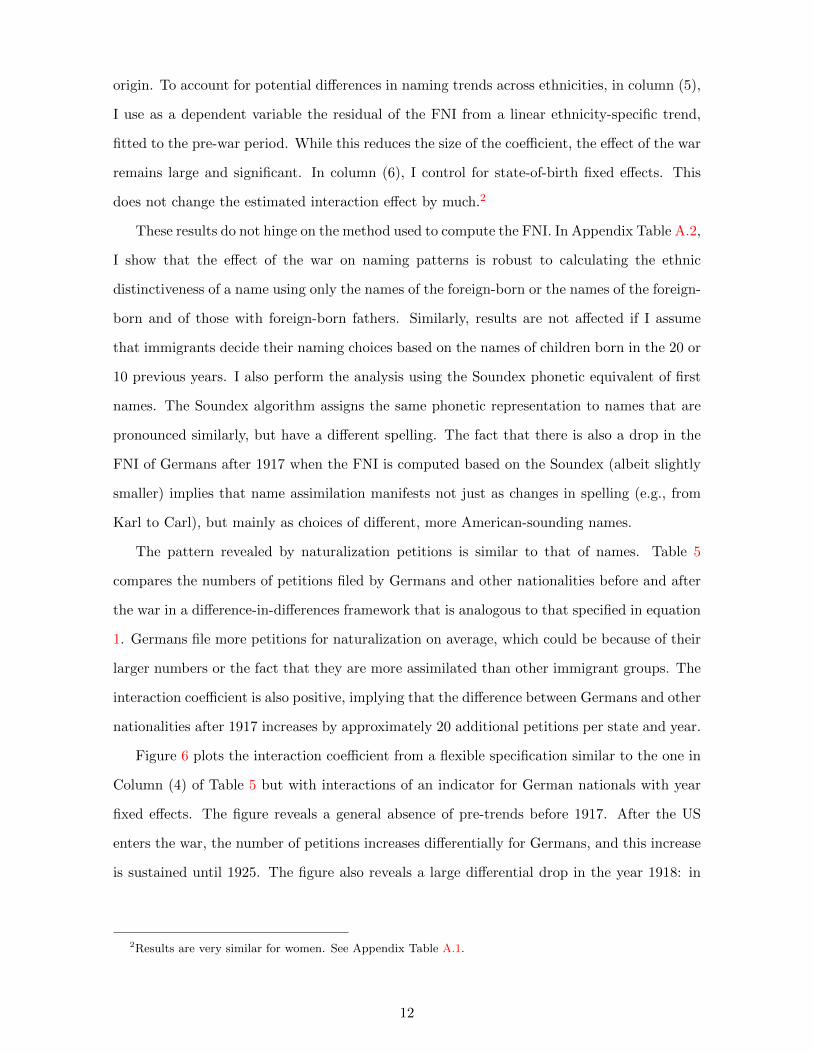
These results do not hinge on the method used to compute the FNI. In Appendix Table A.2,
I show that the effect of the war on naming patterns is robust to calculating the ethnic
distinctiveness of a name using only the names of the foreign-born or the names of the foreign-
born and of those with foreign-born fathers. Similarly, results are not affected if I assume
that immigrants decide their naming choices based on the names of children born in the 20 or
10 previous years. I also perform the analysis using the Soundex phonetic equivalent of first
names. The Soundex algorithm assigns the same phonetic representation to names that are
pronounced similarly, but have a different spelling. The fact that there is also a drop in the
FNI of Germans after 1917 when the FNI is computed based on the Soundex (albeit slightly
smaller) implies that name assimilation manifests not just as changes in spelling (e.g., from
Karl to Carl), but mainly as choices of different, more American-sounding names.
The pattern revealed by naturalization petitions is similar to that of names. Table 5
compares the numbers of petitions filed by Germans and other nationalities before and after
the war in a difference-in-differences framework that is analogous to that specified in equation
1. Germans file more petitions for naturalization on average, which could be because of their
larger numbers or the fact that they are more assimilated than other immigrant groups. The
interaction coefficient is also positive, implying that the difference between Germans and other
nationalities after 1917 increases by approximately 20 additional petitions per state and year.
Figure 6 plots the interaction coefficient from a flexible specification similar to the one in
Column (4) of Table 5 but with interactions of an indicator for German nationals with year
fixed effects. The figure reveals a general absence of pre-trends before 1917. After the US
enters the war, the number of petitions increases differentially for Germans, and this increase
is sustained until 1925. The figure also reveals a large differential drop in the year 1918: in
2Results are very similar for women. See Appendix Table A.1.
12

this year, the US granted citizenship through expedited naturalization procedures to a large
number of foreign-born soldiers who enlisted in the US Army. The expedited process waived
the residency requirement, thus the obligation to file a declaration of intention, and allowed
many soldiers to become naturalized on the same day in which they filed their petition. This
exceptional provision did not apply to non-naturalized Germans, who were considered “enemy
aliens” under the Alien and Sedition Acts of 1798, which were invoked by President Wilson
(Kazal, 2004). To deal with this exceptional increase in the number of petitions for everyone
but Germans in 1918, regressions in columns (1) and (2) of Table 5 that do not include year
fixed effects nonetheless include a 1918 year indicator.
The detailed records of Illinois and Pennsylvania allow for tracking an individual immi-
grant’s name over time, as it is recorded upon arrival and later at the time of declaration
and petition. In practice, the vast majority of immigrants chose to Americanize their names
at the time they filed a declaration of intention, with only a very small proportion chang-
ing their name between declaration and petition.3 For this reason, I focus on declarations
of intention filed after 1911 and examine various measures of name Americanization at the
time of declaration. This restricted focus inevitably reduces the sample size, because only
1,464 individuals have a complete set of records that includes both the certificate of arrival
and later naturalization papers. I compare name Americanization among Germans and other
immigrants in a difference-in-differences specification of the form
Aint = γ + δDint + µn + κt + εint (2)
where Aint is a measure of name Americanization, Dint is an indicator for German immi-
grants filing a declaration of intention after 1917, and µn and κt are nationality and year of
declaration fixed effects, respectively. δ captures the differential change in name Americaniza-
tion for Germans compared to immigrants of other nationalities. Table 6 presents the results.
Columns (1) and (2) look at the change in a name’s conformity to American norms between
arrival and declaration. The dependent variable in column (1) is an indicator that equals one
3In the sample, there are only 86 (out of 3,101) cases of first name changes at the time of petition.
13

if the log AMI of the name at declaration is greater than the log AMI of the name stated at the
time of arrival; in column (2), it is a continuous measure of change.4 In both cases, I control
for the logarithm of a name’s AMI at the time of arrival. Immigrants with names closer to
the American norm would have less of an incentive to Americanize their name. Column (1)
shows that names of Germans who file a declaration of intention become on average more
American after 1917. Irrespective of the measure used, Germans tend to change their names
to an Americanized counterpart disproportionately more than other immigrants after 1917.
The declaration and petition documents were often filled out by a clerk and not by the
immigrant herself.5 At the same time, the certificates of arrival were filled out based on
the passenger lists of the ship the immigrant arrived on, so – unless the ship departed from
a country other than the immigrant’s origin country, as was often the case – they should
contain fewer misspelled names. These features may make for a mechanical increase in the
AMI between certificate and declaration. Although this does not explain the differential
increase for Germans after 1917, in columns (4)–(6) of Table 6, I report results using the
Soundex phonetic equivalent of names to account for the fact that immigration officers may
have been inadvertently Americanizing names in the naturalization records. This does not
substantially affect the results.
Figure 7 plots the coefficients on indicators for every two-year bin in the data, resulting
from a regression otherwise identical to those in Table 6. First names do not show any
noticeable change at the outbreak of WWI in Europe but become significantly Americanized
in 1917–1918. This effect does not carry over to the post-war years, though estimates for
years other than 1917 are noisy, because declarations filed by Germans are disproportionately
concentrated in that year (22 percent of the total, compared to 1-11 percent for every other
year). Overall, these patterns in name changes are consistent with those found among the
second generation and indicate that Germans responded to the war with efforts to hide their
identity and send signals of patriotism.
4I use the natural logarithm of the AMI to account for the fact that the index has a skewed distributionwith a mass at zero. To avoid loss of data when AMI=0, I use ln(AMI+x), where x is a small positive number.Results are robust to using levels instead of logs.
5In a 1921 congressional hearing, MR J.C.F. Gordon, chief naturalization examiner in the third district ofPhiladelphia, states: “...in my office...We give the alien all the assistance possible, filling out his papers forhim and properly advising him... .”
14
4.2 Ruling out alternative explanations
The above findings suggest that assimilation efforts are positively correlated with general
hostility. There are other complementary explanations of the results. One is return migration
to Germany. Bandiera, Rasul and Viarengo (2012) find the out-migration rate of Germans in
the decade 1910–1920 to be higher than 100 percent. If those less assimilated move out of the
country, leaving the more assimilated behind, then both Americanization of children’s names
and petitions for naturalization would increase.6 Together with voluntary out-migration, fear
of deportation might have also been driving the decisions of German immigrants. Though
actual cases of deportation in the period were few, they were in principle authorized by
the Alien and Sedition Act. If the likelihood of deportation was higher for non-naturalized
immigrants, as was presumably the case, then those immigrants would have a higher incentive
to maintain ties with Germany, in the form of German names for children. However, it is
also true that the incentive to assimilate to avoid deportation would have been higher for the
same individuals.
To directly assess whether assimilation during wartime can be entirely explained away
by selective out-migration, I exploit the fact that, for a subset of families, I can observe
children born both before and after the war. Comparing differences in the FNI of older
and younger siblings for Germans and other nationalities allows me to isolate the effect of
wartime hostility on parental decisions while keeping the sample composition constant. For
this purpose, I restrict my attention to a subset of the 1920 and 1930 1% IPUMS samples,
which consists of sons who live with their parents and with at least one male sibling at the
time of the census. For this subsample, I use a specification identical to equation 1, only now
including a family fixed effect. To the extent that out-migration distorted the characteristics
of the population of Germans that chose to remain in the US, this specification will account
for this distortion by considering changes in naming patterns within a family over time.
6The concern is in fact slightly more subtle. Using the 1920 and 1930 census already implies that I onlyobserve the selected sample of families who did not emigrate in 1918. However, even within this sample, thosewith children born right before the war were likely more constrained and less able to emigrate. For this subset,selection is less important than for those without young children who could emigrate at will. One would thenexpect that children born after 1917 come from more assimilated parents, a pattern that is confirmed in thedata. Second-generation Germans born after 1917 are more likely to have parents who have been in the countryfor longer and who are naturalized US citizens. Results are available upon request.
15

Table 7 presents the results. Columns (1) and (2) report the baseline specification in the
restricted subsample of families with more than one male child present in the household at the
time of the census. The effect of the war on names is generally smaller yet comparable to that
in the larger sample reported in Table 4. Columns (3) to (5) introduce family fixed effects.
The within-family effect is half in magnitude, which implies that changes in the composition
of the German population over time are largely responsible for the observed assimilation
patterns. Inclusion of fixed effects, however, is not enough to explain away the entire effect,
which remains positive and highly significant. This suggests that even after accounting for
out-migration, families of Germans who remained in the US did change their naming decisions
in response to the war. Inclusion of indicators for an individual’s birth order or state of birth
have only a marginal effect on the magnitude of the coefficient.
The data on petitions does not allow for directly testing how much of the post-1917 increase
is due to out-migration of Germans unwilling to become US citizens. It does, however, rule out
another alternative explanation for the observed surge in petitions. The year 1917 marks the
beginning of a series of controls on immigration imposed in the US. These initially included
literacy requirements, introduced by the Immigration Act of 1917, and later culminated in
the 1924 immigration quotas, which favored established immigrant groups at the expense of
newer arrivals from Southern and Eastern Europe, as well as from Asia. Part of the increase
in naturalization petitions filed by Germans could be because of their numbers increasing
among incoming immigrants, as immigration restrictions favored them over other nationalities.
To address this concern, I normalize petitions by the number of immigrant arrivals in each
nationality-year cell. To account for the five-year residency requirement for filing a petition, I
construct two measures for eligible recent arrivals using data from the reports of the Bureau of
Immigration, compiled by Ferenczi and Willcox (Willcox, 1929). I first use the total number of
arrivals of a specific nationality in the five to ten years before the petition was filed. Secondly,
I make use of the empirical distribution of years in the US at the time of filing a petition. I
construct a weighted sum of nationality-specific arrivals in prior years, where the weight of
year t corresponds to the share of immigrants that file a petition t years after their arrival
to the US. Normalized petitions are then equal to the total number of petitions divided by
the measure of eligible recent arrivals. Table 8 presents results using these two alternative
measures of normalized petitions as dependent variables in specifications identical to those in
16

Table 5. The estimated effects are substantially unaffected by this normalization.
Is increased assimilation after 1917 a response to discrimination or to the fact that Ger-
many was finding itself on the losing side of the war and German-Americans wanted to detach
themselves from it? Evidence from nationals of other countries that became involved in WWI
does not support the latter interpretation. Appendix Figure A.1 plots the mean FNI by eth-
nicity for all ethnic groups in the sample. The only other ethnic groups that change their
naming patterns exactly when the US enters the war are the Norwegians and the Swedes.
Although both Norway and Sweden remained neutral during WWI, the experience of Norwe-
gian and Swedish Americans was very similar to that of Germans. Their communities in the
Midwest and Minnesota came under attack and were accused of disloyalty for their attach-
ment to their native language and for their support of American neutrality. By 1918, they
found their languages banned from school curricula, and the majority of their newspapers
went out of circulation (Gillespie Lewis, 2004; Chrislock, 1981). At the same time, nation-
als of Germany’s major ally in WWI, Austria-Hungary, did not display a noticeable shift in
naming patterns. Despite being on the losing side of the war, the fact that Austria-Hungary
was a multiethnic empire protected its citizens from being readily singled out and targeted for
discrimination. These patterns are also inconsistent with other explanations, such as German
Americans investing more in their American identity because the war increased the cost of
return to their homeland. While the same considerations are present for Austro-Hungarians,
their assimilation efforts do not follow the same pattern.7
4.3 State-level anti-German sentiment
I construct two state-level measures of anti-Germanism. The first one uses patterns of support
for Democratic incumbent Woodrow Wilson in the 1916 Presidential election. Wilson’s cam-
paign against “hyphenated Americans,” which intensified after his second term in office and
the country’s entry in WWI, is best illustrated by his 1915 State of the Union address. “There
7Russians are another group that displays changes in naming patterns around World War I. Most of thischange, however, is due to a change in the group’s composition. Appendix Figure A.2 shows that the trendin the FNI closely follows the share of those with Yiddish-speaking fathers in the data. It seems that mostcharacteristically Russian names pre-1910 are in fact characteristically Jewish. The FNI within the groups ofthose with Yiddish and non-Yiddish speaking fathers is stable around 1917. Unfortunately, I cannot examinethese patterns after 1920 because information on mother tongue is only available in the 1920 census.
17

are citizens of the United States, ... born under other flags but welcomed under our generous
naturalization laws to the full freedom and opportunity of America, who have poured the poi-
son of disloyalty into the very arteries of our national life.” Such men, he advised Congress,
“must be crushed out ... the hand of our power should close over them at once.” The Wilson
administration and the President himself openly supported the anti-hyphen movement that
after 1917 manifested in acts of harassment and violence against German Americans suspected
of disloyalty.
As the map of the 1916 election reveals, the states that did not support Wilson were
disproportionately concentrated in the Midwest and Great Plains, all regions with large Ger-
man American populations. Indeed, German Americans in their majority rallied behind the
republican candidate Charles E. Hughes (Luebke, 1974). Instead of vote shares, which, apart
from German-specific negative attitudes, also capture broader partisan divisions across states,
I use a measure that captures the increase in the vote share for Woodrow Wilson between
1912 and 1916. This is constructed as follows:
Wilsons =1−W 12
s
1−W 16s
where W 12s is a state-level vote share for Wilson in the presidential election of 1912 and W 16
s
is the respective vote share in the election of 1916. While this measure is similar to the simple
difference in vote shares between 1912 and 1916, it disproportionately weighs increases in
states that registered a higher initial support for Wilson. This accounts for the fact that any
given increase in the vote share in percentage point terms is harder to achieve when a state
starts from an already high initial vote share.
I assign this measure to individuals based on their state of birth. Figure 8 plots the median
GNI by birth cohort for states with below- and above-median change in support for Wilson in
1916. The pattern is once again striking: while the trends are roughly parallel before the war,
1918 constitutes a break in the trend for both groups of states, but is more pronounced in
states that showed a higher increase in support for Wilson, thus expressing more pro-war and
anti-German sentiment. Panel A of Table 9 analyzes the same pattern more systematically in
a differences-in-differences framework, comparing how the difference in the GNI of Germans
born before and after the war varies by the change in vote shares for Wilson in 1916. The inter-
18
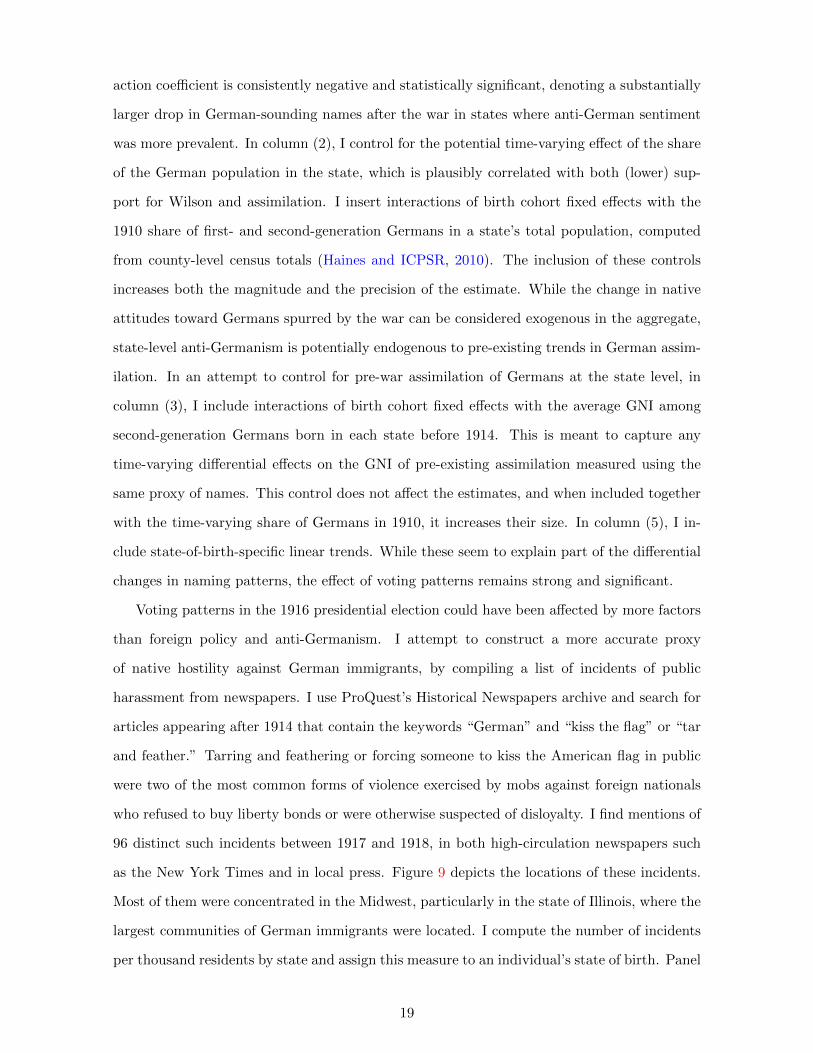
action coefficient is consistently negative and statistically significant, denoting a substantially
larger drop in German-sounding names after the war in states where anti-German sentiment
was more prevalent. In column (2), I control for the potential time-varying effect of the share
of the German population in the state, which is plausibly correlated with both (lower) sup-
port for Wilson and assimilation. I insert interactions of birth cohort fixed effects with the
1910 share of first- and second-generation Germans in a state’s total population, computed
from county-level census totals (Haines and ICPSR, 2010). The inclusion of these controls
increases both the magnitude and the precision of the estimate. While the change in native
attitudes toward Germans spurred by the war can be considered exogenous in the aggregate,
state-level anti-Germanism is potentially endogenous to pre-existing trends in German assim-
ilation. In an attempt to control for pre-war assimilation of Germans at the state level, in
column (3), I include interactions of birth cohort fixed effects with the average GNI among
second-generation Germans born in each state before 1914. This is meant to capture any
time-varying differential effects on the GNI of pre-existing assimilation measured using the
same proxy of names. This control does not affect the estimates, and when included together
with the time-varying share of Germans in 1910, it increases their size. In column (5), I in-
clude state-of-birth-specific linear trends. While these seem to explain part of the differential
changes in naming patterns, the effect of voting patterns remains strong and significant.
Voting patterns in the 1916 presidential election could have been affected by more factors
than foreign policy and anti-Germanism. I attempt to construct a more accurate proxy
of native hostility against German immigrants, by compiling a list of incidents of public
harassment from newspapers. I use ProQuest’s Historical Newspapers archive and search for
articles appearing after 1914 that contain the keywords “German” and “kiss the flag” or “tar
and feather.” Tarring and feathering or forcing someone to kiss the American flag in public
were two of the most common forms of violence exercised by mobs against foreign nationals
who refused to buy liberty bonds or were otherwise suspected of disloyalty. I find mentions of
96 distinct such incidents between 1917 and 1918, in both high-circulation newspapers such
as the New York Times and in local press. Figure 9 depicts the locations of these incidents.
Most of them were concentrated in the Midwest, particularly in the state of Illinois, where the
largest communities of German immigrants were located. I compute the number of incidents
per thousand residents by state and assign this measure to an individual’s state of birth. Panel
19
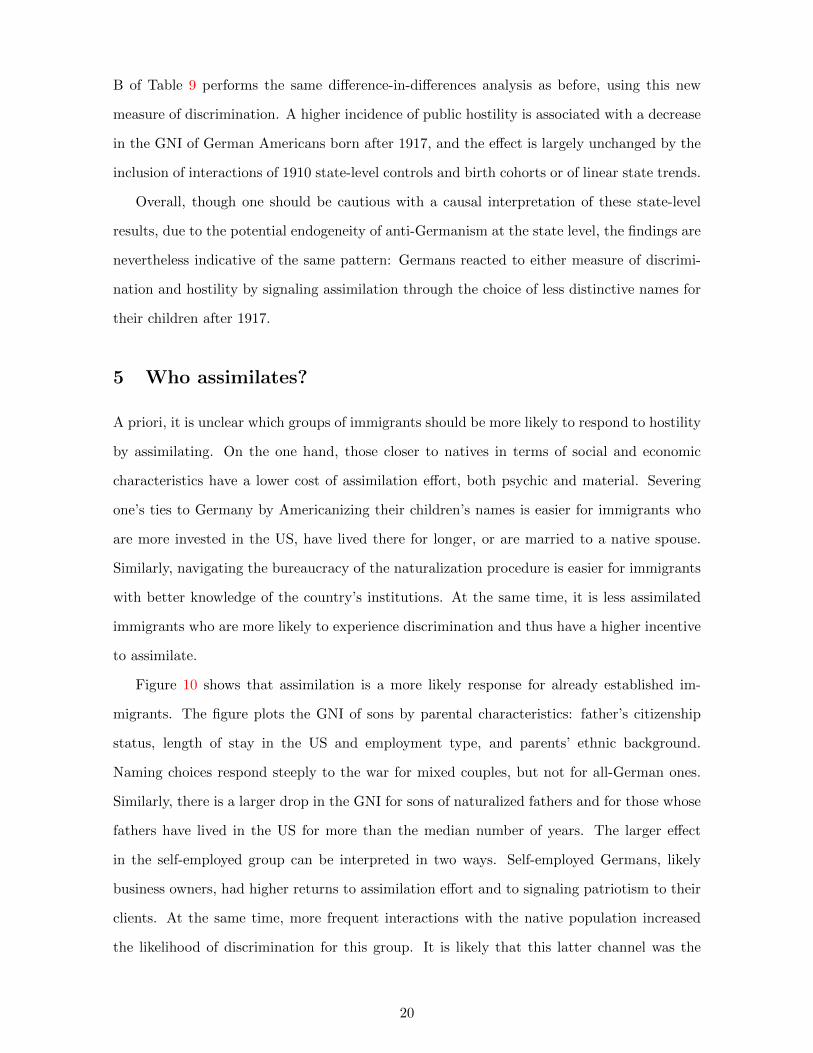
B of Table 9 performs the same difference-in-differences analysis as before, using this new
measure of discrimination. A higher incidence of public hostility is associated with a decrease
in the GNI of German Americans born after 1917, and the effect is largely unchanged by the
inclusion of interactions of 1910 state-level controls and birth cohorts or of linear state trends.
Overall, though one should be cautious with a causal interpretation of these state-level
results, due to the potential endogeneity of anti-Germanism at the state level, the findings are
nevertheless indicative of the same pattern: Germans reacted to either measure of discrimi-
nation and hostility by signaling assimilation through the choice of less distinctive names for
their children after 1917.
5 Who assimilates?
A priori, it is unclear which groups of immigrants should be more likely to respond to hostility
by assimilating. On the one hand, those closer to natives in terms of social and economic
characteristics have a lower cost of assimilation effort, both psychic and material. Severing
one’s ties to Germany by Americanizing their children’s names is easier for immigrants who
are more invested in the US, have lived there for longer, or are married to a native spouse.
Similarly, navigating the bureaucracy of the naturalization procedure is easier for immigrants
with better knowledge of the country’s institutions. At the same time, it is less assimilated
immigrants who are more likely to experience discrimination and thus have a higher incentive
to assimilate.
Figure 10 shows that assimilation is a more likely response for already established im-
migrants. The figure plots the GNI of sons by parental characteristics: father’s citizenship
status, length of stay in the US and employment type, and parents’ ethnic background.
Naming choices respond steeply to the war for mixed couples, but not for all-German ones.
Similarly, there is a larger drop in the GNI for sons of naturalized fathers and for those whose
fathers have lived in the US for more than the median number of years. The larger effect
in the self-employed group can be interpreted in two ways. Self-employed Germans, likely
business owners, had higher returns to assimilation effort and to signaling patriotism to their
clients. At the same time, more frequent interactions with the native population increased
the likelihood of discrimination for this group. It is likely that this latter channel was the
20
primary driver of assimilation decisions in this case. It has been documented that many
German-American entrepreneurs changed the names of their businesses to prove their loyalty
and did so in direct response to pressures by their communities.8
Table 10 presents the same results in a regression framework, both by fathers’ and by
mothers’ characteristics. All regressions include birth cohort fixed effects. Generally, parental
characteristics are correlated with the GNI in the expected way: mixed couples have children
with lower GNI than endogamous ones, and more years in the US or being self-employed
imply less German-sounding names for children. The exception is naturalized status, which
is correlated with more German names. In each case – with the exception of endogamy where
the post-war effect on the GNI is not statistically significant – the change in the GNI after the
war is larger for the more established groups of immigrants or those more likely to become
targets of hostility. Furthermore, an effect is present for both fathers and mothers. Citizenship
of fathers has a larger impact on post-war assimilation than that of mothers, but the pattern
is reversed for length of stay in the US.
There is a similar pattern for Germans who applied for citizenship in the wake of the war.
Using the Ancestry petition data, Figure 11 plots the average difference between immigration
and petition year, by year of petition. Starting around 1917, petitions are increasingly filed by
Germans who have been in the US for longer, while this pattern is less pronounced for other
nationalities. Table 11 shows this more systematically. German petitioners for citizenship
have lived longer in the US than other immigrant groups at the time of petition, but this
difference increases after 1917. The data from the Illinois and Pennsylvania district courts
looks qualitatively similar, both for petitions and for declarations of intention. As Figure 12
shows, immigrants who filed a declaration of intention after 1917 are older and have been in
the US for longer than earlier applicants at the time of declaration, with this increase being
more pronounced among Germans than among applicants from other nationalities. Average
years in the US reach a peak in 1917 for petitions as well. The bottom-right panel of the
8A prominent example was the German-American bank of Milwaukee that changed its name to the AmericanExchange Bank. A letter to the editor of the Wisconsin State Journal on January 12, 1918 reads: “Our lovefor America should not tolerate anything which is German ahead of anything which is American and we willnot tolerate it. The German-American bank [in Milwaukee] should be forced to discontinue business until itscompany chooses a name which is thoroughly American, purely Democratic, and PATRIOTIC.”
21

figure shows that Germans who file a petition at the start of WWI and in 1917 let on average
more time elapse between their first and second papers. Immigrants who had started the
naturalization process 8 or more years ago, rush to complete it at the wake of the war.
Once again, one has to be careful in interpreting the above effects causally, since war-time
hostility likely manifested differently for more and less assimilated Germans. Given, however,
that the latter were more likely to be discriminated, these results indicate that the cost of
assimilation effort is a more likely driver of outcomes than the intensity of discrimination.
There are other ways to interpret these findings. Alongside the cost of assimilation effort,
the returns to assimilation – or, equivalently, the costs from discrimination – are also het-
erogeneous. Established immigrants who have lived in a country for a long time and have
acquired citizenship have a higher incentive to defend these investments of time and effort
and may find available alternatives to assimilation, such as abandoning the US to return to
Germany, more costly. Additionally, any given effort to assimilate is more likely to succeed
and result in an immigrant’s acceptance by the native society if the immigrant already has a
profile that is sufficiently close to that of the natives. Other things equal, this would make
the likelihood of successful assimilation, or expected return of assimilation effort, higher for
established immigrants.
6 Discussion
How informative is the case of German Americans for the dynamics of discrimination and
assimilation today? Anti-Germanism during World War I is best described by a preference-
based model of discrimination, like Becker’s canonical approach. While statistical discrimi-
nation (Arrow, 1973; Phelps, 1972; Coate and Loury, 1993), which is motivated by a lack of
information on certain groups’ characteristics and reduces the return of their investment in
skill acquisition, might be an important driver of immigrants’ low integration today, there
is also sufficient evidence that anti-immigrant sentiment is motivated mostly by cultural and
not economic concerns (Sniderman, Hagendoorn and Prior, 2004; Hainmueller and Hopkins,
2014). If taste-based factors motivate native behavior and if immigrants have the option of
hiding their identifying ethnic or religious characteristics to fit in, then evidence from the
German American case indicates that they will do so and that such decisions will be mostly
22
made by individuals who have lower costs in sending assimilation signals.
More broadly, most models of discrimination do not allow for an assimilation choice for
members of the discriminated group. One exception is Eguia (2015), who models discrimina-
tion as a rational screening strategy, and shows that such a filtering mechanism is successful in
allowing only the highest skilled individuals to become members of the majority or dominant
group. This model, however, does not account for any taste-based discrimination mechanism.
Fearon (2013) models social mimicry, or the decision of agents to pass as members of another
group, when that group has a technology for detecting mimics. The model predicts that
passing rates will be decreasing in the quality of the target group’s detection technology. To
the extent that German Americans were physically and culturally close to Anglo-Saxons, the
cost involved for natives who wanted to detect potential infiltrators or spies would have been
high enough to allow for the high rates of assimilation that we observe empirically. This fact
also potentially delineates the differences of the German American case from, for example,
the case of Muslims in the West, which shares many similar features otherwise. The Germans’
lower physical and cultural distance from the native average implied lower assimilation costs –
e.g. name changes were much easier given existing similarities between German and American
names – or, conversely, a higher return to any given assimilation effort.
There is another reason why assimilation was a likely response to hostility for Germans in
the US. There is much evidence that harassment towards the German group was be specifically
intended to elicit signals of loyalty. Germans were more likely to be targeted for tarring and
feathering or verbal abuse if they made unpatriotic statements in support of Germany or
if they refused to buy liberty bonds. Bisin et al. (2011), in a formal model of assimilation
and oppositional identity, distinguish between conditional and unconditional harassment, the
former being dependent on the non-assimilated behavior of minorities. Minority groups are
more likely to assimilate to conditional discrimination, exactly because it gives them more of
an incentive to do so. If taste-based discrimination is not responsive to signals from the part
of the minority, then there is no reason to undertake costly assimilation actions.
23

7 Conclusion
I examine the responses of immigrants to taste-based discrimination using the case of German
Americans in the early 20th century US. World War I was an exogenous shock to natives’
attitudes, and during the war, many Germans suffered widespread harassment. I show that the
war coincides temporally with a large and persistent drop in the ethnic distinctiveness of names
of children born in the US to German parents, and an increase in name changes and in the
number of petitions for naturalization filed by Germans compared to other immigrant groups.
Name assimilation was higher in states that during the 1916 presidential election registered
higher support for Woodrow Wilson, the presidential candidate who targeted hyphenated
identities and demanded signs of loyalty from the German American community and in states
where more incidents of harassment against Germans took place during the war. Both name
assimilation and efforts to obtain US citizenship were higher for immigrants who had a more
“assimilated” profile, as indicated by intermarriage rates and length of stay in the US.
These findings have implications for an understanding of minority behavior and the dy-
namics of discrimination. While observed integration patterns such as intermarriage rates
and labor market outcomes are equilibrium outcomes that depend both on immigrants’ deci-
sions and the behavior of natives, both names and petitions for naturalization reflect purely
immigrant choices. The results indicate that the association between discrimination and low
integration observed in equilibrium would be even stronger in the absence of immigrant as-
similation efforts. To the extent that we can extrapolate these findings from Germans to other
immigrant groups, this research offers evidence that immigrants largely respond to hostility
by increased efforts to assimilate and invalidates claims that for certain groups, and due to
the lack of their own efforts, “there is no real assimilation.”9 World War I has had a profound
impact on the German group in the US, and its effects, on average, are comparable to the
effects of 9/11 for the large and heterogeneous group of Muslim Americans. At the same
time, the heterogeneity of responses among the immigrant population suggests that the costs
of assimilation effort are important drivers of immigrant decisions.
9Trump claims assimilation among American Muslims is “close” to “non-existent,” The Washington Post,June 16, 2016.
24
References
Abramitzky, Ran, Leah Platt Boustan, and Katherine Eriksson. 2014. “A Nation ofImmigrants: Assimilation and Economic Outcomes in the Age of Mass Migration.” Journalof Political Economy, 122(3): 467–717.
Abramitzky, Ran, Leah Platt Boustan, and Katherine Eriksson. 2016. “CulturalAssimilation during the Age of Mass Migration.” NBER Working Paper 22381.
Adida, Claire L., David D. Laitin, and Marie-Anne Valfort. 2014. “Muslims in France:Identifying a Discriminatory Equilibrium.” Journal of Population Economics, 27(4): 1039–1086.
Algan, Yann, Thierry Mayer, and Mathias Thoenig. 2013. “The Economic Incentivesof Cultural Transmission: Spatial Evidence from Naming Patterns across France.” CEPRDiscussion Papers 9416.
Arrow, Kenneth J. 1973. “The Theory of Discrimination.” In Discrimination in LaborMarkets. , ed. O. Ashenfelter and A. Rees. Princeton, N.J.:Princeton University Press.
Bandiera, Oriana, Imran Rasul, and Martina Viarengo. 2012. “The Making of ModernAmerica: Migratory Flows in the Age of Mass Migration.” CEPR Discussion Paper 9248.
Biavaschi, Costanza, Corrado Giulietti, and Zahra Siddique. 2013. “The EconomicPayoff of Name Americanization.” IZA Discussion Paper 7725.
Bisin, Alberto, Eleonora Patacchini, Thierry Verdier, and Yves Zenou. 2011.“Formation and Persistence of Oppositional Identities.” European Economic Review,55(8): 1046–1071.
Chrislock, Carl H. 1981. Ethnicity Challenged: The Upper Midwest Norwegian?AmericanExperience in World War I. North-field, Minnesota:Norwegian-American Historical Asso-ciation.
Coate, Steven, and Glenn Loury. 1993. “Will Affirmative-Action Policies Eliminate Neg-ative Stereotypes?” American Economic Review, 83(5): 1220–1240.
Conzen, Cathleen Neils. 1980. “Germans.” In Harvard Encyclopedia of American Eth-nic Groups. , ed. Stephan Thernstrom, Ann Orlov and Oscar Handlin. Cambridge, Mas-sachusetts:Belknap Press of Harvard University Press.
Cook, Lisa D, Trevon D Logan, and John M Parman. 2013. “Distinctively BlackNames in the American Past.” NBER Working Paper 18802.
Dancygier, Rafaela M., Karl-Oskar Lindgren, Sven Oskarsson, and Kare Vernby.2015. “Why Are Immigrants Underrepresented in Politics? Evidence from Sweden.” Amer-ican Political Science Review, 109: 703–724.
Davila, Alberto, and Marie Mora. 2005. “Changes in the Earnings of Arab Men in theUS between 2000 and 2002.” Journal of Population Economics, 18(4): 587–601.
Duguet, Emmanuel, Noam Leandri, Yannick L’Horty, and Pascale Petit. 2010. “AreYoung French Jobseekers of Ethnic Immigrant Origin Discriminated Against? A ControlledExperiment in the Paris Area.” Annals of Economics and Statistics, 99: 187–215.
25

Eguia, Jon. 2015. “Discrimination and Assimilation.” Michigan State University workingpaper.
Fearon, James D. 2013. “Strategic Dynamics of Social Mimicry.” Stanford University work-ing paper.
Fouka, Vasiliki. 2016. “Backlash: The Unintended Effects of Language Prohibition in USSchools after World War I.” Stanford University working paper.
Fryer, Roland G., and Steven D. Levitt. 2004. “The Causes and Consequences of Dis-tinctively Black Names.” The Quarterly Journal of Economics, 119(3): 767–805.
Gillespie Lewis, Anne. 2004. Swedes in Minnesota. St Paul, Minnesota:Minnesota Histor-ical Society Press.
Gomez, Angel, Francisco J. Morales, Sonia Hart, Alexandra Vazquez, andWilliam B. Swann Jr. 2011. “Rejected and Excluded Forevermore, but Even MoreDevoted : Irrevocable Ostracism Intensifies Loyalty to the Group Among Identity-FusedPersons.” Personality and Social Psychology Bulletin, 37(12): 1574?1586.
Gould, Eric D, and Esteban F Klor. 2015. “The Long-Run Effect of 9/11: Terrorism,Backlash, and the Assimilation of Muslim Immigrants in the West.” The Economic Journal.
Haines, Michael R., and ICPSR. 2010. Historical, Demographic, Economic, and SocialData: The United States, 1790-2002 [Computer file]. ICPSR02896-v3. Ann Arbor, MI:Inter-university Consortium for Political and Social Research [distributor].
Hainmueller, Jens, and Daniel J Hopkins. 2014. “Public Attitudes toward Immigration.”Annual Review of Political Science, 17: 225–49.
Hainmueller, Jens, and Dominik Hangartner. 2013. “Who Gets a Swiss Passport?A Natural Experiment in Immigrant Discrimination.” American Political Science Review,107: 159–187.
Head, Keith, and Thierry Mayer. 2008. “Detection of Local Interactions from the SpatialPattern of Names in France.” Journal of Regional Science, 48(1): 67–95.
Higham, John. 1998. Strangers in the Land: Patterns of American Nativism, 1860-1925.New Brunswick:Rutgers University Press.
Kazal, Russell. 2004. Becoming Old Stock: The Paradox of German-American Identity.Princeton, N.J.:Princeton University Press.
Lieberson, Stanley. 2000. A Matter of Taste: How Names, Fashions, and Culture Change.New Haven:Yale University Press.
Luebke, Frederick C. 1974. Bonds of Loyalty: German-Americans and World War I.Urbana:Northern Illinois University Press.
Luebke, Frederick C. 1999. Germans in the New World: Essays in the History of Immi-gration. Urbana:University of Illinois Press.
Lyons-Padilla, Sarah, Michele J Gelfand, Hedieh Mirahmadi, Mehreen Farooq,and Marieke van Egmond. 2015. “Belonging Nowhere: Marginalization & RadicalizationRisk among Muslim Immigrants.” Behavioral Science & Policy, 1(2): 1–12.
26

Manning, Alan, and Sanchari Roy. 2010. “Culture Clash or Culture Club? NationalIdentity in Britain.” The Economic Journal, 120(542).
Mill, Roy, and Luke C.D. Stein. 2015. “Race, Skin Color, and Economic Outcomes inEarly Twentieth-Century America.” Arizona State University Mimeo.
Mitts, Tamar. 2016. “From Isolation to Radicalization: The Socioeconomic Predictors ofSupport for ISIS in the West.” Columbia University working paper.
Moser, Petra. 2012. “Taste-Based Discrimination. Evidence from a Shift in Ethnic Prefer-ences after WWI.” Explorations in Economic History, 49(2): 167–188.
Neeraj, Kaushal, Robert Kaestner, and Cordelia Reimers. 2005. “Labor MarketEffects of September 11th on Arab and Muslim Residents of the United States..” Journalof Population Economics, 18(4): 587–601.
Nix, Emily, and Nancy Qian. 2015. “The Fluidity of Race: “Passing” in the United States,1880-1940.” NBER Working Paper 20828.
Oreopoulos, Philip. 2011. “Why do skilled immigrants struggle in the labor market? Afield experiment with thirteen thousand resumes.” American Economic Journal: EconomicPolicy, 3: 148–71.
Phelps, Edmund S. 1972. “The Statistical Theory of Racism and Sexism.” American Eco-nomic Review, 62: 659–61.
Ruggles, Steven, J. Trent Alexander, Katie Genadek, Ronald Goeken,Matthew B. Schroeder, and Matthew Sobek. 2010. Integrated Public Use MicrodataSeries: Version 5.0 [Machine-Readable Database]. University of Minnesota.
Schildkraut, Deborah J. 2005. “The Rise and Fall of Political Engagement among Latinos:The Role of Identity and Perceptions of Discrimination.” Political Behavior, 27: 285–312.
Sniderman, Paul M, Louk Hagendoorn, and Markus Prior. 2004. “Predisposing Fac-tors and Situational Triggers: Exclusionary Reactions to Immigrant Minorities.” AmericanPolitical Science Review, 98(01): 35–49.
Sowell, Thomas. 1996. Migration and Cultures. New York:Basic Books.
US Department of Labor, Bureau of Naturalization. 1913. Annual report of the Com-missioner of Naturalization to the Secretary of Labor. US Department of Labor.
Willcox, Walter F. 1929. “Statistics of Migrations, National Tables, United States.” InInternational Migrations, Volume I: Statistics. , ed. Walter F. Willcox, 372–498. Cambridge,Massachusetts:NBER.
Williams, Kipling D, and Kristin L Sommer. 1997. “Social Ostracism by Coworkers:Does Rejection Lead to Loafing or Compensation?” Personality and Social PsychologyBulletin, 23(7): 693–706.
27

Figures and Tables
Figure 1. Foreign name index by ethnicity
02
04
06
0
Me
an
Fo
reig
n N
am
e I
nd
ex
Austr
ian
Belg
ian
Danis
h
Englis
h
Fin
nis
h
Fre
nch
Germ
an
Iris
h
Italia
n
Norw
egia
n
Port
uguese
Russia
n
Scottis
h
Sw
edis
h
Sw
iss
Wels
h
Notes: The figure plots the mean FNI by ethnic group among second-generation immigrant men in the US
born 1880–1930. Individuals are assigned the ethnicity of the father, unless the father is US-born in which
case ethnicity is assigned on the basis of the mother’s birthplace. Data are from the 1920 and 1930 1% IPUMS
samples (Ruggles et al., 2010). For details on the calculation of the FNI, see Section 3.
28

Figure 2. Petitions by nationality, 1911-1925
02
,00
04
,00
06
,00
08
,00
01
0,0
00
To
tal p
etitio
ns 1
91
1−
19
25
Austr
ia−
Hungary
Belg
ium
Bulg
aria
Canada
Denm
ark
Engla
nd
Fin
land
Fra
nce
Germ
any
Gre
ece
Holla
nd
Irela
nd
Italy
Norw
ay
Pola
nd
Port
ugal
Rom
ania
Russia
Scotland
Spain
Sw
eden
Sw
itzerland
Turk
ey
Wale
s
Notes: The vertical bars show the total number of petitions for naturalization filed by immigrants of each
nationality between 1911 and 1925, and that have been digitized by Ancestry.com. Records come from the
states of California, Maryland, Pennsylvania, and Virginia.
Figure 3. Pennsylvania and Illinois naturalization documents
01
00
20
03
00
40
0
Nu
mb
er
of
do
cu
me
nts
1874
1875
1880
1881
1882
1883
1884
1885
1886
1887
1888
1889
1890
1891
1892
1893
1894
1895
1896
1897
1898
1899
1900
1901
1902
1903
1904
1905
1906
1907
1908
1909
1910
1911
1912
1913
1914
1915
1916
1917
1918
1919
1920
1921
1922
1923
1924
1925
Petitions Declarations Certificates
Notes: The vertical bars show the total number of naturalization documents in the sample of naturalization
records of the Illinois and Pennsylvania district courts.
29

Figure 4. Mean and median GNI of second-generation German men
45
50
55
60
Mean G
NI
1880 1890 1900 1910 1920 1930
Year of birth
48
50
52
54
56
58
Media
n G
NI
1880 1890 1900 1910 1920 1930
Year of birth
Notes: The figure plots the mean (left panel) and median (right panel) GNI by year of birth for US-born
men with at least one German-born parent. The gray vertical line corresponds to 1917, the year when the US
entered WWI.
Figure 5. Testing for a trend break in the GNI of second-generation Germans
0.2
.4.6
P−
va
lue
fro
m t
ren
d b
rea
k t
est
1890 1900 1910 1920 1930
Year of birth
Notes: The figure plots p-values from a Wald test of a break in the linear trend over the periods defined by
each year between 1900 and 1925. The data consists of second generation Germans born 1890–1930. The gray
vertical line corresponds to 1917.
30

Figure 6. Evolution of German petitions for naturalization
−1
50
−1
00
−5
00
50
10
0
Inte
ractio
n w
ith
Ge
rma
n
1912 1914 1916 1918 1920 1922 1924
Year of petition
Notes: The figure reports coefficient estimates and 90% confidence intervals from a regression of the total
number of petitions by nationality-year-state cell on nationality, year, and state fixed effects and interactions
of year indicators with a dummy for petitions filed by Germans.
31

Figure 7. Change in AMI between arrival and declaration
−1
−.5
0.5
1
Inte
ractio
n w
ith
Ge
rma
n
1913−1914 1915−1916 1917−1918 1919−1920 1921−1922
Year of declaration
Notes: The figure reports coefficient estimates and 90% confidence intervals from a regression of the change
in the log AMI between arrival and declaration on indicators for nationality and two-year bins of declaration
indicators and a set of interactions of two-year bins with an indicator for German nationals. The regression
controls for the log AMI of the first name in the certificate of arrival. The sample consists of Germans that filed
a declaration of intention between 1911 and 1923 in the Northern Illinois and Eastern Pennsylvania district
courts.
32

Figure 8. Evolution of naming patterns and state-level support for Woodrow Wilson
35
40
45
50
55
60
Me
dia
n G
NI
1880 1890 1900 1910 1920 1930
Year of birth
Above median
Below median
Notes: The figure plots the median GNI by birth cohort for a sample of second-generation German men.
The black line corresponds to states with above-median change in support for Woodrow Wilson in the 1916
presidential election, and the grey line to states with below-median change in support. The red vertical line is
drawn at 1917.
Figure 9. Harassment incidents against Germans, 1917–1918
Notes: The figure depicts towns where at least one incident of public harassment against Germans took place
during World War I, as reported in the press. Source: ProQuest Historical Newspapers.
33

Figure 10. Evolution of naming patterns by characteristics of the parents
30
40
50
60
70
Media
n G
NI
1880 1890 1900 1910 1920 1930
Year of birth
Father above median years in US
Father below median years in US
40
45
50
55
60
65
Media
n G
NI
1880 1890 1900 1910 1920 1930
Year of birth
Father naturalized citizen
Father non−naturalized
40
45
50
55
60
Media
n G
NI
1880 1890 1900 1910 1920 1930
Year of birth
One parent German
Both parents German
30
40
50
60
70
80
Media
n G
NI
1880 1890 1900 1910 1920 1930
Year of birth
Father self−employed
Father works for wages
Notes: The graphs plot the median GNI by birth year and by characteristics of the parents for a sample of
US-born men with at least one German-born parent. In the upper panel, the sample is restricted to men with
German-born fathers.
34

Figure 11. Average years in the US at time of petition
10
15
20
25
30
Ave
rag
e y
ea
rs in
US
at
tim
e o
f p
etitio
n
1910 1915 1920 1925
Year
German
Non−German
Notes: The figure plots the average difference between year of petition and year of arrival for Germans
(black line) and other nationalities (gray line). The data consist of petition counts by nationality-year-arrival
year-state cell.
Figure 12. Changes in applicant characteristics
51
01
52
0
Ye
ars
in
th
e U
S a
t tim
e o
f d
ecla
ratio
n
1910 1915 1920 1925
Year of declaration
25
30
35
40
45
Ag
e a
t tim
e o
f d
ecla
ratio
n
1910 1915 1920 1925
Year of declaration
51
01
52
02
5
Ye
ars
in
th
e U
S a
t tim
e o
f p
etitio
n
1910 1915 1920 1925
Year of petition
24
68
Ye
ars
ela
pse
d b
etw
ee
n d
ecla
ratio
n a
nd
pe
titio
n
1910 1915 1920 1925
Year of petition
German
Other
Notes: The figure plots the evolution of characteristics of applicants by year of declaration (upper panel) and
year of petition (lower panel) for a sample of immigrants who filed for naturalization between 1911 and 1923
in the Northern Illinois and Eastern Pennsylvania district courts.
35

Table 1. Most German names before and after World War I
Before 1917 After 1917
Name GNI Name GNI
August 93.39 Henry 77.84
Otto 92.41 Carl 75.45
Hugo 92.33 Albert 68.36
Herman 91.02 Paul 63.56
Conrad 91.17 Edward 61.53
Gustave 90.75 William 59.02
Christian 90.66 George 59.38
Emil 88.1 Frank 58.64
Rudolph 87.1 Walter 57.47
Adolph 86.59 Arthur 55.98
Notes: The table shows the values of the German Name In-dex (GNI) for the 10 most distinctive male names among second-generation Germans born 1880–1916 (left panel) and 1917–1930(right panel). The ranking is computed among names that appearat least 50 times in the data. Data are from the 1920 and 1930 1%IPUMS samples.
Table 2. Summary statistics: IPUMS data
Mean S.D. N
GNI 56.095 20.833 35752
One parent German 0.52 0.499 37711
Father US citizen 0.212 0.408 24580
Years of father in US 17.877 12.112 11224
Mother US citizen 0.344 0.475 25129
Years of mother in US 14.114 12.084 10450
Notes: The table reports summary statistics for men born in theUS between 1880 and 1930 who have at least one German-bornparent. Data are from the 1920 and 1930 1% IPUMS samples.
36

Table 3. Summary statistics: Illinois and Pennsylvania naturalization documents
Mean S.D. N
Years in the US at declaration 10.184 7.114 2524
Age at declaration 32.207 9.103 2287
Years between declaration
and petition 3.879 1.701 2527
Log AMI at arrival -7.170 3.595 1464
Log AMI at declaration -4.689 3.553 2532
Notes: The table reports summary statistics for immigrants whofiled a declaration of intention between 1911 and 1923 in the North-ern Illinois and Eastern Pennsylvania district courts.
Table 4. World War I and naming patterns
Dep. variable: FNI
[1] [2] [3] [4] [5] [6]
Born 1917 or later 1.296∗∗∗ 0.627∗∗
(0.192) (0.244)
German -0.939∗∗∗ -0.787∗∗∗ -0.699∗∗∗
(0.148) (0.151) (0.151)
German × -8.218∗∗∗ -8.354∗∗∗ -8.579∗∗∗ -6.255∗∗∗ -4.081∗∗ -3.906∗∗
born 1917 or later (0.457) (0.458) (0.458) (1.501) (1.402) (1.433)
Observations 131099 131099 131099 131099 131099 131099
R-squared 0.00326 0.00341 0.00444 0.0323 0.00333 0.0126
Linear time trend N Y N N N N
Year of birth FE N N Y Y Y Y
Ethnicity FE N N N Y Y Y
Linear ethnicity trends N N N N Y Y
State of birth FE N N N N N Y
Notes: The sample consists of men born in the US 1880–1930 to a foreign-born parent. Individuals are
assigned the ethnicity of the father, unless the father is US-born. The sample consists of the following eth-
nic groups: Italian, Irish, Belgian, French, Swiss, Portuguese, English, Scottish, Welsh, Danish, Norwegian,
Swedish, Finnish, Austrian, and Russian. The dependent variable in columns (5)–(6) is the residual from a
regression of the FNI on linear ethnicity-specific trends fitted to the pre-1917 period. Heteroscedasticity-robust
standard errors are reported in columns (1)–(3), and robust standard errors clustered at the ethnic group level
are reported in columns (4)-(6). Significance levels: *** p< 0.01, ** p< 0.05, * p< 0.1.
37

Table 5. Petitions for naturalization
Dep. variable: Number of petitions
[1] [2] [3] [4] [5]
German 29.39∗∗∗ 42.98∗∗∗ 42.92∗∗∗
(8.827) (9.135) (9.204)
After 1917 23.93∗∗∗ 30.87∗∗∗
(4.815) (5.519)
German × after 1917 25.59∗∗∗ 23.18∗∗∗ 24.04∗∗∗ 20.38∗∗∗ 22.56∗∗
(6.162) (6.595) (6.453) (6.757) (8.667)
Observations 950 950 950 950 950
R-squared 0.0517 0.216 0.225 0.480 0.348
Residence state FE N Y Y Y Y
Year FE N N Y Y Y
Country of origin FE N N N Y Y
Linear nationality trends N N N N Y
Notes: The unit of observation is a nationality-state-year cell (where state and year refer to the time and
place when a petition was filed). Columns (1) and (2) include an indicator for the year 1918. Data comprise of
the following nationalities: Austria-Hungary, Belgium, Bulgaria, Canada, Denmark, England, Finland, France,
Germany, Greece, Netherlands, Ireland, Italy, Norway, Poland, Portugal, Romania, Russia, Scotland, Spain,
Sweden, Switzerland, Turkey, and Wales. The dependent variable in column (5) is the residual from a regression
of petitions on linear nationality-specific trends fitted to the pre-1917 period. Standard errors are clustered at
the nationality level. Significance levels: *** p< 0.01, ** p< 0.05, * p< 0.1.
38

Table 6. Name Americanization
First name Soundex phonetic equivalent
Dep. variable: Higher log AMI Change Higher log AMI Change
in declaration in log AMI Log AMI in declaration in log AMI Log AMI
[1] [2] [3] [4] [5] [6]
German × 0.0689∗∗∗ 0.529∗∗∗ 0.484∗∗ 0.0989∗∗∗ 0.381∗∗∗ 0.754∗∗∗
after 1917 (0.0182) (0.176) (0.176) (0.0241) (0.126) (0.0793)
Observations 1464 1464 2532 1464 1464 2532
R-squared 0.381 0.383 0.246 0.282 0.358 0.137
Notes: The sample consists of immigrants who filed a declaration of intention in the Northern Illinois and
Eastern Pennsylvania district courts between 1911 and 1923. All regressions include nationality and year of
declaration fixed effects. Columns (1), (2), (4), and (5) control for the log AMI of the name in the certificate
of arrival. The dependent variable is an indicator for a log AMI higher at the time of declaration than at the
time of arrival in columns (1) and (4), the change in log AMI between certificate of arrival and declaration in
columns (2) and (5), and the log AMI at declaration in columns (3) and (6). Robust standard errors clustered
at the nationality level in parentheses. Significance levels: *** p< 0.01, ** p< 0.05, * p< 0.1.
Table 7. Accounting for out-migration
Dep. variable: FNI
[1] [2] [3] [4] [5]
German × -4.993∗∗∗ -4.892∗∗∗ -2.497∗∗∗ -2.685∗∗∗ -2.739∗∗∗
born 1917 or later (1.326) (1.295) (0.399) (0.438) (0.399)
Observations 55126 55126 55126 55126 55126
R-squared 0.0440 0.0570 0.498 0.498 0.499
State of birth FE N Y N N Y
Birth order FE N N N Y Y
Family FE N N Y Y Y
Notes: The sample consists of men born in the US 1880–1930 to a foreign-born father, or a native-born
father and a foreign-born mother, who live in the same household as their father and at least one male sibling
at census time. All regressions include birth year and ethnicity indicators. Ethnicity is assigned on the basis
of the father, unless the father is US-born. The sample consists of the following ethnic groups: Italian, Irish,
Belgian, French, Swiss, Portuguese, English, Scottish, Welsh, Danish, Norwegian, Swedish, Finnish, Austrian,
and Russian. Standard errors are clustered at the ethnicity level. Significance levels: *** p< 0.01, ** p< 0.05,
* p< 0.1.
39

Table 8. Petitions for naturalization normalized by immigrant arrivals
Dep. variable: Petitions as share Petitions as share
of arrivals of weighted arrivals
[1] [2] [3] [4]
German × after 1917 0.000859∗∗ 0.000787∗∗ 0.00768∗∗∗ 0.00698∗∗
(0.000342) (0.000340) (0.00268) (0.00255)
Observations 887 887 887 887
R-squared 0.137 0.202 0.170 0.325
Residence state FE N Y N Y
Notes: The unit of observation is a nationality-state-year cell (where state and year refer to the time and
place when a petition was filed). The dependent variable in columns (1) and (2) is the total number of petitions
in each cell divided by the total number of immigrant arrivals of the same nationality in the period 5 to 10 years
before the petition was filed. In columns (3) and (4), the denominator is the weighted average of arrivals in the
5 to 10 years before, where the weights are determined by the empirical distribution of years in the US at the
time of the petition. The sample consists of the following nationalities: Austria-Hungary, Belgium, Bulgaria,
Canada, Denmark, England, Finland, France, Germany, Greece, Netherlands, Ireland, Italy, Norway, Poland,
Portugal, Romania, Russia, Scotland, Spain, Sweden, Switzerland, Turkey, and Wales. Standard errors are
clustered at the nationality level. Significance levels: *** p< 0.01, ** p< 0.05, * p< 0.1.
40

Table 9. State-level anti-German sentiment and naming patterns
Dep. variable: GNI
Panel A State-level support for Woodrow Wilson
[1] [2] [3] [4] [5]
Wilson -5.674∗∗ -5.423∗
(2.627) (3.032)
Wilson × born 1917 or later -11.78∗ -15.87∗∗ -15.09∗∗ -19.21∗∗∗ -14.49∗∗
(6.766) (6.752) (6.872) (6.013) (6.254)
Observations 35623 35623 35623 35623 35623
R-squared 0.0210 0.0242 0.0287 0.0307 0.0110
Panel B State-level harassment incidents
Incidents per thousand -185.0 -232.1
(176.6) (178.5)
Incidents per thousand × -810.6∗∗ -778.9∗∗ -770.5∗∗ -882.9∗∗ -848.1∗∗
born 1917 or later (359.6) (347.1) (382.9) (389.1) (370.8)
Observations 35678 35678 35678 35678 35678
R-squared 0.0202 0.0233 0.0285 0.0304 0.0108
State FE N N Y Y Y
Year of birth FE × N Y Y Y Y
1910 German share
Year of birth FE × N N N Y Y
1910 GNI
Linear state trends N N N N Y
Notes: The sample consists of men born in the US 1880–1930 with at least one German-born parent. All
columns include birth year fixed effects. Wilson is a measure of increase in a state’s support for Woodrow
Wilson between the presidential elections of 1912 and 1916 and is defined in Section 4.1. Incidents per thousand
is the number of reported harassment incidents against Germans per thousand residents in the state during
WWI. 1910 German share is the share of first- and second-generation Germans in the total population of
the state in 1910. Data for the calculation of this variable are from ICPSR. 1910 GNI is the average GNI of
second-generation Germans born in the state before 1914. The dependent variable in column (5) is the residual
from a regression of the GNI on linear state-specific trends fitted to the pre-1917 period. Standard errors are
clustered at the state-of-birth level. Significance levels: *** p< 0.01, ** p< 0.05, * p< 0.1.
41

Table 10. Heterogeneity by parents’ characteristics
Dep. variable: GNI
[1] [2] [3] [4] [5] [6]
One parent German -6.222∗∗∗
(0.231)
One parent German × -0.696
born 1917 or later (0.911)
Father US citizen 2.111∗∗∗
(0.371)
Father US citizen × -6.068∗∗∗
born 1917 or later (1.402)
Mother US citizen 0.0570
(0.333)
Mother US citizen × -4.202∗∗∗
born 1917 or later (1.247)
Father years in US -0.129∗∗∗
(0.0203)
Father years in US × -0.147∗∗∗
born 1917 or later (0.0435)
Mother years in US -0.0693∗∗∗
(0.0193)
Mother years in US × -0.214∗∗∗
born 1917 or later (0.0537)
Father self-employed -0.498
(0.466)
Father self-employed × -2.062∗
born 1917 or later (1.102)
Observations 35752 23331 23866 10593 9894 10593
R-squared 0.0407 0.00665 0.0233 0.0335 0.0372 0.0249
Notes: The sample consists of men born in the US 1880–1930 with at least one German-born parent. All
regressions include birth year indicators. Columns (2), (4), and (6) restrict the sample to men with a German-
born father and columns (3) and (5) to men with a German-born mother. Heteroscedasticity-robust standard
errors in parentheses. Significance levels: *** p< 0.01, ** p< 0.05, * p< 0.1.
42

Table 11. Average years in the US at time of petition
Dep. variable: Average years in the US
[1] [2] [3] [4]
German 5.419∗∗∗ 5.195∗∗∗ 5.175∗∗∗
(0.643) (0.625) (0.623)
After 1917 1.979∗∗∗ 2.137∗∗∗
(0.394) (0.368)
German × after 1917 2.457∗∗∗ 2.349∗∗∗ 2.379∗∗∗ 2.210∗∗∗
(0.386) (0.375) (0.365) (0.334)
Observations 939 939 939 939
R-squared 0.126 0.173 0.188 0.377
Residence state FE N Y Y Y
Year FE N N Y Y
Country of origin FE N N N Y
Notes: The unit of observation is a nationality-state-year cell (where state and year refer to the time and
place when a petition was filed). Columns (1) and (2) include an indicator for the year 1918. Data comprise of
the following nationalities: Austria-Hungary, Belgium, Bulgaria, Canada, Denmark, England, Finland, France,
Germany, Greece, Netherlands, Ireland, Italy, Norway, Poland, Portugal, Romania, Russia, Scotland, Spain,
Sweden, Switzerland, Turkey, and Wales. Standard errors are clustered at the nationality level. Significance
levels: *** p< 0.01, ** p< 0.05, * p< 0.1.
43

A Appendix – Additional Figures and Tables
Figure A.1. Mean FNI by nationality40
50
60
70
Mean F
NI
1880 1890 1900 1910 1920 1930
Year of birth
Italian
40
50
60
70
Mean F
NI
1880 1890 1900 1910 1920 1930
Year of birth
Italian
55
60
65
70
Mean F
NI
1880 1890 1900 1910 1920 1930
Year of birth
Irish
30
40
50
60
70
Mean F
NI
1880 1890 1900 1910 1920 1930
Year of birth
Belgian
35
40
45
50
55
60
Mean F
NI
1880 1890 1900 1910 1920 1930
Year of birth
French
35
40
45
50
55
60
Mean F
NI
1880 1890 1900 1910 1920 1930
Year of birth
Swiss
40
50
60
70
80
Mean F
NI
1880 1890 1900 1910 1920 1930
Year of birth
Portuguese
52
53
54
55
56
Mean F
NI
1880 1890 1900 1910 1920 1930
Year of birth
English
50
55
60
65
70
Mean F
NI
1880 1890 1900 1910 1920 1930
Year of birth
Scottish
40
50
60
70
80
90
Mean F
NI
1880 1890 1900 1910 1920 1930
Year of birth
Welsh
40
45
50
55
60
Mean F
NI
1880 1890 1900 1910 1920 1930
Year of birth
Danish
40
45
50
55
60
Mean F
NI
1880 1890 1900 1910 1920 1930
Year of birth
Norwegian
45
50
55
60
Mean F
NI
1880 1890 1900 1910 1920 1930
Year of birth
Swedish
20
40
60
80
Mean F
NI
1880 1890 1900 1910 1920 1930
Year of birth
Finnish
40
45
50
55
60
Mean F
NI
1880 1890 1900 1910 1920 1930
Year of birth
Austrian
50
55
60
65
70
Mean F
NI
1880 1890 1900 1910 1920 1930
Year of birth
Russian
Notes: The figure plots the mean FNI by year of birth for US-born men with at least one foreign-born parent.
The red vertical line corresponds to 1917, the year when the US entered WWI. Data are from the 1920 and
1930 1% IPUMS samples.
44

Figure A.2. Russian immigrant group composition and FNI
50
55
60
65
70
Me
an
FN
I o
f se
co
nd
−g
en
era
tio
n R
ussia
ns
1880 1890 1900 1910 1920
Year of birth
.4.4
5.5
.55
Sh
are
with
Yid
dis
h−
sp
ea
kin
g f
ath
ers
1880 1890 1900 1910 1920
Year of birth
Notes: The figure plots the mean FNI by year of birth for US-born men with at least one Russian-born parent
(upper panel) and the share of second-generation Russians whose father has Yiddish as his mother tongue.
The gray vertical line is drawn at 1911. Data are from the 1920 and 1930 1% IPUMS samples.
45

Figure A.3. FNI by father’s monther tongue among second-generation Russians
40
50
60
70
80
90
Me
an
FN
I, Y
idd
ish
−sp
ea
kin
g f
ath
ers
1880 1890 1900 1910 1920
Year of birth
45
50
55
60
65
Me
an
FN
I, n
on
−Y
idd
ish
−sp
ea
kin
g f
ath
ers
1880 1890 1900 1910 1920
Year of birth
Notes: The figure plots the mean FNI by year of birth for US-born men with a Russian-born father whose
mother tongue is Yiddish (upper panel) or a language other than Yiddish (lower panel). The gray vertical
line corresponds to 1917, the year when the US entered WWI. Data are from the 1920 and 1930 1% IPUMS
samples.
46

Table A.1. World War I and naming patterns among women
Dep. variable: FNI
[1] [2] [3] [4] [5] [6]
Born 1917 or later -0.196 0.236
(0.185) (0.232)
German -1.028∗∗∗ -1.126∗∗∗ -1.045∗∗∗
(0.145) (0.148) (0.149)
German × -8.979∗∗∗ -8.890∗∗∗ -9.108∗∗∗ -7.767∗∗∗ -5.345∗∗∗ -5.105∗∗∗
born 1917 or later (0.463) (0.464) (0.463) (1.240) (1.110) (1.116)
Observations 131621 131621 131621 131621 131621 131621
R-squared 0.00384 0.00391 0.00500 0.0276 0.00367 0.0122
Linear time trend N Y N N N N
Year of birth FE N N Y Y Y Y
Ethnicity FE N N N Y Y Y
Linear ethnicity trends N N N N Y Y
State of birth FE N N N N N Y
Notes: The sample consists of women born in the US 1880–1930 to a foreign-born parent. Individuals
are assigned the ethnicity of the father, unless the father is US-born. The sample consists of the following
ethnic groups: Italian, Irish, Belgian, French, Swiss, Portuguese, English, Scottish, Welsh, Danish, Norwegian,
Swedish, Finnish, Austrian, and Russian. The dependent variable in columns (5)-(6) is the residual from a
regression of the FNI on linear ethnicity-specific trends fitted to the pre-1917 period. Heteroscedasticity-robust
standard errors are reported in columns (1)–(3), and robust standard errors clustered at the ethnic group level
are reported in columns (4)–(6). Significance levels: *** p< 0.01, ** p< 0.05, * p< 0.1.
47

Table A.2. FNI robustness
Dependent variable is FNI
Coefficient on
Method used to compute the FNI German × born 1917 or later Observations
Baseline -6.255∗∗∗ 131099
(1.501)
Foreign-born -6.743∗∗∗ 115493
(1.662)
Foreign-born and foreign-born fathers -6.720∗∗∗ 115493
(1.672)
Using 20 previous birth cohorts -6.255∗∗∗ 131096
(1.501)
Using 10 previous birth cohorts -6.239∗∗∗ 131060
(1.501)
Using name Soundex phonetic code -5.707∗∗∗ 139675
(1.226)
Notes: The sample consists of men born in the US 1880–1930 to a foreign-born father, or a native-born father
and a foreign-born mother, unless otherwise noted. It comprises of the following ethnic groups: Italian, Irish,
Belgian, French, Swiss, Portuguese, English, Scottish, Welsh, Danish, Norwegian, Swedish, Finnish, Austrian,
and Russian. All regressions include ethnicity and birth cohort fixed effects. Standard errors are clustered at
the ethnic group level. Significance levels: *** p< 0.01, ** p< 0.05, * p< 0.1.
48

Data Sources
Ancestry.com data on petitions for naturalization come from the following sources:
California
Naturalization Records of the U.S. District Court for the Southern District of California,
Central Division (Los Angeles), 1887-1940.NARA Microfilm Publication M1524, 244 rolls.
Records of District Courts of the United States, Record Group 21. National Archives, Wash-
ington, D.C.
Naturalization Records in the Superior Court of San Diego, California, 1883-1936.NARA
Microfilm Publication M1613, 19 rolls. National Archives Gift Collection, Record Group 200.
National Archives, Washington, D.C.
Naturalization Records in the Superior Court of Los Angeles, California, 1876-1915.NARA
Microfilm Publication M1614, 28 rolls. National Archives Gift Collection, Record Group 200.
National Archives, Washington, D.C.
Maryland
Naturalization Petitions of the U.S. District Court for the District of Maryland, 1906-1930.
NARA Microfilm Publication M1640, 43 rolls. Records of District Courts of the United States,
Record Group 21. National Archives, Washington D.C.
Pennsylvania
Naturalization Petitions of the U.S. Circuit and District Courts for the Middle District of
Pennsylvania, 1906-1930. NARA Microfilm Publication M1626, 123 rolls. Records of District
Courts of the United States, Record Group 21. National Archives, Washington, D.C.
Virginia
Naturalization Petitions of the U.S. District Court for the Western District of Virginia (Abing-
don), 1914-1929. NARA Microfilm Publication M1645, 2 rolls. Records of District Courts of
the United States, Record Group 21. National Archives, Washington, D.C.
Naturalization Petitions of the U.S. District and Circuit Courts for the Eastern District
of Virginia (Richmond), 1906-1929. NARA Microfilm Publication M1647, 10 rolls. Records
of District Courts of the United States, Record Group 21. National Archives, Washington,
D.C.
Naturalization Petitions of the U.S. District Court for the Western District of Virginia
(Charlottesville), 1910-1929. NARA Microfilm Publication M1646, 1 roll). Records of Dis-
49

trict Courts of the United States, Record Group 21. National Archives, Washington D.C.
Naturalization Petitions of the U.S. District Court for the Eastern District of Virginia
(Alexandria), 1909-1920. NARA Microfilm Publication M1648, 5 rolls. Records of the District
Courts of the United States, Record Group 21. National Archives, Washington D.C.
FamilySearch.org data on naturalization documents come from the following collections:
Illinois
Illinois, Northern District Petitions for Naturalization, 1906-1994. Images. FamilySearch.
http://FamilySearch.org : 14 June 2016. Citing U.S. District Court for the Eastern Division
of the Northern District of Illinois, 3/3/1905, NAID 593882. Records of District Courts of
the United States, 1685 - 2009, RG 21. National Archives at Chicago.
Pennsylvania
Pennsylvania, Eastern District Petitions for Naturalization, 1795-1931. Images. Family-
Search. http://FamilySearch.org : 14 June 2016. Citing NARA microfilm publication M1522.
Washington, D.C.: National Archives and Records Administration, n.d.
50


![Task Discrimination from Myoelectric Activity: A Learning ... · while in [1] we discriminated using the myoelectric activity of 16 human arm hand muscles, between reach to grasp](https://img.dokumen.tips/doc/110x75/5b1508f07f8b9a8f548d66ef/task-discrimination-from-myoelectric-activity-a-learning-while-in-1-we.jpg)