Embed Size (px)
Citation preview

How do dividend policies influence firm risks?
Henk von EijeUniversity of Groningen∗
Abhinav GoyalUniversity of Liverpool†
Cal MuckleyUniversity College Dublin‡
Abstract
We study the impact of firm dividend policies on firm risks in the United States, from1987 to 2011. The impact of a comprehensive set of dividend policies (cash dividendinitiations, omissions, the duration of the policies, the amounts of payout) is assessed ona set of important firm risks (total, idiosyncratic and systematic market risks, as wellas the Fama-French, 1993, size and distressed earnings risk factors). Unlike previouswork, we account for dividend policy path dependencies and self-selection bias. Wefind that dividend omissions increase idiosyncratic risk more than dividend initiationsreduce this risk. The asymmetry of effects is accentuated by the duration of the policyand the pay-out amount. Unlike findings from previous work, we show that the impactof dividend initiations and omissions on systematic market risks is relatively small.
JEL Classification: G35, G32, C58Keywords: dividends, total risk, idiosyncratic risk, systematic risk, self-selection,path dependency
∗E-mail: [email protected] Corresponding author: Henk von Eije, University of Groningen, Facultyof Economics and Business, Duisenberg Building 848, PO Box 800, 9700 AV, The Netherlands. The authorswould like to thank Bob Scapens for his comments on a previous version of this paper. The usual disclaimerapplies.†E-mail: [email protected]‡E-mail: [email protected].
1

1 Introduction
Dividend policy and firm risk are two major concepts in the field of corporate finance, butthe impact of dividend payment on firm risk has received scant attention in the literature.This may partly be due to the fact that the irrelevance theorem of Miller and Modigliani(1961) focuses on firm value, but not on firm risk. In fact, a consistent incorporation of riskin the value literature was established only three years later (Sharpe, 1964). Notwithstand-ing, risk has now become an important factor in explaining the well-known value effects ofpayout policies (Grullon, Michaely, and Swaminathan, 2002; Grullon and Michaely, 2004).
Two sets of theories of dividend policy determination have been devised, arising fromrelaxing the assumptions underpinning the Miller-Modigliani (1961) theorem, which are ofespecial importance within the field of corporate finance.1 The first is signalling theory(Bhattacharya, 1979, John and Williams, 1985, and Miller and Rock, 1985) which em-phasizes the importance of utilizing dividend policy, to diminish information asymmetrieswhich may arise between the management of the firm and the firm’s investors. The secondis the agency cost-based life cycle theory (Grullon et al. 2005, DeAngelo, DeAngelo andStulz, 2006). This theory implies that the decision to distribute or retain free cash flowsvaries according to the evolution of the phases of the firm’s financial life cycle, therebyreconciling Jensen’s agency theory (Jensen, 1986 and LaPorta et al., 2000) with life-cycletheory. Hence, firm dividend policies may impart value effects, either as an inadvertentmanifestation and/or as a deliberate signal on the part of management with respect to thephase of maturity of the financial life-cycle of the firm.
Positive value effects after unanticipated initiations and increases of dividends are well-documented (Charest, 1978; Healy and Palepu, 1988; Benartzi, Michaely, and Thaler, 1997;Grullon and Michaely, 2004; Charitou et al., 2011). Authors also report relatively largenegative value effects after unanticipated omissions of dividends or reductions in the amountof dividends (Charest, 1978; Healy and Palepu, 1988; Michaely, Thaler, and Womack, 1995;Chen, Shevlin, and Tong, 2007). The value effects after dividend policy changes are unlikelyto be solely caused by an associated adjustment in a firm’s expected profitability, as researchfindings indicate that dividend changes are not reliable signals of subsequent changes inprofitability (Watts, 1973; DeAngelo, DeAngelo and Skinner, 1996; Benartzi, Michaely andThaler, 1997; Grullon, Michaely and Swaminathan, 2002; Grullon et al., 2005).
The explanation of altered risk levels may thus constitute a major (or at least a reinforc-ing) channel via which dividend policies influence firm value. The risk based explanationis corroborated by empirical observations that dividend pay outs are correlated with lowerrisk (Pastor and Veronesi, 2003; Bartram, Brown and Waller, 2012) and that payout poli-cies may impact firm systematic risks (Grullon, Michaely, and Swaminathan, 2002; Grullonand Michaely, 2004). Furthermore, Brav et al. (2005) conduct a survey article and findthat managers tend to believe that there is a causal relation between higher dividends and
1Following Allen and Michaely, 2003, we do not focus here on the possible influence of personal taxesand clientele effects (Miller and Modigliani, 1961) or behavioral finance effects (Baker and Wurgler, 2004).
2

risk reductions. For these reasons, we analyse in this paper the impact of dividend policieson firm risk.
Firm risk is a multi-faceted concept. A firm’s stock return sensitivity to overall marketreturns (beta) should be complemented by its sensitivity to the small minus big ‘size’factor and the high minus low book to market ‘distressed earnings growth’ factor (Famaand French, 1993). As the firm progresses through its financial life-cycle it will become moremature and larger. Hence, the firm will exhibit a greater likelihood of distressed earningsgrowth and a smaller size risk factor effect. In addition, there is also substantive evidencethat idiosyncratic risk is integral in giving price signals to the market (Goyal and SantaClara, 2003) and that, moreover, this risk is increasingly important over time (Campbell etal., 2001 and Wei and Zhang, 2006). Finally, firms have become increasingly likely to default(Fama and French, 2004; Brown and Kapadia, 2007), and this underpins the importance oftotal risk (as a combination of systematic risk and idiosyncratic risk). For the managementof firms, it is thus relevant to know which risk measures, if any, are influenced by dividendpolicies, and if so, by how much. For science, it is relevant to learn whether or not valueenhancing (or value reducing) effects can be caused by dividend policies, and whether thismechanism operates via changes in systematic risk or primarily via changes in idiosyncraticand/or total risk. It is therefore appropriate to study the impact of dividend policies on allthese risk measures.
In order to motivate the range of payout policies examined, it is important to state thatit is expected that there is a different impact on firm risks according to the payout channel orcombination of payout channels adopted. This follows due to the stylized contexts in whichcash dividends and/or share repurchases payout policies tend to be realized. As young firmstend to have relatively rich investment opportunity sets (Fama and French 1993; Grullonand Michaelly 2004), and limited earnings, retention tends to dominate distribution; whilemature firms accumulate earnings and face a deteriorating investment opportunity set, suchthat distribution dominates retention to mitigate associated agency costs. Indeed, as a firmprogresses in its financial life cycle, with progression from a transitory income to predomi-nantly permanent income (Jagannathan, Stephens and Weisbach, 2000; Guay and Harford,2000), a firm tends to commence pay out using share repurchases or share repurchases anddividends2, and with the maturation of the firm’s income stream, it may decide to paydividends exclusively.3 This makes it likely that the perceived reduction of risk, on the partof the market, will be larger when firm managers decide to pay cash dividends instead ofconducting share repurchases or when it is decided to conduct a combination of the twopayout types. Hence, it is likely that risk effects of dividend pay out changes will differfor firms with different previous payout policies - channels of pay out, payout amount and
2Twu (2010) finds that prior payout channels are strongly predictive of decisions of future payouts. More-over, Bhargava (2010) shows that path dependency also exists with respect to amounts paid. Repurchasesdo not significantly influence dividend amounts, while higher dividend amounts do reduce repurchases.
3The group of payers distributing a combination of cash dividends and share repurchases has becomeincreasingly important in comparison to the firms that distribute solely through dividends (Skinner, 2008and Renneboog and Trojanowsky, 2011).
3

payout duration.
Even after correction for the previous payout channel, payout amount and payout du-ration, an analysis of the impact of pay outs on firm risk is not straightforward, becausefirm risk itself may impact the decision to pay. In his seminal paper, Lintner (1956) indi-cates that managers consider earnings stability as a major determinant of dividend policy(Lambrecht and Myers, 2012). They show that dividend paying firms gradually increasedividends in the direction of the desired payout of net earnings with a view to avoidingreductions in dividends in the future. This means that dividend policies of firms are influ-enced by the risk perceptions of their managers. In this vein, Hoberg and Prabhala (2008)find that systematic and idiosyncratic risks are both significant determinants of the propen-sity to pay dividends, and Chay and Suh (2009) find that the standard deviation of themonthly stock market returns (during the previous two years) is a major factor in settingpayout policies. In addition, Charitou et al. (2011) find that there is a significant reductionin default risk in the year prior to a dividend increase or initiation. These findings implythat measurements of the impact of payout policies on risk should take into account thefact that the risk position of the firm may also influence such policies. In this paper wecorrect for self-selection in payout policies based on previous risk.
We study firms listed in the United States and we perform propensity score matchinghypotheses tests (Rosenbaum and Rubin, 1983 and Li and Zhao, 2006) and conduct testsusing the system GMM estimator on dynamic panels (Arellano and Bover, 1995 and Blun-dell and Bond, 1998) to measure the impact of a comprehensive set of dividend policies onfirm risks. This allows verification of whether there are indeed risk reductions after initi-ating dividends, whether the effects differ for dividend payments or a combination of thedividends and repurchases, whether these effects occur only at the initiation of a policy orwhether risk reductions also arise from a longer duration of payouts and/or higher dividendamounts paid and whether firm risks vary inversely in respect to dividend omissions.
Using up to 59,091 fiscal year observations together with the Fama and French (1993)risk factors to disaggregate firm risk, we identify four main findings for the relation betweendividend policies and firm risk. First, cash dividend payers are associated with the lowesttotal risk, while not paying or conducting share repurchases is associated with higher totalrisk. Second, the longevity of the dividend policy is inversely associated with total riskalthough not to systematic risk. Third, the propensity score matching (on previous payoutpolicy, total risk, industry and year) methodology added to the difference-in-differences ap-proach shows causality between dividend initiations and omissions and firm risks. Dividendinitiations and omissions are shown not to impact systematic risk measures significantly orconsistently. Initiations do slightly reduce total and idiosyncratic risks while omissionsmarkedly increase these latter risks. Fourth, we account for the latter asymmetry of ini-tiating and omitting dividends which may be indicative of a gradual change in investors’perceptions during the time that a dividend policy is in effect. We show, using dynamicGMM panel data estimates, that pay out amounts do not impact systematic risks while cashdividend payout durations exhibit relatively small negative effects. Total and idiosyncratic
4

risk exhibit pronounced negative effects from exclusive cash dividend payment durationsand there is a negative effect on idiosyncratic risk from the cash dividend amount paid. As aresult, we conclude that any prolonged value effects (value drift) are not really attributableto systematic market risk reductions, but that such effects are more likely to be caused byidiosyncratic or total risk reductions.
The outline of the article is as follows. Section 2 states the hypotheses tested and ex-plains why the difference-in-differences propensity score matching (PSM) tests and dynamicpanel generalized method of moments (GMM) system estimator approaches are appropriate.Section 3 presents information about the dataset. Section 4 presents associative descriptivestatistics. Section 5 and 6 present the main results concerning causal relations betweenpayout policies and firm risk. Section 7 reports the main conclusions.
2 Hypotheses tests and methodologies
We focus on extending the previous literature by conducting two sets of hypotheses tests,using difference-in-differences propensity score matching (PSM) tests (Rosenbaum and Ru-bin, 1983 and Li and Zhao, 2006) and generalised method of moment (GMM) dynamicpanel system estimators (Blundell and Bond, 1998), to examine the impact of cash divi-dend payout policies on firm risks. The first set of hypotheses is based on the influenceof dividend initiations and omissions on firm risks (Fama and French, 1993). The secondand third sets of hypotheses tests examine the related influence of the duration of payoutand the payout amounts. Contrary to previous adopted approaches (Grullon, Michaelyand Swaminathan, 2002, and Grullon and Michaely, 2004), our combination of methodsaccounts for path dependencies in payout policies, dynamic effects of total risk and theself-selection bias in respect to dividend policies and previous firm risks.
2.1 Hypotheses tests
As dividend initiations indicate a maturation of the financial life-cycle of the firm, we expectthat its influence will be negative on the risk measures, like total, systematic market, andidiosyncratic risks. For example, this is expected to be the case for the beta of the smallminus big risk factor. Firms that initiate dividends are generally larger than firms thatdo not (yet) do so. Turning to the high minus low risk factor, dividend paying firms areexpected to become more sensitive to the high minus low book to market factor due toan increase in the level of distress of earnings growth, with the maturation of the firm.We expect opposite sign effects from dividend omissions. When a firm follows a policy ofpaying dividends, investors might reasonably interpret an omission in dividend pay out asproviding information concerning increases in future firm risks. This leads to our first setof hypotheses tests:
Hypotheses 1: Dividend initiations (omissions) will negatively (positively) impact firm
5

risks.
In respect to dividend initiations and dividend omissions, we study whether there isan asymmetry of effects. Value reductions through omissions are generally larger than thevalue increases concomitant with initiations. If the value effects originate from risk shifts,the effect of omitting should be larger in absolute terms. This leads to our second set ofhypotheses:
Hypotheses 2: Dividend initiations will have a relatively smaller impact on firm risksthan dividend omissions.
There may be a larger impact on firm risks from dividend omissions due to a gradual re-duction of risk since dividend initiation with a longer duration increasing dividend amountsover time. This leads to our third set of hypotheses:
Hypotheses 3: Firm risks will reduce with the payout duration and/or the payoutamount.
2.2 Methods
2.2.1 A propensity score matching algorithm
We test the first and second sets of non-experimental hypotheses, hypotheses 1 and 2, us-ing a modified difference-in-differences approach with a propensity score matching ‘nearestmatch’ algorithm (see, Rosenbaum and Rubin, 1983 and Li and Zhao, 2006). The difference-in-differences approach alone does not account for self-selection bias in relation to previ-ous firm risks. The matching algorithm improves the difference-in-differences approach bymitigating self-selection bias due to observable systematic differences across treated (i.e.dividend initiating or omitting firms) and comparison control groups. We also control forpath dependencies. In particular, the control group has the same previous period payoutchannel as the treated group of firms.
The propensity score is a conditional probability from a probit function, using a samplethat contains the treated and control firms. Each treated firm is then matched to a controlfirm with the closest propensity score.4 In this paper, propensity score matching is adoptedon the criterion of total risk which includes the range of risk measures which we study.We use year dummies as well as industry dummies as additional matching criteria, andapply the propensity score matching algorithm to the full period. It would be preferableto conduct this method for each year, while accounting for the fact that firms in differentindustries may show different reactions. However, this approach is not feasible due to
4The propensity score matching method allows a large number of matching variables without imposingconstraints on these variables.
6

matching difficulties. In addition, we conduct robustness tests conditioning on a relativelylarge number of explanatory variables.5
2.2.2 Dynamic Panel GMM estimation
We test the third set of non-experimental hypotheses, hypotheses 3, using a dynamic panelgeneralized method of moments (GMM) system estimator (Blundell and Bond, 1998).Consistent with a substantial body of literature (Allen and Michaely, 2003; Chay andSuh, 2009), we identify a dynamic model for the choice variable, dividend policy, that isDit = f(yit−1, Zit−1) [1], where Dit, yit−1 and Zit−1 represent dividend policy, firm risk anda set of firm characteristics which determine dividend policy. If firm risk and this set offirm characteristics (and hence also dividend policy) are a feature, in part, of the maturityof the phase of the financial life-cycle of the firm, then the choice variable, dividend policy,may reveal information to the market and determine firm risk, yit. In equation [2], we state:
yit = α+ Σκsyit−s + βDit−1 + γZ ′it−1 + ηi + εit, (2)
where s = 1, εit is a random error term, ηi, is time-invariant unobserved heterogeneity,Z ′ is a subset of variables in Z which is expected to determine firm risk and β is the effect ofdividend policy on firm risk. We simultaneously account for the effects of path dependenciesin total risk (i.e., previous total risk on current firm total risk). The economic rationale ofthe impact of dividend policy on firm risks may stem from this policy being an inadvertentmanifestation and/or a deliberate signal on the part of management.
In this setting, a weak assumption is that current shocks are independent of past real-izations of dividend policies and explanatory variables. This assumption can be stated inorthogonality form, E(εit/yit−s, Dit−1) = 0. The statement relies on the assumption thatwe have specified all endogenous and time-varying variables that effect dividend policiesand firm risks. Despite accounting for a broad set of variables, which may influence firmrisk, equation [2] presents a random error, εit, which is at best an imperfect proxy for thepure expectational error. Hence, the orthogonality conditions above may not be satisfied.In addition, fixed-effects estimates are biased if lagged dependent variables, e.g. yt−s, in-fluence independent variables, e.g. Dit−1, (see, Wooldridge 2002).6 As a result, in equation[2], the fixed-effects panel regression estimation does not mitigate bias from endogeneity.
We use the dynamic panel GMM estimator to obtain efficient, consistent and unbiasedestimates, of the impact of dividend policies (the durations of pay out and amounts ofpay out) on firm risks. To mitigate bias from time invariant heterogeneity we write the dy-namic model of [2] in first difference form ∆yit = κpΣ∆yit−p+β∆Dit+γ∆Zit+∆εit,∀p > 0[3]. To mitigate endogeneity bias, lagged values of the level variables are adopted as in-struments . The instruments must provide a source of exogenous variation for the firm
5The results are available from the authors on request.6In this setting, the consistency of the static panel fixed effect estimator depends on T (the number of
periods) being large, which is not true in our dataset.
7

dividend policy. They must be uncorrelated with the error in the risk equation [2]. Toensure the latter property is satisfied, equation [2] must be well specified and dynami-cally complete. Associated with this exogeneity assumption are orthogonality conditions,E(Dit−sεit) = E(Zit−sεit) = E(yit−sεit) = 0, ∀ s>p [4]. However, equation [3] contains po-tential mis-specifications, including econometric issues stemming from differences. Specifi-cally, differencing may reduce the variation of the explanatory variables (Beck, Levine andLoayaza, 2000). Variables in levels may be weak instruments for first-differenced equations(Arellano and Bover, 1995) and first differencing may exacerbate the impact of measure-ment error on the dependent variable (Griliches and Hausman, 1986). Hence, we mitigatethese shortcomings by estimating a stacked ‘system’ estimator, equation [5]:[
yit∆yit
]= α+ κ
[yit−p
∆yit−p
]+ β
[Dit
∆Dit
]+ γ
[Zit
∆Zit
]+ εit. ([5])
To deal with the unobserved heterogeneity in levels we assume that the correlationbetween the explanatory variables and the unobserved effects is constant over time, whichleads to an additional set of orthogonality conditions E(∆Dit−s(ηi + εit)) = E(∆Zit−s(ηi +εit)) = E(∆yit−s(ηi + εit)) = 0, ∀ s > p [6]. Taking the orthogonality conditions, [4] and [6],together we estimate the stacked ‘system’ of equations [5]. The orthogonality conditionsimply that we can use lagged levels as instruments for our differenced equations and laggeddifferences as instruments for the level equations, respectively.
3 Data description
Our dataset comprises the payout decisions of United States firms,7 reporting in UnitedStates dollars and listed on the NYSE or the NASDAQ from 28 December 1979 to 30December 2011.8 Notwithstanding, we start our analysis in 1987 as there is a relativelysmall number of observations available in the preceding years. We include observationsprior to 1987, where available, to permit lagged variables in our model specifications.
Our data is sourced primarily from Datastream, Worldscope and CRSP. To correct forsurvivorship bias, our dataset comprises active, dead and suspended firms. Firms in theFinancial and Utilities sectors (Industry Classification Benchmark codes 7000 and 8000)and firms with evident cash dividend record errors are excluded from this study. For the
7We focus on firms in the United States (ISIN codes commencing with the prefix ‘US’) as there ishigh quality accounting and stock return data available for United States firms and there is a wealth ofextant findings in respect to dividend policy in the United States. In addition, we prefer not to combinean analysis from several countries, as country differences might confound the firm effects that we want toanalyze. Finally, recent research indicates that the United States is the country with the largest firm levelrisk (Bartram et al., 2012). This implies that the impact of dividend policies on risk may be most relevantin the United States.
8These dates match the exact dates from the website of Kenneth French for the relevant period (http:
//mba.tuck.dartmouth.edu/pages/faculty/ken.french/data_library.html), which is a requirement inorder to estimate the Fame and French (1993) factor loadings.
8

remaining firms, we download return indices with dividends reinvested (RI) on a weeklybasis. We calculate the arithmetic returns from the dividends reinvested return index (RI),taking into account varying fiscal year end dates.9
In order to study a dataset of firms which trade relatively regularly, we require thatthere are at least 25 return observations per fiscal year and subsequent to fiscal year. Wediscontinue the variable in the dataset, if the fiscal year observation shows an arithmetic re-turn observation of -1. Moreover, following Bartram, Brown and Stulz (2012) we ultimatelyretain firms with relatively liquid trading by requiring that less than 30% of the remainingfiscal year observations have zero weekly returns. We also delete the fiscal year observationswhere the standard deviation of the arithmetic returns is equal to zero. Finally, as we donot want our findings to be influenced by different investors’ perceptions associated withinfrequent reporting (von Eije and Megginson 2008), we require that the firms report 4times per year.
Our principal payout variables are cash dividends and net share repurchases. We re-quire that cash dividend and share repurchase observations are available, though they maybe zero. We follow Fama and French (2001) and Skinner (2008) to calculate net share re-purchases.10 We winsorize the variables, except where they are constrained at zero. Hence,as our database extends until 2011, we have 25 years of observations. After these filters,59,091 firm year observations of 4,678 unique firms remain.
[Please insert table 1 about here.]
Table 1 presents a disaggregation of total risk (TRISKW) from the standard deviationof excess weekly returns, for our United States firms, in each fiscal year, into its consti-tutent components of systematic risk (SRIKW) and residual idiosyncratic risk (IRISKW),consistent with Fama and French (1993). The related decomposition of systematic risk intomarket beta (BEXMRW), the beta for the small minus big factor (BSMBW) and the betaof the high minus low factor (BHMLW) is also reported in the table. The descriptive statis-tics of the disaggregated risk variables match those reported in prior studies (e.g. Hobergand Prabhala, 2008).
9As some firms have changed their fiscal year end date, the number of return observations may becomesmaller or larger than the normal 52 (or 53) weeks in a calendar year. In order to retain only weekly returnsfor normal fiscal year durations and to allocate pay out decisions to appropriate reference fiscal years, weexclude observations if the fiscal year was shorter than 360 days or longer than 372 days.
10In particular, we adjust the share repurchases for employee stock options, acquisitions and/or pricemanipulation to obtain a net measurement of share repurchases. This approach approximates share re-purchases activity by monitoring the value of treasury stock. However, if there are no contemporaneousobservations on treasury stock (indicated by either missing values or zero values in the current and prioryear), Fama and French (2001) assume that the retirement method is applied by the firm. In that case weuse net proceeds of the sale/issue of common and preferred stock as representing net share repurchases. Ifthe net share repurchases approximated by the treasury stock monitoring method is unavailable and theretirement method indicates a negative value, we set the net share repurchases at zero.
9

The mean weekly total risk is 7.4%. It represents an annual risk of 53.4% (7.4%*sqrt(52)).11
The reported summary risk measurements show that the majority of total risk (7.4%) isidiosyncratic risk (6.4%). Turning to the components of systematic risk, the mean of thesystematic component (SRIKW) of total risk (3.2%) comprises the market risk factor (BE-MRW with a mean of 1.028) which is larger than sensitivity to the small minus big factor(BSMBW with a mean of .808) and considerably larger than the sensitivity to the book tomarket effect (BHMLW with a mean of .109).12
4 Empirical findings - associative descriptive statistics
Table 2 reports the distribution of firms which adopt specific payout channels, across quin-tiles of firms, with respect to the criterion of total risk. The distinction between payoutchannels is motivated principally by Renneboog and Trojanowsky (2011), who distinguishthree payout channels (solely repurchases, solely dividends, and both types of payout) be-sides non-payment. The main observation is that firms which do not pay out or exclusivelyadopt the share repurchases channel exhibit greater total risk (8.7% and 8.6%, respectively)than firms which combine share repurchase and cash dividend pay outs or exclusively adoptthe cash dividend payout channel (5.3%). Furthermore, in each payout channel, the pro-portion of firms in each total risk quintile varies monotonically. It rises across total riskquintiles for non-paying firms and for exclusive share repurchasers. It declines, across totalrisk quintiles, for those firms that include cash dividends in their payout policies.
[Please insert table 2 about here.]
Turning to table 3, it presents descriptive statistics indicative of an intriguing associationbetween the payout channel, its duration, and the magnitude of total risk and disaggregatedrisks.13 Table 3 shows, in Panel A, that not only total risk declines markedly in associationwith payout policy alteration from non-payment and exclusive share repurchases to a payout
11In order to provide an indication of the economic impact of weekly total equity risk, we set the longterm debt ratio of a firm to its median value of 15.7%. We assume that the long-term debt has no coupons,has a duration of 4 years and is uncorrelated with the equity. Furthermore, we set the annual risk freeinterest rate at 3% and apply the Black and Scholes (1974) formula (in which weekly asset risk equals 84.3%of weekly total equity risk) in order to find the percentage of the implied put option of long term debt inrelation to the risk free present value of long term debt, with respect to an exercise price of 100% of facevalue. At the median of weekly total equity risk (6.4%) that percentage is relatively small, namely 0.36%.When total equity risk increases to 7.4% (the mean value), the implied put option, is 1.14% of the presentvalue of the risk free zero coupon bond. The put option relation is non-linear and for the full range of totalequity risk (between 2.0% and 26.7%), the implied put option percentages lie between 0.0% and 75.5%.
12A year-by-year disaggregation of these winsorized measures of risk, winsorized concomitant total riskand the frequency distributions of the payout channels used over time are available on request.
13We calculate the duration of a payout policy, by setting the first possible pay out year at 1980 andincreasing the duration by one year if the firm continues a specific payout type. Firms that discontinue apayout policy are set at zero during the period of payout policy discontinuation and if they recommencepayout the pay out duration counter starts again at zero.
10

channel comprising cash dividends, but also systematic market risk (BEXMRW), overallsystematic risk (SRISKW) and idiosyncratic risk (IRISKW) reduce in association with thisalteration of payout channels. This finding also applies to the sensitivity to the small minusbig factor (BSMBW) and it means that firms that pay dividends are generally larger.
[Please insert table 3 about here.]
Table 3 shows in Panels B and C the risk measures for different durations of dividendpayout policies. A longer use of a payout channel results in smaller total risk, smallersensitivity to the small minus big factor and smaller idiosyncratic risk. Interestingly, thelongevity of dividend payout policy has not a negative association with the systematicmarket risk measure (BEXMRW) or the overall systematic risk (SRISKW). Firms that usethe combined channel of dividends and share repurchases for an extended period (Panel B)are becoming less sensitive to the high minus low factor, which implies that a long durationof using this payout channel is associated with relatively low book to market firms.
5 Empirical findings - propensity score matching
While the associations reported in section 4 are intriguing, they do not show whether initi-ating (omitting) dividends generates a reduction (an increase) in total risk, because low riskis also a determinant of the likelihood to pay. In order to address the question of causality,we adopt a difference-in-differences methodology, while mitigating for self-selection basedon low total risk. Table 4 presents the difference-in-differences, and associated significancelevels, in respect of Fama and French (1993) measurements of firm risk for firms that defacto change the payout channel and matched benchmark firms that retain the same payoutchannel. The matching is based on the nearest neighbor propensity score, calculated foryear, industry and total risk.
[Please insert table 4 about here.]
There are several findings in this table. First, initiation of a dividend pay out reducestotal (and idiosyncratic) firm risk and omitting to pay dividends increases total (and id-iosyncratic) firm risks. Second, while the difference in weekly total risk between firms thatdo not pay and firms that do pay dividends is 3.3% (8.6% - 5.3% = 3.3%, see table 2),the causal effect of initiating dividend payouts when no previous payouts took place is only-0.5 %. Therefore, the impact is only 15% (-0.5%/-3.3%) of the difference between firmsthat pay dividends and non-payers and it is only marginally significant. Omitting payingdividends has a larger absolute effect on a firm’s idiosyncratic and total risks than initiatingto pay dividends. When a firm that only paid dividends omits its dividends, weekly totalrisk increases by 1.5%, which in absolute terms is three times as large as the effect of the
11

initiation of dividend pay out.14 Hence, we observe a marked asymmetry in effects. Thissuggests that there is an impact on the risk measures during the period of pay out, whichmay arise due to the longevity of pay outs and/or the pay out amounts.
We do not find consistent reductions in the beta for systematic market risk (BEXMRW)due to initiations, nor consistent increases in that risk factor loading due to omitting div-idends. The absence of consistent effects on systematic market risk is in line with Bulan,Subramanian and Tanlu (2007), but is in contradiction to earlier measurements of changesin systematic risk due to pay out changes (Grullon, Michaely, and Swaminathan, 2002; Grul-lon and Michaely, 2004). Turning to the small minus big systematic risk factor (BSMBW),initiating dividends reduces this factor loading (not consistently) and omitting dividendsincreases it relatively markedly. In contrast, in respect to the beta of the high minus lowfactor, we do not find significant effects. Finally, the aggregate systematic risk effects arerelatively small and, in addition, not consistent across dividend policy alterations.
The relatively small magnitudes and inconsistent reactions of the aggregate systematicrisk factor and the three systematic risk factor loadings, to dividend initiations and divi-dend omissions, suggests that we cannot conclude that there are consistent and meaningfulunidirectional effects of dividend policy on systematic risks. Hence, our findings suggestthat it is unlikely that value losses after omissions are caused by increases in systematicmarket risk, although they may be caused by increases in idiosyncratic risk. These findings,together with the relatively straightforward effects found for total and idiosyncratic risks,reveal the direct impact of payout initiations and omissions on firm risks.15,16
14It is noteworthy that the impact of dividend initiations and omissions is smaller if at the same timerepurchases are made.
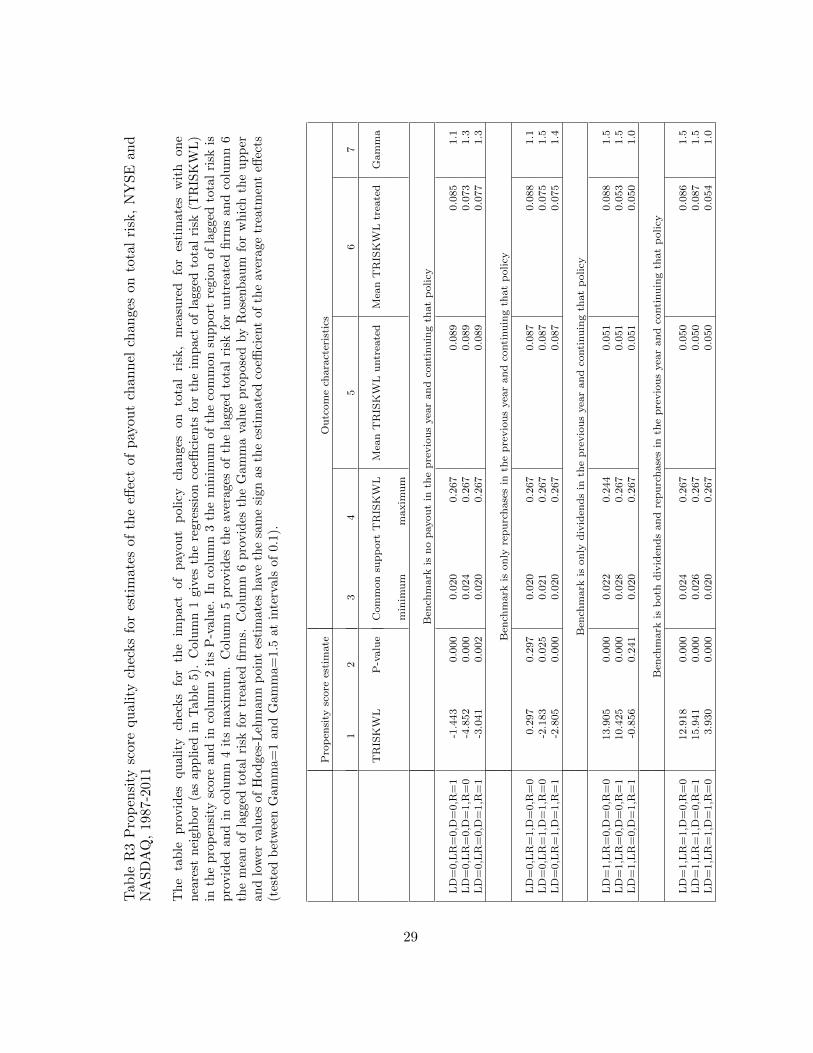
15Robustness checks show no major differences between the average treatment effects measured in table4 and the Hodges-Lehman estimates of the effects. Rosenbaum Gamma values indicate that most mea-surements are robust to omitted variable bias. There are also no major differences between the estimatesfound when using the method of five nearest neighbors instead of when one nearest neighbor is used in thepropensity score matching. Excluding lagged total risk, however, increases the absolute value of most valueeffects, indicating that the use of lagged total risk in the propensity score matching procedure is relevant inorder to control for self-selection related to total risk. As a final robustness test we add eight new indepen-dent variables that may influence risk or payout. In this robustness test, the signs of the impacts measuredare in most cases similar to those of our major estimates in table 4, though the coefficients are generallysomewhat smaller in absolute terms. We prefer the propensity scores when only total risk is included inthe equation (as in table 4) because with eight additional variables, insignificant explanatory variables withrelatively large coefficients may have biased the selection of the matched untreated firms, thereby reducingthe quality of the estimates of the dividend payout effects on risk. Results are available on request.
16It may be noted that we give a comprehensive overview of the impacts of dividend initiations anddividend omissions, but that we only measure the effects of initiating and omitting a certain type of payoutand not the impact the amounts involved in such policy changes. Ordinary least squares regressions of theimpact of the payout amounts involved, however, do not indicate systematic effects. Results are availableon request.
12

6 Empirical findings - dynamic GMM panel regressions
The asymmetry of effects on idiosyncratic risk of initiating and omitting pay out of cashdividends may be indicative of a gradual change in investors’ perceptions during the timethat a dividend policy is in effect. Using system GMM estimates (Blundell and Bond,1998) on our panel dataset, we test if this asymmetry of effects is related to aspects of thepayout policies of paying firms, like relative payout amounts and payout durations, whilesimultaneously accounting for other possibly relevant variables.
Table 5 presents the findings of the impact of payout durations and relative amountson total firm risk for two of our payout channels, exclusive cash dividend pay out and acombination of dividends and share repurchases. We use the lagged natural logarithms ofthe duration of the payout policy in our estimates (LNDDURATIONL for the dividendchannel and LNDRDURATIONL for the combined channel). We also account for theeffects of the relative amounts paid (CDTAWL for the dividend channel, and TOTPTAWLfor the combined channel).17 We include six lagged variables that are assumed to influencefirm risk, namely size (LNTAWL), the long term debt ratio (LTDTAWL), the cash ratio(CATAWL), accounting risk (SDNITAWL), market to book value of equity (MCEWL),and company age (AGE). We assume a dynamic relation and therefore include lagged totalrisk (TRISKWL) as an explanatory variable, because it is likely that there is also pathdependency in the risk levels of paying firms.
[Please insert table 5 about here.]
Table 5 shows that the effects of the control variables on total risk have the expectedsigns and that payout amounts have no significant effects on total risk measures. In contrast,the duration of cash dividends payouts influences total risk negatively and significantly.Quite unexpectedly, however, a longer duration of payouts through both repurchases anddividends marginally increases total firm risk. This finding implies that firms that wantto increase firm value by reducing risk should not indefinitely extend the period of payingthrough a combination of dividends and repurchases.
In a similar manner, we measure the impact of the durations of payout channel use, andthe payout amounts, on our set of Fama and French (1993) risk measures in table 6. Thetable shows that firms with a longer payout duration of solely paying cash dividends havesignificantly smaller idiosyncratic risk (IRISKW) and overall systematic risk (SRISKW),and thereby also smaller total risk. However, the individual betas calculated for the Famaand French (1993) factors are not significantly influenced by a protracted duration of thispayout channel. We find opposite, albeit small results, on both idiosyncratic (IRISKW),total (TRISKW) and overall systematic (SRISKW) risks, for firms that adopt the combinedpayout channel over a protracted period of time. This corroborates our earlier finding that
17Summary statistics for the winsorized duration and the winsorized relative amounts paid are availableon request.
13

firms which use both types of payout should refrain from doing so for a protracted period ifthey intend to increase value by diminishing firm risks. Turning to payout amounts, payinglarger relative amounts (CDTAWL, TOTPTAWL) does reduce the idiosyncratic risk of thefirm, though there is no effect on systematic market risks. Taking tables 5 and 6 together, weconclude that any prolonged value effects (value drift) after dividend initiations (Grullon,Michaely and Swaminathan, 2002) are not really attributable to systematic market riskreductions.
[Please insert table 6 about here.]
7 Conclusion
Firm market risk and payout policies are two major topics of corporate finance, and westudy the direct impact of payout policies on the most important measures of firm risk.We correct explicitly for selection and omitted variables bias. Recently, it is shown thatthe total market risk of the firm is a major determinant of payout policies (Chay and Suh,2009) and researchers should therefore control for selection bias related to the previoustotal market risk before concluding about any effect caused by payout changes. Omittedvariables bias results when the effects of payouts per se are measured without distinguishingbetween payout channels, initiations, payout durations and payout amounts. We take careof selection bias by applying the propensity score matching technique to payout policychanges. The impact of payout durations and payout amounts, across payout channels, aremeasured by system GMM estimates that control for important other determinants of firmrisk.
The propensity score matching procedure gives, first, the expected negative effects ofpayout initiations on total and idiosyncratic risk. Moreover, the effects are larger for ini-tiating dividends than for initiating repurchases. However, second, the effects of payoutinitiations on firm risk measures are not significant. Third, when applying the propensityscore matching technique to firms that omit payouts, the effects are larger than the absoluteeffects found after payout initiations. Fourth, the direct effects of omitting dividends donot result in significant increases in systematic market risk.
The asymmetric effect of initiating and omitting payouts on total and idiosyncratic risksuggests that there are unveiled developments during the payout period. Fifth, when con-trolling for other factors, we find through system GMM estimates that the payout durationinfluences total risk and its two main constituents (overall systematic risk and idiosyncraticrisk). However, a protracted period of paying out both types simultaneously increases theserisks. Finally, we find that higher relative payout amounts reduce idiosyncratic risk.
14

References
[1] Allen, F., Michaely, R., 2003. Payout policy. In: Constantinides, G., Harris, M., Stulz,R. (Eds.), North-Holland Handbooks of Economics. Elsevier.
[2] Arellano,M., Bover,O., 1995. Another look at the instrumental variable estimation oferror-components models. Journal of Econometrics, 68, 29-51.
[3] Bartram,S.M., Brown,G., Stulz,R.M., 2012. Why are U.S. stocks more volatile? Journalof Finance, 67, 1329-1370.
[4] Bartram,S.M., Brown,G., Waller.W., 2012. How important is financial risk? Universityof Warwick Working Paper Series, 1-69.
[5] Benartzi,S., Michaely,R., Thaler,R.H., 1997. Do changes in dividends signal the futureor the past? Journal of Finance, 52, 1007-1034.
[6] Bhargava, A., 2010. An econometric analysis of dividends and share repurchases by USfirms. Journal of the Royal Statistical Society, 173, 631-656.
[7] Bhattacharya,S., 1979. Imperfect information, dividend policy and ‘The bird in thehand’ fallacy, Bell Journal of Economics, 10, 259-270.
[8] Beck,T., Levine, R., Loayza,N., 2000. Finance and the sources of growth. Journal ofFinancial Economics, 58, 261-300.
[9] Black,F., Scholes, M., 1974. The effects of dividend yield and dividend policy on commonstock prices and returns. Journal of Financial Economics, 1, 1-22.
[10] Blundell,R., Bond,S.R., 1998. Initial conditions and moment restrictions in dynamicpanel data models. Journal of Econometrics, 87, 115-143.
[11] Brav,A., Graham,J.R., Harvey,C.R., Michaely,R., 2005. Payout policy in the 21st cen-tury. Journal of Financial Economics, 77, 483-527.
[12] Brown,G.W., Kapadia,N., 2007. Firm-specific risk and equity market development.Journal of Financial Economics, 84, 358-388.
[13] Bulan,L., Subramanian,N., Tanlu,L., 2007. On the Timing of Dividend Initiations.Financial Management, 36, 31-65.
[14] Campbell,J.Y., Lettau,M., Malkiel,B.G., Xu,Y., 2001. Have individual stocks becomemore volatile? An empirical exploration of idiosyncratic risk. Journal of Finance, 56,1-43.
[15] Charitou,A., Lambertides,N., Theodoulou,G., 2011. Dividend increases and initiationsand default risk in equity returns. Journal of Financial and Quantitative Analysis, 46,1521-1543.
15

[16] Charest,G., 1978. Dividend infiormation, stock returns and market efficiency-II. Jour-nal of Financial Economics, 6, 297-330.
[17] Chay,J.B., Suh,J., 2009. Payout policy and cash-flow uncertainty. Journal of FinancialEconomics, 93, 88-107.
[18] Chen.S., Shevlin,T., Tong,Y.H., 2007. Does the pricing of financial reporting qualitychange around dividend changes? Journal of Accounting Research, 45, 1-40.
[19] DeAngelo,H., DeAngelo,A., Skinner,D.J., 1996. Reversal of fortune dividend signalingand the disappearance of sustained earnings growth. Journal of Financial Economics, 40,341-371.
[20] DeAngelo,H., DeAngelo,A., Stulz,R.M., 2006. Dividend policy and the earned/ con-tributed capital mix: A test of the lifecycle theory. Journal of Financial Economics, 81,227-254.
[21] Fama,E.F., French,K.R., 1993. Common risk factors in the returns on stocks and bonds.Journal of Financial Economics, 56, 3-56.
[22] Fama,E.F., French,K.R., 2001. Disappearing dividends: Changing characteristics orlower propensity to pay? Journal of Financial Economics, 60, 3-43.
[23] Fama,E.F., French,K.R., 2004. New lists: Fundamentals and survival rates. Journal ofFinancial Economics, 73, 229-269.
[24] Goyal,A., Santa-Clara,P., 2003. Idiosyncratic risk matters! Journal of Finance, 58,975-1007.
[25] Griliches,Z., Hausman,J.A., 1986. Errors in variables in panel data. Journal of Econo-metrics, 31, 93-118.
[26] Grullon,G., Michaely,R., 2004. The information content of share repurchase programs.Journal of Finance, 59, 651-680.
[27] Grullon,G., Michaely,R., Swaminathan,B., 2002. Are dividend changes a sign of firmmaturity? The Journal of Business, 75, 387-424.
[28] Grullon,G., Michaely,R., Benartzi,S., Thaler,R.H. 2005. Dividend changes do not signalchanges in future profitability. Journal of Business, 78, 1659-1682.
[29] Guay,W., Harford,J., 2000. The cash-flow permanence and information content of div-idend increases versus repurchases. Journal of Financial Economics 57, 385-415.
[30] Healy, P.M., Palepu,K.G., 1988. Earnings information conveyed by dividend initiationand omissions. Journal of Financial Economics, 21, 149-175.
16

[31] Hoberg,G., Prabhala,N.R., 2008. Disappearing dividends, catering, and risk. Reviewof Financial Studies, 22, 79-116.
[32] Jagannathan,M., Stephens,C.P., Weisbach,M.S., 2000. Financial flexibility and thechoice between dividends and stock repurchases. Journal of Financial Economics, 57,355-384.
[33] Jensen,M.C., 1986. Agency costs of free cash-flow, corporate finance, and takeovers.American Economic Review, 76, 323-329.
[34] John,K., Williams,J., 1985. Dividends, dilution, and taxes: A signalling equilibrium.Journal of Finance, 40, 1053-1070.
[35] Lambrecht,B.M., Myers,S.C., 2012. A Lintner Model of payout and managerial rents.Journal of Finance, 67, 1761-1810.
[36] LaPorta,R., Lopez-de Silanes,F., Shleifer,A., Vishny,R.W., 2000. Agency problems anddividend policies around the world. Journal of Finance, 55, 1-33.
[37] Li,X., Zhao,X., 2006. Propensity score matching and abnormal performance after sea-soned equity offerings. Journal of Empirical Finance, 13, 351-370.
[38] Lintner,J., 1956. Distribution of incomes of corporations among dividends, retainedearnings, and taxes. The American Economic Review, 46, 97-113.
[39] Michaely,R., Thaler,R.H., Womack,K.L., 1995. Price reactions to dividend initiationsand omissions: Overreaction or drift? Journal of Finance, 50, 573-608.
[40] Miller,M.H., Modigliani,F., 1961. Dividend policy, growth, and the valuation of shares.Journal of Business, 34, 411-433.
[41] Miller,M.H., Rock,K., 1985. Dividend policy under asymmetric information. Journalof Finance, 40, 1031-1051.
[42] Pastor,L., Veronesi,P., 2003. Stock valuation and learning about profitability. Journalof Finance, 58, 1749-1789.
[43] Renneboog,L., Trojanowski,G., 2011. Patterns in payout policy and payout channelchoice. Journal of Banking and Finance, 35, 1477-1490.
[44] Rosenbaum, P.R., Rubin,D.B., 1983. The central role of the propensity score in obser-vational studies for causal effects. Biometrika, 70, 41-55.
[45] Sharpe,W.F., 1964. Capital asset prices : A theory of market equilibrium under con-ditions of risk. Journal of Finance, 19, 425-442.
[46] Skinner,D.J., 2008. The evolving relation between earnings, dividends, and stock re-purchases. Journal of Financial Economics, 87, 582-609.
17

[47] Twu,M., 2010. Prior payment status and the likelihood to pay dividends: Internationalevidence. The Financial Review, 45, 785-802.
[48] von Eije,J.H., Megginson,W.L., 2008. Dividends and share repurchases in the europeanunion. Journal of Financial Economics, 89, 347-374.
[49] Watts,R., 1973. The information content of dividends. Journal of Business, 46, 191-211.
[50] Wei,S.X., Zhang, C., 2006. Why did individual stocks become more volatile? Journalof Business, 79, 259-292.
[51] Wooldridge,J.M., 2002. Econometric analysis of cross section and panel data. The MITPress, Cambridge.
18

Table 1 Characteristics of the risk measures, NYSE and NASDAQ, 1987-2011
Total risk (TRISKW) is defined as the sample estimate of the standard deviation of the ex-cess arithmetic weekly returns over the risk free rate for a fiscal year. The betas (mnemonicstarting with a B) are the coefficients of an ordinary least squares estimation of the Fama andFrench (1993) equation applied to weekly returns for each fiscal year, where BEXMR is the betaof excess market return, BSMB the beta of small minus big, and BHML the beta of high minuslow. IRISK is a measure of idiosyncratic risk, which is the sample estimate of the residuals derivedfrom the root mean squared errors from the Fama and French beta estimates. SRISK is a measureof systematic risk calculated as the square root of the difference of the squared total risk minusthe squared idiosyncratic risk. All variables are transformed by a 0.5% winsorization at both sides(indicated by the letter W at the end of the mnemonic).
TRISKW BEXMRW BSMBW BHMLW SRISKW IRISKW
Mean 0.074 1.028 0.808 0.109 0.032 0.064St. Dev. 0.041 0.832 1.172 1.442 0.022 0.038Median 0.064 0.984 0.696 0.130 0.027 0.055Min 0.020 -1.699 -2.572 -5.057 0.004 0.017Max 0.267 3.961 5.074 4.925 0.135 0.251
19

Table 2 Total risk quintiles and payout channel, NYSE and NASDAQ, 1987-2011
The table presents the number of firms and the means of winsorized total risk by total riskquintiles and payout channel. Total risk (TRISK) is defined as the standard deviation of the excessarithmetic weekly returns over the risk free rate for a fiscal year. Winsorized total risk (TRISKW)is the value of total risk winsorized at 0.5% at both sides. Firms that do not pay through eitherdividends or repurchases are indicated by payout channel zero (POC=0). Firms that pay outthrough repurchases only are indicated by the first payout channel (POC=1), firms that pay onlydividends are indicated by the second payout channel (POC=2). Finally, firms that distributethrough both repurchases and dividends are represented by the third payout channel (POC=3).
TRISK POC=0 POC=1 POC=2 POC=3 Totalquintile
Number of observations
1 696 2100 3033 5990 118192 1458 4304 1992 4064 118183 2021 5828 1323 2646 118184 2319 7150 780 1569 118185 2739 7794 455 830 11818
Total 9233 27176 7583 15099 59091
Means of TRISKW
1 0.035 0.035 0.032 0.032 0.0332 0.049 0.049 0.048 0.048 0.0493 0.064 0.064 0.063 0.063 0.0644 0.085 0.084 0.083 0.082 0.0845 0.141 0.138 0.133 0.133 0.138
Total 0.087 0.086 0.053 0.053 0.074
20

Table 3 Risk measures of firms by payout channel and duration of the payout channel,NYSE and NASDAQ, 1987-2011
The table presents the risk measures of firms for firms that do not pay out (POC=0) as well as forfirms that use one of the three payout channels (Panel A). Panels B and C present the magnitude ofthe risk measures for the duration of the three payout channels. Firms that do not pay through eitherdividends or repurchases are indicated by payout channel zero (POC=0). Firms that pay out throughrepurchases only are indicated by the first payout channel (POC=1), firms that pay only dividends areindicated by the second payout channel (POC=2). Finally, firms that distribute through both repurchasesand dividends are represented by the third payout channel (POC=3). Total risk (TRISKW) is definedas the standard deviation of the excess arithmetic weekly returns over the risk free rate for a fiscal year.The betas (mnemonics starting with a B) are the factor loadings of an ordinary least squares estimationof the Fama and French (1993) equation applied to weekly returns for each fiscal year, where BEXMR isthe beta of the excess market return factor, BSMB the beta of small minus big risk factor, and BHML isthe beta of high minus low risk factor. IRISK is a measure of idiosyncratic risk, which the the root meansquared errors of the residuals from the Fama and French (1993) regression equation. SRISK is a measureof systematic risk calculated as the square root of the difference of the squared total risk minus the squaredidiosyncratic risk. All variables are transformed by a 0.5% winsorization at both sides (indicated by theletter W at the end of the mnemonics). Obs. is the number of observations.
Panel A: Risk measures by payout channel
POC Obs. TRISKW BEXMRW BSMBW BHMLW SRISKW IRISKW
0 9233 0.087 0.986 0.917 0.236 0.034 0.0791 27176 0.086 1.095 0.992 -0.062 0.037 0.0762 7583 0.053 0.947 0.565 0.345 0.025 0.0453 15099 0.053 0.973 0.533 0.219 0.026 0.045
Total 59091 0.074 1.028 0.808 0.109 0.032 0.064
Duration Panel B: Risk measures by duration of the second payout channelin years (POC=2: only dividends)
Obs. TRISKW BEXMRW BSMBW BHMLW SRISKW IRISKW
1 591 0.064 0.890 0.703 0.368 0.026 0.0572 485 0.061 0.929 0.764 0.259 0.025 0.0553 409 0.061 0.906 0.725 0.255 0.026 0.0544 395 0.062 0.910 0.754 0.303 0.027 0.0545 351 0.062 0.869 0.738 0.356 0.027 0.0546 308 0.063 0.934 0.603 0.434 0.029 0.0547 297 0.057 0.862 0.631 0.317 0.026 0.058 346 0.054 0.942 0.593 0.296 0.026 0.0459 325 0.049 0.922 0.591 0.323 0.022 0.043
10 308 0.044 0.974 0.624 0.368 0.019 0.039> 10 3768 0.048 0.983 0.446 0.366 0.025 0.04
21

Table 3 continued...
Duration Panel C: Risk measures by duration of the third payout channelin years (POC=3: both dividends and repurchases)
Obs. TRISKW BEXMRW BSMBW BHMLW SRISKW IRISKW
1 3830 0.059 0.994 0.634 0.267 0.027 0.0512 2383 0.055 0.971 0.611 0.242 0.026 0.0473 1672 0.053 0.979 0.572 0.270 0.025 0.0464 1215 0.051 0.939 0.512 0.181 0.025 0.0435 972 0.052 0.949 0.490 0.237 0.026 0.0436 735 0.052 0.955 0.509 0.222 0.026 0.0437 605 0.050 0.958 0.482 0.233 0.025 0.0428 586 0.052 1.012 0.470 0.231 0.028 0.0429 504 0.048 1.004 0.489 0.050 0.025 0.039
10 426 0.044 1.001 0.435 0.166 0.022 0.037> 10 2171 0.044 0.948 0.339 0.127 0.024 0.036
22

Table 4 The effect of a change in payout policies on risk measures, NYSE and NASDAQ,1987-2011
The table presents the propensity score matched difference in risk measures when changingfrom the benchmark policy (and the t-values of that difference below the coefficients) withmatching at one nearest neighbor. In the propensity score estimates time dummies, 1-digit industrydummies, year dummies, and lagged winsored total risk are used as independent variables. Drepresents dividend payments and R repurchases. The Letter L before D or R represents the lastyear’s policy. D, R, LD or LR equal to 1 implies that a payout has taken place, and if it is equalto 0, there is no payout in the relevant year. Total risk is defined as the sample estimate of thestandard deviation of the excess arithmetic weekly returns over the risk free rate for a fiscal year.The betas are the coefficients of an ordinary least squares estimation of the Fama and French(1993) equation for each fiscal year. Idiosyncratic risk is sample estimate of the residuals derivedfrom the root mean squared errors from such equations. All variables are winsored at 0.5%. Thebenchmark policy in each panel is to continue the payout channel choice of last year. The 5%critical value of the t-test (two-sided) at the minimum level of matched treated firms (110) is 1.98.
Treated TRISKW BEXMRW BSMBW BHMLW SRISKW IRISKW
Benchmark is no payout in the previous year and continuing that policy
LD=0,LR=0,D=1,R=0 211 -0.005 0.048 -0.041 -0.190 0.000 -0.006P-values (0.065) (0.268) (0.356) (0.068) (0.460) (0.036)
Benchmark is only repurchases in the previous year and continuing that policy
LD=0,LR=1,D=1,R=1 794 -0.004 -0.072 -0.157 -0.004 -0.003 -0.003P-values (0.020) (0.044) (0.003) (0.480) (0.003) (0.052)
Benchmark is only dividends in the previous year and continuing that policy
LD=1,LR=0,D=0,R=0 242 0.015 0.107 0.296 0.094 0.003 0.015P-values (0.000) (0.086) (0.005) (0.245) (0.116) (0.000)
Benchmark is both dividends and repurchases in the previous year and continuing that policy
LD=1,LR=1,D=0,R=1 586 0.009 -0.006 0.218 -0.046 0.002 0.010P-values (0.000) (0.448) (0.002) (0.309) (0.042) (0.000)
23

Table 5 System GMM analysis of the impact of the duration of payment and the amountof payment on total risk, NYSE and NASDAQ, 1987-2011
Dynamic system panel regressions with winsorized total risk (TRISKW) as the dependentvariable. All equations have 357 instruments, namely generalized methods of moments for all thelags of the dependent variable (starting at lag 2) for the dependent of the differenced equation,generalized methods of moments for lagged difference of the dependent variable, standard differencesof the other exogenous variables in the difference equation where appropriate. TRISKWL is laggedwinsorized total risk. LNRDURATIONL is the lagged natural log of the duration of repurchasepayments if firms only repurchase (POC=1). NREPTALWL is the lagged winsorized value of theratio of net repurchase amounts divided by total assets. LNDDURATIONL is the lagged naturallog of the duration of dividend payments if firms only pay dividends (POC=2). CDTAWL is thelagged winsorized value of the ratio of cash dividends divided by total assets. LNDRDURATIONLis the lagged natural log of the duration of repurchase and dividend payments if firms payoutthrough both repurchases and dividends (POC=3). TOTPTAWL is the lagged winsorized value ofthe ratio of total payout divided by total assets. LNTA is the natural log of total assets, LTDTAis long term debt divided by total assets, CATA is cash divided by total assets, SDNITA is the3 year standard deviation of the net income to asset ratio of the current and two previous years,and MCE is the Market capitalization divided by the book value of equity (all these variables arewinsorized from below and above at 0.5% and lagged as indicated by the last two letters of themnemonic). AGE is company age. Coef. is the value of the coefficient and P>z the p-value of thez-statistic. The level equation contains industry and time dummies (not reported).
POC=2 POC=3
Coef. P>z Coef. P>z
TRISKWL 0.275 (0.000) 0.256 (0.000)LNDDURATIONL -0.007 (0.000)CDTAWL -0.019 (0.328)LNDRDURATIONL 0.001 (0.032)TOTPTAWL -0.005 (0.167)LNTAWL 0.002 (0.155) -0.001 (0.290)LTDTAWL 0.005 (0.364) 0.006 (0.096)CATAWL -0.019 (0.002) -0.010 (0.018)SDNITAWL -0.000 (1.000) 0.014 (0.030)MCEWL -0.000 (0.602) -0.000 (0.923)AGE -0.000 (0.106) -0.000 (0.434)CONSTANT 0.039 (0.035) 0.053 (0.000)
Observations 3,479 8,873Groups 785 1,302Wald-Chi2 2764 6214Probability Wald-Chi2 0.000 0.000
24
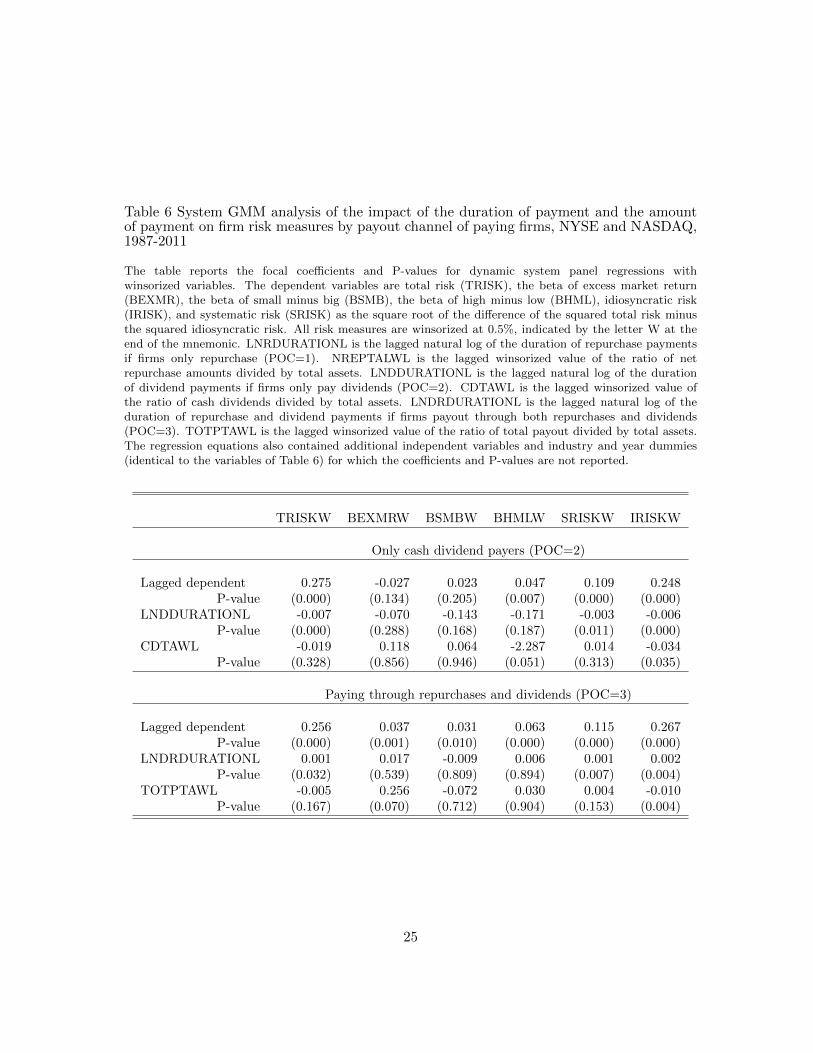
Table 6 System GMM analysis of the impact of the duration of payment and the amountof payment on firm risk measures by payout channel of paying firms, NYSE and NASDAQ,1987-2011
The table reports the focal coefficients and P-values for dynamic system panel regressions withwinsorized variables. The dependent variables are total risk (TRISK), the beta of excess market return(BEXMR), the beta of small minus big (BSMB), the beta of high minus low (BHML), idiosyncratic risk(IRISK), and systematic risk (SRISK) as the square root of the difference of the squared total risk minusthe squared idiosyncratic risk. All risk measures are winsorized at 0.5%, indicated by the letter W at theend of the mnemonic. LNRDURATIONL is the lagged natural log of the duration of repurchase paymentsif firms only repurchase (POC=1). NREPTALWL is the lagged winsorized value of the ratio of netrepurchase amounts divided by total assets. LNDDURATIONL is the lagged natural log of the durationof dividend payments if firms only pay dividends (POC=2). CDTAWL is the lagged winsorized value ofthe ratio of cash dividends divided by total assets. LNDRDURATIONL is the lagged natural log of theduration of repurchase and dividend payments if firms payout through both repurchases and dividends(POC=3). TOTPTAWL is the lagged winsorized value of the ratio of total payout divided by total assets.The regression equations also contained additional independent variables and industry and year dummies(identical to the variables of Table 6) for which the coefficients and P-values are not reported.
TRISKW BEXMRW BSMBW BHMLW SRISKW IRISKW
Only cash dividend payers (POC=2)
Lagged dependent 0.275 -0.027 0.023 0.047 0.109 0.248P-value (0.000) (0.134) (0.205) (0.007) (0.000) (0.000)
LNDDURATIONL -0.007 -0.070 -0.143 -0.171 -0.003 -0.006P-value (0.000) (0.288) (0.168) (0.187) (0.011) (0.000)
CDTAWL -0.019 0.118 0.064 -2.287 0.014 -0.034P-value (0.328) (0.856) (0.946) (0.051) (0.313) (0.035)
Paying through repurchases and dividends (POC=3)
Lagged dependent 0.256 0.037 0.031 0.063 0.115 0.267P-value (0.000) (0.001) (0.010) (0.000) (0.000) (0.000)
LNDRDURATIONL 0.001 0.017 -0.009 0.006 0.001 0.002P-value (0.032) (0.539) (0.809) (0.894) (0.007) (0.004)
TOTPTAWL -0.005 0.256 -0.072 0.030 0.004 -0.010P-value (0.167) (0.070) (0.712) (0.904) (0.153) (0.004)
25

Table A1 Characteristics of the explanatory variables, NYSE and NASDAQ, 1987-2011
CDTA is the cash dividends divided by total assets, NREPTA are the net repurchases based onFama and French (2001) divided by total assets, TOTPTA is the sum of CDTA and NREPTA.RDURATION is the duration of repurchase payments in years if firms only repurchase (POC=1).DDURATION is the duration in years of dividend payments if firms only pay dividends (POC=2).DRDURATION is the duration in years of repurchase and dividend payments if firms payoutthrough both repurchases and dividends (POC=3). LNTA is the value of natural log of total assets,CATA is cash divided by total assets, SDNITA is the standard deviation of the ratios of net incomedivided by total assets for a period of three years including the current year, LTDTA is long termdebt to total assets, MCE is the market to book ratio of equity, NITA is net income to total assets,DATA is the relative change in total assets. All these variables are winsorized at 0.5% at the topand 0.5% at the bottom, which is indicated by the letter W at the end of the mnemonic. AGE isthe firms age calculated by taking the relevant year of observation minus the year of incorporationand minimized at zero.
Obs. Mean St. dev. Median Min Max
CDTAW 59089 0.010 0.027 0.000 0.000 0.255TOTPTAW 59089 0.065 0.155 0.014 0.000 1.072DDURATION 1) 7615 11.435 8.038 10.000 1.000 32.000DRDURATION 2) 15099 5.300 5.307 3.000 1.000 32.000LNTAW 59089 12.726 1.887 12.621 8.375 17.945CATAW 59084 0.199 0.226 0.105 0.000 0.946SDNITAW 49910 0.080 0.149 0.031 0.001 1.257LTDTAW 3) 58650 0.166 0.183 0.114 0.000 0.998MCEW 4) 56964 3.584 5.448 2.180 0.011 53.313NITAW 59065 -0.012 0.231 0.042 -1.648 0.399DATAW 54414 0.059 0.260 0.064 -1.444 0.781AGE 48833 26.219 25.656 17.000 0.000 181.000
1. For firms with dividend payments only.
2. For firms with both dividend and repurchase payments.
3. The maximum of the winsorized value for the long term debt ratio (LTDTAW) is required tobe smaller than or equal to 1.
4. The minimum of the winsorized value of the market to book ratio of equity (MCEW) isrequired to be larger than or equal to 0.
26
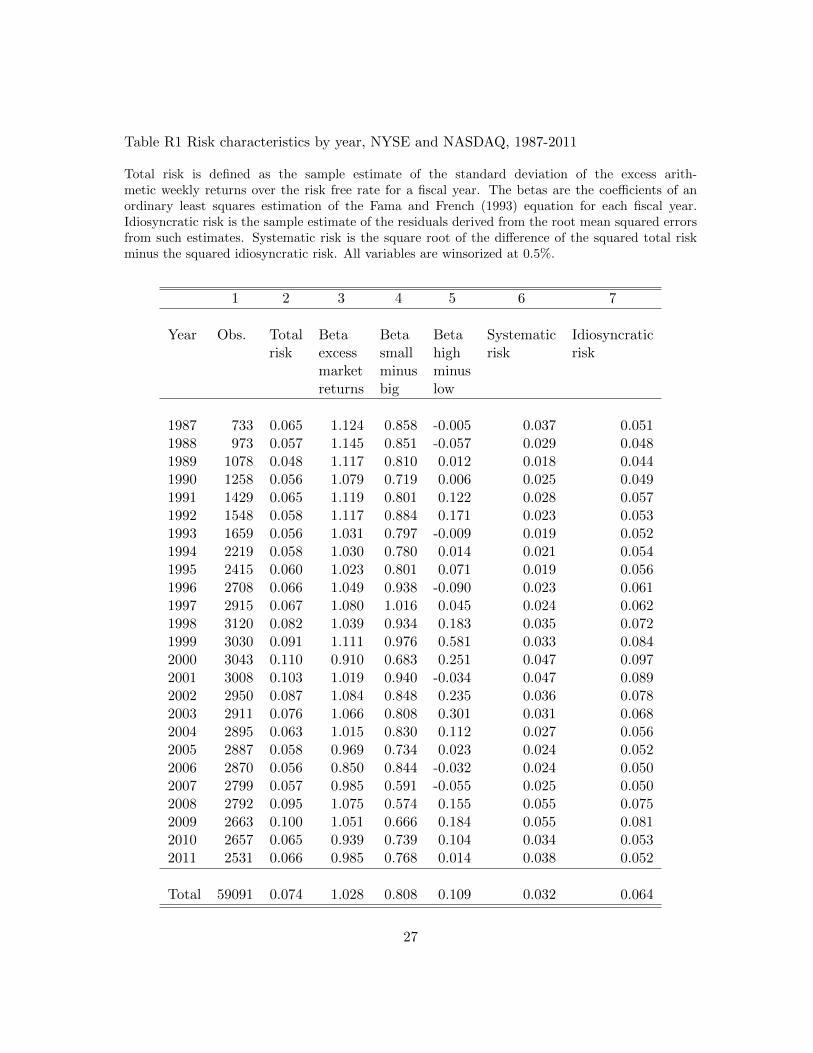
Table R1 Risk characteristics by year, NYSE and NASDAQ, 1987-2011
Total risk is defined as the sample estimate of the standard deviation of the excess arith-metic weekly returns over the risk free rate for a fiscal year. The betas are the coefficients of anordinary least squares estimation of the Fama and French (1993) equation for each fiscal year.Idiosyncratic risk is the sample estimate of the residuals derived from the root mean squared errorsfrom such estimates. Systematic risk is the square root of the difference of the squared total riskminus the squared idiosyncratic risk. All variables are winsorized at 0.5%.
1 2 3 4 5 6 7
Year Obs. Total Beta Beta Beta Systematic Idiosyncraticrisk excess small high risk risk
market minus minusreturns big low
1987 733 0.065 1.124 0.858 -0.005 0.037 0.0511988 973 0.057 1.145 0.851 -0.057 0.029 0.0481989 1078 0.048 1.117 0.810 0.012 0.018 0.0441990 1258 0.056 1.079 0.719 0.006 0.025 0.0491991 1429 0.065 1.119 0.801 0.122 0.028 0.0571992 1548 0.058 1.117 0.884 0.171 0.023 0.0531993 1659 0.056 1.031 0.797 -0.009 0.019 0.0521994 2219 0.058 1.030 0.780 0.014 0.021 0.0541995 2415 0.060 1.023 0.801 0.071 0.019 0.0561996 2708 0.066 1.049 0.938 -0.090 0.023 0.0611997 2915 0.067 1.080 1.016 0.045 0.024 0.0621998 3120 0.082 1.039 0.934 0.183 0.035 0.0721999 3030 0.091 1.111 0.976 0.581 0.033 0.0842000 3043 0.110 0.910 0.683 0.251 0.047 0.0972001 3008 0.103 1.019 0.940 -0.034 0.047 0.0892002 2950 0.087 1.084 0.848 0.235 0.036 0.0782003 2911 0.076 1.066 0.808 0.301 0.031 0.0682004 2895 0.063 1.015 0.830 0.112 0.027 0.0562005 2887 0.058 0.969 0.734 0.023 0.024 0.0522006 2870 0.056 0.850 0.844 -0.032 0.024 0.0502007 2799 0.057 0.985 0.591 -0.055 0.025 0.0502008 2792 0.095 1.075 0.574 0.155 0.055 0.0752009 2663 0.100 1.051 0.666 0.184 0.055 0.0812010 2657 0.065 0.939 0.739 0.104 0.034 0.0532011 2531 0.066 0.985 0.768 0.014 0.038 0.052
Total 59091 0.074 1.028 0.808 0.109 0.032 0.064
27

Table R2 Incidence and total risk per payout channel by year, NYSE and NASDAQ,1987-2011
The first part of this table distinguishes between the various payout channels per year forthe total number of observations in column 1 of table A1. Four payout channels are defined.POC0 represents the firms that do not pay at all, POC1 represents payout through repurchasesonly, POC2 represents payout through dividends only and POC3 represents payout through bothdividends and repurchases. The relative frequency indicates the choice of payout channel by year,implying that the relative frequencies of the four payout channels sum to 1. The second part of thetable shows the total risk for each payout channel by year, as presented in column 2 of table A1.Total risk is the winsorized value of total risk.
Panel A Panel B
Relative frequency Total risk
1987 0.059 0.307 0.184 0.450 0.071 0.079 0.054 0.0581988 0.085 0.281 0.202 0.432 0.074 0.074 0.046 0.0481989 0.099 0.243 0.224 0.434 0.062 0.061 0.040 0.0411990 0.106 0.245 0.233 0.417 0.077 0.071 0.048 0.0461991 0.131 0.253 0.284 0.332 0.090 0.084 0.050 0.0521992 0.132 0.283 0.267 0.317 0.073 0.076 0.045 0.0471993 0.133 0.310 0.233 0.324 0.072 0.070 0.043 0.0451994 0.132 0.410 0.172 0.286 0.069 0.071 0.043 0.0451995 0.157 0.418 0.154 0.271 0.069 0.074 0.041 0.0431996 0.147 0.472 0.127 0.253 0.076 0.079 0.045 0.0461997 0.126 0.524 0.106 0.244 0.076 0.080 0.044 0.0461998 0.139 0.533 0.087 0.241 0.093 0.093 0.057 0.0581999 0.159 0.517 0.089 0.235 0.105 0.104 0.066 0.0642000 0.159 0.545 0.083 0.214 0.118 0.128 0.070 0.0732001 0.184 0.534 0.103 0.179 0.113 0.120 0.064 0.0652002 0.196 0.528 0.107 0.169 0.098 0.099 0.057 0.0572003 0.203 0.491 0.108 0.198 0.086 0.087 0.049 0.0522004 0.183 0.482 0.115 0.220 0.076 0.072 0.046 0.0442005 0.157 0.492 0.107 0.245 0.070 0.065 0.047 0.0432006 0.162 0.483 0.092 0.263 0.067 0.063 0.044 0.0422007 0.147 0.492 0.090 0.272 0.068 0.063 0.049 0.0442008 0.138 0.506 0.096 0.259 0.112 0.099 0.094 0.0812009 0.207 0.451 0.134 0.209 0.123 0.104 0.087 0.0802010 0.185 0.466 0.115 0.234 0.077 0.070 0.055 0.0492011 0.162 0.456 0.113 0.268 0.079 0.073 0.058 0.052
Total 0.156 0.460 0.128 0.256 0.087 0.086 0.053 0.053
28
Tab
leR
3P
rop
ensi
tysc
ore
qu
alit
ych
ecks
for
esti
mat
esof
the
effec
tof
pay
out
chan
nel
chan
ges
onto
tal
risk
,N
YS
Ean
dN
AS
DA
Q,
1987
-201
1
Th
eta
ble
pro
vid
esqu
alit
ych
ecks
for
the
imp
act
of
pay
ou
tp
oli
cych
anges
on
tota
lri
sk,
mea
sure
dfo
res
tim
ate
sw
ith
on
en
eare
stn
eigh
bor
(as
app
lied
inT
able
5).
Colu
mn
1giv
esth
ere
gre
ssio
nco
effici
ents
for
the
imp
act
of
lagged
tota
lri
sk(T
RIS
KW
L)
inth
epro
pen
sity
scor
ean
din
colu
mn
2it
sP
-valu
e.In
colu
mn
3th
em
inim
um
of
the
com
mon
sup
port
regio
nof
lagged
tota
lri
skis
pro
vid
edan
din
colu
mn
4it
sm
axim
um
.C
olu
mn
5p
rovid
esth
eav
erages
of
the
lagged
tota
lri
skfo
ru
ntr
eate
dfi
rms
an
dco
lum
n6
the
mea
nof
lagg
edto
tal
risk
for
trea
ted
firm
s.C
olu
mn
6p
rovid
esth
eG
am
ma
valu
epro
pose
dby
Rose
nb
au
mfo
rw
hic
hth
eu
pp
eran
dlo
wer
valu
esof
Hod
ges-
Leh
man
np
oin
tes
tim
ate
sh
ave
the
sam
esi
gn
as
the
esti
mate
dco
effici
ent
of
the
aver
age
trea
tmen
teff
ects
(tes
ted
bet
wee
nG
amm
a=1
and
Gam
ma=
1.5
at
inte
rvals
of
0.1
).
Propen
sity
score
estimate
Outcomech
aracteristics
12
34
56
7
TRISKW
LP-value
Commonsu
pport
TRISKW
LMea
nTRISKW
Luntrea
ted
Mea
nTRISKW
Ltrea
ted
Gamma
minim
um
maxim
um
Ben
chmark
isnopayoutin
thepreviousyea
randco
ntinuingth
atpolicy
LD=0,LR=0,D
=0,R
=1
-1.443
0.000
0.020
0.267
0.089
0.085
1.1
LD=0,LR=0,D
=1,R
=0
-4.852
0.000
0.024
0.267
0.089
0.073
1.3
LD=0,LR=0,D
=1,R
=1
-3.041
0.002
0.020
0.267
0.089
0.077
1.3
Ben
chmark
isonly
repurchasesin
thepreviousyea
randco
ntinuingth
atpolicy
LD=0,LR=1,D
=0,R
=0
0.297
0.297
0.020
0.267
0.087
0.088
1.1
LD=0,LR=1,D
=1,R
=0
-2.183
0.025
0.021
0.267
0.087
0.075
1.5
LD=0,LR=1,D
=1,R
=1
-2.805
0.000
0.020
0.267
0.087
0.075
1.4
Ben
chmark
isonly
dividen
dsin
thepreviousyea
randco
ntinuingth
atpolicy
LD=1,LR=0,D
=0,R
=0
13.905
0.000
0.022
0.244
0.051
0.088
1.5
LD=1,LR=0,D
=0,R
=1
10.425
0.000
0.028
0.267
0.051
0.053
1.5
LD=1,LR=0,D
=1,R
=1
-0.856
0.241
0.020
0.267
0.051
0.050
1.0
Ben
chmark
isboth
dividen
dsandrepurchasesin
thepreviousyea
randco
ntinuingth
atpolicy
LD=1,LR=1,D
=0,R
=0
12.918
0.000
0.024
0.267
0.050
0.086
1.5
LD=1,LR=1,D
=0,R
=1
15.941
0.000
0.026
0.267
0.050
0.087
1.5
LD=1,LR=1,D
=1,R
=0
3.930
0.000
0.020
0.267
0.050
0.054
1.0
29

Tab
leR
4R
obu
stn
ess
chec
ks
ofth
ech
ange
inp
ayou
tch
ann
el,
NY
SE
and
NA
SD
AQ
,19
87-2
011
Th
eta
ble
pro
vid
esth
eav
erag
etr
eatm
ent
effec
ts(A
TT
)th
atsh
owth
eim
pac
tof
ach
ange
inp
ayou
tch
an
nel
an
dth
eco
nco
mit
ant
t-va
lues
.In
all
case
sin
du
stry
du
mm
ies
and
year
du
mm
ies
are
use
din
esti
mat
ing
the
pro
pen
sity
score
sof
the
trea
ted
firm
sth
atch
ange
thei
rp
ayou
tch
annel
and
the
con
com
itan
tsc
ores
ofth
eu
ntr
eate
dfi
rms
that
do
not
chan
ge
from
the
ben
chm
ark
pay
out
chan
nel
.C
olu
mn
s1
and
2re
pre
sent
the
resu
lts
wh
enad
din
gla
gged
win
sori
zed
tota
lri
sk(T
RIS
KW
L)
asan
ind
epen
den
tva
riab
lean
dap
ply
ing
1n
eare
stn
eigh
bor
(res
ult
sp
rovid
edin
the
mai
nte
xt)
.C
olu
mn
3sh
ows
the
Hod
ges-
Leh
man
nes
tim
ates
ata
Gam
ma
valu
eof
1.C
olu
mn
4sh
ows
the
hig
hes
tG
amm
ava
lue
pro
pose
dby
Ros
enb
aum
for
wh
ich
the
up
per
and
low
erva
lues
ofH
od
ges-
Leh
man
nh
ave
the
sam
esi
gnas
the
esti
mat
edco
effici
ent
of
the
aver
age
trea
tmen
teff
ects
(tes
ted
bet
wee
nG
amm
a=1
and
Gam
ma=
1.5
atin
terv
als
of0.
1).
Col
um
ns
5an
d6
giv
eth
ere
sult
sw
hen
addin
gla
gged
win
sori
zed
tota
lri
skan
dap
ply
ing
5n
eare
stn
eigh
bor
s.T
he
resu
lts
ofp
rop
ensi
tysc
ore
sb
ased
only
onth
ein
du
stry
and
tim
ed
um
mie
sis
pro
vid
edin
colu
mn
s7
and
8.C
olu
mn
s9-
12sh
owth
ere
sult
sw
hen
bes
ides
lagg
edw
inso
rize
dto
tal
risk
also
eigh
tot
her
vari
able
sth
atin
flu
ence
risk
and
pay
outs
are
incl
ud
ed.
Th
ese
are
the
lagg
edw
inso
rize
dlo
gari
thm
ofto
tal
asse
ts(L
NT
AW
L),
the
lagg
edw
inso
rize
dlo
ng
term
deb
td
ebt
rati
o(L
TD
TA
WL
),th
ela
gged
win
sori
zed
cash
rati
o(C
AT
AW
L),
the
lagg
edw
inso
rize
d3
year
stan
dar
dd
evia
tion
ofth
en
etin
com
eto
ass
etra
tio
ofth
ecu
rren
tan
dtw
op
revio
us
year
s(S
DN
ITA
WL
),th
ela
gged
win
sori
zed
mar
ket
cap
ital
izat
ion
div
ided
by
the
book
valu
eof
equ
ity
(MC
EW
L),
and
com
pan
yag
e(A
GE
).B
esid
esth
ese
vari
able
sth
atm
ayin
flu
ence
risk
,w
eals
oad
dtw
ova
riab
les
that
may
infl
uen
cep
ayou
ts,
nam
ely
lagg
edw
inso
rize
dn
etin
com
ed
ivid
edby
tota
las
sets
(NIT
AW
L)
an
dth
ela
gged
win
sori
zed
rela
tive
chan
gein
tota
las
sets
(DA
TA
WL
).C
olu
mn
11in
dic
ates
how
man
yof
the
nin
eva
riab
les
are
sign
ifica
nt
inth
eeq
uat
ion
(irr
esp
ecti
veof
the
corr
ect
sign
).C
olu
mn
12gi
ves
the
hig
hes
tG
amm
ava
lues
for
wh
ich
the
up
per
and
low
erva
lues
ofH
od
ges-
Leh
man
nh
ave
the
sam
esi
gnas
the
esti
mat
edco
effici
ent
ofth
eav
erage
trea
tmen
teff
ects
(aga
inte
sted
bet
wee
nG
amm
a=1
and
Gam
ma=
1.5
atin
terv
als
of0.
1).
30

Tab
leR
4continued...
TR
ISK
WL
incl
uded
TR
ISK
WL
8addit
ional
vari
able
sb
esid
esex
cluded
TR
ISK
WL
1nea
rest
nei
ghb
or
(Sim
ilar
tota
ble
5)
5nea
rest
1nea
rest
1nea
rest
nei
ghb
ors
nei
ghb
ors
nei
ghb
ors
12
34
56
78
910
11
12
AT
Tt-
valu
eH
odges
-G
am
ma
AT
Tt-
valu
eA
TT
t-va
lue
AT
Tt-
valu
e#
Gam
ma
Leh
man
sign.
Ben
chm
ark
isno
pay
out
inth
epre
vio
us
yea
rand
conti
nuin
gth
at
policy
LD
=0,L
R=
0,D
=0,R
=1
-0.0
02
-1.7
8-0
.003
1.1
-0.0
02
-1.8
6-0
.011
-2.4
70.0
01
0.7
54
1.0
LD
=0,L
R=
0,D
=1,R
=0
-0.0
05
-1.5
2-0
.004
1.3
-0.0
06
-2.3
5-0
.014
-2.5
8-0
.006
-1.4
32
1.1
LD
=0,L
R=
0,D
=1,R
=1
-0.0
04
-1.0
2-0
.005
1.3
-0.0
05
-1.6
2-0
.022
-4.0
6-0
.003
-0.5
76
1.1
Ben
chm
ark
isonly
repurc
hase
sin
the
pre
vio
us
yea
rand
conti
nuin
gth
at
policy
LD
=0,L
R=
1,D
=0,R
=0
0.0
03
2.9
40.0
03
1.1
0.0
03
2.8
70.0
03
0.9
20.0
01
0.7
36
1.0
LD
=0,L
R=
1,D
=1,R
=0
-0.0
05
-1.2
4-0
.008
1.5
-0.0
04
-1.1
2-0
.002
-0.3
7-0
.001
-0.1
83
1.0
LD
=0,L
R=
1,D
=1,R
=1
-0.0
04
-2.0
6-0
.006
1.4
-0.0
02
-1.3
9-0
.002
-0.6
1-0
.001
-0.4
13
1.1
Ben
chm
ark
isonly
div
iden
ds
inth
epre
vio
us
yea
rand
conti
nuin
gth
at
policy
LD
=1,L
R=
0,D
=0,R
=0
0.0
15
3.5
20.0
12
1.5
0.0
15
4.2
50.0
31
7.1
80.0
13
2.3
85
1.5
LD
=1,L
R=
0,D
=0,R
=1
0.0
14
2.4
70.0
11
1.5
0.0
15
3.1
20.0
25
4.3
10.0
04
0.4
96
1.5
LD
=1,L
R=
0,D
=1,R
=1
-0.0
01
-0.9
10.0
00
1.0
0.0
00
0.0
30.0
00
-0.1
7-0
.001
-0.7
53
1.0
Ben
chm
ark
isb
oth
div
iden
ds
and
repurc
hase
sin
the
pre
vio
us
yea
rand
conti
nuin
gth
at
policy
LD
=1,L
R=
1,D
=0,R
=0
0.0
14
3.0
80.0
12
1.5
0.0
15
4.1
70.0
36
8.1
40.0
17
2.8
06
1.5
LD
=1,L
R=
1,D
=0,R
=1
0.0
09
3.5
90.0
09
1.5
0.0
10
5.0
60.0
32
10.6
50.0
10
3.0
36
1.5
LD
=1,L
R=
1,D
=1,R
=0
0.0
01
0.5
80.0
00
1.0
0.0
01
1.4
50.0
04
1.4
60.0
01
0.6
65
1.0
31

Table R5 The impact of previous and current payout amounts for firms that change theirpayout policy, NYSE and NASDAQ, 1987-2011.
The table presents the coefficients (and robust p-values) for an ordinary least squares regression ofthe impact of amounts on the change in risk measures for treated firms for the four benchmark policies(panels A-D). All variables are wisorized (indicated with the letter W at the end of the mnemonic). Thedependent variables are change variables (indicated by the letter D before the mnemonic). The coremnemonics of the dependent variables are total risk (TRISK), market beta (BEXMR), the beta of smallminus big (BSMB), the beta of high minus low (BHML), overall systematic risk (SRISK), and idiosyncraticrisk(IRISK). The independent variables are current and lagged (indicated with the letter L at the end ofthe mnemonic) net repurchases to total assets (NREPTA), and current and lagged cash dividends to totalassets. The mnemonics below the risk measures refer to dividend payments (D), lagged dividends payments(LD), net repurchases (R), or lagged repurchases (LR) and whether the payouts took place (=1) or not(=1).
Panel A: Benchmark is no payout in the previous year and continuing that policy
DTRISKW DBEXMRW DBSMBW DBHMLW DSRISKW DIRISKW
LD=0,LR=0,D=1,R=0NREPTAWL
CDTAW 0.041 -3.595** 1.740 -0.869 -0.017 0.054**(0.153) (0.003) (0.336) (0.743) (0.359) (0.049)
CDTAWL
NREPTAW
32

Table R5 contd...
Panel B: Benchmark is only dividends in the previous year and continuing that policy
DTRISKW DBEXMRW DBSMBW DBHMLW DSRISKW DIRISKW
LD=1,LR=0,D=0,R=0NREPTAWL
CDTAW -0.024 -0.979 1.974 1.241 -0.041 -0.003(0.470) (0.373) (0.191) (0.589) (0.094) (0.933)
CDTAWL 0.014 0.144 -1.365 -1.990 0.017 0.008(0.642) (0.889) (0.312) (0.317) (0.449) (0.781)
NREPTAW 0.006 0.079 -0.312 0.085 0.005 0.007(0.659) (0.839) (0.575) (0.881) (0.593) (0.544)
LD=1,LR=0,D=0,R=1NREPTAWL
CDTAW
CDTAWL -0.014 -0.126 0.209 2.621 -0.001 -0.021(0.811) (0.919) (0.942) (0.207) (0.962) (0.691)
NREPTAW 0.189 2.831** 1.269 3.766 0.112** 0.145(0.076) (0.040) (0.739) (0.300) (0.004) (0.148)
LD=1,LR=0,D=1,R=1NREPTAWL
CDTAW
CDTAWL -0.034 0.787 -1.937 2.667 0.020 -0.055(0.364) (0.510) (0.237) (0.165) (0.371) (0.172)
NREPTAW
33

Table R5 contd...
Panel C: Benchmark is both dividends and repurchases in the previous year and continuing that policy
DTRISKW DBEXMRW DBSMBW DBHMLW DSRISKW DIRISKW
LD=1,LR=1,D=0,R=0NREPTAWL -0.009 -1.018 2.043** 1.641 -0.008 -0.004
(0.560) (0.128) (0.009) (0.152) (0.510) (0.738)CDTAW
CDTAWL -0.001 -1.129 0.412 4.554 -0.008 -0.002(0.984) (0.548) (0.874) (0.156) (0.806) (0.957)
NREPTAW
LD=1,LR=1,D=0,R=1NREPTAWL -0.009 -0.050 -1.039** -0.782 -0.005 -0.008
(0.243) (0.877) (0.031) (0.093) (0.321) (0.311)CDTAW
CDTAWL -0.036 -0.093 0.091 0.673 -0.019 -0.034(0.085) (0.920) (0.955) (0.627) (0.160) (0.082)
NREPTAW 0.008 -0.184 0.681 -0.700 0.003 0.005(0.623) (0.706) (0.371) (0.331) (0.724) (0.760)
LD=1,LR=1,D=1,R=0NREPTAWL 0.009 0.265 -0.030 -0.373 0.003 0.008
(0.169) (0.328) (0.919) (0.310) (0.524) (0.188)CDTAW 0.009 -1.693** 0.291 -0.073 -0.012 0.016
(0.671) (0.015) (0.816) (0.968) (0.438) (0.445)CDTAWL -0.006 2.387** -0.751 1.990 0.010 -0.008
(0.793) (0.001) (0.542) (0.277) (0.511) (0.695)NREPTAW
34