Embed Size (px)
Citation preview

MSc Financial Decision Analysis
Does Dividend Policy Matter?
The Impact of Dividend Policy on
Corporate Performance: UK Evidence
Emad Shehadeh
Student ID: UP 516293
Supervised by: Mr. Imad Chbib
December 2012
Portsmouth University Business School

Portsmouth University Business School
MSc Financial Decision Analysis
Title: Does Dividend Policy Matter? The Impact of Dividend Policy on Corporate
Performance: UK Evidence
Author: Emad Shehadeh
Tutor: Mr. Imad Chbib
Year of submission: December 2012
“This project is submitted in partial fulfilment of the requirements for the degree of MSc
Financial Decision Analysis. I, the undersigned, declare that this project report is my own
original work. Where I have taken ideas and or wording from another source, this is
explicitly referenced in the text.
Signed............................................................”
“I give permission that this report may be photocopied and made available for inter-library
loan for the purpose of research.
Signed ...........................................................”

i
Acknowledgment
First and above all I want to praise God for providing me this opportunity and granting me
the ability to proceed successfully. I would like to thank my family who gave me the moral as
well as the financial support I required during my studying. It would have been impossible to
write this dissertation without the guidance and endless support of my supervisor Mr Imad
Cbhib. I warmly thank and appreciate my friends and colleagues in MSc Financial Decision
Analysis for their motivation to finish this course. Special thanks to the staff working in the
University of Portsmouth.

ii
Abstract
The purpose of this paper is to examine the relationship between dividend policy and firm
performance in the UK stock market. The research is based on 283 companies that
maintained their existence in the UK FTSE all shares index between 2005 and 2010. The
study used dividend yield and dividend pay-out ratio as dividend policy indicators and share
price volatility, Tobin Q and return on assets as firm performance measurements. The
Statistical Package for the Social Sciences system (SPSS) was used to run a linear regression
to explore the relations among the variables. The study results suggest different relations
between the variables based on the measures used. It shows that dividend yield have a
significant negative relationship with share price volatility, Tobin Q and a positive
relationship with return on assets. On the other hand, the results indicates a significant
negative relationship between dividend pay-out ratio and share price volatility, a positive
relationship between dividend pay-out ratio and Tobin Q and return on assets.
In addition, it shows the effect of firms’ debt ratio, size, industry and board of directors’ size
on its performance. The results propose a significant negative relationship between firms
share price volatility and its industry, but a positive relationship between firms Tobin Q and
return on assets with its industry. Board of directors’ size have a significant negative
relationship with share price volatility, a negative relationship with Tobin Q and a non-
significant relationship with return on assets. Firm sizes have significant negative relationship
with share price volatility and a positive relationship with Tobin Q and return on assets. Debt
ratio results showed a non-significant relationship with share price volatility and return on
assets, but a positive relationship with Tobin Q. The study examined as well the effect of the
financial credit crisis on firms’ dividend policy and performance. It suggests that dividend
pay-out ratio and debt ratio were strongly affected by the financial crisis. The paper supports
the fact that firms’ dividend policy affects its performance and future value in sample of
firms listed in the UK market.

1

iii
Table of Contents Chapter One ............................................................................................................................... 1
1.0 Introduction ...................................................................................................................... 1
1.1 Background ...................................................................................................................... 1
1.2 Firm’s performance .......................................................................................................... 2
1.3 Aims and Objectives ........................................................................................................ 3
1.4 Research Questions .......................................................................................................... 4
1.5 Research Methodology .................................................................................................... 4
1.6 Research Lay-out ............................................................................................................. 4
Chapter Two............................................................................................................................... 5
2.0 Literature Review............................................................................................................. 5
2.1 Introduction ...................................................................................................................... 5
2.1 Efficient Market Hypothesis and Stock price’s volatility ................................................ 6
2.2 Dividend policy and Firm performance ........................................................................... 6
2.3 Dividend policy changes and share price volatility. ........................................................ 7
2.4 Theories of Dividend policy ............................................................................................ 8
2.4.1 Dividend Irrelevance Theory .................................................................................... 8
2.4.2 Agency Cost theory................................................................................................... 9
2.4.3 Signalling and Free cash flow theory...................................................................... 10
2.4.4 Bird in the hand theory ........................................................................................... 11
2.4.5 Cliental effects theory ............................................................................................. 11
2.5 Debt Ratio effect on firms’ dividend policy and performance. ..................................... 12
2.6 Board directors’ size effect on firms’ dividend policy and performance. ..................... 13
2.7 Industry type effect on firms’ dividend policy and performance. ................................. 14
2.8 Firm size effect on firms’ dividend policy and performance. ........................................ 14
2.9 Historical Pay-out Ratio effect on firms’ dividend policy and performance. ................ 15
2.10 Summary ...................................................................................................................... 15
Chapter Three........................................................................................................................... 17
3.0 Methodology .................................................................................................................. 17
3.1 Introduction .................................................................................................................... 17
3.2 Techniques and sources of data collection..................................................................... 17
3.3 Dividend policy measures .............................................................................................. 17
3.4 Firm performance measures ........................................................................................... 18
iv
3.5 Research control variables. ............................................................................................ 19
3.6 Research equations......................................................................................................... 19
3.7 Definition of research variables ..................................................................................... 21
3.7.1 Debt ratio ................................................................................................................ 21
3.7.2 Firm size.................................................................................................................. 21
3.7.3 Board of directors’ size ........................................................................................... 21
3.7.5 Pay-out ratio ............................................................................................................ 21
3.7.6 Industry type ........................................................................................................... 21
3.7.7 Dividend yield ......................................................................................................... 22
3.7.8 Share price volatility ............................................................................................... 22
3.7.9 Tobin’s Q ................................................................................................................ 22
3.8 Research Hypothesis ...................................................................................................... 22
Chapter Four ............................................................................................................................ 24
4.0 Introduction .................................................................................................................... 24
4.1 Data Descriptive Analysis .............................................................................................. 24
4.2 Regression results .......................................................................................................... 29
4.3 Summary ........................................................................................................................ 46
Chapter Five ............................................................................................................................. 48
5.1 Conclusion ..................................................................................................................... 48
5.2 Limitation ....................................................................................................................... 50
References ................................................................................................................................ 52
Appendices ............................................................................................................................... 58
Appendix (1): Variables descriptive analysis ...................................................................... 58
Appendix (2): Linear regression results from the SPSS model for the relationship between
dividend yield and dividend pay-out ratio with share price volatility. ................................ 61
Appendix (3): Linear regression results from the SPSS model for the relationship between
dividend yield and dividend pay-out ratio with Tobin Q. .................................................... 64
Appendix (4): Linear regression results from the SPSS model for the relationship between
dividend yield and dividend pay-out ratio with ROA .......................................................... 67
Appendix (5): Linear regression results from the SPSS model for the relationship between
dividend yield, dividend pay-out ratio and debt ratio with share price volatility. ............... 70
Appendix (6): Linear regression results from the SPSS model for the relationship between
dividend yield, dividend pay-out ratio and debt ratio with Tobin Q. .................................. 73
Appendix (7): Linear regression results from the SPSS model for the relationship between
dividend yield, dividend pay-out ratio and debt ratio with ROA. ....................................... 76
v
Appendix (8): Linear regression results from the SPSS model for the relationship between
dividend yield, dividend pay-out ratio and board of directors’ size with share price
volatility. .............................................................................................................................. 79
Appendix (9): Linear regression results from the SPSS model for the relationship between
dividend yield, dividend pay-out ratio and board of directors’ size with Tobin Q. ............. 82
Appendix (10): Linear regression results from the SPSS model for the relationship between
dividend yield, dividend pay-out ratio and board of directors’ size with ROA. .................. 85
Appendix (11): Linear regression results from the SPSS model for the relationship between
dividend yield, dividend pay-out ratio and market capitalisation with share price volatility.
.............................................................................................................................................. 88
Appendix (12): Linear regression results from the SPSS model for the relationship between
dividend yield, dividend pay-out ratio and market capitalisation with Tobin Q. ................ 91
Appendix (13): Linear regression results from the SPSS model for the relationship between
dividend yield, dividend pay-out ratio and market capitalisation with ROA. ..................... 94
Appendix (14): Linear regression results from the SPSS model for the relationship between
dividend yield, dividend pay-out ratio and industry type with share price volatility. ......... 97
Appendix (15): Linear regression results from the SPSS model for the relationship between
dividend yield, dividend pay-out ratio and industry type with Tobin Q. ........................... 100
Appendix (16): Linear regression results from the SPSS model for the relationship between
dividend yield, dividend pay-out ratio and industry type with ROA. ................................ 103
Appendix (17): Linear regression results from the SPSS model for the relationship between
dividend yield, dividend pay-out ratio, industry type, board of directors’ size, market
capitalisation and debt ratio with share price volatility. .................................................... 106
Appendix (18): Linear regression results from the SPSS model for the relationship between
dividend yield, dividend pay-out ratio, industry type, board of directors’ size, market
capitalisation and debt ratio with Tobin Q. ........................................................................ 109
Appendix (19): Linear regression results from the SPSS model for the relationship between
dividend yield, dividend pay-out ratio, industry type, board of directors’ size, market
capitalisation and debt ratio with ROA. ............................................................................. 112

1
Page | 1
Chapter One
1.0 Introduction
The dividend policy over decades remains a misleading and unresolved problem for
investors’ and managers’, the factors affecting the managers’ decisions on whether to pay or
re-invest the retained earnings and the consequences of these decisions on the performance of
the firms’. This research will examine some of the factors affecting dividend policy and the
performance of firms’ listed in the UK market.
1.1 Background
Defining dividend policy and factors affecting it has been a research topic for decades, but
yet it is considered one of the most challenging subjects in corporate finance. Black (1976)
described the dividend policy as a puzzle that is difficult to understand and also to solve.
Brealey & Myers listed dividend policy as one of ten major unsolved problems facing
financial analysts in the 21st century (Bhattacharyya, 2007). Dividend policy was defined by
Arnold (2008) as the percentage of profit paid to shareholders, usually periodically.
Although, firms can re-invest the retained earnings in projects that improve overall
performance which eventually maximise shareholders wealth in the long term, the question at
this point is why managers pay dividends? Especially that dividend is taxed at a higher rate
than capital gains. Based on the first theory in dividends established in (1961) by Miller &
Modigliani, a firm’s dividend policy is irrelevant to its value and shareholders wealth. Since
the irrelevant theory was established, many researchers and investors doubted the efficiency
of the assumptions used by Miller & Modigliani to establish the theory where they considered
that all investors act rationally, investors have perfect information about the firm’s strategies,
markets are perfect; no brokerage fees, no taxes or any other fees and managers act in the best
of shareholders interest.
However, in the real world the markets are not perfect, investors pay taxes and brokerage
fees, they do not have perfect information about the firm’s strategy or financial situation and
managers might make decisions in their own interest, but if dividend policy does not affect
firm value and it is taxable at a higher rate than capital gains then why do managers pay
dividends?. Following the Miller & Modigliani theory, researchers argued the factors
affecting managers’ decisions in paying dividend. D’Souza and Saxena (1999) argued that
sometimes managers keep secret information about the firm from the shareholders so they

Page | 2
can use them for their personal interests and in other to create a balance, they pay dividends.
Fairchild (2010) asserted that managers pay dividends to send good and positive signals to
investors. Al-Malkawi (2007) postulated that managers pay dividends to attract investors who
prefer to reduce uncertain future risk by preferring dividend gain rather than capital gain.
Fama & French (2001) in their study on the US market concluded that firm’s profitability,
investment opportunities and size are the main effects on firm’s dividend policy. Al-Najjar &
Hussainey (2009) argued that firm’s capital structure have a big impact on managers
decisions on paying dividends. Bokpin (2011) suggested that the size of the board of directors
is directly related to the agency theory, and it will influence a manager’s decision to pay
dividends. Frankfurt & Wood (2002) argued that different industries have different
government regulations and competitiveness among them, which will affect the dividend
policy for firms within such industry. Baker et al (2001) in their study stressed that previous
pay-out ratios are the main effect on manager’s decision to decide the upcoming pay-out
ratio. Modigliani (1982) argued that inflation has a huge impact on stock returns and as such
recommended that inflation rates should be considered by managers to determine the firm’s
dividend policy. Bhattacharya (2007) in his model presented the effect of dividend
announcement on investors’ behaviour; he argued that since investors don’t have enough
access to information related to firm’s future strategy, they believe that dividend ratio reflects
the financial situation of the firm
1.2 Firm’s performance
Many researchers have attempted to study firm’s performance using different indicators,
some using accounting measures and others arguing that market values reflects more accurate
results. Wolfe & Sauaia (2003) discussed different types of total enterprise (TE) business
games which were developed to study firm’s performance. TE games focus on the
management decisions related to the main functions in firms; marketing, finance and
production. The Multinational Management Game was developed in 1997 by Keys while
Wells proposed that return on sales and debts to total assets are main indicators in measuring
firms’ performance. The Business Strategy and policy game were developed by Eldridge &
Bates in 1984. They found out that selling price, labours amount of generated hours and their
salaries affected firm’s earning per share, and share price. Damodaran (2002) described
market based value as indicators to firm’s performance. Total shareholders return considers
the change in stock price plus the dividend paid in specific period reflects how well the firm
performed in that period.

Page | 3
Another indicator was Market Value Added, which deduct the amount of capital provided by
shareholders from the market value of shares in specific period. The change of market value
in a long period of time will be considered an evidence of firm’s performance. An additional
measure that was developed to deal with the limitations of total shareholders return and
market value added was the Excess return, which takes into consideration the time value of
money. Excess return is measured by deducting the expected future wealth in present value
from the actual wealth in present value. Arnold (2008) mentioned that financial ratios are
good source of information to analyse firm’s performance. He discussed that analysis can use
liquidity, assets turnover, financial leverage and profitability ratios to estimate the change in
firm’s performance. Other measures have been recommended to use. Fama (1991)
recommended the use of Tobin Q value as a market measurement because it is based on the
basis of efficient market hypothesis. He argued that it Tobin Q value is more reliable than
using accounting measures which have been questionable for its limitation. The Q value can
be calculated by adding the dividends to the market value of shares and divide them by total
assets. Chung & Pruitt (1994) claimed that Tobin Q can explain the phenomena of
diversification on investment decisions. Bharadwaj et al. (1991) suggested that the use of
Tobin Q over accounting measures because it’s a reliable indicator of firm’s intangible value,
while accounting measures rely on historical data that doesn’t reflect the current market
situation.
1.3 Aims and Objectives
The broad objective of this study is to clearly define and analyse the relationship between
firms’ dividend policy and their performance in the long-term using different accounting and
market measures; pay-out ratio and dividend yield as dividend policy measurements and
ROA, Tobin Q’s and share price volatility as firm performance measurement. To define the
relationship in the long term, the study aims to accomplish the following tasks;
Examine the relationship between dividend yield and ROA, Tobin Q’s and Share
price volatility and considering the impacts of the financial credit crisis on dividend
yield.
Examine the relationship between pay-out ratio and ROA, Tobin Q’s and share price
volatility as well as the impact of the financial credit crisis on dividend pay-out ratio.

Page | 4
Identify the strongest factors affecting managers’ decisions on dividend policy and its
impact on the performance of the firm.
1.4 Research Questions
The research was guided to answer the following questions;
What is the relationship between firms’ dividend policy and its performance?
Did the financial credit crisis affect the relationship between firms’ dividend policy
and its performance?
What are the factors affecting the managers’ decision when setting firms’ dividend
policy?
1.5 Research Methodology
For the purpose of statistical analysis, the relationship between dividend policy and firm
performance and to cover this task, SPSS software will be used and more than twenty
regressions will be run and multiple linear regression is used no analyse the results. The
results will be based on the UK non-financial companies listed between 2005 and 2010. The
data will be collected using Bloomberg software and firms’ financial reports.
1.6 Research Lay-out
The research is divided into introduction, literature review, methodology, results and
conclusion. Chapter 2 covers the literature review which will discuss previous researches
which have analysed the relationship between dividend policy and firm performance using
different measurements. Chapter 3 will discuss the methodology used in this research which
include the variables used, the equations applied in the regression, the established hypothesis
and the descriptive analysis for the variables. Chapter 4 displays the results obtained from
SPSS software and the analysis using linear regression and the hypothesis testing. The next
and final chapter is the conclusions of the model will which provide a summary of the
analysis and hypothesis results.
Page | 5
Chapter Two
2.0 Literature Review
This chapter will discuss previous theories and studies by various researchers on dividend
policy and firm performance and the factors affecting them.
2.1 Introduction
Dividend policy is a strategic decision made by the management of a firm with regards to the
use of earnings; either pay them as dividends to the shareholders versus reinvest the earnings
in the firm (Hussainy et al, 2011). While the first theoretical definition of dividend was
developed by Lintner (1956), the model by Miller & Modigliani in 1961 is considered the
classical research which proposed the irrelevance theory which assured that dividend policy
is irrelevant to firms’ value. Miller & Modigliani model results based on specific
consideration where investors won’t pay taxes or transaction cost, they can borrow and lend
at the same interest rate, and have access to all information about the firm’s future growth,
and where shareholders will be paid high dividends, and the firm can cover any paid out
earnings by issuing new shares (Arnold, 2008).
However, Black (1976) came up with the puzzle theory and no one argued it because in our
world, transaction cost and taxes exist, and firm’s dividend policy is affected by many
factors; sensitivity of earnings, cliental effect, government regulation, debt level, firm size
and many other factors (Al-Shabibi & Ramesh, 2011). On the other hand it has different
effects, while it sends mixed signals to investors, an increase in pay-out ratio is not necessary
good news, and a decrease in pay-out ratio might benefit the firm in the long-term. Dividend
policy is affected as well by the firm strategy, if the firm is in growth stage, low dividend is
expected. But even a firm in its maturity stage might prefer not to pay dividends and
managers will re-invest the earnings in the research and development department to gain a
competitive advantage or to invest in a positive net present value projects which either ways
will maximise shareholders wealth in the long-term (Grullon et al, 2002).
Page | 6
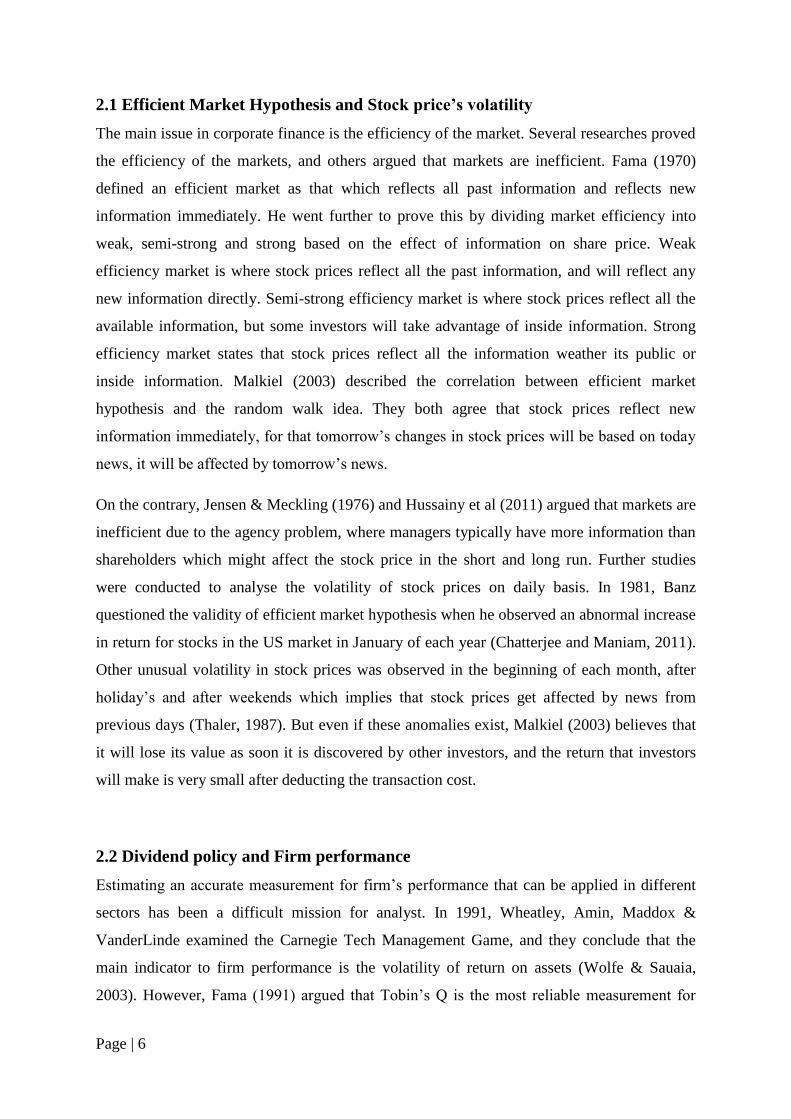
2.1 Efficient Market Hypothesis and Stock price’s volatility
The main issue in corporate finance is the efficiency of the market. Several researches proved
the efficiency of the markets, and others argued that markets are inefficient. Fama (1970)
defined an efficient market as that which reflects all past information and reflects new
information immediately. He went further to prove this by dividing market efficiency into
weak, semi-strong and strong based on the effect of information on share price. Weak
efficiency market is where stock prices reflect all the past information, and will reflect any
new information directly. Semi-strong efficiency market is where stock prices reflect all the
available information, but some investors will take advantage of inside information. Strong
efficiency market states that stock prices reflect all the information weather its public or
inside information. Malkiel (2003) described the correlation between efficient market
hypothesis and the random walk idea. They both agree that stock prices reflect new
information immediately, for that tomorrow’s changes in stock prices will be based on today
news, it will be affected by tomorrow’s news.
On the contrary, Jensen & Meckling (1976) and Hussainy et al (2011) argued that markets are
inefficient due to the agency problem, where managers typically have more information than
shareholders which might affect the stock price in the short and long run. Further studies
were conducted to analyse the volatility of stock prices on daily basis. In 1981, Banz
questioned the validity of efficient market hypothesis when he observed an abnormal increase
in return for stocks in the US market in January of each year (Chatterjee and Maniam, 2011).
Other unusual volatility in stock prices was observed in the beginning of each month, after
holiday’s and after weekends which implies that stock prices get affected by news from
previous days (Thaler, 1987). But even if these anomalies exist, Malkiel (2003) believes that
it will lose its value as soon it is discovered by other investors, and the return that investors
will make is very small after deducting the transaction cost.
2.2 Dividend policy and Firm performance
Estimating an accurate measurement for firm’s performance that can be applied in different
sectors has been a difficult mission for analyst. In 1991, Wheatley, Amin, Maddox &
VanderLinde examined the Carnegie Tech Management Game, and they conclude that the
main indicator to firm performance is the volatility of return on assets (Wolfe & Sauaia,
2003). However, Fama (1991) argued that Tobin’s Q is the most reliable measurement for
Page | 7
firm performance. Baker et al. (2001) used stock price as an indicator to firm performance.
They argued that managers’ pays close attention to the choice of dividend policy and pay-out
ratio in their firm. Their main concern is if they changed the dividend policy that will affect
the stock price, which will affect the firm value, and in return will affect the firm
performance. The effect of dividend policy in firms performance varies based on the
measure’s used as indicators for performance. Baskin (1989) model found a negative
relationship between dividend yield and dividend pay-out ratio and share price volatility.
Hussainey et al (2011) analysis ha similar result to Baskin’s model, they argued that dividend
pay-out ratio have a negative relationship with share price volatility. Allen and Rachim
(1996) results were found a significant negative relationship between dividend pay-out ratios
with share price volatility. DeAngelo et al. (2006) used return on assets as a firm performance
indicator and found a positive relationship between firms’ dividend policy and its
performance. Amidu (2007) studied the relationship between dividend policy and firm
performance using different measures. He found a significant positive relationship between
firm’s dividend policy and firm performance using return on assets as a measurement but the
relationship became negative when he used Tobin Q as a performance indicator. Murekefu
and Ouma (2012) model had similar results to Amidu and found a significant positive
relationship between dividend policy and firm performance.
2.3 Dividend policy changes and share price volatility.
At the beginning of corporate finance, dividend policy was the choice of firms to pay
earnings as cash dividend to its shareholders or reinvest retained earnings in the firm. The
major concern for managers is how much to pay as Dividend, should it be paid annually,
semi-annually or quarterly (Arnold, 2008).
With the progress of corporate finance over the years, dividend policy became a complex
issue; it has to deal with the type of dividend, should it be cash, or scrip dividends, or by
share buy-backs. Other than that, dealing with investor attitude toward risk, and to balance
between investors whom prefers capital gain, and investors whom prefers dividend earnings
(Arnold, 2008).
Lintner (1956) raised questions about the investors that managers should consider; should the
amount of dividend be reduced or increased? Or would they prefer a fixed rate dividends
being decided based on the earnings? The changes in stock prices will be used to analyse how
risky is the stock. The volatility of stock has to do with the historical closing and the amount

Page | 8
of change in the prices. The higher the volatility the higher the changes in the stock price in
the short-run, which will make it difficult to predict the future stock price.
Investors react differently to the available or new information, they react based on their own
analysis, and this will have an impact on the stock market prices. Forsythe, Palfrey, & Plott
(1982) defined four hypothesis related to the share price with an assumption that investors
have a clear idea about their return in the future. The first hypothesis is the naïve hypothesis,
which emphasize that asset prices are irrelevant to the future pay-out. The second hypothesis
is the speculative equilibrium hypothesis, which relates the investor’s decision to their
expectation of other investor’s behaviour, without considering the actual payoff provided
from the asset. The third hypothesis is that assets prices are steadily related to the future pay-
out, it states that prices will be determine based on each individual expectation of the future
pay-out without considering the resale value for a third party. The fourth hypothesis is the
rational expectation hypothesis, which forecasts the prices based on the future pay-out plus
the resale price for the third party.
2.4 Theories of Dividend policy
Several studies have been developed discussing theories related to dividend policy such as,
Lintner (1956), Miller & Modigliani (1961), Black (1976), Bhattacharya (2007), Fama&
French (2001), Al-Malkawi (2007) and Al-Najjar & Hussainey (2009). These theories and
others related are discussed below;
2.4.1 Dividend Irrelevance Theory
Many past studies focused on the causes that affects managers to pay dividends, and if there
is a pay-out ratio that will maximise the shareholders wealth. Miller & Modigliani (1961)
argued that the dividend policy of a company will not affect the future firm value, and firms
are valued based on future cash flows generated from under taken investments. They assumed
in their argument that all investors have access to all the available information, they are not
obligated to pay a brokerage fees, and they do not pay taxes or any other additional costs.
Other assumptions that investors act rationally, they don’t differentiate between dividend and
capital gain to increase their wealth, and they all have enough information about the firms’
objectives and future growth.
Furthermore, Al Shabibi & Ramesh (2011) conducted that dividend policy is an important
decision which affects the firm’s in the long term, and it is affected by the firm cash flow
stability, the firm size, profitability, and the industry it performs in. Fama & French (2001)

Page | 9
argued that the percentage of firm’s paying dividends clearly declined after 1978. They stated
that firm’s that pays dividend regularly will have a competitive disadvantage because their
high cost of equity compared to firms that do not pay dividends.
2.4.2 Agency Cost theory
According to Miller & Modigliani (1961) irrelevance theory, managers make their decisions
in order to maximise shareholders wealth. The assumption that managers work for the best of
shareholders have been questionable by new studies. Jensen & Meckling (1976) defined the
shareholders and managers relationship as a contract between them, where managers will be
responsible to take decisions that will achieve shareholders objectives. But shareholders
might question the manager’s decisions, and make sure that they do not act for their interest.
Agency cost will be the price that shareholders will pay if they have any conflict in interest
with the managers. Hussainy et al (2011) stated another possibility for agency cost, which is
the conflict between shareholders and bondholders, while shareholders seeks for higher
dividend payments, bondholders prefer lower dividend pay-out, to ensure a cash stability in
the firm to repay their debt.
Ross et al. (2008) argued that managers can eliminate the conflict between bondholders and
shareholders by paying dividend in stocks instead of regular cash payment which will keep
the excess cash in the firm. Easterbrook (1984) divided the agency cost to the cost of
monitoring the management, and the cost of risk on the management part. Monitoring
managers by hiring external auditors or increase the number of meetings between
shareholders and managers to try to reduce information asymmetry is consider additional cost
that should not be added. D’Souza and Saxena (1999) studied the relationship between
dividend policy and the agency cost, and found that there is a statistical significant negative
relation between them, and argued that firm should pay dividend in a regular basis to reduce
the agency cost. Al-Malkawi (2007) and Arnold (2008) agreed with D’Souza and Saxena
results and found that dividend is the best solution to reduce agency cost. Al-Najjar &
Hussainey (2009) in their model on UK firms suggested that paying dividend is a substitute
for firms with weak corporate governance.
In their working paper, Jiprapon et al. (2008) studied the effect of corporate governance on
dividend pay-out considering sixty two aspect of corporate governance. They found a
positive relationship between corporate governance and dividend pay-out. The better the
corporate governance in the firm, the higher the dividend pay-out. Fairchild (2010) in his

Page | 10
model identified agency problems related to dividend policy. First if the manager reduced the
dividend amount to invest in a negative net present value investment to gain personal profit.
Second if the manager refuses to reduce dividend to invest in a positive net present value
investment, as a concern of sending bad signals about the firm income.
2.4.3 Signalling and Free cash flow theory
Signalling theory was a result of the asymmetric information between the management and
investors. It states that in an asymmetric environment, the dividend pay-out ratio will be an
important tool for investors to analyse the firm financial stability (Fairchild, 2010). The free
cash flow theory argues that agency cost will be reduced, if the management decided to pay
dividends instead of investing in new projects, because the investor main concern that
managers might invest in a negative present value projects for their own interest (Yoon &
Starks, 1995). The use of the available cash flow by the management sends direct signals to
the investors.
Michael and Mougoue (1991) model anticipated that firms will use cash dividend when they
make small pay out. For intermediate pay outs firms will use open market repurchase, where
they buy-back shareholders shares based on market value. For large pay outs firms will use
fixed price tender, where they offer to buy specific number of shares on specific price.
Although Miller & Modigliani (1961) assumed that management and investors have perfect
information about the firm, but previous researches showed that management will always
have more information more than the investors, even if it is for a short period of time. Petit
(1972) argued that dividend pay-out always carry great information to the investors. If
dividends pay-out ratio increase that will have a positive effect on the share price and vice
versa. Bhattacharyya (2007) stated that dividend announcements for companies are
considered important signals for investors and lot of analyses base their expectations on the
increase/decrease of the pay-out ratios, which raise questions on the irrelevance theory. Ross
et al. (2008) argues that manager’s decisions to increase pay-out ratio is a signal to investors
about the financial stability in the firm. Goddard et al (2006) analysis on the UK market
informed evidence supporting signalling theory, but in the same time they argued that the
relationship between dividend policy and share price volatility is too complicated and cannot
be explained by the signalling theory itself. Fairchild (2010) signalling model used the
dividend as a sign of the firm yearly income, and it affected the management decisions in
taking new projects. Dividend policy sends mixed and complicated signals to investors. If the
management decided to increase their dividend pay-out, investors might analyse that as a bad

Page | 11
sign for future growth, although the reason might be the lack of opportunities to grow or an
increase in last year earnings. If the management decided to decrease their dividends pay-out
to invest in a positive net present value projects, investors might respond negatively, and
question the management decision if it is based on a personal profit, or for the sack of the
firm (Arnold, 2008).
2.4.4 Bird in the hand theory
Investors use different strategies to analyse the available information, and based on them they
react in different ways based on the level of risk. Bird in hand theory asserts that investors
prefer stocks that pay high dividends to reduce risk, “A bird in hand (dividend) is worth more
than two in the bush (capital gains)” (Al-Malkawi, 2007). Investors are divided based on the
level of risk they are willing to take to risk adverse, risk neutral, and risk takers. Most
investor are identified as a risk averse, and for that Al-Malkawi’s theory was supported by
Lintner (1962) with the assumptions that investors are not provided with all the information
about the firm profitability, the dividends gain are taxed in a higher level than capital gain,
and dividends are used as a signal for the firm profitability. Arnold (2008) stated that
investors attitude toward risk encourage them to invest in firms with high dividend pay-out
ratio. Although dividends gain have a tax disadvantage but yet managers keep paying it to
send positive signals to investors who fear the future uncertainty (Hussaine et al. 2011) With
the investors nature to be risk adverse Ross et al. (2008) recommended firms that pays high
dividends to use share repurchase as a dividend policy instead of cash to reduce the amount
of tax on investors gain. On the other hand Easterbrook (1984) against the bird in the hand
theory. His argument was based on the ability of investors’ to sell the shares at any time
instead of waiting for dividends and that will reduce the amount of tax paid as well.
2.4.5 Cliental effects theory
Investors have different strategies in maximising their profits by using specific stocks. Each
investor will prefer stocks that satisfy his needs. Some investors apply bird in hand theory,
and they prefer stocks that pays high dividend, other investors might prefer stocks that do not
pay dividends for taxes reasons. Al-Malkawi (2007) proposed that firms in their growth stage
will pay low dividend to finance their projects, on the other hand, firms in their maturity stage
will pay high dividend. Miller & Modigliani (1961) stated that any investor is as good as
another, so if investors wish to minimise their income taxes they should invest in companies
with low dividends, and investor’s with a dividend gain preference should invest in firms that
pay high dividends, which make dividend policy irrelevance to the firm value. But

Page | 12
Bhattacharyya (2007) argued that Miller and Modigliani model failed to explain why
companies and investors are affected by dividend announcements. Bhattacharyya believes
that dividend announcement have some interested information that Miller and Modigliani
model failed to notice it because of the distraction in their assumptions. Goddard et al (2006)
have argued that firm’s dividend policy decisions considers the needs of specific groups of
investors, and firms will assure that their dividend policy will suit these investors. Al-
Malkawi (2007) categorised cliental effects into two groups, first group are investors who are
driven by taxes, and the second group are investors who are driven by transaction cost. The
group who’s affected by taxes can invest in low dividend companies, and the group who’s
affected by transaction cost are usually small investors who prefer companies with high
dividend pay-out, to minimise transaction cost. Miller & Scholes (1982) reduced the effect of
taxes on investors. They argued that investors can reduce the deducted taxes on their dividend
earnings, by increasing the debt ratio in the portfolio, which will lead to an increase in the
interest paid, that will reduce the earnings before taxes, and therefore reduce the amount of
tax paid.
2.5 Debt Ratio effect on firms’ dividend policy and performance.
Debt ratio is the percentage of external funds to shareholders funds (Arnold, 2008). The
determination of capital structure in UK was considered by Niu (2008) who argued that large
firms with high tangible assets or high taxable rate tend to have high leverage. But firms with
growth opportunities, or firms with high liquidity, or with volatile earnings tend to have low
leverage. Although Miller & Modigliani (1961) theory proposed that the percentage of debt
and equity in the capital structure is irrelevant to firms value, researches argued that debt
level have an impact on dividend policy. Baker and Powell (2000) argued that firm’s capital
structure is affected by the type of industry. Their results showed that utility sectors maintain
different capital structure than firms in the retail sector. Arnold (2008) recommended firms to
have a high debt in their capital structure. His assumption was based on the lower cost of debt
compared to the cost of equity. He assumed that a firm with high debt have a trade-off
between interest expenses and the amount of tax paid, which will increase shareholders
wealth. On the other hand Al-Najjar & Hussainey (2009) argued that one of the main
conflicts between shareholders and managers is the debt ratio, because firms with high debt
have a higher risk of facing difficulties in meeting their future obligation, which will send
negative signals to investors. Their study showed a negative relationship between debt ratio
and dividend policy, the lower the debt ratio, the higher the dividend pay-out. Al-Shabibi &

Page | 13
Ramesh (2011) study on the UK market argued that debt level and dividend policy are not
correlated. Al- Hussainey et al. (2011) studied the effect of debt level on share prices. There
results showed that the higher the debt level, the higher the volatility in stock prices. Allen
and Rachim (1996) argued that debt ratio have a significant positive relationship with share
price volatility. Saeedi and Mahmoodi (2011) found a negative relationship between debt
ratio and ROA but a positive relationship between debt ratio and Tobin Q.
2.6 Board directors’ size effect on firms’ dividend policy and performance.
Board size represents the number of members, executive and none executive in the firm. The
relationship between board of directors’ and dividend policy has been examined by limited
studies. Would the size of board affect the management decisions to pay dividend or is it
irrelevant. Bathala & Rao (1995) in their study on 261 US firms in 1981 found a negative
relationship between the size of board directors’ and dividend policy. They considered the
dividend pay-out is not related to the size of board as much as it is an efficient way to reduce
agency cost. Another study by Borokhovich el al. (2005) examined the relation between
dividend policy and board directors’ size on 192 US firms. Their results were similar to
Bathala & Rao (1995) findings. They suggested that firms with high number of directors’ in
board tend to pay low dividends. Al-Shabibi & Ramesh 2011 study on the UK market found
a non-significant relationship between board size and firms’ dividend policy. On the other
hand Schellengeret al. (1989) found a positive correlation between board size and dividend
policy. Their results were based on a sample on 525 US firms in 1986. They conclude that a
firm board directors’ structure effects dividend policy. In addition a study of 160 US by
Kapalan and Reishus (1990) had the same results. They argued that managers’ decisions in
dividend policy are affected by the number of board directors’. (Belden, Fister and Knapp,
2005), (Al-Najjar & Hussainey (2009) and Bokpin (2011) had similar results; they suggested
a positive relationship between the size of board directors’ and dividend policy. On the other
hand Barnhart and Rosenstein (1998) found a negative relationship between board of
directors’ size and the firm performance. Guest (2009) study on the companies listed in the
UK market found a negative relationship between board of directors’ size and Tobin Q.
Topak (2011) findings from the Turkish market suggested a non-significant relationship
between board of directors’ size and firm performance.

Page | 14
2.7 Industry type effect on firms’ dividend policy and performance.
This identifies the sector where the company operate. Different sectors have different
competitive level, different environmental changes, and different government regulations.
Fama (1974) found that companies in different industries follow different government
regulations which affect their investment decision. Baker and Powell (2000) studied the
relationship between dividend policy and industry type using a survey in 1997 for NYSE
listed US firms. They found a strong relationship between the type of industry and dividend
policy. Based on Baker & Powell results they argue that utility sector tend to pay more
dividend than manufacturing and retail sector. Frankfurter & Wood (2002) had similar
results, they stated that the competitive level is different among the industries, and it affects
the management decision toward dividend policy. Van Caneghem & Aerts (2011) supported
Baker & Powell results. In their study of a large sample on US firms, they found a significant
relationship between dividend policy and industry type. Their argument was based on the
volatility of mean return for the industry, which affects firm’s dividend policy. But Al-
Shabibi & Ramesh analysis on the UK market argues that firm’s dividend policy is not
affected by their industry type. Hussainey et al. (2011) results suggested a non-significant
relationship between industry type and share price volatility.
2.8 Firm size effect on firms’ dividend policy and performance.
Firms can be categorised based on their size. Market capitalization, total assets, profitability
and other measures can be indicators to firm size. The effect of firm size on dividend policy
is associated with the agency cost, and free cash flow theory. Al-Najjar & Al-hussainey
(2009) model found a positive relation between dividend policy and firms size. Holder et al.
(1998) had the same results. They argued that firms in their maturity stage have easier access
to capital market, which will make them able to pay high dividend. Ho (2003) study on
Australian and Japanese market found a positive relation between firm size and dividend
policy. On the other hand Smith and Watts (1992) stated that the theoretical foundation for
the relationship between firm size and dividend policy is not strong. He suggested a negative
relationship between dividend policy and firm size. Keim (1985) had close results to Smith &
Watts. He argued that dividend policy have a significant negative relationship with the firm
size. Recent studies on the UK market by Al-Shabibi & Ramesh (2011) and Al-Najjar and
Hussainey (2009). Hussainey et al. (2011) studied the relationship between firm size and its
performance using share price volatility as an indicator of performance. There results showed
a significant negative relationship between firm size and share price volatility. Allen and

Page | 15
Rachim (1996) argued that small firms are subject to greater share price volatility since it is
expected to be less diversified than large firms’. Saeedi and Mahmoodi (2011) found a
positive relationship between firm size and firm performance when using earning per share as
an indicator, but the relationship became negative when they used Tobin Q as a performance
indicator.
2.9 Historical Pay-out Ratio effect on firms’ dividend policy and performance.
Firm’s pay-out ratio is the amount of earnings paid to shareholders as dividends. Baker et al.
(2001) study on U.S companies found that one of the most factors affecting firm’s dividend
policy is the volatility of historical payments. Al-Shabibi & Rmesh (2011) found a significant
positive relationship between dividend policy and historical pay-out ratio. They argued that
reducing pay-out ratio will send bad signals to investors even if the firm is planning to use the
cash to take a positive net present value projects. Hussainey et al. (2011) analysis on the UK
market found a positive correlation between pay-out ratio and firm’s performance. Pay-out
ratio is a sensitive issue for managers, because changing it will have a big impact on the firm.
It has been mention earlier in the literature review the sensitivity of pay-out ratio to the
company’s future, and satisfying investor’s needs. Easterbrook (1984) argued that a stable
dividend policy will affect the share price positively.
2.10 Summary
The aim of this chapter was discussing previous researches and findings about the
relationship between firms’ dividend policy and its performance. The findings of previous
researches were based on the measures used as indicators form dividend policy and firm
performance. Murekefu & Ouma (2012) model showed a positive relationship between firms’
dividend policy and its performance. DeAngelo et al. (2006) and Amidu (2007) used return
on assets as a performance indicator and found a positive relationship between dividend
policy and firm performance. On the other hand Hussainey et al. (2011) and Allen and
Rachim (1996) models used share price volatility as a performance indicator, they found a
significant negative relationship between dividend pay-out ratio and share price volatility. For
dividend yield, Rachim Hussainey et al. (2011) study showed a positive relationship between
dividend yield and share price volatility. Baskin (1989) and Amidu (2007) models showed a
negative relationship between firms’ dividend policy and its performance using share price
volatility and Tobin Q respectively as a performance indicator.
The control variables’ recommended by Baskin (1989) had different effects on firms’
dividend policy and its performance based on the measurement used. Al-Najjar and

Page | 16
Hussainey (2009) found a positive relationship between firms’ dividend policy and their debt
ratio. Al-Shabibi and Ramesh (2011) results were inconsistent to Al-Najjar and Hussainey
findings, they found that debt ratio have a non-significant relationship with firms’ dividend
policy. Saeedi and Mahmoodi (2011) measured the effect of debt ratio on firm performance
using different indicators. They found a positive relationship between debt ratio and firm
performance using ROA as an indicator, but a negative relationship when using Tobin Q as a
performance measurement.
The board of directors’ size have a positive relationship with dividend policy based on Al-
Najjar and Hussainey (2009) and Bokpin (2011). On the other hand Borokhovich el al. (2005)
analysis showed a negative relationship between board size and dividend policy. Guest
(2009) study found a negative relationship between board of directors’ size and Tobin Q. But
Topak (2011) suggested a non-significant relationship between board of directors’ size and
firm performance on his study.
The firm size was suggested to have a positive relationship with dividend policy based on Al
Shabibi & Ramesh (2011). Hussainey et al. (2011) study showed a significant negative
relationship between firm size and its performance using share price volatility as an indicator.
Saeedi and Mahmoodi (2011) results suggested a negative relationship between firm size and
Tobin Q.
Baker and Powell (2000) found a significant effect of firms’ industry on its dividend policy.
Al-Shabibi and Ramesh (2011) had inconsistent result to Baker and Powell findings. They
suggested a non-significant relationship between firms’ dividend policy and the industry they
follow. Hussainey et al. (2011) results suggested a positive relationship between dividend
yield and share price volatility.

Page | 17
Chapter Three
3.0 Methodology
3.1 Introduction
This chapter provide a description of the applied methodology to achieve the objectives of
this research. The chapter presents the target population and the data collection, the variables
measures, research equations, variables definition, research hypothesis and data analysis.
3.2 Techniques and sources of data collection
The primary aim of this study is to examine the link between dividend policy and firm
performance in the UK market. The relationship between dividend policy and firm
performance has been examined using Statistical Package for Social Sciences (SPSS) on non-
financial companies that maintained its presence in FTSE 250 for six years consecutively
between 2005 and 2010. However, only 89 out of 250 companies maintained their existence
in the market within this period, this might be considered not adequate to present the whole
companies listed in FTSE 250. To avoid this limitation, the criteria were adjusted to include
more companies. The matching companies listed in FTSE all shares UK index from 2005 to
2010 were included. This criterion provided 283 companies to be tested using SPSS and
multiple least square regressions to analyse the data over the six year period. The financial
companies were excluded because of the different rules and regulations applied in financial
sectors which affect its capital structure.
3.3 Dividend policy measures
The elect of measurement used for dividend policy and firm performance were based on the
recommendation and the usage of them by previous researchers in different models. Dividend
policy can be measured by; changes in historical pay-out ratio, dividend per share, and
dividend yield. Hussainey, Chijoke-Mgbame & Magbame (2011) in their model analysed the
relationship between dividend policy and firm performance in the UK market using dividend
yield and pay-out ratio as dividend policy measurement. Also, Allen and Rachim (1996) in
their model measured firm’s dividend policy in Australian market using dividend yield. In
their model in 2009, Al-Najjar and Hussainey measured dividend policy by using dividend
yield as well. Dobbins and Witt (1993), Lintner (1956) and Jensen (1986) recommended

Page | 18
dividend yield and pay-out ratio as accurate measures to firm’s dividend policy as they reveal
the percentage change in dividend and they consider the changes in share prices. For these
recommendations both dividend yield and pay-out ratio are used as dependent variables to
measure firm’s dividend policy in the model.
3.4 Firm performance measures
Different measurements can be used as indicators to firm’s performance. Forbes (2002)
argued that firm’s performance can be measured by the changes in net income, sales, market
capitalisation and assets. Firm’s performance can vary based on the value sources, if it is
based on book values or market values. Accounting ratios; profit, sales, return on equity,
return on assets and other ratios available in firm’s annual reports can be used to measure
firm’s performance. Measures which considers market and book values; market value added,
economic value added, Tobin’s Q and others which could be calculated can be considered
more reliable than accounting ratios. Other measure, volatility in share price which is
considered a market value indicator can be used as well. But with the limitation of accounting
measures mentioned by Arnold (2008) and Bowhill (2008) which assumes that accounting
measures are not reliable because they reflect past performance and does not consider the
future, they need to be adjusted to market values and it ignores the effect on intangible assets
on firm’s performance, Tobin’s Q and share price volatility are used in this model with the
return on assets as independent variables to reflect firm’s performance.
Baskin (1989), Hussainey, Chijoke-Mgbame & Magbame (2011) and Allen andRachim
(2010) models used share price volatility as firm’s performance. They argued that share price
reflects the financial and non-financial information’s, the company’s future strategy is
reflected on share price and it is consider a key performance to investor’s. Feltham & Xie
(1994) and Paul (1992) recommended the use of share price as a firm performance indicator
as it provides more accurate results than other methods. For these reasons share price
volatility was considered a firm performance indicators in the model. The third dependent
variable Tobin’s Q was used based on the agreement of previous researches as it is one of the
main measures of firm’s performance. Fama (1991) argued that Tobin’s Q perfectly
addresses accounting measures limitations and it is based on the foundation of the efficient
market hypothesis. Hall (1993) stated that the efficiency of Tobin’s Q comes from the
consideration of firms tangible and intangible assets. Chung and Pruitt (1994) preference of

Page | 19
Tobin’s Q over other measurements was because it employ the relationship between equity
ownership and firm value.
3.5 Research control variables.
Taking Baskin (1989) recommendation of analysing other factors affecting dividend policy or
firm performance, other control variables were added to the model; debt ratio, firm size, pay-
out ratio, board of directors’ size and industry type. The source of data in this research is
purely secondary data collected from Bloomberg, firm’s annual reports and London Stock
Exchange website. The independent variable dividend policy was measured using pay-out
ratio and dividend yield. The dependent variable firm performance was measure using
Tobin’s Q, return on assets and share price volatility.
3.6 Research equations
In this model the three dependent variables (stock price volatility, Tobin’s Q and ROA) are
regressed to the two independent variables (dividend yield and pay-out ratio), the differences
in results are discussed in the analysis.
Each dependent variable will be regressed to the independent variables with the following
regression equations;
𝑆ℎ𝑎𝑟𝑒 𝑃𝑟𝑖𝑐𝑒 𝑉𝑜𝑙𝑎𝑡𝑖𝑙𝑖𝑡𝑦 = 𝐶 + 𝑎1 + 𝑎2 (1)
𝑇𝑜𝑏𝑖𝑛’𝑠 𝑄 = 𝐶 + 𝑎1 + 𝑎2 (2)
𝑅𝑒𝑡𝑢𝑟𝑛 𝑜𝑛 𝑎𝑠𝑠𝑒𝑡𝑠 = 𝐶 + 𝑎1 + 𝑎2 (3)
Where,
“C” represents the intercept.
“a1” represents pay-out ratio.
“a2” represents dividend yield.
The results represent a simple test to the relationship between firm performance and dividend
policy using different indicators.
With all the factors affecting dividend yield and dividend pay-out ratio the results of the
equations above may not be accurate. For that the control variables mentioned earlier were
added as independent variables. Control variables have been added separately to each
equation to analyse its effect on dividend policy and firm performance, then all the control
variables were added together to consider its effect on dividend policy and firm performance.
𝑆𝑡𝑜𝑐𝑘 𝑝𝑟𝑖𝑐𝑒 𝑣𝑜𝑙𝑎𝑡𝑖𝑙𝑖𝑡𝑦 =

Page | 20
𝐶 + 𝑎1 + 𝑎2 + 𝑎3 + 𝑎4 + 𝑎5 + 𝑎6 + 𝑎7 + 𝑒 (4)
𝑇𝑜𝑏𝑖𝑛’𝑠 𝑄 = 𝐶 + 𝑎1 + 𝑎2 + 𝑎3 + 𝑎4 + 𝑎5 + 𝑎6 + 𝑎7 + 𝑒 (5)
𝑅𝑒𝑡𝑢𝑟𝑛 𝑜𝑛 𝑎𝑠𝑠𝑒𝑡𝑠 =
𝐶 + 𝑎1 + 𝑎2 + 𝑎3 + 𝑎4 + 𝑎5 + 𝑎6 + 𝑎7 + 𝑒 (6)
Where,
“a3” represents Debt ratio.
“a4” represents Firm size.
“a5” represent Board directors’ size.
“a6” represents Historical pay-out ratio.
“a7” represents Industry type.
‘’e’’ represent the error.
The analysis of the equations (4), (5) and (6) will represent more accurate understanding
about the relationship between dividend policy and firm performance. The equations above
were applied on the 283 firms and the results discussed the effect of dividend policy on firm’s
performance each year separately, and the variations of the results are analysed later on this
chapter. The regression model has been used to analyse the results. Where,
R squared (R2); will be a measure of the accuracy of the model predictions. It determines how
well the model fits the data. A value of 1 means that the predictions are fully accurate (The
deviations of independent variables are explained). A value of 0 will indicate that the results
are not reliable and the independent variables should be overlooked. R square efficiency has
been questioned when the number of independent variables is high and for not considering
the sampling errors. Since the adjusted R square is covers these issues it has been used in this
model.
T-statistic; will be an indicator for the relationship between the dependent and independent
variable. It is calculated by dividing the coefficient value from the standard error. A high
value of T-statistic indicates a strong correlation between the independent and dependent
variables vice versa. The T-statistic can be statistically significant at 10%, 5% or 1%.
Beta; it is used to as a weight indicator for the independent variables. The independent
variable with the highest beta value is considered the most affective variable on the
dependent.

Page | 21
3.7 Definition of research variables
3.7.1 Debt ratio
Debt ratio is the proportion of debt to equity is calculated by dividing total debt to total
equity, following Al-Najjar & Hussainey, (2009). The figures were directly obtained from
Bloomberg, and firm’s annual reports.
3.7.2 Firm size
Firm size can be measured by total assets, market capitalisation and number of employees. In
this model market capitalisation was used for the preference of using a market value
measurement and following Hussainey at el. (2011). The figures of closing prices and
number of shares outstanding represent the last day of trading at the end of the firm financial
year. The figures were directly obtained from Bloomberg, and firm’s annual reports.
3.7.3 Board of directors’ size
Board sizes represent the number of directors’ in the boards of each firm, following Bathala
& Rao, (1995). The figures were directly obtained from firm’s annual reports and Bloomberg.
3.7.5 Pay-out ratio
The ratio used is the dividend per share divided by earning per share. Following Hussainey et
al (2011). The figures were directly obtained from Bloomberg, and firm’s annual reports.
3.7.6 Industry type
Firms were divided according to their sectors. Following Al-Shabibi and Ramesh (2011).
Bloomberg Industry Classification (BICS) were used which classify the companies into nine
groups; Utilities, Technology, Industrial, Energy, Diversified, Consumer non-cyclical,
Consumer cyclical, Communications and Basic materials.

Page | 22
3.7.7 Dividend yield
Dividend yield is expressed as the dividend per share divided by earning per share. Following
Malkawi & Al-Najjar (2010).The figures were directly obtained from Bloomberg, and firm’s
annual reports.
3.7.8 Share price volatility
It measures the volatility of changes in stock prices. Following Allen and Rachim (1996) and
Hussainey et al (2011). 360 days price volatility measures the daily changes on share prices
over a year. The figures were obtained directly from Bloomberg.
3.7.9 Tobin’s Q
It was recommended by Fama (2001) as the most accurate measure for firm performance.
The following equation was used to calculate Tobin’s Q values;
(MVS + D) / TA. Where: MVS is the market value of shares based on the last trading day at
the end of the financial year to each firm, TA is the firms’ total assets and D is the firm’s total
debt. It is calculated by deducting the accounting value of the firm’s current liabilities form
the accounting value of the firm’s current assets and then adding the accounting value of the
firm’s long term debt. The figures were directly obtained from Bloomberg.
3.7.10 Return on assets
It is calculated by dividing firm’s Net Income from its Total Assets. Following Wolf,
(2003).The figures were directly obtained from Bloomberg and firm’s annual reports.
3.8 Research Hypothesis
Hypothesis One;
H0 (Null Hypothesis): There is a negative relationship between dividend yield and firms’
share price volatility.
H1 (Alternative Hypothesis): There is a positive relationship between dividend yield and
firms’ share price volatility.

Page | 23
Hypothesis Two;
H0 (Null Hypothesis): There is a negative relationship between dividend pay-out ratio and
firms’ share price volatility.
H1 (Alternative Hypothesis): There is a positive relationship between dividend pay-out and
firms’ share price volatility.
Hypothesis Three;
H0 (Null Hypothesis): There is a negative relationship between dividend yield and firms
Tobin Q.
H1 (Alternative Hypothesis): There is a positive relationship between dividend yield and
firms Tobin Q.
Hypothesis Four;
H0 (Null Hypothesis): There is a negative relationship between dividend pay-out ratio and
firms Tobin Q.
H1 (Alternative Hypothesis): There is a positive relationship between dividend pay-out and
firms Tobin Q.
Hypothesis Five;
H0 (Null Hypothesis): There is a negative relationship between dividend yield and firms ROA
H1 (Alternative Hypothesis): There is a positive relationship between dividend yield and
firms ROA
Hypothesis Six;
H0 (Null Hypothesis): There is a negative relationship between dividend pay-out ratio and
firms ROA
H1 (Alternative Hypothesis): There is a positive relationship between dividend pay-out and
firms ROA

Page | 24
Chapter Four
4.0 Introduction
This chapter will describe the summary statistics of the variables used in the model and
analyse the regression results from SPSS software. It shows the changes in the statistical
mean and standard deviation for each variable in every yea followed by the regression and
hypothesis results.
4.1 Data Descriptive Analysis
Chart (1) shows the changes in the Mean and Standard Deviation for debt ratio. It shows that
in 2006 the Mean for debt ratio increased by 16% comparing to 2005, see table (1) in
appendix (1). The debt ratio continued to increase in 2007 before it decreased slightly in 2008
and it increased again in 2009 to its peek before it decreased in 2010. Fosberg (2012) stated
that the increase in debt ratio in firm’s capital structure between 2006 and 2010 was a result
from the financial crisis. He argued that many firm’s used external debt to save them from
bankruptcy.
The Standard Deviation for this sample is considered to be high, which indicate that most of
the firm’s debt ratio are spread around the mean of the index, but it is normal for the debt
ratio variable to have a high standard deviation, since firm’s have different preferences about
the amount of debt in their capital structure.
Chart (1): Debt ratio descriptive analysis
0
100
200
300
400
500
600
DebtRatio 05
DebtRatio 06
DebtRatio 07
DebtRatio 08
DebtRatio 09
DebtRatio 10
Mean
Std. Deviation

Page | 25
Chart (2) shows the changes in the Mean and Standard Deviation for firm's dividend yield.
Between the periods of 2005 to 2010, dividend yield Mean moved in a similar pattern. But it
increased significantly in 2008 by 54% comparing to 2007, see table (2) in appendix (1). In
2008 the financial crisis effect reached the peek and firms preferred to pay dividends rather
than re-investing the retained earnings. In this sample the Standard Deviation is low, which
indicates that firms dividend yield ratio is close to the mean of the index.
Chart (2): Dividend yield descriptive analysis
Chart (3) shows the changes in the Mean and Standard Deviation for firm’s market
capitalisation. The mean shows a 7.2% increase in 2006 comparing to 2005 and a 13.9%
increase in 2007. In 2008 firm’s market capitalisation was affected by the financial crisis and
decreased by 20%, see table (3) in appendix (1). Fosberg (2012) related this reduction to
firm’s strategy in facing the crisis by increasing their debts and decreasing the amount of
shares outstanding. Standard Deviation figures are relatively high but stable. Which indicate
that firms’ market capitalisation vary between companies and it is spread around the index
mean.
0
0.5
1
1.5
2
2.5
3
3.5
4
4.5
5
DividendYield 05
DividendYield 06
DividendYield 07
DividendYield 08
DividendYield 09
DividendYield 10
Mean
Std. Deviation
Page | 26
Chart (3): Market Capitalisation descriptive analysis
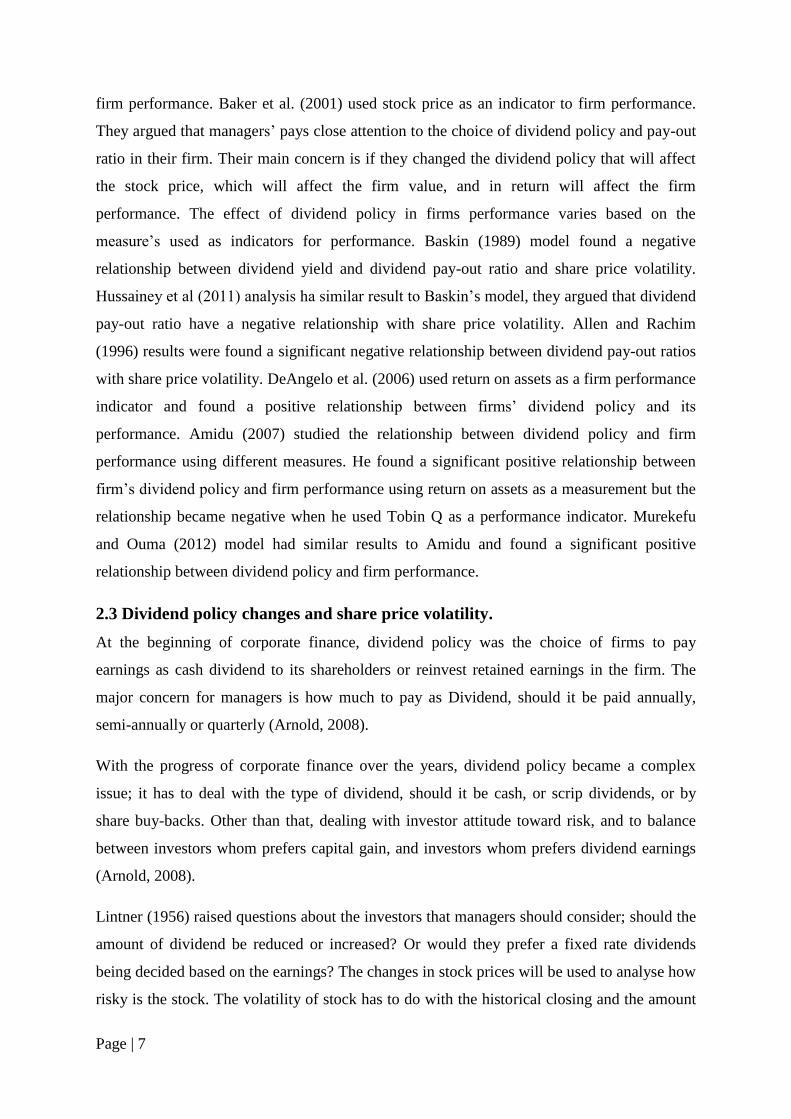
Chart (4) shows the changes in the Mean and Standard Deviation for firm’s Return on Assets.
The table shows an increase in the Mean for ROA between 2006 and 2007. In 2008 and 2009
the effect of financial crisis decreased firm’s ROA before it recovers and increased again in
2010. The standard deviation for the period is considered to be low and stable, which
indicates that firm’s ROA are close to the industry mean and the decrease in the mean during
the financial crisis affected the entire firms. See table (4) in appendix (1).
Chart (4): Return on assets descriptive analysis
0
2000
4000
6000
8000
10000
12000
14000
16000
MarketCap. 05
MarketCap. 06
MarketCap. 07
MarketCap. 08
MarketCap. 09
MarketCap. 10
Mean
Std. Deviation
0
2
4
6
8
10
12
ROA 05 ROA 06 ROA 07 ROA 08 ROA 09 ROA 10
Mean
Std. Deviation
Page | 27
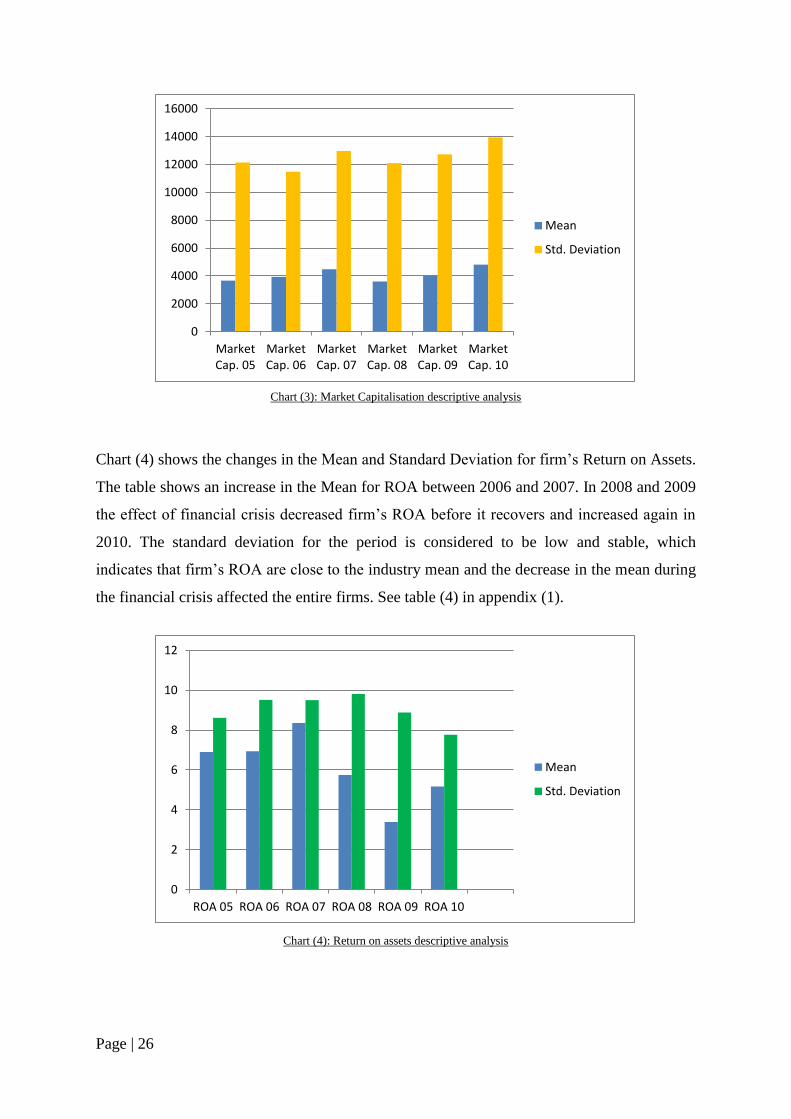
Chart (5) shows the changes in the Mean and Standard Deviation for firm’s Tobin Q’s. It
shows that the Mean of firm’s performance increased by 8% in 2006 but it was affected by
the financial crisis in 2007 to 2009 and had significantly decreased before it recovers in 2010.
The Standard Deviation for Tobin Q’s was low in that period as well and was affected by the
changes in the Mean, which indicates that firm’s performance was strongly affected by the
financial crisis. See table (5) in appendix (1).
Chart (5): Tobin Q’s descriptive analysis
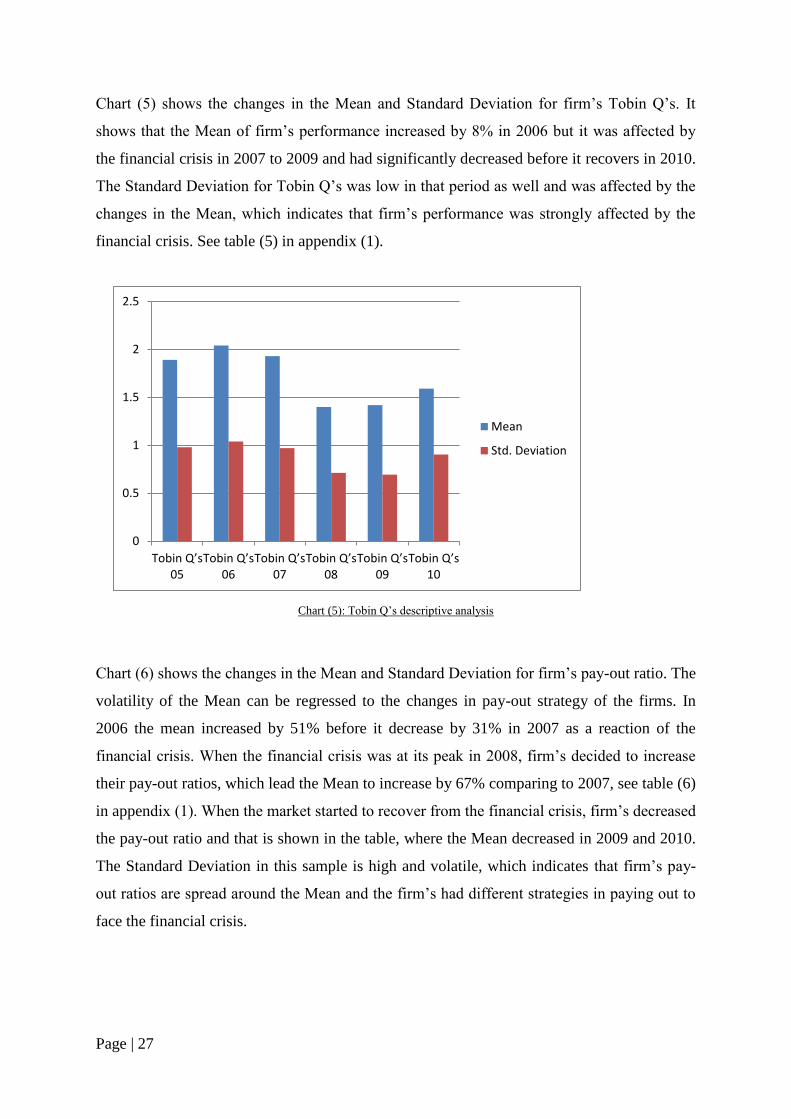
Chart (6) shows the changes in the Mean and Standard Deviation for firm’s pay-out ratio. The
volatility of the Mean can be regressed to the changes in pay-out strategy of the firms. In
2006 the mean increased by 51% before it decrease by 31% in 2007 as a reaction of the
financial crisis. When the financial crisis was at its peak in 2008, firm’s decided to increase
their pay-out ratios, which lead the Mean to increase by 67% comparing to 2007, see table (6)
in appendix (1). When the market started to recover from the financial crisis, firm’s decreased
the pay-out ratio and that is shown in the table, where the Mean decreased in 2009 and 2010.
The Standard Deviation in this sample is high and volatile, which indicates that firm’s pay-
out ratios are spread around the Mean and the firm’s had different strategies in paying out to
face the financial crisis.
0
0.5
1
1.5
2
2.5
Tobin Q’s 05
Tobin Q’s 06
Tobin Q’s 07
Tobin Q’s 08
Tobin Q’s 09
Tobin Q’s 10
Mean
Std. Deviation

Page | 28
Chart (6): Pay-out ratio descriptive analysis
Chart (7) shows the changes in the Mean and Standard Deviation for the stocks volatility.
The changes in the Mean were stable in 2005 to 2007 until it had a significant increase by
55% in 2008 and 25% in 2009 due to the financial crisis, before it decline in 2010 by 29%,
see table (7) in appendix (1). The Standard Deviation in this sample considered to be low in
the first three years before it increases by 79% in 2008 and 25% in 2009 due to the effect of
financial crisis on the stock prices, which lead them to be diffused around the mean.
Chart (7): 360 days share price volatility
0
100
200
300
400
500
600
700
800
Pay-OutRatio 05
Pay-OutRatio 06
Pay-OutRatio 07
Pay-OutRatio 08
Pay-OutRatio 09
Pay-OutRatio 10
Mean
Std. Deviation
0
10
20
30
40
50
60
70
Volatility05
Volatility06
Volatility07
Volatility08
Volatility09
Volatility10
Mean
Std. Deviation

Page | 29
4.2 Regression results
This part will analyse the regression results for the six equations to test the hypothesis
mentioned in chapter 3. If the t-static values are positive, the hypothesis will remain as
specified. But if the t-statistic values are negative the null hypothesis (N0) will be rejected
and the alternative hypothesis (N1) will be accepted. Tables 1-18 show the output of the
linear regression which was run using SPSS software.
Table (1) shows the result of the first equation. Figures are obtained from appendix (2). It
indicates that dividend yield have a significant negative relationship with share price
volatility before and after the financial credit crises. This is consistent with Baskin (1989) and
inconsistent with Hussainey et al. (2011) findings. Including the crisis period in this model
could be the reason for the inconsistent in the model results with Hussainey et al. findings.
On the other hand Pay-out ratio had no significant relationship with share price volatility
between 2005 and 2007. But between 2008 and 2010 and on an average between 2005 to
2010 it shows that pay-out ratio have a negative relationship with share price volatility. This
is inconsistent with Hussainey et al. (2011). Including the crisis period in this model could be
the reason for the inconsistent in the model results with Hussainey et al. findings.
Beta figures shows that the negative effect of dividend yield is higher than the positive effect
of pay-out ratio on share price volatility. Adjusted R square shows that dividend yield and
pay-out ratio effect had declined by about 40%.On average between 2005 and 2010, dividend
yield and pay-out ratio affected share price volatility by about 7%.
Beta t-statistic Sig.
Dividend Yield Avg. 05-07 -0.391 -6.853 0
Pay-Out Ratio Avg. 05-07 0.023 0.379 0.692
Dividend Yield Avg. 08-10 -0.135 -2.154 0.032
Pay-Out Ratio Avg. 08-10 -0.086 -1.379 0.169
Dividend Yield Avg. 05-10 -0.232 -3.789 0
Pay-Out Ratio Avg. 05-10 0.088 -1.432 0.153
2005-2007 2008-2010 2005-2010
Adjusted R Square 0.0413 0.026 0.069
Table 1: The association between share price volatility, dividend yield and pay-out ratio.

Page | 30
Table (2) shows the results of the second equation. Figures are obtained from appendix (3). It
shows that dividend yield have a significant negative relationship with Tobin Q prior and
after the crisis and in the long-term. Pay-out ratios have a positive relationship with Tobin
Q’s in the short term (before and after the crisis) and a significant positive relationship with
Tobin Q’s at 10% in the long term between 2005 and 2010. This is contrary to Amidu (2007)
model findings that suggested a negative relationship between firms’ dividend policy and its
Tobin Q ratio. Amidu findings were based on the Ghana market, which is considered an
emerging market comparing to the UK and this could be an explanation of the differences in
the findings.
Beta figures shows that the negative effect of dividend yield is higher than the positive effect
of pay-out ratio on share price volatility. Adjusted R shows that pay-out ratio and dividend
yield effect on Tobin Q values increased by 1% after the financial crisis. On average between
2005 and 2010, dividend yield and pay-out ratio affected ROA by about 6%.
Beta t-statistic Sig.
Dividend Yield Avg. 05-07 -0.223 -3.69 0
Pay-Out Ratio Avg. 05-07 0.041 0.67 0.503
Dividend Yield Avg. 08-10 -0.252 -4.071 0
Pay-Out Ratio Avg. 08-10 0.053 0.853 0.395
Dividend Yield Avg. 05-10 -0.266 -4.323 0
Pay-Out Ratio Avg. 05-10 0.1 1.622 0.106
2005-2007 2008-2010 2005-2010
Adjusted R Square 0.04 0.05 0.056
Table 2: The association between Tobin Q’s, dividend yield and dividend pay-out ratio.
Table (3) shows the results of the third equation. Figures are obtained from appendix (4). It
indicates that dividend yield had a significant positive relationship with ROA in the short
term and insignificant positive relationship in the long term. On the other hand pay-out ratio
had a non-significant relationship with ROA before the crisis, after the crisis the relationship
became insignificantly negative. But in the long term it has an insignificant positive
relationship with ROA. This is consistent with DeAngelo et al. (2006) and Amidu (2007)
findings.

Page | 31
Beta values show that dividend yield had more effect on ROA than pay-out ratio. Adjusted R
figures show that dividend yield and pay-out ratio effect on ROA declined by more than 50%.
On average between 2005 and 2010 dividend yield and pay-out ratio affected ROA by 1%.
Beta t-statistic Sig.
Dividend Yield Avg. 05-07 0.151 2.47 0.014
Pay-Out Ratio Avg. 05-07 0.005 -0.083 0.934
Dividend Yield Avg. 08-10 0.126 1.99 0.048
Pay-Out Ratio Avg. 08-10 -0.036 -0.571 0.569
Dividend Yield Avg. 05-10 0.101 1.59 0.113
Pay-Out Ratio Avg. 05-10 0.049 0.775 0.439
2005-2007 2008-2010 2005-2010
Adjusted R Square 0.015 0.007 0.009
Table 3: The association between ROA, dividend yield and dividend pay-out ratio.
Table (4) shows the results for the first equation after adding the debt ratio as control variable
and holding others constant. Figures are obtained from appendix (5). Dividend yield results
were not affected by debt ratio and continue to shows a significant negative relationship with
share price volatility.
Pay-out ratio results were affected by debt ratio only before the crisis and show a positive
relationship with share price volatility after it was non-significant. But there was no effect of
debt ratio on the results after the crisis and in the long term, it continues to show a negative
relationship with share price volatility after the financial crisis and on an average between
2005 and 2010.
The control variable debt ratio had more effect on share price volatility before the financial
crisis with a negative relationship, after the financial crisis debt ratio appears to have a non-
significant relationship with price volatility. In the long term, debt ratio has an insignificant
negative relationship with price volatility.
Beta values shows that all the variables have negative effect on share price volatility, the
strongest effect is from dividend yield, then pay-out ratio and then debt ratio. Adjusted R
shows that the effect of the variables on price volatility decreased after the financial crisis by
more than 100%. On average the variables influenced price volatility between 2005 and 2010
by about 7%.

Page | 32
Beta t-statistic Sig.
Dividend Yield Avg. 05-07 -0.392 -6.811 0
Pay-Out Ratio Avg. 05-07 0.062 0.896 0.371
Debt Ratio Avg. 05-07 -0.06 -1.031 0.303
Dividend Yield Avg. 08-10 -0.141 -2.218 0.027
Pay-Out Ratio Avg. 08-10 -0.084 -1.324 0.187
Debt Ratio Avg. 08-10 0.005 0.078 0.938
Dividend Yield Avg. 05-10 -0.229 -3.722 0
Pay-Out Ratio Avg. 05-10 -0.083 -1.353 0.177
Debt Ratio Avg. 05-10 -0.05 -0.854 0.394
2005-2007 2008-2010 2005-2010
Adjusted R Square 0.142 0.024 0.068
Table 4: The association between share price volatility, dividend yield, pay-out ratio and debt ratio.
Table (5) shows the results for the second equation after adding the debt ratio as control
variable holding others constant. Figures are obtained from appendix (6). Dividend yield
results did not vary after adding debt ratio and shows a significant negative relationship with
Tobin Q.
On the other hand pay-out ratio results before the crisis and in the long term were affected by
debt ratio, it shows a non-significant relationship with Tobin Q before the crisis while it
showed an insignificant positive relationship in table (2) and the relationship in the long term
became insignificant though it was significant. After the crisis pay-out ratio continues to
show a positive insignificant relationship with Tobin Q.
Debt ratio had a positive significant relationship with Tobin Q at 10% after the financial
crisis and in the long term, debt ratio seems to have an insignificant positive relationship with
Tobin Q.
Beta figures shows that prior to the credit crisis debt ratio had the biggest impact on the
Tobin Q, but after the financial crisis and in the long term, pay-out ratio have the biggest
impact on Tobin Q then debt ratio and then dividend yield. Adjusted R shows that the
independent variables used affected the Tobin Q’by about 6%.
Beta t-statistic Sig.
Dividend Yield Avg. 05-07 -0.221 -3.647 0

Page | 33
Pay-Out Ratio Avg. 05-07 -0.033 -0.45 0.653
Debt Ratio Avg. 05-07 0.129 1.826 0.069
Dividend Yield Avg. 08-10 -0.262 -4.188 0
Pay-Out Ratio Avg. 08-10 0.061 0.98 0.328
Debt Ratio Avg. 08-10 0.011 0.18 0.857
Dividend Yield Avg. 05-10 -0.27 -4.37 0
Pay-Out Ratio Avg. 05-10 0.094 1.515 0.131
Debt Ratio Avg. 05-10 0.058 0.991 0.322
2005-2007 2008-2010 2005-2010
Adjusted R Square 0.049 0.051 0.056
Table 5: The association between Tobin Q’s, dividend yield, pay-out ratio and debt ratio.
Table (6) shows the results for the third equation after adding debt ratio as control variable
holding others constant. Figures are obtained from appendix (7). Dividend yield results were
not affected by the control variable, it shows that in the short-term dividend yield has a
positive significant relationship with ROA and in the long-run the relationship is positive but
insignificant.
Pay-out ratio figures show that it was affected by debt ratio variable prior the crisis. After
showing a non-significant relationship with ROA, the relationship between pay-out ratio and
ROA became negative before the crisis when adding debt ratio as a control variable. The
relationship after the crisis and in the long-term did not vary, it continues to show a negative
relationship between 2008-2010 and a positive relationship in the long-term.
Debt ratio figures show a significant positive relationship with ROA at 5%, but after the
financial crisis the relationship became insignificantly negative. In the long term debt ratio
have a non-significant relationship with ROA.
Beta shows that in the long run dividend yield has the biggest impact on ROA then pay-out
ratio and then debt ratio. Adjusted R shows that in the short term the variables impact on
ROA before financial crisis was greater than after it. In the long term the variables impacted
the ROA by 6%.
Beta t-statistic Sig.
Dividend Yield Avg. 05-07 0.152 2.478 0.014
Pay-Out Ratio Avg. 05-07 -0.084 -1.139 0.256

Page | 34
Debt Ratio Avg. 05-07 1.37 1.902 0.058
Dividend Yield Avg. 08-10 0.117 1.819 0.07
Pay-Out Ratio Avg. 08-10 -0.035 -0.539 0.59
Debt Ratio Avg. 08-10 -0.044 -7.32 0.464
Dividend Yield Avg. 05-10 0.099 1.561 0.12
Pay-Out Ratio Avg. 05-10 0.047 0.734 0.463
Debt Ratio Avg. 05-10 0.021 0.355 0.723
2005-2007 2008-2010 2005-2010
Adjusted R Square 0.024 0.002 0.006
Table 6: The association between ROA, dividend yield, pay-out ratio and debt ratio
Table (7) shows the results of the first equation after adding the board directors’ size as
control variable and holding others constant. Figures are obtained from appendix (8).
Dividend yield results were not affected by the control variable and continue to shows the
negative significant relationship with share price volatility.
Pay-out ratio results did not vary before the crisis, it shows a non-significant relationship with
share price volatility. After the financial crisis and in the long term the results were affected
by the board size, it shows that the relationship between pay-out ratio and share price
volatility became significantly negative.
Board size results show a significant negative relationship with share price volatility before
and after the financial crisis and in the long term.
Beta figures show that all the variables affected negatively, Board size had the highest effect
with -0.26, then dividend yield with -0.25 and then pay-out ratio with -0.12. Adjusted R
shows that after the financial crisis, the variables effect declined by 46%. In the long term the
variables impact on share price volatility is about 15%.
Beta t-statistic Sig.
Dividend Yield Avg. 05-07 -0.387 -6.594 0
Pay-Out Ratio Avg. 05-07 0.009 0.156 0.876
Board Avg. size 05-07 -0.198 -3.455 0.001
Dividend Yield Avg. 08-10 -0.16 -2.53 0.012
Pay-Out Ratio Avg. 08-10 -0.153 -2.426 0.016
Board Avg. size 08-10 -0.219 -3.693 0
Dividend Yield Avg. 05-10 -0.25 -4.119 0

Page | 35
Pay-Out Ratio Avg. 05-10 -0.12 -1.967 0.05
Board Avg. size 05-10 -0.257 -4.461 0
2005-2007 2008-2010 2005-2010
Adjusted R Square 0.181 0.098 0.145
Table 7: The association between share price volatility, dividend yield, pay-out ratio and board size.
Table (8) shows the results of the second equation after adding the board directors’ size as
control variable and holding others constant. Figures are obtained from appendix (9).
Dividend yield results continue to show the significant negative relationship with Tobin Q’s
in the short and long term.
Pay-out ratio results were not affected by the control variable as well. It shows an
insignificant positive relationship with Tobin Q’s before and after the crisis and a
significantly positive relationship in the long term.
Board size had a negative relationship with Tobin Q’s before the credit crisis. But the
relationship became non-significant after the crisis and in the long term.
Beta figures shows that in the long term Tobin Q’s get affected by dividend yield more than
the other variables. Before the credit crisis, board size had a bigger impact on Tobin Q’s than
pay-out ratio, but after the crisis and in the long-term the results shows that pay-out ratio
effect is more than the board of directors’ size. Adjusted R figures shows that in the long term
the dividend yield, pay-out ratio and board size influence Tobin Q’s by about 6%.
Beta t-statistic Sig.
Dividend Yield Avg. 05-07 -0.235 -3.688 0
Pay-Out Ratio Avg. 05-07 0.03 0.465 0.642
Board Avg. size 05-07 -0.16 -2.59 0.796
Dividend Yield Avg. 08-10 -0.249 -3.949 0
Pay-Out Ratio Avg. 08-10 0.063 0.99 0.323
Board Avg. size 08-10 0.004 0.06 0.953
Dividend Yield Avg. 05-10 -0.275 -4.312 0
Pay-Out Ratio Avg. 05-10 0.104 1.626 0.105
Board Avg. size 05-10 -0.002 -0.036 0.971
2005-2007 2008-2010 2005-2010
Adjusted R Square 0.042 0.047 0.057
Table 8: The association between Tobin Q’s, dividend yield, pay-out ratio and board size

Page | 36
Table (9) shows the results of the third equation after adding the board directors’ size as
control variable and holding others constant. Figures are obtained from appendix (10).
The results show that dividend yield were not affected by the control variable prior the crisis
and in the long term, it continues to show a significant positive relationship with ROA prior
the crisis and insignificant positive relationship in the long term. After the crisis the result
was affected by the control variable and became insignificantly positive after it was
significant.
Pay-out ratios continue to show a non-significant relationship with ROA before the financial
crisis and an insignificant positive relationship in the long-term. But the results after the crisis
became non-significantly after it was insignificantly negative.
Board sizes have an insignificant positive relationship with ROA in the short and long term.
Adjusted R shows that the variables effect on ROA decreased by about 80%. In the long run
the variables have a 0.6% impact on ROA.
Beta t-statistic Sig.
Dividend Yield Avg. 05-07 0.123 1.906 0.058
Pay-Out Ratio Avg. 05-07 0.001 0.01 0.992
Board Avg. size 05-07 0.073 1.16 0.247
Dividend Yield Avg. 08-10 0.104 1.57 0.118
Pay-Out Ratio Avg. 08-10 0.011 0.163 0.87
Board Avg. size 08-10 0.046 0.734 0.463
Dividend Yield Avg. 05-10 0.007 1.173 0.242
Pay-Out Ratio Avg. 05-10 0.062 0.942 0.347
Board Avg. size 05-10 0.074 1.183 0.238
2005-2007 2008-2010 2005-2010
Adjusted R Square 0.009 0.002 0.006
Table 9: The association between ROA, dividend yield, pay-out ratio and board size
Table (10) shows the results of the first equation after adding the market capitalisation as
control variable and holding others constant. Figures are obtained from appendix (11).
Dividend yield figures show the constant significant negative relationship with share price
volatility.

Page | 37
Pay-out ratio figures did not vary from the previous results as well. It shows the non-
significant relationship before the financial crisis and insignificant negative relationship after
the crisis and in the long term.
Market capitalisation as expected have a significant negative relationship with price volatility
in the short and long term. Beta figures shows that in the long term market capitalisation have
the biggest effect on share price volatility with (-2), then dividend yield with (-0.224) and
then pay-out ratio with (-0.096). Adjusted R shows that the variables effect on share price
volatility declined by 71% from 0.174 to 0.05. In the long term the variables affected price
volatility by about 11%.
Beta t-statistic Sig.
Dividend Yield Avg. 05-07 -0.38 -6.78 0
Pay-Out Ratio Avg. 05-07 0.013 0.24 0.811
Market Avg. Cap 05-07 -0.183 -3.375 0.001
Dividend Yield Avg. 08-10 -0.128 -2.076 0.039
Pay-Out Ratio Avg. 08-10 -0.09 -1.458 0.146
Market Avg. Cap 08-10 -0.163 -2.794 0.006
Dividend Yield Avg. 05-10 -0.224 -3.732 0
Pay-Out Ratio Avg. 05-10 -0.096 -1.607 0.11
Market Avg. Cap 05-10 -2 -3.551 0
2005-2007 2008-2010 2005-2010
Adjusted R Square 0.174 0.05 0.106
Table 10: The association between share price volatility, dividend yield, pay-out ratio and market cap.
Table (11) shows the results of the second equation after adding the market capitalisation as
control variable and holding others constant. Figures are obtained from appendix (12).
Dividend yield results were not affected by the control variable and continue to shows a
significant negative relationship with Tobin Q’s in short and long term.
Pay-out ratio results did not vary as well. It shows the insignificant positive relationship in
the short term with Tobin Q’s and a significant positive relationship in the long term.
Market capitalisation figures shows an in significant positive relationship with Tobin Q’s
before the financial crisis and a positive significant relationship after the crisis and in the long
term.

Page | 38
Beta figures shows that Dividend yield have the strongest effect on Tobin Q’s with (-0.27)
then pay-out ratio with (0.104) then market capitalisation with (0.099). Adjusted R shows that
the variables affect Tobin Q’s by 6.2% in the long term.
Table 11: The association between Tobin Q’s, dividend yield, pay-out ratio and market cap.
Table (12) shows the results of the third equation after adding the market capitalisation as
control variable and holding others constant. Figures are obtained from appendix (13).
Dividend yield results did not vary, it shows the significant positive relationship with ROA in
the short term and insignificant positive relationship in the long term.
Pay-out ratio results were not affected by the control variable as well and continue to shows a
non-significant relationship with ROA before the credit crisis, which became negatively
insignificant after the crisis and in the long term, pay-out ratios have insignificant positive
relationship with ROA.
Market capitalisation figures show the significant positive relationship with ROA in the short
and long term.
Beta figures in the long term shows that market capitalisation have the biggest impact on
ROA with (0.162) then dividend yield with (0.094) and then pay-out ratio with (0.056).
Adjusted R in the long term shows that the independent variables affect ROA by 3.2%.
Beta t-statistic Sig.
Dividend Yield Avg. 05-07 0.144 2.36 0.019
Beta t-statistic Sig.
Dividend Yield Avg. 05-07 -0.229 -3.783 0
Pay-Out Ratio Avg. 05-07 0.045 0.747 0.456
Market Avg. Cap 05-07 0.92 1.564 0.119
Dividend Yield Avg. 08-10 -0.256 -4.16 0
Pay-Out Ratio Avg. 08-10 0.055 0.9 0.369
Market Avg. Cap 08-10 0.113 1.95 0.052
Dividend Yield Avg. 05-10 -0.27 -4.398 0
Pay-Out Ratio Avg. 05-10 0.104 1.697 0.091
Market Avg. Cap 05-10 0.099 1.71 0.088
2005-2007 2008-2010 2005-2010
Adjusted R Square 0.045 0.06 0.062

Page | 39
Pay-Out Ratio Avg. 05-07 0.001 0.02 0.984
Market Avg. Cap 05-07 0.126 2.136 0.034
Dividend Yield Avg. 08-10 0.121 1.916 0.056
Pay-Out Ratio Avg. 08-10 -0.033 -5.21 0.603
Market Avg. Cap 08-10 0.142 2.403 0.017
Dividend Yield Avg. 05-10 0.094 1.503 0.134
Pay-Out Ratio Avg. 05-10 0.056 0.899 0.37
Market Avg. Cap 05-10 0.162 2.764 0.006
2005-2007 2008-2010 2005-2010
Adjusted R Square 0.028 0.024 0.032
Table 12: The association between ROA, dividend yield, pay-out ratio and market cap
Table (13) shows the results for the first equation after adding the industry type as a control
variable and holding others constant. Figures are obtained from appendix (14).
Dividend yield figures were affected by the control variable, it continues to show a
significant negative relationship with share price volatility before the credit crisis, but after
the crisis and in the long term it shows an insignificant negative relationship with share price
volatility, while it was significant in table (1).
Pay-out ratio figures were affected as well by the control variable. It continues to show the
non-significant relationship with share price volatility before the financial crisis, but after the
crisis and in the long term the relationship became significantly negative, while it was
insignificant.
Industry type shows figures show an insignificant negative relationship with share price
volatility prior the crisis and a significant negative relationship after the crisis and in the long
term.
Beta results show that dividend yield and industry type effect on share price decreased by
75%, 35% respectively, pay-out ratio effect increased by 500%. In the long term pay-out ratio
have the strongest effect on share price volatility, then industry type and then dividend yield.
Adjusted R square shows that in the long term the independent variables impacted share price
volatility by 9.2%.
Beta t-statistic Sig.
Dividend Yield Avg. 05-07 -0.393 -6.867 0
Pay-Out Ratio Avg. 05-07 0.024 0.416 0.678

Page | 40
Industry type 05-07 -0.32 -0.569 0.57
Dividend Yield Avg. 08-10 -0.101 -1.64 1.02
Pay-Out Ratio Avg. 08-10 -0.115 -1.878 0.062
Industry type 08-10 -0.209 -3.606 0
Dividend Yield Avg. 05-10 -0.093 -1.537 0.125
Pay-Out Ratio Avg. 05-10 -0.223 -3.683 0
Industry type 05-10 -0.162 -2.844 0.005
2005-2007 2008-2010 2005-2010
Adjusted R Square 0.141 0.067 0.092
Table 13: The association between share price volatility, dividend yield, pay-out ratio and Industry type.
Table (14) shows the results of the second equation after adding industry type as control
variable and holding others constant. Figures are obtained from appendix (15).
Dividend yield and pay-out ratio results were not affected by the control variable. Dividend
yield continues to show its significant negative relationship in the short and long term with
Tobin Q.
Pay-out ratio remains to have an insignificant positive relationship with Tobin Q in the short
term and a significant positive relationship in the long term.
Industry type results show an insignificant positive relationship with Tobin Q before the
crisis, after the crisis the relationship became non-significant and positively insignificant in
the long-term.
Beta figures show that in the long term dividend yield has the strongest effect on Tobin Q,
then pay-out ratio and then industry type. Adjusted R square shows that the independent
variables affect the Tobin Q’s by about 6% in the long term.
Beta t-statistic Sig.
Dividend Yield Avg. 05-07 -0.219 -3.616 0
Pay-Out Ratio Avg. 05-07 0.038 0.624 0.533
Industry type 05-07 0.077 1.311 0.191
Dividend Yield Avg. 08-10 -0.254 -4.087 0
Pay-Out Ratio Avg. 08-10 0.054 0.878 0.381
Industry type 08-10 0.025 0.433 0.665
Dividend Yield Avg. 05-10 -0.271 -4.389 0

Page | 41
Pay-Out Ratio Avg. 05-10 0.102 1.663 0.097
Industry type 05-10 0.074 1.284 0.2
2005-2007 2008-2010 2005-2010
Adjusted R Square 0.043 0.048 0.058
Table 14: The association between Tobin Q’s, dividend yield, pay-out ratio and Industry type.
Table (15) shows the results of the third equation after adding industry type as control
variable and holding others constant. Figures are obtained from appendix (16).
Dividend yield results were not affected by the industry type; it shows a significant positive
relationship with ROA in the short term and an insignificant positive relationship in the long
term.
Pay-out ratio results were only affected after the crisis. It continues to show a non-significant
relationship with ROA before the crisis and an insignificant positive relationship in the long
term. After the crisis the relationship became non-significant after it was negative before
adding the control variable.
Industry type results show a non-significant relationship with Tobin Q’s before the crisis and
an insignificant positive relationship after the crisis and in the long term.
Betas figures show that dividend yield have the strongest effect on ROA, then pay-out ratio
and then industry type. Adjusted R shows that in the long term the independent variables
affected ROA by 0.7%.
Beta t-statistic Sig.
Dividend Yield Avg. 05-07 0.15 2.443 0.015
Pay-Out Ratio Avg. 05-07 -0.004 -0.07 0.944
Industry type 05-07 -0.021 -0.348 0.728
Dividend Yield Avg. 08-10 0.116 1.83 0.068
Pay-Out Ratio Avg. 08-10 -0.029 -0.455 0.65
Industry type 08-10 0.095 1.589 0.113
Dividend Yield Avg. 05-10 0.098 1.546 0.123
Pay-Out Ratio Avg. 05-10 0.05 0.794 0.428
Industry type 05-10 0.034 0.578 0.564
2005-2007 2008-2010 2005-2010
Adjusted R Square 0.012 0.012 0.007

Page | 42
Table 15: The association between ROA, dividend yield, pay-out ratio and industry type.
Table (16) shows the result of the fourth equation. Figures are obtained from appendix (17).
It shows that the effect of the independent variables varied after the financial crisis.
After adding all the control variables dividend yield continued to show a significant negative
relationship with share price volatility, which lead to accept the null hypothesis (H0) from
hypothesis one and rejecting the alternative hypothesis (H1). This is consistent with Baskin
(1989) findings.
Dividend pay-out ratio results varied after adding all the control variables to the equation.
Before the crisis it continued to show a non-significant relationship with price volatility, but
while it showed an insignificant negative relationship after the crisis and in the long-term, the
relationship became significantly negative. For that the null hypothesis (H0) from the second
hypothesis were accepted and the alternative hypothesis (H1) were rejected. This is consistent
with Bakin (1989), Allen and Rachim (1996) and Hussainey et al. (2011) findings.
On the other hand the control variables had different effects on share price volatility. Industry
type showed an insignificant negative relationship with share price volatility before the crisis
and a significant negative relationship after the crisis and in the long term. This is
inconsistent to Hussainey et al. (2011) findings, which suggested a non-significant
relationship between industry type and price volatility. Hussainey et al. (2011) model
classified companies to two groups, services and industrial, while in this model nine groups
were used to classify the companies and that might resulted the differences in findings.
Board size results showed a significant negative relationship with share price volatility at
10% before the crisis and 1% after the crisis and in the long term. This is consistent with
Barnhart and Rosenstein (1998) findings. Market capitalisation results showed a significant
negative relationship with share price volatility at 10% before the crisis and in the long term.
But after the crisis the relationship were negatively insignificant. This is consistent with
Hussainey et al. (2011) findings.
Beta figures shows that the effect of dividend yield, board size and debt ratio decreased after
the crisis and the effect of pay-out ratio, industry type and board of directors’ size increased
after the crisis. In the long term dividend yield have the highest effect on price volatility with
(-0.235), then board size with (-0.218), then industry type with (-0.209), then pay-out ratio
with (-0.125), then market capitalisation with (-0.11) and then debt ratio with (-0.021).

Page | 43
Adjusted R square figures show that the independent variables affect price volatility by about
19% in the long term.
Beta t-statistic Sig.
Dividend Yield Avg. 05-07 -0.382 -6.452 0
Pay-Out Ratio Avg. 05-07 0.027 0.369 0.712
Industry type 05-07 -0.072 -1.24 0.216
Board Avg. size 05-07 -0.129 -1.859 0.064
Market Cap. Avg. 05-07 -0.128 -1.863 0.064
Debt Ratio Avg. 05-07 -0.03 -0.427 0.67
Dividend Yield Avg. 08-10 -0.145 -2.314 0.021
Pay-Out Ratio Avg. 08-10 -0.16 -2.59 0.01
Industry type 08-10 -0.246 -4.211 0
Board Avg. size 08-10 -0.182 -2.677 0.008
Market Cap. Avg. 08-10 -0.098 -1.453 0.148
Debt Ratio Avg. 08-10 0.007 0.111 0.912
Dividend Yield Avg. 05-10 -0.235 -3.933 0
Pay-Out Ratio Avg. 05-10 -0.125 -2.077 0.039
Industry type 05-10 -0.209 -3.685 0
Board Avg. size 05-10 -0.218 -3.202 0.002
Market Cap. Avg. 05-10 -0.11 -1.641 0.102
Debt Ratio Avg. 08510 -0.021 -0.369 0.713
2005-2007 2008-2010 2005-2010
Adjusted R Square 0.183 0.152 0.186
Table 16: The association between share price volatility, dividend yield, pay-out ratio, Industry type, board size, market cap.
And debt ratio.
Table (17) shows the result of the fifth equation. Figures are obtained from appendix (18).
Dividend yield results were not affected by the control variables and shows a significant
negative relationship with Tobin Q’s in short and long term. For that the null hypothesis (H0)
from the third hypothesis is accepted and the alternative hypothesis (H1) is rejected. This is
consistent with Gordon growth model (Damodaran, 2002).
Pay-out ratio results were affected by the control variables. It shows a non-significant
relationship with Tobin Q before the crisis, while it showed a positive relation in table (2).

Page | 44
After the crisis and in the long term the relationship became positive. For that we accept the
alternative hypothesis (H1) from the fourth hypothesis and we reject the null hypothesis (H0).
This is consistent with Murekefu and Ouma (2012) findings.
The control variables result shows a positive relationship between industry type and Tobin Q.
On the other hand board of directors’ size have a negative relationship with Tobin Q. This is
consistent with Guest (2009) results. Market capitalisation results showed a significant
positive relationship with Tobin Q. Debt ratio had a significant positive relationship with
Tobin Q before the crisis, non-significant relationship after the crisis and an insignificant
positive relationship with Tobin Q in the long-term. This is consistent with Saeedi and
Mahmoodi (2011) findings.
Beta figures shows that the independent variables effect on Tobin Q’s did not vary after the
financial crisis, expect the debt ratio effect which declined by 80% after the crisis. In the long
term dividend yield have the strongest effect on Tobin Q’s with (-0.29), then market
capitalisation with (0.145), then pay-out ratio with (0.098), then board of directors’ size with
(-0.084), then industry type with (0.08) and then debt ratio with (0.076). Adjusted R square
figures shows that in the long term, the independent variables affect Tobin Q’s by 7%.
Beta t-statistic Sig.
Dividend Yield Avg. 05-07 -0.238 -3.747 0
Pay-Out Ratio Avg. 05-07 -0.053 -0.689 0.491
Industry type 05-07 0.071 1.14 0.256
Board Avg. size 05-07 -0.105 -1.404 0.162
Market Cap. Avg. 05-07 0.145 1.968 0.05
Debt Ratio Avg. 05-07 0.145 1.918 0.056
Dividend Yield Avg. 08-10 -0.29 -4.408 0
Pay-Out Ratio Avg. 08-10 0.089 1.366 0.173
Industry type 08-10 0.048 0.777 0.438
Board Avg. size 08-10 -0.063 -0.878 0.381
Market Cap. Avg. 08-10 0.148 2.082 0.038
Debt Ratio Avg. 08-10 0.028 0.456 0.649
Dividend Yield Avg. 05-10 -0.29 -4.55 0
Pay-Out Ratio Avg. 05-10 0.098 1.522 0.129
Industry type 05-10 0.08 1.313 0.191

Page | 45
Board Avg. size 05-10 -0.084 -1.151 0.251
Market Cap. Avg. 05-10 0.145 20.024 0.044
Debt Ratio Avg. 08510 0.076 1.217 0.225
2005-2007 2008-2010 2005-2010
Adjusted R Square 0.063 0.062 0.07
Table 17: The association between Tobin Q’s, dividend yield, pay-out ratio, Industry type, board size, market capitalisation and
debt ratio.
Table (18) shows the results of the sixth equation. Figures are obtained from appendix (19).
Dividend yield results continue to shows a significant positive relationship before the crisis
and an insignificant positive relationship in the long-term. A0fter crisis results were affected
by the control variables, it shows a non-significant relationship with ROA, while it showed a
significant positive relationship in table (3). For that the alternative hypothesis (H1) from
hypothesis five is accepted and the null hypothesis (H0) is rejected. This is consistent with
Amidu (2007).
On the other hand pay-out ratio results were affected by the control variable in the short term,
while it showed a non-significant relation with ROA before the crisis, the relationship
became positive after adding the control variables. After the crisis the relationship became
non-significant after it was negative before. In the long term the results did not vary and it
continues to show a positive relationship between pay-out ratio and ROA. Therefore the
alternative hypothesis (H1) from the sixth hypothesis is accepted and the null hypothesis is
rejected (H0). These results are consistent with DeAngelo et al. (2006) and Amidu (2007).
The control variables result shows a non-significant relationship between industry type and
ROA in the short term (before and after the crisis) and a positive relationship with ROA in
the long term. Board size results show a non-significant relationship with ROA. This is
consistent with Topak (2011) findings. Firm size results shows a significant positive
relationship with ROA at 10% before the crisis and significant at 5% after the crisis and in
the long term. This is consistent with Saeedi and Mahmoodi (2011) suggestions. Debt ratio
had a significant positive relationship with ROA at 10%. But the relationship became non-
significant after the crisis and in the long-term.
Beta figures show that the variables effect on ROA did not vary after the financial except
industry type and debt ratio. In the long-run market capitalisation has the highest effect on
ROA with (0.172), then dividend yield with (0.066), then pay-out ratio with (0.061), then

Page | 46
industry type with (0.052), then debt ratio with (0.026) and then board size with (-0.017).
Adjusted R square figures show that the independent variables affect the ROA by 1.7%.
Beta t-statistic Sig.
Dividend Yield Avg. 05-07 0.117 1.798 0.073
Pay-Out Ratio Avg. 05-07 -0.075 -0.954 0.341
Industry type 05-07 -0.004 -0.065 0.948
Board Avg. size 05-07 -0.015 -0.196 0.845
Market Cap. Avg. 05-07 0.129 1.712 0.088
Debt Ratio Avg. 05-07 0.133 1.709 0.089
Dividend Yield Avg. 08-10 0.082 1.217 0.225
Pay-Out Ratio Avg. 08-10 0.02 0.302 0.763
Industry type 08-10 0.102 1.619 0.107
Board Avg. size 08-10 -0.021 -0.286 0.775
Market Cap. Avg. 08-10 0.162 2.209 0.028
Debt Ratio Avg. 08-10 -0.024 -0.378 0.706
Dividend Yield Avg. 05-10 0.066 0.997 0.32
Pay-Out Ratio Avg. 05-10 0.061 0.923 0.357
Industry type 05-10 0.052 0.827 0.409
Board Avg. size 05-10 -0.017 -0.225 0.822
Market Cap. Avg. 05-10 0.172 2.338 0.02
Debt Ratio Avg. 08510 0.026 0.399 0.69
2005-2007 2008-2010 2005-2010
Adjusted R Square 0.017 0.017 0.017
Table 18: The association between ROA, dividend yield, pay-out ratio, Industry type, board size, market capitalisation and debt
ratio.
4.3 Summary
This chapter described the changes in the mean and standard deviation for the research
variables, analysed the regression results and stating the results of the hypothesis tests.
The regressions results suggested different relations between dividend yield and firm
performance before and after adding the control variables and based on the measurements
used.

Page | 47
Before adding the control variables dividend yield had a significant negative relationship with
share price volatility and Tobin Q. But it showed a significant positive relationship with ROA
in the short term and a positive relationship in the long-term.
But after adding the control variables the relationship with share price volatility and Tobin Q
did not vary. It showed the same results with ROA before the crisis and in the long-term but
after the crisis the relationship became non-significant.
On the other hand before adding the control variables, dividend pay-out ratio results showed
a non-significant relationship with share price volatility before the crisis and a negative
relationship after the crisis and in the long-term. It showed a positive relationship with Tobin
Q in the short term and a significant positive relationship in the long term. With ROA it
showed a non-significant relationship before the crisis, negative relationship after the crisis
and a positive relationship in the long term.
After adding the control variables, pay-out ratio continued to show a non-significant
relationship with share price volatility before the crisis but the relationship after the crisis and
in the long term became significantly negative. The relationship with Tobin Q became non-
significant after the crisis and positive before the crisis and in the long term. It showed a
positive relationship with ROA before the crisis and in the long term and a non-significant
relationship after the crisis.
The control variables results showed that industry type have a negative relationship with
share price volatility before the crisis and a significant negative relationship after the crisis
and in the long-term. The relationship between industry type and firm performance became
positive when Tobin Q is used as an indicator. When ROA is used, industry type results
showed a non-significant relationship with firm performance in the short term and positive
relationship in the long-term.
Board of directors’ size results showed a significant negative relationship with share price
volatility, a negative relationship with Tobin Q and a non-significant relationship with ROA.
Market capitalisation results showed a significant negative relationship with share price
volatility before the crisis and in the long term but an insignificant negative relationship after
the crisis. On the other hand market capitalisation has a significant positive relationship with
Tobin Q and ROA.
Debt ratio results showed a non-significant relationship with share price. It shows a
significant positive relationship with Tobin Q before the crisis which became non-significant
relationship after the crisis and a positive relationship in the long-term with Tobin Q.

Page | 48
Chapter Five
5.1 Conclusion
The purpose of this research was to observe the relationship between dividend policy
(dividend yield and pay-out ratio) with firm performance (ROA, Tobin Q’s and share price
volatility). It also considered some factors affecting the dividend policy (industry type, board
of directors’ size, market capitalisation and debt ratio) and its relationship with the firm
performance measurements. The relationship between the variables was examined using
linear regression for the purpose of analysis. The study was based on 283 firms’ which
maintained its existence in the UK stock market between the period 2005 and 2010 after
excluding the financial firms. The model results showed different relations between dividend
yield and firm performance based on the indicators used.
When using share price volatility as a performance indicator and regress it with the variables,
the results suggested a significant negative relationship with dividend yield and a non-
significant relationship with pay-out ratio before the financial crisis, but a significant negative
relationship after the crisis and on the long term. Dividend yield result is consistent with
Baskin (1989) findings. Pay-out ratio suggestion is consistent with Baskin (1989), Allen and
Rachim (1996) and Hussainey et al. (2011) results. The results suggest that the higher the
firms’ dividend yield and pay-out ratio the volatility of its stock price will be lower. On the
other hand the control variables had a negative relationship with share price volatility except
the debt ratio that showed a non-significant relationship with price volatility. Type of industry
showed a negative relationship with share price volatility before the financial crisis, but the
relationship became significantly negative after the crisis and on the long term. This result is
inconsistent to Hussainey et al. (2011) due to the different classifications used for companies.
Board of directors’ size showed a significant negative relationship with share price volatility
at 10% before the crisis and at 1% after the crisis and on the long term. This is consistent with

Page | 49
Barnhart and Rosenstein (1998). Firm size showed a significant negative relationship with
share price volatility at 10% before the crisis and in the long term, but insignificant negative
relationship after the crisis. This is consistent with Hussainey et al. (2011) findings. The
result shows that dividend yield have the highest effect on share price volatility.
On the other hand when using Tobin Q as a performance indicator the results highly varied.
Dividend yield result shows a significant negative relationship with Tobin Q. This is
consistent with Gordon growth model (Damodaran, 2002). While the relationship between
pay-out ratio and firm performance was significantly negative when share price volatility was
used as an indicator, the relationship became non-significant before the crisis and positive
after the crisis an in the long term with share price volatility when using Tobin Q as an
indicator. This is consistent with Murekefu and Ouma (2012) findings. The results suggest
that a firm with a high dividend yield will have a low Tobin Q and a firm with high pay-out
ratio will have a high Tobin Q. The control variables results showed a positive relationship
between industry type and firm performance using Tobin Q. Board of directors’ size
continues to show a negative relationship with firm performance after using Tobin Q as an
indicator. This is consistent with Guest (2009) findings. Firm size fissures suggest a
significant positive relationship with Tobin Q. Debt ratio result shows a significant positive
relationship with Tobin Q before the crisis, but after the crisis the relationship became non-
significant and in the long term the relationship is positively insignificant. This is consistent
with Saeedi and Mahmoodi (2011) findings. The results suggested that dividend yield have
the highest impact on Tobin Q results.
When using a book value measurement (ROA) as a firm performance indicator the results
suggest different relations. Although dividend yield had a significant negative relationship
with firm performance when share price volatility and Tobin Q were used, the results showed
a significant positive relationship before the crisis, non-significant relationship after the crisis
and an insignificant positive relationship in the long term between dividend yield and firm
performance when ROA is used as an indicator. This is consistent with Amidu (2007). Pay-
out ratio figures suggests a positive relationship with ROA before the crisis and on the long
term and a non-significant relationship with ROA after the crisis. This is consistent with
DeAngelo et al. (2006) and Amidu (2007). This means that a firm with high dividend yield
and pay-out ratio will have a high ROA. The control variables results suggested a non-
significant relationship between industry type and ROA before and after the crisis, but a

Page | 50
positive relationship in the long term. Board of directors’ size have no effect on firm
performance when using ROA as an indicator. This is consistent with Topak (2011) results.
Firm size figures show a significant positive relationship with ROA. This is consistent with
Saeedi and Mahmoodi (2011) findings. Debt ratio figures show a significant positive
relationship with ROA before the crisis, but after the crisis and on the long term there is no
effect of debt ratio on ROA. The results suggest that market capitalisation have the highest
effect on ROA.
The results above suggest that the relationship between dividend policy and firm performance
depend on the measurements used to identify them. It shows that using market data will
provide different results than using book value figures. For that investors’ and managers will
have different results and suggestions about the relationship between dividend and
performance based on the measures used for dividend policy and firm performance and the
control variables used.
5.2 Limitation
Although the research fulfilled its aims and objectives, but that does not mean there were no
limitations in the study. First the use of firm performance measures, while considering the use
of different measures by using market and book value data. Stock price might not reflect the
real financial situation of the firm and its investment opportunities that have. It does not
consider the firms’ future earnings and it is affected by the external factors that affect the
financial markets (Bernard and Thomas, 1990). On the other hand using ROA as a financial
ratio for firm performance measure might provide un-reliable results since ROA represents
the historical economic values and not the current economic one and it is analysed using
accounting data which can be manipulated by the firm (Bowhill, 2008). Second, it is
important to study the relationship between dividend policy and firm performance excluding
year 2008, which had the peak of the financial credit crisis. Replacing year 2008 with a
dummy variable might provide different results. This dissertation failed to study that
relationship because of the time limit. Third, the control variables used were not enough to
reflect all the factors affecting the firms’ dividend policy and its performance. For that more
control variables should be added to indicate the main factors affecting the firms’ dividend
policy and its performance. To understand the effect of dividend policy on firms’
performance it is recommended to study each industry separately, since each industry is
affected by different variables and it has its own government regulations.

Page | 51

Page | 52
References
Al Shabibi, B. K. & Ramesh, G. (2011). An Empirical Study on the Determinants of
Dividend Policy in the UK. International Research Journal of Finance and Economics, 80,
106-120.
Allen, D. E. & Rachim, V. S. (1996). Dividend policy and stock price volatility: Australian
evidence. Applied Financial Economics, 6(2), 175-188.
Al-Malkawi, N. H. (2007). Determinants of Corporate Dividend Policy in Jordan: An
application of the Tobit Model. Journal of Economic & Administrative Sciences, 23(2), 44-
70.
Al-Najjar, B. & Hussainye, K. (2009). The Association between Dividend Payout and
Outside Directorships. Journal of Applied Accounting Research, 10, 4-19.
Amidu, M. (2007). How does dividend policy affect performance of the firm on Ghana stock
exchange?. Investment Management and Financial Innovations,4(2), 103-112.
Arnold, G. (2008) Corporate Finance Management (4th Ed.). England: Person education
limited.
Baker, H. K. & Powell, G. E (2000). Determinants of corporate dividend policy: a survey of
NYSE firms. Financial Practice and education, 9, 29-40.
Barnhart, S. W. & Roseinstein, S. (1998). Board Composition, Managerial Ownership, and
Firm Performance: An Empirical Analysis. The Financial Review, 33, 1-16.
Baskin, J. (1989). Dividend policy and the volatility of common stock. Journal of Portfolio
Management, 15, 19-25.
Bathala, C. & Rao, R. (1995). The Determinants of Board Composition: An Agency Theory
Perspective. Managerial and Decision Economics, 16(1), 59-69.
Bernard, V. L., & Thomas, J. K. (1990). Evidence That Stock Prices Do Not Fully
Reflect The Implications Of Current Earnings For Future Earnings. Journal of Accounting
and Economics, 13, 305-340.
Bharadwaj, A. S., Bharadwaj, S. G. & Konsynski, B. R. (1991). Information Technology
Effects on Firm Performance as Measured by Tobin's q. Management Science, 45(7), 1008-
1024.
Bhattacharyya, N. (2007). Dividend policy: a review. Managerial Finance, 33(1), 4-13.
Black, F. (1976). The dividend puzzle. Journal of Portfolio Management, 2, 5-8.
Bleden, S., Fister, T. & Knapp, B. (2005). Dividends and Directors: Do Outsiders Reduce

Page | 53
Agency Costs?. Business and Society Review, 110(2), 171-180.
Bokpin, G. A. (2011). Ownership structure, corporate governance and dividend performance
on the Ghana Stock Exchange. Journal of Applied Accounting Research, 12(1), 61-73.
Bond, M. T. & Mougoue, M. (1991). Corporate dividend policy and the partial adjustment
model. Journal of Economics and Business, 43(2), 165-178.
Borokhovich, K., Brunarski, K., Harman, Y. & Kehr, J. (2005). Dividends, Corporate
Monitors and Agency Costs. The Financial Review, 40, 37-65.
Bowhill B., (2008). Business planning and control: Integrating accounting, strategy and
people. England: John Wiley & Sons.
Chatterjee, A. & Maniam, B. (2011). Market Anomalies Revisited. Journal of Applied
Business Research. 13(4), 47-56.
Chung, K. H. & Pruitt, S. W. (1994). A simple approximation of Tobin's q. Financial
Management, 23(3), 70-74.
Damodaran, A. (2002). Investment valuation. New York: Wiley.
DeAngelo, H., DeAngelo, L. & Stulz, R. M. (2006). Dividend policy and the earned/
contributed capital mix: a test of the life-cycle theory. Journal of Financial Economics, 81,
227–254.
Dobbins R. & Witt, S. F. (1993). How Much Should A Firm Pay in Dividends?. Managerial
Finance, 8(1), 23-27.
D'Souza, J. & Saxena, A. K. (1999). Agency cost, market risk, investment opportunities and
dividend policy - an international perspective. Managerial Finance, 25(6), 35-43.
Easterbrook, F. (1984). Two agency cost explanations of dividends. American Economic
Review, 74, 650-659.
Fairchild, R. (2010) Dividend policy, signalling and free cash flow: an integrated approach.
Managerial Finance, 36(5), 394-413.
Fama, E. F. (1970). Efficient Capital Markets: A Review of Theory and Empirical Work.
Journal of Finance, 25, 383-41.
Fama, E. F. (1991). Efficient Capital Markets: II. The Journal of Finance, 46(5), 1575-1617.
Fama, E. F. & French, K. R. (2001). Disappearing dividends: changing firm characteristics or
lower propensity to pay?. Journal of Financial Economics, 60, 3-43.

Page | 54
Feltham, G., & Xie, J. (1994). Performance Measure Congruity and Diversity in Multi-Task
Principal/Agent Relations. Accounting Review, 69, 429-453.
Forbes, K. J. (2002). How Do Large Depreciations Affect Firm Performance?. International
Monetary Fund, 49, 214-238.
Forsythe, R., Palfrey, T. R. & Plott, C. R. (1984). Futures Markets and Informational
Efficiency: A Laboratory Examination. Journal of Finance, 39, 955-981.
Frankfurter, G.M. & Wood, B.G. (2002). Dividend policy theories and their empirical tests.
International Review of Financial Analysis, 11, 111-38.
Goddard, J., McMillan, D. G. & Wilson, J. O. S. (2006). Dividend smoothing vs dividend
signalling: evidence from UK firms. Managerial Finance, 32(6), 493-504.
Grullon, G., Michaely, R. & Swaminathan, B. (2002). Are Dividend Changes a Sign of Firm
Maturity?. The Journal of Business, 75, 387-424.
Guest, P. M. (2009). The Impact of Board Size on Firm Performance: Evidence from the UK.
The European Journal of Finance, 15(4), 385-404.
Hall, B. H. (1993). The stock market's valuation of R&D investment during the 1980's. AEA
Papers and Proceedings, 70(2), 259-264.
Ho, H. (2003). Dividend policies in Australia and Japan. International Advances in
Economic Research, 9(2), 91-100.
Holder, M. E., Langrehr, F. W. & Hexter, J. L. (1998). Dividend policy determinants: an
Investigation of the influences of stakeholder theory. Financial Management 27(3), 73-82.
Hussainey, K., Mgbame, C. O. & Chijoke-Mgbame, A. M. (2011). Dividend policy and share
price volatility: UK evidence. The Journal of Risk Finance, 12(1), 57-68.
Jensen, M. C. & Meckling, W. H. (1976). Theory of the Firm: Managerial Behaviour,
Agency Costs and Ownership Structure. Journal of Financial Economics, 3(4), 305-360.
Jiraporn, P., Kim, S. & Mathur, I. (2008). Does corporate diversification exacerbate or
mitigate earnings management?: an empirical analysis. International Review of
Financial Analysis, 17, 1087-1109.
Kaplan, S. & Reishus, D. (1990). Outside directorships and corporate performance. Journal
of Financial Economics, 27(2), 389-410.
Keim, D. B., (1985). Dividend Yields and Stock Returns: Implications of Abnormal January
Returns. Journal of Financial Economics, 14, 473-489.

Page | 55
Lintner, J. (1965). Distribution of incomes of corporations among dividends, retained
earnings and taxes. The American Economic Review, 46(2), 97-113.
Malkiel B. G. (2003). The Efficient Market Hypothesis and Its Critics. Journal of Economic
Perspectives, 17(1), 59-82.
Miller, M. H, & Modigliani, F. (1961). Dividend policy, growth and the valuation of shares.
The Journal of Business, 34(4), 411-433.
Miller, M. & Scholes, M. (1982). Dividends and Taxes: Some Empirical Evidence. Journal
of Political Economy, 90(6), 1118-1141
Modigliani, F. (1982). Debt, Dividend Policy, Taxes, Inflation and Market Valuation.
Journal of Finance, 37(2), 255-273.
Murekefu, T. M. & Ouma, O. P. (2012). The relationship between dividend pay-out and firm
performance: a study of listed companies in Kenya. European Scientific Journal, 8(9), 199-
215.
Niu, X. (2008). Theoretical and practical review of capital structure and its
determinants. International Journal of Business and Management, 3 (3), 133-139.
Pettit, R. R. (1972) Dividend Announcements, Security Performance and Capital Market
Efficiency. Journal of Finance, 27, 993-1007.
Ross, S. A., Westerfield, R. W., Jaffe, J. and Jordan, B. D. (2008), Modern Financial
Management (8th ed). New York: McGraw-Hill.
Saeedi, A. & Mahmoodi, I. (2011). Capital Structure and Firm Performance:Evidence from
Iranian Companies. International Research Journal of Finance and Economics, 70, 21-29.
Schellenger, M., Wood, D. & Tashakori, A. (1989). Board of Director Composition,
Shareholder Wealth, and Dividend Policy. Journal of Management, 15 (3), 457-467.
Smith, C. W. & Watts, R. L. (1992). The Investment Opportunity Set and Corporate
Financing, Dividend, and Compensation Policies. Journal of Financial Economics, 32, 263-
292.
Thaler, R. H. (1987). Anomalies: The January Effect. The Journal of Economic Perspective,
1(1), 197-201.
Topak, M. S. (2011). The Effect of Board Size on Firm Performance: Evidence from Turkey.
Middle Eastern Finance and Economics, (14), 120-126.
Van Caneghem, T. & Aerts, W. (2011). Intra-industry conformity in dividend policy.
Managerial Finance, 37(6), 492 – 516.

Page | 56
Wolf, J. & Sauaia, A. C. A. (2003). The Tobin q as a company performance indicator.
Developments in Business Simulation and Experiential Learning, 30, 155-159.
Yoon, P. S. & Starks, L. T. (1995). Signalling, Investment Opportunities and Dividend
Announcements. Review of Financial Studies, 8(4), 995-1018.
.

Page | 57

Page | 58
Appendices
Appendix (1): Variables descriptive analysis
Table 1: Debt ratio descriptive analysis
N Minimum Maximum Mean Std. Deviation
Debt Ratio 2005 270 0 1157 89.34 137.631
Debt Ratio 2006 268 0 3027 103.35 247.941
Debt Ratio 2007 271 0 4319 117.75 350.453
Debt Ratio 2008 271 0 1596 106.39 184.032
Debt Ratio 2009 268 0 8229 133.91 522.598
Debt Ratio 2010 265 0 5330 112.83 394.618
Valid N (listwise) 246
Table 2: Dividend yield descriptive analysis
N Minimum Maximum Mean Std. Deviation
Dividend Yield 2005 282 0 27 2.66 2.124
Dividend Yield 2006 283 0 7 2.47 1.498
Dividend Yield 2007 283 0 11 2.78 1.835
Dividend Yield 2008 282 0 30 4.29 3.467
Dividend Yield 2009 283 0 15 3.24 2.716
Dividend Yield 2010 274 0 12 2.72 2.054
Valid N (listwise) 272
Table 3: Market capitalisation descriptive analysis
N Minimum Maximum Mean Std. Deviation
Market Cap. 2005 283 62 127864 3670.61 12145.047
Market Cap. 2006 283 60 111715 3934.46 11484.914
Market Cap. 2007 283 36 116372 4481.00 12975.104
Market Cap. 2008 283 11 112869 3602.64 12102.824
Market Cap. 2009 283 15 112584 4017.82 12734.583
Market Cap. 2010 275 10 110281 4817.82 13946.901
Valid N (listwise) 275

Page | 59
Table 4: Return on assets descriptive analysis
N Minimum Maximum Mean Std. Deviation
ROA 2005 280 -36 35 6.90 8.615
ROA 2006 281 -42 38 6.94 9.516
ROA 2007 281 -32 72 8.36 9.503
ROA 2008 280 -57 52 5.75 9.816
ROA 2009 280 -37 70 3.39 8.890
ROA 2010 274 -49 33 5.17 7.767
Valid N (listwise) 271
Table 5: Tobin Q’s descriptive analysis
N Minimum Maximum Mean Std. Deviation
Tobin Q’s 2005 281 1 6 1.89 .980
Tobin Q’s 2006 281 1 8 2.04 1.040
Tobin Q’s 2007 281 1 7 1.93 .970
Tobin Q’s 2008 280 0 5 1.40 .712
Tobin Q’s 2009 282 0 4 1.42 .693
Tobin Q’s 2010 273 1 8 1.59 .903
Valid N (listwise) 270
Table 6: Tobin Q’s Statistical Analysis.
Table 6: Pay-out ratio descriptive analysis
N Minimum Maximum Mean Std. Deviation
Pay-Out Ratio 2005 274 0 1200 60.55 110.380
Pay-Out Ratio 2006 268 0 9268 91.28 570.175
Pay-Out Ratio 2007 272 0 4022 62.52 245.857
Pay-Out Ratio 2008 253 0 10500 104.38 671.611
Pay-Out Ratio 2009 240 0 2514 84.52 226.593
Pay-Out Ratio 2010 261 0 1318 58.29 126.566
Valid N (listwise) 195

Page | 60
Table 8: Board of directors’ size descriptive analysis
N Minimum Maximum Mean Std. Deviation
Board size 2005 240 4 17 8.92 2.309
Board size 2006 242 4 17 8.95 2.431
Board size 2007 252 4 19 8.93 2.417
Board size 2008 259 4 19 8.90 2.369
Board size 2009 255 5 17 8.73 2.270
Board size 2010 251 4 17 8.75 2.330
Valid N (listwise) 237
.
Table 7: 360 days volatility descriptive analysis
N Minimum Maximum Mean Std. Deviation
Volatility 2005 280 10 97 26.08 10.784
Volatility 2006 283 14 84 28.57 9.439
Volatility 2007 283 13 115 31.04 9.899
Volatility 2008 283 20 136 48.19 17.699
Volatility 2009 283 28 156 60.43 22.172
Volatility 2010 275 18 179 42.87 18.943
Valid N (listwise) 272
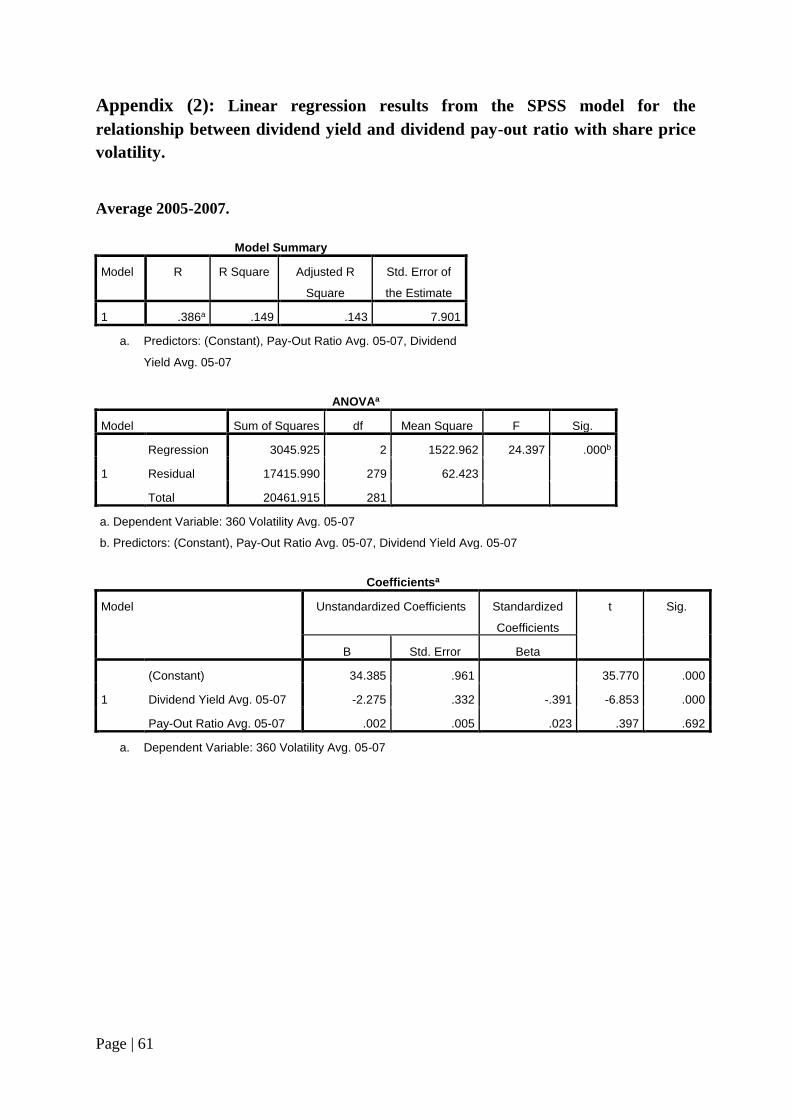
Page | 61
Appendix (2): Linear regression results from the SPSS model for the
relationship between dividend yield and dividend pay-out ratio with share price
volatility.
Average 2005-2007.
Model Summary
Model R R Square Adjusted R
Square
Std. Error of
the Estimate
1 .386a .149 .143 7.901
a. Predictors: (Constant), Pay-Out Ratio Avg. 05-07, Dividend
Yield Avg. 05-07
ANOVAa
Model Sum of Squares df Mean Square F Sig.
1
Regression 3045.925 2 1522.962 24.397 .000b
Residual 17415.990 279 62.423
Total 20461.915 281
a. Dependent Variable: 360 Volatility Avg. 05-07
b. Predictors: (Constant), Pay-Out Ratio Avg. 05-07, Dividend Yield Avg. 05-07
Coefficientsa
Model Unstandardized Coefficients Standardized
Coefficients
t Sig.
B Std. Error Beta
1
(Constant) 34.385 .961 35.770 .000
Dividend Yield Avg. 05-07 -2.275 .332 -.391 -6.853 .000
Pay-Out Ratio Avg. 05-07 .002 .005 .023 .397 .692
a. Dependent Variable: 360 Volatility Avg. 05-07

Page | 62
Average 2008-2010.
Model Summary
Model R R Square Adjusted R
Square
Std. Error of the
Estimate
1 .183a .033 .026 15.991
a. Predictors: (Constant), Pay-Out Ratio Avg. 08-10, Dividend Yield
Avg. 08-10
ANOVAa
Model Sum of Squares df Mean Square F Sig.
1
Regression 2455.828 2 1227.914 4.802 .009b
Residual 71084.421 278 255.699
Total 73540.249 280
a. Dependent Variable: 360 Volatility Avg. 08-10
b. Predictors: (Constant), Pay-Out Ratio Avg. 08-10, Dividend Yield Avg. 08-10
Coefficientsa
Model Unstandardized Coefficients Standardized
Coefficients
t Sig.
B Std. Error Beta
1
(Constant) 55.040 1.820 30.236 .000
Dividend Yield Avg. 08-10 -1.024 .476 -.135 -2.154 .032
Pay-Out Ratio Avg. 08-10 -.017 .012 -.086 -1.379 .169
a. Dependent Variable: 360 Volatility Avg. 08-10
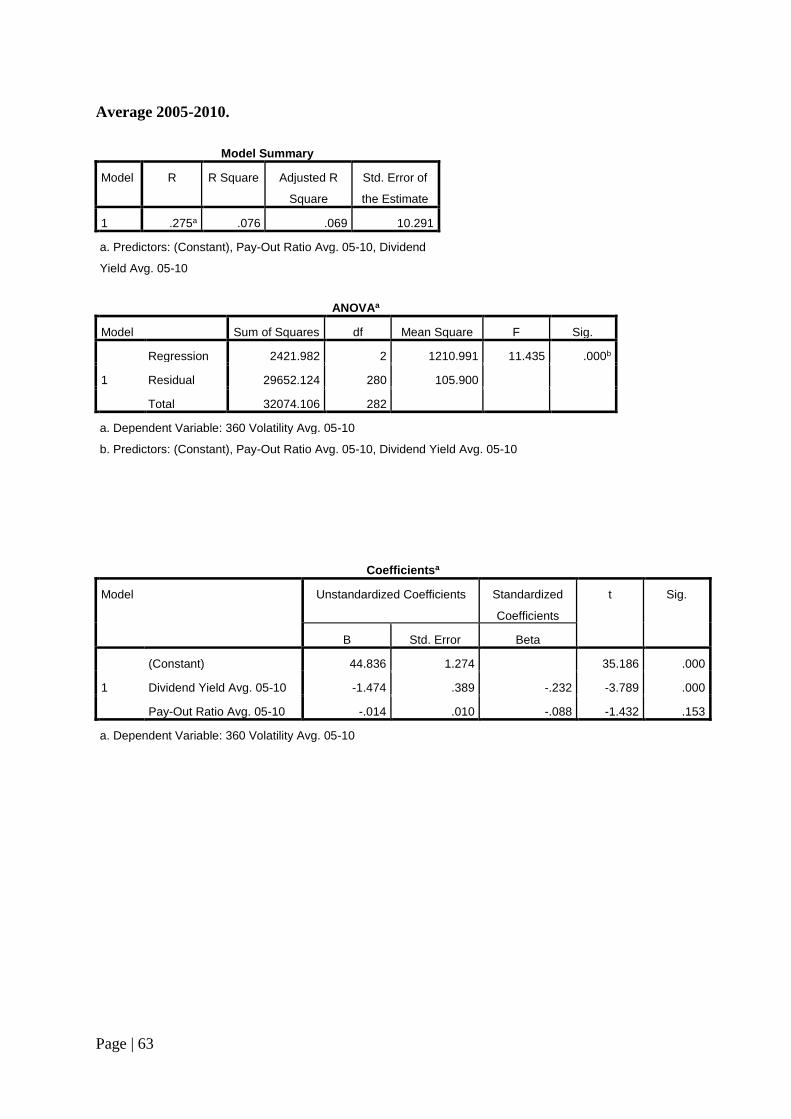
Page | 63
Average 2005-2010.
Model Summary
Model R R Square Adjusted R
Square
Std. Error of
the Estimate
1 .275a .076 .069 10.291
a. Predictors: (Constant), Pay-Out Ratio Avg. 05-10, Dividend
Yield Avg. 05-10
ANOVAa
Model Sum of Squares df Mean Square F Sig.
1
Regression 2421.982 2 1210.991 11.435 .000b
Residual 29652.124 280 105.900
Total 32074.106 282
a. Dependent Variable: 360 Volatility Avg. 05-10
b. Predictors: (Constant), Pay-Out Ratio Avg. 05-10, Dividend Yield Avg. 05-10
Coefficientsa
Model Unstandardized Coefficients Standardized
Coefficients
t Sig.
B Std. Error Beta
1
(Constant) 44.836 1.274 35.186 .000
Dividend Yield Avg. 05-10 -1.474 .389 -.232 -3.789 .000
Pay-Out Ratio Avg. 05-10 -.014 .010 -.088 -1.432 .153
a. Dependent Variable: 360 Volatility Avg. 05-10

Page | 64
Appendix (3): Linear regression results from the SPSS model for the
relationship between dividend yield and dividend pay-out ratio with Tobin Q.
Average 2005-2007.
Model Summary
Model R R Square Adjusted R
Square
Std. Error of
the Estimate
1 .217a .047 .040 .917
a. Predictors: (Constant), Pay-Out Ratio Avg. 05-07, Dividend
Yield Avg. 05-07
ANOVAa
Model Sum of Squares df Mean Square F Sig.
1
Regression 11.496 2 5.748 6.836 .001b
Residual 232.901 277 .841
Total 244.396 279
a. Dependent Variable: Tobin Q's Avg. 05-07
b. Predictors: (Constant), Pay-Out Ratio Avg. 05-07, Dividend Yield Avg. 05-07
Coefficientsa
Model Unstandardized Coefficients Standardized
Coefficients
t Sig.
B Std. Error Beta
1
(Constant) 2.306 .113 20.362 .000
Dividend Yield Avg. 05-07 -.144 .039 -.223 -3.690 .000
Pay-Out Ratio Avg. 05-07 .000 .001 .041 .670 .503
a. Dependent Variable: Tobin Q's Avg. 05-07

Page | 65
Average 2008-2010.
Model Summary
Model R R Square Adjusted R
Square
Std. Error of
the Estimate
1 .239a .057 .050 .704
a. Predictors: (Constant), Pay-Out Ratio Avg. 08-10, Dividend
Yield Avg. 08-10
ANOVAa
Model Sum of Squares df Mean Square F Sig.
1
Regression 8.348 2 4.174 8.431 .000b
Residual 137.644 278 .495
Total 145.993 280
a. Dependent Variable: Tobin Q's Avg. 08-10
b. Predictors: (Constant), Pay-Out Ratio Avg. 08-10, Dividend Yield Avg. 08-10
Coefficientsa
Model Unstandardized Coefficients Standardized
Coefficients
t Sig.
B Std. Error Beta
1
(Constant) 1.734 .080 21.648 .000
Dividend Yield Avg. 08-10 -.085 .021 -.252 -4.071 .000
Pay-Out Ratio Avg. 08-10 .000 .001 .053 .853 .395
a. Dependent Variable: Tobin Q's Avg. 08-10

Page | 66
Average 2005-2010.
Model Summary
Model R R Square Adjusted R
Square
Std. Error of
the Estimate
1 .250a .063 .056 .812
a. Predictors: (Constant), Pay-Out Ratio Avg. 05-10, Dividend
Yield Avg. 05-10
ANOVAa
Model Sum of Squares df Mean Square F Sig.
1
Regression 12.337 2 6.169 9.353 .000b
Residual 184.673 280 .660
Total 197.011 282
a. Dependent Variable: Tobin Q's Avg. 05-10
b. Predictors: (Constant), Pay-Out Ratio Avg. 05-10, Dividend Yield Avg. 05-10
Coefficientsa
Model Unstandardized Coefficients Standardized
Coefficients
t Sig.
B Std. Error Beta
1
(Constant) 2.013 .101 20.013 .000
Dividend Yield Avg. 05-10 -.133 .031 -.266 -4.323 .000
Pay-Out Ratio Avg. 05-10 .001 .001 .100 1.622 .106
a. Dependent Variable: Tobin Q's Avg. 05-10

Page | 67
Appendix (4): Linear regression results from the SPSS model for the
relationship between dividend yield and dividend pay-out ratio with ROA
Average 2005-2007.
Model Summary
Model R R Square Adjusted R
Square
Std. Error of the
Estimate
1 .150a .023 .015 7.479
a. Predictors: (Constant), Pay-Out Ratio Avg. 05-07, Dividend Yield Avg.
05-07
.
ANOVAa
Model Sum of Squares df Mean Square F Sig.
1
Regression 357.441 2 178.720 3.195 .042b
Residual 15493.930 277 55.935
Total 15851.371 279
a. Dependent Variable: ROA Avg. 05-07
b. Predictors: (Constant), Pay-Out Ratio Avg. 05-07, Dividend Yield Avg. 05-07
Coefficientsa
Model Unstandardized Coefficients Standardized
Coefficients
t Sig.
B Std. Error Beta
1
(Constant) 5.345 .924 5.786 .000
Dividend Yield Avg. 05-07 .784 .317 .151 2.470 .014
Pay-Out Ratio Avg. 05-07 .000 .005 -.005 -.083 .934
a. Dependent Variable: ROA Avg. 05-07

Page | 68
Average 2008-2010.
Model Summary
Model R R Square Adjusted R
Square
Std. Error of
the Estimate
1 .119a .014 .007 7.011
a. Predictors: (Constant), Pay-Out Ratio Avg. 08-10, Dividend Yield
Avg. 08-10
ANOVAa
Model Sum of Squares df Mean Square F Sig.
1
Regression 195.259 2 97.629 1.986 .139b
Residual 13614.652 277 49.150
Total 13809.911 279
a. Dependent Variable: ROA Avg. 08-10
b. Predictors: (Constant), Pay-Out Ratio Avg. 08-10, Dividend Yield Avg. 08-10
Coefficientsa
Model Unstandardized Coefficients Standardized
Coefficients
t Sig.
B Std. Error Beta
1
(Constant) 3.522 .801 4.398 .000
Dividend Yield Avg. 08-10 .416 .209 .126 1.990 .048
Pay-Out Ratio Avg. 08-10 -.003 .005 -.036 -.571 .569
a. Dependent Variable: ROA Avg. 08-10

Page | 69
Average 2005-2010
Model Summary
Model R R Square Adjusted R Square Std. Error of the
Estimate
1 .126a .016 .009 6.291
a. Predictors: (Constant), Pay-Out Ratio Avg. 05-10, Dividend Yield Avg. 05-10
ANOVAa
Model Sum of Squares df Mean Square F Sig.
1
Regression 179.143 2 89.572 2.263 .106b
Residual 11041.708 279 39.576
Total 11220.851 281
a. Dependent Variable: ROA Avg. 05-10
b. Predictors: (Constant), Pay-Out Ratio Avg. 05-10, Dividend Yield Avg. 05-10
Coefficientsa
Model Unstandardized Coefficients Standardized
Coefficients
t Sig.
B Std. Error Beta
1
(Constant) 4.634 .784 5.907 .000
Dividend Yield Avg. 05-10 .380 .239 .101 1.590 .113
Pay-Out Ratio Avg. 05-10 .005 .006 .049 .775 .439
a. Dependent Variable: ROA Avg. 05-10

Page | 70
Appendix (5): Linear regression results from the SPSS model for the
relationship between dividend yield, dividend pay-out ratio and debt ratio with
share price volatility.
Average 2005-2007.
Model Summary
Model R R Square Adjusted R
Square
Std. Error of the
Estimate
1 .390a .152 .142 7.848
a. Predictors: (Constant), Debt Ratio Avg. 05-07, Dividend Yield Avg. 05-
07, Pay-Out Ratio Avg. 05-07
ANOVAa
Model Sum of Squares df Mean Square F Sig.
1
Regression 2997.582 3 999.194 16.223 .000b
Residual 16753.056 272 61.592
Total 19750.638 275
a. Dependent Variable: 360 Volatility Avg. 05-07
b. Predictors: (Constant), Debt Ratio Avg. 05-07, Dividend Yield Avg. 05-07, Pay-Out Ratio Avg.
05-07
Coefficientsa
Model Unstandardized Coefficients Standardized
Coefficients
t Sig.
B Std. Error Beta
1
(Constant) 34.457 .981 35.111 .000
Dividend Yield Avg. 05-07 -2.290 .336 -.392 -6.811 .000
Pay-Out Ratio Avg. 05-07 .005 .006 .062 .896 .371
Debt Ratio Avg. 05-07 -.002 .002 -.069 -1.031 .303
a. Dependent Variable: 360 Volatility Avg. 05-07

Page | 71
Average 2008-2010.
Model Summary
Model R R Square Adjusted R
Square
Std. Error of the
Estimate
1 .186a .035 .024 16.070
a. Predictors: (Constant), Debt Ratio Avg. 08-10, Pay-Out Ratio Avg.
08-10, Dividend Yield Avg. 08-10
ANOVAa
Model Sum of Squares df Mean Square F Sig.
1
Regression 2527.100 3 842.367 3.262 .022b
Residual 70501.391 273 258.247
Total 73028.491 276
a. Dependent Variable: 360 Volatility Avg. 08-10
b. Predictors: (Constant), Debt Ratio Avg. 08-10, Pay-Out Ratio Avg. 08-10, Dividend Yield Avg.
08-10
Coefficientsa
Model Unstandardized Coefficients Standardized
Coefficients
t Sig.
B Std. Error Beta
1
(Constant) 55.141 1.864 29.586 .000
Dividend Yield Avg. 08-10 -1.081 .487 -.141 -2.218 .027
Pay-Out Ratio Avg. 08-10 -.016 .012 -.084 -1.324 .187
Debt Ratio Avg. 08-10 .000 .003 .005 .078 .938
a. Dependent Variable: 360 Volatility Avg. 08-10

Page | 72
Average 2005-2010.
Model Summary
Model R R Square Adjusted R
Square
Std. Error of
the Estimate
1 .280a .078 .068 10.300
a. Predictors: (Constant), Debt Ratio Avg. 05-10, Dividend
Yield Avg. 05-10, Pay-Out Ratio Avg. 05-10
ANOVAa
Model Sum of Squares df Mean Square F Sig.
1
Regression 2506.736 3 835.579 7.876 .000b
Residual 29494.048 278 106.094
Total 32000.784 281
a. Dependent Variable: 360 Volatility Avg. 05-10
b. Predictors: (Constant), Debt Ratio Avg. 05-10, Dividend Yield Avg. 05-10, Pay-Out Ratio Avg.
05-10
Coefficientsa
Model Unstandardized Coefficients Standardized
Coefficients
t Sig.
B Std. Error Beta
1
(Constant) 45.024 1.288 34.943 .000
Dividend Yield Avg. 05-10 -1.451 .390 -.229 -3.722 .000
Pay-Out Ratio Avg. 05-10 -.013 .010 -.083 -1.353 .177
Debt Ratio Avg. 05-10 -.002 .002 -.050 -.854 .394
a. Dependent Variable: 360 Volatility Avg. 05-10

Page | 73
Appendix (6): Linear regression results from the SPSS model for the
relationship between dividend yield, dividend pay-out ratio and debt ratio with
Tobin Q.
Average 2005-2007.
Model Summary
Model R R Square Adjusted R
Square
Std. Error of the
Estimate
1 .244a .059 .049 .919
a. Predictors: (Constant), Debt Ratio Avg. 05-07, Dividend Yield Avg.
05-07, Pay-Out Ratio Avg. 05-07
ANOVAa
Model Sum of Squares df Mean Square F Sig.
1
Regression 14.519 3 4.840 5.727 .001b
Residual 229.868 272 .845
Total 244.388 275
a. Dependent Variable: Tobin Q's Avg. 05-07
b. Predictors: (Constant), Debt Ratio Avg. 05-07, Dividend Yield Avg. 05-07, Pay-Out Ratio Avg.
05-07
Coefficientsa
Model Unstandardized Coefficients Standardized
Coefficients
t Sig.
B Std. Error Beta
1
(Constant) 2.296 .115 19.975 .000
Dividend Yield Avg. 05-07 -.144 .039 -.221 -3.647 .000
Pay-Out Ratio Avg. 05-07 .000 .001 -.033 -.450 .653
Debt Ratio Avg. 05-07 .000 .000 .129 1.826 .069
a. Dependent Variable: Tobin Q's Avg. 05-07

Page | 74
Average 2008-2010.
Model Summary
Model R R Square Adjusted R
Square
Std. Error of the
Estimate
1 .248a .061 .051 .701
a. Predictors: (Constant), Debt Ratio Avg. 08-10, Pay-Out Ratio Avg.
08-10, Dividend Yield Avg. 08-10
ANOVAa
Model Sum of Squares df Mean Square F Sig.
1
Regression 8.759 3 2.920 5.947 .001b
Residual 134.014 273 .491
Total 142.773 276
a. Dependent Variable: Tobin Q's Avg. 08-10
b. Predictors: (Constant), Debt Ratio Avg. 08-10, Pay-Out Ratio Avg. 08-10, Dividend Yield Avg.
08-10
Coefficientsa
Model Unstandardized Coefficients Standardized
Coefficients
t Sig.
B Std. Error Beta
1
(Constant) 1.730 .081 21.287 .000
Dividend Yield Avg. 08-10 -.089 .021 -.262 -4.188 .000
Pay-Out Ratio Avg. 08-10 .001 .001 .061 .980 .328
Debt Ratio Avg. 08-10 2.179E-005 .000 .011 .180 .857
a. Dependent Variable: Tobin Q's Avg. 08-10

Page | 75
Average 2005-2010.
Model Summary
Model R R Square Adjusted R
Square
Std. Error of the
Estimate
1 .257a .066 .056 .813
a. Predictors: (Constant), Debt Ratio Avg. 05-10, Dividend Yield Avg. 05-
10, Pay-Out Ratio Avg. 05-10
ANOVAa
Model Sum of Squares df Mean Square F Sig.
1
Regression 13.008 3 4.336 6.554 .000b
Residual 183.904 278 .662
Total 196.911 281
a. Dependent Variable: Tobin Q's Avg. 05-10
b. Predictors: (Constant), Debt Ratio Avg. 05-10, Dividend Yield Avg. 05-10, Pay-Out Ratio Avg.
05-10
Coefficientsa
Model Unstandardized Coefficients Standardized
Coefficients
t Sig.
B Std. Error Beta
1
(Constant) 1.997 .102 19.629 .000
Dividend Yield Avg. 05-10 -.135 .031 -.270 -4.370 .000
Pay-Out Ratio Avg. 05-10 .001 .001 .094 1.515 .131
Debt Ratio Avg. 05-10 .000 .000 .058 .991 .322
a. Dependent Variable: Tobin Q's Avg. 05-10

Page | 76
Appendix (7): Linear regression results from the SPSS model for the
relationship between dividend yield, dividend pay-out ratio and debt ratio with
ROA.
Average 2005-2007
Model Summary
Model R R Square Adjusted R
Square
Std. Error of the
Estimate
1 .185a .034 .024 7.480
a. Predictors: (Constant), Debt Ratio Avg. 05-07, Dividend Yield Avg.
05-07, Pay-Out Ratio Avg. 05-07
ANOVAa
Model Sum of Squares df Mean Square F Sig.
1
Regression 541.490 3 180.497 3.226 .023b
Residual 15219.423 272 55.954
Total 15760.913 275
a. Dependent Variable: ROA Avg. 05-07
b. Predictors: (Constant), Debt Ratio Avg. 05-07, Dividend Yield Avg. 05-07, Pay-Out Ratio Avg.
05-07
Coefficientsa
Model Unstandardized Coefficients Standardized
Coefficients
t Sig.
B Std. Error Beta
1
(Constant) 5.287 .935 5.652 .000
Dividend Yield Avg. 05-07 .794 .320 .152 2.478 .014
Pay-Out Ratio Avg. 05-07 -.006 .006 -.084 -1.139 .256
Debt Ratio Avg. 05-07 .004 .002 .137 1.902 .058
a. Dependent Variable: ROA Avg. 05-07

Page | 77
Average 2008-2010
Model Summary
Model R R Square Adjusted R
Square
Std. Error of the
Estimate
1 .114a .013 .002 7.026
a. Predictors: (Constant), Debt Ratio Avg. 08-10, Pay-Out Ratio Avg.
08-10, Dividend Yield Avg. 08-10
ANOVAa
Model Sum of Squares df Mean Square F Sig.
1
Regression 177.192 3 59.064 1.196 .312b
Residual 13427.968 272 49.368
Total 13605.159 275
a. Dependent Variable: ROA Avg. 08-10
b. Predictors: (Constant), Debt Ratio Avg. 08-10, Pay-Out Ratio Avg. 08-10, Dividend Yield Avg.
08-10
Coefficientsa
Model Unstandardized Coefficients Standardized
Coefficients
t Sig.
B Std. Error Beta
1
(Constant) 3.722 .818 4.551 .000
Dividend Yield Avg. 08-10 .389 .214 .117 1.819 .070
Pay-Out Ratio Avg. 08-10 -.003 .005 -.035 -.539 .590
Debt Ratio Avg. 08-10 -.001 .001 -.044 -.732 .464
a. Dependent Variable: ROA Avg. 08-10

Page | 78
Average 2005-2010
Model Summary
Model R R Square Adjusted R
Square
Std. Error of the
Estimate
1 .128a .016 .006 6.312
a. Predictors: (Constant), Debt Ratio Avg. 05-10, Dividend Yield Avg.
05-10, Pay-Out Ratio Avg. 05-10
ANOVAa
Model Sum of Squares df Mean Square F Sig.
1
Regression 184.457 3 61.486 1.543 .204b
Residual 11035.515 277 39.839
Total 11219.972 280
a. Dependent Variable: ROA Avg. 05-10
b. Predictors: (Constant), Debt Ratio Avg. 05-10, Dividend Yield Avg. 05-10, Pay-Out Ratio Avg.
05-10
Coefficientsa
Model Unstandardized Coefficients Standardized
Coefficients
t Sig.
B Std. Error Beta
1
(Constant) 4.590 .795 5.773 .000
Dividend Yield Avg. 05-10 .375 .240 .099 1.561 .120
Pay-Out Ratio Avg. 05-10 .004 .006 .047 .734 .463
Debt Ratio Avg. 05-10 .001 .002 .021 .355 .723
a. Dependent Variable: ROA Avg. 05-10

Page | 79
Appendix (8): Linear regression results from the SPSS model for the
relationship between dividend yield, dividend pay-out ratio and board of
directors’ size with share price volatility.
Average 2005-2007.
ANOVAa
Model Sum of Squares df Mean Square F Sig.
1
Regression 3417.706 3 1139.235 19.448 .000b
Residual 14527.258 248 58.578
Total 17944.964 251
a. Dependent Variable: 360 Volatility Avg. 05-07
b. Predictors: (Constant), Board Size Avg. 05-07, Dividend Yield Avg. 05-07, Pay-Out Ratio Avg.
05-07
Coefficientsa
Model Unstandardized Coefficients Standardized
Coefficients
t Sig.
B Std. Error Beta
1
(Constant) 40.543 2.078 19.515 .000
Dividend Yield Avg. 05-07 -2.259 .343 -.387 -6.594 .000
Pay-Out Ratio Avg. 05-07 .001 .005 .009 .156 .876
Board Size Avg. 05-07 -.703 .204 -.198 -3.455 .001
a. Dependent Variable: 360 Volatility Avg. 05-07
Model Summary
Model R R Square Adjusted R
Square
Std. Error of
the Estimate
1 .436a .190 .181 7.654
a. Predictors: (Constant), Board Size Avg. 05-07, Dividend Yield
Avg. 05-07, Pay-Out Ratio Avg. 05-07
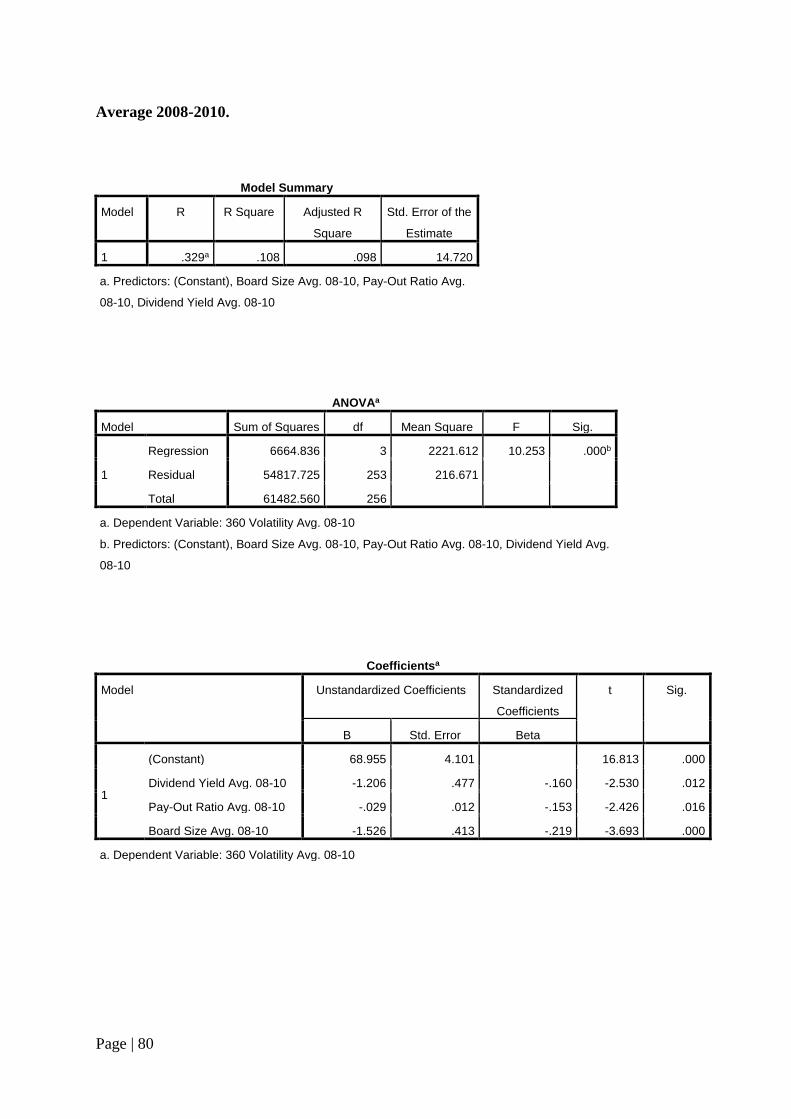
Page | 80
Average 2008-2010.
Model Summary
Model R R Square Adjusted R
Square
Std. Error of the
Estimate
1 .329a .108 .098 14.720
a. Predictors: (Constant), Board Size Avg. 08-10, Pay-Out Ratio Avg.
08-10, Dividend Yield Avg. 08-10
ANOVAa
Model Sum of Squares df Mean Square F Sig.
1
Regression 6664.836 3 2221.612 10.253 .000b
Residual 54817.725 253 216.671
Total 61482.560 256
a. Dependent Variable: 360 Volatility Avg. 08-10
b. Predictors: (Constant), Board Size Avg. 08-10, Pay-Out Ratio Avg. 08-10, Dividend Yield Avg.
08-10
Coefficientsa
Model Unstandardized Coefficients Standardized
Coefficients
t Sig.
B Std. Error Beta
1
(Constant) 68.955 4.101 16.813 .000
Dividend Yield Avg. 08-10 -1.206 .477 -.160 -2.530 .012
Pay-Out Ratio Avg. 08-10 -.029 .012 -.153 -2.426 .016
Board Size Avg. 08-10 -1.526 .413 -.219 -3.693 .000
a. Dependent Variable: 360 Volatility Avg. 08-10

Page | 81
Average 2005-2010
Model Summary
Model R R Square Adjusted R
Square
Std. Error of the
Estimate
1 .394a .155 .145 9.585
a. Predictors: (Constant), Board Size Avg. 05-10, Dividend Yield Avg.
05-10, Pay-Out Ratio Avg. 05-10
ANOVAa
Model Sum of Squares df Mean Square F Sig.
1
Regression 4313.420 3 1437.807 15.650 .000b
Residual 23519.545 256 91.873
Total 27832.965 259
a. Dependent Variable: 360 Volatility Avg. 05-10
b. Predictors: (Constant), Board Size Avg. 05-10, Dividend Yield Avg. 05-10, Pay-Out Ratio Avg.
05-10
Coefficientsa
Model Unstandardized Coefficients Standardized
Coefficients
t Sig.
B Std. Error Beta
1
(Constant) 55.663 2.736 20.344 .000
Dividend Yield Avg. 05-10 -1.596 .387 -.250 -4.119 .000
Pay-Out Ratio Avg. 05-10 -.018 .009 -.120 -1.967 .050
Board Size Avg. 05-10 -1.204 .270 -.257 -4.461 .000
a. Dependent Variable: 360 Volatility Avg. 05-10

Page | 82
Appendix (9): Linear regression results from the SPSS model for the
relationship between dividend yield, dividend pay-out ratio and board of
directors’ size with Tobin Q.
Average 2005-2007
Model Summary
Model R R Square Adjusted R
Square
Std. Error of the
Estimate
1 .231a .053 .042 .941
a. Predictors: (Constant), Board Size Avg. 05-07, Dividend Yield Avg.
05-07, Pay-Out Ratio Avg. 05-07
ANOVAa
Model Sum of Squares df Mean Square F Sig.
1
Regression 12.292 3 4.097 4.628 .004b
Residual 218.672 247 .885
Total 230.964 250
a. Dependent Variable: Tobin Q's Avg. 05-07
b. Predictors: (Constant), Board Size Avg. 05-07, Dividend Yield Avg. 05-07, Pay-Out Ratio Avg.
05-07
Coefficientsa
Model Unstandardized Coefficients Standardized
Coefficients
t Sig.
B Std. Error Beta
1
(Constant) 2.441 .256 9.549 .000
Dividend Yield Avg. 05-07 -.156 .042 -.235 -3.688 .000
Pay-Out Ratio Avg. 05-07 .000 .001 .030 .465 .642
Board Size Avg. 05-07 -.006 .025 -.016 -.259 .796
a. Dependent Variable: Tobin Q's Avg. 05-07

Page | 83
Average 2008-2010.
Model Summary
Model R R Square Adjusted R
Square
Std. Error of the
Estimate
1 .246a .060 .049 .722
a. Predictors: (Constant), Board Size Avg. 08-10, Pay-Out Ratio Avg.
08-10, Dividend Yield Avg. 08-10
ANOVAa
Model Sum of Squares df Mean Square F Sig.
1
Regression 8.459 3 2.820 5.413 .001b
Residual 131.790 253 .521
Total 140.249 256
a. Dependent Variable: Tobin Q's Avg. 08-10
b. Predictors: (Constant), Board Size Avg. 08-10, Pay-Out Ratio Avg. 08-10, Dividend Yield Avg.
08-10
Coefficientsa
Model Unstandardized Coefficients Standardized
Coefficients
t Sig.
B Std. Error Beta
1
(Constant) 1.774 .201 8.822 .000
Dividend Yield Avg. 08-10 -.094 .023 -.260 -4.022 .000
Pay-Out Ratio Avg. 08-10 .001 .001 .076 1.176 .241
Board Size Avg. 08-10 .001 .020 .002 .029 .977
a. Dependent Variable: Tobin Q's Avg. 08-10

Page | 84
Average 2005-2010.
Model Summary
Model R R Square Adjusted R
Square
Std. Error of the
Estimate
1 .261a .068 .057 .829
a. Predictors: (Constant), Board Size Avg. 05-10, Dividend Yield Avg.
05-10, Pay-Out Ratio Avg. 05-10
ANOVAa
Model Sum of Squares df Mean Square F Sig.
1
Regression 12.836 3 4.279 6.220 .000b
Residual 176.102 256 .688
Total 188.938 259
a. Dependent Variable: Tobin Q's Avg. 05-10
b. Predictors: (Constant), Board Size Avg. 05-10, Dividend Yield Avg. 05-10, Pay-Out Ratio Avg.
05-10
Coefficientsa
Model Unstandardized Coefficients Standardized
Coefficients
t Sig.
B Std. Error Beta
1
(Constant) 2.083 .237 8.799 .000
Dividend Yield Avg. 05-10 -.145 .034 -.275 -4.312 .000
Pay-Out Ratio Avg. 05-10 .001 .001 .104 1.626 .105
Board Size Avg. 05-10 -.001 .023 -.002 -.036 .971
a. Dependent Variable: Tobin Q's Avg. 05-10

Page | 85
Appendix (10): Linear regression results from the SPSS model for the
relationship between dividend yield, dividend pay-out ratio and board of
directors’ size with ROA.
Average 2005-2007.
Model Summary
Model R R Square Adjusted R
Square
Std. Error of the
Estimate
1 .145a .021 .009 7.563
a. Predictors: (Constant), Board Size Avg. 05-07, Dividend Yield Avg.
05-07, Pay-Out Ratio Avg. 05-07
ANOVAa
Model Sum of Squares df Mean Square F Sig.
1
Regression 302.547 3 100.849 1.763 .155b
Residual 14127.612 247 57.197
Total 14430.159 250
a. Dependent Variable: ROA Avg. 05-07
b. Predictors: (Constant), Board Size Avg. 05-07, Dividend Yield Avg. 05-07, Pay-Out Ratio Avg.
05-07
Coefficientsa
Model Unstandardized Coefficients Standardized
Coefficients
t Sig.
B Std. Error Beta
1
(Constant) 3.792 2.054 1.846 .066
Dividend Yield Avg. 05-07 .649 .341 .123 1.906 .058
Pay-Out Ratio Avg. 05-07 4.904E-005 .005 .001 .010 .992
Board Size Avg. 05-07 .234 .201 .073 1.160 .247
a. Dependent Variable: ROA Avg. 05-07

Page | 86
Average 2008-2010.
Model Summary
Model R R Square Adjusted R
Square
Std. Error of the
Estimate
1 .116a .014 .002 7.039
a. Predictors: (Constant), Board Size Avg. 08-10, Pay-Out Ratio Avg.
08-10, Dividend Yield Avg. 08-10
ANOVAa
Model Sum of Squares df Mean Square F Sig.
1
Regression 171.415 3 57.138 1.153 .328b
Residual 12487.319 252 49.553
Total 12658.734 255
a. Dependent Variable: ROA Avg. 08-10
b. Predictors: (Constant), Board Size Avg. 08-10, Pay-Out Ratio Avg. 08-10, Dividend Yield Avg.
08-10
Coefficientsa
Model Unstandardized Coefficients Standardized
Coefficients
t Sig.
B Std. Error Beta
1
(Constant) 2.508 1.963 1.278 .203
Dividend Yield Avg. 08-10 .359 .229 .104 1.570 .118
Pay-Out Ratio Avg. 08-10 .001 .006 .011 .163 .870
Board Size Avg. 08-10 .146 .198 .046 .734 .463
a. Dependent Variable: ROA Avg. 08-10

Page | 87
Average 2005-2010.
Model Summary
Model R R Square Adjusted R
Square
Std. Error of the
Estimate
1 .132a .017 .006 6.324
a. Predictors: (Constant), Board Size Avg. 05-10, Dividend Yield Avg.
05-10, Pay-Out Ratio Avg. 05-10
ANOVAa
Model Sum of Squares df Mean Square F Sig.
1
Regression 180.943 3 60.314 1.508 .213b
Residual 10199.813 255 39.999
Total 10380.757 258
a. Dependent Variable: ROA Avg. 05-10
b. Predictors: (Constant), Board Size Avg. 05-10, Dividend Yield Avg. 05-10, Pay-Out Ratio Avg.
05-10
Coefficientsa
Model Unstandardized Coefficients Standardized
Coefficients
t Sig.
B Std. Error Beta
1
(Constant) 3.196 1.805 1.771 .078
Dividend Yield Avg. 05-10 .302 .258 .077 1.173 .242
Pay-Out Ratio Avg. 05-10 .006 .006 .062 .942 .347
Board Size Avg. 05-10 .211 .178 .074 1.183 .238
a. Dependent Variable: ROA Avg. 05-10

Page | 88
Appendix (11): Linear regression results from the SPSS model for the
relationship between dividend yield, dividend pay-out ratio and market
capitalisation with share price volatility.
Average 2005-2007
Model Summary
Model R R Square Adjusted R
Square
Std. Error of the
Estimate
1 .427a .182 .174 7.758
a. Predictors: (Constant), Market Cap. Avg. 05-07, Pay-Out Ratio Avg.
05-07, Dividend Yield Avg. 05-07
ANOVAa
Model Sum of Squares df Mean Square F Sig.
1
Regression 3731.537 3 1243.846 20.668 .000b
Residual 16730.378 278 60.181
Total 20461.915 281
a. Dependent Variable: 360 Volatility Avg. 05-07
b. Predictors: (Constant), Market Cap. Avg. 05-07, Pay-Out Ratio Avg. 05-07, Dividend Yield
Avg. 05-07
Coefficientsa
Model Unstandardized Coefficients Standardized
Coefficients
t Sig.
B Std. Error Beta
1
(Constant) 34.796 .952 36.563 .000
Dividend Yield Avg. 05-07 -2.213 .326 -.380 -6.780 .000
Pay-Out Ratio Avg. 05-07 .001 .005 .013 .240 .811
Market Cap. Avg. 05-07 .000 .000 -.183 -3.375 .001
a. Dependent Variable: 360 Volatility Avg. 05-07

Page | 89
Average 2008-2010.
Model Summary
Model R R Square Adjusted R
Square
Std. Error of the
Estimate
1 .245a .060 .050 15.798
a. Predictors: (Constant), Market Cap. Avg. 08-10, Pay-Out Ratio Avg.
08-10, Dividend Yield Avg. 08-10
ANOVAa
Model Sum of Squares df Mean Square F Sig.
1
Regression 4404.327 3 1468.109 5.882 .001b
Residual 69135.922 277 249.588
Total 73540.249 280
a. Dependent Variable: 360 Volatility Avg. 08-10
b. Predictors: (Constant), Market Cap. Avg. 08-10, Pay-Out Ratio Avg. 08-10, Dividend Yield
Avg. 08-10
Coefficientsa
Model Unstandardized Coefficients Standardized
Coefficients
t Sig.
B Std. Error Beta
1
(Constant) 55.779 1.818 30.684 .000
Dividend Yield Avg. 08-10 -.976 .470 -.128 -2.076 .039
Pay-Out Ratio Avg. 08-10 -.018 .012 -.090 -1.458 .146
Market Cap. Avg. 08-10 .000 .000 -.163 -2.794 .006
a. Dependent Variable: 360 Volatility Avg. 08-10

Page | 90
Average 2005-2010.
Model Summary
Model R R Square Adjusted R
Square
Std. Error of the
Estimate
1 .340a .115 .106 10.084
a. Predictors: (Constant), Market Cap. Avg. 05-10, Dividend Yield Avg.
05-10, Pay-Out Ratio Avg. 05-10
ANOVAa
Model Sum of Squares df Mean Square F Sig.
1
Regression 3703.905 3 1234.635 12.142 .000b
Residual 28370.201 279 101.685
Total 32074.106 282
a. Dependent Variable: 360 Volatility Avg. 05-10
b. Predictors: (Constant), Market Cap. Avg. 05-10, Dividend Yield Avg. 05-10, Pay-Out Ratio
Avg. 05-10
Coefficientsa
Model Unstandardized Coefficients Standardized
Coefficients
t Sig.
B Std. Error Beta
1
(Constant) 45.476 1.262 36.047 .000
Dividend Yield Avg. 05-10 -1.423 .381 -.224 -3.732 .000
Pay-Out Ratio Avg. 05-10 -.015 .010 -.096 -1.607 .110
Market Cap. Avg. 05-10 .000 .000 -.200 -3.551 .000
a. Dependent Variable: 360 Volatility Avg. 05-10

Page | 91
Appendix (12): Linear regression results from the SPSS model for the
relationship between dividend yield, dividend pay-out ratio and market
capitalisation with Tobin Q.
Average 2005-2007
Model Summary
Model R R Square Adjusted R
Square
Std. Error of the
Estimate
1 .235a .055 .045 .915
a. Predictors: (Constant), Market Cap. Avg. 05-07, Pay-Out Ratio Avg.
05-07, Dividend Yield Avg. 05-07
ANOVAa
Model Sum of Squares df Mean Square F Sig.
1
Regression 13.542 3 4.514 5.397 .001b
Residual 230.854 276 .836
Total 244.396 279
a. Dependent Variable: Tobin Q's Avg. 05-07
b. Predictors: (Constant), Market Cap. Avg. 05-07, Pay-Out Ratio Avg. 05-07, Dividend Yield
Avg. 05-07
Coefficientsa
Model Unstandardized Coefficients Standardized
Coefficients
t Sig.
B Std. Error Beta
1
(Constant) 2.284 .114 20.063 .000
Dividend Yield Avg. 05-07 -.147 .039 -.229 -3.783 .000
Pay-Out Ratio Avg. 05-07 .000 .001 .045 .747 .456
Market Cap. Avg. 05-07 7.086E-006 .000 .092 1.564 .119
a. Dependent Variable: Tobin Q's Avg. 05-07

Page | 92
Average 2008-2010.
Model Summary
Model R R Square Adjusted R
Square
Std. Error of the
Estimate
1 .264a .070 .060 .700
a. Predictors: (Constant), Market Cap. Avg. 08-10, Pay-Out Ratio Avg.
08-10, Dividend Yield Avg. 08-10
ANOVAa
Model Sum of Squares df Mean Square F Sig.
1
Regression 10.212 3 3.404 6.944 .000b
Residual 135.781 277 .490
Total 145.993 280
a. Dependent Variable: Tobin Q's Avg. 08-10
b. Predictors: (Constant), Market Cap. Avg. 08-10, Pay-Out Ratio Avg. 08-10, Dividend Yield
Avg. 08-10
Coefficientsa
Model Unstandardized Coefficients Standardized
Coefficients
t Sig.
B Std. Error Beta
1
(Constant) 1.711 .081 21.241 .000
Dividend Yield Avg. 08-10 -.087 .021 -.256 -4.160 .000
Pay-Out Ratio Avg. 08-10 .000 .001 .055 .900 .369
Market Cap. Avg. 08-10 6.438E-006 .000 .113 1.950 .052
a. Dependent Variable: Tobin Q's Avg. 08-10

Page | 93
Average 2005-2010.
Model Summary
Model R R Square Adjusted R
Square
Std. Error of the
Estimate
1 .269a .072 .062 .809
a. Predictors: (Constant), Market Cap. Avg. 05-10, Dividend Yield Avg.
05-10, Pay-Out Ratio Avg. 05-10
ANOVAa
Model Sum of Squares df Mean Square F Sig.
1
Regression 14.253 3 4.751 7.253 .000b
Residual 182.758 279 .655
Total 197.011 282
a. Dependent Variable: Tobin Q's Avg. 05-10
b. Predictors: (Constant), Market Cap. Avg. 05-10, Dividend Yield Avg. 05-10, Pay-Out Ratio
Avg. 05-10
Coefficientsa
Model Unstandardized Coefficients Standardized
Coefficients
t Sig.
B Std. Error Beta
1
(Constant) 1.988 .101 19.631 .000
Dividend Yield Avg. 05-10 -.135 .031 -.270 -4.398 .000
Pay-Out Ratio Avg. 05-10 .001 .001 .104 1.697 .091
Market Cap. Avg. 05-10 6.740E-006 .000 .099 1.710 .088
a. Dependent Variable: Tobin Q's Avg. 05-10

Page | 94
Appendix (13): Linear regression results from the SPSS model for the
relationship between dividend yield, dividend pay-out ratio and market
capitalisation with ROA.
Average 2005-2007.
Model Summary
Model R R Square Adjusted R
Square
Std. Error of the
Estimate
1 .196a .038 .028 7.431
a. Predictors: (Constant), Market Cap. Avg. 05-07, Pay-Out Ratio Avg.
05-07, Dividend Yield Avg. 05-07
ANOVAa
Model Sum of Squares df Mean Square F Sig.
1
Regression 609.355 3 203.118 3.678 .013b
Residual 15242.016 276 55.225
Total 15851.371 279
a. Dependent Variable: ROA Avg. 05-07
b. Predictors: (Constant), Market Cap. Avg. 05-07, Pay-Out Ratio Avg. 05-07, Dividend Yield
Avg. 05-07
Coefficientsa
Model Unstandardized Coefficients Standardized
Coefficients
t Sig.
B Std. Error Beta
1
(Constant) 5.100 .925 5.513 .000
Dividend Yield Avg. 05-07 .746 .316 .144 2.360 .019
Pay-Out Ratio Avg. 05-07 9.418E-005 .005 .001 .020 .984
Market Cap. Avg. 05-07 7.861E-005 .000 .126 2.136 .034
a. Dependent Variable: ROA Avg. 05-07

Page | 95
Average 2008-2010.
Model Summary
Model R R Square Adjusted R
Square
Std. Error of the
Estimate
1 .185a .034 .024 6.951
a. Predictors: (Constant), Market Cap. Avg. 08-10, Pay-Out Ratio Avg.
08-10, Dividend Yield Avg. 08-10
ANOVAa
Model Sum of Squares df Mean Square F Sig.
1
Regression 474.222 3 158.074 3.272 .022b
Residual 13335.688 276 48.318
Total 13809.911 279
a. Dependent Variable: ROA Avg. 08-10
b. Predictors: (Constant), Market Cap. Avg. 08-10, Pay-Out Ratio Avg. 08-10, Dividend Yield
Avg. 08-10
Coefficientsa
Model Unstandardized Coefficients Standardized
Coefficients
t Sig.
B Std. Error Beta
1
(Constant) 3.243 .802 4.042 .000
Dividend Yield Avg. 08-10 .398 .208 .121 1.916 .056
Pay-Out Ratio Avg. 08-10 -.003 .005 -.033 -.521 .603
Market Cap. Avg. 08-10 7.878E-005 .000 .142 2.403 .017
a. Dependent Variable: ROA Avg. 08-10

Page | 96
Average 2005-2010.
Model Summary
Model R R Square Adjusted R
Square
Std. Error of the
Estimate
1 .206a .042 .032 6.217
a. Predictors: (Constant), Market Cap. Avg. 05-10, Dividend Yield Avg.
05-10, Pay-Out Ratio Avg. 05-10
ANOVAa
Model Sum of Squares df Mean Square F Sig.
1
Regression 474.387 3 158.129 4.091 .007b
Residual 10746.464 278 38.656
Total 11220.851 281
a. Dependent Variable: ROA Avg. 05-10
b. Predictors: (Constant), Market Cap. Avg. 05-10, Dividend Yield Avg. 05-10, Pay-Out Ratio
Avg. 05-10
Coefficientsa
Model Unstandardized Coefficients Standardized
Coefficients
t Sig.
B Std. Error Beta
1
(Constant) 4.329 .783 5.528 .000
Dividend Yield Avg. 05-10 .356 .237 .094 1.503 .134
Pay-Out Ratio Avg. 05-10 .005 .006 .056 .899 .370
Market Cap. Avg. 05-10 8.367E-005 .000 .162 2.764 .006
a. Dependent Variable: ROA Avg. 05-10

Page | 97
Appendix (14): Linear regression results from the SPSS model for the
relationship between dividend yield, dividend pay-out ratio and industry type
with share price volatility.
Average 2005-2007.
Model Summary
Model R R Square Adjusted R
Square
Std. Error of the
Estimate
1 .387a .150 .141 7.910
a. Predictors: (Constant), Industries , Pay-Out Ratio Avg. 05-07,
Dividend Yield Avg. 05-07
ANOVAa
Model Sum of Squares df Mean Square F Sig.
1
Regression 3066.149 3 1022.050 16.333 .000b
Residual 17395.766 278 62.575
Total 20461.915 281
a. Dependent Variable: 360 Volatility Avg. 05-07
b. Predictors: (Constant), Industries , Pay-Out Ratio Avg. 05-07, Dividend Yield Avg. 05-07
Coefficientsa
Model Unstandardized Coefficients Standardized
Coefficients
t Sig.
B Std. Error Beta
1
(Constant) 35.032 1.491 23.492 .000
Dividend Yield Avg. 05-07 -2.287 .333 -.393 -6.867 .000
Pay-Out Ratio Avg. 05-07 .002 .005 .024 .416 .678
Industries -.147 .258 -.032 -.569 .570
a. Dependent Variable: 360 Volatility Avg. 05-07

Page | 98
Average 2008-2010.
Model Summary
Model R R Square Adjusted R
Square
Std. Error of the
Estimate
1 .277a .077 .067 15.656
a. Predictors: (Constant), Pay-Out Ratio Avg. 08-10, Industries ,
Dividend Yield Avg. 08-10
ANOVAa
Model Sum of Squares df Mean Square F Sig.
1
Regression 5643.182 3 1881.061 7.674 .000b
Residual 67897.067 277 245.116
Total 73540.249 280
a. Dependent Variable: 360 Volatility Avg. 08-10
b. Predictors: (Constant), Pay-Out Ratio Avg. 08-10, Industries , Dividend Yield Avg. 08-10
Coefficientsa
Model Unstandardized Coefficients Standardized
Coefficients
t Sig.
B Std. Error Beta
1
(Constant) 62.557 2.743 22.809 .000
Industries -1.847 .512 -.209 -3.606 .000
Dividend Yield Avg. 08-10 -.878 .467 -.115 -1.878 .062
Pay-Out Ratio Avg. 08-10 -.020 .012 -.101 -1.640 .102
a. Dependent Variable: 360 Volatility Avg. 08-10

Page | 99
Average 2005-2010.
Model Summary
Model R R Square Adjusted R
Square
Std. Error of the
Estimate
1 .319a .102 .092 10.163
a. Predictors: (Constant), Pay-Out Ratio Avg. 05-10, Industries ,
Dividend Yield Avg. 05-10
ANOVAa
Model Sum of Squares df Mean Square F Sig.
1
Regression 3257.445 3 1085.815 10.513 .000b
Residual 28816.661 279 103.286
Total 32074.106 282
a. Dependent Variable: 360 Volatility Avg. 05-10
b. Predictors: (Constant), Pay-Out Ratio Avg. 05-10, Industries , Dividend Yield Avg. 05-10
Coefficientsa
Model Unstandardized Coefficients Standardized
Coefficients
t Sig.
B Std. Error Beta
1
(Constant) 48.712 1.855 26.259 .000
Industries -.941 .331 -.162 -2.844 .005
Dividend Yield Avg. 05-10 -1.417 .385 -.223 -3.683 .000
Pay-Out Ratio Avg. 05-10 -.015 .010 -.093 -1.537 .125
a. Dependent Variable: 360 Volatility Avg. 05-10

Page | 100
Appendix (15): Linear regression results from the SPSS model for the
relationship between dividend yield, dividend pay-out ratio and industry type
with Tobin Q.
Average 2005-2007.
Model Summary
Model R R Square Adjusted R
Square
Std. Error of the
Estimate
1 .230a .053 .043 .916
a. Predictors: (Constant), Industries , Pay-Out Ratio Avg. 05-07,
Dividend Yield Avg. 05-07
ANOVAa
Model Sum of Squares df Mean Square F Sig.
1
Regression 12.937 3 4.312 5.142 .002b
Residual 231.460 276 .839
Total 244.396 279
a. Dependent Variable: Tobin Q's Avg. 05-07
b. Predictors: (Constant), Industries , Pay-Out Ratio Avg. 05-07, Dividend Yield Avg. 05-07
Coefficientsa
Model Unstandardized Coefficients Standardized
Coefficients
t Sig.
B Std. Error Beta
1
(Constant) 2.133 .174 12.275 .000
Dividend Yield Avg. 05-07 -.141 .039 -.219 -3.616 .000
Pay-Out Ratio Avg. 05-07 .000 .001 .038 .624 .533
Industries .039 .030 .077 1.311 .191
a. Dependent Variable: Tobin Q's Avg. 05-07
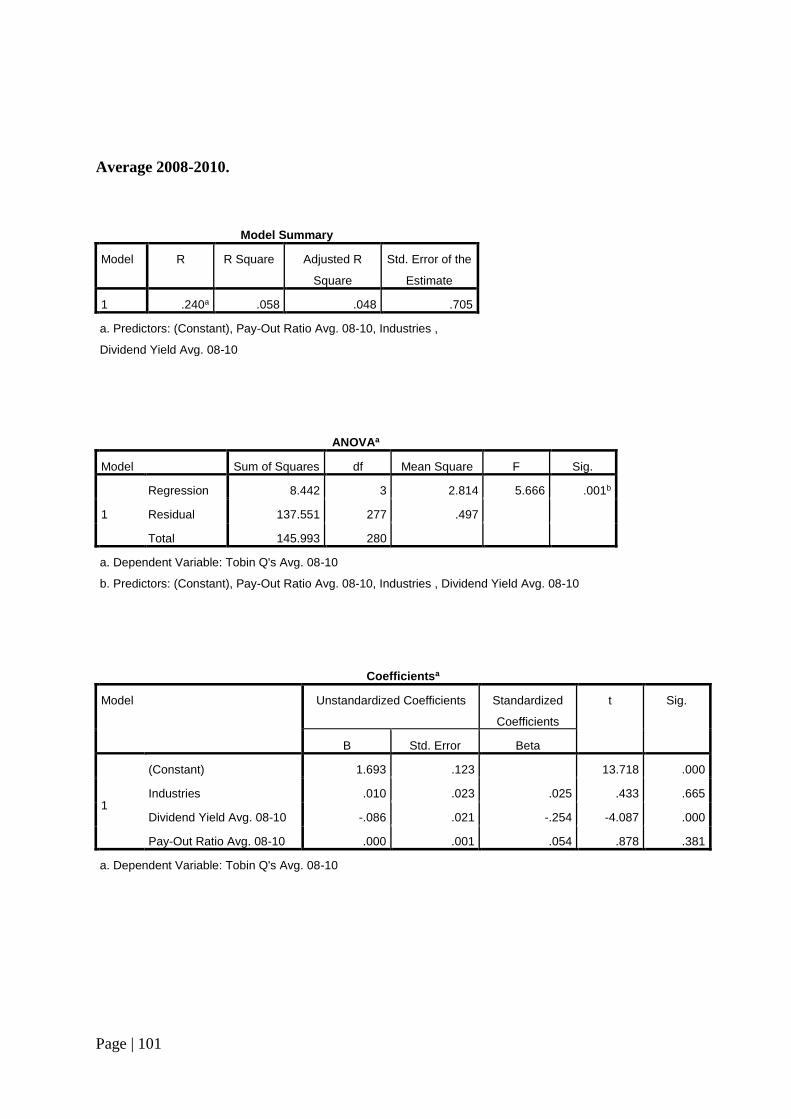
Page | 101
Average 2008-2010.
Model Summary
Model R R Square Adjusted R
Square
Std. Error of the
Estimate
1 .240a .058 .048 .705
a. Predictors: (Constant), Pay-Out Ratio Avg. 08-10, Industries ,
Dividend Yield Avg. 08-10
ANOVAa
Model Sum of Squares df Mean Square F Sig.
1
Regression 8.442 3 2.814 5.666 .001b
Residual 137.551 277 .497
Total 145.993 280
a. Dependent Variable: Tobin Q's Avg. 08-10
b. Predictors: (Constant), Pay-Out Ratio Avg. 08-10, Industries , Dividend Yield Avg. 08-10
Coefficientsa
Model Unstandardized Coefficients Standardized
Coefficients
t Sig.
B Std. Error Beta
1
(Constant) 1.693 .123 13.718 .000
Industries .010 .023 .025 .433 .665
Dividend Yield Avg. 08-10 -.086 .021 -.254 -4.087 .000
Pay-Out Ratio Avg. 08-10 .000 .001 .054 .878 .381
a. Dependent Variable: Tobin Q's Avg. 08-10

Page | 102
Average 2005-2010.
Model Summary
Model R R Square Adjusted R
Square
Std. Error of the
Estimate
1 .261a .068 .058 .811
a. Predictors: (Constant), Pay-Out Ratio Avg. 05-10, Industries ,
Dividend Yield Avg. 05-10
ANOVAa
Model Sum of Squares df Mean Square F Sig.
1
Regression 13.422 3 4.474 6.799 .000b
Residual 183.589 279 .658
Total 197.011 282
a. Dependent Variable: Tobin Q's Avg. 05-10
b. Predictors: (Constant), Pay-Out Ratio Avg. 05-10, Industries , Dividend Yield Avg. 05-10
Coefficientsa
Model Unstandardized Coefficients Standardized
Coefficients
t Sig.
B Std. Error Beta
1
(Constant) 1.873 .148 12.648 .000
Industries .034 .026 .074 1.284 .200
Dividend Yield Avg. 05-10 -.135 .031 -.271 -4.389 .000
Pay-Out Ratio Avg. 05-10 .001 .001 .102 1.663 .097
a. Dependent Variable: Tobin Q's Avg. 05-10

Page | 103
Appendix (16): Linear regression results from the SPSS model for the
relationship between dividend yield, dividend pay-out ratio and industry type
with ROA.
Average 2005-2007.
Model Summary
Model R R Square Adjusted R
Square
Std. Error of the
Estimate
1 .152a .023 .012 7.491
a. Predictors: (Constant), Pay-Out Ratio Avg. 05-07, Industries ,
Dividend Yield Avg. 05-07
ANOVAa
Model Sum of Squares df Mean Square F Sig.
1
Regression 364.220 3 121.407 2.164 .093b
Residual 15487.151 276 56.113
Total 15851.371 279
a. Dependent Variable: ROA Avg. 05-07
b. Predictors: (Constant), Pay-Out Ratio Avg. 05-07, Industries , Dividend Yield Avg. 05-07
Coefficientsa
Model Unstandardized Coefficients Standardized
Coefficients
t Sig.
B Std. Error Beta
1
(Constant) 5.720 1.421 4.024 .000
Industries -.086 .246 -.021 -.348 .728
Dividend Yield Avg. 05-07 .778 .318 .150 2.443 .015
Pay-Out Ratio Avg. 05-07 .000 .005 -.004 -.070 .944
a. Dependent Variable: ROA Avg. 05-07
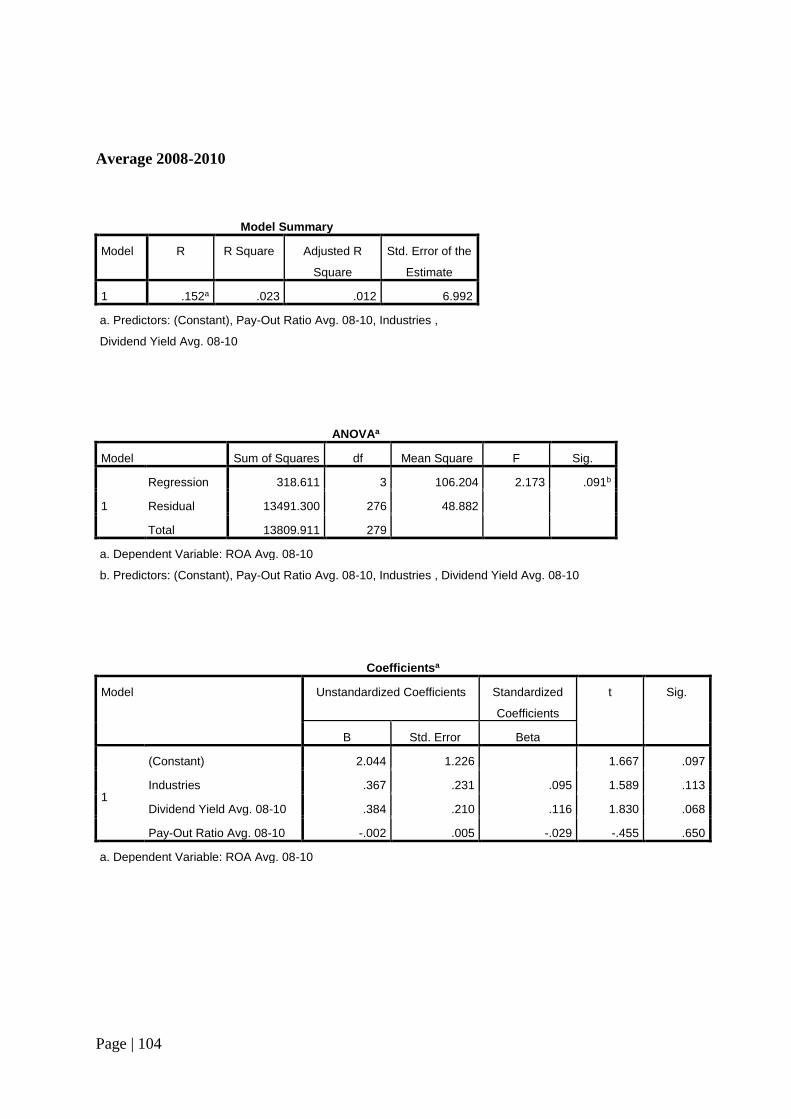
Page | 104
Average 2008-2010
Model Summary
Model R R Square Adjusted R
Square
Std. Error of the
Estimate
1 .152a .023 .012 6.992
a. Predictors: (Constant), Pay-Out Ratio Avg. 08-10, Industries ,
Dividend Yield Avg. 08-10
ANOVAa
Model Sum of Squares df Mean Square F Sig.
1
Regression 318.611 3 106.204 2.173 .091b
Residual 13491.300 276 48.882
Total 13809.911 279
a. Dependent Variable: ROA Avg. 08-10
b. Predictors: (Constant), Pay-Out Ratio Avg. 08-10, Industries , Dividend Yield Avg. 08-10
Coefficientsa
Model Unstandardized Coefficients Standardized
Coefficients
t Sig.
B Std. Error Beta
1
(Constant) 2.044 1.226 1.667 .097
Industries .367 .231 .095 1.589 .113
Dividend Yield Avg. 08-10 .384 .210 .116 1.830 .068
Pay-Out Ratio Avg. 08-10 -.002 .005 -.029 -.455 .650
a. Dependent Variable: ROA Avg. 08-10

Page | 105
Average 2005-2010.
Model Summary
Model R R Square Adjusted R
Square
Std. Error of the
Estimate
1 .131a .017 .007 6.298
a. Predictors: (Constant), Pay-Out Ratio Avg. 05-10, Industries ,
Dividend Yield Avg. 05-10
ANOVAa
Model Sum of Squares df Mean Square F Sig.
1
Regression 192.393 3 64.131 1.617 .186b
Residual 11028.458 278 39.671
Total 11220.851 281
a. Dependent Variable: ROA Avg. 05-10
b. Predictors: (Constant), Pay-Out Ratio Avg. 05-10, Industries , Dividend Yield Avg. 05-10
Coefficientsa
Model Unstandardized Coefficients Standardized
Coefficients
t Sig.
B Std. Error Beta
1
(Constant) 4.148 1.150 3.608 .000
Industries .119 .207 .034 .578 .564
Dividend Yield Avg. 05-10 .371 .240 .098 1.546 .123
Pay-Out Ratio Avg. 05-10 .005 .006 .050 .794 .428
a. Dependent Variable: ROA Avg. 05-10

Page | 106
Appendix (17): Linear regression results from the SPSS model for the
relationship between dividend yield, dividend pay-out ratio, industry type, board
of directors’ size, market capitalisation and debt ratio with share price volatility.
Average 2005-2007.
Model Summary
Model R R Square Adjusted R
Square
Std. Error of the
Estimate
1 .450a .203 .183 7.565
a. Predictors: (Constant), Dividend Yield Avg. 05-07, Board Size Avg.
05-07, Industries , Debt Ratio Avg. 05-07, Market Cap. Avg. 05-07,
Pay-Out Ratio Avg. 05-07
ANOVAa
Model Sum of Squares df Mean Square F Sig.
1
Regression 3488.878 6 581.480 10.160 .000b
Residual 13736.401 240 57.235
Total 17225.279 246
a. Dependent Variable: 360 Volatility Avg. 05-07
b. Predictors: (Constant), Dividend Yield Avg. 05-07, Board Size Avg. 05-07, Industries , Debt
Ratio Avg. 05-07, Market Cap. Avg. 05-07, Pay-Out Ratio Avg. 05-07
Coefficientsa
Model Unstandardized Coefficients Standardized
Coefficients
t Sig.
B Std. Error Beta
1
(Constant) 39.954 2.662 15.012 .000
Pay-Out Ratio Avg. 05-07 .002 .006 .027 .369 .712
Industries -.328 .265 -.072 -1.240 .216
Market Cap. Avg. 05-07 -8.347E-005 .000 -.128 -1.863 .064
Board Size Avg. 05-07 -.451 .243 -.129 -1.859 .064
Debt Ratio Avg. 05-07 -.001 .002 -.030 -.427 .670
Dividend Yield Avg. 05-07 -2.224 .345 -.382 -6.452 .000
a. Dependent Variable: 360 Volatility Avg. 05-07

Page | 107
Average 2008-2010.
Model Summary
Model R R Square Adjusted R
Square
Std. Error of the
Estimate
1 .415a .172 .152 14.303
a. Predictors: (Constant), Dividend Yield Avg. 08-10, Board Size Avg.
08-10, Industries , Debt Ratio Avg. 08-10, Pay-Out Ratio Avg. 08-10,
Market Cap. Avg. 08-10
ANOVAa
Model Sum of Squares df Mean Square F Sig.
1
Regression 10487.654 6 1747.942 8.545 .000b
Residual 50528.366 247 204.568
Total 61016.020 253
a. Dependent Variable: 360 Volatility Avg. 08-10
b. Predictors: (Constant), Dividend Yield Avg. 08-10, Board Size Avg. 08-10, Industries , Debt
Ratio Avg. 08-10, Pay-Out Ratio Avg. 08-10, Market Cap. Avg. 08-10
Coefficientsa
Model Unstandardized Coefficients Standardized
Coefficients
t Sig.
B Std. Error Beta
1
(Constant) 75.676 4.873 15.529 .000
Industries -2.065 .490 -.246 -4.211 .000
Board Size Avg. 08-10 -1.263 .472 -.182 -2.677 .008
Pay-Out Ratio Avg. 08-10 -.030 .012 -.160 -2.590 .010
Market Cap. Avg. 08-10 .000 .000 -.098 -1.453 .148
Debt Ratio Avg. 08-10 .000 .003 .007 .111 .912
Dividend Yield Avg. 08-10 -1.100 .475 -.145 -2.314 .021
a. Dependent Variable: 360 Volatility Avg. 08-10

Page | 108
Average 2005-2010.
Model Summary
Model R R Square Adjusted R
Square
Std. Error of the
Estimate
1 .453a .205 .186 9.358
a. Predictors: (Constant), Dividend Yield Avg. 05-10, Board Size Avg.
05-10, Industries , Debt Ratio Avg. 05-10, Pay-Out Ratio Avg. 05-10,
Market Cap. Avg. 05-10
ANOVAa
Model Sum of Squares df Mean Square F Sig.
1
Regression 5697.588 6 949.598 10.843 .000b
Residual 22069.702 252 87.578
Total 27767.290 258
a. Dependent Variable: 360 Volatility Avg. 05-10
b. Predictors: (Constant), Dividend Yield Avg. 05-10, Board Size Avg. 05-10, Industries , Debt
Ratio Avg. 05-10, Pay-Out Ratio Avg. 05-10, Market Cap. Avg. 05-10
Coefficientsa
Model Unstandardized Coefficients Standardized
Coefficients
t Sig.
B Std. Error Beta
1
(Constant) 59.326 3.326 17.839 .000
Industries -1.172 .318 -.209 -3.685 .000
Board Size Avg. 05-10 -1.018 .318 -.218 -3.202 .002
Pay-Out Ratio Avg. 05-10 -.019 .009 -.125 -2.077 .039
Market Cap. Avg. 05-10 -8.947E-005 .000 -.110 -1.641 .102
Debt Ratio Avg. 05-10 -.001 .002 -.021 -.369 .713
Dividend Yield Avg. 05-10 -1.496 .380 -.235 -3.933 .000
a. Dependent Variable: 360 Volatility Avg. 05-10

Page | 109
Appendix (18): Linear regression results from the SPSS model for the
relationship between dividend yield, dividend pay-out ratio, industry type, board
of directors’ size, market capitalisation and debt ratio with Tobin Q.
Average 2005-2007.
Model Summary
Model R R Square Adjusted R
Square
Std. Error of the
Estimate
1 .292a .085 .063 .938
a. Predictors: (Constant), Dividend Yield Avg. 05-07, Board Size Avg.
05-07, Industries , Debt Ratio Avg. 05-07, Market Cap. Avg. 05-07,
Pay-Out Ratio Avg. 05-07
ANOVAa
Model Sum of Squares df Mean Square F Sig.
1
Regression 19.720 6 3.287 3.734 .001b
Residual 211.243 240 .880
Total 230.964 246
a. Dependent Variable: Tobin Q's Avg. 05-07
b. Predictors: (Constant), Dividend Yield Avg. 05-07, Board Size Avg. 05-07, Industries , Debt
Ratio Avg. 05-07, Market Cap. Avg. 05-07, Pay-Out Ratio Avg. 05-07
Coefficientsa
Model Unstandardized Coefficients Standardized
Coefficients
t Sig.
B Std. Error Beta
1
(Constant) 2.551 .330 7.730 .000
Industries .037 .033 .071 1.140 .256
Market Cap. Avg. 05-07 1.094E-005 .000 .145 1.968 .050
Board Size Avg. 05-07 -.042 .030 -.105 -1.404 .162
Pay-Out Ratio Avg. 05-07 .000 .001 -.053 -.689 .491
Debt Ratio Avg. 05-07 .000 .000 .145 1.918 .056
Dividend Yield Avg. 05-07 -.160 .043 -.238 -3.747 .000
a. Dependent Variable: Tobin Q's Avg. 05-07
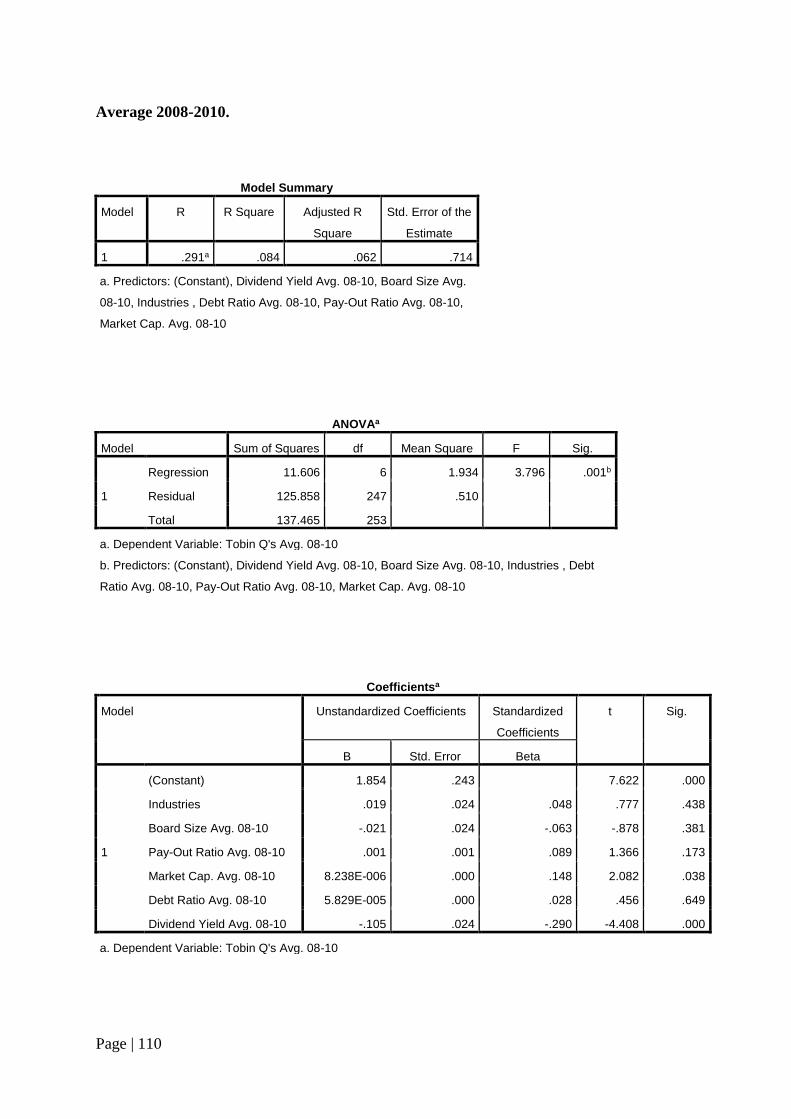
Page | 110
Average 2008-2010.
Model Summary
Model R R Square Adjusted R
Square
Std. Error of the
Estimate
1 .291a .084 .062 .714
a. Predictors: (Constant), Dividend Yield Avg. 08-10, Board Size Avg.
08-10, Industries , Debt Ratio Avg. 08-10, Pay-Out Ratio Avg. 08-10,
Market Cap. Avg. 08-10
ANOVAa
Model Sum of Squares df Mean Square F Sig.
1
Regression 11.606 6 1.934 3.796 .001b
Residual 125.858 247 .510
Total 137.465 253
a. Dependent Variable: Tobin Q's Avg. 08-10
b. Predictors: (Constant), Dividend Yield Avg. 08-10, Board Size Avg. 08-10, Industries , Debt
Ratio Avg. 08-10, Pay-Out Ratio Avg. 08-10, Market Cap. Avg. 08-10
Coefficientsa
Model Unstandardized Coefficients Standardized
Coefficients
t Sig.
B Std. Error Beta
1
(Constant) 1.854 .243 7.622 .000
Industries .019 .024 .048 .777 .438
Board Size Avg. 08-10 -.021 .024 -.063 -.878 .381
Pay-Out Ratio Avg. 08-10 .001 .001 .089 1.366 .173
Market Cap. Avg. 08-10 8.238E-006 .000 .148 2.082 .038
Debt Ratio Avg. 08-10 5.829E-005 .000 .028 .456 .649
Dividend Yield Avg. 08-10 -.105 .024 -.290 -4.408 .000
a. Dependent Variable: Tobin Q's Avg. 08-10

Page | 111
Average 2005-2010.
Model Summary
Model R R Square Adjusted R
Square
Std. Error of the
Estimate
1 .302a .091 .070 .825
a. Predictors: (Constant), Dividend Yield Avg. 05-10, Board Size Avg.
05-10, Industries , Debt Ratio Avg. 05-10, Pay-Out Ratio Avg. 05-10,
Market Cap. Avg. 05-10
ANOVAa
Model Sum of Squares df Mean Square F Sig.
1
Regression 17.231 6 2.872 4.217 .000b
Residual 171.626 252 .681
Total 188.857 258
a. Dependent Variable: Tobin Q's Avg. 05-10
b. Predictors: (Constant), Dividend Yield Avg. 05-10, Board Size Avg. 05-10, Industries , Debt
Ratio Avg. 05-10, Pay-Out Ratio Avg. 05-10, Market Cap. Avg. 05-10
Coefficientsa
Model Unstandardized Coefficients Standardized
Coefficients
t Sig.
B Std. Error Beta
1
(Constant) 2.156 .293 7.350 .000
Industries .037 .028 .080 1.313 .191
Board Size Avg. 05-10 -.032 .028 -.084 -1.151 .251
Pay-Out Ratio Avg. 05-10 .001 .001 .098 1.522 .129
Market Cap. Avg. 05-10 9.734E-006 .000 .145 2.024 .044
Debt Ratio Avg. 05-10 .000 .000 .076 1.217 .225
Dividend Yield Avg. 05-10 -.153 .034 -.290 -4.550 .000
a. Dependent Variable: Tobin Q's Avg. 05-10

Page | 112
Appendix (19): Linear regression results from the SPSS model for the
relationship between dividend yield, dividend pay-out ratio, industry type, board
of directors’ size, market capitalisation and debt ratio with ROA.
Average 2005-2007.
Model Summary
Model R R Square Adjusted R
Square
Std. Error of the
Estimate
1 .203a .041 .017 7.567
a. Predictors: (Constant), Dividend Yield Avg. 05-07, Board Size Avg.
05-07, Industries , Debt Ratio Avg. 05-07, Market Cap. Avg. 05-07,
Pay-Out Ratio Avg. 05-07
ANOVAa
Model Sum of Squares df Mean Square F Sig.
1
Regression 592.530 6 98.755 1.725 .116b
Residual 13741.527 240 57.256
Total 14334.057 246
a. Dependent Variable: ROA Avg. 05-07
b. Predictors: (Constant), Dividend Yield Avg. 05-07, Board Size Avg. 05-07, Industries , Debt
Ratio Avg. 05-07, Market Cap. Avg. 05-07, Pay-Out Ratio Avg. 05-07
Coefficientsa
Model Unstandardized Coefficients Standardized
Coefficients
t Sig.
B Std. Error Beta
1
(Constant) 6.082 2.662 2.285 .023
Industries -.017 .265 -.004 -.065 .948
Market Cap. Avg. 05-07 7.671E-005 .000 .129 1.712 .088
Board Size Avg. 05-07 -.048 .243 -.015 -.196 .845
Pay-Out Ratio Avg. 05-07 -.006 .006 -.075 -.954 .341
Debt Ratio Avg. 05-07 .003 .002 .133 1.709 .089
Dividend Yield Avg. 05-07 .620 .345 .117 1.798 .073
a. Dependent Variable: ROA Avg. 05-07
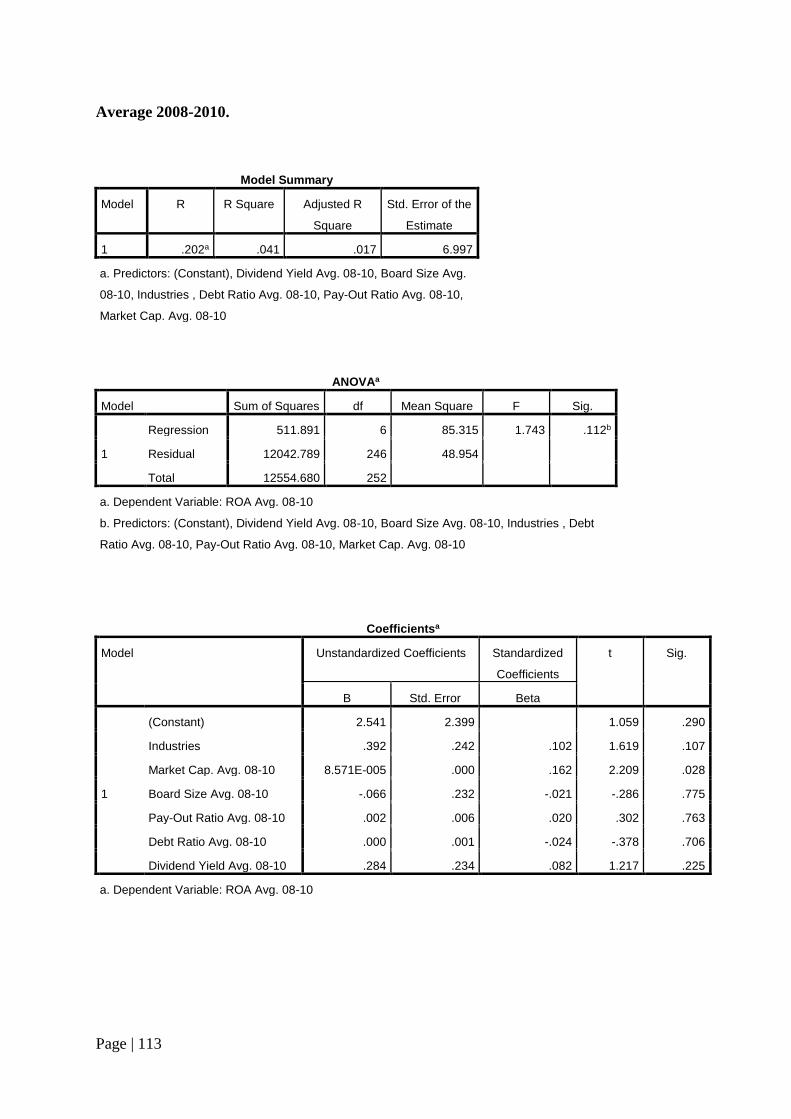
Page | 113
Average 2008-2010.
Model Summary
Model R R Square Adjusted R
Square
Std. Error of the
Estimate
1 .202a .041 .017 6.997
a. Predictors: (Constant), Dividend Yield Avg. 08-10, Board Size Avg.
08-10, Industries , Debt Ratio Avg. 08-10, Pay-Out Ratio Avg. 08-10,
Market Cap. Avg. 08-10
ANOVAa
Model Sum of Squares df Mean Square F Sig.
1
Regression 511.891 6 85.315 1.743 .112b
Residual 12042.789 246 48.954
Total 12554.680 252
a. Dependent Variable: ROA Avg. 08-10
b. Predictors: (Constant), Dividend Yield Avg. 08-10, Board Size Avg. 08-10, Industries , Debt
Ratio Avg. 08-10, Pay-Out Ratio Avg. 08-10, Market Cap. Avg. 08-10
Coefficientsa
Model Unstandardized Coefficients Standardized
Coefficients
t Sig.
B Std. Error Beta
1
(Constant) 2.541 2.399 1.059 .290
Industries .392 .242 .102 1.619 .107
Market Cap. Avg. 08-10 8.571E-005 .000 .162 2.209 .028
Board Size Avg. 08-10 -.066 .232 -.021 -.286 .775
Pay-Out Ratio Avg. 08-10 .002 .006 .020 .302 .763
Debt Ratio Avg. 08-10 .000 .001 -.024 -.378 .706
Dividend Yield Avg. 08-10 .284 .234 .082 1.217 .225
a. Dependent Variable: ROA Avg. 08-10

Page | 114
Average 2005-2010.
Model Summary
Model R R Square Adjusted R
Square
Std. Error of the
Estimate
1 .200a .040 .017 6.300
a. Predictors: (Constant), Dividend Yield Avg. 05-10, Board Size Avg.
05-10, Industries , Debt Ratio Avg. 05-10, Pay-Out Ratio Avg. 05-10,
Market Cap. Avg. 05-10
ANOVAa
Model Sum of Squares df Mean Square F Sig.
1
Regression 416.860 6 69.477 1.750 .110b
Residual 9963.439 251 39.695
Total 10380.298 257
a. Dependent Variable: ROA Avg. 05-10
b. Predictors: (Constant), Dividend Yield Avg. 05-10, Board Size Avg. 05-10, Industries , Debt
Ratio Avg. 05-10, Pay-Out Ratio Avg. 05-10, Market Cap. Avg. 05-10
Coefficientsa
Model Unstandardized Coefficients Standardized
Coefficients
t Sig.
B Std. Error Beta
1
(Constant) 4.402 2.244 1.961 .051
Industries .179 .216 .052 .827 .409
Market Cap. Avg. 05-10 8.584E-005 .000 .172 2.338 .020
Board Size Avg. 05-10 -.048 .215 -.017 -.225 .822
Pay-Out Ratio Avg. 05-10 .006 .006 .061 .923 .357
Debt Ratio Avg. 05-10 .001 .002 .026 .399 .690
Dividend Yield Avg. 05-10 .257 .258 .066 .997 .320
a. Dependent Variable: ROA Avg. 05-10

Page | 115