Embed Size (px)
Citation preview

How diagrams aid teaching and learning
Professor Andy Lane Department of Communication and Systems

teaching and learning require the manipulation and communication of data and
information

teaching and learning require the manipulation and communication of data and
information [but not as eye candy]

educational contexts vary from formal to informal, personal to collective, at
home or at work

diagramming involves the structuring of data and
information into meaningful patterns

diagrams are sense making representations of complex
situations

analogue representations

schematic representations

symbolic representations

conceptual representations

structure v process static v dynamic

co-creation of a collective diagram v
diagram as a focus for discussion

mediated discussions
teacher and student learning

Andy Capp cartoon: “The Boss wants us at the ground early” © Mirrorpix

the use of diagrams in teaching and learning should bear some
relation to use within related professional practice
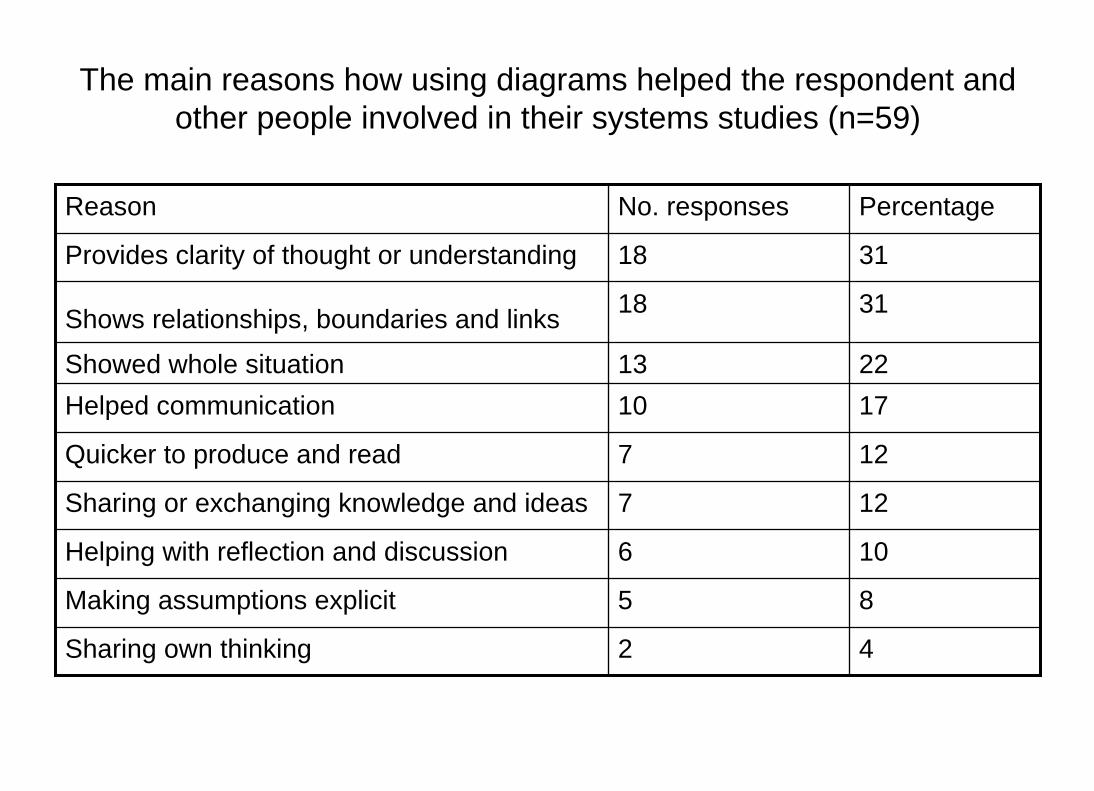
The main reasons how using diagrams helped the respondent and other people involved in their systems studies (n=59)
Reason No. responses Percentage
Provides clarity of thought or understanding 18 31
Shows relationships, boundaries and links 18 31
Showed whole situation 13 22Helped communication 10 17
Quicker to produce and read 7 12
Sharing or exchanging knowledge and ideas 7 12
Helping with reflection and discussion 6 10
Making assumptions explicit 5 8
Sharing own thinking 2 4

mapping stakeholder views
researcher and participant learning

pen and paper v
new technologies

Percentage of respondents who stated that the type of learning experience for diagramming offered in T205 was fairly or very
valuable (n=513)
Learning experience mode Percentage participation
Percentage rating as fairly or very valuable
Prior knowledge 19 71
Discursive print 93 85
Appendix 92 86
WebZone 84 89
CD-ROM 74 92
Group work 28 93
TMA feedback 88 83
Own exploration 48 88

do we practice what we preach?
‘As an aside that is especially apropos for present purposes, we note that (1) professional journal articles typically consist of densely worded technical text; (2) such text often can benefit from clarifying pictorial accompaniments; but (3) pictures, diagrams, and figures take up precious journal space, adding to cost of an already costly enterprise. Nevertheless, it is ironic that one often reads research articles focusing on the effects of text- accompanying illustrations without encountering even a single illustration of the illustration used in the research’. Carney and Levin, 2002

open media

sourcesIllustrations from• http://openlearn.open.ac.uk/GSG_2• http://openlearn.open.ac.uk/T552_1References used• Carney, R.N. and Levin, J.R. (2002) Pictorial Illustrations Still
Improve Students’ Learning from Text, Educational Psychology Review, Vol. 14, No. 1, pp 5-26
• Lane, A. and Morris, R. (2001) Teaching diagramming at a distance: seeing the human wood through the technological trees, Systemic Practice and Action Research, 14(6): pp 715-734
• Lane, A.B. and Oreszczyn, S., Presentation on Mapping approaches for eliciting stakeholder views about complex environmental problems, 2nd International Visual Methods Conference, 13-15 September, 2011, Milton Keynes