Embed Size (px)
Citation preview
How Boston and Other American Cities Support and Sustain the ArtsFunding for Cultural Nonprofits in Boston
and 10 Other Metropolitan Centers
The Boston Foundation
U N D E R S T A N D I N G B O S T O N

Design: Kate Canfield, Canfield Design
Production: Mayerchak & Company
Cover Photograph: Courtesy of Landmarks Orchestra
© 2015 by the Boston Foundation. All rights reserved.
About the Boston Foundation
The Boston Foundation, Greater Boston’s community foundation, is one of the largest community foundations in the
nation, with net assets of some $1 billion. In 2015, the Foundation and its donors made more than $110 million in grants
to nonprofit organizations and received gifts of nearly $122 million. In celebration of its Centennial in 2015, the Boston
Foundation has launched the Campaign for Boston to strengthen the Permanent Fund for Boston, the only endowment
fund focused on the most pressing needs of Greater Boston. The Foundation is proud to be a partner in philanthropy,
with more than 1,000 separate charitable funds established by donors either for the general benefit of the community or
for special purposes. The Boston Foundation also serves as a major civic leader, think tank and advocacy organization,
commissioning research into the most critical issues of our time and helping to shape public policy designed to advance
opportunity for everyone in Greater Boston. The Philanthropic Initiative (TPI), an operating unit of the Foundation,
designs and implements customized philanthropic strategies for families, foundations and corporations around the
globe. For more information about the Boston Foundation and TPI, visit tbf.org or call 617-338-1700.
About TDC
Founded in 1968, TDC is one of the nation’s oldest nonprofit management consulting and research firms. TDC believes
that the nonprofit sector plays a vital role in society, giving tangible support to some of our country’s most cherished
ideals and enhancing the quality of our lives. TDC works exclusively with nonprofit, governmental, educational, and
philanthropic organizations, providing them with the tools critical to achieving mission success. For more information
about TDC, visit tdcorp.org or call 617-728-9151.
UNDERSTANDING BOSTON is a series of forums, educational events and research sponsored by the Boston Foundation to provide
information and insight into issues affecting Boston, its neighborhoods and the region. By working in collaboration with a wide
range of partners, the Boston Foundation provides opportunities for people to come together to explore challenges facing our
constantly changing community and to develop an informed civic agenda. Visit tbf.org to learn more about Understanding
Boston and the Boston Foundation.

How Boston and Other American Cities Support and Sustain the Arts
Funding for Cultural Nonprofits in Boston and 10 Other Metropolitan Centers
AuthorsJuliana Koo, Vice President, TDC
Elizabeth Cabral Curtis, President, TDC
EditorsBarbara Hindley, Senior Director of Publications and Marketing, The Boston Foundation
Kathleen Clute, Communications Manager, The Boston Foundation
Prepared for
The Boston Foundation
January 2016

2 U n d e r s t a n d i n g B o s t o n

3H o w B o s t o n a n d O t h e r A m e r i c a n C i t i e s S u p p o r t a n d S u s t a i n t h e A r t s
PrefaceArts and culture are essential components of a vibrant community. The Boston Foundation recognized this from its very earliest days and has supported our city’s cultural organizations for the last century. One of its first grants, in 1917, helped to launch the Community Center of Boston, an organization that continues to offer music instruction to the city’s young people. In subsequent years, the Foundation provided critical early funding for some of the city’s most treasured large and small cultural organizations, including WGBH-TV, the New England Aquarium, the Boston Center for the Arts, Boston Landmarks Orchestra and the Boston Children’s Chorus.
And in the 1980s, the Foundation created and funded special designated funds that provide annual operating support to many of the city’s cultural institutions, enabling them to offer free programming to the people of Boston’s neighborhoods.
Beginning in 2003, we decided to use our expanded role as a civic leader and provider of information for Boston to commission and publish a series of reports focusing on the fiscal health of our region’s nonprofit arts and culture sector. We engaged the consulting firm TDC to examine the level of private and public support Boston gives to the sector and compare it to other cities. The result was a report titled Funding for Cultural Organizations in Boston and Nine Other Metropolitan Areas, which identified areas of urgent need for the sector, including the state’s crumbling cultural infrastructure.
A subsequent report, titled Culture is Our Common Wealth, presented an action agenda for the sector. It led directly to the Campaign for Cultural Facilities, resulting in the passage of the Massachusetts Cultural Facilities Fund, which has since pumped more than $82 million into the state’s cultural buildings.
This new report, also researched and written by TDC, revisits the issue of financial support for the nonprofit arts sector in Boston and compares it to 10 other cities. It reaffirms a major message of the 2003 report: Boston has one of the most vibrant cultural sectors of any city in America, rivaling other cultural powerhouses, such as New York and San Francisco.
It also shows that, while Bostonians are tremendously supportive of our nonprofit arts organizations, both as audience members and donors, limited investments by foundations, corporations and government may be preventing our region’s cultural institutions, especially small and mid-sized nonprofits, from realizing their fullest potential.
In recent months, Boston’s cultural sector has been receiving more media attention than it has in a number of years. The facilities challenges faced by performing arts groups in our city have been covered extensively, driven by the fact that three major performance venues are in a state of flux and may be transformed for other uses or disappear altogether.
In addition, thanks to the leadership of Mayor Martin J. Walsh and the City’s chief of arts and culture, Julie Burros, Boston is in the midst of a far-reaching cultural planning process. As that process evolves into a blueprint for moving forward, we hope this report will shed light on the fiscal challenges faced by our city’s cultural organizations, especially small and mid-sized groups. We also hope that it will inform a deeper discussion about some of the innovative funding solutions developed by other cities across America to support a thriving and resilient arts and culture sector.
Paul S. GroganPresident and CEOThe Boston Foundation

4 U n d e r s t a n d i n g B o s t o n
Contents
Preface . . . . . . . . . . . . . . . . . . . . . . . . . . . . . . . . . . . . . . . . . . . . . . . . . . . . . . . . . . . . . . . . . . . . . . . . . . . . . . . . . . . . . . . . . . . . . . . . . . . . . . . . 3
Introduction . . . . . . . . . . . . . . . . . . . . . . . . . . . . . . . . . . . . . . . . . . . . . . . . . . . . . . . . . . . . . . . . . . . . . . . . . . . . . . . . . . . . . . . . . . . . . . . . . . . 7
CHAPTER ONE How Do the Cities’ Arts Ecosystems Compare in Breadth, Depth and Assets? . . . . . . . . . . . . . . . . . . .11
CHAPTER TWO How Does Boston’s Funding Landscape Compare to Other Cities? . . . . . . . . . . . . . . . . . . . . . . . . . . . . . .25
CHAPTER THREE Potential for Growth, Potential for Change . . . . . . . . . . . . . . . . . . . . . . . . . . . . . . . . . . . . . . . . . . . . . . . . . . . .37
CHAPTER FOUR Supporting Arts Ecosystems . . . . . . . . . . . . . . . . . . . . . . . . . . . . . . . . . . . . . . . . . . . . . . . . . . . . . . . . . . . . . . . . . .41
Conclusion . . . . . . . . . . . . . . . . . . . . . . . . . . . . . . . . . . . . . . . . . . . . . . . . . . . . . . . . . . . . . . . . . . . . . . . . . . . . . . . . . . . . . . . . . . . . . . . . . . . .55
APPENDIX ONE Methodology and Data Sources . . . . . . . . . . . . . . . . . . . . . . . . . . . . . . . . . . . . . . . . . . . . . . . . . . . . . . . . . . . . . . .57
APPENDIX TWO Interviewees . . . . . . . . . . . . . . . . . . . . . . . . . . . . . . . . . . . . . . . . . . . . . . . . . . . . . . . . . . . . . . . . . . . . . . . . . . . . . . . . .63
APPENDIX THREE Works Cited and Data Sources . . . . . . . . . . . . . . . . . . . . . . . . . . . . . . . . . . . . . . . . . . . . . . . . . . . . . . . . . . . . . . . .65
Endnotes . . . . . . . . . . . . . . . . . . . . . . . . . . . . . . . . . . . . . . . . . . . . . . . . . . . . . . . . . . . . . . . . . . . . . . . . . . . . . . . . . . . . . . . . . . . . . . . . . . . . .69
LIST OF FIGURES AND TABLES
FIGURE 1 Total Organizations . . . . . . . . . . . . . . . . . . . . . . . . . . . . . . . . . . . . . . . . . . . . . . . . . . . . . . . . . . . . . . . . . . . . . . . . . . . . . . . . .11
FIGURE 2 Total Revenue of Arts Organizations . . . . . . . . . . . . . . . . . . . . . . . . . . . . . . . . . . . . . . . . . . . . . . . . . . . . . . . . . . . . . . . . . . .12
FIGURE 3 Total Expenses of Arts Organizations . . . . . . . . . . . . . . . . . . . . . . . . . . . . . . . . . . . . . . . . . . . . . . . . . . . . . . . . . . . . . . . . . .12
FIGURE 4 Distribution of Organizations by Budget Size . . . . . . . . . . . . . . . . . . . . . . . . . . . . . . . . . . . . . . . . . . . . . . . . . . . . . . . . . . .13
FIGURE 5 Distribution of Organizational Expenses by Budget Size . . . . . . . . . . . . . . . . . . . . . . . . . . . . . . . . . . . . . . . . . . . . . . . . . .14
TABLE 1 Average Expenses for $75M+ Organizations . . . . . . . . . . . . . . . . . . . . . . . . . . . . . . . . . . . . . . . . . . . . . . . . . . . . . . . . . . . .14

5H o w B o s t o n a n d O t h e r A m e r i c a n C i t i e s S u p p o r t a n d S u s t a i n t h e A r t s
FIGURE 6 Total Expenses for Large Organizations, Select Cities . . . . . . . . . . . . . . . . . . . . . . . . . . . . . . . . . . . . . . . . . . . . . . . . . . . . .15
FIGURE 7 Distribution of Large Organizations by Budget Size . . . . . . . . . . . . . . . . . . . . . . . . . . . . . . . . . . . . . . . . . . . . . . . . . . . . . .16
FIGURE 8 Total Expenses of $75M+ Organizations vs. All Others . . . . . . . . . . . . . . . . . . . . . . . . . . . . . . . . . . . . . . . . . . . . . . . . . . . .16
FIGURE 9 Distribution of Organizations by Broad Discipline . . . . . . . . . . . . . . . . . . . . . . . . . . . . . . . . . . . . . . . . . . . . . . . . . . . . . . .17
FIGURE 10 Distribution of Expenses by Broad Discipline . . . . . . . . . . . . . . . . . . . . . . . . . . . . . . . . . . . . . . . . . . . . . . . . . . . . . . . . . . .18
FIGURE 11 Top Six Performing Arts Markets by Per Capita Expense . . . . . . . . . . . . . . . . . . . . . . . . . . . . . . . . . . . . . . . . . . . . . . . . . .18
FIGURE 12 Performing Arts Expense Per Capita, Top Six Markets, by Selected Sub-disciplines . . . . . . . . . . . . . . . . . . . . . . . . . . . .19
FIGURE 13 Per Capita Expense, Performing Arts Sub-disciplines, Small and Mid-sized Organizations . . . . . . . . . . . . . . . . . . . . .19
FIGURE 14 Percentage of Organizations with at Least One New Work, by Budget Size . . . . . . . . . . . . . . . . . . . . . . . . . . . . . . . . . .20
FIGURE 15 Distribution of Organizations by Months of Available URNA . . . . . . . . . . . . . . . . . . . . . . . . . . . . . . . . . . . . . . . . . . . . . .22
FIGURE 16 Occupancy Expenses Per Capita . . . . . . . . . . . . . . . . . . . . . . . . . . . . . . . . . . . . . . . . . . . . . . . . . . . . . . . . . . . . . . . . . . . . . .22
FIGURE 17 Value of Facilities by Fixed Asset . . . . . . . . . . . . . . . . . . . . . . . . . . . . . . . . . . . . . . . . . . . . . . . . . . . . . . . . . . . . . . . . . . . . . .23
FIGURE 18 Per Capita Value of Facilities by Fixed Asset and Budget Size . . . . . . . . . . . . . . . . . . . . . . . . . . . . . . . . . . . . . . . . . . . . . .23
FIGURE 19 Participation-Based Earned Revenue . . . . . . . . . . . . . . . . . . . . . . . . . . . . . . . . . . . . . . . . . . . . . . . . . . . . . . . . . . . . . . . . . .26
FIGURE 20 Total Participation-Based Earned Revenue Per Capita by Budget Size . . . . . . . . . . . . . . . . . . . . . . . . . . . . . . . . . . . . . . .26
FIGURE 21 Participation-Based Earned Revenue by Budget Size, Boston vs. All Other Cities . . . . . . . . . . . . . . . . . . . . . . . . . . . . . 27
FIGURE 22 Total Funds Invested in Endowments . . . . . . . . . . . . . . . . . . . . . . . . . . . . . . . . . . . . . . . . . . . . . . . . . . . . . . . . . . . . . . . . . .27
FIGURE 23 Total Funds Invested in Endowments Per Capita by Budget Size . . . . . . . . . . . . . . . . . . . . . . . . . . . . . . . . . . . . . . . . . . .28
FIGURE 24 Percentage of Endowment Goal Raised . . . . . . . . . . . . . . . . . . . . . . . . . . . . . . . . . . . . . . . . . . . . . . . . . . . . . . . . . . . . . . . .28
FIGURE 25 Total Contributed Revenue . . . . . . . . . . . . . . . . . . . . . . . . . . . . . . . . . . . . . . . . . . . . . . . . . . . . . . . . . . . . . . . . . . . . . . . . . . . . 29
FIGURE 26 Distribution of Contributed Revenue by Type . . . . . . . . . . . . . . . . . . . . . . . . . . . . . . . . . . . . . . . . . . . . . . . . . . . . . . . . . . .29
FIGURE 27 Total Individual Contributions . . . . . . . . . . . . . . . . . . . . . . . . . . . . . . . . . . . . . . . . . . . . . . . . . . . . . . . . . . . . . . . . . . . . . . .30
FIGURE 28 Median Individual Giving by Budget Size, Select Cities . . . . . . . . . . . . . . . . . . . . . . . . . . . . . . . . . . . . . . . . . . . . . . . . . . .30
FIGURE 29 Capital Campaign Goals and Rate of Completion, Select Cities . . . . . . . . . . . . . . . . . . . . . . . . . . . . . . . . . . . . . . . . . . . .31
FIGURE 30 Total Corporate Support, Select Cities. . . . . . . . . . . . . . . . . . . . . . . . . . . . . . . . . . . . . . . . . . . . . . . . . . . . . . . . . . . . . . . . . .32
FIGURE 31 Total Foundation Support, Select Cities . . . . . . . . . . . . . . . . . . . . . . . . . . . . . . . . . . . . . . . . . . . . . . . . . . . . . . . . . . . . . . . .32
FIGURE 32 Median Foundation Giving by Budget Size, Select Cities . . . . . . . . . . . . . . . . . . . . . . . . . . . . . . . . . . . . . . . . . . . . . . . . . .33
FIGURE 33 Total Government Support, Select Cities . . . . . . . . . . . . . . . . . . . . . . . . . . . . . . . . . . . . . . . . . . . . . . . . . . . . . . . . . . . . . . .34
FIGURE 34 Median Government Support by Budget Size, Select Cities . . . . . . . . . . . . . . . . . . . . . . . . . . . . . . . . . . . . . . . . . . . . . . . .34
FIGURE 35 Distribution of Government Support by Type, Select Cities . . . . . . . . . . . . . . . . . . . . . . . . . . . . . . . . . . . . . . . . . . . . . . . .35
FIGURE 36 Government Support by Type, Select Cities . . . . . . . . . . . . . . . . . . . . . . . . . . . . . . . . . . . . . . . . . . . . . . . . . . . . . . . . . . . . .35
FIGURE 37 Participation-Based Earned Revenue Growth, 2006 to 2012 . . . . . . . . . . . . . . . . . . . . . . . . . . . . . . . . . . . . . . . . . . . . . . . .37

6 U n d e r s t a n d i n g B o s t o n

7H o w B o s t o n a n d O t h e r A m e r i c a n C i t i e s S u p p o r t a n d S u s t a i n t h e A r t s
provided relatively strong sources of support, the study also showed that Boston did not have the depth and breadth of the funding mechanisms that the other cities had from foundations and government agencies. These limited resources had the biggest impact on small and mid-sized organizations.
The report’s conclusion was that strengthening Boston’s arts market would require increased and more stable resources, a higher profile for the arts on the civic agenda, and broadly representative leadership.
A number of positive results emerged from that report. A Cultural Task Force was convened in the spring of 2003 to develop strategies designed to enhance the revenues and resources available to Massachu-setts’ nonprofit cultural organizations. The Task Force made a series of recommendations reflected in another Boston Foundation report, titled Culture Is Our Common Wealth: An Action Agenda to Enhance Revenues and Resources for Massachusetts Cultural Orga-nizations, published in 2004. One recommendation — a significant and sustained state investment in cultural facilities — was prioritized. As a result, the Campaign for Cultural Facilities was convened in 2004 with the goal of establishing a state fund to strengthen cultural facilities across the Commonwealth, building on many years of preparation and advocacy from the arts community.
As a result of all these efforts, in 2007, the Massachu-setts Legislature created the Massachusetts Cultural Facilities Fund, which since has granted $82.4 million across the Commonwealth to improve the state’s phys-ical cultural infrastructure. Funds have gone to 600 projects in 118 cities and towns, leveraging more than $1.5 billion in support.
Another recommendation of the report was a greater investment in service and advocacy organizations to develop the sector’s cohesion and enhance its ability to meet its collective needs. As a result, the Boston Foun-dation and other partners provided pre-start-up grants and significant operating funds to MASSCreative. That organization has two main missions: to educate the
Introduction
Greater Boston is home to more than 1,500 arts and culture organizations that give the city and the region a tremendous amount to celebrate. From landmark institutions to deeply cherished neighborhood gems, Boston’s nonprofit arts organizations offer audiences an abundance of concerts, performances, exhibits and other cultural opportunities. The cultural scene in Boston engages artists, writers, musicians, dancers and other performers from around the world and from the city’s own neighborhoods. Community members have numerous opportunities to engage in the arts — from choral singing to salsa dancing to neighborhood fairs and festivals.
Despite this abundance, questions remain about whether arts organizations of all sizes in Boston have access to the resources they need to survive and thrive.
More than a decade ago, the Boston Foundation made it a priority to determine whether Boston’s nonprofit arts and cultural organizations were faring as well as those in other cities when it came to financial support. As a result, in 2003, the Foundation commissioned a study: Funding for Cultural Organizations in Boston and Nine Other Metropolitan Areas, produced in partner-ship with TDC. It compared Boston to nine other cities: Charlotte, Chicago, Cleveland, Dallas, Minneapolis-Saint Paul, New York, Pittsburg, San Francisco and Seattle and was based on data from 1999.
The study found that Boston had a very broad and deep arts community for a region of its size. On a per capita basis, Boston had the highest number of arts and cultural nonprofit organizations in the study group, outpacing even New York City. Because of this breadth and depth, Boston’s cultural sector had a significant impact on the state’s economy.
In terms of funding, Boston was second only to New York in per capita contributed revenue for the arts. The majority of these contributions came from individual donors — and most of it went to large cultural institu-tions. In Boston, 65 percent of total contributed income went to organizations with budgets greater than $20 million. While individual giving and earned income

8 U n d e r s t a n d i n g B o s t o n
public about the importance of arts and culture as a public good and build a grassroots movement to advo-cate for public policy changes that support the arts.
Why revisit the funding picture for arts and cultural organizations now?This is a critical and exciting time for arts and cultural organizations in Boston. Mayor Martin J. Walsh has appointed the city’s first cabinet-level Arts and Culture Chief in decades and has initiated the city’s first community-wide cultural planning process, soliciting feedback from thousands of residents about what they need and want from Boston’s cultural sector.
When the city’s cultural plan is released in 2016, local funders and other stakeholders will need to deter-mine how to support not only the ongoing work of Boston’s numerous cultural organizations, but also implementation of the priorities that emerge from the citywide plan.
In order to contribute to this momentum, the Boston Foundation decided to revisit the topic it addressed in the 2003 report: the funding picture for Boston’s nonprofit arts and cultural institutions and how it compares with other cities.
The 10 comparison cities are:
■■ Baltimore
■■ Chicago
■■ Cleveland
■■ Houston
■■ Minneapolis-St. Paul
■■ New York
■■ Philadelphia
■■ Portland, Oregon
■■ San Francisco
■■ Seattle
These cities were chosen because of several factors, including: similarity to Boston in terms of population, cost of living and majority-minority status; the recent introduction of major new public funding streams; and an arts ecosystem that could provide an interest-ing counterpoint to Boston, particularly those that might be seen as aspirational peers. Applying these
criteria caused the replacement of three cities from the 2003 study.1
These cities provide interesting perspectives on how the arts serve their communities and how the commu-nities in turn are attempting to address challenges and realize aspirations. Observing a wide range of approaches helps to set Boston in context and suggests productive ways to think about the levers at the city’s disposal, should it desire to make change.
Ultimately, the most important consideration for Boston is whether the arts ecosystem suits the needs, preferences, and aspirations of the city, the region and their residents. This study, however, is not a needs assessment. Instead, it provides baseline information on what can be observed in Boston’s arts market today. Rather than a prescription for cultural vibrancy, these findings are meant to be a useful tool as the commu-nity reflects on what kind of arts ecosystem it wants.
The study asks three key questions:
■■ How do Boston’s arts organizations compare to those in other cities in terms of depth, breadth and assets?
■■ How do Boston’s revenue mix and funding land-scape compare to those in other cities?
■■ Where are the opportunities to identify resources that Boston could deploy to create systemic change?
To explore these questions, TDC used two sources for quantitative information: IRS Form 990 data from GuideStar and data from the Cultural Data Project, using 2012 as the base year of analysis.2 The CDP offers a more detailed analysis of contributed revenue than was possible in 2003. Given the changes to the data-set—with the introduction of new cities and of CDP—a direct comparison of numerical findings with the 2003 report is not possible. However, it is valid to compare larger trends.
To inform the quantitative analysis, TDC conducted focus groups with 50 Boston-based organizations — across disciplines and budget sizes — and interviewed dozens of arts service organizations, public and private funders and other stakeholders in Boston and the 10 comparison cities. (See the Appendices of this report for details on the data, analyses and interviews.)

9H o w B o s t o n a n d O t h e r A m e r i c a n C i t i e s S u p p o r t a n d S u s t a i n t h e A r t s
Before reviewing the findings, it is important to note that the scope of this study is limited to a narrow, albeit important, portion of the arts ecosystem: nonprofit arts organizations. The arts ecosystem includes a much wider spectrum of players and activities, including artists, art schools, for-profit arts enterprises (includ-ing commercial theater and concert venues) and art-making in non-traditional settings. This last element has gained importance among arts funders in recent years, who see art-making outside of arts organiza-tions — whether embedded in non-arts nonprofits or informal in the community — as a key strategy for broadening access to arts experiences, particularly to underserved audiences. While this and other elements are all important parts of Boston’s arts market, they are outside of the scope of this study. All references to the arts market and ecosystem, therefore, refer only to nonprofit arts organizations along with their audiences and supporters.
Study FindingsBoston’s arts market is densely populated. As found in the 2003 report, Boston has a comparatively high per capita number of arts organizations. While Greater Boston ranks tenth nationwide in terms of population and ninth for total GDP, its nonprofit arts market, which includes more than 1,500 organiza-tions, is comparable to that of New York and San Fran-cisco and — along with San Francisco — consistently surpasses some larger cities, such as Houston, Chicago and Philadelphia, in terms of the number of organiza-tions and their per capita expenses.
Boston’s arts organizations of all sizes are engaging audiences. In 2012, Boston organizations earned nearly $350 million from ticket sales and other participation-based sources, putting Boston in third place in per capita earned revenue behind New York and San Francisco. High participation-based earned-revenue levels in Boston suggest highly engaged audiences that are willing to pay for cultural experiences. Boston’s small and mid-sized organizations are significantly outpacing their peers in other cities when it comes to participation-based earned revenue. At the same time, in focus groups, organizations revealed that their dependence on earned income often drives risk-averse programmatic choices. Quantitative data supports this observation.
Boston’s arts market is unevenly distributed. Boston has a deep well of arts organizations. The way those organizations are distributed sometimes differs from what was seen in the other study cities.
■■ Budget size. Most cities in the study are domi-nated by their largest cultural organizations, which account for a disproportionate share of the dollars in their communities. In Boston, however, that concentration occurs at levels unseen in any other city in the study. Boston’s top three institutions — the Boston Symphony Orchestra, the Museum of Fine Arts and WGBH — account for more than 40 percent of total expenses of all organizations. This is a rate 1.5 to 2 times greater than in comparatively sized markets.3 The presence of these three institu-tions puts Boston on par with New York and San Francisco in terms of per capita dollars expended on the arts. Without these large organizations, Boston’s financial picture would more closely resemble smaller markets in this study.
■■ Discipline. Looking at Boston’s arts market by discipline, the data demonstrate Boston’s strength in history-focused organizations. Evidence suggests, however, that performing arts are less plentiful and less resourced in Boston than elsewhere, causing the city to fall to sixth place in per capita perform-ing arts expenditures. Among the performing arts, Boston is strong in music but shows gaps in theater, dance and other performing arts (including opera).
■■ Cultural equity. Cultural equity was raised as an issue of critical importance by Boston organiza-tions in focus groups and by funders in Boston and elsewhere. Cultural equity is the principle that all people should have equitable opportunities for cultural expression. The goal is for an arts ecosys-tem to reflect the multiplicity of traditions, art forms and identities of its population. Current methods to measure equity in the arts are imperfect, but inter-views revealed that funders in other cities are taking up this task. This issue takes on increased urgency given Boston’s official transition to a majority-minority population in 2010.4
Boston’s arts organizations pay full freight on facili-ties. Total fixed assets on Boston’s balance sheets, which reflect the value of facilities, are the highest per capita among comparatively sized arts markets.5 While the Massachusetts Cultural Facilities Fund, described

10 U n d e r s t a n d i n g B o s t o n
above, is a crucial resource for improving cultural institutions, Boston’s $1 billion in cultural fixed assets dwarf the funds available to maintain them. New York and San Francisco — cities where real estate costs are even higher than in Boston — have lower fixed-asset levels, primarily because some of their major institu-tions operate in city-owned buildings. As a result, these organizations have lower depreciation expenses, lower long-term maintenance costs, and less need to build facilities reserves for the future. In some cases, local government carries associated operating costs such as utilities.
As in 2003, Boston’s individual donors are extremely generous. However, financial support from founda-tions and government is weak.
■■ Boston’s individual donors are supporting arts organizations of all sizes at high levels compared to other cities. Among all of the cities studied, Boston has the highest or second-highest median individual giving in each budget cohort. Contrib-uted revenue for Boston’s arts organizations is driven by the energy, generosity and commitment of its individual donors. Boston’s nonprofit cultural organizations of all budget sizes are raising funds from individuals at higher levels than most of the other cities in the study, proving their ability to forge strong relationships with their individual supporters.
■■ Boston has relatively few foundations making grants to the arts, and what funding is available is skewed toward larger organizations. Relative to other cities, Boston’s small and mid-sized arts organizations do not receive significant foundation support.
■■ Boston receives the lowest amount of government funding per capita among the comparison cities. The primary driver of this low public support is the limited funding from the City of Boston. Boston is the only metro area in this study where federal support outweighs state and local funding.
The absence of robust foundation and government involvement is as important as the missing dollars. In other cities, TDC observed philanthropic programs
in place to drive toward particular outcomes that were not strongly supported by the marketplace of individual donors or ticket buyers, such as funding of small organizations, new or more avant garde artworks, or cultural equity. In contrast, Boston’s arts ecosystem is dominated by the choices of individual consum-ers. Donors give to their favorite organizations, and audience members buy tickets to programs that are compelling to them. Participation from foundation, government and corporate funders is low. Without a critical mass of players that are thinking at a systemic level, Boston has limited levers with which it can make change.
Chapter One of this report paints a broad picture of how the 11 cities compare in the breadth, depth and assets of arts organizations. Chapter Two explores the various revenue sources that are supporting the nonprofit cultural organizations in this study. Chapter Three discusses whether any of these revenue sources offers Boston levers to achieve systemic change. Chap-ter Four offers examples of funding initiatives in the study cities along with a detailed analysis of local government support of the arts.

11H o w B o s t o n a n d O t h e r A m e r i c a n C i t i e s S u p p o r t a n d S u s t a i n t h e A r t s
For the purposes of this study, TDC distilled its comparison of Boston’s arts and cultural market and that of the other 10 cities into three primary areas of inquiry:
■■ Breadth: What is the size and shape of the market as a whole?
■■ Depth: Does the sector have a balanced distribu-tion of organizations by budget size and discipline? Are organizations presenting new artistic works? Does the ecosystem serve all of Boston’s residents equally?
■■ Assets: Do organizations have available cash to address their needs and mitigate risks? Do organi-zations have access to affordable and appropriate facilities?
BreadthScale in the system can be measured in a multiplicity of ways, including counts of organizations, total expenses and total revenues. To account for different population sizes across the cities, these measures are presented as absolute numbers and also per capita. In very gross terms, expenses can be interpreted as a measure of activity.
Boston’s arts market is on the scale of the major markets in New York and San Francisco. (Figure 1) On a per capita basis, Boston is second only to San Francisco in the number of arts and cultural organiza-tions that call the city home. Chicago, Houston and Philadelphia — all larger than Boston — have smaller arts markets per capita and, except for Chicago, even
FIGURE 1
Total Organizations7,8
0
500
1,000
1,500
2,000
6,000
0
45
40
35
30
25
20
15
5
10
SeattleNew York Philadelphia Portland San FranciscoHouston MinneapolisChicago ClevelandBaltimoreBoston
34
1,572 2325
15
28
24
3028
39
21
1,955
623516
926
1,699
673
971
1,415
5,997
898
31
Organizations Per 100,000
Orga
niza
tions
Per 1
00,0
00
MSA Population 4.6M 2.7M 9.5M 2.1M 6.1M 3.3M 19.0M 6.0M 2.3M 4.4M 3.5M
Population Growth (% 2006–2012)
3.3% 2.8% –0.1% –2.1% 9.8% 4.6% 1.2% 2.9% 5.8% 5.2% 7.2%
Cost of Living 133 119 117 101 92 111 186 127 111 164 121
Unemployment 4.9% 6.2% 6.9% 6.0% 4.5% 4.1% 6.5% 6.0% 6.1% 4.8% 5.5%
CHAPTER ONE
How Do the Cities’ Arts Ecosystems Compare in Breadth, Depth and Assets?

12 U n d e r s t a n d i n g B o s t o n
report focuses on four, based on available data and input from interviews and focus groups. These are budget size, discipline, programmatic innovation and cultural equity.
Budget SizeScale is a factor not only of the ecosystem as a whole but also at the organizational level. It determines an organization’s business model and its role in the
fewer organizations. As shown in Figure 2 and Figure 3, these trends stay true when it comes to per capita organizational revenues and expenses.6
DepthThe next sections of this chapter examine what lies underneath Boston’s breadth. Does Boston’s arts ecosystem provide depth for arts audiences and artists alike? While depth has many dimensions, this
FIGURE 2
Total Revenue of Arts Organizations
$0
$800
$600
$400
$200
$1,000
$1,400
$1,200
$5,200
$0
$300
$250
$200
$150
$100
$50
SeattleNew York Philadelphia Portland San FranciscoHouston MinneapolisChicago ClevelandBaltimoreBoston
$232
$1,067
$77
$162
$78
$197
$125
$102
$138
$271
$106
$1,008
$211$336
$654
$1,193
$230
$483
$748
$5,081
$478
$267
Total revenue Per capita
Mill
ions
Per C
apita
Sources: Guidestar 2012, ACS 2012
FIGURE 3
Total Expenses of Arts Organizations
$0
$800
$600
$400
$200
$1,000
$1,200
$5,000
$0
$300
$250
$200
$150
$100
$50
SeattleNew York Philadelphia Portland San FranciscoHouston MinneapolisChicago ClevelandBaltimoreBoston
$212
$977
$61
$124
$439
$72
$193
$121$95
$133
$242
$107
$1,019
$167$257
$640
$1,063
$214
$466
$725
$4,903
$257
Total expenses Per capita
Mill
ions
Per C
apita
Sources: Guidestar 2012, ACS 2012

13H o w B o s t o n a n d O t h e r A m e r i c a n C i t i e s S u p p o r t a n d S u s t a i n t h e A r t s
marketplace. A large budget implies broad reach: the financial heft to present boldface names and market to a mass audience. Smaller budgets imply the abil-ity to present works that speak to a niche, to focus on a specific artistic voice, and to give new artists a chance to present their work. Small organizations can also give amateur artists an outlet for expression. With organizations of different scale, an arts market can present consumers and artists with a breadth and depth of choice.
Budget size cohorts are defined as:
■■ Small: Under $500,000
■■ Mid-sized: $500,000 to $5 million
■■ Large: Above $5 million
Boston’s distribution by budget size mirrors patterns seen in all of the other cities in the study. (Figures 4 and 5) Small organizations outnumber mid-sized and large. (Figure 4) In reviewing expenses, that picture is flipped, with large organizations aggregately spending the most, mid-sized spending less, and small organiza-tions spending the least. (Figure 5)
Boston is dominated by its large arts institutions to a greater degree than any other city in the study. In aggregate, Boston’s 23 largest organizations spent nearly $690 million in 2012 — more than 70 percent of the total expenses of all the city’s arts organiza-tions. (Figure 6) This is in keeping with many of the other cities in the study. But, more than any other city, Boston is dominated by three institutions with budgets above $75 million — the Museum of Fine Arts, the Boston Symphony Orchestra and WGBH.
Small 1,394 569 1,772 473 806 810 5,241 1,251 616 1,472 869
Mid-sized 155 48 155 37 78 96 618 140 45 200 81
Large 23 6 28 6 14 20 138 24 12 27 21
Source: Guidestar 2012
FIGURE 4
Distribution of Organizations by Budget Size
0%
10%
20%
30%
40%
50%
60%
70%
80%
90%
100%
SeattleNew York Philadelphia Portland San FranciscoHouston MinneapolisChicago ClevelandBaltimoreBoston
Small Mid-sized Large

14 U n d e r s t a n d i n g B o s t o n
Contributing to this phenomenon is the fact that five of the other 10 cities in the study do not have any organizations with budgets above $75 million, includ-ing Baltimore, Cleveland, Philadelphia, Portland and Seattle. Of the remaining five that do have organiza-tions at this scale, no other city is as top heavy as Boston, where the three largest organizations account for almost 60 percent of large-organization expenses. (Figure 6) Even in New York, large organizations with more than $75 million in expenses spend a relatively modest 45 percent.
It is illuminating to compare the average expenses of the over-$75 million institutions across the six cities that do have these large institutions. (Table 1) Boston is supporting three “New York-sized” organizations with a population and economy that is a quarter the size of New York’s.10 The over-$75 million organizations in all other cities are on a smaller scale.
Boston’s three largest institutions have a remark-able track record and legacy. They have remained at or very near the top of their disciplines in scale, excellence and prestige for decades. WGBH-TV is the Public Broadcasting System’s leading producer
of broadcast content. Now in its 134th season, the Boston Symphony Orchestra reaches millions of listen-ers, not only through performances in Boston and at Tanglewood, but also via the Internet, radio, television, recordings and tours. Founded in 1876, the Museum of Fine Arts sees more than one million visitors every year and is one of the most comprehensive art muse-ums in the world with a collection that encompasses nearly 450,000 works of art.
TABLE 1
Average Expenses for $75M+ Organizations
Number of Organizations over $75M Average Expenses
Boston 3 $136,324,639
Chicago 3 $85,145,215
Houston 1 $83,082,403
Minneapolis 1 $85,106,092
New York 9 $187,604,456
San Francisco 2 $80,984,228
Source: Guidestar 2012
0%
10%
20%
30%
40%
50%
60%
70%
80%
90%
100%
SeattleNew York Philadelphia Portland San FranciscoHouston MinneapolisChicago ClevelandBaltimoreBoston
Small Mid-sized Large
FIGURE 5
Distribution of Organizational Expenses by Budget Size9
Small $65M $18M $59M $16M $29M $34M $196M $48M $23M $69M $31M
Mid-sized $223M $79M $224M $53M $121M $121M $937M $215M $56M $274M $115M
Large $689M $70M $737M $189M $289M $485M $3,770M $462M $135M $720M $319M
Source: Guidestar 2012

15H o w B o s t o n a n d O t h e r A m e r i c a n C i t i e s S u p p o r t a n d S u s t a i n t h e A r t s
The legacy effect applies not only to their scale and reputations but also to their bases of support. Founded earlier than most other institutions in their respec-tive disciplines, they have had more time to build up support, scale and assets. All of these institutions are embedded deeply in the cultural traditions of Boston’s leading philanthropists, some of whom come from families that have supported these institutions for generations.
On the other hand, Boston’s top three largest-spending cultural organizations look bigger than many of their peers in other cities because they do not have the bene-fit of significant public subsidies. Some of the large organizations in New York and San Francisco receive substantial municipal support, which effectively lowers their operating costs.
A telling comparison can be made between Boston’s Museum of Fine Arts and New York’s Metropolitan Museum of Art. The Metropolitan Museum of Art occupies more than 2 million square feet, while the Museum of Fine Arts stands on 620,000 square feet. This significant difference in scale, however, is impos-sible to detect in a review of balance sheets. Fixed assets on the Metropolitan Museum of Art’s balance sheet stand at $423 million, while the MFA is support-ing fixed assets of $435 million. The disparity between the square footage and the balance sheet value can be explained by the fact that the City of New York
owns the Metropolitan Museum of Art’s building. The city also covers the museum’s annual utilities costs. As a result, its 2012 occupancy cost was $5.6 million, while the MFA’s was $6.6 million for less than half the square footage.
Boston is missing a layer of $10 million-$75 million organizations that can be found in other major arts markets. As noted above, in this study, large organiza-tions are defined as those with budgets of more than $5 million. Other robust arts markets, such as Chicago, Minneapolis, New York, San Francisco and Philadel-phia, have a greater number of cultural organizations that fall in the $10 million-$75 million range. (Figure 7) In Boston, with the exception of the “Big Three” discussed above, the budgets of large organizations generally fall into the $5 million-$10 million range.
The “Big Three” mask a lack of resources in Boston’s cultural sector. The presence of these three institutions obscures the resource constraints faced by the rest of the sector. After removing the influence of all organiza-tions over $75 million, Boston’s arts market is only 63 percent the size of San Francisco’s and nearly equiva-lent in size to Minneapolis in terms of dollars spent. (Figure 8) The trouble is, however, that those dollars are being spread across nearly the same number of organizations as San Francisco and 1.7 times the number in Minneapolis.
$0
$100
$200
$300
$400
$500
$600
$700
$800
SeattlePhiladelphia San FranciscoMinneapolisChicagoBoston New York
Mill
ions
Mill
ions
$0
$4,000
$3,500
$3,000
$2,500
$2,000
$1,500
$1,000
$500
59%
8%
12%
10%
11%
35%
29%
13%
15%
8%
18%
11%
48%
18%
6%
22%
33%
20%
19%
5%
45%
20%
9%
13%
12%
63%
17%
21%
36%
30%
20%
14%
$20–40M $40–75M Over $75M$10–20M$5–10M
FIGURE 6
Total Expenses for Large Organizations, Select Cities (in millions)
Source: Guidestar 2012

16 U n d e r s t a n d i n g B o s t o n
DisciplinesOrganizations in Boston reported the desire to have a critical mass of activity in their disciplines. Without enough activity happening in their own art forms, artists cannot form the creative communities necessary to push their thinking and practice. More practically, without a critical mass of activity in their disciplines at all budget sizes, artists struggle to make a living, hone their craft, and consider moving to other communities. Arts audiences too are served by depth and breadth of offerings across disciplines.
The overall distribution of disciplines in Boston is not markedly different from the other cities. In most of the cities studied, performing arts and history are the most dominant disciplines. The community disci-pline is also a large group, including cultural/ethnic awareness, folk arts, community celebrations, and commemorative events, along with arts education. Museums, arts service organizations, and film/TV/radio each represent a smaller slice.
At first glance, Boston’s distribution of organizations looks consistent with those general patterns with some variations: It’s on the heavier side for history and film/TV/radio.11 The performing arts, however, is the place where there are the largest variations in Boston:
0
5
10
15
20
25
30
SeattlePhiladelphia San FranciscoPortlandMinneapolisHoustonClevelandChicagoBaltimoreBoston New York0
140
120
100
80
60
40
20
3
3
5
1
11
3
4
8
4
9
5
7
3
9
5
2
10
4
6
8
4
9
13
8
1
8
6
1
4
1
5
4
412
3
22
11
9
13
35
67
14
$10–20M $20–40M $40–75M Over $75M$5–10M
FIGURE 7
Distribution of Large Organizations by Budget Size
$10–75M 9 3 16 5 9 15 15 4 19 12 62
Source: Guidestar 2012
$0
$568$409
$167
$243
$83
$676
$85
$257
$356
$555
$3,215$1,688
$3,500$2,500$1,500$500
Expenses of $75M+ cohort Expenses of all other organizations
Boston
Baltimore
Chicago
Cleveland
Houston
Minneapolis
New York
Philadelphia
Portland
San Francisco
Seattle
$162
$725
$214
$901
$466
Millions
FIGURE 8
Total Expenses of $75M+ Organizations vs. All Others
Source: Guidestar 2012
17H o w B o s t o n a n d O t h e r A m e r i c a n C i t i e s S u p p o r t a n d S u s t a i n t h e A r t s
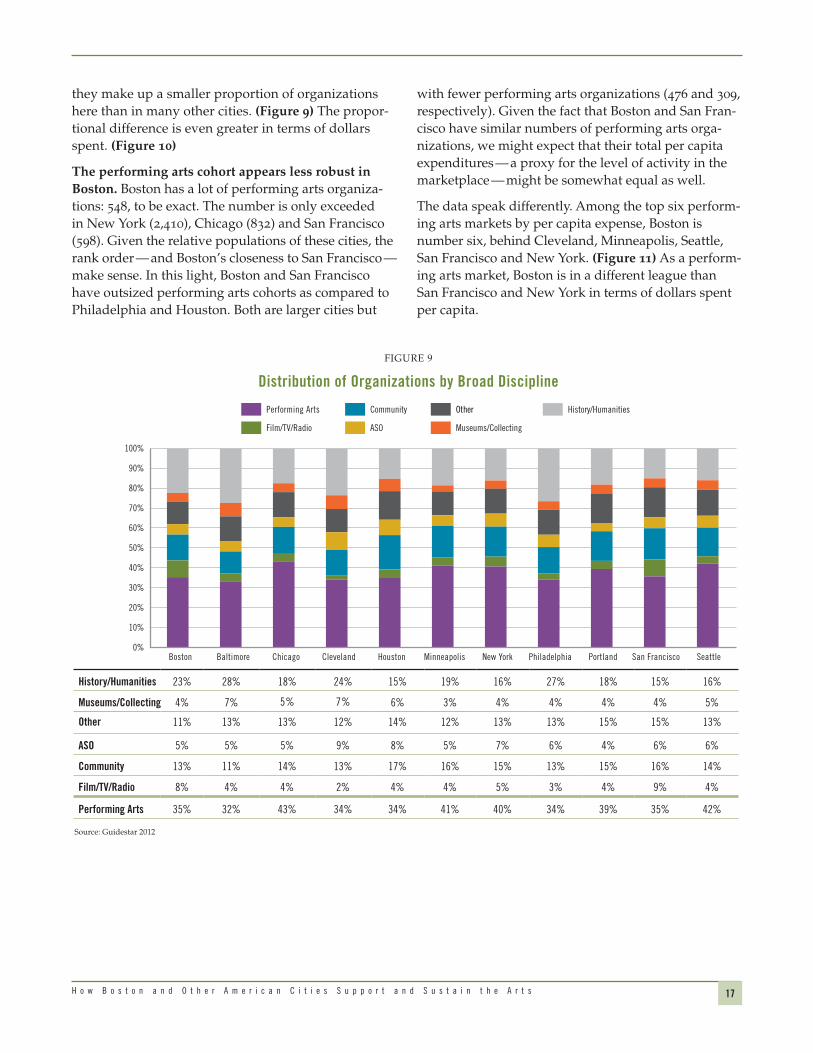
with fewer performing arts organizations (476 and 309, respectively). Given the fact that Boston and San Fran-cisco have similar numbers of performing arts orga-nizations, we might expect that their total per capita expenditures — a proxy for the level of activity in the marketplace — might be somewhat equal as well.
The data speak differently. Among the top six perform-ing arts markets by per capita expense, Boston is number six, behind Cleveland, Minneapolis, Seattle, San Francisco and New York. (Figure 11) As a perform-ing arts market, Boston is in a different league than San Francisco and New York in terms of dollars spent per capita.
they make up a smaller proportion of organizations here than in many other cities. (Figure 9) The propor-tional difference is even greater in terms of dollars spent. (Figure 10)
The performing arts cohort appears less robust in Boston. Boston has a lot of performing arts organiza-tions: 548, to be exact. The number is only exceeded in New York (2,410), Chicago (832) and San Francisco (598). Given the relative populations of these cities, the rank order — and Boston’s closeness to San Francisco — make sense. In this light, Boston and San Francisco have outsized performing arts cohorts as compared to Philadelphia and Houston. Both are larger cities but
0%
10%
20%
30%
40%
50%
60%
70%
80%
90%
100%
SeattleNew York Philadelphia Portland San FranciscoHouston MinneapolisChicago ClevelandBaltimoreBoston
Film/TV/Radio
Performing Arts
ASO
Other
Museums/Collecting
History/HumanitiesCommunity
FIGURE 9
Distribution of Organizations by Broad Discipline
Source: Guidestar 2012
History/Humanities 23% 28% 18% 24% 15% 19% 16% 27% 18% 15% 16%
Museums/Collecting 4% 7% 5% 7% 6% 3% 4% 4% 4% 4% 5%
Other 11% 13% 13% 12% 14% 12% 13% 13% 15% 15% 13%
ASO 5% 5% 5% 9% 8% 5% 7% 6% 4% 6% 6%
Community 13% 11% 14% 13% 17% 16% 15% 13% 15% 16% 14%
Film/TV/Radio 8% 4% 4% 2% 4% 4% 5% 3% 4% 9% 4%
Performing Arts 35% 32% 43% 34% 34% 41% 40% 34% 39% 35% 42%

18 U n d e r s t a n d i n g B o s t o n
All Performing Arts
Boston
Cleveland
Minneapolis
Seattle
San Francisco
New York
$52.50$56.75 $58.96
$63.17
$86.97 $88.26
$0
$10
$20
$30
$40
$50
$60
$100
$90
$80
$70
FIGURE 11
Top Six Performing Arts Markets by Per Capita Expense
Sources: Guidestar 2012, ACS 2012
In terms of performing arts sub-disciplines, Boston has high per capita spending on music, middling spend-ing on dance, and low spending in theater and other performing arts. (Figure 12) After the influence of large organizations is removed, the impact of the miss-ing $10 million-$75 million stratum in theater is made clear. (Figure 13) While theater looks lackluster as a whole, the small and mid-sized cohorts appear more robust on their own. This finding aligns with focus groups, which noted the presence of a strong fringe theater scene in Boston. The converse image is found for small and mid-sized dance. With the exception of Boston’s single large dance institution, the Boston Ballet, the other organizations are very small. These findings are also consistent with feedback about dance from focus groups.
0%
10%
20%
30%
40%
50%
60%
70%
80%
90%
100%
SeattleNew York Philadelphia Portland San FranciscoHouston MinneapolisChicago ClevelandBaltimoreBoston
Film/TV/Radio
Performing Arts
ASO
Other
Museums/Collecting
History/HumanitiesCommunity
FIGURE 10
Distribution of Expenses by Broad Discipline
Source: Guidestar 2012
History/Humanities 13% 19% 10% 4% 5% 11% 11% 16% 9% 8% 6%
Museums/Collecting 30% 23% 32% 37% 34% 13% 26% 26% 22% 23% 24%
Other 3% 5% 6% 4% 5% 7% 4% 4% 5% 6% 5%
ASO 2% 10% 1% 5% 12% 9% 7% 4% 7% 9% 7%
Community 4% 4% 6% 3% 5% 5% 7% 12% 13% 4% 3%
Film/TV/Radio 23% 4% 9% 1% 4% 24% 10% 5% 15% 14% 7%
Performing Arts 25% 35% 37% 46% 35% 31% 34% 32% 29% 36% 47%

19H o w B o s t o n a n d O t h e r A m e r i c a n C i t i e s S u p p o r t a n d S u s t a i n t h e A r t s
$0
$5
$10
$15
$20
$25
$30
$35
TheaterOther Performing ArtsMusicDance
Cleveland Minneapolis SeattleBoston San Francisco New York
FIGURE 12
Performing Arts Expense Per Capita, Top Six Markets, by Selected Sub-disciplines
Sources: Guidestar 2012, ACS 2012
$0
$1
$2
$3
$4
$5
$6
$8
$7
TheaterOther Performing ArtsMusicDance
Cleveland Minneapolis SeattleBoston San Francisco New York
FIGURE 13
Per Capita Expense, Performing Arts Sub-disciplines, Small and Mid-sized Organizations
Sources: Guidestar 2012, ACS 2012
Boston Cleveland Minneapolis Seattle San Francisco New York
Dance $0.72 $0.98 $1.73 $0.65 $5.55 $3.61
Music $6.71 $3.78 $5.14 $5.10 $7.99 $4.34
Other Performing Arts $1.04 $0.57 $3.44 $2.22 $3.55 $2.57
Theater $4.62 $3.71 $6.40 $5.04 $7.85 $6.93
Boston Cleveland Minneapolis Seattle San Francisco New York
Dance $6.89 $0.98 $1.73 $6.62 $16.32 $12.93
Music $25.36 $28.57 $18.46 $12.03 $31.99 $11.80
Other Performing Arts $2.42 $0.57 $6.56 $8.44 $19.47 $26.68
Theater $10.24 $7.60 $25.69 $21.13 $17.01 $19.16

20 U n d e r s t a n d i n g B o s t o n
Boston
Baltimore
Chicago
Cleveland
Minneapolis
New York
Philadelphia
San Francisco
0% 20% 40% 60% 80% 100%
41%
38%
48%
48%
60%
51%
62%
52%
Boston
Baltimore
Chicago
Cleveland
Minneapolis
New York
Philadelphia
San Francisco
0% 20% 40% 60% 80% 100%
48%
61%
64%
37%
66%
63%
65%
72%
Boston
Baltimore
Chicago
Cleveland
Minneapolis
New York
Philadelphia
San Francisco
0% 20% 40% 60% 80% 100%
67%
60%
75%
86%
78%
77%
78%
80%
Small Mid-sized Large
FIGURE 14
Percentage of Organizations with at Least One New Work, by Budget Size
Source: CDP 2012
Programmatic InnovationAnother measure of an arts market’s depth is the availability of never-before-seen artworks. CDP offers a view into programmatic innovation by providing counts of new works produced, including commis-sions, premieres and exhibition openings. While production of new works is only one aspect of programmatic innovation, it is the only quantitative measure of this dimension available to analyze.
Boston’s organizations have a lower rate of new work production than peers in other cities. In focus groups, Boston organizations spoke about the critical importance of ticket sales to their financial sustain-ability. While they took pride in their ability to engage audiences, they also reported a concern that their dependence on earned revenue (as discussed on Chapter Two) may drive them to make safe program-matic choices. This impression is supported in CDP data, which show that less than half of Boston’s small and mid-sized organizations reported producing any new works. (Figure 14)
It is possible to interpret lower rates of programmatic innovation in Boston as simply a reflection of more conservative tastes. While organizations concurred in focus groups that they were catering to their audi-ences’ preferences, they also wondered if they were neglecting an unspoken responsibility of the arts to bring new ideas and experiences to their audiences.
Cultural EquityAnother aspect of depth that is current in the national dialogue on the arts is cultural equity. To define the concept, cultural equity is the principle that all people should have equitable opportunities for cultural expression and that arts ecosystems should reflect a multiplicity of traditions, art forms and identities.
Boston is ready for a conversation about cultural equity. In focus groups with Boston organizations, TDC heard that cultural equity is a priority for them. Small and mid-sized organizations in particular expressed commitment to addressing issues of social justice, equality and diversity through their work. At the same time, they reported that they lack the philan-thropic support to carry out this work individually or collaboratively.
Across the cities studied, interviewees raised questions about whether their arts ecosystems reflect, respond to and represent their populations. They are joined in their concern by the United Nations, which declared cultural rights, such as “the right to participate in cultural life and enjoy one’s culture,” as a component of basic human rights, and Grantmakers in the Arts, which recently adopted a statement of purpose on racial equity in arts philanthropy.
Studies of cultural participation from the National Endowment for the Arts have found that audiences for traditional arts experiences tend to skew white,

21H o w B o s t o n a n d O t h e r A m e r i c a n C i t i e s S u p p o r t a n d S u s t a i n t h e A r t s
female, highly educated and affluent and that non-white adults are less likely to take part in many types of arts activities.12 Changing demographics have made this issue increasingly important. Of the cities included in this study, all but three now have majority-minority urban cores. The city of Boston became majority-minority as of the 2010 US Census.
In interviews, TDC heard that other cities have begun to address cultural equity at a systemic level. The San Francisco Arts Commission has targeted all of its grant making to organizations and individuals deeply rooted in historically underserved communities. New York’s Department of Cultural Affairs is investing in equity goals in several ways: studying the racial makeup of staff at cultural organizations; an identification card program that offers free access to cultural institutions to undocumented immigrants; and a capacity building program for leaders of community-based cultural orga-nizations. The Office of Arts, Culture and the Creative Economy in Philadelphia, which is about to release new research on cultural equity, is seeking funding for a new initiative to support leaders of community-based cultural organizations. The Seattle Office of Arts and Culture has partnered with the city’s Office of Civil Rights to offer workshops in racial equity for arts organizations and provide services for artists of color in the city.
The available data for this report do not allow straight-forward measurement of cultural equity, and meth-odologies are still being developed in a growing body of research. Three prominent methods are: measur-ing contributed revenue to organizations at different budget sizes; comparing the location of audiences and organizations to communities of color; and analyzing the demographics of organizations’ staff and leadership relative to that of the community. These methodolo-gies are new and evolving, and reflective of differing definitions and priorities. Each offers its own insights and limitations, and none was conclusive enough to provide a data-driven finding on cultural equity for this report. Nevertheless, changing demographics and the ongoing dialogue in the arts community suggest that a conversation about cultural equity should be had in Boston today, and TDC’s qualitative focus groups and interviews indicate that the city’s arts organizations and funders would welcome that conversation.
AssetsTurning from the issue of depth in the system, the final two sections in this chapter focus on two key assets required by arts organizations to present their programs and operate effectively: unrestricted cash and facilities.
Unrestricted CashOrganizations need reserves in the form of cash on hand for numerous purposes, including working capi-tal, reserves against operating risks, funds to invest in new opportunities — and, for some, resources for future facilities needs. To understand whether organi-zations have access to the cash they need to apply to these needs, TDC studied months of available unre-stricted net assets (“available URNA”), or the sum total of the liquid resources organizations have built up through surpluses that are not subject to donor restrictions.13
Studying available URNA is not a diagnosis of finan-cial health. It can only help to identify the minimum number of organizations that may be in a state of financial distress — those with less than one month of available URNA. However, organizations with high capital needs can be in financial distress, even if they have positive unrestricted net assets.14
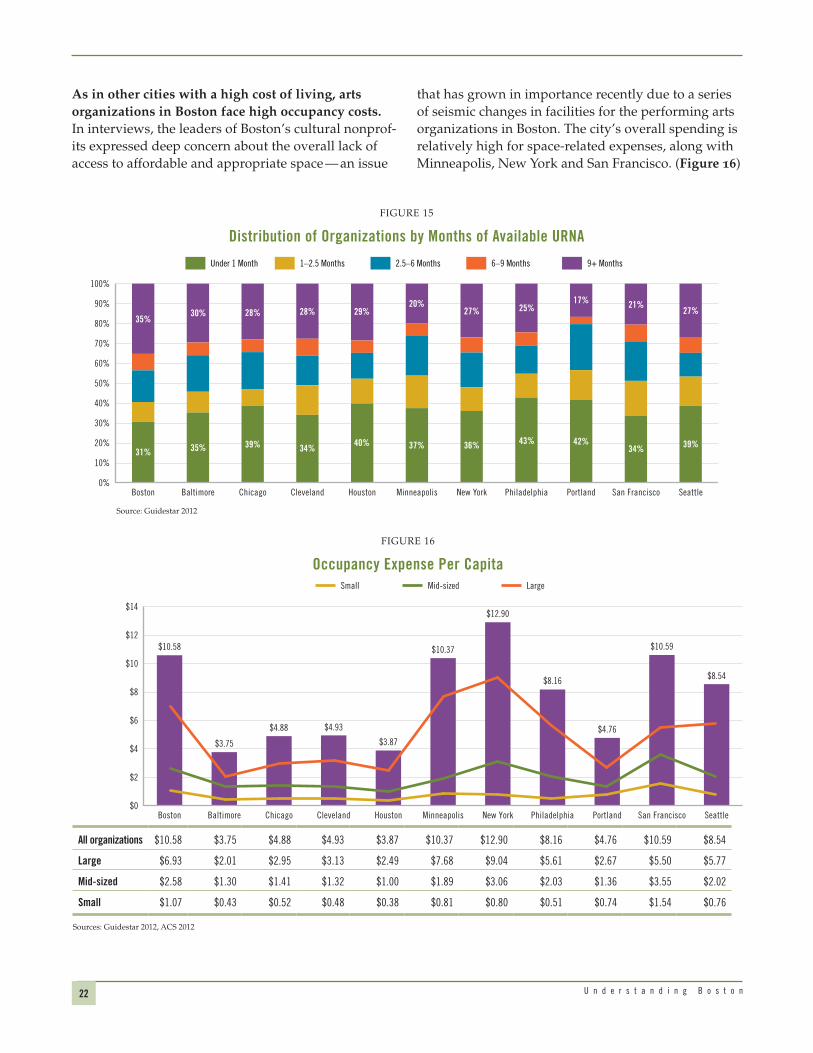
Among all of the cities in this study, between 30 and 45 percent of cultural organizations had less than one month of available URNA. However, Boston had the lowest proportion of organizations in this precarious financial state among the 11 cities. (Figure 15)
Available URNA appears to be correlated with disci-pline. History organizations are less likely to be in the group with less than one month of available URNA. Performing arts organizations are more likely to be in that group. These two discipline groups also happen to be the largest. In Boston, the picture skews positively because its history organizations have more available URNA than average and its performing arts organiza-tions have less.
FacilitiesFacilities were a subject emphasized by organizations as a severe constraint in Boston. This section looks at the issue of facilities from two vantage points: annual occupancy costs and ownership.
22 U n d e r s t a n d i n g B o s t o n
Sources: Guidestar 2012, ACS 2012
FIGURE 16
Occupancy Expense Per Capita
$0
$8
$6
$4
$2
$10
$12
$14
SeattleNew York Philadelphia Portland San FranciscoHouston MinneapolisChicago ClevelandBaltimoreBoston
$10.58
$3.75
$4.93
$3.87
$10.37
$8.16
$4.76
$8.54
$10.59
$4.88
$12.90
Small Mid-sized Large
All organizations $10.58 $3.75 $4.88 $4.93 $3.87 $10.37 $12.90 $8.16 $4.76 $10.59 $8.54
Large $6.93 $2.01 $2.95 $3.13 $2.49 $7.68 $9.04 $5.61 $2.67 $5.50 $5.77
Mid-sized $2.58 $1.30 $1.41 $1.32 $1.00 $1.89 $3.06 $2.03 $1.36 $3.55 $2.02
Small $1.07 $0.43 $0.52 $0.48 $0.38 $0.81 $0.80 $0.51 $0.74 $1.54 $0.76
As in other cities with a high cost of living, arts organizations in Boston face high occupancy costs. In interviews, the leaders of Boston’s cultural nonprof-its expressed deep concern about the overall lack of access to affordable and appropriate space — an issue
that has grown in importance recently due to a series of seismic changes in facilities for the performing arts organizations in Boston. The city’s overall spending is relatively high for space-related expenses, along with Minneapolis, New York and San Francisco. (Figure 16)
0%
10%
20%
30%
40%
50%
60%
70%
80%
90%
100%
SeattleNew York Philadelphia Portland San FranciscoHouston MinneapolisChicago ClevelandBaltimoreBoston
Under 1 Month 1–2.5 Months 2.5–6 Months 6–9 Months 9+ Months
35%
31%
30%
35%
28%
39%
28%
34%
29%
40%
20%
37%
27%
36%
25%
43%
17%
42%
21%
34%
27%
39%
FIGURE 15
Distribution of Organizations by Months of Available URNA
Source: Guidestar 2012

23H o w B o s t o n a n d O t h e r A m e r i c a n C i t i e s S u p p o r t a n d S u s t a i n t h e A r t s
Sources: Guidestar 2012, ACS 2012
$0
$800
$600
$400
$200
$1,000
$1,400
$1,200
$3,100
$0
$300
$250
$200
$150
$100
$50
SeattleNew York Philadelphia Portland San FranciscoHouston MinneapolisChicago ClevelandBaltimoreBoston
$218
$1,004
$54
$248
$100
$188$205
$75
$171
$134
$110
$1,047
$147
$512$625 $588
$170
$597
1,229
3,040
$608
$160
Total facilities fixed assets Per capita
Mill
ions
Per C
apita
FIGURE 17
Value of Facilities by Fixed Asset
Boston
Baltimore
Chicago
Cleveland
Houston
Minneapolis
New York
Philadelphia
Portland
San Francisco
Seattle
$0 $1 $2 $3 $4 $5 $6 $7 $8
$7.17
$6.74
$3.09
$2.13
$4.64
$3.63
$1.48
$3.92
$2.91
$4.86
$3.03
Boston
Baltimore
Chicago
Cleveland
Houston
Minneapolis
New York
Philadelphia
Portland
San Francisco
Seattle
$0 $10 $20 $30 $40 $50
$34
$26
$18
$18
$23
$26
$21
$9
$23
$33
$42
Boston
Baltimore
Chicago
Cleveland
Houston
Minneapolis
New York
Philadelphia
Portland
San Francisco
Seattle
$0 $50 $100 $150 $200 $250
$177
$21
$89
$227
$73
$159
$137
$62
$108
$133
$160
Small Mid-sized Large
FIGURE 18
Per Capita Value of Facilities by Fixed Asset and Budget Size
Sources: Guidestar 2012, ACS 2012
One interesting finding in TDC’s analysis is that performing arts organizations in Boston are not spending as much on facilities as other organizations in other disciplines. It suggests that these organiza-tions may be living, rehearsing and performing in free or cheap space. The city’s many universities and
places of worship are resources in this regard. Free or subsidized space, however, is a double-edged sword. It is often not equipped with desired amenities or equipment; and it is often not guaranteed, leav-ing organizations living under the constant threat of displacement.

24 U n d e r s t a n d i n g B o s t o n
Owning facilities is costly in Boston. Organizations that own their own facilities have costs that go far beyond simple occupancy expenses. They must peri-odically invest in their buildings and include those expenses on profit-and-loss statements as deprecia-tion. While in any given year depreciation is a non-cash expense, it represents very real cash outlays when the inevitable happens and the roof, boiler or other building system needs replacement.
To identify facilities-owning organizations, TDC focused on those that had $1 million or more in land, buildings and equipment (LBE) assets on their balance sheet, after accounting for cost-of-living differences.
The per capita value of Boston’s total LBE assets was very high, with Boston ranking either first or second in LBE assets per capita for organizations of all budget sizes. (Figures 17 and 18) This scale of facilities stew-ardship demands a high degree of available cash for the continual demands of facilities maintenance and renewal.
Boston organizations have limited channels of support for facilities-related expenses. As noted earlier, the Massachusetts Cultural Facilities Fund was established in 2007 to provide funds for maintaining and improving the Commonwealth’s cultural facili-ties. Many of those grants, which are awarded through a competitive process, have gone to Greater Boston’s cultural facilities, but that fund does not provide guar-anteed, annual, consistent support to any single orga-nization. It also has a statewide scope, further limiting the pool of funds for Boston organizations.
The City of Boston does not provide support for arts facilities. Boston’s landmark institutions must handle the full scope of their annual facilities-related expenses themselves, while some peer institutions in cities such as New York, San Francisco and Philadelphia are housed in city-owned and maintained buildings. While it is difficult to quantify the precise level of support that other city agencies provide their cultural institu-tions, it is safe to say that both New York and San Fran-cisco dedicate tens of millions of dollars every year toward targeted facilities support.
Boston’s smaller organizations also have limited avenues for support on high facilities costs. This picture is different in San Francisco, where smaller organizations can receive support from the city’s Nonprofit Displacement Mitigation Program or through the Community Arts Stabilization Trust. While these programs are not a complete solution, they do offer a limited safety net in response to a skyrocket-ing real estate market. As Boston contends with a rapid series of changes in arts facilities, these elements of high costs, high fixed-asset burden and limited safety net are important parts of the context for any intervention.
What does Boston have and what does it lack?
The data indicate that Boston’s arts ecosystem contin-ues to have great breadth. An important finding was that under the surface of abundance Boston’s arts market is highly constrained, resulting in unevenness in the depth of arts organizations along a number of dimensions and also in their access to critical assets.
In focus groups, Boston organizations confirmed these findings. They reported that they work in a constrained system, one where they are able to gain enough support to operate, but not enough to take on programmatic risk or coordinate larger initiatives. For these organizations, there is a link between the constraints they experience, and the profile of Boston’s arts ecosystem, and the revenue streams that support the system.
The next chapter analyzes the sources of revenue that are driving Boston’s ecosystem and how they compare with revenues in other cities.

25H o w B o s t o n a n d O t h e r A m e r i c a n C i t i e s S u p p o r t a n d S u s t a i n t h e A r t s
organization’s offerings. As such, they are an indicator of audience engagement.
High per capita participation-based earned revenue suggests that audiences in Boston are engaged, will-ing to pay high prices — or both. As found in the 2003 report, Boston’s earned revenue is relatively strong when compared to the other cities. (Figure 19) In the 2003 report, Boston’s cultural nonprofits had the second-highest level of total earned revenue, after New York. In 2012, Boston organizations earned nearly $350 million, putting Boston in third place for per capita revenue behind New York and San Francisco.
The available data do not reveal whether attendance or pricing is the primary driver for Boston’s robust earnings.18 But attendance is most likely a significant factor, since earned revenue also aligns closely with tourist volume. Among all of the cities, New York had the highest tourist volume, followed by San Francisco and Boston. In 2014, Boston’s local arts audiences were bolstered by visits from 16 million tourists. High per capita revenue suggests that pricing is also a factor. A review of pricing data in the Cultural Data Project suggests that Boston’s performing arts organizations charge the highest average adult ticket prices of all of the cities in the study.
Boston’s small and mid-sized organizations earn more than their peers in other cities, but they are also more dependent on participation-based earned revenues. Examining per capita figures by budget size reveals that Boston’s small and mid-sized arts organizations have very high levels of participation-based earned revenue, with only San Francisco tracking closely to Boston’s numbers. (Figures 19 and 20) Not only is earned revenue per capita very high among Boston’s small and mid-sized organizations, it also comprises a greater proportion of the entire revenue mix for those organizations. (Figure 21)
Greater Boston’s arts ecosystem received nearly $1.1 billion dollars in revenues in 2012. These revenues can be divided into two key streams: earned and contrib-uted revenues. This chapter defines and reports on the volume, make up and distribution of the two key reve-nue streams across the comparison cities. The goal for the analysis was not to determine organizational-level business model strength, but rather to take a systemic look at how (and why) money moves through the market.15
The trouble with teasing out the meaning behind why the money flows in a certain way and how that flow could (or should) change is that there are multiple forces at play. Some revenue streams, such as earned revenue and individual contributions, are merely the amalgam of many actors in the market making their own decisions. Others exist only because an external player, such as a foundation or government agency, decided to create them. In Boston, this latter stream is weak, which may account for the resource constraints described in the previous chapter.
Earned RevenueEarned revenues are the result of organizations creat-ing a product from their assets that someone in the marketplace wants to purchase. For the most part, these revenues result from the organizations’ own efforts, with success resulting when organizations match products to demand. There are two types of earned revenue — participation-based, which includes funds from ticket sales, and non-participation-based, such as income from function rentals, royalties or investment returns.16
Participation-Based Earned RevenueParticipation-based revenue makes up over 75 percent of earned revenue in each city. They are derived from ticket sales, tuition, admissions, and other fees paid by individuals who wish to participate in an
CHAPTER TWO
How Does Boston’s Funding Landscape Compare to Other Cities?

26 U n d e r s t a n d i n g B o s t o n
Boston
Baltimore
Chicago
Cleveland
Houston
Minneapolis
New York
Philadelphia
Portland
San Francisco
Seattle
$0 $1 $2 $3 $4 $5 $6 $8$7 $9
$7
$3
$3
$3
$2
$4
$3
$5
$7
$4
$3
Boston
Baltimore
Chicago
Cleveland
Houston
Minneapolis
New York
Philadelphia
Portland
San Francisco
Seattle
$0 $5 $10 $20$15 $25 $35$30
$23
$10
$9
$8
$6
$15
$18
$13
$28
$13
$12
Boston
Baltimore
Chicago
Cleveland
Houston
Minneapolis
New York
Philadelphia
Portland
San Francisco
Seattle
$0 $20 $40 $60 $80
$45
$10
$28
$32
$16
$51
$74
$28
$45
$44
$25
Small Mid-sized Large
FIGURE 20
Total Participation-Based Earned Revenue Per Capita by Budget Size
Source: Guidestar 2012
$0
$200
$100
$400
$300
$1,800
$0
$120
$100
$80
$60
$40
$20
SeattleNew York Philadelphia Portland San FranciscoHouston MinneapolisChicago ClevelandBaltimoreBoston
$73
$337
$60$42
$23
$70$40
$102
$60
$80
$40
$381
$22
$88
$233
$353
$45
$210$237
$1,798
$140
$94
Total earned revenue Per capita
Mill
ions
Per C
apita
FIGURE 19
Participation-Based Earned Revenue17
Source: Guidestar 2012

27H o w B o s t o n a n d O t h e r A m e r i c a n C i t i e s S u p p o r t a n d S u s t a i n t h e A r t s
FIGURE 21
Participation-Based Earned Revenue by Budget Size, Boston vs. All Other Cities
Small
Mid-sized
Large
50%0%
41%
31%
45%
35%
35%
27%
10% 20% 30% 40%
Boston All other cities
Source: Guidestar 2012
Non-Participation-Based Earned Revenue: EndowmentsNon-participation based revenues are generally not tied to audience engagement, and are instead instances of organizations leveraging assets such as invest-ments, excess facilities capacity, or intellectual prop-erty. For most organizations, non-participation-based
revenues are not a key part of their business model, and aggregately they make up less than 25 percent of total earned revenues. The largest portion of these revenues are investment returns, which are typically tied to endowments. Therefore, this report focuses on endowments.
Endowments can offer nonprofits a steady source of income over time to support operating expenses or more targeted needs, such as facilities renewal. They are an essential part of the business model for organizations stewarding collections or historic property and other facilities in perpetuity. For any organization, they can ease the pressure to earn or raise revenues on an annual basis. Like earned revenues, endowments are an organizationally controlled revenue stream. They are a result of a financial choice, made by an organization and its inner circle of supporters, to allocate capital toward longevity.
Boston’s cultural organizations at all budget sizes are heavily invested in endowments. Only Cleveland has more endowment dollars per capita than Boston. (Figure 22) Nationally, it is more common for larger organizations to hold endowments than smaller ones. But in Boston, organizations at every budget size have more dollars invested in endowments than those in the other cities in the study. (Figure 23)
$0
$1,500
$500
$2,500
$2,000
$6,500
$0
$500
$450
$400
$350
$200
$250
$300
$150
$100
$50
SeattleNew York Philadelphia Portland San FranciscoHouston MinneapolisChicago ClevelandBaltimoreBoston
$422
$1,942
$184
$966
$266
$224
$263
$59$79
$260
$87
$831
$67
$467
$743
$1,144
$134 $277
$1,576
$6,190
$1,617
$325
Total funds Per capita
Mill
ions
Per C
apita
$1,000
FIGURE 22
Total Funds Invested in Endowments
Sources: Guidestar 2012, ACS 2012

28 U n d e r s t a n d i n g B o s t o n
Boston
Baltimore
Chicago
Cleveland
Houston
Minneapolis
New York
Philadelphia
Portland
San Francisco
Seattle
$0 $1 $2 $3 $4 $5 $6 $7 $8
$6.72
$1.20
$2.04
$3.92
$1.65
$2.23
$3.23
$1.33
$1.11
$6.24
$1.51
Boston
Baltimore
Chicago
Cleveland
Houston
Minneapolis
New York
Philadelphia
Portland
San Francisco
Seattle
$0 $10 $20 $30 $40 $50
$35
$12
$3.22
$24
$25
$13
$15
$17
$16
$33
$35
Boston
Baltimore
Chicago
Cleveland
Houston
Minneapolis
New York
Philadelphia
Portland
San Francisco
Seattle
$0 $100 $200 $300 $400 $500
$381
$54
$82
$439
$239
$209
$307
$41
$243
$40
$226
Small Mid-sized Large
FIGURE 23
Total Funds Invested in Endowments Per Capita by Budget Size
Sources: Guidestar 2012, ACS 2012
One potential reason that endowments are more preva-lent in Boston than in the other cities is the strong pres-ence of collecting institutions, including museums and historic sites. With large collections, historic buildings and other property, these organizations have a busi-ness model that demands the steadying effect of an endowment. More than half of endowment-holding organizations in Boston are collecting institutions.
Boston’s donors past and present have demonstrated their understanding of the need for endowments. While many endowments are the legacy of decades of close relationships with donors, a number of Boston’s arts institutions are continuing to raise endowments today. The Cultural Data Project, which tracks data on capital campaign goals and rates of completion, reports that Boston’s capital campaigns have the highest level of endowment goals among all of cities in this study and were the most likely among all study cities to real-ize these goals. (Figure 24)
Boston
Baltimore
Chicago
Cleveland
Minneapolis
New York
Philadelphia
San Francisco
100%0%
72%
20%
38%
40%
41%
48%
74%
19%
20% 40% 60% 80% 90%10% 30% 50% 70%
Source: CDP 2012
FIGURE 24
Percentage of Endowment Goal Raised

29H o w B o s t o n a n d O t h e r A m e r i c a n C i t i e s S u p p o r t a n d S u s t a i n t h e A r t s
Contributed RevenueContributed revenue consists of gifts and grants from individuals, foundations, corporations and government, including federal, state and local agencies. In general, donors are individuals and funders are institutions. As with participation-based earned revenue, contribu-tions reflect the degree to which an arts organization is perceived as a vibrant, relevant contributor to the arts and cultural life of the city. That relevance can reflect the personal tastes and preferences of a donor. It can also
$0
$400
$200
$800
$600
$2,800
$0
$200
$180
$160
$140
$80
$100
$120
$60
$40
$20
SeattleNew York Philadelphia Portland San FranciscoHouston MinneapolisChicago ClevelandBaltimoreBoston
$129
$592
$135$166
$42
$115
$67
$51
$70
$170
$48
$458
$49
$80
$383
$746
$116
$244
$403
$2,736
$259
$144
Total contributed revenue Per capita
Mill
ions
Per C
apita
FIGURE 25
Total Contributed Revenue
Sources: Guidestar 2012, ACS 2012
0% 20%10% 40%30% 50% 60% 80%70% 90% 100%
San Francisco
New York
Philadelphia
Minneapolis
Chicago
Cleveland
Baltimore
Boston
Foundation
Government
Corporate
Other
Individual23%17% 6% 4%50%
16%13% 35% 6%30%
16%16% 14% 10%44%
11%27% 15% 10%38%
9%19% 29% 12%32%
18%18% 15% 6%42%
22%23% 11% 5%39%
13%22% 12% 5%48%
FIGURE 26
Distribution of Contributed Revenue by Type
Source: CDP 2012
Note: One outlier in Boston and one outlier in San Francisco were removed.
reflect a funder’s philanthropic strategy. Or, it can reflect a sector-wide view taken by private foundations with a sector strategy, public agencies, or civically minded indi-viduals that place the arts in a community-wide context.
Among all of the cities in this study, Boston had the third highest per capita rate of contributed revenue. (Figure 25) However, these revenues come largely from individuals and not institutional funders such as foundations, corporations and government entities, which in the other cities play a larger role. (Figure 26)

30 U n d e r s t a n d i n g B o s t o n
The high rate of individual contributions to Boston’s small organizations is striking when compared to the other cities, and suggests that Boston’s smaller arts and cultural nonprofits are connecting with individual donors in a meaningful way. Raising money from indi-viduals is very resource intensive, however, primarily relying on dedicated staff and volunteers reaching out to donors for support. In interviews and focus groups, Boston organizations noted that fundraising activities rely heavily on the time and efforts of executive direc-tors and sometimes come at the expense of long-term planning and other activities.
FIGURE 28
Median Individual Giving by Budget Size, Select Cities
Boston
Baltimore
Chicago
Cleveland
Minneapolis
New York
Philadelphia
San Francisco
$0 $5 $10 $15 $20 $30$25 $35
$28.6
$13.0
$11.2
$18.3
$13.2
$10.8
$16.6
$18.0
Boston
Baltimore
Chicago
Cleveland
Minneapolis
New York
Philadelphia
San Francisco
$0 $50 $100 $150 $200 $250
$170.5
$114.7
$142.8
$196.4
$116.7
$123.0
$131.8
$99.7
Boston
Baltimore
Chicago
Cleveland
Minneapolis
New York
Philadelphia
San Francisco
$0 $2,000 $6,000$4,000
$2,941
$1,347
$2,170
$2,139
$2,066
$1,860
$5,395
$2,091
Small Mid-sized Large
Thousands Thousands Thousands
Sources: CDP 2012, ACS 2012
Individual GivingBoston organizations rely heavily on individual donors. Boston’s contributed revenue by individuals is strong when compared to the other cities in the study. As with earned revenue, Boston lags only New York and San Francisco in contributions from individuals per capita. (Figure 27)
Arts and cultural organizations in Boston of all sizes rely on individuals as a key and steady source of contributed revenue. Among all of the cities, Boston’s organizations have the highest or second high-est median individual giving for all budget sizes. (Figure 28)
FIGURE 27
Total Individual Contributions19
Sources: CDP 2012, ACS 2012
$0
$100
$600
$900
$0
$90
$70
$60
$50
$30
$20
San FranciscoNew York PhiladelphiaMinneapolisChicago ClevelandBaltimoreBoston
$37
$169
$19
$63
$22
$134
$81
$7
$19
$21
$195
$356
$784
$41
$22
$47
Total individual contributions Per capita
Mill
ions
Per C
apita
$500
$800
$700
$200
$300
$400
$80
$40
$10

31H o w B o s t o n a n d O t h e r A m e r i c a n C i t i e s S u p p o r t a n d S u s t a i n t h e A r t s
Capital campaign activity is high in Boston, and may contribute to the robust individual giving picture. In 2012, 38 organizations in Boston reported that they were conducting a capital campaign, with a whopping goal of $1.3 billion in funds for facilities and endow-ment.20 Only Cleveland outpaced Boston in this area.21 Data on the rate of completion for capital campaigns also suggest that Boston’s donors and funders understand the importance of capital campaigns. As mentioned in the previous section on endowments, Boston’s rate of capital campaign completion is the highest among all of cities in this study. (Figure 29)
Since it is difficult to separate campaign revenues from normal annual contributions, it is challenging to understand what portion is directed toward operating expenses versus campaign priorities. Since campaign gifts are often directed toward long-term fixed assets or endowment investments rather than immediate needs, campaigns can sometimes have a negative effect on annual operating expenses.
0% 20% 40% 60% 80% 100%
San Francisco
New York
Philadelphia
Minneapolis
Chicago
Cleveland
Baltimore
Boston
Total raised Total to raise
82%
66%
61%
65%
71%
74%
81%
67%$0
$1,400
$1,200
$1,000
$800
$600
$400
$200
$1,800
$1,600
$3,800
$0
$600
$500
$400
$300
$100
$200
NewYork
Philadelphia SanFrancisco
MinneapolisChicago ClevelandBaltimoreBoston
Endowment Per capita
Mill
ions
Tota
l Goa
l Per
Cap
ita
Facilities
FIGURE 29
Capital Campaign Goals and Rate of Completion, Select Cities
Sources: CDP 2012, ACS 2012
Corporate FundingCorporate giving in Boston is among the weakest in a weak field. There are two reasons for this weakness. First, corporate giving has been evolving nationally and increasingly is linked to the marketing and brand building of the funders. The arts and cultural nonprof-its that are the most successful in raising corporate funding are those that can expose a large audience to the company’s philanthropic support through advertis-ing and other promotional activities. Small and mid-sized organizations find it hard to compete with larger institutions in this climate.
Boston shows a particular weakness in this area, join-ing Baltimore in the bottom quartile in per capita corporate giving. (Figure 30) In contrast, Minneapolis and New York have retained relatively high levels of corporate funding.
Small $65M $18M $59M $16M $34M $196M $48M $69M
Mid-sized $223M $79M $224M $53M $121M $937M $215M $274M
Large $689M $70M $737M $189M $485M $3,770M $462M $720M

32 U n d e r s t a n d i n g B o s t o n
$0
$10
$60
$130
$0
$8
$7
$6
$5
$3
$2
San FranciscoNew York PhiladelphiaMinneapolisChicago ClevelandBaltimoreBoston
$3
$13
$7
$23
$3
$16
$4
$1
$4
$4
$42
$19
$122
$6
$6
$12
Total corporate support Per capita
Mill
ions
Per C
apita
$50
$20
$30
$40
$4
$1
FIGURE 30
Total Corporate Support, Select Cities
Source: CDP 2012, ACS 2012
FIGURE 31
Total Foundation Support, Select Cities
$0
$120
$20
$200
$160
$340
$0
$30
$20
$25
$15
$10
$5
San FranciscoNew York PhiladelphiaMinneapolisChicago ClevelandBaltimoreBoston
$28
$12
$128
$11
$37
$13
$79
$19
$3
$8
$7
$71$83
$339
$18
$16
$32
Total foundation support Per capita Per capita (excluding outlier)
Mill
ions
Per C
apita
$180
$100
$140
$40
$60
$80
Source: CDP 2012, ACS 2012
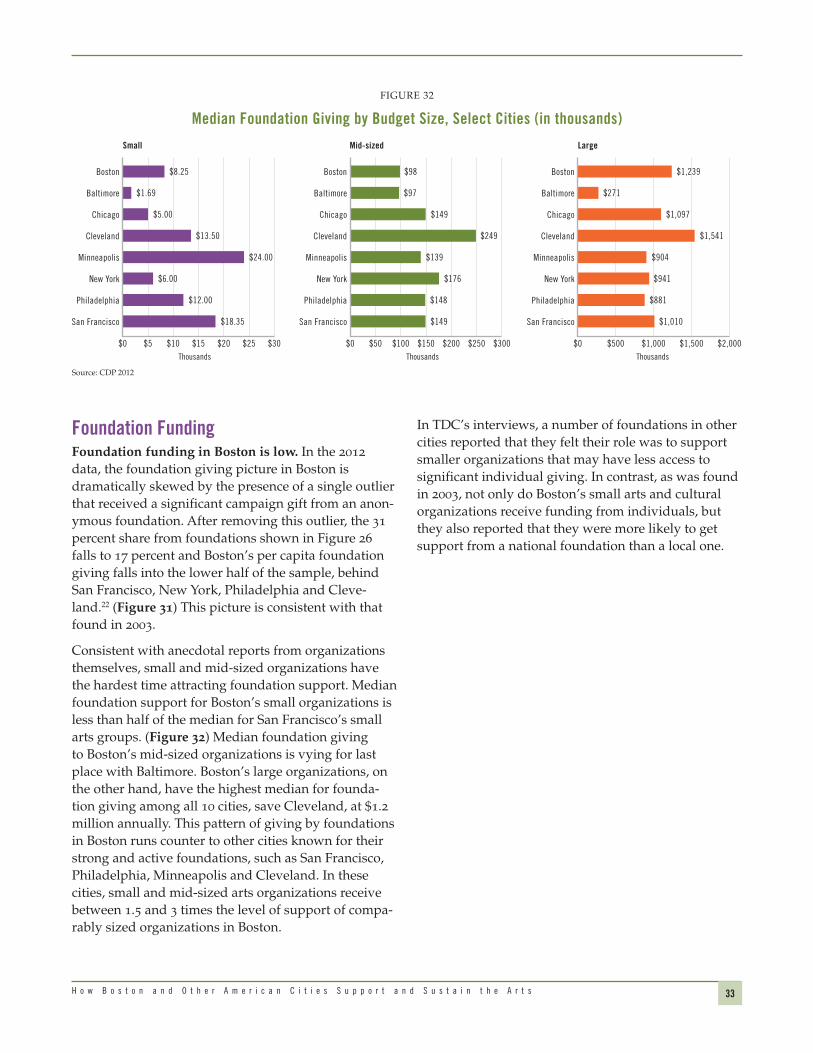
33H o w B o s t o n a n d O t h e r A m e r i c a n C i t i e s S u p p o r t a n d S u s t a i n t h e A r t s
Foundation FundingFoundation funding in Boston is low. In the 2012 data, the foundation giving picture in Boston is dramatically skewed by the presence of a single outlier that received a significant campaign gift from an anon-ymous foundation. After removing this outlier, the 31 percent share from foundations shown in Figure 26 falls to 17 percent and Boston’s per capita foundation giving falls into the lower half of the sample, behind San Francisco, New York, Philadelphia and Cleve-land.22 (Figure 31) This picture is consistent with that found in 2003.
Consistent with anecdotal reports from organizations themselves, small and mid-sized organizations have the hardest time attracting foundation support. Median foundation support for Boston’s small organizations is less than half of the median for San Francisco’s small arts groups. (Figure 32) Median foundation giving to Boston’s mid-sized organizations is vying for last place with Baltimore. Boston’s large organizations, on the other hand, have the highest median for founda-tion giving among all 10 cities, save Cleveland, at $1.2 million annually. This pattern of giving by foundations in Boston runs counter to other cities known for their strong and active foundations, such as San Francisco, Philadelphia, Minneapolis and Cleveland. In these cities, small and mid-sized arts organizations receive between 1.5 and 3 times the level of support of compa-rably sized organizations in Boston.
In TDC’s interviews, a number of foundations in other cities reported that they felt their role was to support smaller organizations that may have less access to significant individual giving. In contrast, as was found in 2003, not only do Boston’s small arts and cultural organizations receive funding from individuals, but they also reported that they were more likely to get support from a national foundation than a local one.
Source: CDP 2012
Boston
Baltimore
Chicago
Cleveland
Minneapolis
New York
Philadelphia
San Francisco
$0 $5 $10 $15 $20 $25 $30
$8.25
$1.69
$5.00
$13.50
$6.00
$12.00
$18.35
$24.00
Boston
Baltimore
Chicago
Cleveland
Minneapolis
New York
Philadelphia
San Francisco
$0 $50 $100 $150 $200 $300$250
$98
$97
$149
$249
$176
$148
$149
$139
Boston
Baltimore
Chicago
Cleveland
Minneapolis
New York
Philadelphia
San Francisco
$0 $500 $1,500$1,000 $2,000
$1,239
$271
$1,097
$1,541
$941
$881
$1,010
$904
Small Mid-sized Large
Thousands Thousands Thousands
FIGURE 32
Median Foundation Giving by Budget Size, Select Cities (in thousands)

34 U n d e r s t a n d i n g B o s t o n
FIGURE 33
Total Government Support, Select Cities
$0
$60
$10
$100
$80
$300
$0
$18
$12
$16
$10
$8
$4
San FranciscoNew York PhiladelphiaMinneapolisChicago ClevelandBaltimoreBoston
$4
$20
$17
$56 $6
$37
$10
$8
$22
$7
$63
$45
$288
$15
$9
$18
Total government support Per capita
Mill
ions
Per C
apita
$90
$50
$70
$20
$30
$40
$14
$6
$2
Sources: CDP 2012, ACS 2012
Boston
Baltimore
Chicago
Cleveland
Minneapolis
New York
Philadelphia
San Francisco
$0 $5 $10 $15 $20 $25
$3.0
$5.4
$2.5
$13.7
$10.3
$7.6
$12.4
$19.4
Boston
Baltimore
Chicago
Cleveland
Minneapolis
New York
Philadelphia
San Francisco
$0 $50 $100 $150 $200
$14.1
$124.4
$20.8
$156.1
$73.7
$20.5
$54.0
$101.4
Boston
Baltimore
Chicago
Cleveland
Minneapolis
New York
Philadelphia
San Francisco
$0 $2,000$1,000 $3,000
$163
$2,236
$193
$1,881
$384
$130
$401
$813
Small Mid-sized Large
Thousands Thousands Thousands
Source: CDP 2012
FIGURE 34
Median Government Support by Budget Size, Select Cities (in thousands)
Direct Government SupportBoston’s arts and cultural organizations receive the lowest per capita government support of all the cities studied. Boston’s organizations receive low levels of government support, especially on the local level. (Figure 33) This study shows that Boston is last or second-to-last in median government support among all of the cities. This is true for every budget category.
(Figure 34) Even Baltimore — which has fewer than half the number of organizations Boston has — attracts a larger pool of government funding.23
Nationwide, local government provides the largest source of funding for arts organizations, with states coming in next and federal funding last. In 2012, nonprofit cultural groups nationwide received $146 million from the National Endowment for the Arts, $260

35H o w B o s t o n a n d O t h e r A m e r i c a n C i t i e s S u p p o r t a n d S u s t a i n t h e A r t s
million from state government, and $700 million from local funding, according to Americans for the Arts.
In Boston, that picture is upended, with federal sources providing the most government funding for cultural organizations, followed by state and local government. (Figures 35 and 36) Low local public funding in Boston is primarily driven by the small size of the City of Boston’s arts grant making budget.
Without robust city funding, Boston lacks certain critical supports that can be observed in other cities. Other cities in the study fund a myriad of programs including grants to organizations, artists and infor-mal groups; grants to organizations outside of main-stream arts disciplines; arts programs produced by public agencies themselves; technical assistance and professional development for organizations; facilities ownership and associated operating and maintenance
0%
10%
20%
30%
40%
50%
60%
70%
80%
90%
100%
San FranciscoNew York PhiladelphiaMinneapolisChicago ClevelandBaltimoreBoston
Local State Federal
15%
46% 47%
67%
28%
71%78%
25%
Source: CDP 2012
FIGURE 35
Distribution of Government Support by Type, Select Cities
FIGURE 36
Government Support by Type, Select Cities
0
$10
$20
$30
$40
$50
$210
San FranciscoNew York PhiladelphiaCleveland MinneapolisChicago
Mill
ions
Boston Baltimore
County State FederalCity
Sources: CDP 2012, ACS 2012

36 U n d e r s t a n d i n g B o s t o n
costs; creation of arts districts; percent for public art programs; and promotion of cultural tourism. Boston has only a few of these elements in play today. (See the Boston city profile on page 42 for more information).
How have revenue streams shaped Boston’s arts ecosystem?
As Chapter One confirms, Boston continues to enjoy a densely populated arts marketplace with significant strengths. It features some of the world’s foremost institutions enriching the cultural landscape with arts experiences of the highest caliber. Even though Boston’s arts market seems robust from a revenue perspective, it is actually highly constrained. If one removes the budgets of the “Big Three” from the analysis, it becomes clear that Boston’s remaining 1,569 organizations are being supported on 60 percent of the dollars that flow to San Francisco’s comparable number of entities.
This constraint is reflected in the weakness or absence of several key elements in Boston’s arts ecosystem, many of which were present in the other communities studied.
■■ Boston is lacking a robust layer of organizations in the $10 million-$75 million range. All disciplines in Boston lack organizations at this scale.
■■ Boston’s performing arts, particularly theater, dance and other performing arts such as opera are surpassed by activity in other study cities. Perform-ing artists in some disciplines find it challenging to build careers in Boston.
■■ Boston’s organizations present new art works at a lower rate than their peers in nearly all cities.
■■ Boston’s organizations at all levels find it difficult to secure the right facilities at an affordable price. Boston’s largest organizations do not receive regular subsidies to help bear their heavy fixed asset burden unlike some of their peers in other study cities.
■■ About 30 percent of Boston’s organizations are living with less than one month of unrestricted cash on their balance sheets. While this was the smallest proportion among all cities, it remains troubling that nearly a third of Boston’s organizations are in this condition.
■■ Added to these gaps is the question of cultural equity. While current data do not allow accurate measurement of this quality, there is a need for the ecosystem to discuss cultural equity in Boston.
A key question for Boston is whether this ecosystem is the one it wants or not. This analysis cannot answer that question. What it can do, however, is to point toward where Boston might garner the resources to make change, if that is what the city desires.
As this chapter revealed, the primary revenue driv-ers in Boston’s arts ecosystem are earned income from participation and contributed revenue from individu-als. Boston’s per capita levels of earned revenue are among the highest of the study cities. And, at every budget size, Boston has the highest or second-highest median individual contributions, when compared to the other ten communities. Both of these revenue streams are the result of many individual preferences, purchases and donations for organizations both large and small, and as such are not available to the system to redirect.
Boston also has fewer of the types of revenue that may be harnessed as levers for systemic change. For instance, corporate giving in Boston is among the weakest in a weak field, reflecting changes in corporate giving patterns over the past decade or more. Founda-tion giving for small and mid-sized organizations, the data revealed, was limited with low median giving when compared to other study cities. Finally, Boston’s arts and cultural organizations receive the lowest per capita government support of all the cities studied. Median levels of government support were low across all budget sizes.
It is important to note that these externally driven revenue streams may be the natural source for resources to fund desired changes to the existing ecosystem. Civically minded foundations and corpora-tions, and government agencies are most able to target their contributions in response to gaps at a systemic level. The opportunity presented by cultural plan-ning in Boston is to reflect the values of the commu-nity, and to craft and drive systemic priorities and coordinated action.
The next chapter explores each of Boston’s key revenue sources, analyzes its potential for growth and its relevance in the context of desired systemic change.

37H o w B o s t o n a n d O t h e r A m e r i c a n C i t i e s S u p p o r t a n d S u s t a i n t h e A r t s
Participation-based Earned RevenueWhile Boston’s arts organizations, particularly the small and mid-sized cohorts, earn higher levels of revenue than the other cities in this study, growth in their earned revenue was flatter than elsewhere. (Figure 37) TDC reviewed the trends between 2006 and 2012, and found that earned revenue in Boston kept up with inflation but did not grow at the pace found in New York and six of the other cities.
Growth in earned revenue relies on increasing the number of tickets sold or raising the price of tickets or both. Since ticket prices are already high in Boston, raising prices may be a challenge.
Simply selling more tickets may also prove difficult.Changing audience preferences and ticket buying habits are having a profound effect on arts markets across the country. Subscriptions have been declining in the face of a generational shift while at the same time, there has been an explosion of leisure-time choices, which has increased competition for audience attention.
With a clear understanding of Boston’s arts ecosystem and of the revenue drivers that shape it, this report turns to exploring whether it is possible to address gaps in the system by growing available resources or redirecting how they flow. As articulated in Chapter Two, there are two broad types of revenue drivers: those that are largely under the control of individual organizations, and those that are primarily externally controlled, where an institutional donor, public or private, makes resources available and sets the agenda for how it will be allocated.
Organizationally Controlled Revenues
There are three major types of organizationally controlled revenues: earned revenue, individual contri-butions, and endowment. Boston’s arts ecosystem is fueled in large part on these types of revenues.
0%
10%
5%
30%
25%
20%
15%
40%
35%
SeattleNew York Philadelphia Portland San FranciscoHouston MinneapolisChicago ClevelandBaltimoreBoston
17%
33%
14%
21%
25%
28%
33%
13%15%
32%34%
Percentage Growth Inflation
FIGURE 37
Participation-Based Earned Revenue Growth, 2006 to 2012
Source: Guidestar 2012 and 2006
CHAPTER THREE
Potential for Growth, Potential for Change

38 U n d e r s t a n d i n g B o s t o n
Another important factor at play is changing demo-graphics. Almost every city in America is seeing increased racial and ethnic diversity. Of the cities included in this study, all but three had majority-minority urban cores. The whole of the United States is projected to be majority-minority by 2050. The rate of change is happening much faster among young people, among whom non-Hispanic whites will be in the minority by 2020.
Going forward, Boston’s organizations may need to make investments toward marketing and program-matic innovation to address these trends and maintain their strength in earned revenue.
Individual ContributionsWhile Boston organizations have proven themselves equal to the task of identifying and connecting with individual donors, it is uncertain how much room they have to grow this important revenue stream in the future. There are several factors that may impact this picture looking forward. First, Boston’s popula-tion is projected to remain flat, meaning that the pool from which to cultivate new individual donors might perhaps be constrained. At the same time, the genera-tional shifts, which are affecting earned revenue, are also at play here. As buying patterns change, organi-zational loyalty is harder to build. In turn, this makes attracting additional contributed individual giving more challenging. Additionally, a younger generation of donors appears interested in supporting a broad array of causes. Last, the rise of outcomes-based social impact reporting can challenge arts organizations that may have a hard time quantifying the results of their work. In the future, Boston’s organizations may have to design, test and invest in new approaches to engag-ing donors to ensure that this critical revenue source remains robust.
EndowmentDespite Boston organizations’ success in raising endowments, they are a truly impactful element of revenue only for a small stratum. For endowments to be useful, they must be large enough to generate a meaningful return in the context of an organization’s expenses. The typical spending rate is five percent of an endowment’s value (though a lower rate is often recommended). For 73 percent of the organizations holding endowments in all of the cities studied, a draw
of 5 percent covers less than one tenth of their annual budgets. In Boston, an additional $520 million would need to be raised by the 75 organizations with small endowments to have a real impact on their financial stability. Given the trends happening with individual donors noted above, it is challenging to imagine that organizations will be able to prioritize endowment campaigns as they work to build relationships with a new generation of donors.
Despite their limitations, could any of these organizationally driven revenue sources nonetheless constitute a lever for systemic change?With respect to earned revenue and endowment, the opportunity to harness them as effective levers for change appear limited at best. As noted elsewhere, these two sources are driven by individual choices at work in the marketplace. With respect to individual donor contributions, these too are primarily driven by individual preferences and taste. Moreover, larger trends are at play that may limit their ability to grow. However, focus groups in Boston and interviews across the other study cities reveal that both arts organiza-tions and civic leaders alike are aware of these trends, and are testing strategies to address the challenge. In Boston, cultural planning may provide a timely oppor-tunity to engage civically minded individuals to align some measure of their giving to a larger systemic goal.
Externally Controlled RevenuesExternally controlled revenues are contributions coming from institutional funders, which may offer more opportunities to direct toward systemic change than those detailed above. The question of scale, however, rises to the fore, given the current limitations in each category.
Corporate ContributionsWhile there was a time when corporations, acting inde-pendently and collectively, played a civic leadership role in supporting Boston’s arts and culture commu-nity, Boston has witnessed a shift in its corporate landscape as major mergers have occurred over the last 15 years along with an exodus of many corporate headquarters. As a result, the city has suffered from a diminishing number of major corporations that can

39H o w B o s t o n a n d O t h e r A m e r i c a n C i t i e s S u p p o r t a n d S u s t a i n t h e A r t s
make significant contributions to arts and cultural organizations, and is instead dominated by hospitals and universities. Looking forward, it is not unreason-able to anticipate that some of the Boston area’s new entrepreneurs could become corporate players in civic philanthropy.
Foundation GivingOver the years, TDC has observed that as new wealth has come of age, new foundations have been estab-lished in Boston, a handful of which have become important players in the arts. Despite these devel-opments, the foundations that support the arts and culture in Boston are limited both in number and scale of funding. According to the Foundation Center, none of the country’s top 25 foundations giving to the arts in 2012 were located in Massachusetts. Going forward, the growth potential for foundation giving will be dependent on existing players shifting policy to elevate the priority of the arts in their giving. As a positive development in this direction, the Arts Funders Network has come together in recent years to share ideas; this group has been deeply engaged with cultural planning.
Direct Government SupportThe City of Boston has unique obstacles to growing public funding for the arts, due to highly restricted home rule policies imposed by the state of Massachu-setts and due to limitations on property tax revenues resulting from a plethora of major nonprofit landown-ers. (These are detailed in the sidebar on page 40.) To mitigate the second factor, Boston has a long-standing Payment in Lieu of Taxes (PILOT) program. In 2011, a change in the City’s PILOT policy resulted in the inclu-sion of seven arts and culture organizations. While the dollars requested through the program are limited, the fact remains that Boston is the only city TDC was able to identify that requests PILOT from cultural institu-tions. Ironically, the introduction of cultural PILOT has led to the unintended consequence of Boston provid-ing net negative cash resources to arts organizations in 2012: $130,000 was granted while $187,000 was paid in PILOT. The sidebar on home rule and PILOT offer more historical context for these complex idiosyncra-sies of Boston’s political situation.
Since 2012, there has been some growth to arts support from both the city and the state, described more fully in Chapter Four.24 Looking forward, the cultural plan-ning process now underway in Boston may provide an opportunity to look more deeply at the question of government funding. A clear cultural plan with strong advocates could be leveraged to build the political will to overcome obstacles to increased arts funding in the City of Boston.
How can externally controlled revenue streams contribute to Boston’s arts ecosystem?Institutional funders have a unique vantage point from which they can scan the needs across an entire system. As a result, they can make targeted invest-ments toward impact on the organizational or systemic level. Going forward, Boston’s arts ecosystem will likely need both levels of funding. On one hand, orga-nizations will need to invest in new marketing strate-gies and innovative programmatic approaches as they face fundamental shifts in their primary sources of support—individual donors and paying arts patrons. On the other hand, the ecosystem as a whole will need support to address the systemic priorities that will be articulated in cultural planning.
Without an increased scale of institutional funding available in Boston, however, there is only so much that these revenue streams can accomplish. As discussed above, there are obstacles to growth on all fronts. However, new shoots of potential exist, particularly in the realm of government funding. If Boston can find the political will to increase revenue streams for the arts, it could provide a game changing moment for the sector here.
Strategic institutional funders can also coordinate larger funding initiatives directed toward a systemic purpose. By working together, it is possible for these initiatives to achieve an adequate scale to make a difference. As the most civically minded of funders, city arts agen-cies can provide key leadership toward efforts that are directly aligned with the interests of the city at large but that may not be of primary interest to private funders—individual and institutional. Given the strength in arts support from individuals here, it may be possible for Boston to be a pioneer in coordinating both individuals and institutions toward common cause.

40 U n d e r s t a n d i n g B o s t o n
There is already some evidence for strategic thinking, coordination and leadership coming from Boston’s arts funders, seen in efforts such as the Massachusetts Cultural Data Project Group, the Boston Public Schools Arts Expansion Fund, the Arts Funders Network, and Boston Creates itself. With more such activity, Boston may be able to garner the funds to create change.
Boston has unique obstacles to growing public funding for the arts. Massachusetts law gives Boston comparatively little authority with which to raise local revenue — from taxing to borrowing to imposing fees. None of the other major cities included in this report are as constrained in their ability to generate a balanced and diversified revenue structure. Cities like Chicago have the freedom to pursue innovative public policy in large part because in Illinois, the state presumes cities and towns have authority, unless stipulated otherwise. In Massachusetts, it’s just the opposite: power is granted to the state unless expressly stipulated otherwise.
As a result, Boston is exceptionally dependent on a limited number of revenue sources, most notably the property tax. Boston depends on the property tax for 57 percent of its total operating revenue, but 53 percent of its land area is exempt from taxation. Complicating this situation is the fact that 78.6 percent of all tax-exempt property in Boston is publicly owned — by the state, federal or city government. Religious property represents another 8.1 percent of tax-exempt land. Educational and medical institutions in Boston account for 10 percent of all tax-exempt land and about 5 percent of the city’s total land area. These institutions represent a very important part of the city’s economy and its growth.
One of the city’s answers to to this conundrum is the Payments in Lieu of Taxes (PILOT) program. Since 1925, Boston’s PILOT program has sought voluntary contributions from large nonprofit landholders to account for the services the city provides for them, such as police, transportation and public works. Historically, the city negotiated with individual nonprofits to determine PILOT contributions, and only large
medical and educational institutions with significant real estate holdings were asked participate. Given their voluntary nature and the individual negotiated terms, PILOT contribu-tions were highly variable, and made up less than 1 percent of city revenues. Since its inception, PILOT has been a contentious and politically charged issue.
Arts organizations were on the sidelines of this debate until 2011, when former Mayor Thomas M. Menino (based on recommendations from a citywide task force) implemented a standardized formula for requesting PILOT contributions. The City asked nonprofit entities with more than $15 million in real estate holdings to make voluntary contributions that would, after a ramp-up period, equal 25 percent of the property taxes they would pay if they were not tax-exempt. A stipulation that “community benefit” could be subtracted from PILOT contributions was meant to offset the burden on organizations.
While most of the institutions asked to participate remained hospitals and universities, arts and cultural organizations were also included for the first time. In fiscal year 2012, the City sought $474,000 in PILOT contributions from seven cultural institutions, including the top three organizations but also a number of smaller groups. Together, these institu-tions paid $187,000, or 40 percent of the funds requested. By 2014, the city sought $1.1 million from cultural institu-tions and received $224,000, or 21 percent. While cities like Philadelphia and Baltimore use PILOT to raise revenues from hospitals and universities, Boston is unique in asking cultural organizations to make PILOT contributions.
Chapter Four provides examples of increased public revenue streams, targeted and coordinated action that has taken place in other cities, and profiles of local public funding in each study city.
Home Rule and PILOT in Boston
41H o w B o s t o n a n d O t h e r A m e r i c a n C i t i e s S u p p o r t a n d S u s t a i n t h e A r t s
This chapter provides examples of new public funding streams, targeted funding and coordinated action, as well as detailed profiles of local public funding drawn from each of the 11 cities included in this study. The profiles offer a combination of key data points as well as perspectives garnered from interviews with funders in each community.
The examples below are often unique to a particular time or place, and cannot be transported wholesale to another context. As such, they cannot be construed as models. However, they do demonstrate that arts leaders in many different communities have found the commitment, creativity and consensus to catalyze the systemic change needed in their cities.
Creation of New Public Funding StreamsThree relatively recent efforts discussed by interview-ees occurred in Cleveland, Portland and Minnesota.
Portland. In 2012, Portland voters passed a $35 per person income tax for city residents, the Arts Educa-tion and Access Fund. The fund was championed by the city mayor and a steering committee of govern-ment, foundation, and business leaders. In 2014, the Fund garnered $8 million for the arts and arts education.
Cleveland. Ten years ago, a regional coalition campaigned for a cigarette tax to underwrite arts support in Cuyahoga County. The tax raises over $15 million in arts funding for the region each year. The original campaign was funded by $1.5 million raised from foundations, arts organizations, and private sources, and was led by the Community Partnership for Arts and Culture (CPAC), an arts service organiza-tion funded by The Cleveland Foundation and the George Gund Foundation.
Minnesota. In 2008, arts advocates banded together with sportsmen and environmental activists to run a campaign that ultimately resulted in the passage of the Clean Water, Land and Legacy Amendment, which amended the state constitution to provide a dedicated sales tax to protect clean water, wildlife habitat, arts
and culture, and parks and trails. In 2012, the tax generated $52.6 million for the arts and $86.5 million for outdoor heritage.
Coordinated and Targeted ActionAcross the study cities, interviewees talked about funding initiatives that supported some of the areas where Boston’s ecosystem has gaps. In some cases, these initiatives achieved a scale that made a differ-ence through the coordination of multiple funders. In others, single players looked at the funding landscape and chose to push elements that they perceived as underfunded in their communities.
Leveraging funding. Several city agencies talked about their ability to attract or coordinate funding streams unavailable to arts organizations alone. For example, arts administrators in the City of Minneapolis, Balti-more, Seattle, and other cities connect arts organiza-tions with other city agencies. Baltimore seeks national funding streams, sometimes open only to municipali-ties, to support citywide initiatives.
Ensuring access and cultural equity. Cultural equity is a priority that is being pursued by institutional funders in San Francisco, Philadelphia, Seattle and New York through grants, technical assistance and research. In Chicago, the city has spearheaded an effort to bring access to the arts to all city neighborhoods, through grants and partnerships with organizations and through programs in city-run arts facilities.
Supporting smaller organizations. Various public entities have embarked on initiatives to provide targeted grants for smaller organizations. These include New York, Minneapolis (through state fund-ing), Cleveland (through the cigarette tax), and Phila-delphia. In addition, private funders in cities such as Chicago, New York and Philadelphia indicated in interviews that they too saw their role as providing philanthropic support for smaller organizations that lack access to the city’s wealthiest individual donors or to corporate support.
CHAPTER FOUR
Supporting Arts Ecosystems

42 U n d e r s t a n d i n g B o s t o n
Bolstering innovation within the ecosystem. A number of funders in San Francisco, New York, Philadelphia and Minneapolis reported that they support the development of new art works with their grants. CDP data show that this support resulted in more new works in those communities. (Figure 14)
Offsetting high facilities costs. San Francisco is the site of several initiatives to help organizations to manage astronomical facilities costs. Among these, the Community Arts Stabilization Trust (CAST) is a partnership bringing together a private foundation, a community loan fund and a city agency.
Supporting distressed organizations. In Port-land, institutional funders coordinated an effort to strengthen a cohort of large institutions in financial distress based upon principles of capitalization. TDC observed evidence in the data that the financial posi-tion of these large institutions improved as a result.
Through a number of individual collaborations and established intermediaries, San Francisco funders noted that they meet regularly to discuss the finan-cial health of individual organizations in their arts ecosystem. Together, they decide whether and how to intervene. Further, they have collaboratively planned capacity building initiatives intended to benefit smaller arts organization.
Funding arts service organizations. ASOs can play a critical role in an arts ecosystem—leading advocacy, providing technical assistance, coordinating joint marketing efforts, and representing the arts sector. While these activities are valuable to the sector, they are often difficult to explain to individual donors. Insti-tutional funders are often the only source of support for ASOs.
Local Funding ProfilesThe systems and mechanisms for public funding of the arts vary significantly among the cities in this report. While many local arts agencies exist within city government, others are set up as private nonprofits or entities at the county or regional level. Local arts agen-cies also vary in the way they support the arts. While some function primarily as grant makers to arts orga-nizations, others focus on promoting the role of the arts, providing technical assistance, or offering direct programs to the public.
Some local governments in this study provide direct support to organizations from line items in the city budget, while others have dedicated funding streams for facilities. Some public funding entities support individual artists, manage cultural facilities and civic art collections, or even run additional programs or services for organizations, individuals and the public. A number of cities provide arts funding directly through city departments.
The following profiles provide a snapshot of public funding for arts and cultural organizations in the 11 metro areas with a focus on the anchor city (or, in the case of Minneapolis-St. Paul, cities) in each. When rele-vant, information on county or other regional funders are included. Each profile includes an overview of the strategies and approaches of public funders and the significant local and regional public funding sources available. The data reflect the funding picture from 2012 to match the analyses within the rest of this report and as such refer to the metro area. In some cases, these sources have changed in scale and/or funding mechanisms over the last few years, which is noted.
BostonIn 2012, the city dedicated $1.6 million for the arts, but only $130,000 was granted out to local nonprofits. The rest of the support went to the Strand Theater, an arts facility owned by the city; arts programming for youth; and the city’s arts administration. The city has separate funds, totaling $690,000 in 2012, to support its public art program.
However, the potential for local support for the arts has brightened considerably over the last year. In 2014, Mayor Martin J. Walsh separated the city’s Office of Arts and Culture from the Office of Tourism and created a new department — one that is solely focused on Boston’s arts and cultural life. The new Mayor’s Office of Arts and Culture (MOAC) is in the midst of a city-wide cultural planning process, guided by a new Chief of Arts and Culture, who occupies the first cabinet-level position for the arts sector at City Hall in decades.
The city’s funding commitment is also deepening. MOAC provides funding to organizations through the Boston Cultural Council (BCC), which re-distributes

43H o w B o s t o n a n d O t h e r A m e r i c a n C i t i e s S u p p o r t a n d S u s t a i n t h e A r t s
funds from the Massachusetts Cultural Council (MCC). In FY15, the city committed $150,000 to match MCC funding, increasing the grant pool to $300,000. The Mayor has doubled that commitment to $300,000 for FY16, which will increase total BCC funding to $480,000, nearly four times the total funding in 2012.
In addition to increasing the funding mechanisms for organizations, the Mayor and MOAC have established new funding streams for individual artists. In 2014, the Mayor established a public art fund that provides some $40,000 a year for individual artists and supple-ments the city’s existing Browne Fund for Public Art. For FY16, the MOAC has received a $100,000 grant from the NEA for Boston’s Artist in Residency program, which will enable city departments to host artists who will contribute creative approaches to municipal planning.
The Mayor and the MOAC have also begun to address the city’s broader cultural life, including innovations such as appointing a Poet Laureate for Boston, seeking public submissions for projects to enhance streets and sidewalks, holding a series of convenings for cultural leaders, and addressing ways to foster a safe and vibrant late-night culture. The Mayor and MOAC also partner with other city departments, such as the Parks and Recreation Department, which provides public
spaces for more than 200 arts and cultural programs, and the Office of Tourism and Special Events.
Mayor’s Office of Arts and Culture25
■■ 2012 operating budget: $1.6 million + $690,000 for Public Art26
■■ Source of funding: City General Fund; State General Fund (grants); Browne Fund27 (Public Art)
■■ Grants: $130,000 for general operating support and field trips28
■■ Other programs: Public Art; One cultural facility owned by the City (Strand Theatre); the Mayor’s Mural Crew (funded by the Department of Youth Engagement and Employment and employing 30 youth to make murals in the city)
Massachusetts Cultural Facilities Fund■■ Source of funding: State capital bonds
■■ Grants/funding for capital projects for organiza-tions in Boston and across the state
Distribution of Organization by Discipline Distribution of Organization by Budget Size
FIGURE 32
Boston
Number of Nonprofit Arts Organizations 1,572 Population 4,602,669
Total Revenues from All Sources $1.07 billion Median Household Income $72,769
ASO Community History / Humanities Museum / Collecting Other Performing Arts Film / TV / Radio
Under$500,000
0% 20% 40% 60% 80% 100%
Over $5M
$500,000–$5M
184 313 51 163 498 11273
21 35 10 17 43 1910
6 7 7 21
Small: 1,394
Mid-sized: 155
Large: 23Total: 1,572
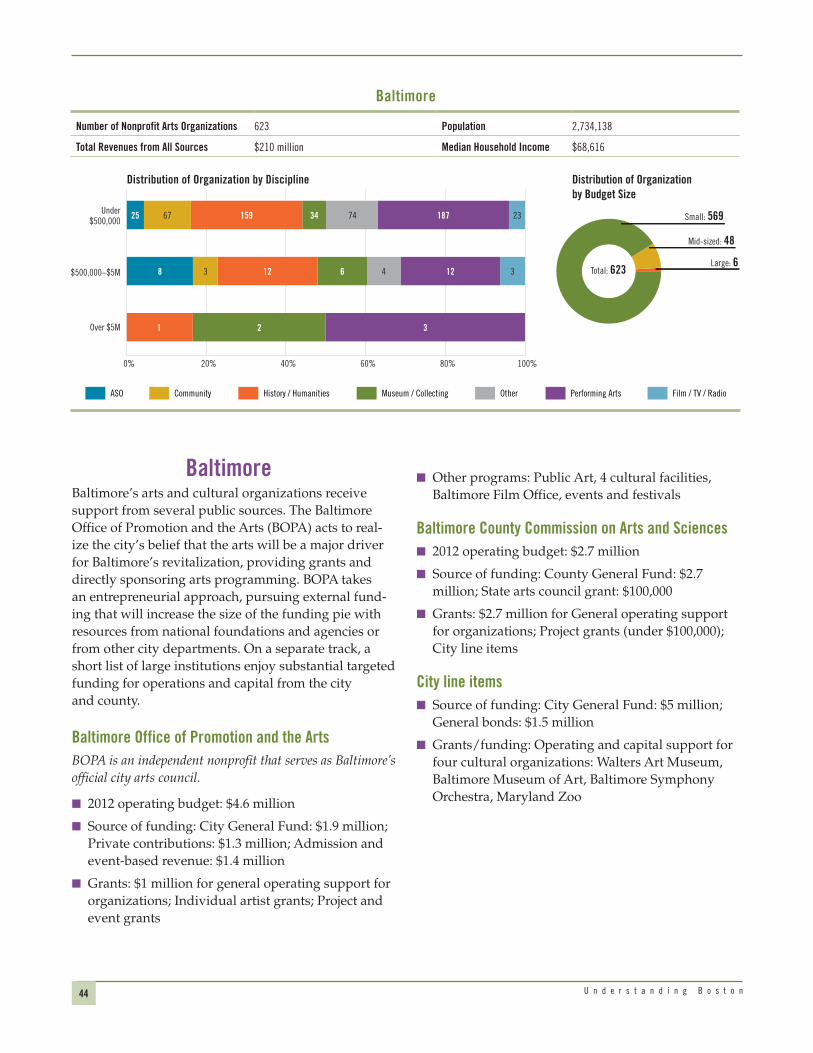
44 U n d e r s t a n d i n g B o s t o n
BaltimoreBaltimore’s arts and cultural organizations receive support from several public sources. The Baltimore Office of Promotion and the Arts (BOPA) acts to real-ize the city’s belief that the arts will be a major driver for Baltimore’s revitalization, providing grants and directly sponsoring arts programming. BOPA takes an entrepreneurial approach, pursuing external fund-ing that will increase the size of the funding pie with resources from national foundations and agencies or from other city departments. On a separate track, a short list of large institutions enjoy substantial targeted funding for operations and capital from the city and county.
Baltimore Office of Promotion and the ArtsBOPA is an independent nonprofit that serves as Baltimore’s official city arts council.
■■ 2012 operating budget: $4.6 million
■■ Source of funding: City General Fund: $1.9 million; Private contributions: $1.3 million; Admission and event-based revenue: $1.4 million
■■ Grants: $1 million for general operating support for organizations; Individual artist grants; Project and event grants
■■ Other programs: Public Art, 4 cultural facilities, Baltimore Film Office, events and festivals
Baltimore County Commission on Arts and Sciences■■ 2012 operating budget: $2.7 million
■■ Source of funding: County General Fund: $2.7 million; State arts council grant: $100,000
■■ Grants: $2.7 million for General operating support for organizations; Project grants (under $100,000); City line items
City line items■■ Source of funding: City General Fund: $5 million;
General bonds: $1.5 million
■■ Grants/funding: Operating and capital support for four cultural organizations: Walters Art Museum, Baltimore Museum of Art, Baltimore Symphony Orchestra, Maryland Zoo
Distribution of Organization by Discipline Distribution of Organization by Budget Size
FIGURE 33
Baltimore
Number of Nonprofit Arts Organizations 623 Population 2,734,138
Total Revenues from All Sources $210 million Median Household Income $68,616
ASO Community History / Humanities Museum / Collecting Other Performing Arts Film / TV / Radio
Under$500,000
0% 20% 40% 60% 80% 100%
Over $5M
$500,000–$5M
67 159 34 74 187 2325
3 12 6 4 12 38
2 31
Small: 569
Mid-sized: 48
Large: 6Total: 623

45H o w B o s t o n a n d O t h e r A m e r i c a n C i t i e s S u p p o r t a n d S u s t a i n t h e A r t s
Department of Cultural Affairs and Special Events (DCASE)
■■ 2012 operating budget: $34.5 million
■■ Source of funding: Special Events and Municipal Hotel Operators’ Occupation Tax; Event-generated revenues; Facility rentals; Grants
■■ Grants: $1.2 million for in general operating support for small and midsize organizations; Individual artist grants (projects, professional development and teaching)
■■ Other programs: Public Art; 10 cultural facilities: Chicago Cultural Center, Millennium Park, Gallery 37 Center for the Arts, Historic Water Tower, two historic houses; Chicago Film Office; Events and programs
Chicago Parks District■■ Source of funding: Aquarium and Museum Oper-
ating Fund drawn from a property tax levied by the Chicago Parks District, and personal property replacement tax (PPRT) revenue — as well as Park District bonds
■■ Grants/funding: $30.6 million for operating and capital support for organizations within the District
ChicagoPrior to a citywide cultural-planning process in 2012, Chicago’s Department of Cultural Affairs and Special Events (DCASE) was created through a merger of the city’s Department of Cultural Affairs and the Office of Special Events. In addition to providing standard arts agency services, DCASE produces more than 2,000 programs, festivals and other events — some of which take place in the city’s 10 cultural facilities and historic homes — which seek to engage neighborhood resi-dents and increase the city’s cultural vibrancy. In fact, DCASE is the largest employer of artists and musi-cians in Chicago. Only a modest portion of DCASE’s $34 million budget goes toward grants, many of which are targeted to small- and mid-sized organizations. Outside the scope of DCASE, large institutions in the City’s Parks District receive dedicated funding for capital and operations.
A primary strategy for the city is promoting Chicago as a tourism destination. The Cultural Plan in 2012 helped to frame the importance of cultural tourism to the city.
Distribution of Organization by Discipline Distribution of Organization by Budget Size
FIGURE 34
Chicago
Number of Nonprofit Arts Organizations 1,955 Population 9,496,587
Total Revenues from All Sources $1.01 billion Median Household Income $61,367
ASO Community History / Humanities Museum / Collecting Other Performing Arts Film / TV / Radio
Under$500,000
0% 20% 40% 60% 80% 100%
Over $5M
$500,000–$5M
239 323 61 231 760 6890
26 18 20 14 61 97
7 113 2 23
Small: 1,772
Mid-sized: 155
Large: 28Total: 1,955
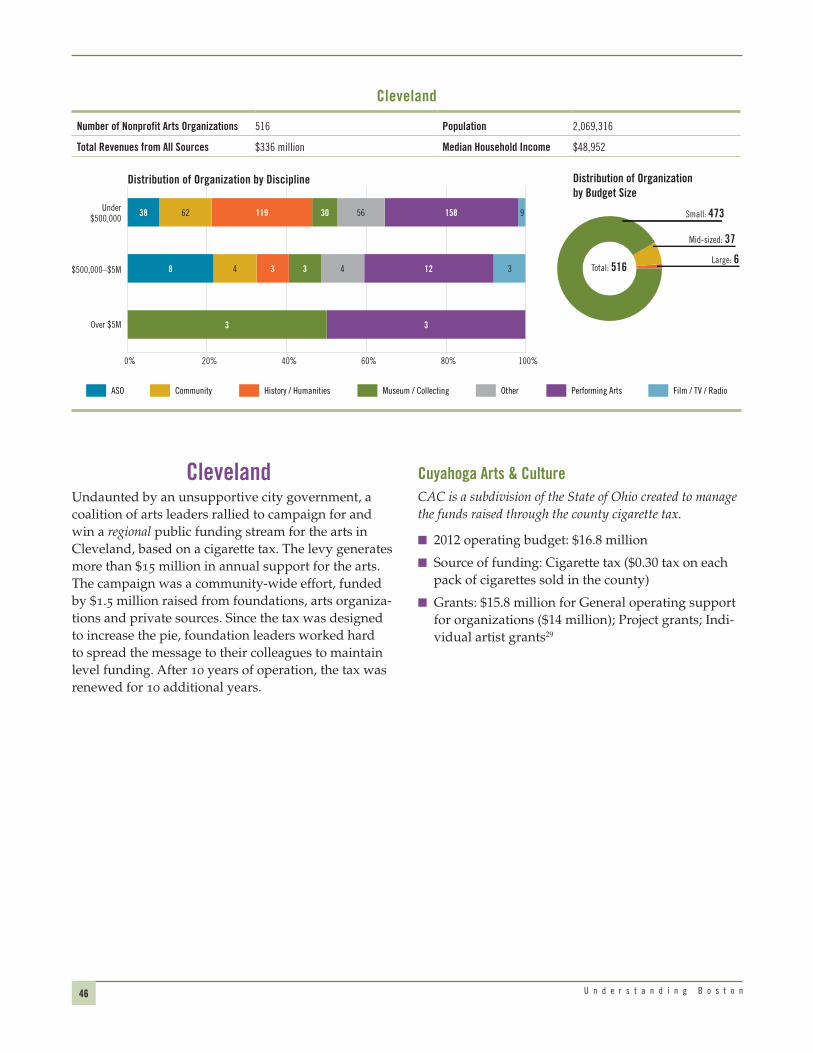
46 U n d e r s t a n d i n g B o s t o n
ClevelandUndaunted by an unsupportive city government, a coalition of arts leaders rallied to campaign for and win a regional public funding stream for the arts in Cleveland, based on a cigarette tax. The levy generates more than $15 million in annual support for the arts. The campaign was a community-wide effort, funded by $1.5 million raised from foundations, arts organiza-tions and private sources. Since the tax was designed to increase the pie, foundation leaders worked hard to spread the message to their colleagues to maintain level funding. After 10 years of operation, the tax was renewed for 10 additional years.
Cuyahoga Arts & CultureCAC is a subdivision of the State of Ohio created to manage the funds raised through the county cigarette tax.
■■ 2012 operating budget: $16.8 million
■■ Source of funding: Cigarette tax ($0.30 tax on each pack of cigarettes sold in the county)
■■ Grants: $15.8 million for General operating support for organizations ($14 million); Project grants; Indi-vidual artist grants29
Distribution of Organization by Discipline Distribution of Organization by Budget Size
FIGURE 35
Cleveland
Number of Nonprofit Arts Organizations 516 Population 2,069,316
Total Revenues from All Sources $336 million Median Household Income $48,952
ASO Community History / Humanities Museum / Collecting Other Performing Arts Film / TV / Radio
Under$500,000
0% 20% 40% 60% 80% 100%
Over $5M
$500,000–$5M
62 119 30 56 158 938
4 3 3 4 12 38
3 3
Small: 473
Mid-sized: 37
Large: 6Total: 516

47H o w B o s t o n a n d O t h e r A m e r i c a n C i t i e s S u p p o r t a n d S u s t a i n t h e A r t s
HoustonWith a booming economy and sprawling growth, Houston has an arts ecosystem that is coming into its own. In a city awash with money, the number of arts organizations doubled in the past 20 years. The city is supportive of the arts with a focus on major institutions that drive cultural tourism and establish Houston’s status as a world-class, diverse city. An Arts and Cultural Plan spearheaded by the city’s Cultural Affairs Office is seeking to examine cultural vibrancy in communities around Houston.
Houston Arts AllianceThe Housing Arts Alliance (HAA) is an independent nonprofit under contract to the city to manage a grants program and the Civic Art Program.
■■ 2012 operating budget: $8.9 million
■■ Source of funding: Hotel occupancy tax: $5.2 million30; Civic Art contracts: $1.5 million31; Private contributions: $2.7 million
■■ Grants: $4.1 million32 for General operating support for organizations; Project grants; Individual artist grants
■■ Other local programs: Civic Art; Direct service to organizations; Capacity building and technical assis-tance for organizations; Folklife & Traditional Arts Program; Convenings
City contracts■■ Source of funding: Hotel occupancy tax: $12.4
million
■■ Grants/funding: Theater District: tourism market-ing for Theater District organizations ($3 million); Museum District: marketing and operating support for Museum District organizations ($2.3 million); Miller Outdoor Theater: 30 organizations to present at the theater ($1.8 million)
Distribution of Organization by Budget Size
Distribution of Organization by Discipline
FIGURE 36
Houston
Number of Nonprofit Arts Organizations 898 Population 6,085,873
Total Revenues from All Sources $477.5 million Median Household Income $57,426
ASO Community History / Humanities Museum / Collecting Other Performing Arts Film / TV / Radio
Under$500,000
0% 20% 40% 60% 80% 100%
Over $5M
$500,000–$5M
142 127 46 116 285 3357
14 11 6 14 18 510
4 6 13
Small: 806
Mid-sized: 78
Large: 14Total: 898

48 U n d e r s t a n d i n g B o s t o n
Minneapolis-St. PaulThe Twin Cities are the flagship cultural center of a state that has made a major commitment to the arts. In 2008, the citizens of Minnesota voted to tax them-selves to support their shared value in the environ-ment, history and the arts. The Clean Water, Land and Legacy Amendment includes an Arts and Cultural Heritage Fund (ACHF), which has raised about $56 million annually for the arts. Of that total, about $3.5 million is allocated to the Twin Cities through the Metropolitan Regional Arts Council (MRAC).33 MRAC funding is exclusively distributed in $10,000 (or smaller) project-based grants; additionally, non-arts organizations are eligible for funding, and win about 30 percent of total grants each year. ACHF funding also reaches the region through direct state-level grants and funds re-granted through the Minnesota Historical Society, Minnesota Public Television and Minnesota Public Radio.
While the City of Minneapolis provides no direct support for arts organizations, its arts agency serves to facilitate funding partnerships between organiza-tions and other city departments, acting almost like an arts service organization. It also works with other city departments to provide commissions for individual artists. Established in 2011, the department budget
has grown from $150,000 to more than $450,000 in four years with further growth anticipated. The City of St. Paul does have a grant program for organiza-tions, funded through a local sales tax. Like MRAC, its focus is on project grants, although it also provides capacity-building support.
Metropolitan Regional Arts CouncilMRAC is the regional arts council for the Minneapolis and St. Paul region of Minnesota.
■■ 2012 operating budget: $4 million
■■ Source of funding: Arts and Cultural Heritage Fund (portion of a statewide sales tax increase passed as part of Clean Water, Land and Legacy Amendment); State General Fund; Foundation support
■■ Grants: $3.3 million for Project grants for organiza-tions under $400,000 and informal arts groups
Minneapolis Office of Arts, Culture and Creative Economy34
■■ 2012 operating budget: $150,000 + $900,000 Public Art budget35
■■ Source of funding: City General Fund
Distribution of Organization by Discipline Distribution of Organization by Budget Size
FIGURE 37
Minneapolis-St. Paul
Number of Nonprofit Arts Organizations 926 Population 3,320,190
Total Revenues from All Sources $654 million Median Household Income $66,751
ASO Community History / Humanities Museum / Collecting Other Performing Arts Film / TV / Radio
Under$500,000
0% 20% 40% 60% 80% 100%
Over $5M
$500,000–$5M
136 159 20 101 333 2536
13 13 5 9 36 1010
3 2 7 33 1 1
Small: 810
Mid-sized: 96
Large: 20Total: 926

49H o w B o s t o n a n d O t h e r A m e r i c a n C i t i e s S u p p o r t a n d S u s t a i n t h e A r t s
■■ Grants: $0. The Office of Arts, Culture and Creative Economy does not provide direct grants to organizations
■■ Other programs: Partners with other city depart-ments and nonprofits to provide: Individual artist commissions (funded by Convention Center); Artist-in-residency program (funded by General Fund and private grants); Training for artists
City of St. Paul Cultural STAR Program■■ 2012 operating budget: $1.6 million
■■ Source of funding: Sales tax (portion of a 0.5 percent city sales tax levy)
■■ Grants: $1.6 million36 for Project grants, Organiza-tional development grants
Hennepin County■■ Source of funding: Park Museum Fund (portion of
county property tax)
■■ Grants/funding: $10 million, which covers portion of operating budget of Minneapolis Institute of Arts
New YorkThe City of New York supports a Department of Cultural Affairs (DCLA) that dwarfs all other city arts agencies and is the largest public arts funder in the country outside of the federal government. In 2008, DCLA increased its competitive grant pool, which previously had been too small and competitive to reach many organizations. Now granting about $30 million each year, the Cultural Development Fund supports more than 800 organizations across the five boroughs. At the same time, the City continues to support 33 legacy institutions with operating support, capital, and in-kind goods and services. It provides an average of $150 million in capital support. DCLA extends its support to smaller local arts agencies within the five boroughs as well, such as the Lower Manhat-tan Cultural Council, which in turn funds very small organizations and elevates the voices of emerging artists, curators and presenters.
Department of Cultural Affairs (DCLA)■■ 2012 operating budget: $145 million + capital
support ($90.9 million37)
■■ Source of funding: City General Fund
Distribution of Organization by Discipline Distribution of Organization by Budget Size
FIGURE 38
New York
Number of Nonprofit Arts Organizations 5,997 Population 19,048,067
Total Revenues from All Sources $5.08 billion Median Household Income $65,791
ASO Community History / Humanities Museum / Collecting Other Performing Arts Film / TV / Radio
Under$500,000
0% 20% 40% 60% 80% 100%
Over $5M
$500,000–$5M
818 872 174 682 2,148 245302
81 78 53 66 216 4282
23 8 46 1413 13 21
Small: 5,241
Mid-sized: 618
Large: 138Total: 5,997

50 U n d e r s t a n d i n g B o s t o n
■■ Grants: $140 million + capital support for Operating and capital support for 33 city-owned cultural insti-tutions ($109 million); General operating support for organizations ($31 million); Capital support grants ($90.9 million)38
■■ Other programs: Public Art; Materials for the Arts: Donates used equipment to cultural organiza-tions (valued at $5.8 million); Capital Projects Unit: Supports creation, renovation and care of cultural facilities, Partners with other city departments to complete construction projects; Community Arts Development Program: Capacity building for lead-ers of small community-based cultural organiza-tions (funded by the Department of Housing and Urban Development); Seniors Partnering with Artists Citywide (SPARC): Artists-in-residence program at senior centers (funded by Department for the Aging); Cultural After School Adventures: Enables cultural institutions and public schools to bring cultural activities/experiences to students (funded by the Department of Youth and Commu-nity Development)
PhiladelphiaLike Boston, Philadelphia is hampered in its efforts to obtain dedicated local arts funding by its inability to direct tax revenues toward specific purposes without state legislative approval. Nevertheless, the city offers both targeted and responsive funding streams for the arts. The Philadelphia Cultural Fund (PCF), which provides operating support for organizations with a variety of budget sizes, has increased its total fund-ing in the past four years from $1.8 million to about $3 million. The city also provides direct operating and capital support to a handful of organizations affiliated with the city, including several major institutions. In addition, an array of city departments provide support and issue contracts for services to organizations. Supplementing city arts funds are capital grants from the state, which provide millions of dollars each year in much needed facilities support for this city rich in historic buildings.
The city’s tourism promotions have made a dedicated effort in the past decade to elevate the profile of Phila-delphia’s arts community, and the arts have also been a key strategy of efforts to revitalize downtown Philadel-phia. The city’s Office of Arts, Culture and the Creative Economy is also pursuing a major initiative focused on small and mid-sized organizations that address cultural equity issues.
Philadelphia Cultural FundPCF is a nonprofit that distributes funds allocated from the city Budget. Funding passes through the city’s Office of Arts, Culture and the Creative Economy.
■■ 2012 operating budget: $1.8 million
■■ Source of funding: City General Fund
■■ Grants: $1.7 million for General operating support for cultural organizations ($1.6 million); Youth Arts Enrichment ($100,000)
Office of Arts, Culture and the Creative Economy■■ 2012 operating budget: $900,000 + $1.8 million
pass through to Cultural Fund + $1.4 million for Public Art
■■ Source of funding: City General Fund; Private contributions
■■ Grants: see Cultural Fund

51H o w B o s t o n a n d O t h e r A m e r i c a n C i t i e s S u p p o r t a n d S u s t a i n t h e A r t s
■■ Other programs: Public Art; one cultural facility (gallery); Events and programs; Pass-through fund-ing for the African American Museum ($230,000)
City line items■■ Source of funding: City General Fund; City Capital
Budget; City Department budgets39
■■ Funding: Operating support for eight organizations (range from $300,000-$2.3 million): Fire Museum, Historical Commission, Mann Center, Mural Arts Program, Philadelphia History Museum, Phila-delphia Museum of Art, Philadelphia Zoo, Please Touch Museum; Capital support for four organiza-tions (ranging from $200,000-$4 million): Philadel-phia Museum of Art, Philadelphia History Museum, Philadelphia Zoo and Please Touch Museum
Redevelopment Assistance Capital Program (RACP)RACP is a statewide grants program for capital support for economic, cultural, civic, recreational and historical improvement projects.
■■ Source of funding: State General Fund; Bonds
■■ Funding: $10–100 million40 for Capital projects for arts organizations
PortlandThe local public funding landscape in Portland, Oregon changed in 2012 when voters passed a $35 per person income tax for city residents, called the Arts Education and Access Fund, to support arts education and arts organizations. The city’s Mayor organized a regional steering committee, made up of representa-tives from government as well as local foundations and businesses, to lead efforts to research and imple-ment a dedicated funding stream. Ultimately, the scope of the effort was limited to the City of Portland. Find-ing that arts education was a key priority to voters, the committee paired an increase in arts education in the city’s public schools with operating support for organi-zations as the selling point for a new arts tax. The deci-sion was that the first $6.5 million of the anticipated $12 million tax revenue would go directly to support-ing art and music teachers in schools, and the remain-der would pass to the Regional Arts and Culture Council to distribute to arts organizations, with a focus on operating support and promoting equity and access to the arts for all Portland residents.
Thus far, implementation of the tax has been some-what problematic, with only about $8 million of the anticipated $12 million currently being collected. The decrease was due to tweaks to the tax by a new Mayor
Distribution of Organization by Discipline Distribution of Organization by Budget Size
FIGURE 39
Philadelphia
Number of Nonprofit Arts Organizations 1,415 Population 5,996,101
Total Revenues from All Sources $748 million Median Household Income $61,927
ASO Community History / Humanities Museum / Collecting Other Performing Arts Film / TV / Radio
Under$500,000
0% 20% 40% 60% 80% 100%
Over $5M
$500,000–$5M
165 341 46 165 425 3574
22 33 10 13 42 614
6 9 11 3 4
Small: 1,251
Mid-sized: 140
Large: 24Total: 1,415

52 U n d e r s t a n d i n g B o s t o n
and City Council as well as hurdles related to the process through which the taxes were collected. Advo-cates hope that collection will improve over time, but worry about the efficacy of the tax in supporting arts organizations.
Regional Arts and Culture CouncilRACC is a nonprofit regional arts council serving Portland and the surrounding three counties.
■■ 2012 operating budget: $8 million
■■ Source of funding: City General Fund: $3.6 million; Multnomah County lodging tax; METRO; County General Fund (Multnomah, Washington and Clacka-mas counties); Oregon Arts Commission; Private contributions; Arts Education and Access Fund: $35 per person income tax for City of Portland residents’ tax passed in 2012
■■ Grants: $1.7 million for General operating support for organizations ($900,000); Project grants for organizations; Individual artist grants; Profes-sional development grants for organizations and individuals
■■ Other programs: Public Art; Right Brain Initiative: Professional development for teachers, principals and artists to use the arts to teach core curriculum and provide arts experiences for youth; Work for Art: Workplace giving program matched by public and private funding; Technical assistance and professional development for organizations and artists
Distribution of Organization by Discipline Distribution of Organization by Budget Size
FIGURE 40
Portland
Number of Nonprofit Arts Organizations 673 Population 2,261,148
Total Revenues from All Sources $230 million Median Household Income $57,896
ASO Community History / Humanities Museum / Collecting Other Performing Arts Film / TV / Radio
Under$500,000
0% 20% 40% 60% 80% 100%
Over $5M
$500,000–$5M
90 115 26 98 242 2421
9 7 1 3 16 36
3 4 11 2 1
Small: 616
Mid-sized: 45
Large: 12Total: 673

53H o w B o s t o n a n d O t h e r A m e r i c a n C i t i e s S u p p o r t a n d S u s t a i n t h e A r t s
San FranciscoThe City of San Francisco has two major funding agencies, both of which are more than 50 years old. A pioneer in using hotel tax revenue to support arts organizations, San Francisco provides about $80 million annually, including both targeted and respon-sive operating and capital support. The City’s Grants for the Arts Department provides ongoing operating support for a wide array of organizations, and the San Francisco Arts Commission focuses on cultural equity, with a grant program aimed at organizations and indi-vidual artists in historically underserved communities. Additionally, three of the city’s major institutions are departments of City government and as such receive operating and capital support from the city.
San Francisco’s city agencies are active in pushing change and developing additional support systems for arts organizations. They seek innovative approaches to assist organizations and have increasingly focused on providing adequate facilities and cultural spaces. The Arts Commission has partnered with other depart-ments and organizations on initiatives such as the Community Arts Stabilization Trust, which acquires properties in San Francisco to lease to organizations otherwise unable to lease or own property.
San Francisco Grants for the Arts■■ 2012 operating budget: $11.8 million
■■ Source of funding: Hotel tax41; City General Fund
■■ Grants: $10.9 million for General operating support for organizations ($9.7 million); Project grants ($1.3 million)
San Francisco Arts Commission■■ 2012 operating budget: $10.6 million + Public Art
Funds
■■ Source of funding: Hotel tax; City General Fund
■■ Grants: $4 million for Project grants for small and midsize organizations; Individual artist grants; Non-competitive operating grants for four cultural centers run by private non-profits
■■ Other programs: Public Art
City Line Items■■ Source of funding: Hotel tax; City General Fund
■■ Funding: About $45 million for Operating and capital support for three cultural institutions run as City Departments: Asian Art Museum, Fine Arts Museum, War Memorial
Distribution of Organization by Discipline Distribution of Organization by Budget Size
FIGURE 41
San Francisco
Number of Nonprofit Arts Organizations 1,699 Population 4,399,211
Total Revenues from All Sources $1.2 billion Median Household Income $77,183
ASO Community History / Humanities Museum / Collecting Other Performing Arts Film / TV / Radio
Under$500,000
0% 20% 40% 60% 80% 100%
Over $5M
$500,000–$5M
241 225 58 232 523 12073
28 30 13 25 67 2017
5 2 8 64 2
Small: 1,472
Mid-sized: 200
Large: 27Total: 1,699

54 U n d e r s t a n d i n g B o s t o n
SeattleSeattle has dedicated funding streams at both the city and regional levels that support the city’s arts orga-nizations. For a number of years, the regional arts agency, 4Culture, received a portion of a King County lodging tax, originally established in 1987 to service debt on the Kingdome. Envisioned as a way to encour-age tourism and promote the region as a cultural desti-nation, the dedicated funding stream ended in 2012 when the Kingdome debt was scheduled to be retired. Despite the loss of this revenue, an endowment begun in 2001 is intended to keep arts funding level until 2021, when 4Culture will once again receive a portion of lodging tax revenue.42
The City of Seattle has also dedicated resources to support the arts. The Office of Arts and Culture part-ners with other city departments, ranging from the Department of Transportation to the Office of Civil Rights, to leverage the arts in creative placemak-ing and to address cultural equity and social justice. The Office has focused on youth arts opportunities as well as providing affordable cultural space. It also provides operating grants for organizations, including a program aimed at first time applicants.
Office of Arts and Culture■■ 2012 operating budget: $7.6 million
■■ Source of funding: Admission tax: $5 million; Municipal Art Fund: $2.3 million; Reserve Fund: $200,000
■■ Grants: $2.4 million for General operating support for organizations ($1.6 million); Individual artist grants ($152,000); Project grants for organizations ($900,000); Capacity building grants for organi-zations ($260,000); Youth arts grants ($170,000); Cultural facilities fund ($155,000)
■■ Other programs: Public Art; two cultural facilities
4Culture■■ 2012 operating budget: $10.6 million43
■■ Source of funding: County lodging tax; County capi-tal budget (Public Art); County General Fund; Fees for consulting services
■■ Grants: $5.9 million for General operating support for organizations; Individual artist grants; Capital support grants
■■ Other programs: Public Art (county); one cultural facility; Professional development for organizations
Distribution of Organization by Discipline Distribution of Organization by Budget Size
FIGURE 42
Seattle
Number of Nonprofit Arts Organizations 971 Population 3,499,632
Total Revenues from All Sources $483 million Median Household Income 67,437
ASO Community History / Humanities Museum / Collecting Other Performing Arts Film / TV / Radio
Under$500,000
0% 20% 40% 60% 80% 100%
Over $5M
$500,000–$5M
131 144 32 116 368 3147
9 11 11 11 24 411
4 1 12 21 1
Small: 869
Mid-sized: 81
Large: 21Total: 971

55H o w B o s t o n a n d O t h e r A m e r i c a n C i t i e s S u p p o r t a n d S u s t a i n t h e A r t s
Conclusion
As TDC found in its 2003 report, Boston has a vibrant nonprofit arts and culture sector, with more than 1,500 organizations ranging from world-class museums and performing arts companies to neighborhood-based, youth-oriented organizations. Rivaled only by New York and San Francisco, Boston’s cultural scene surpasses some cities that have much larger populations and speaks to this city’s deep commit-ment to, and love for, the arts. The people of Boston are extremely supportive of the sector, with a demon-strated eagerness to visit museums and other cultural institutions, attend performances and donate funds.
Across the country, however, the arts sector has been going through deep reflection on its relevance to today’s society. Changing audience demographics, declining attendance, rising costs, sharper competi-tion and financially fragile organizations all demand careful thought by all who wish to support thriving arts communities. In this context, it is a great moment to take stock of the strengths and gaps in Boston’s arts market. The fact that cultural planning is taking place amplifies the opportunity for the community to review data-driven insights and debate what they mean for the city.
This report finds that Boston’s cultural organizations remain a powerful asset for the city and its residents. Boston has an arts ecosystem that is densely populated with some of the country’s greatest arts institutions, large and small, enriching the cultural landscape here every day. This system developed organically over time — a natural expression of a community built on creative capital — fueled by the preferences of indi-vidual donors and ticket buyers. Generous patrons and individual consumers are the great strength of Boston’s arts market, in addition to the organizations that they support.
And yet, there remain critical gaps in the system. There is a missing stratum of $10 million-$75 million organizations. Theater, dance, and other perform-ing arts organizations appear less robust in Boston than in other cities. All cultural perspectives are not fully represented. Arts organizations of all sizes in
Boston struggle with high facilities costs. The specter of losing several of the city’s major performing arts venues, combined with rapid development, throw this issue into high relief. Finally, stakeholders with a more systemic vantage point, such as foundations and government funders, have largely been missing from the field.
The fundamental questions this report poses are: “Is this the ecosystem that Boston wants, and if not, what tools does the community have at its disposal to change this picture?”
Ideally, the cultural planning process will articulate a shared vision for Boston’s arts ecosystem. The next critical step will be to advocate for strategies that will transform today’s arts market into one that can real-ize that shared vision. This report has explored tactics that have worked elsewhere and examines the likely strategies that could be deployed in Boston to fund the desired change.
In other cities, institutional funders such as founda-tions and government have led the charge for systemic change. In Boston, there is an opportunity for these funders — both public and private — to increase support and play a key strategic role. In addition, there is a special opportunity to engage the city’s highly committed and generous individual donors to collec-tively support and advocate for priorities that emerge from the cultural plan. With these efforts, Boston’s arts market will have a more complete array of tools at its disposal to realize the city’s shared vision and to shape an arts ecosystem that can continue to serve and enrich the Boston community for many years to come.


57H o w B o s t o n a n d O t h e r A m e r i c a n C i t i e s S u p p o r t a n d S u s t a i n t h e A r t s
The Cities and Why They Were ChosenTDC reviewed data from Boston and 10 other metro-politan statistical areas (MSAs): Baltimore, Chicago, Cleveland, Houston, Minneapolis-St. Paul, New York, Philadelphia, Portland (Oregon), San Francisco and Seattle.
The cities included in this study were chosen because of their similarity to Boston in terms of MSA popu-lation, cost of living and majority-minority status. Other cities were chosen because they had recently introduced major new public funding streams. The remaining cities were chosen because they provided an interesting counterpoint to Boston. Applying these criteria, TDC decided to replace three cities from the 2003 study and add an additional city.
DataGuidestar. The Guidestar database of Form 990s served as TDC’s proxy for the full breadth of the arts organizations chosen. Individual nonprofit organiza-tions were selected based on their primary NTEE code. All “A” coded organizations—those identifying as arts, cultural and humanities—were chosen. The full sample
included 17,245 total organizations across the 11 MSAs. A smaller sample of 4,911 was used in financial analy-ses, since Guidestar does not provide financial infor-mation for 990 postcard filers.
Cultural Data Project. Unlike the Guidestar 990 data, the Cultural Data Project (CDP) breaks down contrib-uted revenue by source, and gives detailed information on capital campaigns and non-financial information. Three of the 11 cities are not represented in CDP—Houston, Seattle, and Portland—and were excluded from this analysis. In participating cities, CDP repre-sents 10 to 20 percent of the organizations in the Guid-estar universe, skewed toward larger organizations. It is important to note that some organizations filling out the CDP form are not NTEE-coded as arts organi-zations in Guidestar and others are not independent 501(c)(3) nonprofits. We included only organizations that were also in the Guidestar dataset, for a sample of 2,617 total organizations across eight MSAs.
Other Data Sources. TDC consulted data from additional sources such as the Western States Arts Federation’s (WESTAF) Creative Vitality Index and the
TABLE A1
Methodology for Inclusion of Cities
Present in last study
Similar population
Similar cost of living
Majority-minority urban core
New public funding stream
Aspirational arts market
Baltimore X
Chicago X X X
Cleveland X X X
Houston X
Minneapolis X X X
New York X X X X
Philadelphia X X X X
Portland X
San Francisco X X X X X
Seattle X X
APPENDIX ONE
Methodology and Data Sources

58 U n d e r s t a n d i n g B o s t o n
Foundation Center. They also used Census and other data for demographic and economic information.
Qualitative Data. To inform its quantitative analysis, TDC conducted focus groups with 51 Boston-based arts and cultural organizations and interviews with 52 informants in Boston and the 10 other cities. Focus group participants included representatives from organizations spanning budget size and discipline in Boston. Participants offered insights into the health and vibrancy of the sector, the role of the arts in the city, and the trends and impact of funding on organi-zations. Informants in each of the 11 MSAs included representatives from city government and local and state arts agencies, private funders and arts service organizations. TDC asked questions about available funding, funder priorities and networks, systems of support for the arts and strengths and weaknesses within the ecosystem. Interviewees are listed on page 63.
Caveats on the Data and Analysis■■ While GuideStar data offers the most accurate cost-
efficient representation of the arts ecosystem, it is not a randomized sample. Therefore, TDC could not report on the degree of confidence it had in the analysis.
■■ TDC did not attempt to identify organizations outside of the NTEE A classification that might be considered a part of the arts and culture universe. This decision excludes organizations that classify themselves primarily in another category, such as zoos, some libraries, and institutions of higher learn-ing, even though they might have some—or even significant—arts activities. In a very limited number of cases, TDC attempted to capture data on very large institutions not primarily classified as an arts organization in our analysis.
■■ The IRS permits organizations under $200,000 to file a postcard return rather than Form 990. Therefore, TDC had very limited information on these smaller organizations. For the most part, TDC was unable to include these nonprofits in any financial analyses. TDC did, however, include them in broad counts of the total arts markets, including those involving discipline.
■■ TDC’s analysis is dependent on the reliability of CDP and GuideStar data, which are both reliant on the precision of organizations’ data entry as well as
the accuracy of the audits and financial statements from which data are drawn. While TDC cannot take responsibility for the complete integrity of CDP or GuideStar data, it does acknowledge that any errors in the analyses are its own.
Guide to AnalysisGuideStarTDC used the business master file (BMF) to determine the universe of organizations. While organizations under $200,000 file only postcard returns, they are included in the BMF. For organizations that did not file a Form 990, only discipline and organizational age were known. TDC assumed that non-filers had under $200,000 in organizational expenses.
TDC removed ten organizations from the dataset that were deemed non-arts organizations despite having an A Code. These organizations included academic journals focusing on health, business and technology subjects.
The Art Institute of Chicago, a major museum, is not included in the original data as an arts organization; rather it is classified as a school, as half of its opera-tions are for the school rather than the museum. To account for this institution, TDC added the Art Insti-tute to all counts of organizations by discipline and budget size in Chapter One. To accurately represent the expense and revenue picture in Chicago, TDC included the Art Institute’s museum expenses, as reported in its 2012 audit (available online), in our calculations of the total expenses in Chicago. TDC assumed that museum revenue would be similar in scale to its expenses, and included revenue equal to expenses in the overall revenue for Chicago. These numbers are also included in expenses and revenues in the analysis of large orga-nizations in Chapter One. However, the Art Institute is excluded from all analyses of revenue in Chapter Two, due to the lack of the breakdowns on sources of contributed revenue.
For calculations looking at available unrestricted net assets, only organizations that had full data filled in on the balance sheet (Part X) of the Form 990 were included, which decreased the sample of organizations with financial data to 3,888.

59H o w B o s t o n a n d O t h e r A m e r i c a n C i t i e s S u p p o r t a n d S u s t a i n t h e A r t s
Cultural Data Project (CDP)For the analysis of funding sources, TDC removed eight organizations that act as major re-granting organizations within their city, in order to prevent the double-counting of certain funding streams. For example, because the Minneapolis Historical Society regrants a significant portion of the state’s Arts and Culture Heritage Fund to other organizations, it was removed from this analysis.
Basic Identifying CategoriesTo analyze the Guidestar population and the CDP sample, TDC broke down the data into several cate-gories that served as a baseline for organizing and comparing the data, then used a set of raw and calcu-lated indicators to investigate the data. The section below outlines the categories and calculated indicators that served as the basis for the analysis.
Cities. Nearly all the analyses were made on the Metropolitan Statistical Area level, though in a very few cases (where noted) they focused on the city of Boston only. MSA data was received from both Guid-estar and CDP. However, CDP data does not necessar-ily include full MSA data if an MSA spans across state lines and the secondary state does not participate. This situation is the case in Boston, whose MSA crosses into New Hampshire, a non-CDP state. The precise MSAs used were as follows.
■■ Boston-Cambridge-Newton MA-NH MSA
■■ Baltimore-Columbia-Towson, MD MSA
■■ Chicago-Naperville-Elgin, IL-IN-WI MSA
■■ Cleveland-Elyria, OH MSA
■■ Houston-The Woodlands-Sugar Land TX MSA
■■ Minneapolis-St. Paul-Bloomington MN-WI MSA
■■ New York-Newark-Jersey City, NY-NJ-PA MSA
■■ Philadelphia-Camden-Wilmington, PA-NJ-DE-MD MSA
■■ Portland-Vancouver-Hillsboro, OR-WA MSA
■■ San Francisco-Oakland-Hayward CA MSA
■■ Seattle-Tacoma-Bellevue WA MSA
Time span. All findings refer to 2012 unless noted otherwise. For longitudinal analysis, 2006 was the comparison year. Longitudinal analysis was only possible with Guidestar data, since most states lack enough CDP data prior to 2012. Only organizations filing 990s in both years were included. The sample of organizations in the longitudinal analysis included 1,813 organizations across the 11 MSAs.
Budget size. As noted in the report, TDC used two schemes for categorizing by organizational budget size. First, organizations were divided into six catego-ries based on total expenses: Under $200,000, $200,000-$500,000, $1.5–5 million, $5–20 million, and over $20 million. These cohorts were combined to examine the role of small (under $500,000), mid-sized ($500,000–$5 million), and large (over $5 million) organizations in each city.
Discipline. TDC used organizations’ primary NTEE codes to allocate organizations into 16 disciplines. Based on this breakdown, TDC further bucketed orga-nizations into seven broad disciplines as well as two “super disciplines.” (Table A2 and Table A3)
Financial CalculationsGuidestar-based analyses. TDC used Guidestar as the basis for analysis of revenue, expenses, and balance sheet. The Form 990 lines used for each calculation differ between 2006 and 2012 because of the change in the Form 990. (Table A4)
To look at availability of financial resources, TDC cate-gorized organizations based on their months of avail-able unrestricted net assets.
■■ Less than 1 month
■■ 1–2.5 months
■■ 2.5–6 months
■■ 6–9 months
■■ Over 9 months
CDP-based analyses. TDC used the CDP sample to investigate contributed revenue streams, campaigns and new works. (Table A5)

60 U n d e r s t a n d i n g B o s t o n
TABLE A2
Code Type Discipline
A01 Alliance/Advocacy Organizations ASO (Arts Service Organization)
A02 Management & Technical Assistance ASO
A03 Professional Societies, Associations ASO
A05 Research Institutes and/or Public Policy Analysis ASO
A11 Single Organization Support Fundraising
A12 Fund Raising and/or Fund Distribution Fundraising
A19 Nonmonetary Support N.E.C. Fundraising
A20 Arts, Cultural Organizations Multipurpose/Other
A23 Cultural, Ethnic Awareness Community
A24 Folk Arts Community
A25 Arts Education/Schools Arts Education
A26 Arts Council/Agency ASO
A27 Community Celebrations Community
A30 Media, Communications Organizations Film, TV, Radio
A31 Film, Video Film, TV, Radio
A32 Television Film, TV, Radio
A33 Printing, Publishing Humanities
A34 Radio Film, TV, Radio
A40 Visual Arts Organizations Visual Arts
A50 Museum & Museum Activities Other Museums
A51 Art Museums Art Museum
A52 Children’s Museums Other Museums
A54 History Museums History
A56 Natural History, Natural Science Museums Other Museums
A57 Science & Technology Museum Other Museums
A60 Performing Arts Other Performing Arts
A61 Performing Arts Centers PAC
A62 Dance Dance
A63 Ballet Dance
A65 Theater Theater
A68 Music Music
A69 Symphony Orchestras Music
A6A Opera Other Performing Arts
A6B Singing Choral Music
A6C Music Groups, Bands, Ensembles Music
A6E Performing Arts Schools Arts Education
A70 Humanities Organizations Humanities
A80 Historical Societies and Related Activities History
A82 Historical Societies, Historic Preservation History
A84 Commemorative Events Community
A90 Arts Service Activities/Organizations ASO
A99 Other Art, Culture, Humanities Organizations/Services N.E.C. Multipurpose/Other

61H o w B o s t o n a n d O t h e r A m e r i c a n C i t i e s S u p p o r t a n d S u s t a i n t h e A r t s
TABLE A3
Discipline Broad Discipline Super Discipline
ASO ASO
Fundraising ASO
Multipurpose/Other Other
Community Community
Arts Education Community
Film, TV, Radio Film, TV, Radio
Humanities History/Humanities
Visual Arts Other
Other Museums Museums/Collecting Collections
Art Museum Museums/Collecting Collections
History History/Humanities Collections
Other Performing Arts Performing Arts Performance
PAC Performing Arts
Dance Performing Arts Performance
Theater Performing Arts Performance
Music Performing Arts Performance
TABLE A4
Category Name Detail/ Calculation Form 990 Line
2012 Total Revenue Total revenue Part VIII, Line 12
Total Expenses Total expenses Part IX, Line 25
Contributed Revenue Contributed income + special event income + gaming income
Part VIII, Lines 1h, 8c, 9c
Participation-Based Earned Revenue Program service income + sales of inventory Part VIII, Lines 2g, 10c
Program Expenses Total program service expenses Part IX, Line 25B
Available URNA Unrestricted net assets - investments in land, building and equipment + secured notes payable + tax exempt bonds
Part X, Lines 27, 10c, 20, 23
Months of Available URNA Available URNA ÷ month of expenses (total expenses ÷ 12)
Endowments Total endowment balance Schedule D, Part V, Line 1
Facilities Ownership Y: if investments in land, building and equipment > $1M, adjusted for cost of living
Part X, Line 10c
Facilities Fixed Assets If facility-owning organization, total investments in land, building and equipment
Part X, Line 10c
Occupancy Total occupancy expense Part IX, Line 16
2006 Total Revenue Total revenue Part I, Line 12
Total Expenses Total expenses Part I, Line 17
Contributed Revenue Contributed income + membership dues + net special event income
Part I, Lines 1d, 3, 9c
Participation-Based Earned Revenue Program service income + net sales of inventory Part I, Lines 2, 10c

62 U n d e r s t a n d i n g B o s t o n
TABLE A5
Category Name Detail/ Calculation
Contributed Revenue Total contributed support + total revenue from memberships
Individual Support Individual support + trustee support + revenue from memberships
Corporate Support Total corporate support
Foundation Support Total foundation support
Government Support City government support + county government support + state government support + federal government support
Other Support Tribal contributions + special events revenue + parent organization support + related organization support + in-kind support + other contributions
City Support Total city government support
County Support Total county government support
State Support Total state government support
Federal Support Total federal government support
Capital Campaign Goal Total capital campaign goal
Capital Campaign to Raise Total capital campaign goal - total raised to date
Endowment Campaign Goal Total endowment campaign goal
Endowment Campaign to Raise Total endowment campaign goal - total raised to date
Campaign Goal Total capital campaign goal + total endowment campaign goal
New Works Commissioned works + world premieres + national premieres + exhibition openings

63H o w B o s t o n a n d O t h e r A m e r i c a n C i t i e s S u p p o r t a n d S u s t a i n t h e A r t s
NationalBarbara Schaffer Bacon, Americans for the ArtsJanet Brown, Grantmakers in the ArtsRandy Cohen, Americans for the Arts
BostonJulie Burros, City of BostonCatherine Peterson, ArtsBostonJane Preston, New England Foundation for the ArtsLaura Sherman, Klarman Family FoundationAnita Walker, Massachusetts Cultural CouncilSan San Wong, Barr Foundation
BaltimoreTheresa Colvin, Maryland State Arts CouncilBill Gilmore, Office of Promotion and the ArtsJeannie Howe, Greater Baltimore Cultural AllianceKevin Moreno, Baltimore Community Foundation
ChicagoMichelle Boone, City of ChicagoSuzanne Connor, Chicago Community TrustJonathan VanderBrug, Arts Alliance IllinoisBenna Wilde, Prince Charitable Trusts
ClevelandKathleen Cerveny, Cleveland FoundationDeena Epstein, George Gund FoundationKaren Gahl-Mills, Cuyahoga Arts and CultureMegan Van Voorhis, Cleveland Partnership for Arts
and Culture
HoustonMinnette Boesel, City of HoustonJonathon Glus, Houston Arts AllianceDavid Lake, Houston Endowment
Minneapolis-St. PaulVicki Benson, McKnight FoundationSharon DeMark, St. Paul FoundationSue Gens, Minnesota State Arts Board
Gulgun Kayim, City of MinneapolisJeff Prauer, Metropolitan Regional Arts CouncilLaura Zabel, Springboard for the Arts
New YorkTom Finkelpearl, City of New YorkKerry McCarthy, New York Community TrustMargaret Morton, Bloomberg PhilanthropiesKay Takeda, Lower Manhattan Cultural Council
PhiladelphiaMichelle Currica and Ken Metzner, Philadelphia
Cultural FundHelen Haynes, Office of Arts, Culture and the Creative
EconomyPhilip Horn, Pennsylvania Council on the ArtsPaula Marincola, Pew Center for Arts and HeritageOlive Mosier, William Penn Foundation
PortlandMichelle Boss Barba, Oregon Community FoundationEloise Damrosch, Regional Arts and Culture CouncilMartha Richards, Miller FoundationBrian Rogers, Oregon Arts Commission and Oregon
Cultural Trust
San FranciscoKiley Arroyo, Cultural Strategies NetworkTom DeCaigny, San Francisco Arts CommissionJohn McGuirk, Hewlett FoundationTere Romo, San Francisco FoundationKary Schulman, San Francisco Grants for the Arts
SeattleRandy Engstrom, Seattle Office of Arts and
Cultural AffairsMari Horita, ArtsFundJim Kelly, 4CultureJim McDonald, Paul Allen FoundationHuong Vu, The Boeing Corporation
APPENDIX TWO
Interviewees


65H o w B o s t o n a n d O t h e r A m e r i c a n C i t i e s S u p p o r t a n d S u s t a i n t h e A r t s
AAAS. (2015). Humanities Indicators: A project of the American Academy of Arts and Sciences. Retrieved September 3, 2015, from http://www.humanities indicators.org/default.aspx
Adams, W. (2014, November 1). Address to National Federation of State Councils. Retrieved September 3, 2015, from National Endowment for the Humanities: http://www.neh.gov/about/chairman/speeches/address-national-federation-state-councils
Americans for the Arts. (2015). Twenty Years of Government Support for the Arts: Federal, State, and Local (1995 to 2014).
ArtsBoston. (2014). The Arts Factor.
Baumol, W. J., & Bowen, W. G. (1966). Performing Arts, The Economic Dilemma: a study of problems common to theater, opera, music, and dance. Twenti-eth Century Fund.
BEA. (2012). Gross Domestic Product (GDP) by Metro-politan Area. United States Bureau of Economic Analysis.
BLS. (2015). Local Area Unemployment Statistics. United States Bureau of Labor Statistics.
BMRB. (2013). New PILOT Program Raises Receipts in Second Year. Boston: Boston Municipal Research Bureau.
BMRB. (2014). New PILOT Program Raises Receipts in Third Year. Boston: Boston Municipal Research Bureau.
BRA. (2013). The Largest Employers in the City of Boston. Boston: Boston Redevelopment Authority.
Bureau of Economic Analysis. (2013, September 17). Economic growth widespread across metropolitan areas in 2012. US Department of Commerce.
Cabral-Curtis, E., Burgin, K., & Woolworth, N. (2015). Too Good to be True? The Opportunity and Cost of the $1 Building. Boston: TDC.
CFF. (2015, June 19). Governor Baker includes $10 million for Cultural Facilities Fund in First Capital Plan. Retrieved September 7, 2015, from Massachusetts Cultural Facilities Fund: http://www.masscultur-alcouncil.org/facilities/facilities_news/june15_release.htm
City of Boston. (2015). Boston Creates. Retrieved September 7, 2015, from http://www.bostoncreates.org/
City of Boston. (2010). Mayor’s PILOT Task Force: Final Report & Recommendations. Retrieved September 3, 2015, from City of Boston: http://www.cityofbos-ton.gov/Images_Documents/PILOT_%20Task%20Force%20Final%20Report_WEB%20_tcm3-21904.pdf
City of Boston. (2015). PILOT Program (Payment in Lieu of Tax). Retrieved September 2, 2015, from http://www.cityofboston.gov/assessing/PILOTProgram.asp
City of Philadelphia. (2015). Five Year Financial and Strategic Plan for Fiscal Years 2016–2020. City of Philadelphia.
City of Philadelphia. (2013). Summary of Operations Fiscal Years 2008 to 2013.
Colby, S. L., & Ortman, J. (2015). Projections of the Size and Composition of the U.S. Population: 2014 to 2060, Population Estimates and Projections. US Census Bureau.
Cook, G. (2015, July 30). State Arts Budget to Increase 20 Percent After Legislature Overrides Governor’s Veto. Artery . Boston: WBUR.
Cultural Data Project. (2014, October 29). 2012 Data Profiles of Arts and Cultural Organizations. Philadelphia.
Culture Blocks. (2013). Culture Blocks. Retrieved August 20, 2015, from http://www.cultureblocks.com/wordpress/
APPENDIX THREE
Works Cited and Data Sources

66 U n d e r s t a n d i n g B o s t o n
Curtis, E. C., Koo, J., & Nelson, S. (2009). Building a Sustainable Future for History Institutions: A Systemic Approach. Boston: TDC.
D5 Coalition. (2015). Retrieved August 15, 2015, from http://www.d5coalition.org
D5. (2015). D5 Coalition. Retrieved August 15, 2015, from http://www.d5coalition.org
Foundation Center. (2002, 2012). Aggregate Fiscal Data for Top 50 FC 1000 Foundations Awarding Grants for Arts and Culture. Retrieved September 2, 2015, from http://data.foundationcenter.org/#/fc1000/subject:arts/all/top:foundations/list/2012
Foundation Center. (2012). Aggregate Fiscal Data for Top 50 FC Foundations Awarding Grants for Arts and Culture, 2012. Retrieved August 18, 2015, from Foun-dation Stats: http://data.foundationcenter.org/#/fc1000/subject:arts/all/top:foundations/list/2012
Foundation Center. (2015). Top 100 U.S. Foundations by Asset Size. Retrieved August 18, 2015, from Foun-dation Center: http://foundationcenter.org/find-funders/topfunders/top100assets.html
Frug, G. E., & Barron, D. J. (2007). Boston Bound: A Comparison of Boston’s Legal Powers with Those of Six Other Major American Cities (Executive Summary). Boston: The Boston Foundation.
GBCVB. (2015). Boston Performing Arts & Entertain-ment. Retrieved August 22, 2015, from http://www.bostonusa.com/visit/bostoneveryday/whattodo/performingartsentertainment/
GBCVB. (2015). Statistics and reports. Retrieved August 18, 2015, from Greater Boston Convention and Visi-tors Bureau: http://www.bostonusa.com/partner/press/statistics/
GIA. (2015). Racial Equity in Arts Philanthropy: Statement of Purpose. Retrieved August 24, 2015, from http://www.giarts.org/racial-equity-arts-philanthropy-statement-purpose
Giving USA. (2013). Giving USA Data Tables. Giving USA Foundation.
GuideStar. (2012). Data on Arts Nonprofits from IRS Form 990.
GuideStar. (2015). NTEE A Arts, Culture, and Humani-ties Organizations located in Massachusetts vs. those in the Boston MSA. Retrieved August 19, 2015, from http://www.guidestar.org
Herman, C. M. (2014, November 15). Boston’s PILOT program lagging. CommonWealth , pp. 12–14.
Kayim, G. (2012). Minneapolis Creative Vitality Index Report. Minneapolis Office of Arts, Culture, and Creative Economy.
Kenyon, D., & Langley, A. (2010). Payments in Lieu of Taxes: Balancing Municipal and Nonprofit Interests. Lincoln Institute of Land Policy.
Kidder, S., & et al. (2010). Mayor’s PILOT Task Force: Final Report & Recommendations. City of Boston.
La Placa Cohen. (2014). Culture Track ‘14.
LaLonde, R., O’Muircheartaigh, C., & Perkins, J. (2006). Mapping Cultural Participation in Chicago. Chicago: Cultural Policy Center. University of Chicago.
Langley, A., Kenyon, D., & Bailin, P. (2012). Payments in Lieu of Taxes by Nonprofits: Which Nonprofits Make PILOTs and Which Localities Receive Them. Lincoln Institute of Land Policy.
Lomax, A. (1980). Appeal for Cultural Equity. African Music , 27 (2), 22–31.
Lord, C. (2013). The Arts Diversity Index: Measurement of and Impacts on Diversity in Bay Area Theatre. San Fran-cisco: Theatre Bay Area.
MCA. (2014). Clean Water, Land & Legacy Amendment Overview & History. Retrieved September 2, 2015, from http://www.mncitizensforthearts.org/news/amendment-funds/
MCFF. (2015). Grantmaking Data, FY2007 to FY2014. Massachusetts Cultural Facilities Fund.
Minnesota Historical Society. (2015). Minnesota Histori-cal & Cultural Heritage Grants. Retrieved August 21 2015, 2015, from http://legacy.mnhs.org/grants/
Minnesota State Legislature. (2015). Minnesota’s Legacy. Retrieved September 2, 2015, from http://www.legacy.leg.mn/
MOTT. (2015). Mass Vacation: Explore Arts. Retrieved August 22, 2015, from http://www.massvacation.com/explore/arts/

67H o w B o s t o n a n d O t h e r A m e r i c a n C i t i e s S u p p o r t a n d S u s t a i n t h e A r t s
NASAA. (2015, July). Annual Appropriations and Revenue Survey Data. Washington, DC: National Assembly of State Arts Agencies.
NEA. (2013). How a Nation Engages with Art: Highlights from the 2012 Survey of Public Participation in the Arts. National Endowment for the Arts.
Nelson, S. (2003). Funding for Cultural Organizations in Boston and Nine Other Metropolitan Areas. Boston: The Boston Foundation.
Nelson, S. (2009). Getting Beyond Breakeven. Boston: TDC.
Nelson, S., & Koo, J. (2014). Capitalization, Scale, and Investment: Does Growth Equal Gain? Philadelphia: William Penn Foundation.
Nelson, S., & McQueen, A. (2008). Vital Signs: Metro Boston’s Arts and Cultural Nonprofits, 1999 and 2004. Boston: The Boston Foundation.
Nelson, S., Ford, R. C., & Woolworth, N. (2014). The Unsung Majority: An exploratory study of small and mid-sized arts organizations. Boston: TDC.
NTTO. (2010). Top States and Cities Visited by Over-seas Travelers. National Travel and Tourism Office.
Pastore, E. (2009). The Future of Museums and Librar-ies: A Discussion Guide. Washington, DC: Institute of Museum and Library Services.
San Francisco Arts Commission. (2015). About Cultural Equity Endowment. Retrieved August 19, 2015, from http://www.sfartscommission.org/ceg/about-ceg/
Sidford, H. (2011). Fusing Arts, Culture, and Social Change: High Impact Strategies for Philanthropy. National Committee for Responsive Philanthropy.
TCG. (2015). Equity, Diversity & Inclusion Initiative. Retrieved July 28, 2015, from http://www.tcg.org/fifty/diversity.cfm
The Boston Foundation. (2014). Boston Indicators Project: Total revenue and expenditures City of Boston. Retrieved September 2, 2015, from http://www.bostonindicators.org/indicators/economy/how-are-we-doing/3-7funding-to-support-the-knowledge-economy/3-7-2total-revenue-and-expen-ditures-city-of-boston
UNESCO. (2001). Culture and Human Rights: UNESCO 2001 Universal Declaration on Cultural Diversity. Retrieved August 24, 2015, from http://www.unesco.org/new/en/culture/themes/culture-and-development/the-future-we-want-the-role-of-culture/culture-and-human-rights/
US Census. (2010). 2010 Census.
US Census. (2010). Cost of Living Index-Selected Urban Areas: Annual Average.
US Census. (2012). Five-year Estimates: City and Metropolitan Area Population, Non-Hispanic White Population, Household Income. American Community Survey .
Wang, J., & Nelson, S. (2005). Arts Service Organizations: A Study of Impact and Capacity. Boston: The Boston Foundation.
WESTAF. (2012). Creative Vitality Suite.
Woolhouse, M. (2015, January 29). State’s high housing costs weigh on economic opportunity. Boston Globe .


69H o w B o s t o n a n d O t h e r A m e r i c a n C i t i e s S u p p o r t a n d S u s t a i n t h e A r t s
1. The data were drawn from Metropolitan Statistical Areas, as defined by the Office of Management and Budget, to match the approach of the 2003 study. Basic details about each MSA, such as population levels and cost of living are included in the appendices. For convenience, the Minneapolis-St. Paul MSA is referred to hereafter as “Minneapolis.”
2. 2012 represented the most complete year available from these data sources at the time that these analyses were completed.
3. Percentage of top 3 organizations’ expenses within total expenses in comparably sized markets: Chicago (24 percent), Minneapolis (27 percent), New York (19 percent), San Francisco (22 percent).
4. The majority-minority designation applies only to the city of Boston. The metro area remained predominantly white.
5. Only Cleveland (with relatively high fixed assets and a small population) came out higher on this measure.
6. It is important to note that the financial impact of the large majority of small organizations is not included in this analysis since the IRS does not require organizations below $200,000 to file financial information. However, even when an allowance for these organizations is made (calculated at a generous average organizational size of $100,000), the financial domination of large organizations persists in all communities except Baltimore (which has only six large organizations in total).
7. Data included in this table are drawn from several sources. MSA population comes from the US Census Bureau’s 2012 American Community Survey (ACS). The growth percentage is based on ACS 2006 and 2012 MSA population numbers. Cost of living refers to the Cost of Living Index from the 2010 US Census. Unemployment is the 2012 Annual Average unemployment rate from the US Bureau of Labor Statistics.
8. Although the Art Institute of Chicago (AIC) was not included in the GuideStar data set because it is classified as an educational organization, TDC added its museum operations when possible because of the outsized impact that the AIC museum has on the Chicago arts ecosystem.
Please see the appendices for detailed methodology on the Art Institute of Chicago’s inclusion in the analysis, and how TDC approximated its arts-related expenses and revenues.
9. The large mid-sized cohort in Baltimore reflects the fact that Baltimore has very few large organizations, not that it has an unusually large mid-sized cohort.
10. Sources: 2010 US Census and Bureau of Economic Analysis 2013.
11. This higher concentration of film/TV/radio organizations in Boston is explained by the prevalence of public access stations in cities and towns across the MSA.
12. Other studies that include non-traditional forms of arts participation, such as the Greater Philadelphia Cultural Alliance’s Cultural Engagement Index, have found high participation rates among young people and non-whites.
13. “Months of available unrestricted net assets” corrects unrestricted net assets for unrestricted yet illiquid assets, such as facilities, to get at a clearer picture of resources that an organization can apply toward current-day needs. The calculation and specific Form 990 fields used in it are listed in the appendices.
14. For more details on TDC’s full method for diagnosing financial health, please see Getting Beyond Breakeven.
15. It is important to note that the information on the types of contributed revenue was drawn from the Cultural Data Project, while earned and total contributed aggregates were taken from GuideStar. Since the count of organizations in CDP is smaller than in GuideStar, it is not possible to account for 100 percent of contributed revenues found in GuideStar by adding up types of contributed revenue taken from CDP.
16. Separating participation-based revenues from investment returns in TDC’s earned revenue analysis is a key difference between this study and other recent research.
17. The Art Institute of Chicago is excluded from all calculations in Chapter Two because it was not possible to determine the makeup of its total arts-related revenue.
Endnotes

70 U n d e r s t a n d i n g B o s t o n
26. The Boston Arts Commission manages public art in Boston, which is administered by the Mayor’s Office of Arts and Culture. The City of Boston also has a budget for art works in public buildings, which is not included in the figure for Public Art as these funds are variable and depend upon capital construction projects.
27. The Browne Fund was established in 1978 with funds bequeathed to the city in 1901. The Fund is overseen by the Boston Arts Commission and administered by the Mayor’s Office of Arts and Culture. The Browne Fund supports public art projects throughout the City of Boston.
28. Grants are distributed through the Boston Cultural Council, which is under the umbrella of the Office of Arts, Tourism and Special Events.
29. Individual artist grants are distributed through a separate nonprofit, Community Partnership for Arts and Culture (CPAC), which serves as a service and advocacy organization for the greater Cleveland region.
30. A total of 19.3 percent of total hotel occupancy tax funds to the city go to the arts. HAA receives 39.5 percent of that for grant distribution.
31. Civic Art contracts in Houston are funded through 1.75 percent of qualifying capital improvement projects.
32. Hotel occupancy tax law requires that grant money must go to organizations that promote Houston as a cultural destination.
33. History organizations in Minneapolis-St. Paul are not funded by MRAC but rather through the Minnesota Historical Society, which is the statewide regrantor for the Arts and Cultural Heritage Fund dedicated to history. The Arts and Cultural Heritage Fund also directly supports public broadcasting in Minneapolis.
34. The Arts, Culture and Creative Economy program was established in 2011, and the budget has grown to $450,000 in FY2015.
35. Public Art in Minneapolis is managed by the Art in Public Places program, which works with the Minneapolis Arts Commission, a separate city commission.
36. A total of 80 percent of grant money must be invested in the downtown cultural district.
18. CDP collects data on attendance. However, guidelines for data entry leave a wide berth for varied interpretation, making it difficult to understand what these data mean. Therefore, TDC did not use these data in the analysis of earned revenue drivers.
19. The San Francisco number is skewed by an outlier in campaign.
20. A single outlier organization made up 44% of that goal.
21. This finding resonates with Cleveland interviews, which reported that organizations are attempting to build endowment to replace diminished individual and corporate giving.
22. The lower showing of Minneapolis and Philadelphia was somewhat surprising, given the strong reputation of those cities’ foundations. Philadelphia’s relatively average level of foundation giving may be explained by the dominance of the top foundations, as compared to a wider field of major players in cities like San Francisco and New York. In Minneapolis, foundations share the field with active corporate givers, who give an almost equivalent amount.
23. This analysis of government funding is based on reported revenues from nonprofit organizations and, as such, does not capture the full scope of government investment in the arts in Boston or in other cities. The city profiles in Chapter Four offer a more complete picture of the roles that local governments play in the arts ecosystem.
24. In 2012, the state funding picture was very low for Boston, because the Massachusetts Cultural Council (MCC) was funded at its lowest level since 2006. Since then, MCC funding has grown. The 2016 appropriation for MCC of $14.6 million was a 54 percent increase over the $9.5 million budget in 2012. MCFF too was in its lowest funded year at $1.55 million. It is important to note that the total of these increases to the Massachusetts Cultural Council or the Cultural Facilities Fund will not solely benefit Greater Boston. Similarly, the numbers reported in Figure 29 include only state funds directed toward organizations in Greater Boston.
25. In 2015, the Mayor’s Office of Arts and Culture was separated from the Office of Tourism, with a budget of $1.3 million.

71H o w B o s t o n a n d O t h e r A m e r i c a n C i t i e s S u p p o r t a n d S u s t a i n t h e A r t s
37. Capital support varies year to year, and the 2012 capital support was significantly lower than normal. Capital support usually falls in the range of $100–200 million. The 2012 number was the lowest since 2000.
38. Funded through separate Executive Capital Budget.
39. Several departments other than the Office of Arts, Culture and the Creative Economy support specific organizations. These include the Parks and Recreation Department, the Fire Department, and the Department of Health and Human Services.
40. Capital support varies year to year and projects often span several years.
41. Until 2012, funding for the arts (including GFTA, SFAC, Asian Art Museum, Fine Arts Museum and the War Memorial) were tied under a city ordinance to the hotel tax fund. In 2013, hotel tax revenue was redirected to the City General Fund. Going forward, arts funding will come from the City General Fund and will be determined by the mayor’s budget decisions.
42. Between 2001 and 2012, 40 percent of dedicated lodging tax revenues for the arts was set aside to create an endowment to support the arts.
43. Until 2012, 4Culture was funded through a county lodging (hotel) tax. This allocation ended in 2012 but is set to restart in 2021. Between 2013 and 2021, an endowment generated from lodging tax revenue ($70 million) will sustain funding for 4Culture.

72 U n d e r s t a n d i n g B o s t o n
Notes


U N D E R S T A N D I N G B O S T O N