Embed Size (px)
Citation preview

New Insights from the American Housing Survey
January 2011
Housing Trends Update for the 55+ Market
Mature MarketI N S T I T U T E
®
REPO
RT
Ho
usin
g Tren
ds U
pd
ate for th
e 55+ M
arket

The MetLife Mature Market Institute® The MetLife Mature Market Institute is MetLife’s center of expertise in aging, longevity and the generations and is a recognized thought leader by business, the media, opinion leaders and the public. The Institute’s groundbreaking research, insights, strategic partnerships and consumer education expand the knowledge and choices for those in, approaching or working with the 40+ market.
The Institute supports MetLife’s long-standing commitment to identifying emerging issues and innovative solutions for the challenges of life. MetLife, Inc. is a leading global provider of insurance, annuities and employee benefit programs, serving 90 million customers in over 60 countries. Through its subsidiaries and affiliates, MetLife holds leading market positions in the United States, Japan, Latin America, Asia Pacific, Europe and the Middle East. For more information, please visit: www.MatureMarketInstitute.com
57 Greens Farms Road Westport, CT 06880 [email protected]
National Association of Home Builders The National Association of Home Builders (NAHB) is a Washington, D.C.-based trade association representing 160,000 members involved in home building, remodeling, multi-family construction, property management, subcontracting, design, housing finance, building product manufacturing, and other aspects of residential and light commercial construction. Known as “the voice of the housing industry,” NAHB is affiliated with more than 800 state and local home builders associations around the country. NAHB’s builder members will construct about 80% of the new housing units projected for 2011.
1201 15th Street, NW Washington, DC 20005 (202) 266-8200, x0 • Fax (202) 266-8400 www.nahb.org
© 2011 MetLife
• Not A Deposit • Not FDIC-Insured • Not Insured By Any Federal Government Agency • Not Guaranteed By Any Bank Or Credit Union • May Go Down In Value

HOUSING TRENDS UPDATE FOR THE 55+ MARKET: NEW INSIGHTS FROM THE AMERICAN HOUSING SURVEY 1
Table of Contents Executive Summary.......................................................................................................................2
• Key Findings........................................................................................................................2 • Methodology ........................................................................................................................4
Chapter 1: 55+ Neighborhoods and Housing Characteristics ...................................................5 • Where 55+ Households Live by Tenure and Structure Type ..............................................5 • Where 55+ Households Live by Community Type .............................................................7 • Presence of Community Amenities ...................................................................................10 • Presence of Other Community Characteristics ..................................................................14 • Overall Rating of Current Community and Homes ...........................................................21
Chapter 2: 55+ Recent Movers ...................................................................................................24 • Reasons for Moving...........................................................................................................24 • Trends in Reasons for Moving...........................................................................................27 • Reasons for Choosing a Community .................................................................................30 • Age Distribution by Community Type ..............................................................................34 • Current Market: Household Size and Type .......................................................................36 • Current Market: Race and Education of Household Head.................................................41 • Current Market: Household Income and Share of Home Workers....................................45 • Number of Other Homes Looked at Before Moving In.....................................................49
Chapter 3: New Construction for the 55+ Market ...................................................................53 • Dollar Value of New Construction ....................................................................................53 • Basic Characteristics of New Construction .......................................................................54 • Why Households Choose New Homes ..............................................................................56 • How New Housing Units Compare with Previous Residences .........................................59 • How New Home Purchases Are Financed.........................................................................61
Chapter 4: Reverse/Home Equity Conversion Mortgages.......................................................63
• Mortgage Status of 55+ Homeowners ...............................................................................63 • Demographics and Socio-Economic Status of Reverse Mortgage Borrowers ..................64 • Length of Stay and Mortgage Status of Reverse Mortgage Borrowers ............................67 • Reverse Mortgage Borrowers in 55+ Communities ..........................................................68
Chapter 5: 55+ Housing Market Shares and Projections ........................................................69
Appendix: Additional Tables ......................................................................................................73
Endnotes .......................................................................................................................................75

2
Executive Summary The Baby Boomers, conventionally defined as those born in 1946 through 1964, have had an impact on society, from their childhood to their transition into retirement. This generation is now age 47 to 65, straddling the key threshold of age 55, when housing can legally be age-restricted and therefore designed specifically to serve them. In 2009, recognizing the importance of these developments for the housing industry, the MetLife Mature Market Institute and the National Association of Home Builders (NAHB) undertook and reported a study, Housing for the 55+ Market: Trends and Insights on Boomers and Beyond, which looked at the trends reported in the American Housing Survey (AHS). They have partnered again on a research project that closely examines the 55+ population—the Boomers as well as older cohorts—from the most recent AHS regarding their choice in homes and communities as well as how they finance them. The result, Housing Trends Update for the 55+ Market, makes this report one of the most comprehensive studies dedicated to this segment of the housing market. The report is based on data from the most recent installments of the AHS, which is funded by the U.S. Department of Housing and Urban Development and conducted in odd-numbered years by the U.S. Census Bureau. Although the data cover all types of housing and households, the report focuses especially on households age 55 or older, those living in age-qualified active adult communities, other non-age-qualified 55+ owner-occupied communities (not explicitly age-restricted but nevertheless occupied primarily by people age 55+), and age-restricted rental communities. In select cases, data is also presented on housing characteristics for households under age 55 for comparison. The most recent AHS data come from interviews that took place in the midst of the 2008–2009 economic recession and provide insights into how the economic downturn affected the 55+ market. The report also looks closely at trends that emerged during the eight-year period from 2001 to 2009. In particular, Housing Trends Update for the 55+ Market analyzes where 55+ households live, characteristics of their homes and communities, and level of satisfaction with the homes and communities. The report also looks at 55+ households who change addresses, finding out why they moved and from where, as well as other key demographic information, such as household size, education, race, and income. Also covered are characteristics of new construction, including the dollar value, basic characteristics, motivations of the buyer or renter, comparisons to the previous home, and how new home purchases are financed. A separate section is devoted to the relatively new phenomenon of reverse or home equity conversion mortgages. Finally, the report looks at the market share of 55+ households and presents a forecast of home sales and new construction for this segment of the market in 2011 and 2012. Key Findings • The majority of 55+ households do not live in age-qualified (i.e., age-restricted) or other communities
occupied mostly by 55+ households. The shares of households in different types of 55+ communities have been relatively stable since 2005; however, that implies an increase in demand for housing in 55+ communities going forward, as the share of households age 55+ is projected to grow annually, and to account for nearly 45% of all U.S. households by the year 2020.
• The 2008–2009 recession made 55+ new home buyers more practical. Aesthetic reasons for choosing a housing unit, such as exterior appearance and the unit view became less important. Financial reasons gain their importance in other 55+ communities and non-communities.
• The recent housing downturn made a significant impact on how 55+ households finance their new home purchases. Those making a down payment had to rely more frequently on savings and cash on

HOUSING TRENDS UPDATE FOR THE 55+ MARKET: NEW INSIGHTS FROM THE AMERICAN HOUSING SURVEY 3
hand rather than a sale of a previous home. For example, only 55% of the new age-qualified active adult home buyers who made a down payment reported that it came from the sale of a previous home, significantly down from 92% in 2007. Other 55+ home buyers registered similar difficulties selling their previous residences in 2009.
• By some measures, the neighborhoods in which 55+ households live have improved. Compared to earlier years, more 55+ households report having access to satisfactory shopping in 2007 and 2009; fewer report having a problem with street noise.
• Most 55+ households continue to be happy with the homes and communities they live in, but this is especially true for 55+ households living in age-qualified adult housing, who on average rate their home a 9.0 on a scale of 1 to 10 (1=worst; 10=best).
• The primary reasons for moving to a 55+ owner-occupied community continue to be family or personal reasons, and the desire to have a higher quality home. In multi-family communities, family was the number one reason as well, but reducing costs came in second.
• Similarly, when 55+ households choose a particular community, their decision is most often driven by the desire to be close to family and friends. Design and looks also rank high but lost their importance to some extent during the recent economic downturn.
• Although not cited as often as the top three reasons, proximity to work is on the rise as a reason for choosing an active adult community. The share citing proximity to work has increased with each survey, from 2% in 2001 to nearly 12% in 2009, suggesting that active adult communities are attracting more residents while they are still in the workforce.
• Consistent with this pro-work tendency, the share of 55+ single-family customers who work at home continues to rise, even during the economic downturn. Although the reason for this can’t be determined with certainty, changes in technology may be making businesses more willing and able to let employees work at home. The trend is likely to continue as more and more tech-savvy Baby Boomers cross the age 55 threshold. The implication for builders of active adult housing is that demand for office space inside the home is likely to rise.
• Between 2007 and 2009, coincident with the most recent economic recession, average income for 55+ households in the market for housing declined, more significantly among those moving to multi-family properties—from an average of over $36,000 in 2007 to under $34,000 in 2009.
• Despite the drop in income for other categories of 55+ households, income for age-qualified active adult customers continued to rise, to an average of more than $80,000 in 2009. Partially, this can be attributed to a rising number of high-income households attracted to this market segment. In 2009, more than 27% of age-qualified active adult customers earned $100,000 or more, compared to less than 5% in 2001.
• Customers who buy homes in age-qualified active adult or other 55+ communities look at an average of 12 homes, usually in more than one neighborhood before making the purchase. In contrast, more than half of customers moving into age-restricted rental apartments look at only one or two housing units in only one neighborhood.
• Median values of homes purchased show that no category of the 55+ community was immune to the recent downturn in housing markets. All experienced price declines since a peak that occurred either in 2005 or 2007.
• However, the median price of a new age-qualified active adult home in 2009 was still $300,000, only about 6% below its 2005 peak of $320,000. The gap between the median value of new age-qualified active adult and other types of homes purchased by 55+ buyers widened, as the percentage declines for the other types was larger.

4
• When 55+ households buy new homes, they tend to trade up in quality but not necessarily in price. In 2009, more than half of 55+ buyers reported that they were moving into a better unit. Fewer than half of the same buyers, however, reported that their new homes cost more than the old ones.
• A small but growing share of older households is taking advantage of reverse mortgages. Less than 1% of 55+ households reported having a reverse mortgage or home equity conversion mortgage in 2009. Even so, the reverse mortgage share has increased with every survey and in 2009 was almost eight times greater than in 2001.
• Almost two-thirds of reverse mortgage borrowers are between ages 62–79, with an average age of 77. Although only about 1% of all 55+ homeowners, more than 241,000 seniors hold a reverse mortgage, a 54% increase from 2007.
• About 54,000 housing starts in 55+ communities are projected in 2011. Although up 30% from the number estimated for 2010, this still represents a relatively modest level of 55+ production. Starts in 55+ communities are projected to increase another 46%, to roughly 79,000 housing units, in 2012.
Methodology The information in this report is based on the 2009 American Housing Survey (AHS), the most recent release of this ongoing data collection, and observed trends in the AHS between 2001 and 2009. The AHS is designed by the U.S. Department of Housing and Urban Development (HUD) and the U.S. Census Bureau to capture a relatively large amount of information about the physical characteristics of the units in which Americans live. Characteristics are tabulated not only by the age of the occupants and structure type, but by community type. Based on the information available in the AHS, three types of 55+ communities can be defined: age-qualified active adult communities, other non-age-qualified 55+ owner-occupied communities (those that are not explicitly age-restricted but nevertheless are occupied by adults age 55 +), and age-restricted rental communities. The AHS first began asking the relevant questions on 55+ communities in 2001; therefore, this is the earliest that trends in these types of communities can be tracked. The decision to examine particular types of 55+ communities in detail is based not only on the availability of responses to particular questions in the AHS, but also on the ability to capture a sufficient number of observations to analyze. The AHS is a survey of all housing in the U.S., and some types of 55+ housing communities comprise a relatively small share of the total housing stock. The definitions of 55+ community types employed here capture at least 20 observations in each cell, even when the analysis is restricted to recent movers or new construction, and it was considered inadvisable to partition the data more finely than this. Each of the chapters in this report focuses on a different aspect of the 55+ housing market. Chapter 1 describes the existing 55+ communities and housing characteristics. Chapter 2 studies the demand side of the 55+ housing market by examining characteristics and mobility trends of 55+ recent movers. Chapter 3 analyzes the supply side of the market by looking at the new construction serving the 55+ housing market. Chapter 4 examines how senior households use reverse and home equity conversion mortgages. Chapter 5 presents 55+ market projections into 2011.
HOUSING TRENDS UPDATE FOR THE 55+ MARKET: NEW INSIGHTS FROM THE AMERICAN HOUSING SURVEY 5
Chapter 1 55+ Neighborhoods and Housing Characteristics This chapter presents detailed information on where older households live, including characteristics of the communities and how satisfied they are with them. The information in this chapter is intended to increase understanding of the 55+ housing market in terms of the surrounding neighborhood and what community characteristics may attract consumers.
Where 55+ Households Live by Tenure and Structure Type
Most 55+ Households Own Single-Family Detached Homes
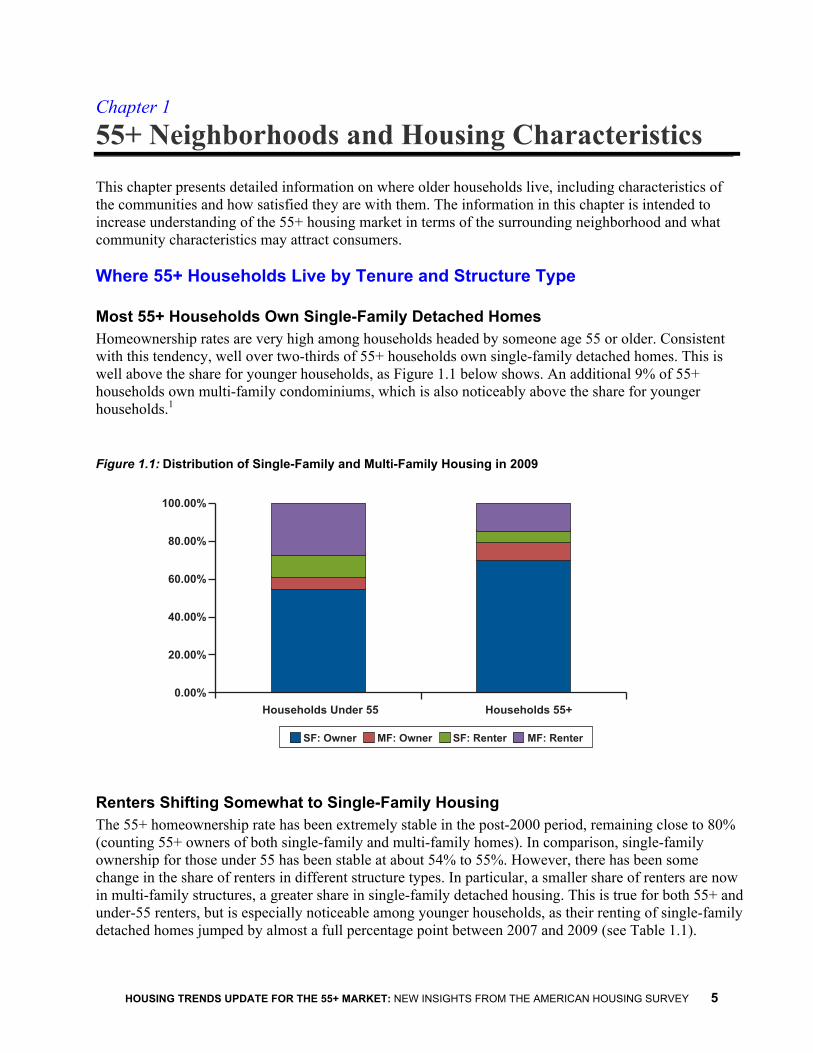
Homeownership rates are very high among households headed by someone age 55 or older. Consistent with this tendency, well over two-thirds of 55+ households own single-family detached homes. This is well above the share for younger households, as Figure 1.1 below shows. An additional 9% of 55+ households own multi-family condominiums, which is also noticeably above the share for younger households.1
Figure 1.1: Distribution of Single-Family and Multi-Family Housing in 2009
Renters Shifting Somewhat to Single-Family Housing
The 55+ homeownership rate has been extremely stable in the post-2000 period, remaining close to 80% (counting 55+ owners of both single-family and multi-family homes). In comparison, single-family ownership for those under 55 has been stable at about 54% to 55%. However, there has been some change in the share of renters in different structure types. In particular, a smaller share of renters are now in multi-family structures, a greater share in single-family detached housing. This is true for both 55+ and under-55 renters, but is especially noticeable among younger households, as their renting of single-family detached homes jumped by almost a full percentage point between 2007 and 2009 (see Table 1.1).
100.00%
80.00%
60.00%
40.00%
20.00%
0.00%Households Under 55 Households 55+
SF: Owner MF: Owner SF: Renter MF: Renter

6
Table 1.1: Household Tenure and Structure Type 2001–2009
Share of Households Under 55 Share of Households 55+
Multi-Family Single-Family Detached
Multi-Family Single-Family Detached
Owner Renter Owner Renter Owner Renter Owner Renter
% %
2001 6.05 29.89 54.29 9.77 9.13 15.80 70.65 4.42
2003 6.12 29.16 54.57 10.14 9.09 15.50 70.86 4.55
2005 6.51 28.35 54.91 10.23 9.46 15.56 70.57 4.41
2007 6.51 28.40 54.20 10.89 9.02 15.74 70.56 4.68
2009 6.33 27.57 54.31 11.79 9.01 15.38 70.56 5.04

HOUSING TRENDS UPDATE FOR THE 55+ MARKET: NEW INSIGHTS FROM THE AMERICAN HOUSING SURVEY 7
Where 55+ Households Live by Community Type Over a period of years, NAHB economists have worked with HUD and the Census Bureau to improve the quality of the data that the federal government collects on 55+ housing markets. One result of these efforts is that, beginning in 2001, the AHS began asking respondents whether the building or neighborhood they live in is age-restricted, and if not, whether it is occupied mostly by people age 55+. This new question gives us the opportunity to distinguish 55+ communities from other community types. The question on age restriction is important because age-restricted (or, as it is often called in the industry, age-qualified) communities may have different amenities designed to attract older people, and it will be useful to know what these amenities are. The second part of this question, designed to identify communities that have attracted people age 55+ even though these communities are not age-qualified, also provides useful information. Some of these communities are likely to be close substitutes for age-qualified properties, in which case they represent a significant part of the 55+ housing supply. By using the age-restricted status and information on communities occupied mostly by residents age 55+, along with information on structure type and ownership status, we classify different types of communities as shown in Table 1.2. This classification scheme was devised to handle the new data available in the AHS and does not necessarily agree with terminology and definitions used elsewhere in the industry. Table 1.2: Households by Community Type and Homeownership: 2009
Multi-Family Single-Family Detached Community Type
Owner Renter Owner Renter Total
Age-Qualified Active Adult 422,100 0 668,351 0 1,090,451
Owner in Other 55+ Communities 913,961 0 7,316,256 0 8,230,217
Age-Restricted Rentals 0 1,523,483 0 65,807 1,589,290
Renter in Other 55+ Communities 0 860,958 0 511,649 1,372,607
Other 55+ Households 2,212,076 3,647,037 19,928,352 1,433,106 27,220,570
Total 55+ Households 3,548,137 6,031,478 27,912,959 2,010,562 39,503,135
Under-55 Households 4,137,580 18,170,635 35,411,272 7,744,399 65,463,885
Total 7,685,716 24,202,113 63,324,230 9,754,961 104,967,020

8
Most 55+ Households Do Not Live in Age-Qualified Active Adult or Other 55+ Communities
As shown in Table 1.2, age-qualified active adult housing accounts for just over a million of the 39.5 million 55+ households in the U.S. in 2009. “Other” 55+ owner-occupied communities— identified by homeowners who reported their neighbors are mostly 55 and older, although the neighborhoods (or the buildings for multi-family residents) are not explicitly age-qualified— account for 8.2 million. Sixty-nine percent of 55+ households, however, live in communities that are neither age-qualified nor occupied mostly by people over age 55 (see Figure 1.2).
Figure 1.2: 55+ Household Distribution in 2009
Age-qualified active adult and age-restricted rentals are two specific community types that clearly represent distinct segments of the housing market. The “other 55+ owner-occupied community” category is somewhat nebulous, but it accounts for a relatively large share of the 55+ households and is thus too large and potentially important to ignore. These three community types—age-qualified active adult, other 55+ owner-occupied community, and age-restricted rentals—are analyzed in the rest of this chapter. Other community types that can be identified either contain too few households to tabulate or do not isolate a distinct enough part of the housing market to tabulate.
Age-QualifiedActive Adult
3%
Owner in Other 55+ Communities
21%
Age-Restricted Rentals
4%
Renter in Other 55+ Communities
3%
Other 55+Households
69%

HOUSING TRENDS UPDATE FOR THE 55+ MARKET: NEW INSIGHTS FROM THE AMERICAN HOUSING SURVEY 9
Age-Qualified Active Adult Share Stable Since 2005 As shown in Tables 1.3 and 1.4, the share of 55+ households choosing to live in age-qualified active adult communities was on the rise through 2007 and remained in the vicinity of 3% since 2005. Technically, the data show slight declines in both the share and number of households in age-qualified active adult communities in 2009, but that could easily be attributable to sampling error. According to the NAHB long-term forecast, the share of 55+ households is expected to grow to nearly 45% by 2020. As the number of Baby Boomer households appropriate for active adult housing increases over the next decade, the number of residents in these communities is likely to rise, even if their share among 55+ households remain stable. Table 1.3: 55+ Household Distribution by Community Type
2001 2003 2005 2007 2009 Community Type
% Age-Qualified Active Adult 2.2 2.0 2.7 3.0 2.8
Owner in Other 55+ Communities 19.0 15.1 18.9 19.0 20.8
Age-Restricted Rentals 3.2 2.9 3.7 4.0 4.0
Renter in Other 55+ Communities 3.8 3.2 3.5 3.2 3.5
Other 55+ 71.8 76.8 71.1 70.8 68.9
Table 1.4: Number of Households by Community Type
Community Type 2001 2003 2005 2007 2009
Age-Qualified Active Adult 732,727 689,082 1,018,742 1,155,882 1,090,451
Owner in Other 55+ Communities 6,374,299 5,205,327 7,005,812 7,377,108 8,230,217
Age-Restricted Rentals 1,060,883 1,003,332 1,372,424 1,563,126 1,589,290
Renter in Other 55+ Communities 1,280,281 1,106,286 1,312,481 1,262,596 1,372,607
Other 55+ 24,080,224 26,553,808 26,393,129 27,515,100 27,220,570
Total 55+ Households 33,528,414 34,557,835 37,102,588 38,873,812 39,503,135
Under-55 Households 65,514,116 64,430,550 64,828,879 64,899,382 65,463,885
Total 99,042,530 98,988,385 101,931,467 103,773,194 104,967,020

10
Presence of Community Amenities Many Households Report Having Access to Open Spaces and Recreational Facilities The AHS contains data on a substantial number of community characteristics. Table 1.5 shows amenities that developers of 55+ housing may provide (e.g., recreational services) or take into account when planning the project (e.g., a location near water). Among these particular amenities, open space within half a block and recreational facilities are the most common. Almost 43% of the 55+ households in single-family detached homes live within half a block of open space (roughly the same as for younger households). A slightly smaller share (36%) of the 55+ households in multi-family structures have open spaces in their communities, and this percentage also does not vary much by age. More than 53% of 55+ multi-family households reported having recreational facilities in their communities, and this percentage increases with age. A smaller share, about 41%, of single-family detached households reported having recreational facilities in their communities. Recreational facilities include any of the following: a community center or clubhouse, golf course, walking/jogging trails, private or restricted-access beach, park, or shoreline. Clearly, it would be useful to be able to distinguish golf courses from walking trails, but the Census Bureau needs to lump all recreational amenities into one category in order to preserve respondent confidentiality. Table 1.5: Community Amenities in 2009: Single-Family Detached and Multi-Family Households
Age of Household Head Under 55 55 or Older
Under 45
45 to 54
55 to 64
65 to 74 75+ Total
55+
Single-Family Detached %
Open space within ½ block 42.8 44.6 44.7 43.9 37.5 42.7
With recreational facilities 39.5 40.7 41.4 40.2 39.4 40.5
Community services provided 17.9 17.8 17.6 18.0 19.8 18.3
Building not on the waterfront but water within ½ block 13.5 15.1 15.3 13.6 10.1 13.5
Gated community 5.3 5.0 5.6 6.1 5.2 5.6
Building located on the waterfront 2.1 3.3 4.0 4.5 3.9 4.1
Multi-Family %
Open space within ½ block 34.7 36.4 35.2 34.9 37.3 35.8
With recreational facilities 45.7 46.5 45.0 55.0 61.6 53.1
Community services provided 18.0 19.7 18.7 23.6 36.2 25.8
Building not on the waterfront but water within ½ block 12.4 12.5 11.6 11.8 12.7 12.0
Gated community 19.7 19.7 19.1 21.3 22.3 20.7
Building located on the waterfront 1.9 2.8 2.9 3.8 5.1 3.8

HOUSING TRENDS UPDATE FOR THE 55+ MARKET: NEW INSIGHTS FROM THE AMERICAN HOUSING SURVEY 11
Most Age-Qualified Active Adult and Age-Restricted Rental Communities Provide Recreational Facilities
Although the incidence of most community amenities does not vary much with the age of the head of household, there are substantial differences based on the type of community. For example, well over 70% of age-qualified active adult or age-restricted rental communities provide recreational facilities, while only 46% of other 55+ owner-occupied communities provide recreational facilities (see Table 1.6).
Table 1.6: Community Amenities in 2009 by Community Type
Age-Qualified Active Adult
Other 55+ Owner-
Occupied Communities
Age-Restricted Rental
%
With recreational facilities 74.5 46.4 78.9
Open space within ½ block 40.5 44.8 37.2
Community services provided 34.7 19.8 57.1
Gated community 35.0 6.9 28.4
Building not on the waterfront but water within ½ block 18.8 14.5 11.1
Building located on the waterfront 6.3 6.3 3.8
Another example is the presence of community services, which, as defined in the AHS, include shuttle buses and day care centers. The share of households in apartment buildings with community services does increase somewhat with age, but the greatest differences are seen when looking across community types. Age-restricted rental communities have the highest incidence (57%) of community services, while only 20% of other 55+ owner-occupied communities provide community services.

12
Age-Qualified Active Adult Homes Are More Often Near Water, in a Gated Community, and in Communities with Recreational Facilities Homes in age-qualified active adult communities are more likely to be located near (within half a block or 300 feet) a body of water, although only an average share of the homes are actually on the waterfront. In the case of active adult homes, of course, the community may be on a waterfront even though this is not the case for every home in the community. According to a previous NAHB article, being on waterfront increases property value more than any of the other neighborhood characteristics identified in the AHS.2 The AHS also asks respondents whether their communities are surrounded by walls or fences preventing access by persons other than residents. If the answer is yes, the home is classified as being in a gated community. According to this definition, in 2009, 35% of age-qualified active adult homes are in gated communities, in contrast to only 6% for 55+ single-family detached households in general. More 55+ Owners Locating Near Open Spaces As Tables 1.7 and 1.8 show, having open space within half a block is becoming more common, thus developing into a universal trend covering all types of 55+ housing and communities. In addition, the AHS shows that age-qualified active adult communities are more likely than other communities to provide recreational facilities, although in 2007 and 2009 the share turned out to be even higher in age-restricted rental communities. Table 1.7: Trends in Amenities: 55+ Single-Family Detached and Multi-Family Households
2001 2003 2005 2007 2009
Mul
ti-Fa
mily
Sing
le-F
amily
D
etac
hed
Mul
ti-Fa
mily
Sing
le-F
amily
D
etac
hed
Mul
ti-Fa
mily
Sing
le-F
amily
D
etac
hed
Mul
ti-Fa
mily
Sing
le-F
amily
D
etac
hed
Mul
ti-Fa
mily
Sing
le-F
amily
D
etac
hed
% Open space within ½ block 27.5 35.8 28.7 36.9 32.7 39.0 33.9 41.6 35.8 42.7
With recreational facilities 45.3 31.6 45.8 29.9 44.5 29.3 51.5 37.9 53.1 40.5
Community services provided 27.7 20.3 27.1 18.5 26.7 17.6 28.4 19.1 25.8 18.3
Building not on the waterfront but water within ½ block
11.0 11.8 11.7 12.4 11.7 13.0 11.5 12.9 12.0 13.5
Building located on the waterfront 3.8 3.9 3.2 3.9 3.4 3.7 3.3 4.0 3.8 41.0
Gated community 14.7 3.1 14.4 3.3 13.7 3.3 18.6 5.7 20.7 5.6

HOUSING TRENDS UPDATE FOR THE 55+ MARKET: NEW INSIGHTS FROM THE AMERICAN HOUSING SURVEY 13
Table 1.8: Trends in Amenities by Community Type
2001 2003 2005 2007 2009
Ag
e-Q
ua
lifi
ed
Oth
er
55
+ O
wn
er
Ag
e-R
es
tric
ted
R
en
tal
Ag
e-Q
ua
lifi
ed
Oth
er
55
+ O
wn
er
Ag
e-R
es
tric
ted
R
en
tal
Ag
e-Q
ua
lifi
ed
Oth
er
55
+ O
wn
er
Ag
e-R
es
tric
ted
R
en
tal
Ag
e-Q
ua
lifi
ed
Oth
er
55
+ O
wn
er
Ag
e-R
es
tric
ted
R
en
tal
Ag
e-Q
ua
lifi
ed
Oth
er
55
+ O
wn
er
Ag
e-R
es
tric
ted
R
en
tal
%
With recreational facilities
81.2 37.0 70.2 77.1 37.8 74.4 73.2 34.7 70.6 74.3 44.3 75.2 74.5 46.4 78.9
Community services provided
43.9 22.1 52.1 43.3 20.5 51.5 34.9 18.6 55.5 36.7 22.0 56.8 34.7 19.8 57.1
Open space within ½ block
33.9 35.2 25.9 35.1 34.7 33.8 33.5 39.9 34.7 37.6 42.5 39.5 40.5 44.8 37.2
Gated community
30.9 5.2 21.3 35.9 4.8 21.6 30.6 5.3 22.3 33.6 7.5 27.8 35.0 6.9 28.4
Building not on the waterfront but water within ½ block
21.0 13.0 9.5 19.0 13.8 14.3 18.4 13.7 12.6 16.6 13.3 11.2 18.8 14.5 11.1
Building located on the waterfront
4.8 6.8 3.8 6.0 5.8 1.8 3.7 6.1 4.0 4.9 6.5 3.2 6.3 6.3 3.8

14
Presence of Other Community Characteristics 55+ Households Less Likely to Live Near Neighborhood Nuisances The AHS collects information on a variety of other neighborhood characteristics. Many of these are characteristics that develop over time and are not necessarily planned for by developers, such as heavy street noise. Tables 1.9 and 1.10 show that many of these nuisances (crime, trash, abandoned buildings) are less common among older households. This is consistent with the notion that households seek to move into locations free from particular nuisances and, as a household ages, it tends to be more successful at this. Table 1.9: Other Community Characteristics in 2009: Single-Family Detached Households
Age of Household Head
Under 55 55 or Older
Under 45
45 to 54
55 to 64
65 to 74 75+ Total
55+
Nearby Characteristics %
Single-family home within ½ block 97.0 95.7 96.0 94.9 95.8 95.6
Public elementary school within 1 mile 61.7 62.1 63.9 60.9 52.7 62.5
Business within ½ block 24.6 22.3 21.0 18.1 19.6 19.8
Parking lot within ½ block 18.6 17.8 16.4 14.0 13.6 15.0
Railroad/airport/4-lane hwy within ½ block 14.3 13.3 13.3 12.9 13.0 13.1
Mobile home within ½ block 9.2 8.6 10.3 11.6 10.7 10.8
Factories within ½ block 4.0 3.5 3.3 3.1 2.3 3.0
Other Characteristics %
Majority of neighbors 55+ 14.2 20.3 23.9 28.4 31.7 27.1
Apartment building in neighborhood 14.0 12.6 12.2 10.5 11.9 11.6
Nearby units are younger 9.4 10.6 11.8 12.3 16.0 13.0
Nearby units are older 8.0 8.0 8.3 6.8 7.0 7.5
Characteristics That Are Satisfactory %
Satisfactory neighborhood shopping 97.6 97.9 97.2 97.0 97.4 97.2
Satisfactory police protection 93.2 93.3 93.5 93.8 94.7 93.9
Satisfactory public transportation 49.4 49.6 45.5 42.4 46.4 44.8
Nuisance Characteristics %
Roads within ½ block need repairs 37.9 37.8 37.4 36.5 36.8 37.0
Heavy street noise 21.1 20.6 20.4 19.8 19.4 20.0
Community crime 18.0 16.9 14.1 13.0 10.4 12.8
Trash within ½ block 8.0 6.5 6.2 5.5 5.1 5.7
Buildings with bars on window within ½ block 7.3 7.5 6.7 7.3 7.3 7.0
Abandoned buildings in neighborhood 6.8 5.6 5.8 5.8 3.9 5.3

HOUSING TRENDS UPDATE FOR THE 55+ MARKET: NEW INSIGHTS FROM THE AMERICAN HOUSING SURVEY 15
Table 1.10: Other Community Characteristics in 2009: Multi-Family Households
Age of Household Head
Under 55 55 or Older
Under 45 45 to 54 55 to 64 65 to 74 75+ Total 55+
Nearby Characteristics %
Public elementary school within 1 mile 78.4 79.3 82.8 69.9 100.0 81.6
Single-family home within ½ block 71.5 73.3 73.0 71.9 71.4 72.2
Parking lot within ½ block 67.0 61.5 63.5 57.7 67.6 63.3
Business within ½ block 61.7 60.1 58.4 54.1 53.4 55.7
Railroad/airport/4-lane hwy within ½ block 29.4 29.2 27.2 25.2 24.9 25.9
Factories within ½ block 8.5 9.6 8.4 7.0 5.4 7.0
Mobile home within ½ block 3.7 3.9 3.4 2.8 2.7 3.0
Other Characteristics %
Apartment building in neighborhood 80.5 77.5 71.4 70.3 71.5 71.2
Nearby units are younger 12.7 12.0 11.3 10.3 9.4 10.4
Nearby units are older 9.1 8.2 8.1 11.6 12.4 10.4
Majority of neighbors 55+ 6.6 15.3 17.0 25.6 34.7 23.8
Characteristics That Are Satisfactory %
Satisfactory neighborhood shopping 97.5 96.9 97.0 97.7 98.3 97.6
Satisfactory police protection 92.6 93.0 93.4 94.6 97.6 95.1
Satisfactory public transportation 80.8 81.6 81.7 78.5 76.4 79.1
Nuisance Characteristics %
Roads within ½ block need repairs 45.9 44.4 43.4 38.7 34.6 39.3
Noise from walls/ceilings 38.4 31.1 28.9 21.3 14.6 22.3
Heavy street noise 30.5 31.6 30.5 25.8 20.2 25.9
Community crime 25.6 23.9 22.3 19.4 10.9 17.8
Buildings with bars on window within ½ block 19.4 24.5 20.8 21.7 14.7 19.1
Trash within ½ block 16.2 15.0 10.2 9.6 5.5 8.5
Abandoned buildings in neighborhood 8.6 8.7 7.3 6.1 2.9 5.6
55+ Households Experiencing Better Shopping, Less Street Noise Tables 1.11 and 1.12 show the incidence of various community characteristics from 2001 to 2009. The incidences of most characteristics have remained relatively stable across years, without many obvious trends in one direction or the other. One exception is that more 55+ households now report access to satisfactory shopping. The percentages with satisfactory shopping jumped for 55+ households in both single-family and multi-family housing in 2007, and remained high in 2009. Meanwhile, the share of 55+ households reporting problems with heavy street noise has declined. The year-to-year reductions in street noise have not been extremely large, but consistent since 2001. Where the percentage shifts moderately in a particular year in a way that has no obvious explanation, it’s important to remember that these results come from a survey that is subject to sampling errors which are a source of variation in the numbers.
16
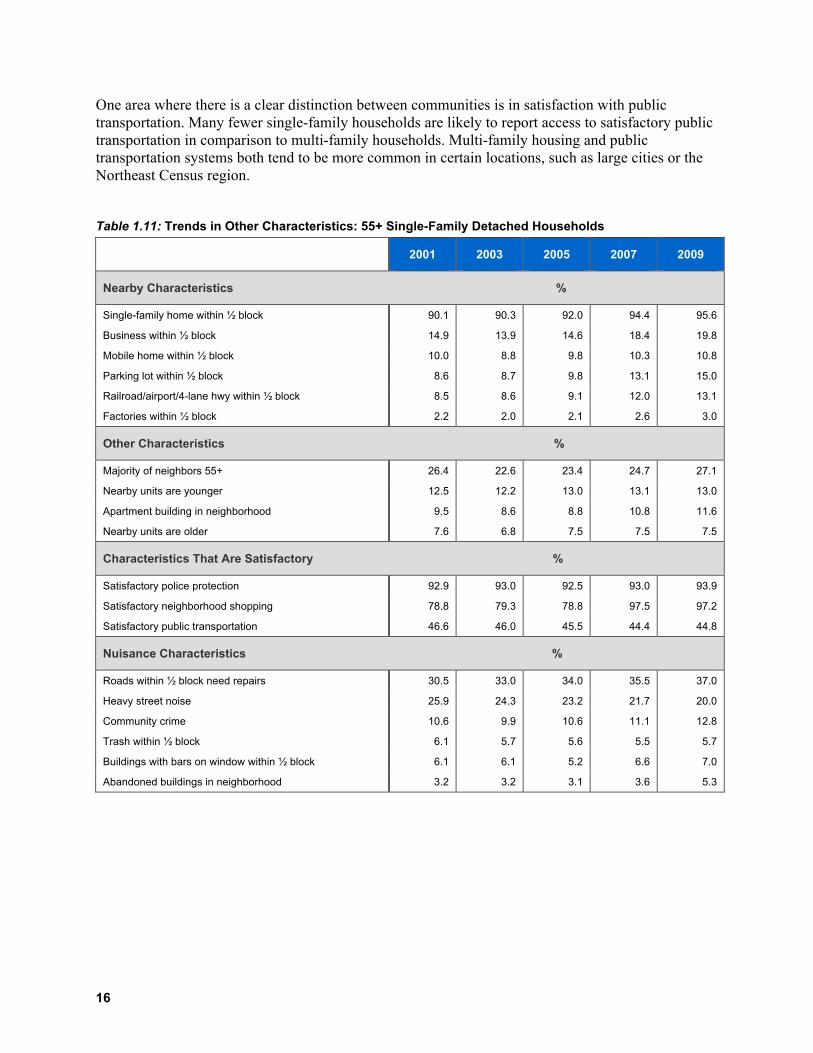
One area where there is a clear distinction between communities is in satisfaction with public transportation. Many fewer single-family households are likely to report access to satisfactory public transportation in comparison to multi-family households. Multi-family housing and public transportation systems both tend to be more common in certain locations, such as large cities or the Northeast Census region. Table 1.11: Trends in Other Characteristics: 55+ Single-Family Detached Households
2001 2003 2005 2007 2009
Nearby Characteristics %
Single-family home within ½ block 90.1 90.3 92.0 94.4 95.6
Business within ½ block 14.9 13.9 14.6 18.4 19.8
Mobile home within ½ block 10.0 8.8 9.8 10.3 10.8
Parking lot within ½ block 8.6 8.7 9.8 13.1 15.0
Railroad/airport/4-lane hwy within ½ block 8.5 8.6 9.1 12.0 13.1
Factories within ½ block 2.2 2.0 2.1 2.6 3.0
Other Characteristics %
Majority of neighbors 55+ 26.4 22.6 23.4 24.7 27.1
Nearby units are younger 12.5 12.2 13.0 13.1 13.0
Apartment building in neighborhood 9.5 8.6 8.8 10.8 11.6
Nearby units are older 7.6 6.8 7.5 7.5 7.5
Characteristics That Are Satisfactory %
Satisfactory police protection 92.9 93.0 92.5 93.0 93.9
Satisfactory neighborhood shopping 78.8 79.3 78.8 97.5 97.2
Satisfactory public transportation 46.6 46.0 45.5 44.4 44.8
Nuisance Characteristics %
Roads within ½ block need repairs 30.5 33.0 34.0 35.5 37.0
Heavy street noise 25.9 24.3 23.2 21.7 20.0
Community crime 10.6 9.9 10.6 11.1 12.8
Trash within ½ block 6.1 5.7 5.6 5.5 5.7
Buildings with bars on window within ½ block 6.1 6.1 5.2 6.6 7.0
Abandoned buildings in neighborhood 3.2 3.2 3.1 3.6 5.3

HOUSING TRENDS UPDATE FOR THE 55+ MARKET: NEW INSIGHTS FROM THE AMERICAN HOUSING SURVEY 17
Table 1.12: Trends in Other Characteristics: 55+ Multi-Family Households
2001 2003 2005 2007 2009
Nearby Characteristics %
Parking lot within ½ block 47.4 49.0 48.1 59.9 63.3
Business within ½ block 44.3 42.5 44.1 52.8 55.7
Railroad/airport/4-lane hwy within ½ block 17.4 18.0 17.9 24.3 25.9
Factories within ½ block 4.6 5.0 4.2 6.5 7.0
Mobile home within ½ block 2.5 1.9 2.5 2.8 3.0
Other Characteristics %
Apartment building in neighborhood 61.2 60.1 61.5 69.6 71.2
Majority of neighbors 55+ 27.9 23.6 24.8 22.6 23.8
Nearby units are older 11.3 10.0 11.1 10.4 10.4
Nearby units are younger 10.4 10.1 10.0 11.2 10.4
Characteristics That Are Satisfactory %
Satisfactory police protection 95.4 94.8 94.8 94.8 95.1
Satisfactory neighborhood shopping 90.2 90.0 90.3 98.0 97.6
Satisfactory public transportation 79.0 80.4 78.2 78.8 79.1
Nuisance Characteristics %
Heavy street noise 33.4 33.1 30.0 27.4 25.9
Roads within ½ block need repairs 32.3 33.3 33.6 37.4 39.3
Noise through wall/ceiling 19.1 19.8 19.7 21.0 22.3
Community crime 18.2 18.3 16.1 16.3 17.8
Buildings with bars on window within ½ block 12.7 11.7 11.5 18.1 19.1
Trash within ½ block 8.8 9.3 8.1 8.5 8.5
Abandoned buildings in neighborhood 5.1 4.5 3.9 4.5 5.6
18
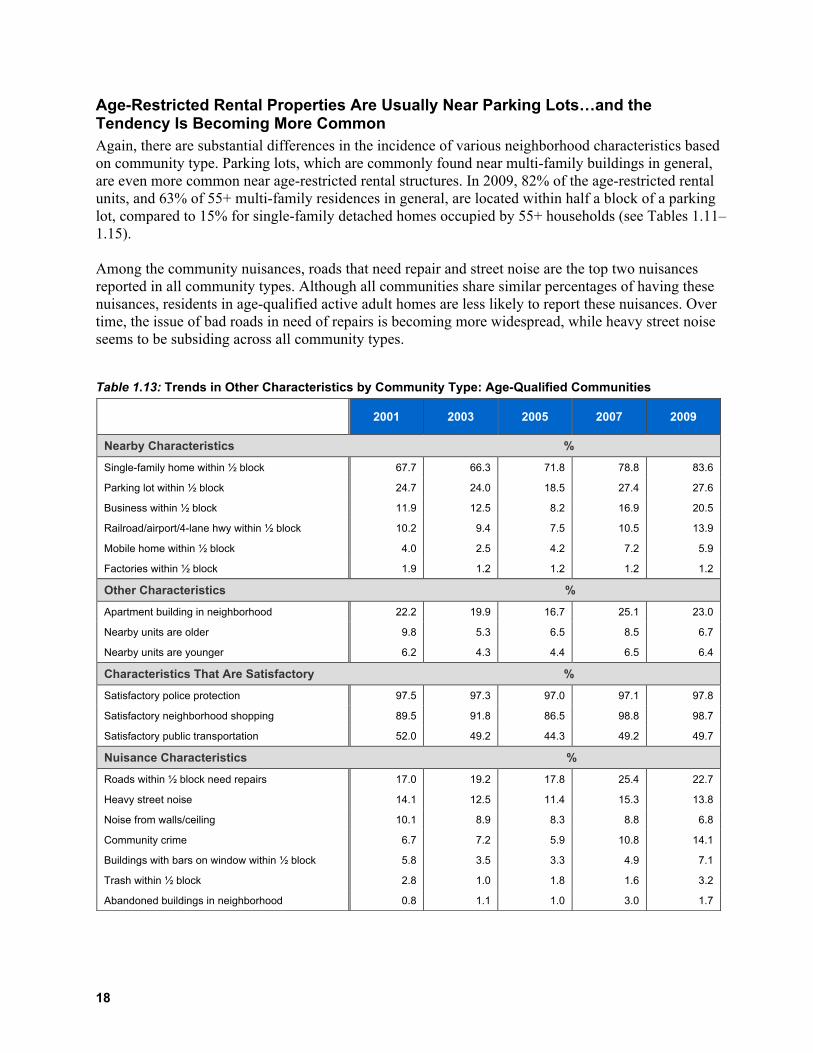
Age-Restricted Rental Properties Are Usually Near Parking Lots…and the Tendency Is Becoming More Common Again, there are substantial differences in the incidence of various neighborhood characteristics based on community type. Parking lots, which are commonly found near multi-family buildings in general, are even more common near age-restricted rental structures. In 2009, 82% of the age-restricted rental units, and 63% of 55+ multi-family residences in general, are located within half a block of a parking lot, compared to 15% for single-family detached homes occupied by 55+ households (see Tables 1.11–1.15). Among the community nuisances, roads that need repair and street noise are the top two nuisances reported in all community types. Although all communities share similar percentages of having these nuisances, residents in age-qualified active adult homes are less likely to report these nuisances. Over time, the issue of bad roads in need of repairs is becoming more widespread, while heavy street noise seems to be subsiding across all community types. Table 1.13: Trends in Other Characteristics by Community Type: Age-Qualified Communities
2001 2003 2005 2007 2009
Nearby Characteristics %
Single-family home within ½ block 67.7 66.3 71.8 78.8 83.6
Parking lot within ½ block 24.7 24.0 18.5 27.4 27.6
Business within ½ block 11.9 12.5 8.2 16.9 20.5
Railroad/airport/4-lane hwy within ½ block 10.2 9.4 7.5 10.5 13.9
Mobile home within ½ block 4.0 2.5 4.2 7.2 5.9
Factories within ½ block 1.9 1.2 1.2 1.2 1.2
Other Characteristics %
Apartment building in neighborhood 22.2 19.9 16.7 25.1 23.0
Nearby units are older 9.8 5.3 6.5 8.5 6.7
Nearby units are younger 6.2 4.3 4.4 6.5 6.4
Characteristics That Are Satisfactory %
Satisfactory police protection 97.5 97.3 97.0 97.1 97.8
Satisfactory neighborhood shopping 89.5 91.8 86.5 98.8 98.7
Satisfactory public transportation 52.0 49.2 44.3 49.2 49.7
Nuisance Characteristics %
Roads within ½ block need repairs 17.0 19.2 17.8 25.4 22.7
Heavy street noise 14.1 12.5 11.4 15.3 13.8
Noise from walls/ceiling 10.1 8.9 8.3 8.8 6.8
Community crime 6.7 7.2 5.9 10.8 14.1
Buildings with bars on window within ½ block 5.8 3.5 3.3 4.9 7.1
Trash within ½ block 2.8 1.0 1.8 1.6 3.2
Abandoned buildings in neighborhood 0.8 1.1 1.0 3.0 1.7

HOUSING TRENDS UPDATE FOR THE 55+ MARKET: NEW INSIGHTS FROM THE AMERICAN HOUSING SURVEY 19
Table 1.14: Trends in Other Characteristics by Community Type: 55+ Owner-Occupied Communities
2001 2003 2005 2007 2009
Nearby Characteristics %
Single-family home within ½ block 84.7 87.1 88.5 91.9 93.4
Business within ½ block 17.4 15.9 18.6 20.7 23.8
Parking lot within ½ block 13.2 13.0 14.0 17.2 19.0
Mobile home within ½ block 9.8 8.5 9.5 11.1 12.0
Railroad/airport/4-lane hwy within ½ block 8.9 10.1 9.7 12.6 14.4
Factories within ½ block 2.1 2.1 2.5 2.8 3.2
Other Characteristics %
Apartment building in neighborhood 14.0 13.4 13.4 13.9 15.9
Nearby units are younger 11.3 11.2 10.8 11.4 12.1
Nearby units are older 9.5 7.8 8.2 9.0 9.7
Characteristics That Are Satisfactory %
Satisfactory police protection 93.4 93.5 92.2 92.1 93.3
Satisfactory neighborhood shopping 78.3 80.4 78.1 97.1 97.0
Satisfactory public transportation 48.5 48.2 47.9 45.0 44.3
Nuisance Characteristics %
Roads within ½ block need repairs 28.0 31.0 32.1 34.5 36.2
Heavy street noise 27.1 25.2 25.8 23.3 21.8
Noise from walls/ceiling 14.3 12.8 11.9 14.0 15.8
Community crime 10.3 11.5 11.8 10.8 12.9
Buildings with bars on window within ½ block 7.3 7.5 6.6 7.8 7.7
Trash within ½ block 6.0 4.6 5.2 5.8 5.9
Abandoned buildings in neighborhood 3.4 3.7 4.1 3.7 5.4

20
Table 1.15: Trends in Other Characteristics by Type of Community: Age-Restricted Rental Communities
2001 2003 2005 2007 2009
Nearby Characteristics %
Parking lot within ½ block 69.2 71.7 70.6 81.3 81.6
Single-family home within ½ block 62.2 56.6 58.2 68.7 71.4
Business within ½ block 53.3 45.1 50.2 60.5 64.1
Railroad/airport/4-lane hwy within ½ block 21.0 17.9 20.6 30.4 31.7
Factories within ½ block 4.3 4.0 4.2 7.3 6.5
Mobile home within ½ block 3.7 1.7 2.3 3.5 3.7
Other Characteristics %
Apartment building in neighborhood 64.7 59.8 62.9 73.7 77.1
Nearby units are older 24.5 23.9 23.5 23.5 20.2
Nearby units are younger 9.6 9.7 8.5 12.4 10.9
Characteristics That Are Satisfactory %
Satisfactory police protection 96.0 96.0 96.1 96.7 96.5
Satisfactory neighborhood shopping 87.5 88.2 89.5 99.2 98.1
Satisfactory public transportation 81.9 79.7 77.6 80.5 81.5
Nuisance Characteristics %
Roads within ½ block need repairs 29.8 27.2 31.7 34.2 37.0
Heavy street noise 29.8 25.3 23.4 19.0 22.0
Community crime 14.0 13.4 11.7 11.3 14.9
Noise from walls/ceilings 11.5 13.1 13.4 14.9 17.3
Buildings with bars on window within ½ block 9.1 6.1 5.9 11.9 14.6
Trash within ½ block 6.5 5.0 5.0 7.2 5.5
Abandoned buildings in neighborhood 3.6 2.9 2.8 3.7 4.1

HOUSING TRENDS UPDATE FOR THE 55+ MARKET: NEW INSIGHTS FROM THE AMERICAN HOUSING SURVEY 21
Overall Rating of Current Community and Homes Higher Ratings for Older Households Respondents were asked in the AHS to rate their current communities and homes on a scale of 1 to 10—with 10 being the best, 1 the worst. Although overall community and home ratings are high in general, the older the household, the higher they are (see Table 1.16). Comparing satisfaction by structure type, the average rating is higher for 55+ households in single-family detached homes than for those in multi-family housing units, 8.7 compared to 8.3 (see Table 1.16(a–d) in the Appendix for complete breakdown of ratings on the 1–10 scale). The high average ratings across Table 1.16 are consistent with the low incidences of community nuisances reported by older households and suggest that developers of age-qualified housing for older residents have a substantial hurdle to overcome in attracting these residents away from their current homes and neighborhoods, with which they are generally quite satisfied. Table 1.16: Overall Rating of Current Community & Home in 2009
Age of Household Head
Under 55 55 or Older
Under 45 45 to 54 55 to 64 65 to 74 75+ Total 55+
Average Community Rating
Single-Family Detached 8.0 8.2 8.3 8.5 8.6 8.4
Multi-Family 7.5 7.6 7.8 8.2 8.7 8.2
Average Home Rating
Single-Family Detached 8.2 8.4 8.5 8.7 8.8 8.7
Multi-Family 7.6 7.8 7.9 8.4 8.7 8.3
(On a Scale of 1 to 10; 1=worst, 10=best)

22
On a Scale of 1 to 10, Age-Qualified Active Adult Homes Rate a 9 Tables 1.17 and 1.18 show ratings by community type and emphasizes the threshold most age-qualified active adult developments must achieve to attract residents. As high as the ratings are among 55+ households in general, they are even higher in these communities. Residents in age-qualified active adult communities on average rate the community an 8.9 and the house a 9.0. Table 1.17: Overall Rating of Current Community by Community Type in 2009
Age-Qualified Active Adult
Other 55+ Owner- Occupied
Communities Age-Restricted
Rental
%
1 0.2 0.5 0.4
2 0.3 0.2 0.2
3 0.2 0.3 1.2
4 0.5 0.4 0.3
5 1.3 3.2 4.0
6 2.2 3.3 3.8
7 5.4 10.4 9.4
8 25.6 25.1 21.1
9 18.5 19.1 15.0
10 45.9 37.6 44.5
Average 8.9 8.6 8.6
(On a scale of 1 to 10; 1=worst, 10=best)
Table 1.18: Overall Rating of Current Home by Community Type in 2009
Age-Qualified Active Adult
Other 55+ Owner- Occupied
Communities Age-Restricted
Rental
%
1 0.0 0.3 0.0
2 0.0 0.1 0.0
3 0.0 0.1 0.5
4 0.2 0.6 0.3
5 1.9 2.2 2.9
6 2.3 2.1 3.8
7 5.1 8.3 9.2
8 24.0 25.2 21.2
9 20.2 18.1 17.3
10 46.4 43.0 44.7
Average 9.0 8.8 8.8
(On a scale of 1 to 10; 1=worst, 10=best)

HOUSING TRENDS UPDATE FOR THE 55+ MARKET: NEW INSIGHTS FROM THE AMERICAN HOUSING SURVEY 23
Table 1.19 shows average ratings of communities and homes from 2001 through 2009. The average ratings for various types of housing are generally stable over this period. Table 1.19: Trends in Average Ratings of Communities and Homes
2001 2003 2005 2007 2009
Average Rating of Current Community
55+ Single-Family Detached 8.4 8.4 8.5 8.5 8.4
55+ Multi-Family 8.1 8.1 8.2 8.2 8.2
Age-Qualified Active Adult 8.8 9.0 8.9 8.8 8.9
Other 55+ Owner-Occupied Communities 8.5 8.6 8.6 8.6 8.6
Age-Restricted Rental 8.3 8.5 8.7 8.7 8.6
Average Rating of Current Home
55+ Single-Family Detached 8.6 8.6 8.7 8.7 8.7
55+ Multi-Family 8.3 8.3 8.4 8.3 8.3
Age-Qualified Active Adult 8.9 9.0 8.9 8.9 9.0
Other 55+ Owner-Occupied Communities 8.7 8.7 8.7 8.8 8.8
Age-Restricted Rental 8.6 8.8 8.8 8.7 8.8
(Scale of 1 to 10; 1=worst, 10=best)

24
Chapter 2
55+ Recent Movers This chapter studies the current 55+ housing market by looking at the 55+ households who moved recently. Moving is one of the most common ways to adjust housing consumption, and the reasons for moving can reflect the actual need for housing. In addition to examining reasons for moving and mobility trends, this chapter provides detail on demographics, income, and other characteristics of 55+ movers. It presents information on household size, education and race of the household head, household income, etc. The information provided in this chapter creates a better understanding of the demand side of the current 55+ housing market. To get a sample large enough to make detailed comparisons, the AHS sample included households who moved within the past two years. Reasons for Moving Family Reasons Are Important The AHS asks respondents who moved recently the reasons they moved. Multiple reasons are permitted, so the percentages may not total 100. The reasons for moving are tabulated for households who moved into single-family detached homes and into multi-family units separately (see Table 2.1 and Table 2.2). In both cases, family-/personal-related reasons are cited most frequently by 55+ households. Such family reasons may include the desire to live close to another family member or other relatives. Generally speaking, the older the household head, the more likely the household is to move because of family-related reasons. Higher Quality Units and Less Expense Are Attracting 55+ Households For the recent 55+ movers into single-family detached homes, another important reason for moving is better quality housing units. This is true for the under-55 households even more so. Many 55+ households moving into multi-family homes also are looking for higher quality units, but less expensive housing is even more important for many of them. Less expensive housing includes cases where respondents are moving because they want less expensive homes to maintain as well as cases where they are looking for lower rents.

HOUSING TRENDS UPDATE FOR THE 55+ MARKET: NEW INSIGHTS FROM THE AMERICAN HOUSING SURVEY 25
Older Households Are Less Interested in Moving into a Larger Place
Young households under age 45 moving into single-family detached housing indicate wanting a larger place more frequently than any other reason, more than 18%. For the older households, there are fewer and fewer who are still considering moving because they need a larger place (see Table 2.1).
Table 2.1: Reasons Households Chose to Move in 2009: Single-Family Detached Households
Age of Household Head
Under 55 55 or Older
Under 45
45 to 54 55 to 64 65 to 74 75+ Total 55+
%
Family-/personal-related 7.0 10.5 15.7 21.5 38.6 19.7
Want a better quality house/apartment 11.5 13.1 10.5 9.5 6.0 9.7
Want a larger place 18.1 10.4 10.0 7.5 0.0 8.3
Change in marital status 6.3 8.1 5.0 1.8 10.6 4.8
Establish own household 14.8 9.4 4.3 2.8 1.7 3.7
Change jobs 10.4 11.0 10.6 4.6 3.0 8.3
Want less expensive housing 3.7 4.4 6.3 6.0 4.3 6.0
Change owner/renter status 10.5 7.8 7.8 4.4 0.0 6.1
Closer to work/school 9.1 6.4 3.2 2.8 3.8 3.2
Financial-/employment-related 3.5 5.5 3.8 5.8 1.2 4.0
Private company/person wanted it 1.6 2.3 2.0 1.7 4.2 2.2
Disaster loss in previous unit 0.5 0.6 0.8 3.5 0.0 1.4
Forced by government 0.8 0.2 0.7 0.6 0.0 0.6
Other reasons 15.8 19.9 26.3 32.7 32.3 28.5
26
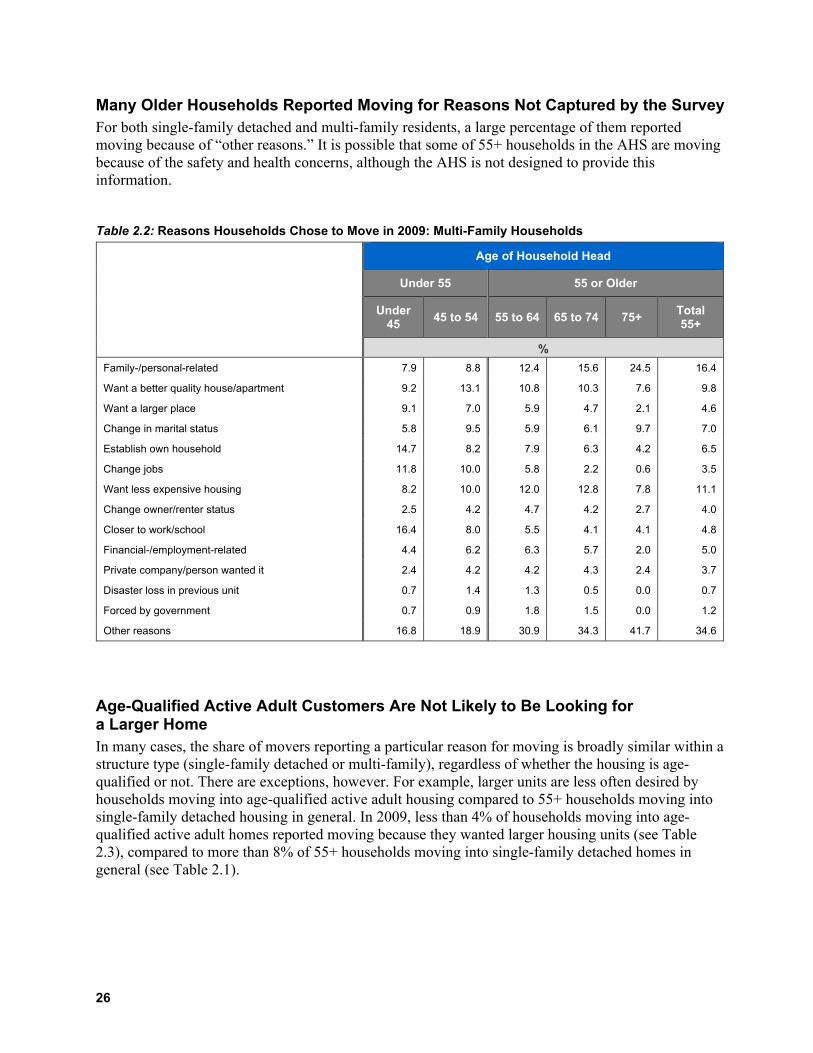
Many Older Households Reported Moving for Reasons Not Captured by the Survey For both single-family detached and multi-family residents, a large percentage of them reported moving because of “other reasons.” It is possible that some of 55+ households in the AHS are moving because of the safety and health concerns, although the AHS is not designed to provide this information. Table 2.2: Reasons Households Chose to Move in 2009: Multi-Family Households
Age of Household Head
Under 55 55 or Older
Under 45 45 to 54 55 to 64 65 to 74 75+ Total
55+
% Family-/personal-related 7.9 8.8 12.4 15.6 24.5 16.4
Want a better quality house/apartment 9.2 13.1 10.8 10.3 7.6 9.8
Want a larger place 9.1 7.0 5.9 4.7 2.1 4.6
Change in marital status 5.8 9.5 5.9 6.1 9.7 7.0
Establish own household 14.7 8.2 7.9 6.3 4.2 6.5
Change jobs 11.8 10.0 5.8 2.2 0.6 3.5
Want less expensive housing 8.2 10.0 12.0 12.8 7.8 11.1
Change owner/renter status 2.5 4.2 4.7 4.2 2.7 4.0
Closer to work/school 16.4 8.0 5.5 4.1 4.1 4.8
Financial-/employment-related 4.4 6.2 6.3 5.7 2.0 5.0
Private company/person wanted it 2.4 4.2 4.2 4.3 2.4 3.7
Disaster loss in previous unit 0.7 1.4 1.3 0.5 0.0 0.7
Forced by government 0.7 0.9 1.8 1.5 0.0 1.2
Other reasons 16.8 18.9 30.9 34.3 41.7 34.6
Age-Qualified Active Adult Customers Are Not Likely to Be Looking for a Larger Home In many cases, the share of movers reporting a particular reason for moving is broadly similar within a structure type (single-family detached or multi-family), regardless of whether the housing is age-qualified or not. There are exceptions, however. For example, larger units are less often desired by households moving into age-qualified active adult housing compared to 55+ households moving into single-family detached housing in general. In 2009, less than 4% of households moving into age-qualified active adult homes reported moving because they wanted larger housing units (see Table 2.3), compared to more than 8% of 55+ households moving into single-family detached homes in general (see Table 2.1).

HOUSING TRENDS UPDATE FOR THE 55+ MARKET: NEW INSIGHTS FROM THE AMERICAN HOUSING SURVEY 27
Many Households Moving into Age-Restricted Rental Homes Are Looking for Less Expensive Housing Table 2.3 shows that movers into age-restricted rentals search for less expensive housing more often than movers into age-qualified or other 55+ communities. They are also more likely to move because of family- and personal-related reasons. Table 2.3: Reasons Households Chose to Move in 2009 by Community Type
Age-Qualified Active Adult
Other 55+ Owner-
Occupied Communities
Age-Restricted
Rental
% Family-/personal-related 21.2 19.4 28.4
Want a better quality house/apartment 8.3 13.6 10.3
Want a larger place 3.7 6.3 1.9
Change in marital status 8.1 7.4 6.7
Establish own household 2.1 3.3 5.6
Change jobs 5.1 3.8 0.0
Want less expensive housing 5.5 4.9 12.6
Change owner/renter status 2.3 8.6 2.1
Closer to work/school 3.8 2.3 3.8
Financial-/employment-related 3.5 3.5 5.7
Private company/person wanted it 0.0 0.0 3.3
Disaster loss in previous unit 0.0 2.0 0.3
Forced by government 0.0 0.0 0.0
Other reasons 51.4 33.5 38.7
Trends in Reasons for Moving When the Economy Is Bad, 55+ Households Are Less Interested in a Large Single-Family Home…Those Moving into Multi-Family Units Are More Concerned about Finding a Less Expensive Home Tables 2.4 and 2.5 show trends in major reasons for moving. In some cases, there is at least some relationship between economic conditions and the reasons people move. In the recession years of 2001 and 2009, for example, fewer than usual 55+ households moved because they wanted larger housing units and more of them moved because they wanted a less expensive place to live. When the economy improved in 2003, relatively more 55+ households started to look for larger housing units and the budget became less of a concern. Better-quality housing and family reasons consistently remain two top reasons for moving of single-family households. For multi-family households, however, concerns about less-expensive housing often take over better-quality housing issues, especially in the recession years.

28
As shown in Table 2.5, those moving into age-qualified active adult communities have been looking for a larger place less and less frequently; meanwhile, family-/personal-related and change of jobs reasons have been on the rise. Table 2.4: Trends in Reasons Households Choose to Move by Structure Type
2001 2003 2005 2007 2009
Sing
le-F
amily
D
etac
hed
Mul
ti-Fa
mily
Sing
le-F
amily
D
etac
hed
Mul
ti-Fa
mily
Sing
le-F
amily
D
etac
hed
Mul
ti-Fa
mily
Sing
le-F
amily
D
etac
hed
Mul
ti-Fa
mily
Sing
le-F
amily
D
etac
hed
Mul
ti-Fa
mily
%
Family-/personal-related 20.7 15.8 18.3 19.8 21.8 19.3 16.9 14.7 19.7 16.4
Want a better quality house/apartment 14.0 10.8 12.5 10.1 13.3 9.7 12.8 9.7 9.7 9.8
Want a larger place 7.9 5.9 9.9 5.7 8.8 6.1 8.3 5.4 8.3 4.6
Change in marital status 7.0 9.1 6.4 8.5 7.1 7.1 4.2 9.0 4.8 7.0
Change owner/renter status 6.9 6.2 4.9 5.1 4.1 4.1 4.6 3.4 6.1 4.0
Closer to work/school 6.3 5.9 4.8 4.8 4.0 4.5 4.8 6.0 3.2 4.8
Establish own household 5.7 6.6 5.1 5.5 6.6 6.0 4.5 5.3 3.7 6.5
Change jobs 5.2 4.7 4.0 3.7 5.4 4.3 5.6 3.7 8.3 3.5
Want less expensive housing 5.1 13.4 4.2 9.2 4.5 10.5 4.3 9.5 6.0 11.1
Financial-/ employment-related 3.3 5.8 2.7 4.9 3.1 6.4 3.5 5.9 4.0 5.0
Private company/ person wanted it 1.5 4.2 3.0 2.7 2.2 2.8 2.8 3.3 2.2 3.7
Forced by government 1.0 1.7 0.4 1.1 0.6 0.5 0.5 0.1 0.6 1.2
Disaster loss in previous unit 0.4 1.5 1.0 0.3 0.6 0.8 1.4 2.0 1.4 0.7
Other reasons 35.4 34.8 31.6 31.6 33.0 34.8 28.5 31.9 28.5 34.6

HOUSING TRENDS UPDATE FOR THE 55+ MARKET: NEW INSIGHTS FROM THE AMERICAN HOUSING SURVEY 29
Table 2.5: Trends in Reasons Households Choose to Move by Community Type
2001 2003 2005 2007 2009
Age
-Qua
lifie
d
Oth
er 5
5+
Ow
ner
Age
-Res
tric
ted
Ren
tal
Age
-Qua
lifie
d
Oth
er 5
5+
Ow
ner
Age
-Res
tric
ted
Ren
tal
Age
-Qua
lifie
d
Oth
er 5
5+
Ow
ner
Age
-Res
tric
ted
Ren
tal
Age
-Qua
lifie
d
Oth
er 5
5+
Ow
ner
Age
-Res
tric
ted
Ren
tal
Age
-Qua
lifie
d
Oth
er 5
5+
Ow
ner
Age
-Res
tric
ted
Ren
tal
% Family-/personal-related 13.5 15.4 22.6 18.9 15.9 29.3 17.8 22.5 24.9 18.6 20.7 22.3 21.2 19.4 28.4
Want a better quality house/apartment 10.1 13.8 11.0 9.6 10.1 14.6 17.6 10.1 12.8 8.4 8.1 13.3 8.3 13.6 10.3
Want less expensive housing 9.3 5.8 18.2 5.5 6.5 13.5 4.7 7.4 16.2 7.5 5.5 13.1 5.5 4.9 12.6
Change in marital status 8.0 7.4 10.3 5.2 10.9 7.8 7.9 5.8 6.2 9.6 5.7 7.8 8.1 7.4 6.7
Want a larger place 5.9 8.0 4.0 4.9 9.9 3.1 1.3 10.1 3.4 0.0 8.5 3.7 3.7 6.3 1.9
Financial-/ employment-related 5.4 3.7 6.4 3.3 3.2 4.0 3.1 2.2 9.6 10.2 3.1 6.0 3.5 3.5 5.7
Change owner/ renter status 5.4 6.1 7.8 3.8 2.1 7.8 0.0 6.2 2.3 2.3 5.6 3.8 2.3 8.6 2.1
Establish own household 3.1 6.8 4.2 4.1 2.4 5.7 5.1 3.6 4.6 2.7 4.2 4.7 2.1 3.3 5.6
Closer to work/school 2.2 8.2 1.7 4.2 4.8 2.2 1.7 4.5 1.8 2.8 3.7 4.6 3.8 2.3 3.8
Change jobs 0.0 4.0 2.4 2.4 1.8 0.0 0.0 4.6 1.7 4.0 5.7 1.9 5.1 3.8 0.0
Private company/ person wanted it 0.0 0.7 4.6 2.2 0.8 0.7 0.0 0.9 3.4 0.0 2.0 3.0 0.0 0.0 3.3
Disaster loss in previous unit 0.0 0.0 1.5 0.0 0.0 0.0 0.0 0.0 1.0 0.0 0.5 1.8 0.0 2.0 0.3
Forced by government 0.0 1.0 1.4 0.0 0.0 1.9 0.0 0.4 0.0 0.0 0.0 0.6 0.0 0.0 0.0
Other reasons 56.4 40.8 46.0 47.1 44.0 33.8 56.6 39.3 38.6 53.0 38.0 34.0 51.4 33.5 38.7
30
Reasons for Choosing a Community
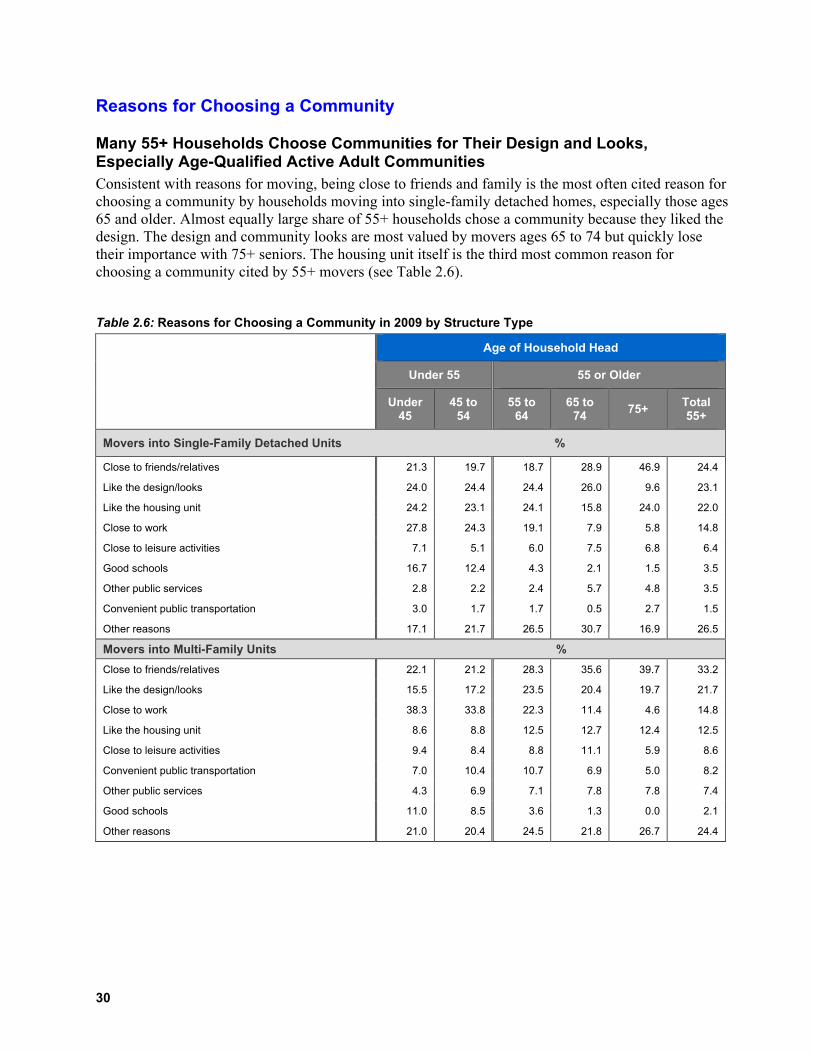
Many 55+ Households Choose Communities for Their Design and Looks, Especially Age-Qualified Active Adult Communities Consistent with reasons for moving, being close to friends and family is the most often cited reason for choosing a community by households moving into single-family detached homes, especially those ages 65 and older. Almost equally large share of 55+ households chose a community because they liked the design. The design and community looks are most valued by movers ages 65 to 74 but quickly lose their importance with 75+ seniors. The housing unit itself is the third most common reason for choosing a community cited by 55+ movers (see Table 2.6). Table 2.6: Reasons for Choosing a Community in 2009 by Structure Type
Age of Household Head
Under 55 55 or Older
Under 45
45 to 54
55 to 64
65 to 74 75+ Total
55+
Movers into Single-Family Detached Units %
Close to friends/relatives 21.3 19.7 18.7 28.9 46.9 24.4
Like the design/looks 24.0 24.4 24.4 26.0 9.6 23.1
Like the housing unit 24.2 23.1 24.1 15.8 24.0 22.0
Close to work 27.8 24.3 19.1 7.9 5.8 14.8
Close to leisure activities 7.1 5.1 6.0 7.5 6.8 6.4
Good schools 16.7 12.4 4.3 2.1 1.5 3.5
Other public services 2.8 2.2 2.4 5.7 4.8 3.5
Convenient public transportation 3.0 1.7 1.7 0.5 2.7 1.5
Other reasons 17.1 21.7 26.5 30.7 16.9 26.5
Movers into Multi-Family Units % Close to friends/relatives 22.1 21.2 28.3 35.6 39.7 33.2
Like the design/looks 15.5 17.2 23.5 20.4 19.7 21.7
Close to work 38.3 33.8 22.3 11.4 4.6 14.8
Like the housing unit 8.6 8.8 12.5 12.7 12.4 12.5
Close to leisure activities 9.4 8.4 8.8 11.1 5.9 8.6
Convenient public transportation 7.0 10.4 10.7 6.9 5.0 8.2
Other public services 4.3 6.9 7.1 7.8 7.8 7.4
Good schools 11.0 8.5 3.6 1.3 0.0 2.1
Other reasons 21.0 20.4 24.5 21.8 26.7 24.4

HOUSING TRENDS UPDATE FOR THE 55+ MARKET: NEW INSIGHTS FROM THE AMERICAN HOUSING SURVEY 31
The reasons 55+ households who moved into multi-family homes chose a community are broadly similar to the reasons motivating 55+ households moving into single-family homes, although movers into apartments are more likely to cite family reasons, and the decision is less influenced by the housing unit itself. In addition, multi-family movers cite a location near public transportation and other public services somewhat more often than single-family detached movers. The AHS does not provide detail on what other public services may include. No matter which home structures (single-family or multi-family) movers chose, a large portion of the households reported “other reasons” for choosing a community. Again, it is possible that many older customers may be looking for a safe community or a community with easy access to medical services, among other considerations. The reasons cited by respondents who moved into age-qualified active adult communities (see Table 2.7) are similar to those reported by 55+ movers into single-family detached housing. The differences are that age-qualified active adult customers put a much greater emphasis on the community design and looks, and are more likely to seek leisure activities. The share who was attracted by leisure activities is close to 11% among those moving into age-qualified active adult housing, while only 6% of the 55+ households living in single-family detached homes reported moving because of closeness to leisure activities. Compared to the residents in other communities, fewer of those moving into age-restricted rental units are motivated by the community design and the housing units themselves. Instead, other public services and convenient public transportation become important factors for attracting independent living residents. For example, more than 9% of the households in age-restricted rental communities reported choosing a community because of the public services and about 8% because of the convenient public transportation, these shares are 3% and 2% respectively among households in other 55+ owner-occupied communities (see Table 2.7). Table 2.7: Reasons for Choosing a Community in 2009: Movers into 55+ Communities
Age-Qualified Active Adult
Other 55+ Owner-
Occupied Communities
Age-Restricted Rental
%
Like the design/looks 33.5 31.9 19.6
Close to friends/relatives 23.4 21.5 37.4
Like the housing unit 22.3 28.8 15.6
Close to work 11.8 10.7 3.1
Close to leisure activities 10.6 11.6 9.2
Convenient public transportation 6.1 2.1 8.2
Other public services 3.2 2.7 9.4
Good schools 0.4 2.7 0.3
Other reasons 27.8 25.5 29.5

32
Being Close to Work Is Becoming Increasingly Important for Age-Qualified Active Adult Customers While shares of households reporting various reasons for choosing an age-qualified active adult community stayed stable over time, being close to work is now cited more frequently. As shown in Table 2.8, these communities now attract higher shares of younger adults who are still working and thus more concerned about a convenient commute to work. Table 2.8: Trends in Reasons for Choosing a Community: Movers into Age-Qualified Active Adult Communities
2001 2003 2005 2007 2009
% Like the design/looks 47.6 35.3 44.1 53.6 33.5
Like the housing unit 35.2 27.1 22.2 27.7 22.3
Close to leisure activities 23.1 24.5 21.9 24.1 10.6
Close to friends/relatives 19.7 23.0 28.3 39.9 23.4
Other public services 4.8 4.5 3.2 7.2 3.2
Close to work 2.0 3.2 6.4 8.8 11.8
Good schools 0.0 0.0 0.0 0.0 0.4
Convenient public transportation 0.0 0.0 2.3 2.4 6.1
Other reasons 22.4 28.6 24.4 20.1 27.8
Table 2.9: Trends in Reasons for Choosing a Community: Movers into Other 55+ Owner-Occupied Communities
2001 2003 2005 2007 2009
%
Like the design/looks 37.8 35.3 43.9 33.6 31.9
Like the housing unit 37.4 28.5 32.8 27.3 28.8
Close to friends/relatives 24.7 27.3 22.7 30.5 21.5
Close to leisure activities 16.0 14.3 13.7 19.5 11.6
Close to work 8.5 10.1 14.4 16.2 10.7
Other public services 6.4 2.6 3.8 5.3 2.7
Convenient public transportation 3.5 1.7 3.1 2.9 2.1
Good schools 2.5 1.5 4.2 3.1 2.7
Other reasons 17.2 17.9 15.2 19.9 25.5

HOUSING TRENDS UPDATE FOR THE 55+ MARKET: NEW INSIGHTS FROM THE AMERICAN HOUSING SURVEY 33
Table 2.10: Trends in Reasons for Choosing a Community: Movers into Age-Restricted Rental Communities
2001 2003 2005 2007 2009
%
Close to friends/relatives 34.2 36.9 36.2 38.4 37.4
Like the design/looks 22.9 23.8 21.2 21.4 19.6
Other public services 20.9 6.7 8.1 9.2 9.4
Like the housing unit 15.6 12.0 14.1 14.6 15.6
Close to leisure activities 10.5 10.1 6.4 12.9 9.2
Convenient public transportation 9.5 5.3 6.8 6.9 8.2
Close to work 4.6 1.5 3.1 6.1 3.1
Good schools 0.7 0.3 0.0 0.2 0.3
Other reasons 31.2 25.8 27.6 23.7 29.5
Table 2.11: Trends in Reasons for Choosing a Community
2001 2003 2005 2007 2009
Sing
le- F
amily
D
etac
hed
Mul
ti-Fa
mily
Sing
le- F
amily
D
etac
hed
Mul
ti-Fa
mily
Sing
le- F
amily
D
etac
hed
Mul
ti-Fa
mily
Sing
le- F
amily
D
etac
hed
Mul
ti-Fa
mily
Sing
le- F
amily
D
etac
hed
Mul
ti-Fa
mily
% Like the design/looks 32.0 25.5 27.1 22.5 30.3 26.3 31.8 21.3 23.1 21.7
Like the housing unit 31.8 15.6 25.5 13.8 28.4 15.6 26.7 14.4 22.0 12.5
Close to friends/ relatives 25.8 28.1 19.9 30.0 20.3 27.1 24.7 34.2 24.4 33.2
Close to leisure activities 11.6 10.1 7.2 7.1 7.4 8.1 11.9 9.6 6.4 8.6
Close to work 11.4 14.8 10.2 11.8 12.1 13.2 16.6 18.2 14.8 14.8
Good schools 5.1 2.8 3.4 1.3 3.8 1.6 5.5 1.6 3.5 2.1
Other public services 4.5 10.9 2.5 3.9 3.2 7.2 5.2 7.9 3.5 7.4
Convenient public transportation 2.0 8.7 1.3 5.3 1.7 7.2 2.8 7.2 1.5 8.2
Other reasons 20.3 27.2 21.5 20.6 22.4 25.5 16.8 22.2 26.5 24.4

34
Age Distribution by Community Type Age-Restricted Rental Communities Attract Mostly Households Well Above the Age 55 Cut-Off Compared to age-qualified active adult or other 55+ owner-occupied, age-restricted rental communities attract relatively older households. As shown in Table 2.12, a significantly higher share (almost 23%) of the households who moved into age-restricted rental communities is 85 and older; the majority of these customers (more than 60%) are 75+. In contrast, in the age-qualified active adult housing market, the age distribution is concentrated in the younger age brackets with the majority in the 55 to 69 bracket. Other 55+ owner-occupied communities attract even younger customers. Sixty-four percent of customers in this market are under age 65 and only 4% are over age 80 (see Table 2.12). Table 2.12: Age of Households Moving into 55+ Communities: 2009
Age-Qualified Active Adult
Other 55+ Owner- Occupied
Communities Age-Restricted
Rental
% Under 55 2.1 10.7 0.6
55 to 59 16.1 26.4 5.4
60 to 64 7.6 26.4 13.7
65 to 69 29.6 16.5 14.3
70 to 74 9.5 5.9 10.5
75 to 79 16.3 10.0 17.0
80 to 84 8.3 0.6 15.8
85+ 10.4 3.7 22.8

HOUSING TRENDS UPDATE FOR THE 55+ MARKET: NEW INSIGHTS FROM THE AMERICAN HOUSING SURVEY 35
Age-Qualified Active Adult Communities Are Increasingly Attracting Households Under Age 60 Who Are Still Working
As Table 2.13 shows, the share of households in age-qualified active adult communities younger than 60 almost doubled from 2001 to 2007, even though declined slightly in 2009. At the same time other 55+ owner-occupied communities continue to attract even higher shares of younger households. Table 2.13: Trends in Age of Households Moving into Age-Qualified Active Adult and Other 55+ Owner-Occupied Communities
2001 2003 2005 2007 2009
Ag
e-Q
ua
lifi
ed
Oth
er
55
+ O
wn
er
Ag
e-Q
ua
lifi
ed
Oth
er
55
+ O
wn
er
Ag
e-Q
ua
lifi
ed
Oth
er
55
+ O
wn
er
Ag
e-Q
ua
lifi
ed
Oth
er
55
+ O
wn
er
Ag
e-Q
ua
lifi
ed
Oth
er
55
+ O
wn
er
%
Under 55 0.0 1.3 0.0 0.8 0.0 9.8 1.1 14.5 2.1 10.7
55 to 59 11.1 31.5 17.8 26.2 17.2 26.2 19.6 24.8 16.1 26.4
60 to 64 22.6 25.9 20.1 29.0 15.6 17.7 18.3 20.5 7.6 26.4
65 to 69 24.6 13.8 19.9 18.5 14.6 18.7 27.2 15.1 29.6 16.5
70 to 74 13.2 10.8 19.6 11.4 19.8 10.7 12.4 12.3 9.5 5.9
75 to 79 12.9 10.2 10.2 6.7 19.3 6.5 12.5 5.1 16.3 10.0
80 to 84 9.3 6.7 7.8 5.0 5.6 7.5 5.4 4.8 8.3 0.6
85+ 6.3 0.0 4.6 2.4 7.9 2.8 3.7 2.9 10.4 3.7

36
Current Market: Household Size and Type
55+ Single-Family Detached Customers Are Most Often Two-Person Households As shown in Table 2.14, the average household size decreases for older households in both the single-family detached and multi-family housing market. In the single-family detached market, it drops from 3.1 persons per household under age 45 to 1.8 persons per household age 75+. Table 2.14: Household Size in 2009: Movers into Single-Family Detached & Multi-Family Units
Age of Household Head
Under 55 55 or Older
Under 45 45 to 54 55 to 64 65 to 74 75+ Total 55+
Single-Family Detached % 1 person 13.7 19.5 23.6 26.5 41.4 26.3
2 persons 27.6 33.8 49.7 52.1 43.5 49.6
3 persons 20.9 18.0 12.7 14.2 12.5 13.0
4 or more 37.8 28.6 14.1 7.2 2.5 11.1
Average 3.1 2.8 2.3 2.1 1.8 2.2
Multi-Family % 1 person 34.1 50.0 58.6 68.5 82.6 67.5
2 persons 32.4 28.6 28.6 28.1 16.7 25.3
3 persons 17.3 12.4 6.2 2.5 0.7 3.8
4 or more 16.2 9.0 6.6 1.0 0.0 3.4
Average 2.2 1.9 1.7 1.4 1.2 1.5
55+ Multi-Family Customers Are Most Often One-Person Households Not surprisingly, the multi-family housing market has a smaller average household size and a higher share of one-person households. In the single-family detached housing market, only 26% of 55+ movers are one-person households; this number increases to almost 68% in the multi-family housing market. These households do not include people living in group quarters, such as nursing homes, and it is important to keep this in mind when interpreting the numbers, especially for the 75+ age bracket.
In Both Single-Family Detached and Multi-Family Housing Markets, the Average Size of 55+ Households Has Been Stable Over Time In recent history, there has not been much change in the size distribution of 55+ households. As shown in Table 2.15, the shares of 55+ households with one, two, and three or more persons in 2009 were almost identical to the shares recorded in 2001. The total number of households in these categories has grown over the past decade in proportion to the increase in the total number of 55+ households.

HOUSING TRENDS UPDATE FOR THE 55+ MARKET: NEW INSIGHTS FROM THE AMERICAN HOUSING SURVEY 37
Table 2.15: Trends in Household Size: 55+ Movers into Single-Family Detached & Multi-Family Units
2001 2003 2005 2007 2009
Sing
le-F
amily
D
etac
hed
Mul
ti-Fa
mily
Sing
le-F
amily
D
etac
hed
Mul
ti-Fa
mily
Sing
le-F
amily
D
etac
hed
Mul
ti-Fa
mily
Sing
le-F
amily
D
etac
hed
Mul
ti-Fa
mily
Sing
le-F
amily
D
etac
hed
Mul
ti-Fa
mily
% 1 person 26.1 60.5 26.2 62.8 26.5 63.2 27.4 64.2 26.3 67.5
2 persons 53.1 30.4 52.1 28.6 52.7 29.1 50.2 27.0 49.6 25.3
3 persons 9.7 5.0 11.1 5.7 12.5 4.8 12.4 4.8 13.0 3.8
4 or more 11.1 4.2 10.6 3.0 8.3 2.9 10.0 4.1 11.1 3.4
Average 2.2 1.6 2.2 1.5 2.1 1.5 2.1 1.5 2.2 1.5 The Majority of Age-Qualified Active Adult and Other 55+ Communities Are Two-Person Households Age-qualified active adult and other 55+ communities attract mostly two-person households, while age-restricted rental communities attract mostly singles (see Table 2.16). Specifically, 85% of all households moving into age-restricted rental residences in 2009 are one-person households, and very few have more than two persons. Comparing the percentages of one-person households in 55+ communities (age-qualified active adult, other 55+ owner-occupied and age-restricted rentals), 55+ single-family detached, and 55+ multi-family housing, we see that age-restricted rental homes have the highest share of one-person households. Table 2.16: Trends in Household Size by Community Type
2001 2003 2005 2007 2009 Movers into Age-Qualified Active Adult Communities % 1 person 43.0 51.8 47.3 29.3 42.8
2 persons 57.0 46.5 46.7 65.6 52.7
3 persons 0.0 1.7 6.0 1.7 4.5
4 or more 0.0 0.0 0.0 3.3 0.0
Average 1.6 1.5 1.6 1.8 1.6
Movers into Other 55+ Owner-Occupied Communities % 1 person 23.5 29.3 21.5 31.5 24.1
2 persons 63.8 56.7 61.1 54.1 55.3
3 persons 6.4 8.8 9.0 8.2 13.8
4 or more 6.3 5.2 8.6 6.2 6.9
Average 2.0 1.9 2.1 2.0 2.1
Movers into Age-Restricted Rental Communities % 1 person 71.5 85.9 85.9 84.1 84.7
2 persons 26.9 12.9 13.0 14.7 15.0
3 persons 1.6 1.2 1.1 0.4 0.3
4 or more 0.0 0.0 0.0 0.7 0.0
Average 1.3 1.2 1.2 1.2 1.2

38
In Single-Family Detached Homes, Married Couples without Children Account for Almost 50% of the 55+ Market We classify households into six mutually exclusive categories, as shown in Table 2.17. As discussed before, two-person households are common in the 55+ single-family detached housing market. By looking at the household types, we see that this market consists of mainly married couples without children. Table 2.17: Household Type in 2009
Age of Household Head
Under 55 55 or Older
Under 45
45 to 54
55 to 64
65 to 74 75+
Total 55+
Single-Family Detached % Married couple with children 37.2 23.7 8.2 2.1 0.0 5.8
Married couple without children 13.5 26.9 46.5 50.7 36.3 46.4
One person–male 9.2 11.1 11.6 8.4 8.3 10.4
One person–female 4.5 8.4 12.0 18.1 33.1 15.9
Single parent 20.7 15.5 8.2 4.3 2.9 6.6
Other 14.9 14.5 13.5 16.4 19.4 14.9
Multi-Family % Married couple with children 12.4 6.5 2.9 0.5 0.0 1.5
Married couple without children 8.9 11.6 19.0 21.6 14.2 18.4
One person–male 18.6 25.8 23.3 21.1 25.0 23.2
One person–female 15.5 24.2 35.2 47.4 57.6 44.3
Single parent 22.8 15.9 5.0 1.5 0.0 2.8
Other 21.8 16.1 14.5 8.0 3.3 9.9

HOUSING TRENDS UPDATE FOR THE 55+ MARKET: NEW INSIGHTS FROM THE AMERICAN HOUSING SURVEY 39
One-Person Households Headed by Females Dominate the 55+ Multi-Family and Age-Restricted Rental Market For all 55+ market segments (single-family detached, multi-family, age-qualified active adult, etc.) shown in this chapter, the share of one-person female households is larger than the share of one-person male households. However, the largest gap between these two shares is in the age-restricted rental housing market. Table 2.18: Trends in 55+ Household Types Moving into Single-Family Detached and Multi-Family Units
2001 2003 2005 2007 2009 Si
ngle
-Fam
ily
Det
ache
d
Mul
ti-Fa
mily
Sing
le-F
amily
D
etac
hed
Mul
ti-Fa
mily
Sing
le-F
amily
D
etac
hed
Mul
ti-Fa
mily
Sing
le-F
amily
D
etac
hed
Mul
ti-Fa
mily
Sing
le-F
amily
D
etac
hed
Mul
ti-Fa
mily
% Married couple with children 6.2 2.4 6.8 2.2 5.5 1.9 6.1 2.6 5.8 1.5
Married couple without children 51.6 22.9 49.0 19.6 49.7 21.0 49.1 18.0 46.4 18.4
One person–male 8.8 19.9 10.5 18.9 9.2 17.8 11.0 23.6 10.4 23.2
One person–female 17.3 40.5 15.7 43.9 17.4 45.4 16.4 40.6 15.9 44.3
Single parent 5.5 3.7 6.3 4.2 5.3 3.8 4.8 3.5 6.6 2.8
Other 10.6 10.5 11.7 11.2 13.0 10.1 12.7 11.8 14.9 9.9

40
In the age-qualified active adult housing market, married couples without children account for the largest share. Not surprisingly, households with children are not found in age-qualified active adult or age-restricted rental communities. Table 2.19: Trends in Household Types by Community Type
2001 2003 2005 2007 2009 Age-Qualified Active Adult Communities % Married couple with children 0.0 0.0 0.0 0.0 0.0
Married couple without children 50.6 42.8 47.4 61.9 52.4
One person–male 5.7 14.4 7.9 7.6 11.2
One person–female 37.3 37.5 39.4 21.8 31.6
Single parent 0.0 0.0 0.0 1.5 0.0
Other 6.4 5.3 5.3 7.3 4.7
Other 55+ Owner-Occupied Communities % Married couple with children 3.7 5.4 6.5 4.2 8.1
Married couple without children 63.2 55.0 55.9 54.1 56.6
One person–male 6.1 8.2 6.7 8.3 5.1
One person–female 17.4 21.2 14.7 23.2 18.9
Single parent 4.5 1.9 4.7 1.2 2.7
Other 5.1 8.4 11.4 9.0 8.6
Age-Restricted Rental Communities % Married couple with children 0.0 0.0 0.0 0.0 0.0
Married couple without children 23.5 11.8 11.5 11.3 12.2
One person–male 16.4 17.6 15.9 19.8 26.3
One person–female 55.2 68.3 70.0 64.3 58.4
Single parent 1.5 0.3 0.6 1.7 0.0
Other 3.5 2.0 2.0 2.9 3.1

HOUSING TRENDS UPDATE FOR THE 55+ MARKET: NEW INSIGHTS FROM THE AMERICAN HOUSING SURVEY 41
Current Market: Race and Education of Household Head 55+ Household Heads in the Market for Single-Family Detached Homes Are More Likely to Have an Advanced Degree Education is an important factor that can impact the home buying decision. If nothing else, different marketing strategies may be more appropriate for prospective buyers with different levels of education. Comparing the education attainment of the 55+ customers in the market for single-family detached homes to the 55+ customers in the multi-family housing market, we see that a larger share of customers in the market for single-family detached homes have college degrees or more advanced education. Advanced professional degrees beyond a bachelor’s degree are most common in the 55 to 74 age bracket among those moving to single-family detached homes. Of course, people over age 55 have had more time in which to acquire the degree. Some people return to school for advanced degrees after a considerable period of time in the workforce. In the multi-family market, however, older households do not seem to have an educational edge over younger households. Table 2.20: Household Educational Attainment in 2009 by Structure Type
Age of Household Head
Under 55 55 or Older
Under 45 45 to 54 55 to 64
65 to 74 75+ Total
55+ Single-Family Detached % Advanced degree 10.2 12.0 16.0 15.0 11.0 15.2
Bachelor’s 22.0 15.7 17.9 15.8 9.1 16.4
Some college but no bachelor’s 32.4 34.7 32.0 26.6 23.4 29.7
High school diploma but no college 25.3 28.9 23.8 23.7 35.0 25.0
Some high school or lower 10.2 8.8 10.4 18.9 21.5 13.7
Multi-Family % Advanced degree 8.6 8.6 8.6 7.7 7.5 8.1
Bachelor’s 20.9 15.2 16.2 13.9 13.3 14.8
Some college but no bachelor’s 33.7 33.0 23.2 26.1 22.2 23.7
High school diploma but no college 25.0 29.8 31.0 28.0 30.4 30.1
Some high school or lower 11.8 13.4 20.9 24.3 26.6 23.3

42
The Share of 55+ Customers with College or Advanced Education Is Increasing
College attendance, in general, and advanced education, in particular, has become increasingly widespread, and this is reflected in 55+ housing markets over time. For example, the share of 55+ households with a college or advanced degree has increased steadily from 26% in 2001 to 32% in 2009 in the market for single-family detached homes and from 19% to almost 23% in the multi-family market (see Table 2.21).
Table 2.21: Trends in Educational Attainment of 55+ Movers into Single-Family Detached and Multi-Family Units
2001 2003 2005 2007 2009
Sin
gle
-Fa
mil
y
De
tac
he
d
Mu
lti-
Fa
mil
y
Sin
gle
-Fa
mil
y
De
tac
he
d
Mu
lti-
Fa
mil
y
Sin
gle
-Fa
mil
y
De
tac
he
d
Mu
lti-
Fa
mil
y
Sin
gle
-Fa
mil
y
De
tac
he
d
Mu
lti-
Fa
mil
y
Sin
gle
-Fa
mil
y
De
tac
he
d
Mu
lti-
Fa
mil
y
%
Advanced degree 12.4 7.1 12.9 8.2 13.3 9.6 14.1 10.8 15.2 8.1
Bachelor’s 14.0 12.3 16.8 13.9 15.2 14.5 16.9 13.8 16.4 14.8
Some college, but no bachelor’s
27.8 23.0 28.5 24.8 30.4 25.2 28.2 26.7 29.7 23.7
High school diploma, but no college
26.1 25.6 23.5 25.8 25.3 27.4 26.9 27.0 25.0 30.1
Some high school or lower
19.7 31.9 18.3 27.3 15.8 23.4 14.0 21.8 13.7 23.3

HOUSING TRENDS UPDATE FOR THE 55+ MARKET: NEW INSIGHTS FROM THE AMERICAN HOUSING SURVEY 43
Many Age-Restricted Rental Customers Lack a College Education Comparing the education of the 55+ household heads in different markets shows that well over half of the age-restricted rental customers in 2009 are comprised of households without a college education. In contrast, close to 80% of customers for age-qualified active adult and 70% in other 55+ owner-occupied communities have at least some college education. This finding is consistent with the fact that households in age-restricted rental markets generally have lower average income (discussed later in this chapter), and the supposition that age-restricted rental communities may be government-subsidized. Table 2.22: Trends in Educational Attainment by Community Type
2001 2003 2005 2007 2009 Age-Qualified Active Adult Communities % Advanced degree 15.1 19.1 16.4 15.4 19.3
Bachelor’s 16.4 15.7 12.0 21.8 21.7
Some college but no bachelor’s 18.0 34.8 35.0 35.7 37.7
High school diploma but no college 33.7 24.0 32.9 21.5 14.3
Some high school or lower 16.8 6.3 3.8 5.6 6.9
Other 55+ Owner-Occupied Communities % Advanced degree 14.0 17.2 12.4 17.9 14.7
Bachelor’s 14.9 21.5 19.0 19.6 21.2
Some college but no bachelor’s 33.7 28.1 32.9 34.8 32.6
High school diploma but no college 26.2 22.5 25.2 19.7 21.2
Some high school or lower 11.2 10.7 10.5 8.0 10.3
Age-Restricted Rental Communities % Advanced degree 4.7 5.9 7.1 4.4 4.7
Bachelor’s 7.9 9.7 12.7 10.8 10.0
Some college but no bachelor’s 28.8 23.4 19.4 28.1 25.0
High school diploma but no college 24.6 34.3 31.1 29.2 30.3
Some high school or lower 34.0 26.7 29.7 27.5 30.2

44
55+ Market Has Become More Diverse but Still Dominated by Households Lead by White, Non-Hispanic Heads Although it is not surprising to see that the majority of the 55+ housing market consists of white, non-Hispanic households, age-qualified active adult communities attract an even greater share of white, non-Hispanic households. Overall, 88% of recent movers to age-qualified active adult communities are white, non-Hispanic, compared to 77% of recent movers to other 55+ owner-occupied and 65% of recent movers to age-restricted rental communities. The shares of minorities in the 55+ single-family housing market have been quite stable, around 18%, from 2001 to 2005; however, the shares increased to 23% in 2007 to 2009 (see Table 2.23). The share of minorities also trended upward since 2005 in age-qualified and other 55+ owner-occupied communities. The trend is likely to continue, and the 55+ housing market is likely to become more racially and ethnically diverse since the share of minorities is even higher among younger households in the single-family and multi-family markets, as shown in Table 2.24. Past immigration rates, which have been relatively high in recent decades, also suggest that the trend toward a greater share of minorities among older households will continue. Most immigrants come into the U.S. before they are age 55, so increased diversity in the 55+ population will occur naturally as the result of immigration rates. Table 2.23: Trends in Share of Households with White, Non-Hispanic Heads
2001 2003 2005 2007 2009 55+ Movers into % Single-Family Detached 82.6 81.1 81.7 77.0 77.4
Multi-Family 68.9 71.4 70.1 67.5 65.9
Movers into 55+ Communities % Age-Qualified Active Adult 93.1 90.9 93.9 88.0 87.7
Other 55+ Owner-Occupied 87.9 84.5 86.3 82.8 77.2
Age-Restricted Rental 72.9 78.0 73.4 73.9 65.0
Table 2.24: White, Non-Hispanic Share of Recent Movers by Structure Type in 2009
Age of Household Head
Under 55 55 or Older
Under 45 45 to 54 55 to 64 65 to 74 75+ Total 55+
% Single-Family Detached 68.9 70.3 73.3 84.7 84.7 77.4
Multi-Family 52.9 55.6 56.1 65.9 83.5 65.9

HOUSING TRENDS UPDATE FOR THE 55+ MARKET: NEW INSIGHTS FROM THE AMERICAN HOUSING SURVEY 45
Current Market: Household Income and Share of Home Workers Average Income for 55+ Single-Family Detached Customers Is Close to $70K Not surprisingly, the average income of households in the markets for both single-family detached and multi-family housing peaks for households age 45 to 64 and then decreases as age increases. Of course, for 55+ households, accumulated wealth becomes more important as a means of financing living arrangements. The 55+ customers in the single-family detached housing market earn on average $33,000 more than the 55+ customers in the multi-family housing market. A high share of the 55+ multi-family customers is at the low end of the income distribution. Table 2.25: Income in 2009 for Movers into Single-Family Detached and Multi-Family Units
Age of Household Head
Under 55 55 or Older
Under 45 45 to 54 55 to 64 65 to 74 75+ Total 55+
Single-Family Detached Units % Under $20K 14.6 14.0 17.9 24.8 38.1 21.9
$20–$39.9K 21.7 19.8 20.8 32.2 32.2 24.9
$40–$59.9K 18.1 15.6 16.8 18.1 11.4 16.5
$60–$79.9K 15.1 15.1 9.7 9.7 11.4 9.9
$80–$99.9K 11.4 11.0 8.2 4.5 3.1 6.7
$100–$149.9K 10.8 14.9 14.5 4.9 2.6 10.8
$150K+ 8.3 9.7 11.9 5.7 1.2 9.2
Average $69,373 $75,841 $78,389 $52,464 $34,797 $67,105
Multi-Family Units % Under $20K 30.3 32.2 43.8 49.2 50.3 46.9
$20–$39.9K 29.5 25.9 22.8 27.0 36.1 27.4
$40–$59.9K 17.9 17.3 11.9 11.8 5.7 10.2
$60–$79.9K 10.4 11.8 7.5 4.5 2.9 5.5
$80–$99.9K 5.1 5.5 4.4 2.0 1.5 3.0
$100–$149.9K 4.6 5.1 7.2 4.1 2.4 5.2
$150K+ 2.3 2.2 2.3 1.4 1.1 1.8
Average $41,355 $42,439 $39,399 $31,109 $26,701 $33,908

46
55+ Movers Register Income Decline in 2009 As shown in Table 2.26, average income of 55+ movers increased between 2001 and 2007, although there was a decline in 2005. In 2009, as a result of the most recent economic recession average income declined, more significantly among those moving to multi-family properties.
Table 2.26: Trends in Income of 55+ Movers by Structure Type
2001 2003 2005 2007 2009
Sing
le-F
amily
D
etac
hed
Mul
ti-Fa
mily
Sing
le-F
amily
D
etac
hed
Mul
ti-Fa
mily
Sing
le-F
amily
D
etac
hed
Mul
ti-Fa
mily
Sing
le-F
amily
D
etac
hed
Mul
ti-Fa
mily
Sing
le-F
amily
D
etac
hed
Mul
ti-Fa
mily
% Under $20K 27.6 52.5 25.5 49.1 22.0 51.7 16.5 44.4 21.9 46.9
$20–$39.9K 23.5 23.6 25.8 24.3 22.7 23.1 24.4 27.3 24.9 27.4
$40–$59.9K 17.3 9.4 15.5 12.1 22.5 11.0 19.3 12.0 16.5 10.2
$60–$79.9K 10.0 6.8 10.1 6.6 10.9 5.9 10.7 6.7 9.9 5.5
$80–$99.9K 6.9 3.0 7.2 2.6 8.5 2.9 8.7 2.9 6.7 3.0
$100–$149.9K 7.9 1.7 7.3 2.4 7.6 3.3 11.9 3.3 10.8 5.2
$150K+ 6.7 3.0 8.6 3.1 6.0 2.1 8.5 3.3 9.2 1.8
Average $64,606 $35,536 $66,967 $37,461 $58,624 $31,731 $69,537 $36,642 $67,105 $33,908
The Share of High-Income Households in the Age-Qualified Active Adult Market Is on the Rise Until recently, the average income of age-qualified active adult customers has been significantly lower than the average income of households moving into other 55+ owner-occupied communities. In 2007 and 2009, the situation reversed, as age-qualified active adult communities attracted significantly higher shares of high-income households. More than 27% of their customers earned $100,000 or more in 2009, compared to less than 5% in 2001. As a matter of fact, the average income of age-qualified active adult customers continued to rise even during the 2009 recession, while other 55+ households experienced a drop in income.

HOUSING TRENDS UPDATE FOR THE 55+ MARKET: NEW INSIGHTS FROM THE AMERICAN HOUSING SURVEY 47
Sixty-two percent of age-restricted rental customers earn less than $20,000. Of the various 55+ market segments customers in the age-restricted rental market have by far the lowest average income, around $20,600 in 2009. Table 2.27: Trends in Income of Movers by Community Type
2001 2003 2005 2007 2009 Age-Qualified Active Adult Communities % Under $20K 23.1 30.7 28.7 18.5 21.8
$20–$39.9K 37.0 21.0 28.5 18.3 14.7
$40–$59.9K 18.6 19.6 19.8 16.4 14.1
$60–$79.9K 7.8 10.7 6.8 9.5 16.5
$80–$99.9K 8.7 9.3 8.5 16.6 5.7
$100–$149.9K 4.8 5.1 4.7 11.4 16.5
$150K+ 0.0 3.6 3.0 9.3 10.7
Average $40,389 $45,252 $45,936 $76,473 $80,772
Other 55+ Owner-Occupied Communities % Under $20K 19.4 20.7 15.5 11.8 18.3
$20–$39.9K 26.2 27.5 23.1 24.9 23.6
$40–$59.9K 19.5 19.4 22.3 14.3 13.0
$60–$79.9K 13.4 7.0 14.2 14.2 12.7
$80–$99.9K 5.0 7.9 6.8 9.7 14.1
$100–$149.9K 10.3 6.1 9.0 16.1 10.0
$150K+ 6.2 11.4 9.0 9.0 8.3
Average $64,278 $78,105 $72,634 $74,633 $69,722
Age-Restricted Rental Communities % Under $20K 73.5 74.3 77.0 64.5 62.0
$20–$39.9K 18.4 18.5 16.9 25.8 29.8
$40–$59.9K 4.6 7.0 1.4 5.8 4.6
$60–$79.9K 0.6 0.0 2.4 1.2 1.0
$80–$99.9K 0.0 0.0 1.4 1.4 0.0
$100–$149.9K 0.0 0.0 0.8 0.6 1.8
$150K+ 2.9 0.3 0.0 0.6 0.8
Average $26,284 $16,485 $16,227 $19,860 $20,622

48
The Share of 55+ Customers Who Work at Home Is on the Rise The share of customers who work at home is consistently larger in the single-family detached housing market then the share in the multi-family housing market throughout the 2001–2009 period. Beginning in 2005, there was a significant increase in the share of home workers in the single-family detached housing market, and a big jump in both markets in 2007 (see Table 2.28). The trend continued in the single-family market even into the 2009 recession, while it retreated slightly in the multi-family market. Although the reason for this cannot be determined with certainty, it is possible that companies are more willing to let employees work at home as technology makes transmitting information electronically easier. It is very likely the trend will continue since the share of home workers is even higher among younger, more tech-savvy households (see Table 2.29). The implication for builders of active adult housing is that demand for office space inside the home is likely to rise. The share of home workers has been on the rise in other 55+ owner-occupied communities as well and exceeded 15% in 2009, while declining to 11% in age-qualified active adult communities and to 3% in age-restricted rental communities. Table 2.28: Trends in Share of Movers Who Work at Home
2001 2003 2005 2007 2009 55+ Households Moving into % Single-Family Detached 9.9 8.7 11.5 16.7 18.0
Multi-Family 5.6 5.9 6.7 13.2 11.2
Movers into % Age-Qualified Active Adult 11.2 5.1 5.0 14.4 11.0
Other 55+ Owner-Occupied Communities 5.7 8.4 11.9 12.7 15.1
Age-Restricted Rental 1.9 1.3 0.8 4.1 2.9
Table 2.29: Share of Movers in 2009 Who Work at Home by Structure Type
Age of Household Head
Under 55 55 or Older
Under 45 45 to 54 55 to 64 65 to 74 75+ Total 55+
% Single-Family 26.3 25.3 23.6 9.8 4.4 18.0
Multi-Family 22.7 20.9 18.5 8.6 0.7 11.2

HOUSING TRENDS UPDATE FOR THE 55+ MARKET: NEW INSIGHTS FROM THE AMERICAN HOUSING SURVEY 49
Number of Other Homes Looked at Before Moving In Customers for Single-Family Detached Housing Look at More Homes before Buying The AHS asks respondents how many other homes they look at before moving into their current home. In the single-family detached housing market, 55+ customers on average look at 12 other homes before choosing a unit (see Table 2.30). Customers who choose multi-family housing look at considerably fewer units (about 5) before moving in. One possible explanation is that customers tend to spend less effort on choosing a unit if they are planning to rent instead of buy. The households in the 45–64 age brackets tend to look at more homes on average, the older households get the less homes they need to see before making a decision. Table 2.30: Number of Other Homes Looked at in 2009 Before Moving into Single-Family Detached and Multi-Family Units
Age of Household Head
Under 55 55 or Older
Under 45 45 to 54 55 to 64 65 to 74 75+ Total
55+
Single-Family Detached Units %
0 home 9.8 13.6 15.7 21.6 27.1 18.1
1–2 homes 13.2 12.5 10.5 13.6 19.2 12.0
3–5 homes 26.9 19.8 18.6 21.6 14.1 18.9
6–10 homes 18.7 21.8 20.4 15.2 22.2 19.3
11–20 homes 17.7 15.9 19.4 12.1 13.9 17.1
21 and more homes 13.6 16.3 15.5 16.0 3.6 14.5
Average 11.7 13.4 13.1 12.4 6.1 12.3
Multi-Family Units % 0 home 12.4 16.2 15.1 28.1 27.3 21.1
1–2 homes 20.3 19.4 28.3 25.5 35.5 29.3
3–5 homes 37.4 34.0 28.4 26.7 25.5 27.3
6–10 homes 17.6 18.8 13.1 11.2 8.5 11.5
11–20 homes 8.8 7.3 9.7 5.4 2.7 7.0
21 and more homes 3.4 4.3 5.4 3.2 0.5 3.7
Average 6.0 6.3 6.2 4.7 2.6 5.0

50
Table 2.31: Trends in Number of Other Homes 55+ Households Look at Before Moving into Single-Family Detached and Multi-Family Units
2001 2003 2005 2007 2009
Sin
gle
-Fa
mil
y
De
tac
he
d
Mu
lti-
Fa
mil
y
Sin
gle
-Fa
mil
y
De
tac
he
d
Mu
lti-
Fa
mil
y
Sin
gle
-Fa
mil
y
De
tac
he
d
Mu
lti-
Fa
mil
y
Sin
gle
-Fa
mil
y
De
tac
he
d
Mu
lti-
Fa
mil
y
Sin
gle
-Fa
mil
y
De
tac
he
d
Mu
lti-
Fa
mil
y
Number
of
Homes
%
0 25.0 27.9 26.3 26.9 24.3 27.1 18.5 19.0 18.1 21.1
1–2 13.9 20.7 13.2 23.0 13.2 22.8 10.8 24.1 12.0 29.3
3–5 20.0 27.1 19.4 27.4 18.7 22.7 19.2 26.8 18.9 27.3
6–10 15.6 14.1 16.4 12.3 19.6 16.2 17.8 15.2 19.3 11.5
11–20 14.5 8.0 15.7 6.8 12.4 8.0 18.4 11.3 17.1 7.0
21 + 11.0 2.2 8.9 3.7 11.9 3.3 15.4 3.7 14.5 3.7
Average 10.7 4.6 8.7 5.4 9.8 5.2 12.0 5.9 12.3 5.0

HOUSING TRENDS UPDATE FOR THE 55+ MARKET: NEW INSIGHTS FROM THE AMERICAN HOUSING SURVEY 51
Majority of the Age-Restricted Rental Customers Do Not Look at More Than Two Other Homes On average, customers of active adult and other 55+ owner-occupied communities looked at roughly the same number of homes as a typical 55+ single-family detached buyer before choosing a unit (see Table 2.32). In contrast, customers in the age-restricted rental market tend to look at fewer than three homes before making a decision. It may be that the low-income customers typical of this market do not feel they have many options in the marketplace. Again, this is consistent with the hypothesis that many of the age-restricted rental units are subsidized. Table 2.32: Trends in Number of Other Homes Buyers Look at Before Moving in by Community Type
2001 2003 2005 2007 2009 Age-Qualified Active Adult % 0 home 12.4 27.3 19.9 19.9 7.1
1–2 homes 10.3 12.0 16.2 8.6 19.3
3–5 homes 18.6 19.8 10.3 20.4 25.3
6–10 homes 23.4 13.8 29.7 21.5 13.0
11–20 homes 25.3 9.7 13.5 13.7 18.7
21 and more homes 10.1 17.5 10.5 15.9 16.6
Average 11.6 13.0 10.1 13.6 12.0
Other 55+ Owner-Occupied % 0 home 24.5 19.1 18.1 9.1 19.6
1–2 homes 14.8 5.6 13.7 9.3 6.0
3–5 homes 21.9 20.1 20.2 18.2 16.5
6–10 homes 18.3 26.1 18.6 21.7 22.9
11–20 homes 9.0 17.0 17.5 19.2 18.1
21 and more homes 11.6 12.2 11.9 22.5 17.0
Average 9.6 12.4 10.8 15.1 12.1
Age-Restricted Rental % 0 home 37.3 33.8 36.4 28.7 30.6
1–2 homes 32.8 33.3 28.3 34.4 34.6
3–5 homes 17.3 23.5 16.5 23.2 26.3
6–10 homes 7.7 5.5 14.1 9.8 7.0
11–20 homes 3.7 2.4 2.6 4.0 0.4
21 and more homes 1.2 1.6 2.1 0.0 1.2
Average 2.8 2.6 3.6 2.8 2.9

52
Customers Who Choose Age-Qualified Active Adult or Other 55+ Owner-Occupied Communities Are More Likely to Shop for Homes in Multiple Neighborhoods The AHS also contains information on whether the households looked at other neighborhoods before moving. In general, the share of 55+ households in both single-family and multi-family markets considering more than one neighborhood has been rising since 2003. The majority, however, especially in the multi-family market, still has a particular neighborhood in mind when considering a move. The opposite is true for customers who chose single-family detached homes in a 55+ community (either age-qualified or otherwise occupied mostly by 55+ households). In recent years, more than half of these customers looked at multiple neighborhoods before moving in. In 2009, close to two-thirds of age-qualified adult customers looked at more than one neighborhood, the highest share of any 55+ market segments. In sharp contrast, a relatively small share, 33% of 55+ customers for age-restricted rentals looked at more than one neighborhood before moving. Table 2.33: Trends in Tendency to Look at Homes in More than One Neighborhood before Making a Decision
2001 2003 2005 2007 2009
55+ Households Moving into % Single-Family Detached 43.0 40.2 44.8 48.4 49.3
Multi-Family 39.6 34.1 38.5 42.5 42.6
Movers into % Age-Qualified Active Adult 52.7 36.9 46.7 53.2 64.1
Other 55+ Owner-Occupied Communities 44.4 47.9 51.0 57.8 53.8
Age-Restricted Rental 32.1 29.5 32.5 33.0 33.0

HOUSING TRENDS UPDATE FOR THE 55+ MARKET: NEW INSIGHTS FROM THE AMERICAN HOUSING SURVEY 53
Chapter 3
New Construction for the 55+ Market In this chapter, all tabulations are for new construction only. Newly built units are defined as units occupied by recent movers who report that they are the first occupants of housing units. This definition can be problematic in age-restricted rental and other rental markets, where the turnover rate is high and residents may not be the first occupants even in fairly new structures, or in some cases not know for certain whether they are the first occupants or not. To avoid any of these problems, the tabulations in this chapter are restricted to owner-occupied properties. Because this chapter analyzes the AHS sample restricted to new construction, the number of observations on which the tables are based is considerably smaller than in previous chapters, which tabulated characteristics for all homes, irrespective of their vintage. Dollar Value of New Construction Prices for Age-Qualified Active Adult Units Are $300K on Average, Not Much Different from Prices on Other New Homes Purchased by 55+ Households Table 3.1 shows home values for new housing units occupied by 55+ households. The table includes both averages and medians. When the distribution is skewed (i.e., the homes at the top end are very expensive compared to what the majority of buyers or renters occupy), it tends to pull the average above the median (the median cuts the distribution in half, so that half of the homes are more expensive than the median; half are less expensive). Compared to other new homes purchased by 55+ households, the average price in age-qualified active adult communities is lower, but the median price turned out to be higher in most recent years, 2005 to 2009. This suggests that although the age-qualified active adult housing is not primarily serving the lower end of the market, it was not attracting the few buyers at the very top end until recently. Median values, that tell a better story over time since they are less affected by outliers, show that none of the 55+ communities were immune to a housing downturn, and all experienced price declines since their peaks in 2005–2007. Despite declines, values of new homes purchased by 55+ buyers are somewhat higher than those reported by the Census Bureau in 2009 (average = $270,900, median = $216,7003). This is reasonable given the overall wealth of 55+ home buyers.

54
Table 3.1: Home Value for New 55+ Construction
2001 2003 2005 2007 2009
Average Home Value by Communities
Age-Qualified Active Adult $209,826 $195,667 $309,038 $298,667 $319,003
Other 55+ Communities $256,110 $251,166 $393,562 $300,402 $346,932
Other 55+ New Home Buyer $249,847 $269,556 $357,273 $366,744 $338,311
Median Home Value by Communities
Age-Qualified Active Adult $180,000 $180,000 $320,000 $300,000 $300,000
Other 55+ Communities $200,000 $200,000 $300,000 $274,000 $255,000
Other 55+ New Home Buyer $192,000 $200,000 $258,000 $280,000 $239,000
Basic Characteristics of New Construction New Age-Qualified Active Adult Homes Are Somewhat Smaller Than Other New Homes Purchased by 55+ Households
As shown in Table 3.2, age-qualified active adult units tend to be smaller than new homes in other owner-occupied 55+ communities (i.e., where most of the residents are 55+ anyway) or new homes purchased by 55+ new home buyers not in 55+ communities. This is true whether the new homes are measured by square footage, number of bedrooms, or number of bathrooms. Nevertheless, the new age-qualified active adult units are not tiny, averaging more than two bathrooms and 2,087 square feet of living space in 2009. These are just a bit smaller than in 2007 when the age-qualified active adult homes were largest ever.

HOUSING TRENDS UPDATE FOR THE 55+ MARKET: NEW INSIGHTS FROM THE AMERICAN HOUSING SURVEY 55
In terms of size characteristics, the new homes purchased in other owner-occupied 55+ communities stand between age-qualified active adult and new homes purchased by 55+ buyers outside of any type of 55+ community, but now show a tendency to become just as large as new homes purchased by other 55+ buyers. Even though we would expect home value and home size to be related, this does not appear to be the case since 2001. The overall rapid price appreciation across homes of all sizes in 2001–2005 and recent rapid depreciation appear to be driving new home prices purchased by 55+ households. Table 3.2: Trends in Size of Homes Built by Community Type
2001 2003 2005 2007 2009
Age-Qualified Active Adult Average square footage 1,844 2,718 2,059 2,329 2,087
Median square footage 1,700 2,000 1,950 2,400 2,100
Average number of rooms 5.2 5.4 5.8 6.4 6.0
Average number of bedrooms 2.4 2.3 2.4 2.8 2.3
Average number of bathrooms 2.0 2.0 2.1 2.5 2.4
Other Owner-Occupied 55+ Communities Average square footage 2,474 2,413 2,815 3,247 2,521
Median square footage 2,100 2,000 2,300 2,100 2,400
Average number of rooms 5.6 6.5 7.2 6.3 6.3
Average number of bedrooms 2.7 2.7 3.2 3.0 3.2
Average number of bathrooms 2.2 2.3 2.5 2.6 2.6
55+ Buyers, but Not in 55+ Communities Average square footage 2,700 2,893 2,520 2,979 3,414
Median square footage 2,060 2,300 2,400 2,400 2,400
Average number of rooms 6.6 6.6 7.1 6.7 7.0
Average number of bedrooms 3.1 3.0 3.2 3.4 3.4
Average number of bathrooms 2.5 2.5 2.5 2.6 2.7

56
Why Households Choose New Homes Less Emphasis on Exterior Appearance and Other Aesthetics During Tough Economic Times The 2008 recession made 55+ new home buyers more practical. Aesthetic reasons for choosing a housing unit, such as exterior appearance and the unit view became less important. For example, in 2009 less than 9% of new home buyers in age-qualified active adult communities bought a unit because they liked exterior appearance; and less than 8% because they liked the view. In 2007 these shares were more than 20% and 34% respectively. Liking the kitchen turned out to be least important for all 55+ new home buyers in 2009. Financial reasons gain their importance among new home buyers in other 55+ communities and non-communities. Those buying in age-qualified active adult communities were less concerned about financial reasons than other 55+ new home buyers. For New Age-Qualified Active Adult Home Buyers, Room Layout and Community Design Are Most Important Consistently, the dominant reason households choose a particular new, age-qualified active adult home is the room layout and design of the unit. In 2009, more than 60% of the new home buyers in age-qualified active adult communities chose the home for this reason. The right size is consistently the second most important reason for these buyers. In 2009, 46% of them chose a housing unit because they liked the size. Table 3.3: Trends in Reasons Buyers Choose New Homes Built in Age-Qualified Active Adult Communities
2001 2003 2005 2007 2009
Reasons for Choosing the Housing Unit % Like room layout/design 83.2 59.1 68.5 71.2 61.4
Exterior appearance 27.4 28.5 27.5 20.4 8.5
Financial reasons 14.2 12.0 24.8 38.9 15.5
Like the size 37.2 42.5 25.8 39.8 46.2
Construction quality 31.2 32.1 20.1 19.2 32.6
Like the kitchen 34.0 26.8 18.9 21.1 5.6
Like the view 10.3 14.2 15.0 33.9 7.5
Other reasons 12.3 5.8 18.7 11.0 6.7
Reasons for Choosing the Community % Like the community design 47.5 52.3 50.9 64.3 48.7
Close to friends/relatives 20.6 28.1 32.1 34.9 22.1
Close to leisure activity 20.5 39.5 24.4 24.0 13.7
Like the housing unit 48.6 33.9 25.4 16.9 35.3
Close to public service in community 3.9 8.6 0.0 10.6 0.0
Close to public transportation 0.0 0.0 0.0 2.9 8.7

HOUSING TRENDS UPDATE FOR THE 55+ MARKET: NEW INSIGHTS FROM THE AMERICAN HOUSING SURVEY 57
For 55+ Households Buying New Homes, Community Design and Housing Unit Itself Are Top Two Reasons for Choosing a Community There are some other differences between different types of 55+ new home buyers. New home buyers in other 55+ communities tend to value construction quality more than any other 55+ buyers of new homes. Almost 40% of them chose a new unit because of the construction quality, their most often cited reason in 2009. When choosing a community, 55+ new home buyers are most likely to consider community design and the housing unit itself. In 2009, these were the top two reasons listed by all 55+ customers buying in and outside of 55+ communities. Being close to friends and family ranked third for all 55+ new home buyers. Those buying new homes in age-qualified and other 55+ communities tend to value being close to leisure activities more than new home buyers not in 55+ communities. Table 3.4: Trends in Reasons Buyers Choose New Homes Built in Other 55+ Communities
2001 2003 2005 2007 2009
Reasons for Choosing the Housing Unit % Like room layout/design 53.0 62.1 57.4 64.5 37.1
Exterior appearance 36.0 21.0 21.8 15.9 19.2
Financial reasons 13.3 14.0 3.5 12.0 24.4
Like the size 31.2 31.5 23.0 36.4 27.4
Construction quality 49.2 40.8 38.9 40.9 39.2
Like the kitchen 12.4 9.3 14.6 5.6 6.7
Like the view 32.0 16.2 15.6 27.6 6.7
Other reasons 14.7 10.8 8.2 22.6 16.0
Reasons for Choosing the Community % Like the community design 54.9 38.3 53.6 33.7 40.8
Close to friends/relatives 31.2 40.2 26.8 33.9 19.1
Close to leisure activity 23.4 17.8 21.3 39.6 16.2
Like the housing unit 35.8 24.8 31.6 31.3 33.2
Close to public service in community 9.6 3.5 2.5 7.3 8.1
Close to public transportation 5.5 0.0 2.5 0.0 6.4

58
Table 3.5: Trends in Reasons 55+ Buyers Choose New Homes Not Built in 55+ Communities
2001 2003 2005 2007 2009
Reasons for Choosing the Housing Unit %
Like room layout/design 55.7 41.3 50.0 53.4 62.6
Exterior appearance 20.0 16.4 21.5 21.8 11.0
Financial reasons 16.3 9.6 8.8 9.6 16.1
Like the size 29.5 21.4 20.6 27.2 25.6
Construction quality 28.9 20.5 29.1 30.6 21.4
Like the kitchen 12.0 5.4 14.5 10.9 8.5
Like the view 16.9 7.3 10.6 12.5 13.9
Other reasons 15.6 17.6 20.3 21.9 12.7
Reasons for Choosing the Community %
Like the community design 44.6 36.6 39.7 34.7 27.1
Close to friends/relatives 24.4 18.5 17.3 25.4 23.1
Close to leisure activity 12.1 6.5 10.9 9.1 6.1
Like the housing unit 26.1 22.5 29.7 30.2 25.4
Close to public service in community 5.7 2.1 3.7 5.4 3.3
Close to public transportation 1.2 0.2 1.2 1.0 0.4

HOUSING TRENDS UPDATE FOR THE 55+ MARKET: NEW INSIGHTS FROM THE AMERICAN HOUSING SURVEY 59
How New Housing Units Compare with Previous Residences 55+ Households Moving into New Homes Are Trading Up in Quality but Not Necessarily in Price The AHS asks recent movers a series of questions about their new homes compared to their previous residences. More than 50% of those who bought new homes in age-qualified active adult communities, close to 86% of those who bought new homes in other 55+ communities and more than 75% of non-community new home buyers reported that they were moving into a better unit. The same buyers, however, are less likely to report that their new homes cost more than the old ones, 46%, 40%, and 59%, respectively (see Tables 3.6–3.8). Almost All Customers for New Age-Qualified Active Adult Homes Previously Owned Single-Family Homes Among 55+ new home buyers, the share that are moving out of an existing, owner-occupied, single-family home is very high. This is especially true among new home buyers in age-qualified active adult communities, where the share of previous single-family homeowners is 91%. Table 3.6: Trends in New/Previous Unit Comparisons: Buyers of New Homes in Age-Qualified Active Adult Communities
2001 2003 2005 2007 2009
% New housing unit costs more 32.3 34.0 41.5 28.6 46.3
New housing unit costs less 10.2 37.9 39.5 27.5 14.3
New housing unit is better 57.9 75.1 62.1 61.3 50.1
New housing is worse 10.4 7.5 0.0 0.0 9.1
New neighborhood is better 48.1 53.8 47.9 43.7 53.9
New neighborhood is worse 5.4 0.0 3.9 7.8 0.0
Previous residence condo/co-op 0.0 8.8 8.4 8.3 4.9
Previous residence owned 95.4 78.7 97.0 95.9 79.1
Previous residence single-family 85.2 76.6 100.0 92.0 90.9
Previous residence multi-family 9.3 13.1 0.0 8.0 9.1

60
Table 3.7: Trends in New/Previous Unit Comparisons: Buyers of New Homes in Other 55+ Communities
2001 2003 2005 2007 2009 %
New housing unit costs more 47.0 20.2 53.0 24.4 40.3
New housing unit costs less 23.0 45.8 27.0 40.5 33.7
New housing unit is better 57.3 64.9 73.8 52.1 85.6
New housing is worse 6.1 7.5 0.0 9.0 0.0
New neighborhood is better 52.6 47.4 59.5 40.3 37.8
New neighborhood is worse 4.2 7.0 0.0 2.3 22.7
Previous residence condo/co-op 23.7 3.7 5.5 5.3 0.0
Previous residence owned 83.6 87.2 85.6 95.2 74.3
Previous residence single-family 83.7 92.3 85.2 96.1 72.0
Previous residence multi-family 14.5 0.0 7.4 0.0 12.9
Table 3.8: Trends in New/Previous Comparisons: 55+ Buyers of New Homes Not in 55+ Communities
2001 2003 2005 2007 2009
% New housing unit costs more 44.8 50.9 39.4 50.9 59.4
New housing unit costs less 29.3 18.0 29.1 24.6 14.9
New housing unit is better 67.5 74.0 71.5 73.8 75.2
New housing is worse 3.6 6.8 5.7 1.9 5.3
New neighborhood is better 53.0 47.6 47.0 47.8 57.6
New neighborhood is worse 5.1 9.0 5.4 4.2 2.5
Previous residence condo/co-op 13.4 9.2 7.8 8.8 10.6
Previous residence owned 82.7 80.2 81.5 85.2 82.3
Previous residence single-family 86.0 84.2 83.6 88.1 80.2
Previous residence multi-family 10.5 11.1 9.0 6.6 9.0

HOUSING TRENDS UPDATE FOR THE 55+ MARKET: NEW INSIGHTS FROM THE AMERICAN HOUSING SURVEY 61
How New Home Purchases Are Financed Unable to Sell Their Current Homes, 55+ New Home Buyers Rely More Heavily on Savings and Cash on Hand The recent housing downturn made a significant impact on how 55+ households finance their new home purchases. Those making a down payment had to rely more frequently on savings and cash on hand rather than a sale of a previous home. Only 55% of the new age-qualified active adult home buyers who made a down payment reported that it came from the sale of a previous home, significantly down from 92% in 2007 and 100% reported in the 2005 AHS. New home buyers in other 55+ and not in 55+ communities registered similar difficulties selling their previous residencies in 2009. The share of new home buyers making a down payment from the sale of a previous home fell from 78% to 36% in other 55+ communities, and from 63% to 44% outside of 55+ communities. Many Age-Qualified Active Adults Do Not Need a Loan One of the traditional reasons builders have been attracted to the age-qualified active adult segment of the housing market is that many of the buyers in this market segment are able to finance their purchases out of accumulated wealth, rather than out of current income. This means that the market for age-qualified active adult housing should be relatively stable and not fluctuate as much as other segments of the housing market do in response to changes in interest rates or the overall business cycle. Data from the AHS support this view of the marketplace. Even during the 2008–2009 recession, less than 43% of the buyers for new, age-qualified active adult homes needed to take out a mortgage. In comparison, 68% of new home buyers in other 55+ communities, and 65% of 55+ new home buyers outside of communities had to rely on a mortgage. Table 3.9: Trends in Financing New Homes Purchased in Age-Qualified Active Adult Communities
2001 2003 2005 2007 2009 Take out a mortgage 30.6% 42.8% 41.4% 51.2% 42.7%
For Those with Mortgages ARM share 0.0% 0.5% 0.0% 20.7% 0.0%
Median loan to value ratio 0.71 0.67 0.45 0.65 0.75
Source of Down Payment % Sale of previous home 70.8 90.3 100.0 92.1 54.6
Savings or cash on hands 29.3 9.7 0.0 0.0 45.4
Other sources 0.0 0.0 0.0 7.9 0.0
No down payment 0.0 0.0 0.0 0.0 0.0

62
Table 3.10: Trends in Financing New Homes Purchased in Other 55+ Communities
2001 2003 2005 2007 2009
Take out a mortgage 54.4% 47.0% 60.1% 39.7% 67.6%
For Those with Mortgages
ARM share 4.1% 3.2% 8.5% 0.0% 3.2%
Median loan to value ratio 0.65 0.39 0.56 0.61 0.93
Source of Down Payment %
Sale of previous home 75.1 64.5 64.5 78.2 36.1
Savings or cash on hands 24.9 28.7 33.5 11.6 31.2
Other sources 0.0 6.7 2.0 10.2 18.7
No down payment 0.0 0.0 0.0 0.0 14.0
Table 3.11: Trends in Financing New Homes Purchased by 55+ Households, but Not in 55+ Communities
2001 2003 2005 2007 2009
Take out a mortgage 54.7% 57.3% 58.4% 70.2% 64.9%
For Those with Mortgages
ARM share 2.2% 1.1% 2.0% 3.1% 1.0%
Median loan to value ratio 0.69 0.68 0.64 0.59 0.73
Source of Down Payment %
Sale of previous home 46.3 63.5 56.2 62.6 43.5
Savings or cash on hands 45.5 20.0 30.9 24.8 39.4
Other sources 5.7 10.5 3.0 12.6 12.7
No down payment 2.5 6.0 10.0 1.8 4.4
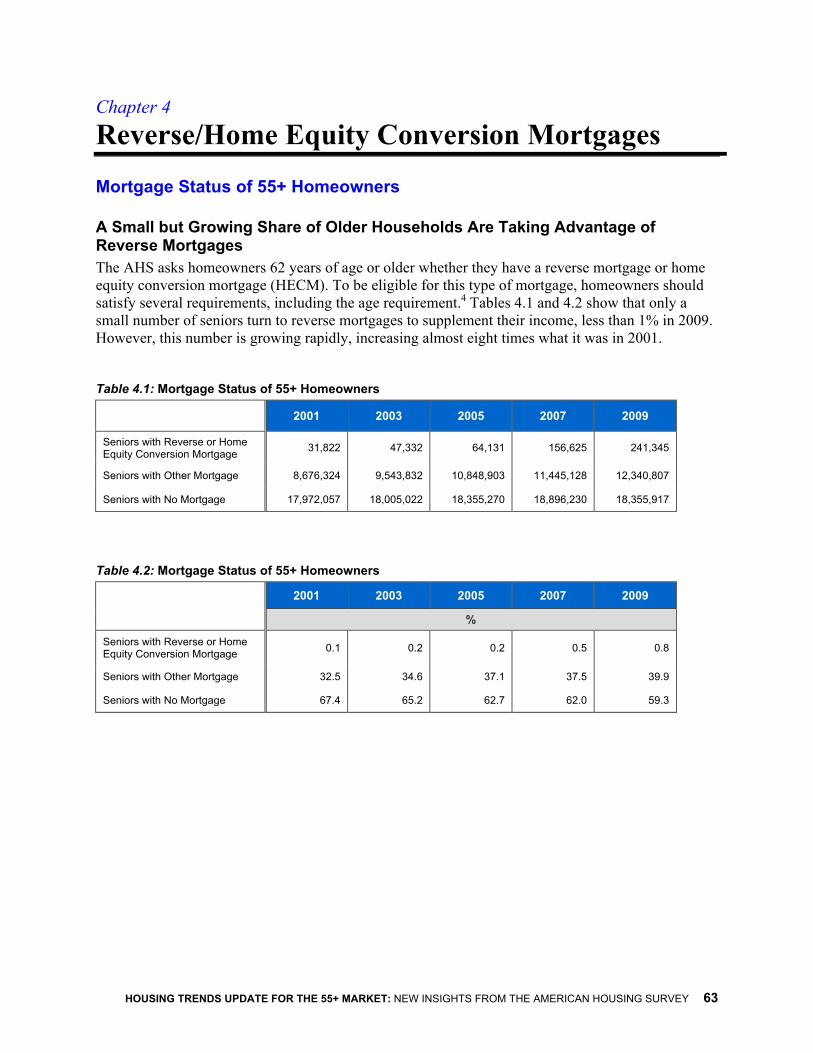
HOUSING TRENDS UPDATE FOR THE 55+ MARKET: NEW INSIGHTS FROM THE AMERICAN HOUSING SURVEY 63
Chapter 4
Reverse/Home Equity Conversion Mortgages Mortgage Status of 55+ Homeowners A Small but Growing Share of Older Households Are Taking Advantage of Reverse Mortgages The AHS asks homeowners 62 years of age or older whether they have a reverse mortgage or home equity conversion mortgage (HECM). To be eligible for this type of mortgage, homeowners should satisfy several requirements, including the age requirement.4 Tables 4.1 and 4.2 show that only a small number of seniors turn to reverse mortgages to supplement their income, less than 1% in 2009. However, this number is growing rapidly, increasing almost eight times what it was in 2001. Table 4.1: Mortgage Status of 55+ Homeowners
2001 2003 2005 2007 2009
Seniors with Reverse or Home Equity Conversion Mortgage 31,822 47,332 64,131 156,625 241,345
Seniors with Other Mortgage 8,676,324 9,543,832 10,848,903 11,445,128 12,340,807
Seniors with No Mortgage 17,972,057 18,005,022 18,355,270 18,896,230 18,355,917
Table 4.2: Mortgage Status of 55+ Homeowners
2001 2003 2005 2007 2009
%
Seniors with Reverse or Home Equity Conversion Mortgage 0.1 0.2 0.2 0.5 0.8
Seniors with Other Mortgage 32.5 34.6 37.1 37.5 39.9
Seniors with No Mortgage 67.4 65.2 62.7 62.0 59.3

64
Demographics and Socio-Economic Status of Reverse Mortgage Borrowers Most Reverse Mortgage Borrowers Are Over Age 75; Many More Are One-Person Households Compared to Other Mortgage Holders To be eligible for a HECM, all applicants must be at least 62 years of age. Table 4.3 shows that reverse mortgage borrowers tend to be much older, 77 years of age on average. The majority of these borrowers are concentrated in the 75+ age brackets, with more than 22% 85 years and older. The fact that eligibility requirements become more lenient and the HECM amount increases with advanced age of borrowers explains why reverse mortgage borrowers have such a skewed age distribution. Seniors with and without standard mortgages tend to be much younger, 64 and 71 years of age, respectively. As will be shown below, these are households with higher income and less in need of supplemental earnings from reverse mortgages. Table 4.4 shows that compared to seniors with or without mortgages, reverse mortgage borrowers are more likely to be single householders. Table 4.3: 55+ Senior Homeowner Age Distribution in 2009
Seniors with Reverse or Home Equity
Conversion Mortgage Seniors with Mortgage Seniors with No
Mortgage
% 55 to 59 0.0 37.8 14.7
60 to 64 1.1 27.3 16.9
65 to 69 19.0 15.5 16.8
70 to 74 22.8 9.2 15.0
75 to 79 20.0 5.8 14.5
80 to 84 14.9 2.6 11.9
85+ 22.3 1.8 10.2
Average 77.0 63.5 70.8
Table 4.4: 55+ Household Size by Mortgage Status in 2009
Seniors with Reverse or Home Equity
Conversion Mortgage Seniors with Mortgage Seniors with No
Mortgage
%
1 person 43.5 23.1 35.3
2 persons 46.5 50.7 51.8
3 persons 6.9 14.9 8.3
4 persons 3.1 11.2 4.6
Average 1.7 2.2 1.9

HOUSING TRENDS UPDATE FOR THE 55+ MARKET: NEW INSIGHTS FROM THE AMERICAN HOUSING SURVEY 65
Table 4.5: 55+ Household Type by Mortgage Status in 2009 Seniors with Reverse
or Home Equity Conversion Mortgage
Seniors with Mortgage
Seniors with No Mortgage
% Married Couple with Children 2.2 7.7 2.7
Married Couple without Children 38.4 55.0 51.6
One person—male 15.7 7.6 10.3
One person—female 27.7 15.6 25.0
Single Parent 1.4 3.5 1.6
Other 14.6 10.6 8.9
Reverse Mortgages Not Limited to the Most Educated Owners More than 20% or reverse mortgage borrowers have bachelor’s or advanced degrees, and additional 40% have some college education (see Table 4.6). Their educational attainment is similar to the education of seniors with no mortgages. Seniors with mortgages, who tend to be younger and have higher earnings, have a higher share of college graduates.
Table 4.6: Educational Attainment of the Household Head in 2009
Seniors with Reverse or Home Equity
Conversion Mortgage Seniors with
Mortgage Seniors with No
Mortgage
% Advanced Degree 10.3 16.9 11.2
Bachelor’s 11.3 19.7 13.9
Some College, but no Bachelor’s 39.8 23.9 32.3
High School Diploma, but no College 27.5 29.9 25.1
Some High School or Lower 11.2 9.7 17.4
Reverse Mortgage Borrowers Are As Ethnically Diverse As Other 55+ Homeowners As shown in Table 4.7, the shares of minorities with a reverse mortgage, or HECM, are very similar to their shares among 55+ homeowners with and without mortgages.

66
Table 4.7: 55+ Householder Race and Ethnicity by Mortgage Status in 2009
Seniors with Reverse or Home Equity
Conversion Mortgage Seniors with
Mortgage Seniors with No
Mortgage
% White, Non-Hispanic 78.6 77.4 84.5
Black, Non-Hispanic 6.8 10.3 7.0
Hispanics 10.0 7.4 5.5
Other race 4.6 4.9 3.0
Low-Income Homeowners Appear Likely Reverse Mortgage Customers There are no income requirements to qualify for a HECM. Table 4.8 shows that low-income homeowners are more likely to use reverse mortgages to supplement their income. More than a third of reverse mortgage borrowers earn less than $20,000, and close to 80% earn under $40,000. The average income of reverse mortgage borrowers is less than $35,000, while seniors with and without mortgages earn close to $81,000 and more than $53,000, respectively. Table 4.8: 55+ Household Income by Mortgage Status in 2009
Seniors with Reverse or Home Equity
Conversion Mortgage Seniors with
Mortgage Seniors with No
Mortgage
% Under $20K 36.2 12.2 25.7
$20K–$39.9K 40.6 19.0 28.8
$40K–$59.9K 9.6 18.4 16.6
$60K–$79.9K 8.6 13.7 9.7
$80K–$99.9K 2.2 10.2 7.0
$100K–$149.9K 1.1 15.0 7.2
$150K+ 1.7 11.6 5.0
Average $34,693 $80,768 $53,252
The Median Value of Homes with Reverse Mortgages Is Close to $225,000, Similar to Mortgage-Free Homes FHA does not set any limits on the value of homes qualifying for a HECM. However, the amount that can be borrowed is based on the lower of the appraised value, sales price or the FHA HECM mortgage limit of $625,500, as of 2010. As Table 4.9 shows, more than half of all seniors with reverse mortgages have homes that are valued between $100,000 and $250,000.

HOUSING TRENDS UPDATE FOR THE 55+ MARKET: NEW INSIGHTS FROM THE AMERICAN HOUSING SURVEY 67
Table 4.9: Home Value by Mortgage Status, 2008–2009
Seniors with Reverse or Home Equity
Conversion Mortgage Seniors with
Mortgage Seniors with No
Mortgage
% Under $100K 12.4 18.0 27.9
$100–$149.9K 23.9 15.7 16.9
$150–$249.9K 31.3 25.5 24.1
$250–$349.9K 12.1 15.3 12.7
$350–$499.9K 11.6 12.2 9.0
$500K+ 8.7 13.3 9.3
Median $224,955 $285,507 $230,979
Length of Stay and Mortgage Status of Reverse Mortgage Borrowers Substantial Share of Mortgage-Free Owners and Reverse Mortgage Borrowers Have Been in Their Homes Less Than 10 Years On average, reverse mortgage borrowers and seniors without mortgages stayed in their homes much longer, 24 and close to 27 years respectively, compared to 55+ homeowners who are still paying down their mortgage, 15.6 years (see Table 4.10). However, there is a substantial share of these seniors who have been in their homes for less than 10 years. More than a quarter of reverse mortgage borrowers and almost 20% of mortgage-free seniors have been in their homes for less than 10 years. These are likely households who made their recent home purchases with cash on hand or other savings. As of January 1, 2009, reverse mortgages can be used to buy a home, so the share of recent movers with reverse mortgages is likely to rise even higher over time.
Table 4.10: Length of Stay in Current Home by Mortgage Status, 2008–2009 Seniors with Reverse
or Home Equity Conversion Mortgage
Seniors with Mortgage
Seniors with No Mortgage
Less than 5 years 11.5 21.0 10.5
5 to less than 10 14.9 19.6 9.2
10 to less than 15 12.3 15.3 9.9
15 to less than 20 10.0 12.9 9.4
20 to less than 25 10.9 11.0 8.9
25 to less than 30 7.8 6.3 7.9
30 to less than 35 6.9 6.5 12.8
35 or more years 25.8 7.4 31.5
Average Length of Stay 24.4 15.6 26.6

68
Reverse Mortgage Borrowers in 55+ Communities
Reverse Mortgage Borrowers Can Be Found in Active Adult Communities
According to Table 4.11, more than a third of all reverse mortgage borrowers live in 55+ communities, with roughly 7% residing in age-qualified active adult and 29% in other 55+ communities.
Table 4.11: Distribution of 55+ Owners by Community Type and Presence of Mortgage, 2008–2009
Seniors with Reverse or Home Equity
Conversion Mortgage
Seniors with Mortgage
Seniors with No Mortgage
%
Age-Qualified Active Adult 6.9 2.7 3.9
Owners in Other 55+ Communities 29.4 21.8 27.1
55+ Owners not in Communities 63.7 75.5 69.0

HOUSING TRENDS UPDATE FOR THE 55+ MARKET: NEW INSIGHTS FROM THE AMERICAN HOUSING SURVEY 69
Chapter 5
55+ Housing Market Shares and Projections Close to One-Fifth of All Home Buyers Are Age 55+ Table 5.1 shows how much of various housing market segments 55+ customers and communities account for in three market segments: all 55+ households, 55+ households moving into age-qualified active adult communities, and 55+ households moving into “other” 55+ communities (non-age-qualified, but where most residents are 55+). The numbers in the table represent shares of the total market. For example, the first number in “All 55+” column is 12.2%, which means that 55+ households account for about 12% of the households that change addresses and move into a different housing unit in a given year (see Table 5.2 for the market demand data). The number moving into rental units includes those moving into units that benefit from government subsidies. Given the nature of custom homes, which are built on an individual customer’s lot, there is a question about whether or not a custom home built in an age-qualified community is conceptually valid. The 55+ households have somewhat different tendencies than younger customers. Because older households are more likely to buy homes—and especially to buy new homes—55+ households account for almost 19% of the home-buying market, and more than 21% of the market for new homes. Among buyers, older customers have a somewhat greater tendency to “buy” custom homes5, so 55+ households account for more than 24% of the market for new custom homes. Reflecting the ever-increasing number of Baby Boomers reaching the 55+ criteria for age-qualified communities, the shares of 55+ households have been on the rise across all home buyer categories through 2007, but took a pause and even declined a bit in 2009. As shown in Table 5.1, 55+ (age-qualified and other 55+) communities account for almost 6% of the home-buying market, thus suggesting that most of 55+ home buyers are moving into communities that are not classified as 55+ communities.

70
Table 5.1: Trends in 55+ Housing Market Shares 2001 2003 2005 2007 2009
Age
55+
Age
-Qua
lifie
d
Oth
er 5
5+
Com
mun
ity
Age
55+
Age
-Qua
lifie
d
Oth
er 5
5+
Com
mun
ity
Age
55+
Age
-Qua
lifie
d
Oth
er 5
5+
Com
mun
ity
Age
55+
Age
-Qua
lifie
d
Oth
er 5
5+
Com
mun
ity
Age
55+
Age
-Qua
lifie
d
Oth
er 5
5+
Com
mun
ity
% All recent movers 12.2 1.7 2.5 13.2 1.7 2.3 14.1 2.0 2.7 14.8 2.2 2.5 14.0 2.1 2.6
Movers into rental units 9.7 2.0 1.7 10.8 2.0 1.6 11.4 2.4 1.7 12.1 2.4 1.7 11.9 2.3 1.9
Home buyers 16.3 1.2 3.7 17.0 1.3 3.6 18.2 1.3 4.3 19.3 1.8 3.9 18.5 1.5 4.1
Existing home buyers
15.0 0.9 3.4 16.4 0.9 3.6 17.6 1.1 4.3 18.1 1.3 4.1 18.0 1.4 4.5
New home buyers 20.9 2.3 4.7 19.4 2.8 3.5 20.9 2.3 4.1 23.9 3.7 3.5 21.3 2.3 2.2
New for-sale home buyers 19.3 3.1 4.2 19.1 3.0 3.6 20.0 2.6 3.8 22.2 4.2 3.4 20.1 2.8 1.9
New custom home buyers 24.3 0.7* 5.9 26.1 0.0* 1.9 24.3 1.1* 5.5 29.3 2.1* 3.8 24.4 0.7* 3.0
The “*” shown in cells for buyers of new homes in age-qualified communities indicates that the number of observations in this cell is too small to distinguish from zero.

HOUSING TRENDS UPDATE FOR THE 55+ MARKET: NEW INSIGHTS FROM THE AMERICAN HOUSING SURVEY 71
Table 5.2: Trends in 55+ Housing Market Demand
*There are very few observations in the cells for age-qualified custom homes. There is also a question of whether or not it makes to talk about custom homes, which are built on an individual customer’s lot, being in age-qualified communities.
2001 2003 2005 2007 2009
Age 55+ All recent movers 1,631,774 1,777,656 2,042,602 2,084,086 1,839,972
Movers into rental units 807,295 897,785 988,233 1,065,641 1,062,818
Home buyers 824,479 879,872 1,054,370 1,018,445 777,155
Existing home buyers 593,257 686,104 819,407 750,937 627,448
New home buyers 231,223 193,768 234,963 267,509 149,707
New for-sale home buyers 148,947 183,135 176,722 187,656 102,115
New custom home buyers 82,276 10,633 58,242 79,853 47,592
Age-Qualified All recent movers 225,498 227,556 287,396 310,052 271,432
Movers into rental units 163,139 162,908 210,969 213,872 208,337
Home buyers 62,359 64,648 76,427 96,181 63,095
Existing home buyers 36,369 36,209 50,752 55,141 47,230
New home buyers 25,991 28,439 25,675 41,040 15,865
New for-sale home buyers 23,704 28,439 23,037 35,261 14,494
New custom home buyers 2,287* 0* 2,639* 5,779* 1,372
Other 55+ Community All recent movers 332,035 317,061 393,085 358,301 339,716
Movers into rental units 145,409 129,965 146,339 150,746 167,024
Home buyers 186,627 187,096 246,746 207,555 172,693
Existing home buyers 134,098 151,905 200,418 168,202 157,165
New home buyers 52,529 35,191 46,328 39,353 15,528
New for-sale home buyers 32,611 34,405 33,169 29,086 9,771
New custom home buyers 19,918 786 13,160 10,268 5,757

72
In 2011, Only About 54,000 Housing Starts Are Projected in 55+ Communities The housing industry is currently going through its most severe downturn since the Census Bureau began producing statistics on new construction shortly after World War II. NAHB’s current housing forecast for 2011 calls for 655,000 single-family housing starts, 149,000 multi-family starts, 455,000 new single-family home sales, and 5.11 million existing single-family home sales. Even though these numbers represent a housing activity beginning its rebound in 2010, the recovery will still be relatively weak in historical perspective. The number of single-family starts in the 2011 forecast is still down 62% from the high point of more than 1.7 million in 2007. Projections for the 55+ market generally follow the trends for the overall forecast, but also take into account the rising trends in 55+ market shares, driven largely by underlying population dynamics. The annual 55+ projection estimates reported in Table 5.3 are generated by applying the trends in the 55+ population shares and the AHS percentages to NAHB’s forecast of housing activity for calendar year 2010–2012. The 2011 estimates show that housing units sold to or occupied by 55+ households will account for about 184,000 housing starts, with about 149,000 of these single-family, and 54,000 in communities that are either age-qualified or otherwise occupied primarily by 55+ customers. The estimates also show that 55+ customers account for almost 100,000 of the projected new single-family sales, and almost 950,000 of the projected existing single-family homes sales in 2011. All these numbers are projected to increase in 2011, but from the very weak levels shown in the 2010 forecast. Table 5.3: 55+ Housing Market Projections
2010 2011 2012
Total Sold to or Occupied
by 55+ Households
In Age-Qualified or Other 55+
Communities
Total Sold to or Occupied
by 55+ Households
In Age-Qualified or Other 55+
Communities
Total Sold to or Occupied
by 55+ Households
In Age-Qualified or Other 55+
Communities
Housing Starts 138,699 41,489 184,232 53,997 270,399 78,726
Single-Family 109,079 26,409 149,054 36,087 220,736 53,442
Multi-Family 29,620 15,080 35,178 17,909 49,663 25,284
New Single-Family Existing Sales 71,047 20,809 98,685 28,905 148,290 43,434
Sales of Existing Single-Family Homes 792,041 246,650 945,716 294,506 1,110,031 345,675

HOUSING TRENDS UPDATE FOR THE 55+ MARKET: NEW INSIGHTS FROM THE AMERICAN HOUSING SURVEY 73
Appendix Additional Tables Table 1.16(a): Overall Rating of Current Community in 2009: Single-Family Detached Households
Age of Household Head Under 55 55 or Older
Under 45
45 to 54 55 to 64 65 to 74 75+ Total 55+
% % 1 0.6 0.5 0.4 0.5 0.5 0.5
2 0.5 0.3 0.3 0.3 0.3 0.3
3 0.9 0.6 0.6 0.4 0.3 0.5
4 1.2 1.2 0.9 0.9 0.6 0.8
5 5.4 4.5 4.5 3.8 4.0 4.2
6 5.8 4.5 4.1 3.7 3.4 3.8
7 15.0 13.6 12.1 10.7 9.1 10.9
8 30.2 29.0 29.0 25.0 24.0 26.6
9 17.7 19.1 18.6 18.3 17.3 18.2
10 22.6 26.8 29.5 36.5 40.6 34.3
Average: SF Detached 8.0 8.2 8.3 8.5 8.6 8.4
(On a scale of 1 to 10; 1=worst, 10=best) Table 1.16(b): Overall Rating of Current Home in 2009: Single-Family Detached Households
Age of Household Head Under 55 55 or Older
Under 45
45 to 54 55 to 64 65 to 74 75+ Total 55+
% % 1 0.4 0.3 0.3 0.3 0.4 0.3
2 0.2 0.2 0.2 0.1 0.1 0.1
3 0.4 0.2 0.3 0.2 0.0 0.2
4 0.7 1.0 0.7 0.6 0.4 0.6
5 4.1 3.6 3.2 2.5 3.6 3.1
6 4.6 3.9 3.2 3.1 2.6 3.0
7 15.8 12.6 10.7 8.4 6.9 9.1
8 31.8 28.9 27.9 24.6 24.1 26.0
9 17.6 19.5 18.6 19.5 17.0 18.5
10 24.5 29.8 34.9 40.6 44.9 39.0
Average: SF Detached 8.2 8.4 8.5 8.7 8.8 8.7
(On a scale of 1 to 10; 1=worst, 10=best)

74
Table 1.16(c): Overall Rating of Current Community in 2009: Multi-Family Households
Age of Household Head Under 55 55 or Older
Under 45
45 to 54 55 to 64 65 to 74 75+ Total 55+
% % 1 1.6 1.1 1.5 0.4 0.5 0.9
2 1.1 1.6 0.6 0.4 0.2 0.4
3 1.7 1.7 1.2 0.7 0.4 0.8
4 3.1 2.6 2.0 1.4 0.4 1.3
5 8.8 9.2 8.9 7.7 4.9 7.3
6 8.5 7.4 7.0 5.2 3.2 5.3
7 18.0 16.0 14.6 11.2 8.2 11.6
8 27.5 27.2 25.7 27.1 22.4 25.0
9 13.6 14.7 14.7 15.0 15.8 15.1
10 16.0 18.6 23.8 31.0 43.9 32.3
Average: Multi-Family 7.5 7.6 7.8 8.2 8.7 8.2
(On a scale of 1 to 10; 1=worst, 10=best)
Table 1.16(d): Overall Rating of Current Home in 2009: Multi-Family Households
Age of Household Head Under 55 55 or Older
Under 45
45 to 54 55 to 64 65 to 74 75+ Total 55+
% % 1 1.0 0.8 0.8 0.6 0.4 0.6
2 0.6 0.8 0.4 0.2 0.2 0.3
3 1.4 1.2 1.2 0.5 0.2 0.7
4 2.0 1.7 1.8 0.4 0.6 1.0
5 7.8 7.4 6.8 6.2 3.3 5.5
6 8.0 6.1 6.8 5.1 3.3 5.2
7 21.2 18.2 15.7 10.0 8.2 11.7
8 29.8 30.0 27.1 26.0 24.2 25.9
9 12.4 13.2 14.7 17.0 17.0 16.1
10 15.9 20.8 24.7 34.0 42.9 33.1
Average: Multi-Family 7.6 7.8 7.9 8.4 8.7 8.3
(On a scale of 1 to 10; 1=worst, 10=best)

HOUSING TRENDS UPDATE FOR THE 55+ MARKET: NEW INSIGHTS FROM THE AMERICAN HOUSING SURVEY 75
Endnotes
1 For purposes of this report, single-family attached units are included in multi-family. The total number of units in the
single-family attached category is relatively small, and including them in the multi-family total impacts the multi-family
tabulations only slightly. In practice, multi-family town homes and single-family attached units are often difficult to
distinguish from each other, even for an expert observer.
2 Paul Emrath, “On the Waterfront: Still the Most Valuable Location,” Housing Economics, January, 2006.
http://www.nahb.org/generic.aspx?sectionID=734&genericContentID=69665&channelID=311. The statistical
model used to generate the result can also be accessed on line interactively:
http://www.nahb.org/generic.aspx?sectionID=784&genericContentID=32911.
3 U.S. Census Bureau, Construction Reports, Series C-25, New One Family Homes Sold.
4 For more information, see the U.S. Department of Housing and Urban Development Web site,
http://www.hud.gov/offices/hsg/sfh/hecm/hecmhome.cfm.
5 Custom homes are defined as those built on the customer’s lot, with the owner either hiring a general contractor or
in some cases functioning as the general contractor himself or herself. Technically, these homes do not go through
a sale in the same sense as a spec home in a residential subdivision, but for simplicity, this chapter includes people
who acquire new custom homes among the home buyers.

www.MatureMarketInstitute.com200 Park Avenue, New York, NY
MMI00166(0111) © 2012 Metropolitan Life Insurance Company L0212241257[exp0115]
Mature MarketI N S T I T U T E
®