Embed Size (px)
Citation preview

A Quarterly Overview of Socioeconomic & Housing Trends in Minneapolis
third quarter 2013
Vol. 12 No. 3
2013
Minneapolis Trends
Highlights for the third quarter of 2013 change from
3Q-13 2Q-13 3Q-12
Labor force 219,777 residents
Residents employed 208,547
Unemployment rate 5.1%
New residential permitted units 1,220 units
Permitted residential conversions, remodels and additions
174 buildings
$ 25.2 million
Permitted non-residential conversions, remodels and additions
178 buildings
$ 63.8 million
Residential units demolished 51 units
Rental vacancy rate 1.9 %
Average rent in inflation-adjusted dollars $ 1,041
Residential units soldTraditional
Lender-mediated1,340 units
301 units
Median sale price of residential unitsTraditional
Lender-mediated$ 219,900
$ 96,000
Foreclosures 195
Condemned and vacant buildings 606
Minneapolis CBD office vacancy rate 16.7 %
Minneapolis CBD retail vacancy rate 11.6 %
Highlights for the first quarter of 2013 – Jobs and wages 1Q-13 4Q-12 1Q-12
Number of jobs 296,909 employees
Wages in inflation-adjusted dollars $ 1,358

Minneapolis Trends
third quarter 2013
Contents
Economic indicators 3
Labor force 4
Jobs 5
Wages 8
Definitions & sources 12
Development indicators 13
New construction 14
Cost of residential construction 15
Conversions, remodels, and additions 16
Major construction projects 20
Demolitions 21
Definitions & sources 22
Housing stock & the real estate market 24
Apartment vacancy rates & average rents 25
Residential sales 30
Foreclosures 32
Condemned & vacant buildings 34
Office space 35
Retail space 37
Industrial space 39
Definitions & sources 41

3Minneapolis Trends, 3rd Quarter 2013
Employment grew at a slightly slower rate than the labor force this past quarter.
The resulting unemployment rate is higher than the previous quarter at 5.1%. In
comparison with the same quarter last year, over 3,400 more city residents were
working.
As of the first quarter 2013 there were 296,909 jobs in Minneapolis, more than
4,000 (1.4 percent) fewer than the previous quarter, and nearly 8,000 more (2.7
percent) than the same quarter of the previous year.
During the last 12-month period, the metro and state added jobs, at a pace of 2.0
and 1.9 percent respectively.
Average inflation adjusted wages for first quarter 2013 were up 0.9 percent from
the same period a year before. Inflation adjusted wages in the metro and state fell at
rates of -0.9 and -0.8 percent respectively during the same period.
Economic indicators

4Minneapolis Trends, 3rd Quarter 2013
Table 1: LABOR FORCE, EMPLOYMENT AND UNEMPLOYMENT not seasonally adjusted
3Q-12 4Q-12 1Q-13 2Q-13 3Q-13
Minneapolis
Labor Force 218,184 216,753 215,868 219,377 219,777
Employment 205,104 205,365 204,542 208,412 208,547
Unemployment rate 6.0% 5.3% 5.2% 5.0% 5.1%
Metro area
Labor Force 1,631,197 1,623,066 1,620,025 1,641,577 1,641,111
Employment 1,538,827 1,540,779 1,532,804 1,561,805 1,562,813
Unemployment rate 5.7% 5.1% 5.4% 4.9% 4.8%
Source: Minnesota Department of Employment and Economic Development (DEED) – Labor Market Information
* For metro area definition, see page 12.
3Q-12 4Q-12 1Q-13 2Q-13 3Q-13
250,000
250,000
200,000
150,000
100,000
50,000
0
Source: Minnesota Department of Employment and Economic Development (DEED) – Labor Market Information
Labor force
Figure 1: AVERAGE EMPLOYMENT – Minneapolis not seasonally adjusted
During the second quarter 400 people (a 0.2 percent increase) joined the labor force, while 135 additional residents (a 0.1 percent increase) were working. As a result, the unem-ployment rate increased from 5.0 percent in the second quarter of 2013 to 5.1 percent in the third quarter of 2013.
The metro area experienced a decrease in the labor force and an increase in employment. This resulted in a decrease in the unemploy-ment rate from the previous quarter to 4.8 percent.
Figure 2: AVERAGE EMPLOYMENT – Metro area* not seasonally adjusted
3Q-12 4Q-12 1Q-13 2Q-13 3Q-13
2,000,000
1,600,000
1,200,000
800,000
400,000
0
Source: Minnesota Department of Employment and Economic Development (DEED) – Labor Market Information
* For metro area definition, see page 12

5Minneapolis Trends, 3rd Quarter 2013
Table 2: AVERAGE NUMBER OF JOBS BY INDUSTRY – Minneapolis1
1Q-2012 2Q-2012 3Q-2012 4Q-2012 1Q-2013 Change from 1Q-12 - 1Q-13
Total, All Industries 288,990 297,296 299,306 301,044 296,909 (4,135)
Construction 4,777 5,375 5,869 5,407 5,045 (362)
Manufacturing 13,402 13,597 13,717 13,504 13,063 (441)
Utilities 2,798 2,841 2,856 2,803 2,844 41
Wholesale Trade 8,233 8,441 8,598 8,516 8,752 236
Retail Trade 13,359 15,039 14,827 14,542 13,801 (741)
Transportation and Warehousing 6,841 6,778 6,677 6,756 6,685 (71)
Information 10,511 10,496 10,556 10,682 10,555 (127)
Finance and Insurance 27,057 27,035 27,132 27,051 27,021 (30)
Real Estate and Rental and Leasing 9,034 9,154 9,304 9,305 9,293 (12)
Professional and Technical Services 31,946 32,393 32,761 33,006 33,234 228
Management of Companies and Enterprises 18,342 18,845 19,393 19,743 19,893 150
Administrative and Waste Services 14,955 15,973 16,278 15,955 13,830 (2,125)
Educational Services 30,307 30,331 28,836 31,380 31,374 (6)
Health Care and Social Assistance 49,206 49,572 50,358 51,671 52,348 677
Arts, Entertainment, and Recreation 4,663 5,437 5,304 4,638 4,791 153
Accommodation and Food Services 22,384 23,974 24,188 24,390 23,054 (1,336)
Other Services, Ex. Public Admin 9,422 9,944 9,672 9,735 9,379 (356)
Public Administration 11,530 11,786 12,716 11,769 11,767 (2)
Source: Minnesota Department of Employment and Economic Development (DEED) – Minnesota Quarterly Census, Employment and Wages
1 Natural resource-based industries and agriculture, fishing, and forestry employment are not shown in the table. Some industry numbers may not be disclosed because of privacy issues, so totals do not add up. Table reflects latest revision by Minnesota Department of Employment and Economic Development.
Jobs

6Minneapolis Trends, 3rd Quarter 2013
Jobs
As of first quarter 2013, the number of jobs located in Minneapolis was 296,909, a 1.4 percent decrease from the previous quarter. In comparison with the same quarter in 2012, the number of jobs increased by 2.7 percent (approximately 8,000 jobs).
Note that some of the increases or de-creases of jobs in Table 2 are subject to seasonal variations. For example, construc-tion grows during the spring and summer but drops in the winter.
12 month change – 1st quarter 2012 to 1st quarter 2013
Sectors which gained the most jobs:
Construction grew by 268 jobs, a 5.6 percent increase.
Wholesale Trade grew by 519 jobs, a 6.3 percent increase.
Management of Companies and Enterprises grew by 1,551 jobs, a 8.5 percent increase.
Health Care and Social Assistance grew by 3,142 jobs, a 6.4 percent increase.
Sectors which experienced greatest job losses:
Manufacturing lost 339 jobs, a 2.5 percent decrease.
Transportation and Warehousing lost 156 jobs, a 2.3 percent decrease.
Administrative and Waste Ser-vices lost 1,125 jobs, a 7.5 percent decrease.
Quarter to quarter change – 4th quarter 2012 to 1st quarter 2013
Sectors which gained the most jobs:
Health Care and Social Assistance grew by 677 jobs, a 1.3 percent increase.
Wholesale Trade grew by 236 jobs, a 2.8 percent increase.
Arts, Entertainment, and Rec-reation grew by 153 jobs, a 3.3 percent increase.
Sectors which experienced greatest job losses:
Construction lost 362 jobs, a 6.7 percent decrease.
Manufacturing lost 441 jobs, a 3.3 percent decrease.
Retail Trade lost 741 jobs, a 5.1 percent decrease.
Administrative and Waste Services lost 2,125 jobs, a 13.3 percent de-crease.
Accommodation and Food Ser-vices lost 1,336 jobs, a 5.5 percent decrease.
As shown in Figure 3, the city, metro area, and state all gained jobs over the twelve-month period. The city’s job base increased by 2.7 percent, more than the 2.0 and 1.9 percent increased experienced at the metro area and state level.
Of the sectors posting growth over this period, Management of Companies and Enterprises was the fastest growing sector in the city at over 8.5 percent, while it grew at a slower rate in the metro area and the state. In addition to management of companies, health care and wholesale trade industries grew in the city faster than in either the metro or state.
Of the economic sectors losing jobs in the city, manufacturing, finance and insurance, and administrative and waste services decreased in the city, but grew or held steady in the metro and state.
In transportation/warehousing, jobs decreased in all three geographic areas.
JobsJobsJobs

-15% -10% -5% 0% +5% +10% +15% +20% +25% +30% +35% +40%
Total, All Industries
Mgnt of Co / Enterprises
Health Care / Soc. Assist.
Wholesale Trade
Construction
Profl /Techl Serv.
Educational Services
Retail Trade
Accommodation/ Food Serv.
RE / Rental / Leasing
Arts, Entert./ Rec
Public Administration
Utililies
Information*
Finance & Insurance
Other Services
Transport./ wrhsng
Manufacturing
Admin. / Waste Serv.
-15% -10% -5% 0% +5% +10% +15% +20% +25% +30% +35% +40%
Source: Minnesota Department of Employment and Economic Development (DEED)
Minneapolis industries are sorted from high to low For metro area definition, see page 12
7Minneapolis Trends, 3rd Quarter 2013
Figure 3: JOBS –1Q-12 to 1Q-13 percentage change
Jobs
2.0%1.9%
Minneapolis
Metro
Minnesota
2.7%

8Minneapolis Trends, 3rd Quarter 2013
Wages
Table 3: AVERAGE WEEKLY WAGE – Minneapolis1 in current dollars
1Q-2012 2Q-2012 3Q-2012 4Q-2012 1Q-2013Change from
1Q-12 - 1Q-13
Total, All Industries $ 1,319 $ 1,152 $ 1,150 $ 1,276 $ 1,358 $ 39
Construction $ 1,143 $ 1,206 $ 1,129 $ 1,194 $ 1,141 $ (2)
Manufacturing $ 1,175 $ 1,103 $ 1,098 $ 1,355 $ 1,116 $ (59)
Utilities $ 2,643 $ 1,628 $ 1,572 $ 1,807 $ 2,424 $ (219)
Wholesale Trade $ 1,339 $ 1,215 $ 1,204 $ 1,406 $ 1,449 $ 110
Retail Trade $ 537 $ 481 $ 503 $ 516 $ 532 $ (5)
Transportation and Warehousing $ 1,014 $ 915 $ 984 $ 962 $ 1,029 $ 15
Information $ 1,402 $ 1,312 $ 1,276 $ 1,357 $ 1,494 $ 92
Finance and Insurance $ 2,925 $ 1,734 $ 1,737 $ 2,069 $ 3,151 $ 226
Real Estate and Rental and Leasing $ 2,223 $ 1,239 $ 1,417 $ 1,369 $ 2,161 $ (62)
Professional and Technical Services $ 1,678 $ 1,683 $ 1,685 $ 2,231 $ 1,683 $ 5
Management of Companies and Enterprises $ 2,213 $ 1,993 $ 1,963 $ 1,801 $ 2,308 $ 95
Administrative and Waste Services $ 680 $ 636 $ 659 $ 696 $ 693 $ 13
Educational Services $ 1,012 $ 1,133 $ 1,082 $ 1,188 $ 1,055 $ 43
Health Care and Social Assistance $ 938 $ 950 $ 934 $ 991 $ 947 $ 9
Arts, Entertainment, and Recreation $ 915 $ 1,378 $ 1,389 $ 1,046 $ 917 $ 2
Accommodation and Food Services $ 386 $ 384 $ 387 $ 399 $ 382 $ (4)
Other Services, Ex. Public Admin $ 608 $ 586 $ 618 $ 657 $ 606 $ (2)
Public Administration $ 1,278 $ 1,223 $ 1,162 $ 1,269 $ 1,260 $ (18)
Source: Minnesota Department of Employment and Economic Development (DEED) – Minnesota Quarterly Census, Employment
1 Natural resources and agriculture, fishing and forestry employment are not counted. Some industry numbers may not be disclosed because of privacy issues.
The average weekly wage in Minneapolis in the first quarter of 2013 was $1,358, a 3.0 percent increase in non-adjusted dollars from the previous year, and a 0.9 percent increase when accounting for inflation.
The majority of sectors saw a weekly wage increase in non-adjusted dollars over the previous year. Finance and Insurance saw the highest average weekly wages increase at 226 dollars (7.7 percent). The highest percentage wage increase occurred in the Wholesale Trade sector at 8.2 percent. (110 dollars).

9Minneapolis Trends, 3rd Quarter 2013
Wages
Figure 4: AVERAGE WEEKLY WAGES – 1Q-12 to 1Q-13 in inflation-adjusted dollars
In general, jobs in Minneapolis command higher average weekly wages than the metropolitan area or the state. When com-pared to the same quarter last year, average weekly wages in inflation-adjusted dollars rose in the city while wages dropped in both the metro area and state.
$ 1400
1300
1200
1100
1000
900
800
700
600
500
400
300
200
100
0
1Q-12 2Q-12 3Q-12 4Q-12 1Q-13
$ change 1Q-12 to
1Q-13
% change 1Q-12 to
1Q-13
Minneapolis $ 1,346 $ 1,176 $ 1,168 $ 1,295 $ 1,358 $ 12 0.9%
Metro area $ 1,162 $ 1,042 $ 1,045 $ 1,129 $ 1,152 ($ 10) -0.9%
Minnesota $ 1,009 $ 925 $ 926 $ 997 $ 1,005 ($ 4) -0.4%
Source: Minnesota Department of Employment and Economic Development (DEED)
For conversion factors, see page 12
1Q12 2Q-12 3Q12 4Q-12 1Q-13
Minneapolis
Metro
Minnesota

10Minneapolis Trends, 3rd Quarter 2013
Wages
Source: Minnesota Department of Employment and Economic Development (DEED)
* For conversion factors, see page 12
Minneapolis industries are sorted from high to low. For metro area definition, see page 12
Minneapolis
Metro
Minnesota
Figure 5: AVERAGE WEEKLY WAGES –1Q-12 to 1Q-13 percent change in inflation-adjusted dollars*
-10% -8% -6% -4% -2% 0% +2% +4% +6% +8% +10% +12%
Total, All Industries
Wholesale Trade
Finance and Insurance
Information
Management of Companies
Educational Services
Administrative and Waste Services
Transportation and Warehousing
Health Care and Social Assistance
Professional and Technical Services
Arts and Recreation
Construction
Other Services
Retail Trade
Accommodation and Food Services
Public Administration
RE / Rental / Leasing
Manufacturing
Utilities -10% -8% -6% -4% -2% 0% +2% +4% +6% +8% +10% +12%

11Minneapolis Trends, 3rd Quarter 2013
Wages
Most industry sectors tracked for this report saw average non-adjusted weekly wages increase in Minneapolis this quarter. Wholesale Trade, Finance and Insur-ance, and Information sectors saw the largest percentage increases over the previ-ous year. In the metro and state geogra-phies average weekly wages also increased in most sectors, as shown in Figure 5 above. Of sectors experiencing the great-est growth, management of companies, construction, and public administration industry wages grew at a faster pace in the metro area and state than in Minneapolis.
Wholesale Trade saw the largest increase in wages in Minneapolis with 8.2 percent growth, while wages for the industry rose at rates of 3.4 and 3.2 percent respectively in the metro area and state.

12Minneapolis Trends, 3rd Quarter 2013
Labor Force, Employment and Unemployment: Labor force, employment and
unemployment by place of residence are based on monthly figures from the Minnesota
Department of Employment and Economic Development. Labor force means the
number of non-farm workers employed or looking for a job at a given time. For
complete definitions go to: http://www.bls.gov/opub/hom/pdf/homch1.pdf
Metro area: The following counties make up the seven-county metropolitan area:
Anoka, Carver, Dakota, Hennepin, Ramsey, Scott, and Washington.
Jobs and wages: Average number of jobs by industry is based on data of all
establishments covered under the Unemployment Insurance System, which includes
about 97 percent of Minnesota employment. Some categories of employment are
excluded, including sole proprietors, self-employed people, railroad workers, elected
government officials and others working on a commission basis. Tables 2 and 3 show
data to two digits by industry in the North American Industry Classification System
(NAIC) for Minneapolis, the seven-county metropolitan area, and Minnesota. To see
how the “digits” work, go to http://www.census.gov/eos/www/naics/
Inflation-adjusted figures: Values reported in table 3 are expressed in current dollars
(not adjusted for inflation). For analysis purposes, however, text is based on these table
values converted to constant (inflation-adjusted) dollars based on the U.S. Bureau of
Labor Statistics’ Consumer Price Index (CPI) for all urban consumer goods in the
Minneapolis-Saint Paul, Minnesota-Wisconsin statistical metropolitan area and the
Midwest urban areas. For the third quarter of 2012, dollars have been converted with
an index reflecting the CPI for the second half of 2012 and second half of 2011 with
2012 as a base year for Minneapolis and metro area, and the state. To look at the
indexes go to: http://www.bls.gov/cpi/ then go to databases and to “All urban consumers
(current series).”

13Minneapolis Trends, 3rd Quarter 2013
Development indicators1,220 new construction residential units were permitted this quarter, most of
them rental units in multifamily buildings, although the number of single family
permits increased again to the highest total for a quarter since 2007 with 46
permits issued.
The city permitted 87.8 percent more multifamily units this quarter than last
quarter, and 2.1 percent more permits than were issued in the same quarter of
2012.
Twenty-seven residential and commercial projects valued at least $1 million were
permitted this quarter, totaling $280.3 million. The largest single project was a new
317- unit, 6 story apartment building called The Marshall.

14Minneapolis Trends, 3rd Quarter 2013
Table 4: NEW RESIDENTIAL UNITS PERMITTED
3Q-12 4Q-12 1Q-13 2Q-13 3Q-13
Single-family
City 21 24 22 33 46
Metro area 1,422 1,262 1,059 1,665 1,720
Multifamily
City 1,150 1,508 487 625 1,174
Metro area 1,691 2,634 497 832 1,903
Total Units
City 1,171 1,532 509 658 1,220
Metro area* 3,113 3,896 1,556 2,497 3,623
Source: U.S. Census Bureau, based on estimated number of permits with imputation
* Estimated number of permits with imputation: The Census Bureau estimates that about 8 percent of the total number of units permitted are undereported by counties in the metro area.
For metro area definition, see page 12
Figure 6: NEW RESIDENTIAL UNITS PERMITTED – Minneapolis
3Q-12 4Q - 12 1Q-13 2Q-13 3Q-13
Source: U.S. Census Bureau, and Minneapolis CPED
1600
1400
1200
1000
800
600
400
200
0
Minneapolis city permitting of single- and multi-family units increased both over the pre-vious quarter and the same quarter in 2012. New residential unit permitting activity in the metro area also increased over the previous quarter and the same quarter last year.
Figure 6 shows the last five quarters of residen-tial unit permits issued in Minneapolis. These numbers do not include remodeling and conversion projects, which are discussed on page 25. Remodeling and conversion projects are reported separately from new building permits, and appear in Table 5 and Map 2.
Single family
Multi family

15Minneapolis Trends, 3rd Quarter 2013
Map 1: NEW CONSTRUCTION PERMITS – 3Q-13
Source: Minneapolis CPED
Forty-six single-family dwellings were permit-ted, many of them in the southwestern part of the city, near Lake Harriet and Lake Calhoun. Ten new multi-family buildings totaling 1,174 units were also permitted this quarter, most of them located near Downtown and University of Minnesota.
Two new non-residential buildings were also permitted, both on Glenwood Avenue in the North Sector.

$ 500,000
450,000
400,000
350,000
300,000
250,000
200,000
150,000
100,000
50,000
0
$ 250,000
200,000
150,000
100,000
50,000
0 3Q-12 4Q-12 1Q-13 2Q-13 3Q-13
3Q-12 4Q-12 1Q-13 2Q-13 3Q-13
16Minneapolis Trends, 3rd Quarter 2013
Figure 7: SINGLE-FAMILY CONSTRUCTION COST per unit
The forty-six new single-family homes permit-ted this quarter had estimated construction costs ranging from $137,000 to $960,000, with a median of $287,819.
The average single-family construction cost in the city decreased by 2.2 percent this quarter in comparison with last quarter, and decreased 10.3 percent compared with the same quarter last year. In the metro area permitted work increased in value by 3.5 percent over the previous quarter and increased 10.0 percent compared with the same quarter last year.
This quarter the average construction cost of multifamily units decreased in both the city and metro from the previous quarter while costs increased when compared to the same quarter last year.
3Q-12 4Q-12 1Q-13 2Q-13 3Q-13
Minneapolis $ 124,285 $ 141,456 $ 161,739 $ 190,674 $ 146,171
Metro area $ 119,944 $ 120,911 $ 160,705 $ 151,448 $ 135,280
Source: U.S. Census Bureau
Values in table are not adjusted for inflation For metro area definition, see page 12
Figure 8: MULTIFAMILY CONSTRUCTION COST per unit
3Q-12 4Q-12 1Q-13 2Q-13 3Q-13
Minneapolis $ 323,310 $ 310,675 $ 314,971 $ 296,341 $ 289,921
Metro area $ 277,800 $ 298,970 $ 303,261 $ 295,165 $ 305,517
Source: U.S. Census Bureau
Table values are not adjusted for inflation For metro area definition, see page 12
MetroMinneapolis
MetroMinneapolis

17Minneapolis Trends, 3rd Quarter 2013
Table 5: PERMITTED CONVERSIONS, REMODELS AND ADDITIONS projects $50,000 +
3Q-12 4Q-12 1Q-13 2Q-13 3Q-13
Remodels
Number of buildings 166 158 122 170 167
Total Value $28,342,503 $52,359,744 $13,879,186 $27,775,695 $22,976,086
Conversions and additions2
Number of buildings 5 7 5 4 7
Net number of units 259 386 -3 0 0
Total value $5,230,523 $46,997,482 $1,689,000 $9,092,809 $2,186,020
Total Residential1
Number of buildings 171 165 127 174 174
Value $33,573,026 $99,357,226 $15,568,186 $36,868,504 $25,162,106
Total non-residential1
Number of buildings3 150 141 150 156 178
Value $98,747,731 $41,099,298 $102,497,433 $75,028,318 $63,817,628
Source: Minneapolis CPED
1 Residential and non-residential building listings may include structural work, build-outs (other than new building build-outs) and other improvements.2 Residential conversions consist of a change in uses (e.g. from an office building to residential apartments) or subdividing or consolidating residential units. 3 Types of non-residential buildings vary, including parking ramps, communication equipment, and public works, commercial or industrial buildings.
The City saw the same number of residen-tial remodeling, conversion and addition projects with a value of $50,000 or more this quarter when compared to the previ-ous quarter, but the overall value of those permits decreased.
Commercial permit numbers were up when compared to the previous quarter, while the value of those permits decreased.

18Minneapolis Trends, 3rd Quarter 2013
Map 2 RESIDENTIAL CONVERSIONS, REMODELS & ADDITIONS – 3Q-13 projects $50,000 +
Source: Minneapolis CPED
Approximately three-quarters of residential remodeling permits valued over $50,000 in the second quarter were attributed to single-family dwellings. These permits accounted for approximately 75 percent of the residential remodel permit value in the city as well.
19Minneapolis Trends, 3rd Quarter 2013
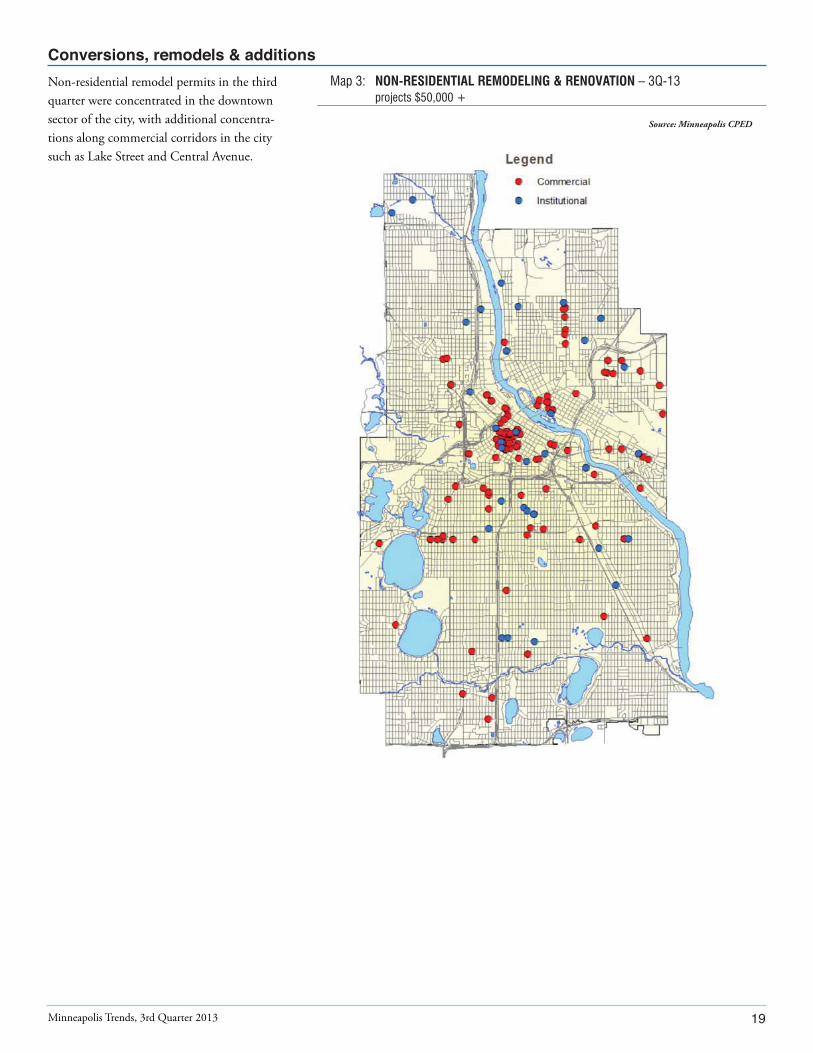
Non-residential remodel permits in the third quarter were concentrated in the downtown sector of the city, with additional concentra-tions along commercial corridors in the city such as Lake Street and Central Avenue.
Map 3: NON-RESIDENTIAL REMODELING & RENOVATION – 3Q-13 projects $50,000 +
Source: Minneapolis CPED

20Minneapolis Trends, 3rd Quarter 2013
Table 6: MAJOR PERMITTED MINNEAPOLIS CONSTRUCTION PROJECTS projects $1,000,000+
Description Address Neighborhood Projected CPED Involvement 1
The Marshall: New 317-unit, 6-story apartment building 1313 5th St SE Marcy Holmes $ 56,494,761
Junction Flats: New 182-unit, 6-story apartment building 643 5th St N North Loop $ 42,064,147
The Bridges: New 210-unit, 11-story apartment building 928 University Ave SE Marcy Holmes $ 34,424,887
New 3-story building for counseling center 1100 Glenwood Ave Sumner- Glenwood $ 31,447,385
Metro Park East: New 194-unit apartment project consisting of 3 separate 5-story buildings 2635 4th St SE Prospect Park-
East River Road $ 28,495,047
The Cooperage: New 60-unit, 4-story senior apartment building 2304 Snelling Ave Seward $ 17,772,039
Velo Apartments: New 106-unit, 6-story apartment building 115 2nd St N North Loop $ 11,892,900
The 700 on Washington: New 98-unit, 6-story apartment building 700 Washington Ave SE University of Minnesota $ 11,443,571
New 1-story office building 1307 Glenwood Ave Harrison $ 6,800,000
Pillsbury A Mill Redevelopment: Prep work for conversion of structure to 158-unit apartment building 401 Main St SE Marcy Holmes $ 6,000,000
Interior remodel for Hennepin County Human Services building 1001 Plymouth Ave N Near-North $ 3,917,376
Mechanical improvements 2600 10th Ave S Midtown Phillips $ 3,539,537
Remodel of commercial buildings for artisan food production facility 1401 Marshall St Ne Sheridan $ 3,439,260
Office tenant improvements 917 Nicollet Mall Downtown West $ 3,402,531
Office building remodel 106 Washington Ave N North Loop $ 2,545,000
Office building remodel 800 Washington Ave N North Loop $ 2,440,846
Office building remodel 701 4th Ave S Downtown West $ 1,887,000
New 12-unit apartment building 629 15th Ave Se Marcy Holmes $ 1,700,000
Office building remodel 330 2nd Ave S Downtown West $ 1,674,603
Conversion of vacant building to 22-unit apartment building 115 5th St NE Nicollet Island-East Bank $ 1,235,200
Commercial roof replacement 2600 10th Ave S Midtown Phillips $ 1,186,927
Single-family dwelling remodel and addition 4315 Fremont Ave S East Harriet $ 1,180,000
Office building remodel 800 Lasalle Ave Downtown West $ 1,083,168
Restaurant and brewhouse remodel 701 Washington Ave N North Loop $ 1,064,926
Office building remodel 315 27th Ave SE Prospect Park-East River Road $ 1,061,482
Hospital lab remodel 2600 10th Ave S Midtown Phillips $ 1,044,000
Target Center concession stand remodel 600 1st Ave N North Loop $ 1,018,821
Source: Minneapolis CPED
* Includes more than one permit at one address1 Community Planning and Economic Development (CPED) assists selected construction projects in the City with land assembly, property purchases, grants for land remediation, and financial
assistance through bonds or small loans for businesses. All development projects regardless of financial involvement receive technical assistance from CPED on land use and regulatory matters.
The following list shows major projects permitted in Minneapolis in the third quarter of 2013. The dollar amounts only
reflect projected construction cost (not land acquisition or soft costs) for permits issued.

21Minneapolis Trends, 3rd Quarter 2013
Demolitions
Map 4: DEMOLITIONS –3Q-13
Source: Minneapolis CPED
Residential demolitions increase this quarter when compared to the previous quarter, as well as when compared to the same quarter from 2012.
Demolitions continue to be focused in the southwest sector of the city as sites are prepped for the construction of new single-family dwellings.
160
150
140
120
100
80
60
40
20
0 3Q - 12 4Q - 12 1Q - 13 2Q-13 3Q-13
Source: Minneapolis CPED
Figure 9: RESIDENTIAL UNITS DEMOLISHED – Minneapolis
Units
3Q-12 50
4Q-12 40
1Q-13 162
2Q-13 31
3Q-13 51

22Minneapolis Trends, 3rd Quarter 2013
Building permits for new construction: Permits represent construction projects (residential and non-residential) approved by the City. Typically there is a time lag between issuing a permit and actual construction.
Table four and figures six to eight are based on monthly figures for the city of Minneapolis and metropolitan area provided by the U.S. Census Bureau. For mapping purposes, data on new building construction, remodels, conversions and demolitions for the city are based on permit information by address from the City’s Regulatory Services Department. Numbers from the U.S. Census Bureau and Minneapolis Regulatory Services may differ slightly for the same period because of a time-lag in reporting. Census Bureau numbers do not include additions, remodels or demolitions.
Single-family buildings have only one unit in the building.
Multifamily buildings have two or more units in the building, except when noted that triplexes and duplexes are counted separately (in that case, multifamily buildings have four or more units.)
Cost of residential construction is based on the cost developers report on permit requests for their projects.
Construction cost per unit refers to the total construction cost reported divided by the number of units permitted during the period considered.
Non-residential buildings include any kind of use except residential. Cost is based on the amount the developer reports to the City’s Regulatory Services Department.
Building permits for residential remodeling, additions and conversions: Table five and maps two and three are based on data from the City of Minneapolis CPED Department. Information includes all City-approved projects for remodeling, additions and conversions with a value of $50,000 or more.
Building permits for demolitions: These data were obtained from the City of Minneapolis CPED Department and include all partially or totally demolished buildings. The multifamily building category includes rentals and condominiums.
Maps – Building uses: Categories listing the uses of buildings are based on descriptions from their permits. The following categories are used:
Map 1 – New buildings
Single-family: means detached dwellings.
Other residential: means buildings with two (duplex and double bungalow), three (triplex) or more residential units, including townhouses.
Mixed-use residential: means buildings with other uses in addition to residential, for example, residential and commercial; residential and retail and/or office.
Non-residential use: means all buildings that do not have a residential component. It also includes structures such as communications towers and skyways.

23Minneapolis Trends, 3rd Quarter 2013
Map 2 – Residential remodels with a construction cost of $50,000 or more:
Single-family includes all detached single-family dwellings with permits for renovations, additions or improvements.
Other residential includes all residential buildings that are not detached single-family dwellings, including units in buildings with two or more units. It includes remodeling or build-outs of one or more individual units and remodeling of the entire building.
Conversions consist of the construction of new residential units in non-residential buildings such as factories, warehouses, hotels and others and remodeling of a building for residential uses. It does not include conversions of apartment units to condominiums. It includes changing two or more residential units into a single residence or the subdivision of a single unit into several.
Map 3 – Non-residential remodels, additions and improvements with a cost of $50,000 or more
Commercial includes offices, warehouses, factories, restaurants and retail buildings in general. It may be a build-out of an office space or several floors, or it may be the remodeling of an entire building. Several tenant remodels at one address are considered one project, i.e. renovation of 33 S. Sixth St. (the former Multifoods Tower) downtown.
Institutional: This category includes hospitals, clinics, churches, schools, nursing homes, correctional centers and any other institutional use.
Transportation related includes parking, skyways and bus and rail terminals.
Map 4 – Demolitions
Single family buildings: All detached residential buildings with one unit in the structure.
Multi-family buildings: All residential buildings with 2 or more units in the structure.
Non-residential: All non-residential buildings and structures

24Minneapolis Trends, 3rd Quarter 2013
Residential and Commercial Real Estate Market
The average apartment vacancy rate in Minneapolis decreased from 2.2 percent in
the second quarter of 2013 to 1.9 percent in the third quarter of 2013.
The number of traditional housing sales increased by 27.3 percent over the same
quarter last year, while lender-mediated sales decreased by 24.8 percent. Average
prices on traditional housing sales decreased by 2.3 percent from the previous
quarter, and increased 2.8 percent over the same quarter last year.
The number of condemned, boarded and vacant buildings in the city decreased to
606, the lowest quarterly total since the second quarter of 2007.
Foreclosure sales also continue to decline, by 9.7 percent from the previous quarter,
and 50.9 percent when compared to the same time last year.
The office vacancy rate in the Minneapolis central business district (CBD) hovered
between 13.9 percent and 16.8 percent this quarter, depending on the firm
reporting. Retail vacancies ranged from 11.6 percent to 33.6 percent – the large
discrepancy is explained by differences in reporting method by firm.

Figure 10: RENTAL VACANCY RATES in percent
5%
4
3
2
1
0
3Q-12 4Q-12 1Q-13 2Q-13 3Q-13
Source: GVA Marquette Advisors Reports, based on a sample survey of market-rate rental properties
10 units and more (subsidized and small multifamily rentals are excluded.)
Recorded data for the last month of the quarter For metro area definition, see page 41
25Minneapolis Trends, 3rd Quarter 2013
Table 7: VACANCY RATE AND AVERAGE RENT in current dollars
3Q-12 4Q-12 1Q-12 2Q-13 3Q-13
Minneapolis
Units surveyed 16,183 16,831 16,483 16,923 17,500
Vacant units 263 296 312 368 332
Average rent $ 995 $ 1,006 $ 1,017 $ 1,037 $ 1,041
Vacancy rate 1.6% 1.8% 1.9% 2.2% 1.9%
Metro area
Units surveyed 111,204 115,974 112,383 114,715 117,356
Vacant units 2,977 3,353 3,091 2,675 2,897
Average rent $ 951 $ 957 $ 966 $ 979 $ 984
Vacancy rate 2.7% 2.9% 2.8% 2.3% 2.5%
Source: GVA Marquette Advisors Reports, based on a sample survey of market-rate rental properties 10 units and more (subsidized and small multifamily rentals are excluded.)
Recorded data for the last month of the quarter For metro area definition, page 41
The Minneapolis vacancy rate for multifam-ily rental housing decreased this quarter from 2.2 percent last quarter to 1.9 percent. In the metro area, the vacancy rate was 2.5 percent, a modest increase from last quarter’s observed 2.3 percent vacancy rate.
Metro
Minneapolis

$ 1,200
1,000
800
600
400
200
0
26Minneapolis Trends, 3rd Quarter 2013
At $1,041, Minneapolis average rent in infla-tion-adjusted dollars increased slightly when compared to both last quarter and the same quarter of last year. In the metro area average rent was $984, increasing slightly from both the previous quarter over the previous year.
The vacancy rate rose in Downtown, South-west, and north sectors from last quarter, and decreased in South and East. Compared to the same quarter last year the vacancy rate rose in all sectors except for East. The largest change from year to year occurred in Downtown, where the vacancy rate increased from 1.7 percent in the third quarter of 2012, up to 3.3 percent in the third quarter of 2013.
* For conversion factors, see page 41.
3Q-12 4Q-12 1Q-13 2Q-13 3Q-13
Downtown 1.7% 2.2% 2.2% 3.0% 3.3%
Southwest 1.6% 1.5% 2.1% 1.9% 2.2%
North 1.1% 2.8% 1.7% 1.7% 2.2%
South 1.8% 1.6% 1.5% 2.7% 2.0%
East 1.5% 1.7% 1.2% 1.4% 0.9%
Source: GVA Marquette Advisors Reports, based on a sample survey of market-rate rental properties 10 units and more (subsidized and small multifamily rentals are excluded.)
Recorded data for the last month of the quarter* For sector definitions, see page 41.
3Q-12 4Q-12 1Q-13 2Q-13 3Q-13
8%
6
4
2
0
3Q-12 4Q-12 1Q-13 2Q-13 3Q-13
Minneapolis $ 1,015 $ 1,027 $ 1,029 $ 1,035 $ 1,041
Metro area $ 970 $ 977 $ 977 $ 977 $ 984
Source: GVA Marquette Advisors Reports, based on a sample survey of market-rate rental properties 10
units and more (subsidized and small multifamily rentals are excluded.)
Recorded data for the last month of the quarter* For conversion factors, see page 41
Figure 11: AVERAGE APARTMENT RENT in current dollars
Figure 12: VACANCY RATES BY MINNEAPOLIS GEOGRAPHIC SECTORS* in percent
In inflation-adjusted dollars
MetroMinneapolis
3Q-12 4Q-12 1Q-13 2Q-13 3Q-13
SouthDowntown
NorthEast
Southwest

$ 1,400
1,200
1,000
800
600
400
200
0
27Minneapolis Trends, 3rd Quarter 2013
Figure 13: AVERAGE MONTHLY RENT BY CITY GEOGRAPHIC SECTORS* in inflation-adjusted dollars
Average rents increased over the previous quarter in all sectors of the city. On a year to year basis, rents increased the most in Down-town Minneapolis (4.7 percent, or 61 dollars), followed by South (4.6 percent, or approxi-mately 41 dollars), and North (4.4 percent, or 40 dollars).
* For conversion factors, see page 42.
3Q-12 4Q-12 1Q-13 2Q-13 3Q-13
3Q-12 4Q-12 1Q-13 2Q-13 3Q-13
Downtown $ 1,282 $ 1,312 $ 1,318 $ 1,338 $ 1,343
Southwest $ 917 $ 922 $ 923 $ 926 $ 927
North $ 889 $ 893 $ 884 $ 877 $ 929
South $ 901 $ 921 $ 920 $ 936 $ 942
East $ 902 $ 899 $ 877 $ 855 $ 883
Source: GVA Marquette Advisors Reports, based on a sample survey of market-rate rental properties 10 units and more (subsidized and small multifamily rentals are excluded.)
Recorded data for the last month of the quarter. * For conversion factors, see page 42.
** For City sectors definition see page 41.
South
Downtown
North
Southwest
East

6%
5
4
3
2
1
0
$ 1,500
1,250
1,000
750
500
250
0
28Minneapolis Trends, 3rd Quarter 2013
3Q-12 4Q-12 1Q-13 2Q-13 3Q-13
Figure 14: RENTAL VACANCY RATE – Minneapolis in percent by apartment type
Figure 15: AVERAGE UNIT MONTHLY RENT – Minneapolis in inflation-adjusted dollars by apartment type
3Q-12 4Q-12 1Q-13 2Q-13 3Q-13
3Q-12 4Q-12 1Q-13 2Q-13 3Q-13
Studio 1.5% 1.5% 2.2% 2.1% 0.0%
One-bedroom 1.6% 1.6% 1.5% 2.0% 2.0%
Two-bedroom 1.7% 2.1% 2.2% 2.4% 2.5%
Three-bedroom 1.7% 3.4% 1.7% 0.9% 2.2%
Source: GVA Marquette Advisors Reports, based on a sample survey of market-rate rental properties 10 units and more (subsidized and small multifamily rentals are excluded.)
Recorded data for the last month of the quarter
3Q-12 4Q-12 1Q-13 2Q-13 3Q-13
Studio $ 746 $ 750 $ 754 $ 757 $ 757
One-bedroom $ 933 $ 953 $ 953 $ 959 $ 962
Two-bedroom $ 1,294 $ 1,264 $ 1,304 $ 1,321 $ 1,335
Three-bedroom $ 1,434 $ 1,418 $ 1,434 $ 1,421 $ 1,446
Source: GVA Marquette Advisors Reports, based on a sample survey of market-rate rental properties 10 units and more (subsidized and small multifamily rentals are excluded.)
Recorded data for the last month of the quarter.
When compared to the previous quarter, vacancy rates increased for two-bedroom and three-bedroom apartment types, held steady for one-bedrooms, and decreased to essentially zero vacancy for studio apartments.
In comparison with the third quarter of 2012, vacancy rates increased for all apartment types except for studios.
Average rents in inflation-adjusted dollars held steady this quarter for studio apartments, and increased for one-, two-, and three-bedroom unit types.
Average rents increased from a year ago in inflation-adjusted dollars for all unit types.
* For conversion factors, see page 42.
Three-bedroomsTwo-bedroomsStudioOne-bedroom
Three-bedrooms
Studio
Two-bedrooms
One-bedroom

$1,500
1,250
1,000
750
500
250
0 3Q-12 4Q-12 1Q-13 2Q-13 3Q-13
29Minneapolis Trends, 3rd Quarter 2013
3Q-12 4Q-12 1Q-13 2Q-13 3Q-13
Studio $ 724 $ 731 $ 735 $ 735 $ 738
One-bedroom $ 845 $ 854 $ 853 $ 853 $ 859
Two-bedroom $ 1,054 $ 1,059 $ 1,060 $ 1,061 $ 1,066
Three-bedroom $ 1,335 $ 1,351 $ 1,347 $ 1,344 $ 1,352
Source: GVA Marquette Advisors Reports, based on a sample survey of market-rate rental properties 10 units and more (subsidized and small multi family rentals are excluded.)
Recorded data for the last month of the quarter For metro area definition, see page 41
Figure 16: APARTMENT RENTAL VACANCIES – Metro area in percent by apartment type
3Q-12 4Q-12 1Q-13 2Q-13 3Q-13
3Q-12 4Q-12 1Q-13 2Q-13 3Q-13
Studio 2.2% 2.2% 2.8% 2.3% 2.0%
One-bedroom 2.4% 2.6% 2.4% 2.2% 2.2%
Two-bedroom 2.8% 3.1% 3.0% 2.4% 2.8%
Three-bedroom 3.3% 3.8% 3.1% 2.7% 2.5%
Source: GVA Marquette Advisors Reports, based on a sample survey of market-rate rental properties 10 units and more (subsidized and small multifamily rentals are excluded.)
Recorded data for the last month of the quarter For metro area definition, see page 41
Figure 17: AVERAGE APARTMENT MONTHLY RENT – Metro area in inflation-adjusted dollars by apartment type
In the metro area vacancy rates decreased for studio and three-bedroom apartments, held steady for one-bedrooms, and increased for two-bedroom units when compared to the previous quarter.
Compared with the third quarter of 2012, vacancy rates were down or held steady for all unit types in the metro area.
Average rents in inflation-adjusted dollars in the metro increased slightly for all types of apartments since the previous quarter – post-ing increases of no more than 0.8 percent. In comparison with third quarter of 2012, average rents also increased for all apartment types.
6%
4
2
0
Three-bedrooms
Studio
Two-bedroomsOne-bedroom
Three-bedrooms
Studio
Two-bedrooms
One-bedroom

30Minneapolis Trends, 3rd Quarter 2013
Residential sales
Overall sale of housing units increased slightly from the previous quarter. This included an increase in traditional sales (8.6 percent increase) and a decrease in lender-mediated sales (24.4 percent decrease). Median prices for the quarter decreased for both traditional sales and lender-mediated sales. The median price of traditional sales in Minneapolis ($219,000) fell slightly behind that of the region ($224,000).
Over a twelve-month period, the number of traditional housing sales increased by 27.3 percent, while lender-mediated sales decreased by 24.8 percent, continuing to reflect the declining number of distressed properties in the market.
Median sale prices increased for traditional sales (2.8 percent) and decreased for lender-mediated sales (3.9 percent). This quarter lender-mediated sales including foreclosures were 18 percent of all housing sales in the city, while they accounted for 28 percent of sales in the same quarter of the previous year.
Figure 18: TRADITIONAL AND LENDER-MEDIATED CLOSED SALES AND MEDIAN SALE PRICE– Minneapolis
$ 250,000
200,000
150,000
100,000
50,000
0 3Q-12 4Q-12 1Q-13 2Q-13 3Q-13
1,250
1,000
750
500
250
0
units
3Q-12 4Q-12 1Q-13 2Q-13 3Q-13
Traditional sales 1,053 902 686 1,234 1,340
Lender-mediated sales 400 406 383 398 301
Traditional sales median price $ 214,000 $ 200,000 $ 198,500 $ 225,000 $ 219,900
Lender-mediated median price $ 99,900 $ 91,260 $ 92,750 $ 112,000 $ 96,000
Source: Minneapolis Area Association of Realtors (MAAR)
Tra-ditional median price
Lender- mediated median price
Traditional sales
Lender mediated sales

3Q-12 4Q-12 1Q-13 2Q-13 3Q-13
31Minneapolis Trends, 3rd Quarter 2013
Figure 19: TRADITIONAL AND LENDER-MEDIATED CLOSED SALES AND MEDIAN SALE PRICE – Metro area*
$ 250,000
200,000
150,000
100,000
50,000
0
12,000
10,000
8,000
6,000
4,000
2,000
0
units
Residential sales
3Q-12 4Q-12 1Q-13 2Q-13 3Q-13
Traditional sales 8,998 7,533 5,595 11,307 12,758
Lender-mediated sales 4,843 4,333 3,903 4,027 3,408
Traditional sales median price $ 215,000 $ 210,950 $ 205,000 $ 224,000 $ 224,000
Lender-mediated median price $ 124,900 $ 125,000 $ 125,900 $ 138,000 $ 139,501
Source: Minneapolis Area Association of Realtors (MAAR)
* The metro area in this chart refers to the 13 counties covering Minnesota and Wisconsin served by the Minneapolis Area Association of Realtors.
For metro area definition, see page 41
In the metro area sales were up from the previ-ous quarter by 5.4 percent. Traditional sales increased 12.8 percent, while lender-mediated sales declined by 15.4 percent. Median sale prices held steady for traditional sales, and decreased by 1.1 percent for lender-mediated sales.
Lender mediated sales
Traditional median price
Lender- mediated median price
Traditional sales

32
Table 8: FORECLOSURE PROPERTIES – Minneapolis by ward
3Q-12 4Q-12 1Q-13 2Q-13 3Q-13
Ward Percent Percent Percent Percent Percent
1 31 8% 31 10% 26 8% 18 8% 21 11%
2 9 2% 8 2% 7 2% 2 1% 2 1%
3 26 7% 28 9% 22 7% 12 6% 7 4%
4 91 23% 67 21% 68 22% 55 25% 50 26%
5 62 16% 33 10% 43 14% 25 12% 11 6%
6 10 3% 21 7% 16 5% 7 3% 10 5%
7 9 2% 14 4% 12 4% 6 3% 15 8%
8 42 11% 33 10% 27 9% 28 13% 14 7%
9 26 7% 23 7% 22 7% 19 9% 16 8%
10 16 4% 9 3% 10 3% 6 3% 10 5%
11 21 5% 20 6% 19 6% 14 6% 7 4%
12 42 11% 25 8% 28 9% 15 7% 25 13%
13 12 3% 10 3% 11 4% 9 4% 7 4%
Total 397 100% 322 100% 311 100% 216 100% 195 100%
Source: Hennepin County Sheriff’s Office. The data is subject to revision by the Sheriff’s Office; for complete and current foreclosure listings, please see the Hennepin County Sheriff’s website at. http://www4.co.hennepin.mn.us/webforeclosure/
MAP 5: PROPERTIES FORECLOSED – 3Q-13 by wards
This quarter 195 properties were sold at public auction, 9.7 percent fewer than the previous quarter, and 50.9 percent fewer than third quarter of 2012. This is the lowest count recorded since Minneapolis Trends began re-porting foreclosures in 2006. Wards 1, 4, and 12 accounted for 49 percent of total foreclo-sures in the city, with Ward 4 accounting for 26 percent of the total.
Source: Hennepin County
Data on foreclosures downloaded as of January 2013. The table and map do not take into account foreclosures recorded after the data was compiled, nor any properties later redeemed by the owner in the 6 month redemption period.
Minneapolis Trends, 2nd Quarter 2013

33Minneapolis Trends, 3rd Quarter 2013
Figure 20: RESIDENTIAL FORECLOSURES – Minneapolis in units
Foreclosures continued their steady decline since peaking in 2008. This quarter represents a new low foreclosure count since before the housing crisis started.
1,000
800
600
400
200
03Q-2007 3Q-2008 3Q-2009 3Q-2010 3Q-2011 3Q-2012 3Q-2013
Source: Hennepin County
Data for 2008 have been revised.

34Minneapolis Trends, 3rd Quarter 2013
Map 6: CONDEMNED AND VACANT BUILDINGS
Table 10: CONDEMNED AND VACANT BUILDINGS – Minneapolis as of the end of quarter
3Q-12 4Q-12 1Q-13 2Q-13 3Q-13
Boarded and condemned buildings 316 303 304 287 285
Vacant but not condemned 405 386 386 344 321
Total 721 686 686 631 606
Source: Minneapolis CPED
Note: About 98 percent of the buildings in the table are residential. Only buildings that have been registered as vacant with the City of Minneapolis Inspections Division are included.
Chapter 249 of City ordinances covers requirements for registering vacant buildings.
The total number of condemned, boarded and vacant buildings in the city decreased from the last quarter, and was 16 percent lower than at the end of third quarter of 2012. The number of condemned buildings dropped by 9.8 per-cent compared to third quarter last year, while the number of vacant but not condemned buildings decreased 20.7 percent. Condemned buildings have been decreasing more or less steadily since third quarter 2008. Many of the buildings have already been demolished due to an aggressive city policy to remove blighted buildings, while saving as many as possible for rehab.
Source: Minneapolis CPED

3Q-12 4Q-12 1Q-13 2Q-13 3Q-13
25%
20
15
10
5
0
25%
20
15
10
5
0
35Minneapolis Trends, 3rd Quarter 2013
The office vacancy rate was between 13.9 per-cent and 16.8 percent according to the above real estate firms. Pressure remains highest in the Class A market; there remain large blocks of vacant space in Class B and C properties.
The reported average direct vacancy rate in the metro area ranged between 15.4 percent and 17.5 percent, according to the above real estate firms. Like the Minneapolis CBD, demand in the office real estate market in the Twin Cities was higher for Class A properties, which were already experiencing short supply.
Figure 22: OFFICE SPACE VACANCY RATE – Metro area in percent
3Q-12 4Q-12 1Q-13 2Q-13 3Q-13
3Q 12 4Q 12 1Q 13 2Q 13 3Q 13
CB Richard Ellis 17.6% 17.1% 17.0% 17.0% 17.1%
Colliers 16.5% 16.1% 16.0% 15.4% 15.4%
NorthMarq 18.0% 18.0% 18.0% 17.5% 17.5%
Sources: CB Richard Ellis, Colliers and NorthMarq
See explanation of sources onpage 42
Figure 21: OFFICE SPACE VACANCY RATE – Minneapolis CBD in percent
3Q 12 4Q 12 1Q 13 2Q 13 3Q 13
CB Richard Ellis 16.2% 16.3% 16.4% 16.7% 16.7%
Colliers 14.6% 14.5% 14.3% 14.2% 13.9%
NorthMarq 16.1% 16.1% 16.1% 16.8% 16.8%
Sources: CB Richard Ellis, Colliers and NorthMarq
See explanation of sources on page 42
Colliers
CB Richard EllisColliers
CB Richard Ellis
NorthMarq
NorthMarq

36Minneapolis Trends, 3rd Quarter 2013
Figure 24: OCCUPIED OFFICE SPACE – rate of growth in percent
2%
1.0
0
– 1.0
-2.0 2Q-12 3Q-12 4Q-12 1Q-13 2Q-13
The average asking lease rate per square foot in the Minneapolis central business district (CBD) increased slightly this quarter, and was also higher than the third quarter of 2012. In the metro area rates were also up for the quarter but down when compared to the same quarter last year.
Between the second and third quarter in Downtown Minneapolis the rate of growth in occupied office space increased, while still being negative overall. The metro area experi-enced a decreased absorption rate in the third quarter of 2013.
3Q-12 4Q-12 1Q-13 2Q-13 3Q-13
Minneapolis CBD 0.2% -0.1% 1.1% -1.0% -0.5%
Metro area 0.6% 0.9% 1.3% -0.4% -0.5%
Source: CB Richard Ellis
Class A, B and C multi-tenant office buildings 30,000 square feet and larger
Figure 23: OFFICE AVERAGE ASKING LEASE PRICE in current dollars per square foot per year
$ 14
12
10
8
6
4
2
0
3Q-12 4Q-12 1Q-13 2Q-13 3Q-13
3Q-12 4Q-12 1Q-13 2Q-13 3Q-13
Minneapolis CBD $ 12.52 $ 12.46 $ 12.55 $ 12.63 $ 12.71
Metro area $ 12.08 $ 11.91 $ 11.86 $ 11.92 $ 11.98
Source: CB Richard Ellis
Class A, B and C multi-tenant office buildings 30,000 square feet and larger
Minneapolis CBD Metro area
Minneapolis CBD Metro area

12%
10
8
6
4
2
0
36 %
35
30
25
20
15
10
5
0
37Minneapolis Trends, 3rd Quarter 2013
Retail space
Figure 25: RETAIL VACANCY RATE – Minneapolis CBD in percent
The reported retail vacancy rate in the Min-neapolis CBD ranged between 11.6 and 33.6 percent. Block E and Gaviidae Common were removed from the CBRE reporting in the first quarter of 2013 as the future programming of those spaces are unknown or substantially not retail focused. Colliers adjusted their reporting based on similar information for this quarter. Note that large variations in the vacancy rate result from the relatively small amount of square feet of retail in the CBD, as well as differences in how the measurements are done.
The metro area vacancy rate this quarter ranged from 5.7 percent to 7.8 percent, with decreases reported over the last quarter from two of the three real estate firms referenced.
3Q-12 4Q-12 1Q-13 2Q-13 3Q-13
Figure 26: RETAIL VACANCY RATE – Metro area in percent
3Q-12 4Q-12 1Q-13 2Q-13 3Q-13
3Q 12 4Q 12 1Q 13 2Q 13 3Q 13
CB Richard Ellis 7.8% 7.7% 7.5% 7.4% 7.3%
Colliers 6.4% 6.2% 6.4% 6.2% 5.7%
Northmarq 8.9% 8.3% 8.3% 7.8% 7.8%
Sources: CB Richard Ellis, Colliers and NorthMarq
CB Richard Ellis and Colliers include all multi-tenant retail buildings 30,000 square feet and larger, and buildings under construction.
3Q 12 4Q 12 1Q 13 2Q 13 3Q 13
CB Richard Ellis 13.3% 13.6% 12.0% 12.2% 11.6%
Colliers 21.3% 25.6% 32.6% 36.1% 13.3%
NorthMarq 21.7% 26.8% 26.8% 33.6% 33.6%
Sources CB Richard Ellis and NorthMarq
Includes all multi-tenant retail buildings 30,000 square feet and larger, including buildings under construction.
CB Richard Ellis
NorthMarq
CB Richard Ellis
Colliers
NorthMarq
Colliers

3%
2
1
0
– 1
– 2
– 3
$ 35
30
25
20
15
10
5
0
3Q-12 4Q-12 1Q-13 2Q-13 3Q-13
38Minneapolis Trends, 3rd Quarter 2013
Figure 28: OCCUPIED RETAIL SPACE – rate of growth in percent
Retail space
3Q-12 4Q-12 1Q-13 2Q-13 3Q-13
Minneapolis CBD 0.0% -0.3% -19.5% -0.2% 0.7%
Metro area 0.3% -0.6% -0.5% 0.1% 0.1%
Source: CB Richard Ellis
Includes all multi-tenant retail buildings 30,000 square feet and larger, including buildings under construction.
Average asking lease price per square foot in the Minneapolis central business district (CBD) decreased since last quarter and was steady when compared to the same quarter last year.
In the metro area, average asking lease price also decreased over the previous quarter, and fell below asking prices from the same quarter in previous year. The gap in asking prices between the Minneapolis CBD and the rest of the region increased slightly, standing at 30.5 percent at the end of the third quarter of 2013.
Occupied retail space in the Minneapolis central business district (CBD) increased slightly this quarter as the market continues to react to the loss of space in Block E and Gaviidae Common.
Figure 27: RETAIL AVERAGE ASKING LEASE PRICE in current dollars per square foot per year
3Q-12 4Q-12 1Q-13 2Q-13 3Q-13
Minneapolis CBD $22.53 $22.53 $22.49 $22.85 $22.53
Metro area $17.87 $18.29 $18.33 $18.41 $17.26
Source: CB Richard Ellis
Includes all multi-tenant retail buildings 30,000 square feet and larger, including buildings under construction.
3Q-12 4Q-12 1Q-13 2Q-13 3Q-13
Minneapolis CBD Metro
Minneapolis CBD
Metro

10 %
8
6
4
2
0 3Q-12 4Q-12 1Q-13 2Q-13 3Q-13
$ 6
5
4
3
2
1
0
39Minneapolis Trends, 3rd Quarter 2013
The industrial space total vacancy rate in-creased over the previous quarter in both the Minneapolis and Midway areas, while decreas-ing in the Metro as a whole.
The average asking lease price for industrial space decreased the Metro area from the previ-ous quarter, increased in the Midway area, and held steady in the Minneapolis area.
3Q-12 4Q-12 1Q-13 2Q-13 3Q-13
Minneapolis $ 3.98 $ 4.02 $ 4.00 $ 3.95 $ 3.95
Midway* $ 4.12 $ 4.09 $ 4.05 $ 4.05 $ 4.13
Metro area $ 4.61 $ 4.65 $ 4.72 $ 4.57 $ 4.55
Source: CB Richard Ellis
Note: For Midway and Minneapolis, the industrial average asking lease rate is only for warehousingIncludes industrial buildings 100,000 square feet and larger, including buildings under construction. *Midway includes industrial areas of northeast Minneapolis and Saint Paul.
Figure 29: INDUSTRIAL VACANCY RATE in percent
Figure 30: INDUSTRIAL AVERAGE ASKING LEASE RATE in dollars per square foot per year
3Q-12 4Q-12 1Q-13 2Q-13 3Q-13
3Q-12 4Q-12 1Q-13 2Q-13 3Q-13
Minneapolis 5.0% 4.1% 3.4% 3.2% 3.4%
Midway* 6.8% 5.3% 4.6% 4.4% 4.5%
Metro area 7.2% 6.2% 5.9% 5.8% 5.6%
Source: CB Richard Ellis
Includes industrial buildings 100,000 square feet and larger, including buildings under construction. Market consists of bulk warehouses, office warehouses, office showrooms, and manufacturing and specialty buildings.
*Midway industrial area includes parts of Northeast Minneapolis and Saint Paul.
Minneapolis
Metro areaMidway*
Minneapolis
Metro area
Midway*

40Minneapolis Trends, 3rd Quarter 2013
3Q-12 4Q-12 1Q-13 2Q-13 3Q-13
Minneapolis 0.1% 0.2% -0.1% 0.3% -0.2%
Midway* 0.0% 1.6% 1.3% 0.2% 0.1%
Metro area 0.3% 1.0% 0.4% 0.2% 0.3%
Source: CB Richard Ellis
Includes all competitive industrial buildings 100,000 square feet and larger, including buildings under construction. Market consists of bulk warehouses, office
warehouses, office showrooms, and manufacturing and specialty buildings. *Midway includes industrial areas of northeast Minneapolis and Saint Paul.
Figure 31: OCCUPIED INDUSTRIAL SPACE – rate of growth in percent
2%
1
0
– 1
– 2
3Q-12 4Q-12 1Q-13 2Q-13 3Q-13
Industrial absorption rates decreased in the Minneapolis and Midway areas this quarter, while absorption increased in the Metro area.
MinneapolisMidway*Metro

41Minneapolis Trends, 3rd Quarter 2013
Housing Vacancy Rate: The vacancy rate is the percentage of unoccupied housing
units among the total number of housing units. Vacancy rates for the multifamily
rental market are calculated quarterly by GVA Marquette Advisors based on a
quarterly survey of properties in the Twin Cities metropolitan area.
City areas: : For data analysis purposes, GVA Marquette Advisors divides the city
into five sub-areas, according to the map below.
Note that we changed the Minneapolis sector names to reflect changes that GVA
Marquette made at the City’s request. South is now South-west; East is South, and
NE, SE and UMN is East. North remains North.
Median sale values: These values are based on home prices researched by the
Minneapolis Area Association of Realtors (MAAR).
Closed home sales: These values are based on home sales reported by the
Minneapolis Area Association of Realtors (MAAR). Closed sales mean that there
is an agreement to sell and steps have been taken toward that end. MAAR makes
a difference between traditional sales and lender-mediated sales. The first type
includes all sales that are neither foreclosures nor short sales. These two define the
lender-mediated sales.
Metro area definition: The Minneapolis Area Association of Realtors service area
includes 12 counties in Minnesota (Chisago, Anoka, Sherburne, Wright, Hennepin,
Ramsey, Washington, Dakota, Scott, Carver, Rice and Goodhue) and one county in
Wisconsin (St. Croix).
Foreclosure sales: These sales occur when property owners are deprived of the right
to keep their properties because of failure to make payments on a mortgage or other
contractual property fees, such as condominium association fees, when due. Data
on foreclosure sales are reported by the Hennepin County Sheriff to Hennepin
County Taxpayer Services Department and later sent to City of Minneapolis CPED
Research Division. Hennepin County’s methodology is to count all foreclosure
Sheriff’s sales categories (mortgage, assessments, associations, executions and
judgments). Data include only foreclosed properties in the City of Minneapolis that
were sold at public option in the specified time period.
Boarded and vacant buildings: A vacant property is a property identified as such
by City of Minneapolis inspectors; City Ordinance 249 requires the property’s
owner to register it as vacant. In addition to being vacant, the property could be
condemned as uninhabitable either for being boarded more than 60 days or because
of lack of maintenance. Data on boarded and vacant buildings are obtained from
the City Department of Regulatory Services.
North
Downtown
East

42Minneapolis Trends, 3rd Quarter 2013
Real estate statistics as reported by CB Richard Ellis () include office, retail and
industrial space vacancy rates, average asking lease price per square foot and absorption
of square feet for the Twin Cities metropolitan area, Minneapolis and Midway
(industrial space) or Minneapolis central business district (office and retail space). The
metro area includes several submarkets and may not coincide with definitions based on
jurisdictional boundaries. This quarter Minneapolis Trends also shows office and retail
vacancy rates reported by Colliers (), and Cushman & Wakefield-NorthMarq ()
Average asking lease rate: This is determined by multiplying the asking net
lease rate for each building by its available space, adding the products, then
dividing by the sum of all available space.
Average vacancy rate: This is determined by dividing the number of vacant
square feet by the net rentable area.
Rate of growth and absorption: This is the change in occupied square feet
from one quarter to the next, determined by subtracting vacant space (not
including sublets and shadow space) from the rentable space available.
Variations in reporting are due to differences in definitions and in the number,
frequency, and geographical location of buildings included in the surveys. Variations in
retail vacancy rates are more evident than in the case of office vacancy but also — and
particularly in the case of the Minneapolis CBD — the relatively small amount of retail
space compared to the overall metro inventory.
Inflation-adjusted figures: For the purpose of analyzing residential rent, text is based
on values converted to constant (inflation-adjusted) dollars based on the U.S. Bureau of
Labor Statistics’ Consumer Price Index (CPI) for housing in the Midwest urban areas
category size “class A” (more than 1.5 million people).

Minneapolis Community Planning & Economic Development
Beth Elliott, AICP
Principal Planner
City of Minneapolis
Department of Community Planning and Economic Development
105 Fifth Avenue South – Room 200
Minneapolis, MN 55401
Phone: (612) 673-2442
105 Fifth Avenue South – Room 200
Minneapolis, MN 55401
If you need this material in an alternative format please call 612-673-2162.
Deaf and hard-of-hearing persons may use a relay service to call 311 agents
at 612-673-3000. TTY users may call 612-673-2157 or 612-673-2626.
Attention – If you have any questions regarding this material please call 311.
Hmong – Ceeb toom. Yog koj xav tau kev pab txhais cov xov no rau koj dawb, hu
612-673-2800.
Spanish – Atención. Si desea recibir asistencia gratuita para traducir esta información,
llama 612-673-2700.
Somali – Ogow. Haddii aad dooneyso in lagaa kaalmeeyo tarjamadda macluumaadkani
oo lacag la’ aan wac 612-673-3500.