Embed Size (px)
Citation preview

A Quarterly Overview of Socioeconomic & Housing Trends in Minneapolis
third quarter 2014
Vol. 12 No. 3
2014
Minneapolis Trends
Highlights for the third quarter of 2014 change from
3Q-14 2Q-14 3Q-13
Labor force 221,106 residents
Residents employed 211,845
Unemployment rate 4.2%
New residential permitted units 409 units
Permitted residential conversions, remodels and additions
184 buildings
$ 29.6 million
Permitted non-residential conversions, remodels and additions
206 buildings
$ 124.2 million
Residential units demolished 56 units
Rental vacancy rate 2.1 %
Average rent in inflation-adjusted dollars $ 1,105
Residential units soldTraditional
Lender-mediated1,471 units
173 units
Median sale price of residential unitsTraditional
Lender-mediated$ 224,940
$ 124,500
Foreclosures 175
Condemned and vacant buildings 590
Minneapolis CBD office vacancy rate 15.1 %
Minneapolis CBD retail vacancy rate 10.9 %
Highlights for the first quarter of 2014 – Jobs and wages 1Q-14 4Q-13 1Q-13
Number of jobs 299,532 employees
Wages in inflation-adjusted dollars $ 1,401

Minneapolis Trends
third quarter 2014
Contents
Economic indicators 3
Labor force 4
Jobs 5
Wages 8
Definitions & sources 12
Development indicators 13
New construction 14
Cost of residential construction 15
Conversions, remodels, and additions 16
Major construction projects 20
Demolitions 21
Definitions & sources 22
Housing stock & the real estate market 24
Apartment vacancy rates & average rents 25
Residential sales 30
Foreclosures 32
Condemned & vacant buildings 34
Office space 35
Retail space 37
Industrial space 39
Definitions & sources 41

3Minneapolis Trends, 3rd Quarter 2014
Average employment and labor force numbers increased over the past quarter,
with employment growth outpacing the rate of labor force growth. The resulting
unemployment rate is lower than the previous quarter at 4.2%. In comparison with
the same quarter last year, over 3,000 more city residents were working.
As of the first quarter 2014 there were 299,532 jobs in Minneapolis, a decrease of
2.0 percent over the previous quarter, and 2,500 more (0.9 percent) than the same
quarter of the previous year. Over the same 12-month period, the metro and state
also added jobs at a similar pace of 0.9 and 1.0 percent respectively.
Average inflation adjusted wages for the first quarter 2014 were up 1.7 percent from
the same period a year before. Inflation adjusted wages in the metro area rose 2.0
percent while rising 1.3 percent at the state level during the same period.
Economic indicators

4Minneapolis Trends, 3rd Quarter 2014
Table 1: LABOR FORCE, EMPLOYMENT AND UNEMPLOYMENT not seasonally adjusted
3Q-13 4Q-13 1Q-14 2Q-14 3Q-14
Minneapolis
Labor Force 219,777 218,076 217,389 219,885 221,106
Employment 208,547 208,608 207,067 210,431 211,845
Unemployment rate 5.1% 4.3% 4.7% 4.3% 4.2%
Metro area
Labor Force 1,641,111 1,629,810 1,628,191 1,643,297 1,650,304
Employment 1,562,813 1,561,940 1,549,957 1,575,135 1,585,722
Unemployment rate 4.8% 4.1% 4.8% 4.1% 3.9%
Source: Minnesota Department of Employment and Economic Development (DEED) – Labor Market Information
* For metro area definition, see page 12.
3Q-13 4Q-13 1Q-14 2Q-14 3Q-14
250,000
250,000
200,000
150,000
100,000
50,000
0
Source: Minnesota Department of Employment and Economic Development (DEED) – Labor Market Information
Labor force
Figure 1: AVERAGE EMPLOYMENT – Minneapolis not seasonally adjusted
During the third quarter 1,221 residents (a 0.6 percent increase) joined the labor force; while over 1,414 more residents (a 0.7 percent increase) were working. As a result, the un-employment rate fell from 4.3 percent in the second quarter of 2014 to 4.2 percent in the third quarter of 2014.
The metro area also experienced an increase in the labor force accompanied by a larger increase in employment. This resulted in a decrease in the unemployment rate to 3.9 percent down from 4.1 percent in the previ-ous quarter.
Figure 2: AVERAGE EMPLOYMENT – Metro area* not seasonally adjusted
3Q-13 4Q-13 1Q-14 2Q-14 3Q-14
2,000,000
1,600,000
1,200,000
800,000
400,000
0
Source: Minnesota Department of Employment and Economic Development (DEED) – Labor Market Information
* For metro area definition, see page 12

5Minneapolis Trends, 3rd Quarter 2014
Table 2: AVERAGE NUMBER OF JOBS BY INDUSTRY – Minneapolis1
1Q-2013 2Q-2013 3Q-2013 4Q-2013 1Q-2014 Change from 1Q-13 - 1Q-14
Total, All Industries 296,999 302,839 305,275 305,655 299,532 2,533
Construction 5,061 5,490 6,145 5,860 5,313 252
Manufacturing 13,124 13,043 13,130 13,131 12,927 (197)
Utilities 2,844 2,879 2,913 2,845 2,758 (86)
Wholesale Trade 8,646 8,719 8,844 8,780 8,353 (293)
Retail Trade 13,845 15,102 15,138 14,871 14,073 228
Transportation and Warehousing 6,697 6,596 6,458 6,772 6,866 169
Information 9,363 9,264 10,721 10,740 10,877 1,514
Finance and Insurance 26,828 26,631 26,598 26,492 26,322 (506)
Real Estate and Rental and Leasing 9,389 9,297 9,241 8,962 8,737 (652)
Professional and Technical Services 33,244 33,441 33,737 33,849 34,158 914
Management of Companies and Enterprises 19,936 20,056 20,295 20,152 19,191 (745)
Administrative and Waste Services 13,802 14,718 15,099 14,833 13,932 130
Educational Services 31,373 31,406 29,356 31,596 31,372 (1)
Health Care and Social Assistance 52,434 53,433 54,369 55,232 54,726 2,292
Arts, Entertainment, and Recreation 4,798 5,385 5,329 4,667 4,794 (4)
Accommodation and Food Services 23,032 24,243 24,907 24,785 23,337 305
Other Services, Ex. Public Admin 9,410 9,739 9,768 9,664 9,509 99
Public Administration 11,767 11,928 13,031 12,245 12,118 351
Source: Minnesota Department of Employment and Economic Development (DEED) – Minnesota Quarterly Census, Employment and Wages
1 Natural resource-based industries and agriculture, fishing, and forestry employment are not shown in the table. Some industry numbers may not be disclosed because of privacy issues, so totals do not add up. Table reflects latest revision by Minnesota Department of Employment and Economic Development.
Jobs

6Minneapolis Trends, 3rd Quarter 2014
Jobs
As of the first quarter 2014, the num-ber of jobs located in Minneapolis was 299,532, a 2.0 percent decrease from the previous quarter. In comparison with the same quarter in 2013, the number of jobs increased by 0.9 percent (approximately 2,500 jobs).
Note that some of the increases or de-creases of jobs in Table 2 are subject to seasonal variations. For example, construc-tion grows during the spring and summer but drops in the winter.
12 month change – 1st quarter 2013 to 1st quarter 2014
Sectors which gained the most jobs:
Information grew by 1,514 jobs, a 16.4 percent increase.
Construction grew by 252 jobs, a 5.0 percent increase.
Health Care and Social Assistance grew by 2,292 jobs, a 4.4 percent increase.
Sectors which experienced greatest job losses:
Manufacturing lost 197 jobs, a 1.5 percent decrease.
Real Estate, Rental, and Leasing lost 652 jobs, a 6.9 percent decrease.
Wholesale Trade lost 293 jobs, a 3.4 percent decrease.
Quarter to quarter change – 4th quarter 2013 to 1st quarter 2014
Sectors which gained the most jobs:
Transportation and Warehous-ing grew by 94 jobs, a 1.4 percent increase.
Information grew by 137 jobs, a 1.3 percent increase.
Professional and Technical Serv-cies grew by 309 jobs, a 0.9 percent increase.
Sectors which experienced greatest job losses:
Construction lost 547 jobs, a 9.3 percent decrease.
Administrative and Waste Services lost 901 jobs, a 6.1 percent decrease.
Accommodation and Food Ser-vices lost 1,448 jobs, a 5.8 percent decrease.
As shown in Figure 3, the city, metro area, and state all gained jobs over the twelve-month period. The city’s job base increased by 0.9 percent over the previous twelve months while the metro area and state added jobs at a rate of 0.9 and 1.0 percent respectively.
Of the sectors posting growth over this period, Information was the fastest grow-ing sector in the city at 16.4 percent, while the industry saw job losses in both the Metro and state. In addition to health care, Construction and Health Case sectors grew at rates of 5.0 percent and 4.4 percent respectively over the previous twelve months.
Of the economic sectors losing jobs in the city, Wholesale Trade, Real Estate, Rental, and Leasing, and Management of Companies saw the greatest declines.
JobsJobsJobs

-10% -8% -6% -4% -2% 0% +2% +4% +6% +8% +10% +12%
Total, All Industries
Information*
Construction
Health Care / Soc. Assist.
Public Administration
Profl /Techl Serv.
Transport./ wrhsng
Retail Trade
Accommodation/ Food Serv.
Other Services
Admin. / Waste Serv.
Educational Services
Arts, Entert./ Rec
Manufacturing
Finance & Insurance
Utililies
Wholesale Trade
Mgnt of Co / Enterprises
RE / Rental / Leasing
-10% -8% -6% -4% -2% 0% +2% +4% +6% +8% +10% +12%
Source: Minnesota Department of Employment and Economic Development (DEED)
Minneapolis industries are sorted from high to low For metro area definition, see page 12
7Minneapolis Trends, 3rd Quarter 2014
Figure 3: JOBS –1Q-13 to 1Q-14 percentage change
Jobs
0.9%1.0%
Minneapolis
Metro
Minnesota
0.9%
16.2%
8Minneapolis Trends, 3rd Quarter 2014
Wages
Table 3: AVERAGE WEEKLY WAGE – Minneapolis1 in current dollars
1Q-2013 2Q-2013 3Q-2013 4Q-2013 1Q-2014Change from
1Q-13 - 1Q-14
Total, All Industries $ 1,358 $ 1,206 $ 1,169 $ 1,282 $ 1,401 $ 43
Construction $ 1,141 $ 1,222 $ 1,094 $ 1,252 $ 1,268 $ 127
Manufacturing $ 1,116 $ 1,097 $ 1,048 $ 1,220 $ 1,186 $ 70
Utilities $ 2,424 $ 1,777 $ 1,691 $ 1,898 $ 2,733 $ 309
Wholesale Trade $ 1,449 $ 1,337 $ 1,335 $ 1,514 $ 1,559 $ 110
Retail Trade $ 532 $ 497 $ 516 $ 539 $ 562 $ 30
Transportation and Warehousing $ 1,029 $ 927 $ 977 $ 961 $ 1,033 $ 4
Information $ 1,494 NA $ 1,316 $ 1,407 $ 1,530 $ 36
Finance and Insurance $ 3,151 $ 1,838 $ 1,850 $ 2,097 $ 3,357 $ 206
Real Estate and Rental and Leasing $ 2,161 $ 1,368 $ 1,465 $ 1,470 $ 2,424 $ 263
Professional and Technical Services $ 1,683 $ 1,719 $ 1,693 $ 2,227 $ 1,759 $ 76
Management of Companies and Enterprises $ 2,308 $ 2,283 $ 1,962 $ 1,769 $ 2,267 $ (41)
Administrative and Waste Services $ 693 $ 657 $ 692 $ 725 $ 698 $ 5
Educational Services $ 1,055 $ 1,181 $ 1,102 $ 1,218 $ 1,084 $ 29
Health Care and Social Assistance $ 947 $ 951 $ 928 $ 988 $ 966 $ 19
Arts, Entertainment, and Recreation $ 917 $ 1,318 $ 1,286 $ 1,076 $ 876 $ (41)
Accommodation and Food Services $ 382 $ 388 $ 402 $ 405 $ 393 $ 11
Other Services, Ex. Public Admin $ 606 $ 609 $ 618 $ 649 $ 631 $ 25
Public Administration $ 1,260 $ 1,227 $ 1,186 $ 1,235 $ 1,321 $ 61
Source: Minnesota Department of Employment and Economic Development (DEED) – Minnesota Quarterly Census, Employment
1 Natural resources and agriculture, fishing and forestry employment are not counted. Some industry numbers may not be disclosed because of privacy issues.
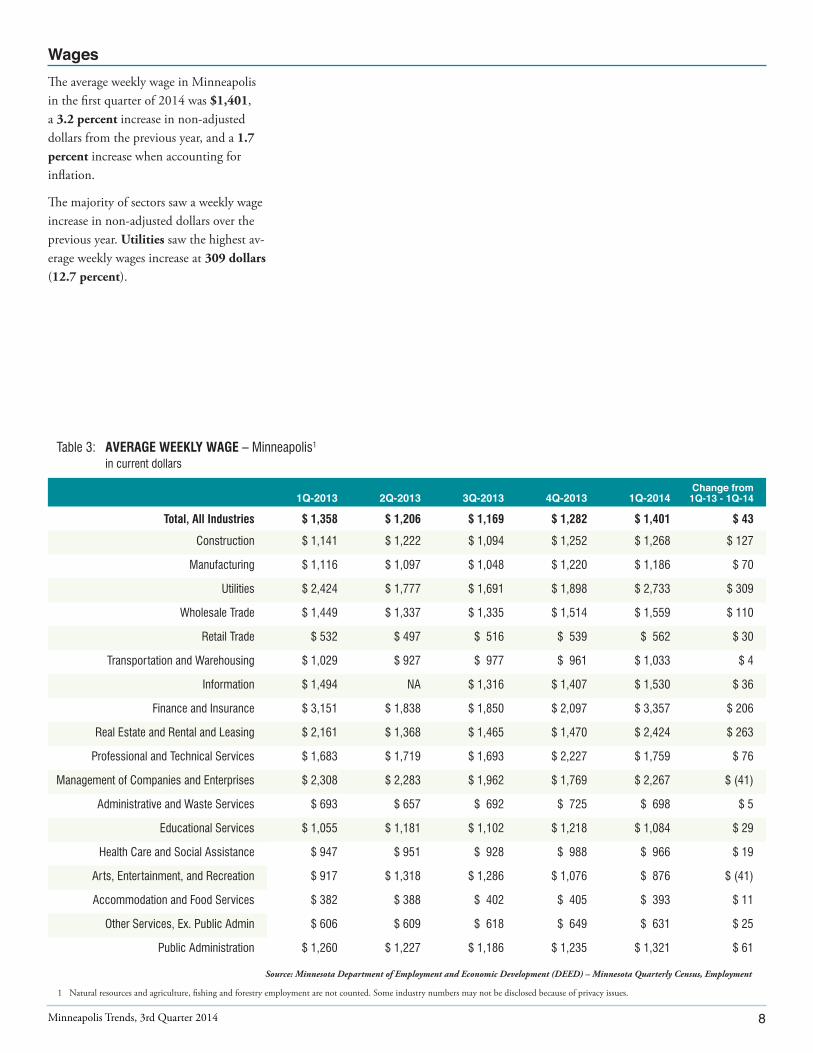
The average weekly wage in Minneapolis in the first quarter of 2014 was $1,401, a 3.2 percent increase in non-adjusted dollars from the previous year, and a 1.7 percent increase when accounting for inflation.
The majority of sectors saw a weekly wage increase in non-adjusted dollars over the previous year. Utilities saw the highest av-erage weekly wages increase at 309 dollars (12.7 percent).

9Minneapolis Trends, 3rd Quarter 2014
Wages
Figure 4: AVERAGE WEEKLY WAGES –1Q-13 to 1Q-14 in inflation-adjusted dollars
In general, jobs in Minneapolis command higher average weekly wages than the metropolitan area or the state. When com-pared to the same quarter last year, average weekly wages in inflation-adjusted dollars rose in the city, metro, and state.
$ 1400
1300
1200
1100
1000
900
800
700
600
500
400
300
200
100
0
1Q-13 2Q-13 3Q-13 4Q-13 1Q-14
$ change 1Q-13 to
1Q-14
% change 1Q-13 to
1Q-14
Minneapolis $ 1,378 $ 1,223 $ 1,182 $ 1,297 $1,401 $ 23 1.7%
Metro area $ 1,169 $ 1,053 $ 1,066 $ 1,103 $ 1,192 $ 23 2.0%
Minnesota $ 1,023 $ 948 $ 957 $ 1,007 $ 1,036 $ 13 1.3%
Source: Minnesota Department of Employment and Economic Development (DEED)
For conversion factors, see page 12
1Q13 2Q-13 3Q13 4Q-13 1Q-14
Minneapolis
Metro
Minnesota

10Minneapolis Trends, 3rd Quarter 2014
Wages
Source: Minnesota Department of Employment and Economic Development (DEED)
* For conversion factors, see page 12
Minneapolis industries are sorted from high to low. For metro area definition, see page 12
Figure 5: AVERAGE WEEKLY WAGES –1Q-13 to 1Q-14 percent change in inflation-adjusted dollars*
1.7%2.0%
-10% -8% -6% -4% -2% 0% +2% +4% +6% +8% +10% +12% +13%
Total, All Industries
Utilities
RE / Rental / Leasing
Construction
Wholesale Trade
Finance and Insurance
Manufacturing
Retail Trade
Public Administration
Professional and Technical Services
Other Services
Accommodation and Food Services
Educational Services
Information
Health Care and Social Assistance
Administrative and Waste Services
Transportation and Warehousing
Management of Companies
Arts and Recreation -10% -8% -6% -4% -2% 0% +2% +4% +6% +8% +10% +12%+13%
Minneapolis
Metro
Minnesota
1.3%

11Minneapolis Trends, 3rd Quarter 2014
Wages
A majority of the sectors tracked for this report saw average inflation-adjusted weekly wages increase in Minneapolis this quarter. Utilities and Real Estate, Rental, and Leasing sectors saw the larg-est percentage increases over the previous year. In the metro and state geographies, job sectors experiencing the greatest wage growth were Utilities and Finance and Insurance.
Utilities saw the largest increase in inflation adjusted wages in Min-neapolis with 11.1 percent growth, while wages for the industry increased at rates of 8.3 and 4.7 percent respec-tively in the metro area and state.

12Minneapolis Trends, 3rd Quarter 2014
Labor Force, Employment and Unemployment: Labor force, employment and
unemployment by place of residence are based on monthly figures from the Minnesota
Department of Employment and Economic Development. Labor force means the
number of non-farm workers employed or looking for a job at a given time. For
complete definitions go to: http://www.bls.gov/opub/hom/pdf/homch1.pdf
Metro area: The following counties make up the seven-county metropolitan area:
Anoka, Carver, Dakota, Hennepin, Ramsey, Scott, and Washington.
Jobs and wages: Average number of jobs by industry is based on data of all
establishments covered under the Unemployment Insurance System, which includes
about 97 percent of Minnesota employment. Some categories of employment are
excluded, including sole proprietors, self-employed people, railroad workers, elected
government officials and others working on a commission basis. Tables 2 and 3 show
data to two digits by industry in the North American Industry Classification System
(NAIC) for Minneapolis, the seven-county metropolitan area, and Minnesota. To see
how the “digits” work, go to http://www.census.gov/eos/www/naics/
Inflation-adjusted figures: Values reported in table 3 are expressed in current dollars
(not adjusted for inflation). For analysis purposes, however, text is based on these table
values converted to constant (inflation-adjusted) dollars based on the U.S. Bureau of
Labor Statistics’ Consumer Price Index (CPI) for all urban consumer goods in the
Minneapolis-Saint Paul, Minnesota-Wisconsin statistical metropolitan area and the
Midwest urban areas. For the third quarter of 2012, dollars have been converted with
an index reflecting the CPI for the second half of 2012 and second half of 2011 with
2012 as a base year for Minneapolis and metro area, and the state. To look at the
indexes go to: http://www.bls.gov/cpi/ then go to databases and to “All urban consumers
(current series).”

13Minneapolis Trends, 3rd Quarter 2014
Development indicators409 new construction residential units were permitted this quarter, most of them
rental units in multifamily buildings, although the number of single family permits
remained strong at 31 permits issued.
The city permitted 51.8 percent fewer multifamily units this quarter than last
quarter, and 66.5 percent fewer permits than were issued in the same quarter of
2013.
Forty residential and commercial permits valued at least $1 million were issued this
quarter, totaling $372.2 million. The largest single project included permits for two
new office buildings for Wells Fargo in downtown.

14Minneapolis Trends, 3rd Quarter 2014
Table 4: NEW RESIDENTIAL UNITS PERMITTED
3Q-13 4Q-13 1Q-14 2Q-14 3Q-14
Single-family
City 46 45 37 27 31
Metro area 1,720 1,412 958 1,428 1,610
Multifamily
City 1,174 890 437 784 378
Metro area 1,903 1,449 770 1,470 1,499
Total Units
City 1,220 935 474 811 409
Metro area* 3,623 2,861 1,728 2,898 3,109
Source: U.S. Census Bureau, based on estimated number of permits with imputation
* Estimated number of permits with imputation: The Census Bureau estimates that about 8 percent of the total number of units permitted are undereported by counties in the metro area.
For metro area definition, see page 12
Figure 6: NEW RESIDENTIAL UNITS PERMITTED – Minneapolis
3Q-13 4Q-13 1Q-14 2Q-14 3Q-14
Source: U.S. Census Bureau, and Minneapolis CPED
1600
1400
1200
1000
800
600
400
200
0
Minneapolis city permitting of single-family units increased over the previous quarter and decreased when compared to the same quarter in 2013, while permitting of multi-family units decreased over the previous quarter and the same quarter in 2013. New resi-dential unit permitting activity in the metro area increased over the previous quarter and decreased when compared to the same quarter last year.
Figure 6 shows the last five quarters of new residential unit permits issued in Minneapolis. These numbers do not include remodeling and conversion projects, which are discussed on page 25. Remodeling and conversion proj-ects are reported separately from new building permits, and appear in Table 5 and Map 2.
Single family
Multi family

15Minneapolis Trends, 3rd Quarter 2014
Map 1: NEW CONSTRUCTION PERMITS – 3Q-14
Source: Minneapolis CPED
Thirty-one single-family dwellings were permitted, many of them in the southwestern part of the city, near Lake Harriet and Lake Calhoun – also a number of new single-family units were permitted in the Longfellow area in the south sector of the city. Seven new multi-family buildings totaling 378 units were also permitted this quarter.

$ 500,000
450,000
400,000
350,000
300,000
250,000
200,000
150,000
100,000
50,000
0
$ 250,000
200,000
150,000
100,000
50,000
0 3Q-13 4Q-13 1Q-14 2Q-14 3Q-14
3Q-13 4Q-13 1Q-14 2Q-14 3Q-14
16Minneapolis Trends, 3rd Quarter 2014
Figure 7: SINGLE-FAMILY CONSTRUCTION COST per unit
The thirty-one new single-family homes per-mitted this quarter had estimated construction costs ranging from $170,000 to $1,280,000 with a median of $328,969.
The average single-family construction cost in the city increased by 16.3 percent this quarter in comparison with last quarter, and increased 25.1 percent compared with the same quarter last year. In the metro area permitted single-family construction cost decreased by 3.3 per-cent over the previous quarter and increased 2.2 percent compared with the same quarter last year.
This quarter the average construction cost of multifamily units increased in Minneapolis and decreased in the metro from the previous quarter while increasing in both geographies when compared to the same quarter from the previous year.
3Q-13 4Q-13 1Q-14 2Q-14 3Q-14
Minneapolis $ 146,171 $ 136,490 $ 166,541 $ 158,446 $ 212,947
Metro area $ 135,280 $ 145,736 $ 176,751 $ 147,566 $ 146,243
Source: U.S. Census Bureau
Values in table are not adjusted for inflation For metro area definition, see page 12
Figure 8: MULTIFAMILY CONSTRUCTION COST per unit
3Q-13 4Q-13 1Q-14 2Q-14 3Q-14
Minneapolis $ 289,921 $ 329,671 $ 341,409 $ 311,999 $ 362,830
Metro area $ 305,517 $ 329,477 $ 334,031 $ 323,010 $ 312,243
Source: U.S. Census Bureau
Table values are not adjusted for inflation For metro area definition, see page 12
MetroMinneapolis
Metro
Minneapolis

17Minneapolis Trends, 3rd Quarter 2014
Table 5: PERMITTED CONVERSIONS, REMODELS AND ADDITIONS projects $50,000 +
3Q-13 4Q-13 1Q-14 2Q-14 3Q-14
Remodels
Number of buildings 167 115 100 162 166
Total Value $ 22,976,086 $ 19,966,647 $ 9,480,414 $ 31,829,146 $ 25,864,908
Conversions and additions2
Number of buildings 7 13 7 13 18
Net number of units 19 274 -7 63 5
Total value $ 2,186,020 $ 82,807,806 $ 196,000 $ 9,301,359 $ 3,721,007
Total Residential1
Number of buildings 174 128 107 175 184
Value $ 25,162,106 $ 102,774,453 $ 9,676,414 $ 41,130,505 $ 29,585,915
Total non-residential1
Number of buildings3 178 165 134 189 206
Value $ 63,817,628 $ 60,963,468 $ 69,067,513 $ 83,855,306 $ 124,221,140
Source: Minneapolis CPED
1 Residential and non-residential building listings may include structural work, build-outs (other than new building build-outs) and other improvements.2 Residential conversions consist of a change in uses (e.g. from an office building to residential apartments) or subdividing or consolidating residential units. 3 Types of non-residential buildings vary, including parking ramps, communication equipment, and public works, commercial or industrial buildings.
The City saw an increase the number of residential remodeling, conversion and addition projects with a value of $50,000 or more this quarter when compared to the previous quarter.
Commercial permit numbers and overall value were also up when compared to the previous quarter and the same quarter from the previous year.
18Minneapolis Trends, 3rd Quarter 2014
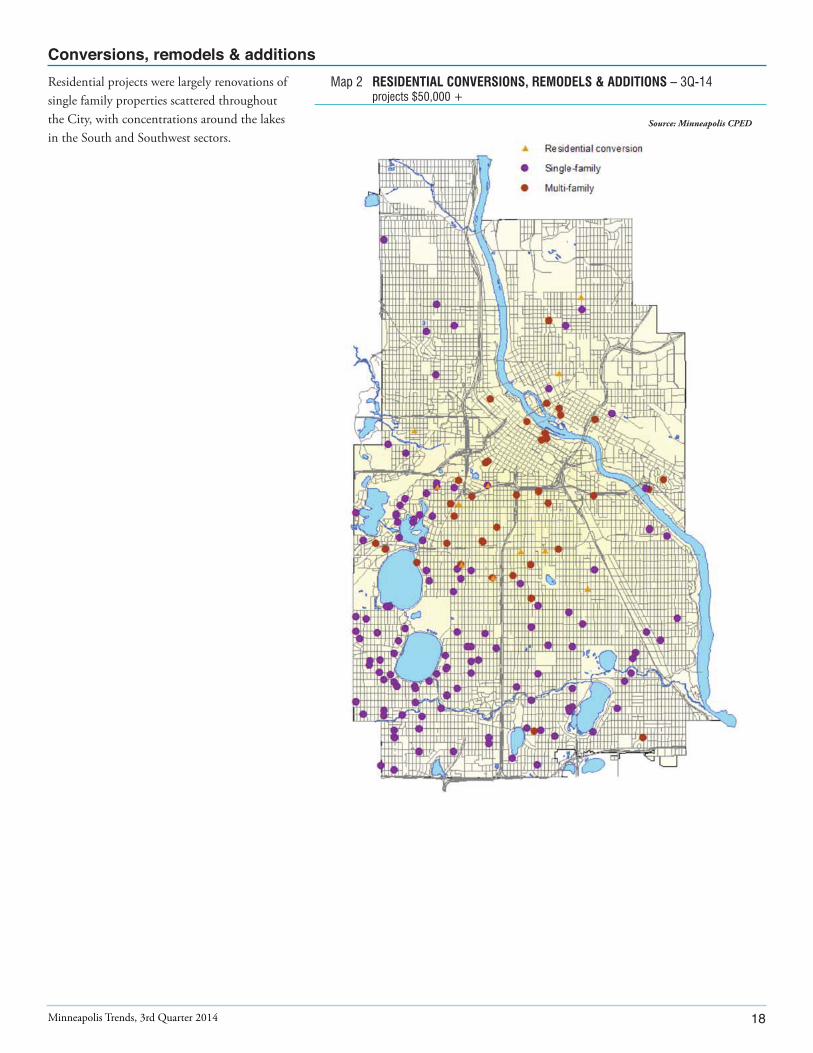
Map 2 RESIDENTIAL CONVERSIONS, REMODELS & ADDITIONS – 3Q-14 projects $50,000 +
Source: Minneapolis CPED
Residential projects were largely renovations of single family properties scattered throughout the City, with concentrations around the lakes in the South and Southwest sectors.
19Minneapolis Trends, 3rd Quarter 2014
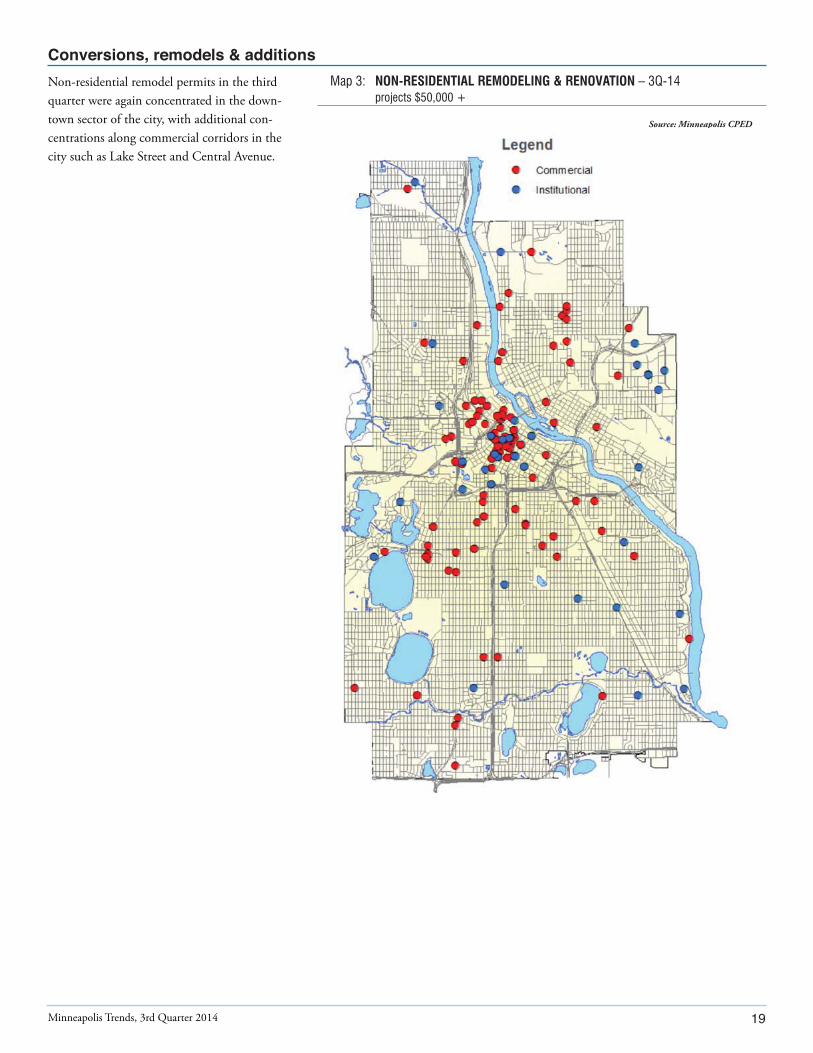
Non-residential remodel permits in the third quarter were again concentrated in the down-town sector of the city, with additional con-centrations along commercial corridors in the city such as Lake Street and Central Avenue.
Map 3: NON-RESIDENTIAL REMODELING & RENOVATION – 3Q-14 projects $50,000 +
Source: Minneapolis CPED

20Minneapolis Trends, 3rd Quarter 2014
Table 6: MAJOR PERMITTED MINNEAPOLIS CONSTRUCTION PROJECTS projects $1,000,000+
Description Address Neighborhood Projected CPED Involvement 1
Wells Fargo new office tower 530 4th St S Downtown West $ 87,647,428
Wells Fargo new office tower 329 Portland Ave Downtown East $ 87,261,468
New 30 story 262 unit residential building 400 Marquette Ave Downtown West $ 58,260,409
Renovation of Block E 600 Hennepin Ave Downtown West $ 13,382,877
Wells Fargo new office tower 530 4th St S Downtown West $ 11,500,000
Wells Fargo new office tower 329 Portland Ave Downtown East $ 11,500,000
Renovation of Block E 600 Hennepin Ave Downtown West $ 9,135,265
Office remodel 225 6th St S Downtown West $ 7,946,815
Office remodel 1101 3rd St S Downtown East $ 7,200,000
Office and warehouse addition 15 West Broadway Near-North $ 6,800,000
New 4 story 45 unit residential building 5426 Nicollet Ave Tangletown $ 6,500,000
New 28 unit residential building 530 4th St S Downtown West $ 5,588,012
New 32 unit Residential building 329 Portland Ave Downtown East $ 5,588,012
New grocery store and offices 317 38th St E Bryant $ 4,734,490
Renovation of Block E 600 Hennepin Ave Downtown West $ 4,139,287
Former school board headquarters remodel 807 Broadway St Ne Logan Park $ 4,042,195
New 3 story mixed use building 2915 James Ave S East Isles $ 3,700,295
Office remodel 45 5th St S Downtown West $ 2,542,000
Target Center remodel 600 1st Ave N Downtown West $ 2,500,000
Bus Maintenance facility remodel 3106 Nicollet Ave Lyndale $ 2,400,000
Conversion of grocery to commercial kitchen, market, and café 2412 Nicollet Ave Whittier $ 2,363,950
Office remodel 100 5th St S Downtown West $ 2,254,500
Conversion of auto dealership to Walgreens 5424 Lyndale Ave S Kenny $ 2,150,000
Residential remodel 5640 34th Ave S Wenonah $ 2,121,449
Demolition and alteration to building in preparation for conversion to residential use
22 27th Ave SeProspect Park - East River Road
$ 1,700,000
Office remodel 501 Nicollet Mall Downtown West $ 1,501,237
Replace roof 1130 Nicollet Mall Downtown West $ 1,400,000
Clinic renovation 2525 Chicago Ave Midtown Phillips $ 1,387,000
Office remodel 2601 Franklin Ave E Seward $ 1,386,248
Office remodel 300 Border Ave N North Loop $ 1,375,888
School remodel 66 Malcolm Ave Se Prospect Park - East River Rd $ 1,357,884
New 3 unit residential building 4255 Sheridan Ave S Linden Hills $ 1,345,939
Tenant improvement to office/warehouse building 2633 Minnehaha Ave Longfellow, Seward $ 1,300,000
New single family residence 3901 Abbott Ave S Linden Hills $ 1,280,000
Office remodel 800 Nicollet Mall Downtown West $ 1,204,170
Replace roof 80 8th St S Downtown West $ 1,200,000
Surly Brewery interior buildout 3171 5th St Se Prospect Park - East River Rd $ 1,145,693
Replace roof 1701 49th Ave N Humboldt Industrial Area $ 1,113,000
Convention center improvements 132 16th St E Loring Park $ 1,099,475
Restaurant buildout 1608 Harmon Pl Loring Park $ 1,098,749
Source: Minneapolis CPED
The following list shows major projects permitted in Minneapolis in the third quarter of 2014. The dollar amounts only
reflect projected construction cost (not land acquisition or soft costs) for permits issued.
Permit amounts do not indicate actual project costs and are an estimate used for the purposes of permit issuance only.
* Includes more than one permit at one address1 Community Planning and Economic Development (CPED) assists selected construction projects in the City with land assembly, property purchases, grants
for land remediation, and financial assistance through bonds or small loans for businesses. All development projects regardless of financial involvement receive technical assistance from CPED on land use and regulatory matters.

21Minneapolis Trends, 3rd Quarter 2014
Demolitions
Map 4: DEMOLITIONS –3Q-14
Source: Minneapolis CPED
Residential demolitions held steady this quar-ter when compared to the previous quarter, and increased when compared to the same quarter from 2013.
Demolitions continue to be focused in areas of the city where sites are prepped for the construction of new single-family or multi-family projects.
160
150
140
120
100
80
60
40
20
0 3Q - 13 4Q - 13 1Q - 14 2Q-14 3Q-14
Source: Minneapolis CPED
Figure 9: RESIDENTIAL UNITS DEMOLISHED – Minneapolis
Units
3Q-13 51
4Q-13 80
1Q-14 32
2Q-14 56
3Q-14 56

22Minneapolis Trends, 3rd Quarter 2014
Building permits for new construction: Permits represent construction projects (residential and non-residential) approved by the City. Typically there is a time lag between issuing a permit and actual construction.
Table four and figures six to eight are based on monthly figures for the city of Minneapolis and metropolitan area provided by the U.S. Census Bureau. For mapping purposes, data on new building construction, remodels, conversions and demolitions for the city are based on permit information by address from the City’s Regulatory Services Department. Numbers from the U.S. Census Bureau and Minneapolis Regulatory Services may differ slightly for the same period because of a time-lag in reporting. Census Bureau numbers do not include additions, remodels or demolitions.
Single-family buildings have only one unit in the building.
Multifamily buildings have two or more units in the building, except when noted that triplexes and duplexes are counted separately (in that case, multifamily buildings have four or more units.)
Cost of residential construction is based on the cost developers report on permit requests for their projects.
Construction cost per unit refers to the total construction cost reported divided by the number of units permitted during the period considered.
Non-residential buildings include any kind of use except residential. Cost is based on the amount the developer reports to the City’s Regulatory Services Department.
Building permits for residential remodeling, additions and conversions: Table five and maps two and three are based on data from the City of Minneapolis CPED Department. Information includes all City-approved projects for remodeling, additions and conversions with a value of $50,000 or more.
Building permits for demolitions: These data were obtained from the City of Minneapolis CPED Department and include all partially or totally demolished buildings. The multifamily building category includes rentals and condominiums.
Maps – Building uses: Categories listing the uses of buildings are based on descriptions from their permits. The following categories are used:
Map 1 – New buildings
Single-family: means detached dwellings.
Other residential: means buildings with two (duplex and double bungalow), three (triplex) or more residential units, including townhouses.
Mixed-use residential: means buildings with other uses in addition to residential, for example, residential and commercial; residential and retail and/or office.
Non-residential use: means all buildings that do not have a residential component. It also includes structures such as communications towers and skyways.
23Minneapolis Trends, 3rd Quarter 2014
Map 2 – Residential remodels with a construction cost of $50,000 or more:
Single-family includes all detached single-family dwellings with permits for renovations, additions or improvements.
Other residential includes all residential buildings that are not detached single-family dwellings, including units in buildings with two or more units. It includes remodeling or build-outs of one or more individual units and remodeling of the entire building.
Conversions consist of the construction of new residential units in non-residential buildings such as factories, warehouses, hotels and others and remodeling of a building for residential uses. It does not include conversions of apartment units to condominiums. It includes changing two or more residential units into a single residence or the subdivision of a single unit into several.
Map 3 – Non-residential remodels, additions and improvements with a cost of $50,000 or more
Commercial includes offices, warehouses, factories, restaurants and retail buildings in general. It may be a build-out of an office space or several floors, or it may be the remodeling of an entire building. Several tenant remodels at one address are considered one project, i.e. renovation of 33 S. Sixth St. (the former Multifoods Tower) downtown.
Institutional: This category includes hospitals, clinics, churches, schools, nursing homes, correctional centers and any other institutional use.
Transportation related includes parking, skyways and bus and rail terminals.
Map 4 – Demolitions
Single family buildings: All detached residential buildings with one unit in the structure.
Multi-family buildings: All residential buildings with 2 or more units in the structure.
Non-residential: All non-residential buildings and structures

24Minneapolis Trends, 3rd Quarter 2014

25Minneapolis Trends, 3rd Quarter 2014
Residential and Commercial Real Estate Market
The average apartment vacancy rate in Minneapolis fell to 2.1 percent in the third
quarter of 2014 after rising to 3.5 in the second quarter. The vacancy rate remains
up from the 1.9 percent rate in the third quarter of 2013.
The number of traditional housing sales increased by 9.8 percent over the same
quarter last year, while lender-mediated sales decreased by 42.5 percent. Average
prices on traditional housing sales decreased by 4.3 percent from the previous
quarter, and increased 1.4 percent over the same quarter last year.
Foreclosure sales increased by 22.4 percent from the previous quarter, and decreased
by 10.3 percent when compared to the same time last year.
The office vacancy rate in the Minneapolis central business district (CBD) ranged
between 12.7 percent and 17.2 percent this quarter, depending on the firm
reporting. Retail vacancies ranged from 10.9 percent to 21.6 percent – the large
discrepancy is explained by differences in reporting method by firm.

Figure 10: RENTAL VACANCY RATES in percent
5%
4
3
2
1
0
3Q-13 4Q-13 1Q-14 2Q-14 3Q-14
Source: GVA Marquette Advisors Reports, based on a sample survey of market-rate rental properties
10 units and more (subsidized and small multifamily rentals are excluded.)
Recorded data for the last month of the quarter For metro area definition, see page 41
26Minneapolis Trends, 3rd Quarter 2014
Table 7: VACANCY RATE AND AVERAGE RENT in current dollars
3Q-13 4Q-13 1Q-14 2Q-14 3Q-14
Minneapolis
Units surveyed 17,500 18,174 18,510 18,381 19,179
Vacant units 332 455 589 644 404
Average rent $ 1,041 $ 1,098 $ 1,095 $ 1,118 $ 1,105
Vacancy rate 1.9% 2.5% 3.2% 3.5% 2.1%
Metro area
Units surveyed 117,356 115,632 117,434 114,496 123,503
Vacant units 2,897 2,932 3,214 2,986 3,025
Average rent $ 984 $ 981 $ 1,000 $ 1,004 $ 1,007
Vacancy rate 2.5% 2.5% 2.7% 2.6% 2.4%
Source: GVA Marquette Advisors Reports, based on a sample survey of market-rate rental properties 10 units and more (subsidized and small multifamily rentals are excluded.)
Recorded data for the last month of the quarter For metro area definition, page 41
The vacancy rate for multifamily rental hous-ing in Minneapolis fell to 2.1 percent. The metro area vacancy rate also dropped this quarter to 2.4 percent.
Metro
Minneapolis

$ 1,200
1,000
800
600
400
200
0
27Minneapolis Trends, 3rd Quarter 2014
At $1,105, Minneapolis average rent in inflation-adjusted dollars decreased when compared to the previous quarter and in-creased when compared to the same quarter of last year. In the metro area average rent was $1,007, an increase from the previous quarter and a decrease when compared to the same quarter of the previous year.
The vacancy rate fell in the Downtown, North, and South sectors over the last quarter, and rose in the Southwest and East sectors. Compared to the same quarter last year the vacancy rate rose in the Southwest, North, and East sectors, while falling slightly in the Downtown sector. The vacancy rate held steady in the South sector. The largest change from year to year occurred in East, where the vacancy rate increased from 0.9 percent in the third quarter of 2013, up to 1.6 percent in the third quarter of 2014.
* For conversion factors, see page 41.
3Q-13 4Q-13 1Q-14 2Q-14 3Q-14
Downtown 3.3% 4.0% 5.0% 5.7% 3.1%
Southwest 2.2% 2.5% 2.7% 2.5% 2.7%
North 2.2% 2.7% 5.6% 5.6% 3.3%
South 2.0% 1.8% 3.2% 2.6% 2.0%
East 0.9% 1.2% 0.8% 1.5% 1.6%
Source: GVA Marquette Advisors Reports, based on a sample survey of market-rate rental properties 10 units and more (subsidized and small multifamily rentals are excluded.)
Recorded data for the last month of the quarter* For sector definitions, see page 41.
3Q-13 4Q-13 1Q-14 2Q-14 3Q-14
8%
6
4
2
0
3Q-13 4Q-13 1Q-14 2Q-14 3Q-14
Minneapolis $ 1,071 $ 1,129 $ 1,108 $ 1,132 $ 1,105
Metro area $ 1,012 $ 993 $ 1,012 $ 1,004 $ 1,007
Source: GVA Marquette Advisors Reports, based on a sample survey of market-rate rental properties 10
units and more (subsidized and small multifamily rentals are excluded.)
Recorded data for the last month of the quarter* For conversion factors, see page 41
Figure 11: AVERAGE APARTMENT RENT in current dollars
Figure 12: VACANCY RATES BY MINNEAPOLIS GEOGRAPHIC SECTORS* in percent
In inflation-adjusted dollars
MetroMinneapolis
3Q-13 4Q-13 1Q-14 2Q-14 3Q-14
South
DowntownNorth
East
Southwest

$ 1,400
1,200
1,000
800
600
400
200
0
28Minneapolis Trends, 3rd Quarter 2014
Figure 13: AVERAGE MONTHLY RENT BY CITY GEOGRAPHIC SECTORS* in inflation-adjusted dollars
Average inflation adjusted rents decreased over the previous quarter in the Southwest, North, and East sectors of the city, while ris-ing in the South and Downtown sectors. On a year to year basis, rents increased the most in Southwest Minneapolis (4.7 percent, or 44 dollars), followed by Downtown (2.9 percent, or approximately 41 dollars).
* For conversion factors, see page 42.
3Q-13 4Q-13 1Q-14 2Q-14 3Q-14
3Q-13 4Q-13 1Q-14 2Q-14 3Q-14
Downtown $ 1,381 $ 1,442 $ 1,415 $ 1,418 $ 1,422
Southwest $ 954 $ 951 $ 1,007 $ 1,033 $ 998
North $ 956 $ 949 $ 955 $ 951 $ 939
South $ 969 $ 1,002 $ 954 $ 923 $ 949
East $ 908 $ 866 $ 867 $ 895 $ 884
Source: GVA Marquette Advisors Reports, based on a sample survey of market-rate rental properties 10 units and more (subsidized and small multifamily rentals are excluded.)
Recorded data for the last month of the quarter. * For conversion factors, see page 42.
** For City sectors definition see page 41.
South
Downtown
North
Southwest
East
6%
5
4
3
2
1
0
$ 1,500
1,250
1,000
750
500
250
0
29Minneapolis Trends, 3rd Quarter 2014
3Q-13 4Q-13 1Q-14 2Q-14 3Q-14
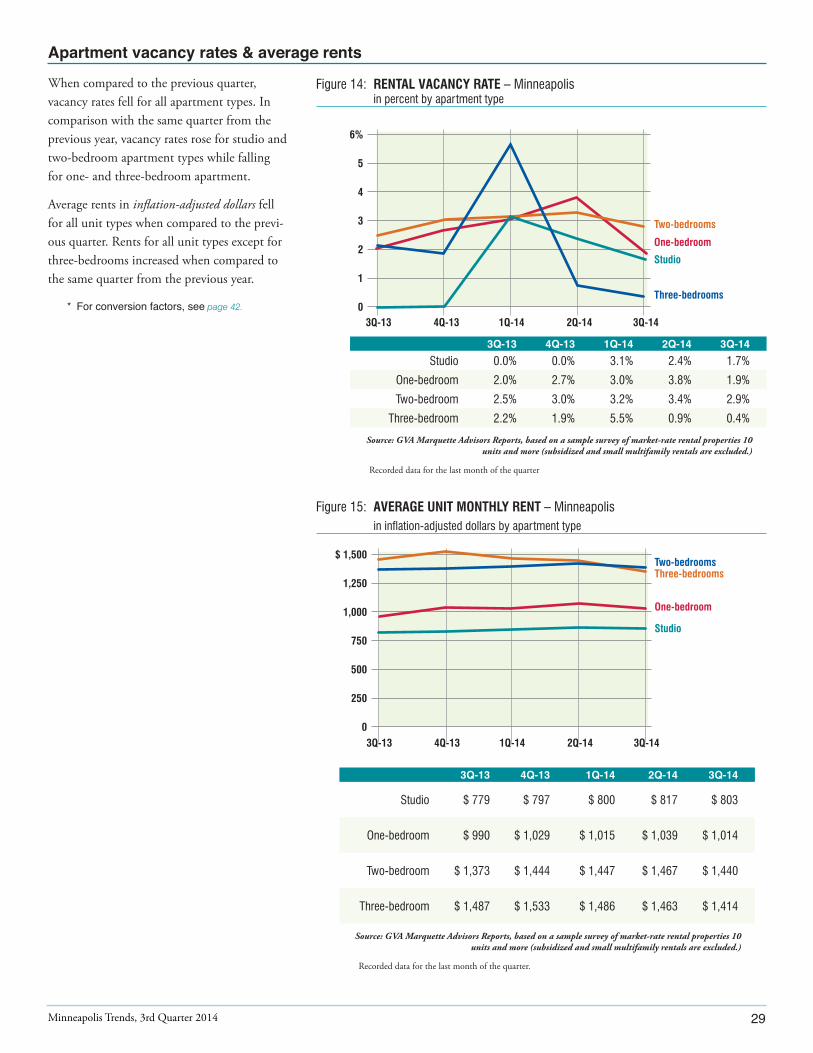
Figure 14: RENTAL VACANCY RATE – Minneapolis in percent by apartment type
Figure 15: AVERAGE UNIT MONTHLY RENT – Minneapolis in inflation-adjusted dollars by apartment type
3Q-13 4Q-13 1Q-14 2Q-14 3Q-14
3Q-13 4Q-13 1Q-14 2Q-14 3Q-14
Studio 0.0% 0.0% 3.1% 2.4% 1.7%
One-bedroom 2.0% 2.7% 3.0% 3.8% 1.9%
Two-bedroom 2.5% 3.0% 3.2% 3.4% 2.9%
Three-bedroom 2.2% 1.9% 5.5% 0.9% 0.4%
Source: GVA Marquette Advisors Reports, based on a sample survey of market-rate rental properties 10 units and more (subsidized and small multifamily rentals are excluded.)
Recorded data for the last month of the quarter
3Q-13 4Q-13 1Q-14 2Q-14 3Q-14
Studio $ 779 $ 797 $ 800 $ 817 $ 803
One-bedroom $ 990 $ 1,029 $ 1,015 $ 1,039 $ 1,014
Two-bedroom $ 1,373 $ 1,444 $ 1,447 $ 1,467 $ 1,440
Three-bedroom $ 1,487 $ 1,533 $ 1,486 $ 1,463 $ 1,414
Source: GVA Marquette Advisors Reports, based on a sample survey of market-rate rental properties 10 units and more (subsidized and small multifamily rentals are excluded.)
Recorded data for the last month of the quarter.
When compared to the previous quarter, vacancy rates fell for all apartment types. In comparison with the same quarter from the previous year, vacancy rates rose for studio and two-bedroom apartment types while falling for one- and three-bedroom apartment.
Average rents in inflation-adjusted dollars fell for all unit types when compared to the previ-ous quarter. Rents for all unit types except for three-bedrooms increased when compared to the same quarter from the previous year.
* For conversion factors, see page 42.Three-bedrooms
Two-bedrooms
Studio
One-bedroom
Three-bedrooms
Studio
Two-bedrooms
One-bedroom

$1,500
1,250
1,000
750
500
250
0 3Q-13 4Q-13 1Q-14 2Q-14 3Q-14
30Minneapolis Trends, 3rd Quarter 2014
3Q-13 4Q-13 1Q-14 2Q-14 3Q-14
Studio $ 759 $ 761 $ 768 $ 771 $ 772
One-bedroom $ 884 $ 885 $ 886 $ 893 $ 884
Two-bedroom $ 1,096 $ 1,100 $ 1,096 $ 1,099 $ 1,090
Three-bedroom $ 1,391 $ 1,373 $ 1,360 $ 1,360 $ 1,349
Source: GVA Marquette Advisors Reports, based on a sample survey of market-rate rental properties 10 units and more (subsidized and small multi family rentals are excluded.)
Recorded data for the last month of the quarter For metro area definition, see page 41
Figure 16: APARTMENT RENTAL VACANCIES – Metro area in percent by apartment type
3Q-13 4Q-13 1Q-14 2Q-14 3Q-14
3Q-13 4Q-13 1Q-14 2Q-14 3Q-14
Studio 2.0% 2.0% 3.0% 3.3% 2.5%
One-bedroom 2.2% 2.3% 2.5% 2.6% 2.3%
Two-bedroom 2.8% 2.8% 2.8% 2.6% 2.5%
Three-bedroom 2.5% 2.4% 3.0% 2.3% 2.4%
Source: GVA Marquette Advisors Reports, based on a sample survey of market-rate rental properties 10 units and more (subsidized and small multifamily rentals are excluded.)
Recorded data for the last month of the quarter For metro area definition, see page 41
Figure 17: AVERAGE APARTMENT MONTHLY RENT – Metro area in inflation-adjusted dollars by apartment type
In the metro area vacancy rates increased three-bedroom units while falling for all other apartment types. Studio and one-bedrooms saw an increase in vacancy when compared to the same quarter from the previous year, while two- and three-bedrooms experienced a decrease in vacancy.
Average rents in inflation-adjusted dollars in the metro fell for one-, two-, and three-bedroom apartments while rising slightly for studio units compared to the previous quarter. When compared to the same quarter from the previous year one-bedroom apartments saw a rent increase, while two- and three-bedroom apartment types saw rents decrease; studio apartments saw no change in rent.
6%
4
2
0Three-bedrooms
Studio
Two-bedroomsOne-bedroom
Three-bedrooms
Studio
Two-bedrooms
One-bedroom

31Minneapolis Trends, 3rd Quarter 2014
Residential sales
Overall sale of housing units increased from the previous quarter. This included an increase in traditional sales (3.8 percent increase) and a decrease in lender-mediated sales (20.6 percent decrease). Median prices for the quarter fell for traditional sales and rose for lender-mediated sales. The median price of traditional sales in Minneapolis ($222,940) fell slightly behind the regional median sale price ($224,900).
Over a twelve-month period, the number of traditional housing sales increased by 9.8 percent, while lender-mediated sales decreased by 42.5 percent, continuing to reflect the declining number of distressed properties in the market.
Median sale prices increased for traditional sales (1.4 percent) and for lender-mediated sales (29.7 percent). This quarter lender-mediated sales including foreclosures were 11 percent of all housing sales in the city, while they accounted for 18 percent of sales in the same quarter of the previous year.
3Q-13 4Q-13 1Q-14 2Q-14 3Q-14
Figure 18: TRADITIONAL AND LENDER-MEDIATED CLOSED SALES AND MEDIAN SALE PRICE– Minneapolis
$300,000
250,000
200,000
150,000
100,000
50,000
0
1300
1,250
1,000
750
500
250
0
units
3Q-13 4Q-13 1Q-14 2Q-14 3Q-14
Traditional sales 1,340 974 739 1,417 1,471
Lender-mediated sales 301 252 235 218 173
Traditional sales median price $ 219,900 $ 209,000 $ 199,820 $233,000 $ 222,940
Lender-mediated median price $ 96,000 $ 98,250 $ 100,401 $ 115,000 $ 124,500
Source: Minneapolis Area Association of Realtors (MAAR)
Traditional median price Lender-
mediated median price
Traditional sales
Lender mediated sales

3Q-13 4Q-13 1Q-14 2Q-14 3Q-14
32Minneapolis Trends, 3rd Quarter 2014
Figure 19: TRADITIONAL AND LENDER-MEDIATED CLOSED SALES AND MEDIAN SALE PRICE – Metro area*
$350,000
300,000
250,000
200,000
150,000
100,000
50,000
0
14,000
12,000
10,000
8,000
6,000
4,000
2,000
0
units
Residential sales
3Q-13 4Q-13 1Q-14 2Q-14 3Q-14
Traditional sales 12,758 9,251 5,885 12,104 13,379
Lender-mediated sales 3,408 2,622 2,389 2,334 1,813
Traditional sales median price $ 224,000 $ 216,700 $ 213,150 $ 224,864 $ 224,900
Lender-mediated median price $ 139,501 $ 135,000 $ 135,000 $ 144,900 $ 145,000
Source: Minneapolis Area Association of Realtors (MAAR)
* The metro area in this chart refers to the 13 counties covering Minnesota and Wisconsin served by the Minneapolis Area Association of Realtors.
For metro area definition, see page 41
In the metro area traditional sales were up from the previous quarter by 10.5 percent, while lender-mediated sales declined by 22.3 percent. Median sale prices for traditional sales and lender-mediated sales rose by 0.4 and 3.9 percent respectively.
Lender mediated sales
Traditional median price
Lender- mediated median price
Traditional sales

33
Table 8: FORECLOSURE PROPERTIES – Minneapolis by ward
3Q-13 4Q-13 1Q-14 2Q-14 3Q-14
Ward Percent Percent Percent Percent Percent
1 21 11% 10 6% 22 13% 8 6% 15 9%
2 2 1% 1 1% 4 2% 4 3% 2 1%
3 7 4% 13 8% 4 2% 10 7% 5 3%
4 50 26% 26 16% 38 22% 29 20% 46 26%
5 11 6% 23 14% 24 14% 22 15% 24 14%
6 10 5% 3 2% 6 3% 4 3% 5 3%
7 15 8% 11 7% 7 4% 6 4% 9 5%
8 14 7% 16 10% 12 7% 12 8% 13 7%
9 16 8% 17 11% 18 10% 10 7% 16 9%
10 10 5% 5 3% 6 3% 6 4% 5 3%
11 7 4% 11 7% 9 5% 9 6% 9 5%
12 25 13% 17 11% 19 11% 18 13% 18 10%
13 7 4% 7 4% 4 2% 5 3% 8 5%
Total 195 100% 160 100% 173 100% 143 100% 175 100%
Source: Hennepin County Sheriff’s Office. The data is subject to revision by the Sheriff’s Office; for complete and current foreclosure listings, please see the Hennepin County Sheriff’s website at. http://www4.co.hennepin.mn.us/webforeclosure/
MAP 5: PROPERTIES FORECLOSED – 3Q-14 by wards
This quarter 175 properties were sold at public auction, 22.4 more than the previous quarter, and 10.3 percent fewer than the third quarter of 2013.
Source: Hennepin County
Data on foreclosures downloaded as of January 2014. The table and map do not take into account foreclosures recorded after the data was compiled, nor any properties later redeemed by the owner in the 6 month redemption period.
Minneapolis Trends, 2nd Quarter 2013

34Minneapolis Trends, 3rd Quarter 2014
Figure 20: RESIDENTIAL FORECLOSURES – Minneapolis in units
1,000
800
600
400
200
03Q-2008 3Q-2009 3Q-2010 3Q-2011 3Q-2012 3Q-2013 3Q-2014
Source: Hennepin County
Data for 2008 have been revised.
35Minneapolis Trends, 3rd Quarter 2014
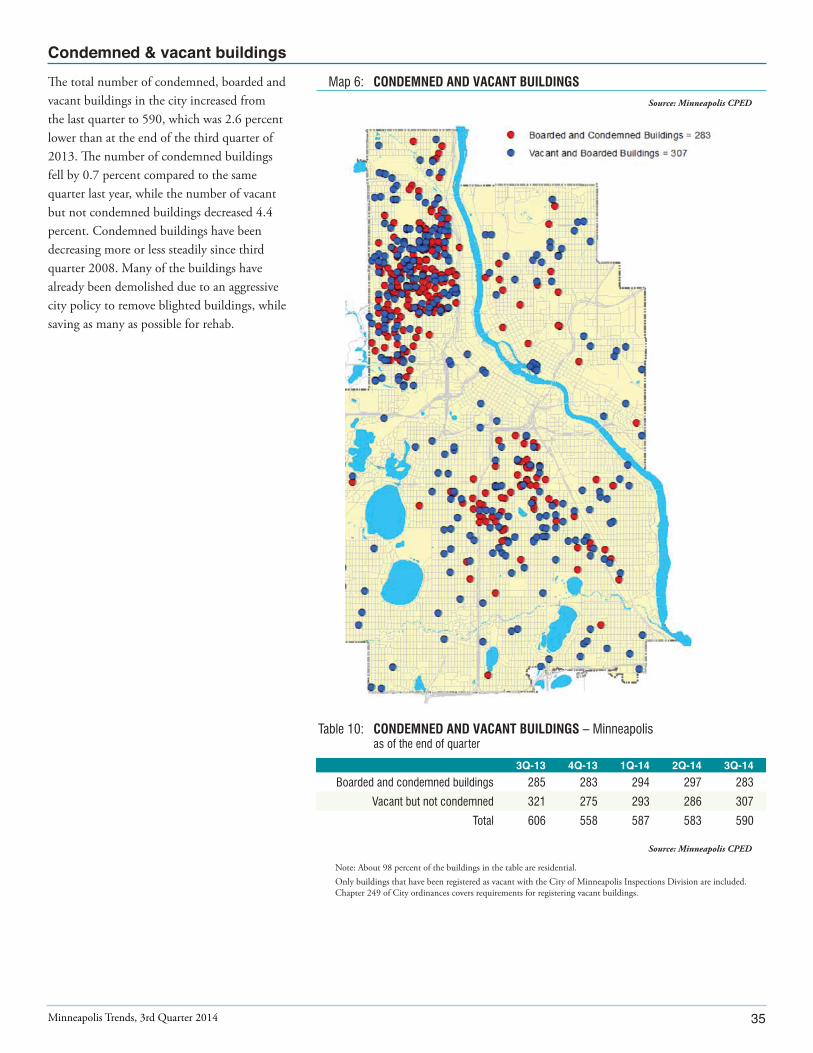
Map 6: CONDEMNED AND VACANT BUILDINGS
Table 10: CONDEMNED AND VACANT BUILDINGS – Minneapolis as of the end of quarter
3Q-13 4Q-13 1Q-14 2Q-14 3Q-14
Boarded and condemned buildings 285 283 294 297 283
Vacant but not condemned 321 275 293 286 307
Total 606 558 587 583 590
Source: Minneapolis CPED
Note: About 98 percent of the buildings in the table are residential. Only buildings that have been registered as vacant with the City of Minneapolis Inspections Division are included.
Chapter 249 of City ordinances covers requirements for registering vacant buildings.
The total number of condemned, boarded and vacant buildings in the city increased from the last quarter to 590, which was 2.6 percent lower than at the end of the third quarter of 2013. The number of condemned buildings fell by 0.7 percent compared to the same quarter last year, while the number of vacant but not condemned buildings decreased 4.4 percent. Condemned buildings have been decreasing more or less steadily since third quarter 2008. Many of the buildings have already been demolished due to an aggressive city policy to remove blighted buildings, while saving as many as possible for rehab.
Source: Minneapolis CPED

3Q-13 4Q-13 1Q-14 2Q-14 3Q-14
25%
20
15
10
5
0
25%
20
15
10
5
0
36Minneapolis Trends, 3rd Quarter 2014
The office vacancy rate was between 12.7 per-cent and 17.2 percent according to the above real estate firms. Pressure remains highest in the Class A market; there remain larger blocks of vacant space in Class B and C properties.
The reported average direct vacancy rate in the metro area ranged between 14.2 percent and 17.4 percent, according to the above real estate firms. Like the Minneapolis CBD, demand in the office real estate market in the Twin Cities was higher for Class A properties.
Figure 22: OFFICE SPACE VACANCY RATE – Metro area in percent
3Q-13 4Q-13 1Q-14 2Q-14 3Q-14
3Q 13 4Q 13 1Q 14 2Q 14 3Q 14
CB Richard Ellis 17.1% 17.3% 17.3% 16.8% 16.8%
Colliers 15.4% 15.6% 15.3% 14.7% 14.2%
NorthMarq 17.5% 17.4% 17.4% 17.4% 17.4%
Sources: CB Richard Ellis, Colliers and NorthMarq
See explanation of sources onpage 42
Figure 21: OFFICE SPACE VACANCY RATE – Minneapolis CBD in percent
3Q 13 4Q 13 1Q 14 2Q 14 3Q 14
CB Richard Ellis 16.7% 16.3% 16.4% 15.3% 15.1%
Colliers 13.9% 13.9% 13.3% 12.7% 12.7%
NorthMarq 16.8% 17.4% 17.4% 17.2% 17.2%
Sources: CB Richard Ellis, Colliers and NorthMarq
See explanation of sources on page 42
Colliers
CB Richard EllisColliers
CB Richard Ellis
NorthMarq
NorthMarq

37Minneapolis Trends, 3rd Quarter 2014
Figure 24: OCCUPIED OFFICE SPACE – rate of growth in percent
2%
1.0
0
– 1.0
-2.0 3Q-13 4Q-13 1Q-14 2Q-14 3Q-14
The average asking lease rate per square foot in the Minneapolis central business district (CBD) and the metro area continues to rise. The change constitutes a 13.5% rise in asking rent prices for office space in the CBD when compared to the previous year.
Between the second and third quarter in Downtown Minneapolis the rate of growth in occupied office space increased while the rate of growth decreased in the metro area as a whole. An additional 24,000 square feet of office space was occupied in the Minneapolis CBD when compared to the previous quarter, and an additional 842,000 square feet of office space was occupied in the Minneapolis CBD when compared to the previous year.
3Q-13 4Q-13 1Q-14 2Q-14 3Q-14
Minneapolis CBD -0.5% 1.1% 1.6% 1.5% 0.1%
Metro area -0.5% 0.1% 0.6% 0.4% -0.1%
Source: CB Richard Ellis
Class A, B and C multi-tenant office buildings 30,000 square feet and larger
Figure 23: OFFICE AVERAGE ASKING LEASE PRICE in current dollars per square foot per year
$ 14
12
10
8
6
4
2
0
3Q-13 4Q-13 1Q-14 2Q-14 3Q-14
3Q-13 4Q-13 1Q-14 2Q-14 3Q-14
Minneapolis CBD $ 12.71 $ 13.43 $ 13.98 $ 14.15 $ 14.42
Metro area $ 11.98 $ 12.33 $ 12.68 $ 13.10 $ 13.20
Source: CB Richard Ellis
Class A, B and C multi-tenant office buildings 30,000 square feet and larger
Minneapolis CBD Metro area
Minneapolis CBD
Metro area

12%
10
8
6
4
2
0
36 %
35
30
25
20
15
10
5
0
38Minneapolis Trends, 3rd Quarter 2014
Retail space
Figure 25: RETAIL VACANCY RATE – Minneapolis CBD in percent
The reported retail vacancy rate in the Min-neapolis CBD ranged between 10.9 and 21.6 percent. Note that large variations in the vacancy rate result from the relatively small amount of square feet of retail in the CBD, as well as differences in how the measurements are done.
The metro area vacancy rate this quarter ranged from 5.5 percent to 7.8 percent.
3Q-13 4Q-13 1Q-14 2Q-14 3Q-14
Figure 26: RETAIL VACANCY RATE – Metro area in percent
3Q-13 4Q-13 1Q-14 2Q-14 3Q-14
3Q 13 4Q 13 1Q 14 2Q 14 3Q 14
CB Richard Ellis 7.3% No data 7.0% 6.7% 7.8%
Colliers 5.7% 5.4% 5.2% 5.7% 5.5%
Northmarq 7.8% 7.2% 7.2% 7.2% 7.2%
Sources: CB Richard Ellis, Colliers and NorthMarq
CB Richard Ellis and Colliers include all multi-tenant retail buildings 30,000 square feet and larger, and buildings under construction.
3Q 13 4Q 13 1Q 14 2Q 14 3Q 14
CB Richard Ellis 11.6% No data 9.9% 11.0% 10.9%
Colliers 13.3% 12.8% 14.4% 15.3% 16.5%
NorthMarq 33.6% 34.1% 34.1% 21.6% 21.6%
Sources CB Richard Ellis and NorthMarq
Includes all multi-tenant retail buildings 30,000 square feet and larger, including buildings under construction.
CB Richard Ellis
NorthMarq
CB Richard Ellis
Colliers
NorthMarq
Colliers

3%
2
1
0
– 1
– 2
– 3
$ 35
30
25
20
15
10
5
0
3Q-13 4Q-13 1Q-14 2Q-14 3Q-14
39Minneapolis Trends, 3rd Quarter 2014
Figure 28: OCCUPIED RETAIL SPACE – rate of growth in percent
Retail space
3Q-13 4Q-13 1Q-14 2Q-14 3Q-14
Minneapolis CBD 0.7% No data 1.9% -1.2% 0.1%
Metro area 0.1% No data -0.8% 0.3% -0.5%
Source: CB Richard Ellis
Includes all multi-tenant retail buildings 30,000 square feet and larger, including buildings under construction.
Average asking lease price per square foot in the Minneapolis central business district (CBD) held steady compared to the previous quarter’s numbers and when compared to the same quarter last year.
In the metro area, average asking lease price decreased over the most recent available reported numbers, and rose slightly from the same quarter in the previous year.
Figure 27: RETAIL AVERAGE ASKING LEASE PRICE in current dollars per square foot per year
3Q-13 4Q-13 1Q-14 2Q-14 3Q-14
Minneapolis CBD $ 22.53 No data $ 22.53 $ 22.53 $ 22.53
Metro area $ 17.26 No data $ 17.35 $ 17.59 $ 17.46
Source: CB Richard Ellis
Includes all multi-tenant retail buildings 30,000 square feet and larger, including buildings under construction.
3Q-13 4Q-13 1Q-14 2Q-14 3Q-14
Minneapolis CBD Metro
Minneapolis CBD
Metro
10 %
8
6
4
2
0 3Q-13 4Q-13 1Q-14 2Q-14 3Q-14
$ 6
5
4
3
2
1
0
40Minneapolis Trends, 3rd Quarter 2014
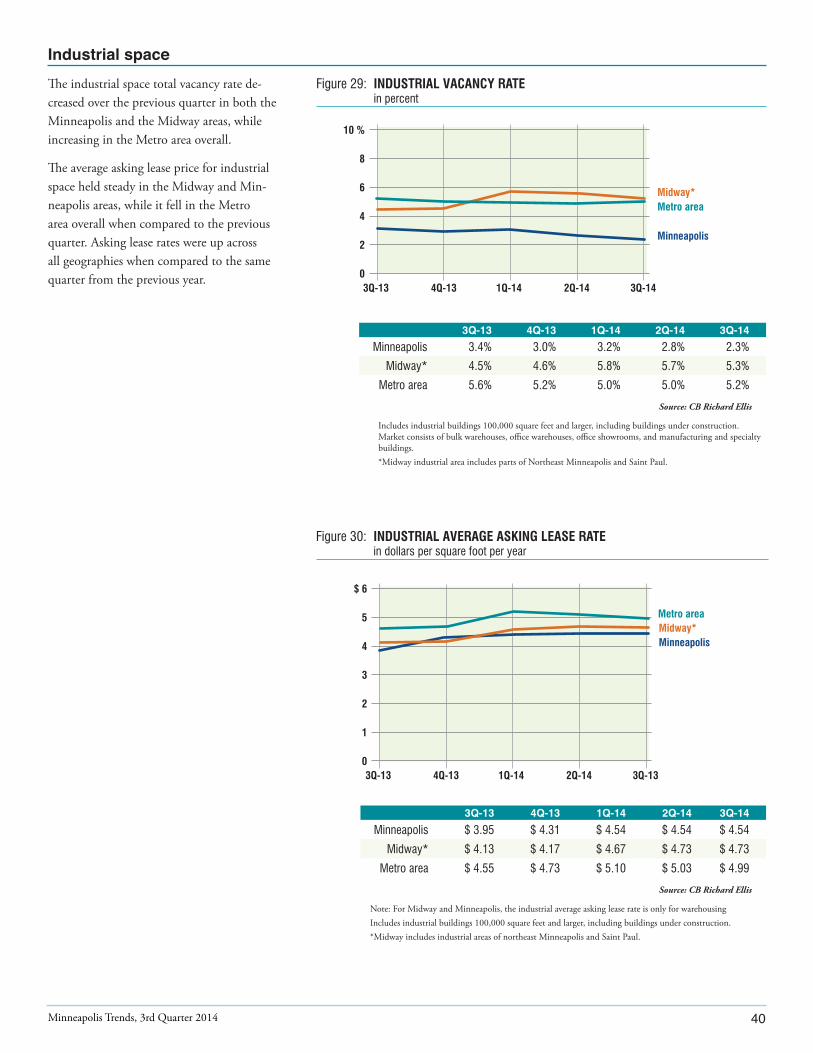
The industrial space total vacancy rate de-creased over the previous quarter in both the Minneapolis and the Midway areas, while increasing in the Metro area overall.
The average asking lease price for industrial space held steady in the Midway and Min-neapolis areas, while it fell in the Metro area overall when compared to the previous quarter. Asking lease rates were up across all geographies when compared to the same quarter from the previous year.
3Q-13 4Q-13 1Q-14 2Q-14 3Q-14
Minneapolis $ 3.95 $ 4.31 $ 4.54 $ 4.54 $ 4.54
Midway* $ 4.13 $ 4.17 $ 4.67 $ 4.73 $ 4.73
Metro area $ 4.55 $ 4.73 $ 5.10 $ 5.03 $ 4.99
Source: CB Richard Ellis
Note: For Midway and Minneapolis, the industrial average asking lease rate is only for warehousingIncludes industrial buildings 100,000 square feet and larger, including buildings under construction. *Midway includes industrial areas of northeast Minneapolis and Saint Paul.
Figure 29: INDUSTRIAL VACANCY RATE in percent
Figure 30: INDUSTRIAL AVERAGE ASKING LEASE RATE in dollars per square foot per year
3Q-13 4Q-13 1Q-14 2Q-14 3Q-13
3Q-13 4Q-13 1Q-14 2Q-14 3Q-14
Minneapolis 3.4% 3.0% 3.2% 2.8% 2.3%
Midway* 4.5% 4.6% 5.8% 5.7% 5.3%
Metro area 5.6% 5.2% 5.0% 5.0% 5.2%
Source: CB Richard Ellis
Includes industrial buildings 100,000 square feet and larger, including buildings under construction. Market consists of bulk warehouses, office warehouses, office showrooms, and manufacturing and specialty buildings.
*Midway industrial area includes parts of Northeast Minneapolis and Saint Paul.
Minneapolis
Metro areaMidway*
Minneapolis
Metro areaMidway*

41Minneapolis Trends, 3rd Quarter 2014
3Q-13 4Q-13 1Q-14 2Q-14 3Q-14
Minneapolis -0.2% 0.4% -0.2% 0.2% 0.5%
Midway* 0.1% -0.1% -1.3% -0.3% 0.1%
Metro area 0.3% 0.4% 0.3% 0.3% -0.2%
Source: CB Richard Ellis
Includes all competitive industrial buildings 100,000 square feet and larger, including buildings under construction. Market consists of bulk warehouses, office
warehouses, office showrooms, and manufacturing and specialty buildings. *Midway includes industrial areas of northeast Minneapolis and Saint Paul.
Figure 31: OCCUPIED INDUSTRIAL SPACE – rate of growth in percent
2%
1
0
– 1
– 2
3Q-13 4Q-13 1Q-14 2Q-14 3Q-14
Industrial absorption rates increased in Min-neapolis and the Midway area, while decreas-ing in the metro area when compared to the previous quarter.
MinneapolisMidway*Metro

42Minneapolis Trends, 3rd Quarter 2014
Housing Vacancy Rate: The vacancy rate is the percentage of unoccupied housing
units among the total number of housing units. Vacancy rates for the multifamily
rental market are calculated quarterly by GVA Marquette Advisors based on a
quarterly survey of properties in the Twin Cities metropolitan area.
City areas: : For data analysis purposes, GVA Marquette Advisors divides the city
into five sub-areas, according to the map below.
Note that we changed the Minneapolis sector names to reflect changes that GVA
Marquette made at the City’s request. South is now South-west; East is South, and
NE, SE and UMN is East. North remains North.
Median sale values: These values are based on home prices researched by the
Minneapolis Area Association of Realtors (MAAR).
Closed home sales: These values are based on home sales reported by the
Minneapolis Area Association of Realtors (MAAR). Closed sales mean that there
is an agreement to sell and steps have been taken toward that end. MAAR makes
a difference between traditional sales and lender-mediated sales. The first type
includes all sales that are neither foreclosures nor short sales. These two define the
lender-mediated sales.
Metro area definition: The Minneapolis Area Association of Realtors service area
includes 12 counties in Minnesota (Chisago, Anoka, Sherburne, Wright, Hennepin,
Ramsey, Washington, Dakota, Scott, Carver, Rice and Goodhue) and one county in
Wisconsin (St. Croix).
Foreclosure sales: These sales occur when property owners are deprived of the right
to keep their properties because of failure to make payments on a mortgage or other
contractual property fees, such as condominium association fees, when due. Data
on foreclosure sales are reported by the Hennepin County Sheriff to Hennepin
County Taxpayer Services Department and later sent to City of Minneapolis CPED
Research Division. Hennepin County’s methodology is to count all foreclosure
Sheriff’s sales categories (mortgage, assessments, associations, executions and
judgments). Data include only foreclosed properties in the City of Minneapolis that
were sold at public option in the specified time period.
Boarded and vacant buildings: A vacant property is a property identified as such
by City of Minneapolis inspectors; City Ordinance 249 requires the property’s
owner to register it as vacant. In addition to being vacant, the property could be
condemned as uninhabitable either for being boarded more than 60 days or because
of lack of maintenance. Data on boarded and vacant buildings are obtained from
the City Department of Regulatory Services.
North
Downtown
East

43Minneapolis Trends, 3rd Quarter 2014
Real estate statistics as reported by CB Richard Ellis () include office, retail and
industrial space vacancy rates, average asking lease price per square foot and absorption
of square feet for the Twin Cities metropolitan area, Minneapolis and Midway
(industrial space) or Minneapolis central business district (office and retail space). The
metro area includes several submarkets and may not coincide with definitions based on
jurisdictional boundaries. This quarter Minneapolis Trends also shows office and retail
vacancy rates reported by Colliers (), and Cushman & Wakefield-NorthMarq ()
Average asking lease rate: This is determined by multiplying the asking net
lease rate for each building by its available space, adding the products, then
dividing by the sum of all available space.
Average vacancy rate: This is determined by dividing the number of vacant
square feet by the net rentable area.
Rate of growth and absorption: This is the change in occupied square feet
from one quarter to the next, determined by subtracting vacant space (not
including sublets and shadow space) from the rentable space available.
Variations in reporting are due to differences in definitions and in the number,
frequency, and geographical location of buildings included in the surveys. Variations in
retail vacancy rates are more evident than in the case of office vacancy but also — and
particularly in the case of the Minneapolis CBD — the relatively small amount of retail
space compared to the overall metro inventory.
Inflation-adjusted figures: For the purpose of analyzing residential rent, text is based
on values converted to constant (inflation-adjusted) dollars based on the U.S. Bureau of
Labor Statistics’ Consumer Price Index (CPI) for housing in the Midwest urban areas
category size “class A” (more than 1.5 million people).

Minneapolis Community Planning & Economic Development
Beth Elliott, AICP
Principal Planner
City of Minneapolis
Department of Community Planning and Economic Development
105 Fifth Avenue South – Room 200
Minneapolis, MN 55401
Phone: (612) 673-2442
105 Fifth Avenue South – Room 200
Minneapolis, MN 55401
If you need this material in an alternative format please call 612-673-2162.
Deaf and hard-of-hearing persons may use a relay service to call 311 agents
at 612-673-3000. TTY users may call 612-673-2157 or 612-673-2626.
Attention – If you have any questions regarding this material please call 311.
Hmong – Ceeb toom. Yog koj xav tau kev pab txhais cov xov no rau koj dawb, hu
612-673-2800.
Spanish – Atención. Si desea recibir asistencia gratuita para traducir esta información,
llama 612-673-2700.
Somali – Ogow. Haddii aad dooneyso in lagaa kaalmeeyo tarjamadda macluumaadkani
oo lacag la’ aan wac 612-673-3500.