Embed Size (px)
Citation preview

Household Wealth and Debtin PolandPilot survey report 2014

Household Wealth and Debt in Poland
Pilot survey report 2014
Financial Stability Department
Warsaw 2015

Prepared by: the Financial Stability Department (in co-operation with the Economic Institute)
Edited by: Piotr Bańbuła and Zbigniew Żółkiewski
Authors: Piotr Bańbuła Kacper Grejcz Filip Premik Joanna Przeworska Zbigniew Żółkiewski
This study was prepared at the Financial Stability Department in co-operation with the Economic Institute, for the needs of the NBP authorities. Opinions ex-pressed in this material are authors’ opinions and do not present the opinion of the NBP authorities.

Preface 4
Summary 5
Introduction 7
1. Net wealth 13
1.1. Main results 13
1.2. Distribution of net wealth 17
1.3. Net wealth in Poland as compared to the euro area countries 24
2. Assets 27
2.1. Real assets 28
2.2. Financial assets 32
3. Debt 38
3.1. Total debt 40
3.2. Housing loans 42
3.3. Non-housing credits and loans 44
3.4. Household debt burden 46
References 59
Statistical annex 62
Table of contents

Preface
4 Household Wealth and Debt in Poland
Preface
The Household Wealth and Debt Survey (BZGD), whose findings are presented in this paper, is a
survey primarily concerned with the analysis of the widely understood financial situation of respond-
ents, with a particular emphasis on assets accumulated by households and liabilities (debt) incurred
by them. The survey was conducted in 2014 by Narodowy Bank Polski, in cooperation with the Cen-
tral Statistical Office (Główny Urząd Statystyczny – GUS). The survey is a pilot study, however due to
the relatively large sample of the surveyed households and advanced research methodology, we de-
cided to publish its results.
The Household Wealth and Debt Survey also relied on the experience gathered by Narodowy Bank
Polski thanks to its participation in the works of the research network of the European Central Bank
entitled: Household Finance and Consumption Network (HFCN). Under this network, central banks
and statistical offices of the euro area countries have conducted since 2006 surveys of household fi-
nancial condition, and, in particular household assets and debt. In 2012 Narodowy Bank Polski was
granted observer’s status in the HFCN network.
The survey questionnaire covers the range of issues which are addressed in euro area surveys. While
being a version of the HFCN questionnaire, the survey has been adapted to the Polish conditions,
modified as regards the formulation of questions and the layout of research modules by teams of
Narodowy Bank Polski and the Central Statistical Office (GUS). The surveyed sample was chosen by
the GUS, taking into account NBP’s comments and requests. The survey was conducted in February
2014 by GUS employees (supervision, organization, compilation of the survey findings) and inter-
viewers employed at voivodship statistical offices. Imputation of the results was carried out at the
Voivodship Statistical Office in Łódź.
The authors would like to extend their acknowledgements to the employees of the Central Statistical
Office and voivodship statistical offices, involved in the survey, in particular to Mr. Piotr Łysoń – Di-
rector of the Social Surveys and Living Conditions Department, Ms. Małgorzata Żyra – Deputy Direc-
tor of the Department, Ms. Krystyna Siwiak – Head of the Household Surveys Division, Ms. Maria
Barlik – employee of the Household Surveys Division. Any errors and omissions are the sole respon-
sibility of the authors.
The study was prepared at the Financial Stability Department, in cooperation with the Economic Insti-
tute for the needs of NBP authorities. Opinions expressed in the study are author’s opinions and not
those of the authorities of Narodowy Bank Polski.

Summary
5 Household Wealth and Debt in Poland
Summary
The average net wealth of households in Poland in 2014, measured by the median, amounted to PLN
256.8 thousand. The net wealth value was largely determined by real assets, collected by the house-
holds, including predominantly the value of the main residence (an average of PLN 282.6 thousand)
and self-employed business wealth (an average of PLN 219.7 thousand). Financial assets were much
less important in the process of wealth accumulation (an average of PLN 8.6 thousand).
Real asset holdings varied across individual groups of respondents. The vast majority of households
were owners of their main residence1 (76.4%) and vehicles (63.0%). Much fewer households declared
other real estate property (19.1%) or self-employment business assets (18.8%) as components of their
wealth. Among financial assets the most common form of fund accumulation were deposits (81.9% of
households), whereas the actual value of assets accumulated in this form was relatively small (an av-
erage of PLN 5.0 thousand).
Liabilities of households, consisting of various forms of debt, are declared by 37% households and, in
the case of an average household, constitute a relatively small burden on its assets (PLN 10.0 thou-
sand). The level of debt by type of debt varies greatly. Housing loans secured by a lien on property
(mortgage loans) are the main component of household debt in Poland. They are reported by only
12.1% of households and are considered a relatively high burden (an average of PLN 104.0 thousand).
Other loans, primarily consumer loans, are more common (29.4% of households), but their value is
much smaller (an average of PLN 5 thousand).
Net wealth is a highly fluctuating variable along with many important characteristics of households.
In particular, net wealth grows considerably with along growing household income and educational
attainment of the household reference person. The net wealth also increases markedly with age of the
of the household reference person, during their economic activity, reaching the maximum value when
the household reference person reaches the age of 45 - 64 years (PLN 304.5 thousand). The labour force
status of the household reference person and class of their place of residence are a highly differentiat-
ing feature of net wealth level. Households in which the household reference person runs business
activity (self-employed status) are clearly more affluent (PLN 783.6 thousand) than the average in the
total population, and also residents of rural areas hold wealth of a considerably higher value (PLN
366.1 thousand) than households in urban areas (PLN 207.2 thousand).
The findings of the survey of Polish households’ wealth, especially in case of the net wealth metrics,
follow the regularities observed in the euro area. Households in Poland are moderately wealthy
against the background of the euro area countries, holding an average of net wealth (EUR 61.7 thou-
sand) which constitutes approx. 56% of the net wealth of median household in the euro area (EUR
109.2 thousand). The highest household net wealth in the euro area is recorded in Luxembourg (EUR
1 Owner of the main residence means a person holding the title to more than 50% of value of the real estate. 1% of households
own less than 50% title to the real estate.

Summary
6 Household Wealth and Debt in Poland
397.8 thousand) and Cyprus (EUR 266.9 thousand) while the lowest value of wealth is recorded in
Slovakia (EUR 61.2 thousand) and Germany (EUR 51.4 thousand). The main asset, contributing the
most to the total household wealth, both in Poland and in the euro area, is real property being the
household main residence. Poland has clearly greater prevalence of owner occupied real estate
(76.4%) as compared to the euro area average (60.1%). This fact largely explains why an average Polish
household has greater or similar wealth as compared with much wealthier countries as measured by
GDP, where the possession of the main residence is less common (e.g. Austria - 47.7%, Germany -
44.2%). For the Polish households financial assets are less important as a component of their total as-
sets (median of EUR 2.1 thousand) than for the euro area households (median of EUR 11.4 thousand),
accounting for approx. 5% of total assets, as compared to approx. 15% for the euro area. The element
which is distinctive for households in Poland is a relatively high percentage of respondents declaring
possession of business assets (18.8% vs. 11.1% in the euro area) and the value of these assets (EUR 52.8
thousand as compared to EUR 30.0 thousand in the euro area).
Households in Poland are significantly less indebted than those in the euro area. In Poland, the aver-
age household debt amounts to EUR 2.4 thousand (a little over 6% in relation to gross assets), while
the euro area average debt is EUR 21.5 thousand, representing approx. 22% of total assets.
Poland is a country with significantly smaller wealth inequalities as compared with the euro area
countries, as evidenced by a lower Gini coefficient for net wealth (58% vs. an average of 68% for the
euro area). Similar wealth inequalities as in Poland are observed in such countries such as Greece
(56%), Slovenia (53%) or Slovakia (45%) and the most pronounced inequalities are observed in Ger-
many and Austria (76%) and Cyprus (70%).

Introduction
7 Household Wealth and Debt in Poland
Introduction
The Household Wealth and Debt Survey (BZGD), whose findings are discussed in this study, is aimed
to put together a wide range of information on the economic situation of households with a focus on
assets accumulated and liabilities incurred by households. The data on assets and liabilities of house-
holds are collected with a high degree of detail. Household assets include real and financial assets.
Real components of assets are represented by real estate property being the main residence, other real
estate property, vehicles, self-employment business wealth and valuables. Financial assets include
such items as saving deposits, shares in mutual funds and bonds purchased individually, shares of
(stock exchange) listed companies purchased individually, funds gathered on accounts managed by
professionals, other financial receivables (e.g. arising from loans, bills of exchange, etc.).
Liabilities include debt incurred by households arising from: housing (mortgage) loans, consumer
loans (including car loans) and other consumer loans (credit or payment card debt or overdraft), other
liabilities (e.g. resulting from instalment payment agreements, private loans from family, friends, em-
ployers, etc.) and business loans or loans for other purposes (including the repayment of other debts).
As a result, data collected during the Household Wealth and Debt Survey (BZGD) draw a complete
picture of households’ financial situation, which may be recorded as the balance sheet of the house-
hold sector (in terms of assets and liabilities). The result (balancing item) of the balance sheet of the
household sector, and, at the same time, the key outcome variable of the survey is net wealth, defined
as the difference between total assets and total liabilities. The financial balance sheet of the household
sector can be outlined as follows:
Figure 1. Financial balance sheet of the household sector in Household Wealth and Debt Survey
(BZGD)
HOUSEHOLD BALANCE SHEET
ASSETS LIABILITIES
Real assets Housing loans
Household main residence Housing loans secured on the main residence
Other real estate property Housing loans secured on another real estate
Vehicles
Valuables Non-housing credit and loans
Self-employment business wealth
Financial assets
Deposits
Mutual funds
Shares
Obligations NET WEALTH: ASSETS – LIABILITIES
Receivables
Voluntary pension schemes / Life insurance
Other financial assets
Source: Own elaboration
In addition to a complete set of data on assets and liabilities of the household sector, collected in the
Household Wealth and Debt Survey, there are large amounts of supplementary information allowing

Introduction
8 Household Wealth and Debt in Poland
for an exhaustive characterization of households in terms of their socio – economic and demographic
characteristics. In particular, other2 modules of the questionnaire include the following issues:
demographic data (including the composition of the household, age, sex, marital status, edu-
cation, etc.).
household expenses (including, total average monthly spending on food and non-alcoholic
beverages, cash donated to persons outside the household, e.g. support to the relatives, gifts,
savings: propensity to save and saving objectives, etc.).
status in the labour market and income of the household (including professional activity, oc-
cupation and position, working hours, income from employment, etc.)
economic activity (including the value and legal form of the company, its business profile,
employment size, etc.).
bequests and donations (including the type of bequest or gift received, the year of receipt,
value, etc.)
pensions schemes (including pension entitlements under public pension schemes, participa-
tion in voluntary pension schemes and the total amount of funds gathered, insurance cover-
age under life insurance policy and the total amount of funds collected, etc.).
complementary information concerning the household financial condition (including self-
assessment of financial situation, savings "for a rainy day," etc.).
In addition, the Household Wealth and Debt Survey collects a series of supplementary information
concerning, in particular: the place of residence (including, the type of building, location, quality, etc.),
the way in which the interview proceeded (attitude of the respondent, credibility of answers, degree
of understanding of questions by the respondent, etc.) and performance of the survey (including the
effectiveness of the interview, the duration of the interview, the reasons for refusal or interruption of
the interview etc.). The complexity of information collected in the Household Wealth and Debt Sur-
vey, not only makes it possible to compile balance sheets of the household sector (and its subgroups),
but it also enables the analysis of processes of wealth accumulation by households, depending on their
characteristics.
The Household Wealth and Debt Survey fills a major information gap on the household finance in
Poland, namely the lack of complete and sufficiently detailed data on assets and debts (e.g. for differ-
ent income groups or socio-economic groups of households). Household surveys which are currently
conducted in Poland both by the GUS (Household Budget Survey, European Union Survey on Income
and Living Conditions (EU-SILC)), and by other institutions (e.g. Social Diagnosis) meet information
needs in this respect to a limited extent only. They focus on flows of income and expenses, and pro-
vide at most only approximate, very rough information on certain aspects of assets and debts. On the
other hand, the aggregate data on household assets and debts, derived from the national accounts or
aggregate banking statistics are neither complete3 nor allow the conduct of analyses for particular
groups of households. In case of BZGD, it is possible to conduct various studies of major theoretical
and practical importance, because of detailed individual data on assets and debts of households in
Poland, along with their socio-economic and demographic characteristics.
2 The survey questionnaire constitutes Chapter 3 of the Methodological Annex to this study (NBP, 2015b). 3 For example, the financial accounts do not show tangible fixed assets.

Introduction
9 Household Wealth and Debt in Poland
From the point of view of Narodowy Bank Polski, the ability to use the data from the Household
Wealth and Debt Survey to analyse the stability of the financial system, as influenced by the situation
and decisions of households, is of key importance. This may be achieved, in particular, through the
identification of heavily indebted households whose current income is largely used for debt servicing
and who additionally fail to hold sufficient collateral in the form of liquid assets. Moreover, in the case
of mortgage loans - the loan-to-value ratio threatens borrower’s solvency. In case this concerns a con-
siderable part of households, this can adversely affect the situation of some banks heavily involved in
lending to households, and thus undermine the instability of the banking sector. Until now, this type
of analysis has not been possible due to the absence of consistent individual data on debt, income and
assets of households4.
Data from the Household Wealth and Debt Survey also provide a better understanding of the mone-
tary transmission mechanism. In particular, they allow a more thorough analysis of how households
respond to changes in NBP interest rates, bearing in mind that this reaction can considerably differ
among the household groups, depending on the distribution of the debt burden on the current income
and accumulated savings across the population. These analyses will also be crucial for conducting
macro-prudential policy, both in the assessment of the scale of systemic risk and calibration of macro-
prudential instruments such as debt servicing costs - DSTI (debt-service-to-income). Comparable stud-
ies have been launched in other parts of the world to this end, among others, by the Federal Reserve in
the United States and by the European Central Bank for the euro area5.
Individual data on assets and debt, complemented by a wide range of household characteristics will
also be useful for different types of studies of a fundamental nature, that can provide a better under-
standing of the mechanisms of financial decision-making of households, help to identify the risks to
which they are exposed and build micro- and macroeconomic models reflecting these processes. In
particular, statistical surveys of assets and debt, with the range of data collected similar to those used
in the Household Wealth and Debt Survey6, are used, among others, to analyse the conditions of
household saving processes, household propensity to undertake risk and to explain the structure of
accumulated assets, the impact of changes in the value of wealth on consumption, inequalities of in-
come and wealth, credit availability and determinants of demand for credit, debt and household vul-
nerability to shocks.
The basis and the inspiration for the Household Wealth and Debt Survey is the Household Finance
and Consumption Network (HFCN) project7, launched in 2006 and coordinated by the European Cen-
tral Bank in the euro area countries. The first round of the survey, launched by HFCN in 2010, covered
15 euro area countries and collected information on 62,000 households. The results of the survey were
4 Analytical possibilities offered by the Household Wealth and Debt Survey in this respect are presented in Box 4 of the Finan-
cial Stability Report – July 2015 (NBP, 2015a, p.45).The paper by Zajączkowski and Żochowski (2007) gives an example of
analyses based on the data coming from GUS surveys of household budgets for similar purposes, used at NBP. 5 For example, FED (2014), ECB (2013a). 6 The overview of the literature on the subject may be found, among others, in: Davies and Shorrocks (2000), ECB (2009). 7 Full information on the HFCN project, together with links to the materials published under the project, may be found on the
website of the European Central Bank (https://www.ecb.europa.eu/pub/economic-research/research-
networks/html/researcher_hfcn.en.html).

Introduction
10 Household Wealth and Debt in Poland
published in 2013. The second round of the survey, whose results will be released in 2016, involved 17
countries, and another round of the survey will be carried out every 2 or 3 years. In the recent years,
several countries outside the euro area, including Poland8, were granted an observer status in the
HFCN and started their own surveys on financial situation of households, with special emphasis on
their assets and debts, following the HFCN methodology9.
The Household Wealth and Debt Survey is a survey in which households, participating on a voluntary
basis (in the case of certain questions - household members) respond, in the presence of an interview-
er, to a series of questions regarding their broadly defined financial situation and selected socio-
demographic characteristics. The survey has been carried out by Narodowy Bank Polski in coopera-
tion with the Central Statistical Office (GUS). The range of questions asked in the questionnaire corre-
sponds with the HFCN project, whereas the layout of the modules and questions was developed by
the teams of NBP and the GUS. Data to be analysed in this study was based on the January and Feb-
ruary 2014 results, and cover a representative sample of 7 thousand households living in Poland, of
which approx. 3.5 thousand completed the questionnaire10 in a satisfactory way. The survey is a pilot
study, however due to the relatively large number of the surveyed households and fairly advanced
research methodology, being the result of close cooperation with the Central Statistical Office and
consultations within the HFCN, we decided to publish its findings. We plan to conduct the Household
Wealth and Debt Survey in the future on a regular basis, every 2 - 3 years, while maintaining coopera-
tion with the GUS and the HFCN, on a larger sample of households and using modified methodology
(e.g. sample selection scheme, questionnaire, method of interviewing, etc.). For these reasons, these
results should be considered only as the first approach to the issue of the distribution of wealth and
debts among households in Poland.
To ensure an appropriate understanding of the results of the Household Wealth and Debt Survey two
factors should be borne in mind. First, BZGD is a survey and as such faces problems typical for this
kind of study11. In particular, household assets (gross wealth), as one of the basic categories analysed
in the survey, are a variable strongly unevenly distributed across households. Consequently, it re-
quires appropriately adjusted sampling scheme (the so-called oversampling of the wealthiest house-
holds). We applied this procedure also in our survey, however, like in the case of similar surveys con-
ducted worldwide, it is difficult to precisely evaluate the effectiveness of the method used (See Box
1.1). A potentially serious problem, undermining the quality of the survey, is also the lack of response,
which may be manifested either in unit non-response or in item non-response. Respondents’ tendency
to avoid answering certain questions or even to refuse to participate in the survey is the higher, the
8 These include (as at 31 July 2015) the Czech Republic and Hungary, with Denmark having an observer status in the HFCN. 9 Methodological solutions adopted by the HFCN are largely based on the experiences of the Survey of Consumer Finances
(SCF), a study of this type conducted on a regular basis for the longest period of time. The survey has been carried out by the
US Federal Reserve since 1983 (the first trial study in 1962). Also the Bank of Italy / Banca d'Italia boasts of a long tradition of
household surveys, addressing wealth and debt issues (since 1965). Since the beginning of the 2000s regular surveys of house-
holds’ wealth and debt have been conducted by the central banks of Spain, Greece, the Netherlands and Portugal (see: ECB,
2009). 10 For more information on the study see the Methodological Annex (NBP, 2015b). 11 The problems encountered in the surveys of households’ financial situation are discussed in the papers by Davies and Shor-
rocks (2000) and ECB (2013b).

Introduction
11 Household Wealth and Debt in Poland
more sensitive, in their opinion, the questions asked. Surveys of household financial situation, includ-
ing their assets and debt, are studies whose basic questions are generally considered highly sensitive
for the respondent. Surveys of this kind also run the risk of misreporting, usually manifested in sys-
tematic undervaluation of the value of assets declared by the respondent. One of the major causes of
this problem is the above mentioned sensitivity of the surveyed issues for the respondent; this can also
be driven by the deficiencies in financial education. For those reasons, it is difficult to expect the re-
sults of the survey of households' financial situation, generalized for the whole population, to provide
aggregates consistent with the data derived from comprehensive, aggregate statistics, such as bank
reporting or the national accounts. The strong point of the survey is that it allows to collect individual
data on the analysed phenomenon, which gives the possibility of constructing distributions of varia-
bles which are of interest for the researcher and developing microeconomic models of the analysed
phenomena. The second part of this study, namely the Methodological Annex (NBP 2015b), analyses,
in more detail, such issues as the sampling scheme, random and non-random errors and the extent of
coverage of certain financial aggregates, in relation to the national accounts data and results of the
Household Budget Survey.
The second issue which is important for the appropriate interpretation of the results of the Household
Wealth and Debt Survey is an understanding of the concept of the key outcome variable of the survey,
namely the household net wealth. This variable, as in the HFCN survey and other surveys of this type,
is defined as the total value of financial and non-financial assets owned by the household less the val-
ue of its total debt, as measured by respondent at the time of the survey. Thus, wealth includes only
those assets and liabilities, which are the household’s private property and which are subject to mar-
ket valuation12. For instance, financial claims of households’ on the State Treasury resulting from pub-
lic pension schemes, or more broadly - social security system, are not included in this definition.
Household wealth understood in this way should not be considered equivalent to the wealth of
households, understood as the sum of the current value of the household net wealth and the discount-
ed current value of the expected stream of future income. The second category is broader as it contains
the expected income resulting from the participation in the public social security system. The aim of
such surveys as the HFCN, the BZGD and similar ones is to determine private net wealth rather than
net wealth of households13. This is very important in ensuring international comparability of results of
household wealth and debt surveys. It turns out that in countries with complex social security systems
households tend to show less propensity to save and collect private wealth, as it is somewhat offset by
a stream of the expected social benefits14. Thus, taxes financing those social security schemes replace
private savings and the social benefits system substitutes the utility stream flowing from private as-
sets. As a result, higher level of household private wealth in country A as compared to country B does
not necessarily have to mean more wealth in country A, because country B can provide their citizens
with at least comparable or higher stream of services through a developed social security system, fi-
nanced with taxes, not with private savings. The results of the first round of the HFCN survey, as well
12 See Davies and Shorrocks – op.cit., OECD (2013). 13 Based on Zachłod-Jelec (2008) containing an overview of theoretical concepts concerning household wealth and discussing
practical connected with wealth assessment. 13 The thesis on the substitutionary character of private problems connected with wealth assessment. 14 The thesis on the substitutionary character of private assets and public social insurance systems are positively verified by
Fessler and Schürz (2015) basing on the data from the HFCN survey.

Introduction
12 Household Wealth and Debt in Poland
as the results of our survey discussed below, provide a clear exemplification of this thesis. This survey
is a pioneer study when it comes to providing detailed information on the distribution of wealth and
its components across households in Poland. In the literature there are few estimates of the aggregate
household wealth, based on its various definitions15 (e.g. Zachłod-Jelec - op. Cit., Credit Suisse (2014)
and earlier publications, Allianz (2014) and earlier publications). The above cited paper by Zachłod-
Jelec - op. cit., and another study by the author (Zachłod-Jelec, 2011) present also the theoretical con-
cept of household wealth and attempt to account for this wealth (assets financial) in the model of con-
sumption for Poland.
The subsequent chapters of our study discuss the following issues. Chapter 2 presents and analyses
the main results of the survey, in the form of aggregate characteristics and distribution of net wealth,
including its comparison with the results of the HFCN survey. This chapter outlines the main results
of the survey. Chapter 3 focuses on the analysis of financial and non-financial assets of households. In
Chapter 4 we analyse household debt with a particular emphasis on the assessment of risks undertak-
en by household. The Statistical Annex presents tables with the detailed results and the glossary of
most important categories analysed in this study. The Methodological Annex, which is complemen-
tary to this publication (NBP, 2015b), addresses the following issues: organization and methodology of
the survey (including its questionnaire), imputation and editing of results and discussion of the cer-
tain measures of the survey quality.
15 Studies by Credit Suisse also contain certain measures of wealth inequalities.

Net wealth
13 Household Wealth and Debt in Poland
1. Net wealth
1.1. Main results
The average net wealth of a household in Poland, as measured by the median16, amounted to PLN
256.8 thousand. Net wealth variable is subject to a significant variability resulting from many im-
portant features of households. In particular, net wealth tends to increase considerably along with
growing income per household (see Figure 1.1 left-hand panel). For example, 10% of households with
the highest annual net income had at their disposal assets (PLN 539.0 thousand) on average, which
were, more than four times the median size of wealth held by 20% of the lowest income households17
(PLN 120.0 thousand).
Figure 1.1. Net wealth and net income (left-hand panel - empirical copula), net wealth depending on
the education of the reference person (right-hand panel – in PLN thousand).
Notes: Marginal distributions in the empirical copula have been converted into monotonous distributions in the
interval (0,1) using the empirical distribution. The Spearman's rank correlation coefficient is 0.42, with 95% confi-
dence interval (0,388-0,443). If the variables had been negatively interrelated, the distribution of the empirical
copula would have focused around the diagonal with a negative slope. If the variables had been positively corre-
lated, the distribution of the empirical copula would have focused around the diagonal with a positive slope. On
the other hand, if the variables had been independent, the distribution would have been uniform throughout the
field.
Source: BZGD, NBP.
16 In this study the median will be used as the basic measure of the central trend due to the strong skewnness of wealth distribu-
tion. Such an approach is commonly used in household wealth surveys (e.g. ECB, 2013a). 17 Due to strong right-handed asymmetry (skewenness) of wealth distribution, we distinguish decile groups for the wealthiest
households in terms of income and wealth (above the 80th percentile), maintaining a breakdown into quintiles for other
households.
0
0,1
0,2
0,3
0,4
0,5
0,6
0,7
0,8
0,9
1
0 0,1 0,2 0,3 0,4 0,5 0,6 0,7 0,8 0,9 1
Net
Incom
e
Net Wealth
0
50
100
150
200
250
300
350
400
Primary or NoEducation
Secondary Tertiary

Net wealth
14 Household Wealth and Debt in Poland
Education of the household reference person18 is favourable to wealth accumulation (see Figure 1.1,
right-hand panel). In the case of households where the reference person has higher education, net
wealth (PLN 343.6 thousand) is more than twice as high as in households where the reference person
has at most primary education (PLN 151.0 thousand).
Another feature that strongly differentiates the value of net wealth is the labour force status of the
reference person (see Figure 1.2 right-hand panel). Households in which the reference person con-
ducts their own business activity (self-employed status) are clearly more affluent (PLN 783.6 thou-
sand) than households having employee status (PLN 238.6 thousand) or pensioner status (PLN 201.6
thousand). Net wealth varies significantly with the age of the household reference person, reaching
the highest value when the household reference person attains the age of 45 - 64 (PLN 304.5 thousand)
increasing from PLN 141.5 thousand in the case of young households (16 - 34 years), and then falling
to PLN 216.7 thousand in the case of the oldest households whose reference person is above 65 years
of age (see Figure 1.2 left-hand panel).
Figure 1.2. Net wealth depending on the age (left-hand panel) and the labour force status of the refer-
ence person (right-hand panel) – PLN thousands.
Source: BZGD, NBP.
Net wealth per household is strongly differentiated by the class of the geographical location of resi-
dence. Households in rural areas have on average much more wealth (PLN 366.1 thousand) than
households in urban areas (PLN 207, 2 thousands). Residents of large cities19 (over 200 thousand of
inhabitants) are clearly more affluent (PLN 258.3 thousand) than is in the case of smaller towns (PLN
184.7 thousand).
As consistently shown by the household wealth surveys worldwide20, the value of net wealth is pri-
marily determined by real assets accumulated by households, predominantly in the form of their main
18 The household head is the main person providing information to the interviewer during the survey. We use interchangeably
the terms the household reference person and the household head. 19 See Table A2, Statistical Annex. 20 For example, the ECB (2013a), Ynesta (2008).
-
50
100
150
200
250
300
350
400
16-24 25-34 35-44 45-54 55-64 65-74 75+
- 100 200 300 400 500 600 700 800 900
Net wealth
15 Household Wealth and Debt in Poland
residence and business assets. Financial assets are of clearly lesser importance in the process of wealth
accumulation. Debt resulting from the purchase of the main residence is a major factor lowering the
household net wealth.
The median value of the household main residence in the entire population was PLN 282.6 thousand
while business assets averaged PLN 219.7 thousand. An important component of household assets is
also the value of other property than their main place of residence (PLN 150.0 thousand). The holding
of particular real assets varies across various groups of households. While the vast majority of house-
holds own their main residence (76.4%) and motor vehicles (63.0%), much fewer households declared
other real estate (19.1%) or business assets (18.8%) as components of their wealth. Business assets
amount to an average of PLN 219.7 thousand and represent a significant part of wealth of the most
affluent households in Poland (see Table 1.2). At the same time, as compared to other countries in the
euro area both the frequency (18.8% versus 11.1% in the euro area) and the value of that wealth com-
ponent (EUR 52.8 thousand versus EUR 30.0 thousand in the euro area) are relatively high in Poland.
Financial assets represent a relatively small part of total net wealth and amount to an average (median
of the total financial assets) of PLN 8.6 thousand. Individual components of financial assets are very
unevenly distributed across households, and their average value varies significantly. For example,
bank deposits are the most popular form of fund collection (81.9% of households hold bank deposits),
whereas the value of assets accumulated in the form of deposits is relatively small (PLN 5.0 thousand).
On the other hand, households are far less likely to invest their savings in investment funds (4.2% of
households), while in the case of such assets the figures are, on the average, significantly higher (PLN
11.9 thousand).
Liabilities of households, comprising various forms of debt (for example, mortgage loans, consumer
loans, etc.) are for the average household a relatively small burden on its assets (PLN 10.0 thousand).
On the other hand, as in the case of financial assets, households differ considerably both in terms of
the debt profile and debt level of particular types of commitments. For example, liabilities resulting
from secured housing loans (mortgages), which are the main component of household debt in Poland,
concern only 12.1% of households, yet represent a relatively high burden for them (an average of PLN
104.0 thousand). In contrast, other loans, primarily consumer loans21 are much more common (23.5%
of households claim to have taken a consumer loan), but their value in household liabilities is much
lower (on average PLN 5 thousand).
21 These are consumer loans (for example, for the purchase of a car or another motor vehicle, to finance business or professional
activity, for other loan repayment, for educational purposes, to finance living costs, for other purposes) and loans for con-
sumption purposes taken out at banks and non-bank financial institutions.

Net wealth
16 Household Wealth and Debt in Poland
Table 1.1. Net wealth and assets of households – main characteristics
Household
struc-ture
Net wealth Assets
Real assets Financial assets
%
median (PLN thou-sand)
mean PLN thou-sand)
%
median (PLN thou-sand)
mean PLN thou-sand)
%
median (PLN thou-sand)
mean PLN thou-sand)
All households 100.0 256.8 411.1 88.8 307.4 470.5 88.7 8.6 21.9
Ownership status
Owner outright 65.2 355.0 523.3 100.0 343.5 508.8 91.0 9.4 22.5
Owner with housing loan 11.2 275.6 477.7 100.0 422.0 596.0 96.9 13.4 33.5
Tenant or other 23.6 4.6 68.7 52.3 13.0 119.2 78.3 4.7 13.4
Household type
One-person household¹ 30.3 160.2 239.1 77.4 202.0 299.6 78.3 4.0 18.0
Couple without children 19.3 247.2 411.2 94.0 270.0 439.1 92.2 10.1 26.2
Couple with children 32.3 314.2 488.8 93.7 362.0 538.5 93.9 10.6 24.0
Extended-family household 18.1 403.5 559.9 93.2 413.7 581.2 92.8 9.1 19.3
Age of the reference person
16-34 15.7 141.5 272.3 85.4 254.0 347.1 91.4 9.1 19.3
35-44 18.4 286.0 470.8 91.7 372.3 537.6 91.9 10.0 25.3
45-64 43.3 304.5 485.5 91.0 345.0 523.4 90.3 9.5 23.9
65+ 22.6 216.7 321.5 84.8 260.0 367.8 81.1 5.0 16.9
Labour force status of the refer-ence person
Employed 45.5 238.6 359.3 91.0 297.0 406.2 93.7 9.9 24.5
Self-employed 11.1 783.6 1 068.1 99.8 789.4 1 073.5 94.8 18.0 32.7
Retired and other not working 43.4 201.6 297.1 83.6 252.0 346.4 81.8 5.5 15.6
Education of the reference person
Primary or no education 15.7 151.0 270.2 73.1 257.0 366.8 69.3 3.7 9.2
Secondary education 60.9 247.8 423.2 89.8 285.0 470.7 90.3 8.0 16.6
Higher education 23.4 343.6 473.1 96.6 393.6 500.8 97.5 18.1 40.9
Class of geographical location
Urban areas 67.1 207.2 335.3 86.4 265.1 390.0 90.5 9.1 24.0
Rural areas 32.9 366.1 565.5 93.4 405.5 606.9 84.9 7.7 17.4
Net income (quantiles)
0-20% 20.0 120.0 196.0 69.2 200.0 278.3 67.8 2.4 7.7
20-40% 20.1 178.6 280.2 85.1 200.0 322.8 87.7 4.8 12.6
40-60% 20.0 253.8 364.5 93.7 272.0 390.4 92.4 7.6 15.8
60-80% 20.0 357.5 552.5 96.5 392.7 583.4 97.0 11.2 22.3
80-90% 10.0 405.8 507.0 99.4 401.3 513.0 98.4 18.8 26.2
90-100% 10.0 539.0 817.2 99.2 587.0 832.9 98.4 34.1 64.5
Net wealth (quantiles)
0-20% 20.0 6.9 12.6 44.3 7.0 29.0 6.9 3.4 6.8
20-40% 19.9 129.9 125.2 99.4 132.0 139.2 89.9 6.3 12.5
40-60% 20.1 256.8 257.8 100.0 254.7 260.7 96.0 10.0 20.3
60-80% 19.9 455.4 458.8 100.0 448.8 457.2 95.8 11.5 22.4
80-90% 10.0 698.6 715.5 100.0 695.8 713.5 97.6 12.3 24.2
90-100% 10.0 1 263.8 1 692.7 100.0 1 245.3 1 672.4 99.1 26.5 62.5
Source: BZGD, NBP.

Net wealth
17 Household Wealth and Debt in Poland
1.2. Distribution of net wealth
Net wealth is unevenly distributed across households, and their strong concentration is observed in
the group of the most affluent households. This is a common phenomenon observed in both devel-
oped and developing countries22. According to the data collected in this survey, 10% of the most afflu-
ent households hold 37% of the total net assets, while for 20% of the least wealthy households; (net)
accumulated assets represent only a small part (1.0%) of the total households’ assets.
A fraction of households (5.9%) failed to gather wealth of a net positive value, out of which 2.6% hold
total debt exceeding the stock of all the accumulated assets meaning wealth of a net negative value. In
the case of 1% of the least affluent households, net value of their wealth does not exceed PLN -4.5
thousand, with the lowest recorded value of PLN -130 thousand. The average (median) household
collects (net) assets worth up to approx. PLN 257 thousand, while 1% of the most affluent households
hold (net) assets amounting to at least PLN 2.8 million (see Figure 1.3).
The difference in income and wealth inequalities is reflected in the Lorenz curve (see Figure 1.4 left-
hand panel), which is the cumulative distribution of a particular category (income in the economy,
wealth in the population). The diagonal line reflects equal distribution of a particular variable in the
population. The size of the field between the line of equal distribution and the Lorenz curve corre-
sponds to the Gini coefficient - the higher the Gini coefficient, the greater the inequality. The Gini coef-
ficient for the net wealth is 57.9%, while for net income amounts to 38.4%. Income inequality in Poland
is less pronounced than wealth inequality, which is also in line with the global trends23. The House-
hold Wealth and Debt Survey data show that 10% of the highest-net-income households generate 23%
of the total income of all households, while income of 20% of the lowest-income households accounts
for a mere 7% of the total income.
The Gini coefficient for net income in the Household Wealth and Debt Survey is therefore higher than
that obtained in such surveys as the EU-SILC survey (30.7%, 2013), the household budget survey
(33.8%, 2013) or Social Diagnosis [Diagnoza Społeczna] (28.5%, 2015), which shows a considerable
span of results24. The data derived from the Household Wealth Survey point to a larger scale of in-
come inequality in Poland, as they better capture the highest income households in the sample than
other surveys. This was achieved thanks to the above mentioned procedure25 of oversampling the
most affluent households which may also be expected to generate a higher income. This was suggest-
ed by the experience of the euro area countries from the findings of the survey of financial situation of
households, including their assets and debt, gathered under the HFCN project, where also the values
of the Gini coefficient are higher than those calculated on the basis of data from other surveys26 such
22 See OECD (2015), UNO (2013). 23 OECD – op. cit., UNO - op. cit. 24 The analysis of the reasons for the divergence of Gini coefficient estimates for Poland between the EU-SILC study and the
Household Budget Surveys may be found in the paper by Wójcik-Żołądek ( 2013). 25 See also NBP (2015b), being a methodological annex to this study. 26 For example Arrondel et al. (2014), relying on the data from the HFCN study, present the Gini coefficient estimate at the level
of 42.1% (for gross income, 2010), whereas the EU-SILC data, available at the website of the Eurostat, show the Gini coefficient
of 30.2% (disposable income, allowing for the equivalence scale, 2010).

Net wealth
18 Household Wealth and Debt in Poland
as the EU – SILC survey (Arrondel et al., 2014). What should be borne in mind is the limited compara-
bility of inequality measures, including the Gini coefficient for various surveys. This results, apart
from diversified representativeness of the surveyed households, also from different income measures
used (gross, net) and possible allowance made for demographic composition of a household (use of
the scale of equivalence) etc. For example, the Gini coefficient according to this survey, calculated for
net income using the scale of equivalence (as defined by the OECD) is 34.6%, thus being quite close to
the one calculated on data from the household budget survey.
Despite the attempts to factor in lower propensity of wealthy households to participate in the survey
in the sampling algorithm (see Methodological appendix - NBP, 2015b), it appears that the share of the
richest households in the survey is lower than the actual one (see Box 1.1). Consequently, the scale of
wealth inequalities in Poland is probably greater than suggested by the survey results.
Figure 1.3. Distribution of household net wealth
Source: BZGD, NBP.
Note: The Figure presents upper marginal values of percentiles of the net asset value.
-500
0
500
1 000
1 500
2 000
2 500
3 000
0 10 20 30 40 50 60 70 80 90
Net
Wealt
h (
tho
us
. P
LN
)
Percentiles
P90: 879 thous. PLN
P70: 457 thous. PLN
P50: 257 thous. PLN
P30: 130 thous. PLN P10: 2 thous. PLN
P80: 606 tys.
zł

Net wealth
19 Household Wealth and Debt in Poland
Figure 1.4. The Lorenz curves for net wealth and net income (left-hand panel). The way of acquiring of the household main
residence across net wealth deciles (right-hand panel).
Source: BZGD, NBP.
The fact of possessing the principal place of residence is associated with the level of net wealth - the
percentage of households owning their place of residence is rising rapidly from almost 2% for the least
affluent household to more than 95 % for middle wealth households and more affluent households
(see Figure 1.4 right-hand panel). The role of home construction is rising and the role of purchase of
the main residence is declining with higher wealth (the poorest households from the bottom decile of
wealth are an exception). More than 75% of less wealthy households acquire their main residence
through purchase. In turn, more than 40% of households from the last quintile have built their main
residence on their own, and only 25% of them acquired it by the purchase. Also the number of house-
holds declaring to have acquired their place of residence through donation is rising with higher
household wealth, posting a 5-10% rise in the case of less wealthy households and a 20% rise in the
case of the richest households. Acquisition through donation does not seem to be related to the level
of assets and the percentage of households that were donated the property is in the range of 5-15%.
Different levels of wealth and its components in particular wealth groups are illustrated in Table 1.2.
This table presents balance sheets for three deciles of households – the poorest households, middle
wealth households and the richest households.
The sum of net wealth of the 10% least wealthy households is negative (approx. – PLN 3.6 billion).
This results from a small share of households in this group being owners of their main residence (ap-
prox. 1.6%) and a relatively high level of loan-related debt resulting from non-housing credit and
loans (comparable with housing debt and even higher than among middle wealth households). Motor
vehicles in this group account for a major part of real assets (approx. 10%) as compared to other
groups of households. At the same time, as a result of a relatively low level of real assets, financial
assets play a very important role in the assets of the least wealthy households (approx. 26% of all as-
sets versus approx. 3-6% of all assets in two comparable wealth groups). The value of fixed assets held
-20%
0%
20%
40%
60%
80%
100%
0% 20% 40% 60% 80% 100%Cu
mu
lati
ve
shar
e o
f n
et w
eal
th /
net
inco
me
Cumulative share of household
net income net wealth line of equality
0%
20%
40%
60%
80%
100%
Net wealth deciles
No answer
Don't know
Donation
Inheritance
Own construction
Purchase
Percentage of households owning the household main residence (rhs)

Net wealth
20 Household Wealth and Debt in Poland
in this group is almost one hundred times smaller than the value of fixed assets held by middle wealth
households and the value of total financial assets approximately twenty times smaller.
Net wealth of middle wealth households amounts to approx. PLN 345 billion, the overwhelming part
being fixed assets, including primarily household’s principle residence (owned by approx. 95% of
households and accounting for approx. 79% of total assets). Other real estate and business assets,
which are not held by the poorest group of households, account in this group, for approx. 7% and
2.7% of total assets, respectively. Housing loans are the main component of household debt, represent-
ing approx. 90% of the total debt.
The wealthiest 10% of households have accumulated PLN 2.3 billion worth of assets. The vast majority
of them own their main residence (approx. 99%). Similarly to other wealth groups, this asset compo-
nent constitutes the main asset, but its share in comparison to other asset components in this group is
the lowest (approx. 52.5%). The role of other real estate property (approx. 14.7% of assets) and, above
all business assets is considerably rising (approx. 26.7% of assets). Financial assets account for a rela-
tively small part of household wealth. Housing loans are the main component of household liabilities
(approx. 69%), but as compared to middle-income households other the type of debt (approx. 31%) is
clearly gaining in importance.

Net wealth
21 Household Wealth and Debt in Poland
Table 1.2. Households by their net wealth
10% of the poorest households
ASSETS LIABILITIES
Value (PLN
million) Share (%)
Value (PLN million)
Share (%)
Total assets 5 482.5 100.0 Total liabilities 9 089.1 100.0
Real assets 4 076.2 74.3 Housing loans 4 669.7 51.4
Household main residence 3 357.7 61.2 Residential loans backed on the main residence
4 669.7 51.4
Other real estate property - 0.0 Residential loans backed on another real estate
- 0,0
Vehicles 568.9 10.4 Non-housing credit and loans 4 419.4 48.6
Valuables 149.6 2.7
Self-employment business wealth - 0.0
Financial assets 1 406.3 25.7
Deposits 622.5 11.4 NET WEALTH
Mutual funds 18.1 0.3 Value (PLN million)
Shares 16.1 0.3 Net wealth - 3 606.7
Bonds - 0.0
Receivables 69.6 1.3
Voluntary pension schemes/ life insurance policies
680.0 12.4
Other financial assets - 0.0
10% of the middle wealth households (45%-55%)
ASSETS LIABILITIES
Value (PLN
million) Share (%)
Value (PLN million)
Share (%)
Total assets 369 852.9 100.0 Total liabilities 35 642.8 100.0
Real assets 348 097.9 94.1 Housing loans 31 715.3 89.0
Household main residence 297 937.6 80.6 Residential loans backed on the main residence
30 406.2 85.3
Other real estate property 23 659.9 6.4 Residential loans backed on another real estate
1 309.2 3.7
Vehicles 13 748.0 3.7 Non-housing credit and loans 3 927.5 11.0
Valuables 2 352.6 0.6
Self-employment business wealth 10 399.9 2.8
Financial assets 21 754.9 5.9
Deposits 14 968.6 4.0 NET ASSETS
Mutual funds 579.2 0.2 Value (PLN million)
Shares 571.7 0.2 Net assets 344 424.0
Bonds 396.0 0.1
Receivables 398.2 0.1
Voluntary pension schemes/ life insurance policies
4 290.8 1.2
Other financial assets 550.3 0.1
10% of the wealthiest households
ASSETS LIABILITIES
Value (PLN
million) Share (%)
Value (PLN million)
Share (%)
Total assets 2 346 664.3 100.0 Total liabilities 54 504.5 100.0
Real assets 2 264 672.0 96.5 Housing loans 37 598.6 69.0
Household main residence 1 238 033.3 52.8 Residential loans backed on the main residence
31 279.5 57.4
Other real estate property 345 641.4 14.7 Residential loans backed on another real estate
6 319.2 11.6
Vehicles 46 349.4 2.0 Non-housing credit and loans 16 905.9 31.0
Valuables 4 662.7 0.2
Self-employment business wealth 629 985.3 26.8
Financial assets 81 992.3 3.5
Deposits 53 635.0 2.3 NET ASSETS
Mutual funds 11 493.6 0.5 Value (PLN million)
Shares 2 137.1 0.1 Net assets 2 292 159.8
Bonds 2 141.5 0.1
Receivables 1 964.8 0.1
Voluntary pension schemes/ life insurance policies
6 702.5 0.3
Other financial assets 3 917.8 0.2
Source: BZGD, NBP.
Net wealth
22 Household Wealth and Debt in Poland
Box 1.1. The richest households and distribution of wealth
Empirical studies show that concentration of wealth in the group of the richest is very high (Wolff 2006; Ken-
nickell 2007; Davies et al. 2010). For this reason, we need a good representation of this group in the sample in
order to determine the degree of inequality of wealth distribution. At the same time, given lower propensity of
wealthy households to participate in the surveys, the share of this group of households should be higher in the
sample than in the population so that the number of those households as shown in the survey results reflect
their size in the population.
For this purpose, the drawing algorithm takes into account parameters that are potentially related to the
wealth level. The most effective way is to use administrative data that are strongly associated with the wealth
level (e.g. real property tax or income tax). In the present survey we did not use this type of individual data.
Statistical districts (encompassing several dozen of dwellings), where the richest households were expected to
be domiciled, were identified in 10% of those municipalities where in 2013 the highest average personal in-
come taxes were paid. Within these municipalities statistical districts were selected with the largest average
housing area (based on the census figures).
In order to ascertain whether the distribution of wealth in the sample reflects the distribution across the popu-
lation we can rely on publicly available information on wealth of the richest Poles (Forbes, 2014). Households
in the sample, even the richest ones, will be closer to the central part of wealth distribution, and the richest
ones in the very tail of the distribution. If the form of the distribution estimated on the basis of the sample used
in the survey is the same as when taking into account the data on the wealthiest households, this means, that
the sample is representative also in the upper tail of the distribution. Empirical studies show that the distribu-
tion of wealth is in line with power-law distribution (Clauset et al. 2009).
So we can estimate the exponent of this distribution based on the sample and compare it with the exponent
obtained on the basis of the data containing both the survey data and data from the list of the richest house-
holds. This survey was carried out in the euro area countries and the United States on the basis of the data
published on the Forbes list of the richest people (Vermeulen, 2014). It shows that wealth distribution in the
population is particularly well reflected in countries where tax data were used to identify households for sam-
pling (USA, Spain, France) whereas in other countries (Germany, Austria, Italy, Belgium, the Netherlands) the
sample underestimates the degree of wealth concentration.
The variable is a power-law distribution variable if its probability distribution is as follows:
𝑝(𝑥) ∝ 𝛼𝑥−𝛼
where α is called the exponent of decomposition or the scaling parameter.
The empirically found power-law distributions concern primarily the tails of the distribution (observations of
extreme values, and not the entire distribution), and are characterized by an exponent in the range of 2 <α <3.
If logarithmized, both sides of the first equation give the following:
ln(𝑝(𝑥)) = −𝛼 ln(𝑥) + 𝐶
where C is a constant.
The above equation is often used to check if a variable is a power-law distribution variable – it is checked
whether the variable x and its histogram, both shown on a logarithmic scale, follow a straight line with a slope
-α. This procedure usually turns out to be unreliable, but if, instead of the probability density function, the
distribution function is used and the histogram is constructed using ranks, the error in estimating the exponent
is very small (Clauset et al. 2009). This approach was used in this analysis. Break point value wealth from
whose level the distribution takes a form of a power-law distribution (PLN 757 thousand) was determined in
accordance with the procedure proposed by (Clauset et al. 2009) based on the data from the sample without

Net wealth
23 Household Wealth and Debt in Poland
the use of weights.
Figure 1.5 shows the estimation of the upper part of wealth distribution based on the data from the Household
Wealth and Debt Survey (BZGD) and based on data from the Household Wealth and Debt Survey (BZGD)
correlated with the Forbes data. It turns out that the scaling parameter is lower if the list of the richest people
in Poland is factored in. The higher scaling parameter obtained on the basis of the Household Wealth and Debt
Survey (BZGD) data suggests a lower degree of concentration of wealth than the actual one. In other words,
the scale of inequality in the distribution of wealth is higher than suggested by the Household Wealth and
Debt Survey (BZGD) data because it failed to sufficiently account for the wealth of the richest people. These
results are consistent with those for other countries, where administrative data were used when sampling the
households (see. Vermeulen, 2014).
Figure 1.5. The power-law distribution taking into account the survey data only and the one additionally
taking into account the data on the richest people.
Notes: The logarithm of the complementary power-law distribution function estimated on the basis of the
histogram using ranks was shown on the vertical axis. The logarithm of net wealth in PLN was shown on the
horizontal axis. The first observation in the upper left-hand part of the graph corresponds to assets in the
amount of PLN 757 thousand, and the last observation in the lower right-hand corner corresponds to the assets
of approx. PLN 11 billion.
Source: BZGD, NBP.
α= 2,63
α = 3,00
BZGD+Forbes BZGD Forbes

Net wealth
24 Household Wealth and Debt in Poland
1.3. Net wealth in Poland as compared to the euro area countries
Net wealth of an average household27 in Poland (EUR 61.7 thousand) accounted for approx. 56 % of
the median net wealth of an average household in the euro area28 (EUR 109.2 thousand). This means
that Polish households are moderately wealthy as compared to the euro area countries, with average
net wealth similar to that observed in such countries such as Austria (EUR 76.4 thousand), Portugal
(EUR 75.2 thousand), Slovakia (EUR 61.2 thousand) and Germany (EUR 51.4 thousand). Luxembourg
(EUR 397.8 thousand), Cyprus (EUR 266.9 thousand) and Malta (EUR 215.9 thousand) feature the
highest net wealth per household in the euro area.
The above mentioned countries with the level of net wealth per average household relatively similar
to that observed in Poland, form a heterogeneous group in terms of the level of development, as
measured by GDP per capita. On the one hand, these include the least developed euro area countries
such as Portugal (78% of GDP per capita of the EU-28, 2014, PPS – Purchasing Power Standard) and
Slovakia (76% of GDP per capita of the EU-28, 2014, PPS) and, on the other hand, countries belonging
to the forefront in the European Union in terms of the level of development, such as Germany (124%
of GDP per capita of the EU-28, 2014, PPS) and Austria29 (128% of GDP per capita of the EU-28, 2014,
PPS). Bearing in mind that the main place of residence is the household main asset, determining the
total household wealth (if the household owns a real estate), based on the behaviour of this variable
we can explain the position of these countries at the bottom part of the distribution of net wealth. In
countries with lower GDP per capita, belonging to the analysed group, ownership of the occupied
property is much more common (Slovakia -89.9% of households, Portugal - 71.5%, Poland - 76.4%)
than in wealthier countries in terms of GDP (Austria - 47.7%, Germany - 44.2%), where, in turn, rental
of dwellings is much more common. With considerably lower prevalence of property ownership in
the latter group of countries, their average (median) value is much higher (Austria – EUR 200.0 thou-
sand, Germany – EUR 168.0 thousand) than in countries with lower GDP per capita (Slovakia – EUR
55.9 thousand, Portugal – EUR 90.0 thousand, Poland - EUR 67.9 thousand).
Financial assets of Polish households are of lesser importance as a component of their total net wealth
than is the case in the euro area. The average household in Poland has gathered financial assets worth
EUR 2.1 thousand (conditional median) as compared to EUR 72.6 thousand, which is the average val-
ue of real assets. In contrast, in the euro area a household has an average of EUR 11.4 worth of finan-
cial assets (conditional median) and the average stock of real assets amounting to EUR 144.8 thousand.
Households in Poland are significantly less indebted than the euro area countries, in relation to the
accumulated gross assets. In Poland, the average total debt is EUR 2.4 thousand (slightly more than
6% of gross assets), while in the euro area the average household debt is EUR 21.5 thousand (approx.
22% of gross assets).
27 Translated into the EUR at the exchange rate published by NBP on 30 June 2014 of 4.1609 PLN/EUR. 28 Here and in the later part, values for the euro area based on the ECB (2013a). 29 All data on GDP per capita taking into account the purchasing power standard, based on Eurostat
(http://ec.europa.eu/eurostat).

Net wealth
25 Household Wealth and Debt in Poland
Net wealth of households in Poland is generally more evenly distributed than in the euro area. In par-
ticular, wealth inequalities in Poland, as measured by the Gini coefficient, amount to 58% as compared
to the average of 68% in the area euro30. Poland is therefore a country with considerably smaller
wealth inequalities, similarly to Greece (56%), Slovenia (53%) or Slovakia (45%). The largest wealth
inequalities, as measured by the Gini coefficient, are observed in Germany and Austria (76%) and
Cyprus (70%).
Larger wealth inequalities may be observed especially in the United States. In Poland 10% of the rich-
est households own 37% of net assets, the average euro area31 figure being 50% and the US figure 84%.
Differences as regards inequalities in the distribution of wealth in Europe as compared to the United
States32 are, however, probably less pronounced. Data for Poland (see Box 1.1) and most euro area
countries fail to sufficiently factor in the wealthiest people, while in the United States they seem also
to appropriately reflect the situation of the wealthiest ones33 (Vermeulen, 2014).
To sum up this part of the study, the results of the surveys of the affluence of Polish households, in
terms of the main measure of wealth - net wealth, correspond to the regularities observed in the euro
area. Net wealth value of the average Polish household against the euro area countries is relatively
low, reflecting the level of income of Polish households. Assets of Polish households consist, for the
most part and to a considerably larger extent than in the euro area, of real assets (95.5% of total assets),
mainly real estate (66.5%), with a small share of financial assets (4.5%). Such a composition of assets is
typical of relatively less developed countries (e.g. Slovakia, Portugal) with a quite modest level of
income and a moderate degree of development of the financial system, with a relatively low house-
hold debt as one of the consequences. At the same time, households in these countries show a strong
propensity to own occupied dwellings34 as a result of which the average net wealth of households in
these countries, including Poland, is above the average observed in some other countries (Germany),
where households have relatively higher income. The second feature distinctive for Polish households
is a high percentage of people declaring ownership of business assets as well as their level. For most
categories of the balance sheet, assets and liabilities in Poland are relatively low as compared to most
euro area countries, but in the case of business values they appear to be relatively high. A wider de-
bate concerning international comparisons of net wealth of households in the euro area, including
differences between income and wealth of households across countries, is presented in papers based
on the data from the HFCN survey35.
30 ECB (2013a) – op. cit. 31 Fessler i Schürz (2013). 32 Federal Reserve (2014). 33 Higher possibility to include the richest in the sample usually results from access to administrative data. 34 This is most likely the effect of both the poorly developed housing market and institutional and cultural differences. 35 The updated list of publication, using the HFCN survey data, may be found at the website:
https://www.ecb.europa.eu/pub/economic-research/research-networks/html/researcher_hfcn.en.html.

Net wealth
26 Household Wealth and Debt in Poland
Table 1.3. Net wealth of Polish households and their components against the background of the
euro area countries, taking into account the ownership of the main residence (median – EUR
thousand)
All household Owners of the main residence Non-owners of the main residence
As-sets
% of indebted house-holds
Liabili-ties
Net wealth
% of households
As-sets
% indebted house-holds
Liabili-ties
Net wealth
% of households
As-sets
% indebted house-holds
Liabil-ities
Net wealth
PL 70.7 37.0 2.4 61.7 77.4 88.0 38.7 3.4 83.7 22.6 2.2 31.1 0.8 1.0
BE 249.9 44.8 39.3 206.2 69.7 335.5 51.5 55.9 304.1 30.4 9.9 29.5 4.5 7.6
DE 67.9 47.4 12.6 51.4 44.2 263.1 54.7 61.7 215.5 55.8 13.3 41.6 3.3 10.3
GR 110.2 36.6 14.6 101.9 72.4 152.1 38.6 20.0 136.5 27.6 7.0 31.5 5.0 5.4
ES 210.2 50.0 36.0 182.7 82.7 245.6 51.9 43.4 214.3 17.3 9.1 40.7 8.0 5.1
FR 150.4 46.9 28.4 115.8 55.3 273.8 56.5 44.2 238.4 44.7 9.5 34.9 4.4 7.8
IT 188.0 25.2 15.0 173.5 68.7 259.5 27.3 31.0 250.8 31.3 12.0 20.6 5.0 10.8
CY 331.9 65.4 60.2 266.9 76.7 425.4 69.5 77.5 349.0 23.3 21.0 51.8 17.9 16.3
LU 494.4 58.3 73.4 397.8 67.1 636.1 64.0 104.7 556.2 32.9 28.1 46.8 10.0 22.1
MT 227.4 34.1 15.7 215.9 77.7 276.1 37.3 18.8 267.0 22.3 22.6 22.8 3.4 21.7
NL 217.3 65.7 89.1 103.6 57.1 330.5 83.5 132.8 214.8 42.9 25.7 42.0 11.2 19.3
AT 92.8 35.6 13.8 76.4 47.7 264.1 42.4 30.8 241.2 52.3 13.7 29.4 3.6 11.6
PT 93.2 37.7 31.7 75.2 71.5 127.0 43.5 40.6 106.1 28.5 5.5 23.3 3.0 4.5
SI 105.2 44.5 4.3 100.7 81.8 136.1 48.1 4.7 134.0 18.2 4.0 28.1 2.4 3.5
SK 64.4 26.8 3.2 61.2 89.9 69.6 26.9 4.1 65.6 10.1 2.6 25.6 1.0 2.2
FI 132.7 59.8 29.4 85.8 69.2 196.4 64.7 56.7 153.1 30.8 5.2 49.0 4.9 2.8
EA 142.0 43.7 21.5 109.2 60.1 253.0 48.9 50.0 217.6 39.9 11.5 35.9 4.3 9.1
Legend: PL - Poland, BE - Belgium, DE - Germany, GR - Greece, ES - Spain, FR - France, IT - Italy, CY - Cyprus LU - Luxemburg,
MT - Malta, NL - Netherlands, AT - Austria, PT - Portugal, SI - Slovenia, SK – Slovakia, FI - Finland, EA – euro area.
Source: BZGD, NBP; HFCN (2013).

Assets
27 Household Wealth and Debt in Poland
2. Assets
Household assets may be broken down into two main types of assets: real assets and financial assets.
Both real assets and financial assets are in portfolios of the vast majority of households (88.8% and
88.7% respectively), and their total value is predominantly determined by the value of real assets.
They account for 95.2% of total assets of this sector. As a result, the average value (median) of real
assets is significantly higher (PLN 302.1 thousand) than that of financial assets (PLN 8.6 thousand).
Widespread ownership of real assets and financial assets which represent the overwhelming majority
of total household wealth is typical of developed countries as evidenced by the HFCN results. In the
euro area, 91.1% of households hold real assets, while 96.8% of all households own financial assets.
The average value (median) of real assets (PLN 144,8 thousand) exceeds, by far, the value of financial
assets (EUR 11.4 thousand). In Poland the situation is similar.
Household net income (Figure 2.1) is a significant factor explaining the differences in the level and the
structure of assets between households. The percentage of households holding both real assets and
financial assets increases with higher income (the largest differences in these percentages are observed
between the first and the second decile group). In addition, the more income generated by a house-
hold, the higher the value of assets acquired by the household and the higher the share of financial
assets in household’s portfolio.
Figure 2.1. The structure of gross assets of households determined by household net income (left-hand panel: the share of
components in the total value -%, and the percentage of households holding particular components -%; right-hand panel: medi-
an in PLN thousand.
Source: BZGD, NBP.
40%
50%
60%
70%
80%
90%
100%
Net income deciles
real assets financial assets
real assets (% hh) financial assets (% hh)
-
5
10
15
20
25
30
35
40
-
100
200
300
400
500
600
700
Net income deciles
real assets financial assets (rhs)

Assets
28 Household Wealth and Debt in Poland
2.1. Real assets
Similarly to the euro area countries, real property constituting the household main residence (76.4%)
and motor vehicles (63.0%) are the most common real assets held by Polish households. A smaller
proportion of households hold other assets i.e. valuables (25.7%), other real estate property (19.1%),
self-employment business assets (18.8%). As regards the value structure of real assets, real estate is its
largest component: the household main residence accounts for 69.7%, and other property for 11.1% of
real assets. Also self-employment business wealth representing 15.8% account for a relatively large
share of assets. Other real assets, namely vehicles and valuables represent the total of 3.4%. In the fol-
lowing part of the analysis the latter two categories have been combined due to their low share in the
structure of real assets.
Figure 2.2. The structure of real assets (left-hand panel: percentage of households -%, share of the
aggregate -%, right-hand panel: median in PLN thousand) by net income (decile groups)
Source: BZGD, NBP.
0%
10%
20%
30%
40%
50%
60%
70%
80%
90%
100%
Net income deciles
self-employment business wealth
valuables
vehicles
other real estate property
household main residence
household main residence (% hh)
other real estate property (% hh)
vehicles (% hh)
valuables (% hh)
self-employment business wealth (% hh)
0
50
100
150
200
250
300
350
400
450
500
Net income deciles
household main residence
other real estate property
vehicles
valuables
self-employment business wealth

Assets
29 Household Wealth and Debt in Poland
Table 2.1. Real assets of households - main characteristics
Real assets
Total
Household main
residence
Other real estate
property
Self-employment
business wealth
Other
%
median (PLN
thousand)
mean (PLN
thousand) %
All households 88.8 307.4 470.5 77.4 19.1 18.8 69.8
Ownership status
Owner-outright 100.0 343.5 508.8 100.0 20.9 22.5 74.5
Owner with housing loan 100.0 422.0 596.0 100.0 25.4 22.7 88.4
Renter or other 52.3 13.0 119.2 4.3 11.2 6.6 48.1
Household type
One-person household¹ 77.4 202.0 299.6 66.5 12.2 6.4 41.8
Couple without children 79.5 270.0 439.1 79.5 70.0 14.7 76.3
Couple with children 81.0 362.0 538.5 81.0 82.7 25.7 85.5
Extended family 87.2 413.7 581.2 87.2 77.3 31.6 81.5
Age of the reference person
16-34 85.4 254.0 347.1 59.1 20.8 15.0 77.8
35-44 91.7 372.3 537.6 78.3 24.0 27.3 81.0
45-64 91.0 345.0 523.4 82.9 20.5 23.9 73.5
65+ 84.8 260.0 367.8 79.2 11.6 4.8 48.8
Labour force status of the reference person
Employed 91.0 297.0 406.2 75.6 22.3 11.9 22.3
Self-employed 99.8 789.4 1 073.5 92.1 28.9 94.8 28.9
Retired and other not working 83.6 252.0 346.4 75.6 13.3 6.5 13.3
Education of the reference person
Primary or no education 73.1 257.0 366.8 65.8 6.1 12.0 40.0
Secondary education 89.8 285.0 470.7 78.5 17.8 20.7 72.2
Tertiary education 96.6 393.6 500.8 82.3 31.2 18.4 83.6
Class of locality
Urban areas 86.4 265.1 390.0 72.7 20.3 12.2 20.3
Rural areas 93.4 405.5 606.9 86.9 16.7 32.2 16.7
Net income (quantiles)
0-20% 69.2 200.0 278.3 60.5 7.1 4.8 30.5
20-40% 85.1 200.0 322.8 70.7 12.1 10.9 59.5
40-60% 93.7 272.0 390.4 80.2 18.2 18.6 77.2
60-80% 96.5 392.7 583.4 86.4 21.5 26.5 88.5
80-90% 99.4 401.3 513.0 87.6 31.0 26.8 93.3
90-100% 99.2 587.0 832.9 91.1 42.2 39.4 92.9
Net wealth (quantiles)
0-20% 44.3 7.0 29.0 6.9 2.5 1.1 40.6
20-40% 99.4 132.0 139.2 89.9 11.4 4.0 62.7
40-60% 100.0 254.7 260.7 96.0 18.8 8.6 71.6
60-80% 100.0 448.8 457.2 95.8 22.8 23.4 82.2
80-90% 100.0 695.8 713.5 97.6 33.8 42.4 91.5
90-100% 100.0 1 245.3 1 672.4 99.1 46.3 71.2 92.2
Source: BZGD, NBP. Note: 1) The category includes single parents.

Assets
30 Household Wealth and Debt in Poland
Net income category clearly differentiates the structure of real assets of particular groups of house-
holds (Figure 2.2). With growing income, the percentage of households holding particular types of
real assets gradually increases. In addition, the wealthier the household, the greater the value of its
assets. The exception are self-employment business assets, whose average value (median) is slightly
fluctuating above the second decile of income, ranging between PLN 200-250 thousand. Household
main residence prevails in the structure of real assets held by less affluent households (90% of the total
real assets for the first decile group). With rising income, other assets, in particular, business assets
(22% of real assets for the last decile group) and other real estate property (18% in the case of this
group of households) account for a larger share in the structure of real assets . The share of household
assets associated with business activity is stable and seems to be independent of income, with the ex-
ception of the lower tail distribution.
Figure 2.3. The household main residence (left-hand panel) and self-employment business wealth by
age groups (right-hand panel) - the median value in PLN thousands; the percentage of households in
%.
Źródło: BZGD, NBP.
The age of the reference person is the feature which is responsible for significant differences between
households in terms of propensity to own major real assets. In particular, there is a clear correlation
between the stage of the household reference person in the life cycle and the household’s possession
of real estate properties (in particular, the household main residence - left-hand panel of Figure 2.3)
and self-employment business wealth (right-hand panel). Young households (whose reference person
is under the age of 35 years) rarely hold property, because they are at the beginning of their profes-
sional activity and have limited access to capital. They are also less likely to conduct business activity.
Then, as the reference person grows older over their professional life cycle, households tend to own
their household main residence more often (peak in the age group 55 - 64), and the share of owners of
business assets also increases (until the age of 45 - 54). In the case of households whose reference per-
son is at the retirement age, the number of households in the possession of their main residence de-
clines (perhaps due to the transfer of wealth to the next generation). Older households also limit their
business activity for similar reasons or due to the sale of their enterprise.
0%
20%
40%
60%
80%
100%
-
50
100
150
200
250
300
350
16-24 25-34 35-44 45-54 55-64 65-74 75+
Percentage of household (rhs) Median
0%
5%
10%
15%
20%
25%
30%
35%
-
50
100
150
200
250
300
16-24 25-34 35-44 45-54 55-64 65-74 75+
Percentage of household (rhs) Median

Assets
31 Household Wealth and Debt in Poland
Figure 2.4. The percentage of households holding particular real assets by the class of locality (left-
hand panel) and the type of conducting business (right-hand scale) -%
Source: BZGD, NBP.
Rural areas have higher concentration of households being owners of their main residence (left-hand
panel of Figure 2.4). Moreover, a greater percentage of households in rural areas (32.2%) claim to be
owners of self-employment business wealth than households in urban areas (12.2%). This stems large-
ly from the fact that households in rural areas are engaged in farming business. More than half (56%)
of business assets come from sole proprietorship (right-hand panel of Figure 2.4), whose value is as-
sessed at an average of approx. PLN 100 thousand. Companies employing more than one person are
valued at an average approx. PLN 275.5 thousand.
Poland belongs to the group of countries that feature a high proportion of ownership of the household
main residence (76.4%) as compared to the euro area countries. The average share of home ownership
in the euro area is 60.1% and varies strongly across countries, ranging from 47% in Austria and 4.43%
in Germany where ownership of the household main residence is relatively uncommon to approx.
90% in Slovakia. What is distinctive for Polish households is that young families in Poland tend to buy
their principal residence much more often than their counterparts in the euro area. Approximately
59% of households in Poland whose reference person is aged 16-34 own the property used as the
household main residence, while in the euro area countries this share is 31.9%36. In contrast, posses-
sion of other real estate property than the household main residence is less common in Poland than in
the euro area (19.1% and 23.1% respectively). Households in Poland hold a distinctly higher percent-
age of self-employment business wealth (18.8%) than their counterparts in the euro area (11.1%).
A similar percentage of households holding business assets was observed in such countries as Cyprus
(19.5%) and Italy (18.0%).
36 HFCN (2013b).
0
10
20
30
40
50
60
70
80
90
100
household main residence self-employment businesswealth
city / town countryside
56%
44%
single proprietorship
company employing more than one person

Assets
32 Household Wealth and Debt in Poland
Table 2.2. Real assets in Poland as compared to euro area countries (% of households, median in EUR
thousand)
Coun-try
Total Household main residence Other real estate property Self-employment business
wealth
% of house-
holds
median (EUR
thousand)
% of house-holds
median (EUR thousand)
% of house-holds
median (EUR
thousand)
% of house-holds
median (EUR thousand)
PL 88.8 72.6 77.4 67.9 19.1 36.0 18.8 52.8
BE 89.8 220.0 69.6 250.0 16.4 174.0 6.6 50.0
DE 80.2 89.2 44.2 168.0 17.8 115.0 9.1 19.4
GR 92.2 114.3 72.4 100.0 37.9 61.9 9.8 36.2
ES 95.3 201.7 82.7 180.3 36.2 120.2 14.2 50.8
FR 100.0 124.1 55.3 193.8 24.7 115.9 8.9 53.1
IT 97.7 176.0 68.7 200.0 24.9 100.0 18.0 15.0
CY 95.8 313.8 76.7 240.3 51.6 202.2 19.5 98.8
LU 93.6 470.5 67.1 500.0 28.2 300.0 5.2 97.6
MT 94.8 201.1 77.7 186.6 31.4 120.1 11.5 136.5
NL 89.8 198.8 57.1 240.0 6.1 165.5 4.8 51.7
AT 84.8 107.0 47.7 200.0 13.4 94.0 9.4 180.6
PT 90.1 91.9 71.5 90.0 27.1 53.5 7.7 47.1
SI 96.2 105.9 81.8 110.9 23.2 52.4 11.6 25.5
SK 96.0 61.8 89.9 55.9 15.3 16.4 10.7 4.6
FI 84.3 144.2 67.8 129.7 29.8 107.6 13.8 0.9
EA 91.1 144.8 60.1 180.3 23.1 103.4 11.1 30.0
Source: BZGD, NBP; EBC (2013).
Note: The column „Household main residence” shows the percentage of households holding the title to a part (not lower than
50%) or to the whole property.
2.2. Financial assets
The most common financial assets are bank deposits, held by 81.9% of households. More than half of
households (51.3%) accumulate savings in order to protect their family and dependents in the case
unfavourable random events (whole life insurance policies), or to finance their life needs after the end
of professional life cycle (voluntary37 pension schemes other than the Occupational Pension Schemes).
Households tend to invest much less in such products as investment funds (4.2%), shares (3.5%) and
bonds (1.0%) or hold other financial assets38 (7.2%). Bank deposits account for the bulk (68.2%) of the
total value of financial assets. Financial investments in securities represent 11.7% of the total financial
assets, of which approximately 61% are shares in investment funds. Savings under voluntary pension
schemes and the value of insurance policies make up 15.0% of total financial assets. Other financial
assets represent 5.1% of total financial assets.
37 Household receivables resulting from membership in public and occupational pension schemes are not treated as financial
assets of households. 38 The category of other financial assets includes financial assets held on accounts managed by professionals (e.g. brokers, finan-
cial advisers), derivatives, shares held in company (companies) not quoted on the stock exchange (on the public market) ex-
clusively as an investor or non-active shareholder and other household receivables.

Assets
33 Household Wealth and Debt in Poland
The wealthier the household, the higher the tendency to hold various financial assets (see Table 2.3
and Figure 2.5). The share of investments in mutual funds, stocks and bonds increases with higher net
income (19% of financial assets in the upper decile group, as compared to 4% in the lowest decile
group). Higher income households usually hold higher value financial assets (right-hand panel of
Figure 2.5). It should be noted that the share of funds collected under voluntary pension schemes and
insurance policies is relatively constant and independent of income (11-18%).
In addition to income, also the education of the reference person has a clear impact on the forms of
savings, which is particularly visible in the case of such assets as investment funds, bonds and stocks
(Table 2.3). In particular, 21% of households with higher education hold this type of financial assets as
compared to only 6.9% of households with secondary education and 1.8% with primary education.

Assets
34 Household Wealth and Debt in Poland
Table 2.3. Financial assets of households - main features
Financial assets
Total Deposits
Mutual funds, bonds, shares
Voluntary private pensions / Life insurance
Other
%
median (PLN
thousand)
mean (PLN
thousand) %
All households 88.7 8.6 21.9 81.9 7.5 51.3 6.9
Ownership status
Owner outright 91.0 9.4 22.5 84.2 7.4 53.0 6.1
Owner with housing loan 96.9 13.4 33.5 94.1 14.8 63.6 11.0
Tenant or other 78.3 4.7 13.4 69.6 4.4 41.0 7.4
Household type
One-person household¹ 78.3 4.0 18.0 67.7 4.6 38.2 6.1
Couple without children 92.2 10.1 26.2 85.4 10.0 58.0 6.8
Couple with children 93.9 10.6 24.0 90.0 9.6 57.8 8.8
Extended-family household 92.8 9.1 19.3 87.2 5.7 54.3 5.2
Age of the reference person
16-34 91.4 9.1 19.3 88.5 8.3 50.4 9.0
35-44 91.9 10.0 25.3 87.1 9.5 53.7 9.2
45-64 90.3 9.5 23.9 84.7 7.5 54.2 6.7
65+ 81.1 5.0 16.9 68.2 5.3 44.1 4.1
Labour force status of the reference person
Employed 93.7 9.9 24.5 89.3 10.1 58.8 7.9
Self-employed 94.8 18.0 32.7 92.5 6.5 47.7 13.0
Retired and other not working 81.8 5.5 15.6 71.3 4.9 44.3 4.4
Education of the reference person
Primary or no education 69.3 3.7 9.2 56.0 1.2 34.8 3.3
Secondary education 90.3 8.0 16.6 83.2 5.6 52.0 6.8
Tertiary education 97.5 18.1 40.9 95.7 16.4 60.3 9.6
Class of geographical location
Urban areas 90.5 9.1 24.0 83.9 8.9 54.2 7.8
Rural areas 84.9 7.7 17.4 77.7 4.6 45.4 5.2
Net income (quantiles)
0-20% 67.8 2.4 7.7 55.9 1.8 30.2 4.4
20-40% 87.7 4.8 12.6 77.9 3.1 45.0 5.7
40-60% 92.4 7.6 15.8 86.5 5.8 52.6 5.0
60-80% 97.0 11.2 22.3 92.0 10.0 60.2 8.0
80-90% 98.4 18.8 26.2 97.7 12.9 65.1 7.6
90-100% 98.4 34.1 64.5 96.5 20.2 71.3 15.6
Net wealth (quantiles)
0-20% 74.7 3.4 6.8 64.7 1.3 37.9 5.6
20-40% 90.2 6.3 12.5 81.9 5.6 57.2 5.3
40-60% 90.0 10.0 20.3 82.7 7.1 54.7 5.6
60-80% 92.1 11.5 22.4 86.6 11.4 51.7 6.4
80-90% 95.3 12.3 24.2 91.9 9.8 56.7 9.8
90-100% 96.9 26.5 62.5 94.9 14.1 52.9 13.5
Source: BZGD, NBP. Note: 1) The category includes single-parent families

Assets
35 Household Wealth and Debt in Poland
Figure 2.5. The structure of financial assets (left-hand panel: percentage of households -%, share of the
aggregate -%; right-hand panel; median in PLN thousand) according to net income (decile groups)
Source: BZGD, NBP.
The prevalence of financial assets as the form of wealth accumulation by households is lower in Po-
land than in most euro area countries (Table 2.4), which reflects the fact that banking services are gen-
erally less widespread in Poland. Similarly to the euro area countries, deposits are the most popular
financial asset, although the percentage of households holding them in Poland is significantly lower
than the euro area average (81.9% of households as compared to 96.4% in the euro area). Polish
households are also less inclined to invest in mutual funds, shares or bonds than their euro area coun-
terparts. Smaller figures are recorded in Slovakia and Greece. On the other hand, the percentage of
Polish households saving under voluntary pension plans and life insurance schemes (51.3%) is signifi-
cantly higher than the average in the euro area (33%) and exceeds the index for all the euro area coun-
tries39.
39 It should be noted that certain studies concerning the euro area countries point to problems with precise determination of the
scale of this phenomenon. As a result, those assets are often undervalued, thus becoming hardly comparable between coun-
tries. When comparing the Household Wealth and Debt Survey (BZDG) data concerning life insurance and voluntary pension
funds with the Polish Financial Supervision Authority (KNF) data it seems that the Households Wealth Study reflects fairly
accurately the percentage of households holding this type of assets (KNF, 2013), Deutsche Bank (2013)).
0%
20%
40%
60%
80%
100%
Net income decile
other financial assets
voluntary private pensions / whole life insurance
mutual funds, bonds, shares
deposits
deposits (% hh)
mutual funds, bonds, shares (% hh)
voluntary private pensions / whole life insurance (% hh)
other financial assets (% hh)
0
5
10
15
20
25
Net income decile
deposits
mutual funds, bonds, shares
voluntary private pensions / whole life insurance
other financial assets

Assets
36 Household Wealth and Debt in Poland
Table 2.4. Financial assets in Poland as compared to the euro area countries (percentage of households
-%, median in EUR thousand
Country
Total Deposits Mutual funds Bonds Shares Voluntary pension
schemes / life insurance policies
% of house-holds
median (EUR thou-sand)
% of house-holds
median (EUR thou-sand)
% of house-holds
median (EUR thou-sand)
% of house-holds
median (EUR thou-sand)
% of house-holds
median (EUR thou-sand)
% of house-holds
median (EUR thou-sand)
PL 88.7 2.1 81.9 1.2 4.2 2.9 1.0 1.5 3.5 1.9 51.3 1.0
BE 98.0 26.5 97.7 10.0 17.6 20.4 7.5 30.8 14.7 5.1 43.3 19.9
DE 99.3 17.1 99.0 7.9 16.9 10.0 5.2 16.0 10.6 8.6 46.5 11.4
GR 74.5 4.4 73.4 3.6 1.2 8.8 0.5 N 2.7 5.7 3.8 10.5
ES 98.3 6.0 98.1 3.5 5.6 13.9 1.4 19.2 10.4 6.1 23.6 7.4
FR 99.6 10.7 99.6 6.5 10.7 6.9 1.7 12.0 14.7 6.9 37.5 10.6
IT 92.0 10.0 91.8 5.9 6.3 20.0 14.6 20.0 4.6 10.9 18.0 10.1
CY 87.9 22.1 81.2 5.8 1.0 N 3.2 22.5 34.6 1.9 45.7 15.5
LU 98.4 27.9 98.0 14.3 19.0 26.9 4.4 45.8 10.0 10.8 34.3 27.8
MT 97.2 26.2 96.9 13.2 8.0 16.9 21.6 20.4 13.4 10.3 24.2 20.3
NL 97.8 34.7 94.2 10.1 17.7 7.1 6.0 15.5 10.4 5.6 49.8 53.2
AT 99.5 13.5 99.4 10.6 10.0 11.2 3.5 13.8 5.3 7.1 17.7 8.1
PT 94.5 4.3 94.3 3.4 2.8 15.0 0.4 N 4.4 5.0 14.1 5.9
SI 93.9 1.7 93.6 0.8 12.0 4.8 0.7 N 10.0 1.2 18.3 3.4
SK 91.7 2.5 91.2 2.0 2.7 2.5 1.0 N 0.8 N 15.0 3.2
FI 100.0 7.4 100.0 4.5 27.4 2.6 0.8 10.0 22.2 3.8 23.7 4.3
EA 96.8 11.4 96.4 6.1 11.4 10.0 5.3 18.3 10.1 7.0 33.0 11.9
Legend: PL - Poland, BE - Belgium, DE - Germany, GR - Greece, ES - Spain, FR - France, IT - Italy, CY - Cyprus LU - Luxemburg,
MT - Malta, NL - Netherlands, AT - Austria, PT - Portugal, SI - Slovenia, SK – Slovakia, FI - Finland, EA – euro area.
Source: BZGD, NBP; EBC (2013).
From the point of view of financial risk analysis of households it is important to identify those finan-
cial assets that may act as protective buffers against unexpected, unfavourable random events, such as
job loss, a strong increase in the current financial burdens, etc. That is the role of the so-called liquid
financial assets which should be understood as deposits, units in mutual funds, bonds and shares.
Figure 2.6 shows that the higher the income the larger the percentage of households holding both liq-
uid and illiquid financial assets, while the share of liquid assets in the total of financial assets is rela-
tively independent of income (left-hand panel). Liquid assets represent on average 82.8% of financial
assets. Households belonging to the highest income groups hold liquid financial assets with much
higher values (right-hand panel), so they can be more resistant to possible shocks.

Assets
37 Household Wealth and Debt in Poland
Figure 2.6. Liquid vs. illiquid financial assets (left-hand panel: percentage of households -%, share of
the aggregate -% right-hand panel: median in PLN thousand) by net income (decile groups)
Source: BZGD, NBP.
0%
20%
40%
60%
80%
100%
Net income deciles
non-liquid assets
liquid assets
liquid assets (% hh)
non-liquid assets (% hh)
0
5
10
15
20
25
30
0-10
%
10-2
0%
20-3
0%
30-4
0%
40-5
0%
50-6
0%
60-7
0%
70-8
0%
80-9
0%
90-1
00%
Net income deciles
liquid assets non-liquid assets

Debt
38 Household Wealth and Debt in Poland
3. Debt
This chapter presents liabilities of households in Poland, and consists of two parts. At the beginning,
we have presented the most important characteristics of indebted households, according to socio-
economic features, such as: age, education, labour market status of the reference person, household
size and place of residence and level of income or net wealth. The analysed debt was divided into
housing loans40 and non-housing credit and loans 41 as these types of debt differ both in terms of val-
ue, maturities and risks, and characteristics of indebted households. Basic statistics were compared
with the results for the euro area countries. More detailed breakdowns are shown in the tables in the
Statistical Annex to this Report.
In the second part of the chapter we analysed the debt burden of households and the financial risk
they are exposed to as a consequence. We took into consideration both their current burden as well as
asset holdings which could offset temporary increases in debt service costs or declines in income.
Again, the basic statistics were compared to the results for the euro area countries.
40 The class housing loans includes loans granted for housing purposes, which include the purchase of the household main resi-
dence, purchase of another real estate property (land, buildings) and renovation or modernization of a housing unit/house. 41 The class non-housing credit and loans comprises consumer loans (granted for the purchase of a car or another motor vehicle,
educational purposes, financing of maintenance costs), other consumer loans (credit account debt, credit in the form of credit
line/overdraft), loans to finance business or professional activity, loans for other purposes (including, for the reimbursement of
other loans) and loans for consumption purposes. In the further part of the Report we have used the abbreviated name of this
class “non-housing credit and loans”.

Debt
39 Household Wealth and Debt in Poland
Table 3.1. Liabilities of households – main characteristics
Household structure
Liabilities
Total Housing credits / loans Non-housing credit and
loans
% % median
(PLN thousand)
mean (PLN thousand)
% median
(PLN thousand)
mean (PLN thousand)
% median
(PLN thousand)
mean (PLN thousand)
All households 100.0 37.0 10.0 57.3 12.1 104.0 142.7 29.4 5.0 13.4
Ownership status
Owner outright 65.2 29.0 5.7 20.9 1.5 101.8 108.1 28.0 5.0 15.8
Owner with housing loans 11.2 100.0 111.0 150.7 100.0 104.0 145.9 37.0 7.5 13.0
Tenant or other 23.6 30.5 3.2 13.7 1.4 158.0 143.0 29.8 3.0 7.1
Household type
One-person household¹ 30.3 23.3 3.8 29.1 4.9 50.0 102.2 19.9 2.4 9.1
Couple 19.3 36.2 12.0 71.3 12.8 126.0 172.2 27.2 5.0 13.5
Couple with children 32.3 49.5 17.2 77.9 22.4 115.0 150.2 36.3 5.3 13.6
Extended-family household 18.1 38.3 6.5 24.5 5.1 43.6 69.2 35.2 6.0 16.7
Age of the reference person
16-34 15.7 47.2 32.2 88.8 24.8 137.0 157.0 29.9 6.0 9.7
35-44 18.4 51.9 25.0 87.5 24.5 115.0 164.4 37.7 5.4 13.9
45-64 43.3 36.2 7.1 34.3 7.7 59.0 103.5 31.7 5.0 14.0
65+ 22.6 19.8 3.2 20.0 1.7 26.8 76.1 18.5 2.8 14.4
Labour force status of the refer-ence person
Employed 45.5 46.8 14.0 71.3 19.6 119.0 153.3 34.3 5.0 9.8
Self-employed 11.1 45.6 20.7 74.5 17.5 110.5 135.9 35.4 8.0 28.9
Retired and other not working 43.4 24.5 4.0 20.9 2.8 48.0 77.2 22.7 3.3 12.8
Education of the reference person
Primary or no education 15.7 22.4 3.4 19.3 2.0 38.0 61.4 20.9 3.0 14.7
Secondary education 60.9 37.9 7.4 37.8 9.5 70.0 108.1 32.3 5.0 12.5
Tertiary education 23.4 44.4 52.0 113.6 25.6 150.0 180.8 27.5 6.0 15.2
Class of geographical location
Urban areas 67.1 37.3 11.3 63.1 13.1 115.0 152.3 29.0 5.0 12.7
Rural areas 32.9 36.3 7.0 45.0 10.1 90.0 117.7 30.3 5.0 14.7
Net income (quantiles)
0-20% 20.0 20.1 2.5 30.8 2.0 50.0 54.5 18.5 2.0 4.0
20-40% 20.1 28.2 4.4 57.5 4.9 60.0 71.7 24.6 3.3 7.9
40-60% 20.0 40.4 7.5 61.0 11.6 66.2 106.8 32.9 3.8 10.5
60-80% 20.0 47.3 14.4 52.5 17.5 105.6 138.2 37.9 6.0 20.5
80-90% 10.0 48.6 13.5 56.9 19.2 130.0 127.9 38.1 6.5 11.3
90-100% 10.0 49.1 78.8 106.2 29.6 182.0 221.6 28.0 9.5 25.5
Net wealth (quantiles)
0-20% 20.0 34.3 3.5 30.8 4.5 160.0 180.8 31.6 3.0 7.5
20-40% 20.1 43.1 12.0 56.9 16.5 101.2 128.7 32.8 4.3 9.9
40-60% 20.1 35.9 10.5 58.9 12.0 104.0 154.2 27.6 5.5 9.4
60-80% 19.9 32.8 10.0 58.0 11.2 98.0 137.6 26.3 5.8 13.8
80-90% 9.9 39.8 12.9 52.9 15.8 54.2 114.3 31.3 7.0 9.5
90-100% 10.0 37.9 26.9 106.2 16.6 130.0 166.8 25.9 8.0 48.2
Source: BZGD, NBP. Note: 1) The category includes single-parent families

Debt
40 Household Wealth and Debt in Poland
3.1. Total debt
In Poland, approximately 37% of households are indebted, of which 12.1% are burdened with housing
loans and 29.4% with non-housing credit and loans (see Table 3.1 and Figure 3.1, left-hand panel).
Debt resulting from these types of loans accounts for 81.5% and 18.5% of the total household debt
respectively. The dominant role of housing loans in the total household debt results from significantly
higher value of housing loans. The average value of debt resulting from housing loans, as measured
by the median, amounts to PLN 104 thousand, while the average value of debt resulting from other
types of loans is PLN 5 thousand. For approx. 5.5% of households burdened with housing loans the
current debt is relatively low and does not exceed PLN 10 thousand. For approx. 4% of households
burdened with other loans the debt is relatively high and exceeds PLN 50 thousand (see Figure 3.2).
The percentage of indebted households is unevenly distributed in various sections of household char-
acteristics. Smaller households, low-income households or households whose reference person is old-
er or has at most primary education (see Table 3.1) are the least likely to be burdened with debt.
Income is a differentiating factor both in terms of the percentage of indebted households in the group
and the amount of debt. Among households with income above the median or at least secondary edu-
cation, every second one claims to be indebted. Households in these groups represent respectively
approx. 50% and 90% of all the indebted households, and their debt represents respectively 78% and
97% of the total debt (see Figure 3.1 right-hand panel). Households with children and young house-
holds get indebted as often as households with higher education and significant disposable income.
The likelihood of getting indebted is not affected by the place of residence of the household (urban /
rural) - in both sections, the percentage of indebted households ranges from 30% to 40% in the ana-
lysed group of households.
Figure 3.1. The proportion of indebted households by type of loan in the household population (left-
hand panel) (%) and the share of selected groups of households in the total number of indebted
households and the total value of debt (right-hand panel) (%)
Source: BZGD, NBP.
63,0%
12,1%
24,9%
37,0%
Households without debt
Households with housing loans
Households with non-housing loans
90,5%
52,0% 43,3%
57,6%
96,8%
78,1%
58,8%
71,7%
0%
10%
20%
30%
40%
50%
60%
70%
80%
90%
100%
Persons withat least
secondaryeducation
Householdswith incomeabove themedian
Householdswith children
Workingpersons
Share of the group in the total number of the indebtedhouseholds
Share of the group in the total value of debt

Debt
41 Household Wealth and Debt in Poland
Note: Category „Indebted with non-housing credit or loans” encompasses households without a housing loan. The percentage
of households with non-housing credit or loans is 29.4% as 37.2% of households with housing loan are, at the same time, bur-
dened with other loan and they account for approx. 4.5% of the population.
Figure 3.2. Distribution of housing loans and non-housing credit and loans (%)
Source: BZGD, NBP.
The propensity of households to borrow does not seem to be linked to their net wealth – the percent-
age of indebted households is relatively constant in all wealth groups (see Figure 3.3). In turn, the
correlation of net wealth with debt level is reflected in extreme wealth and extreme poverty groups
only – it is significantly lower in the case of the least affluent households and higher for the wealthiest
ones, while it is constant for middle wealth groups.
Figure 3.3. The percentage of indebted households and the median debt according to net income and
net wealth
Source: BZGD, NBP.
Both the percentage of indebted households (37%) and the average debt value (according to the medi-
an of EUR 2.4 thousand) in Poland are significantly below the values in euro area, where more than
43.7% of households are indebted, holding an average debt of approx. PLN 21.5 thousand. House-
holds in Poland declare some of the lowest debt values, comparable to the ones declared by house-
holds in Slovakia and Slovenia, while the frequency of borrowing is similar to that in the Maltese and
the Greek societies (see Table 3.2).
0%
5%
10%
15%
20%
25%
30%
35%
40%
do 1 ths 1-5 ths 5-10 ths 10-50 ths 50-100 ths 100-150 ths 150-300 ths 300-500 ths 500-1200 ths
Value of non-housing loans Value of housing loans
0
10
20
30
40
50
60
70
80
90
0
10
20
30
40
50
60
0-10% 10-20% 20-30% 30-40% 40-50% 50-60% 60-70% 70-80% 80-90% 90-100%
Conditio
nal m
edia
n (
PLN
thousand)
% o
f in
debte
d h
ousehold
s
Deciles
% of indebted households by net income % of indebted households by net wealth
Median by net income (right-hand scale) Median by net wealth (right-hand scale)

Debt
42 Household Wealth and Debt in Poland
Table 3.2. Household debt in Poland as compared to the euro area countries
PL BE DE GR ES FR IT CY LU MT NL AT PT SI SK FI EA
Percentage of the in-debted households (%)
37.0 44.8 47.4 36.6 50.0 46.9 25.2 65.4 58.3 34.1 65.7 35.6 37.7 44.5 26.8 59.8 43.7
Debt median (EUR thousand)
2.4 39.3 12.6 14.6 36.0 18.4 15.0 60.2 73.4 15.7 89.1 13.8 31.7 4.3 3.2 29.4 21.5
Legend: PL - Poland, BE - Belgium, DE - Germany, GR - Greece, ES - Spain, FR - France, IT - Italy, CY - Cyprus LU - Luxemburg,
MT - Malta, NL - Netherlands, AT - Austria, PT - Portugal, SI - Slovenia, SK – Slovakia, FI - Finland, EA – euro area.
Source: BZGD, NBP; ECB (2013).
3.2. Housing loans
Out of 12.1% of households with a housing loan, 10.8% finance the real estate being their main resi-
dence and 1.6% - another property (see Table A12 of the Statistical Annex). In approx. 96% of cases,
the loan is secured by a mortgage on the financed property. Most of households holding a housing
loan do not declare any other forms of debt, while 37.2% of indebted households (4.5% of all house-
holds) are repaying, at the same time, non- housing credit or loans (see Figure 3.4 left-hand panel).
83% of households who have taken out a housing loan, are repaying their debt in domestic currency
(10.1% of all households) and 17% (2.2% of all households) in foreign currency, out of whom the vast
majority of foreign currency borrowers repay their debt in Swiss francs. Foreign currency debt ac-
counts for 24.3% of the total housing debt (statistics on the scale of burden of domestic and foreign
currency borrowers is presented in the box in Section 3.4).
Figure 3.4. The percentage of households with housing loans and other forms of debt in the popula-
tion (left-hand panel) (%) and the share of selected groups of households in the total number of in-
debted households and in the total value of housing debt (right-hand panel) (%)
Note: Other consumer loans include credit card debt, credit in the form of credit line or overdraft.
Source: BZGD, NBP.
7,6%
2,1%
1,2%
1,1%
4,5%
Households with housing loans
Households with housing loans and consumer loans, loan for business orprofessional activity (small business loans) and loan for other purposes
Households indebted with housing loans and other consumer loans
Households indebted with housing loans, other consumer loans and consumerloans, loans for business or professional activity (small business loans) and loans forother purposes
59,8%
69,4% 69,3% 62,9%
78,3% 80,2%
0%
10%
20%
30%
40%
50%
60%
70%
80%
90%
100%
Households withchildren
Household whosereference person
is beyond 44years of age
Households withincome above the
median
Share of the group in the total number of the indebtedhouseholds
Share of the group in the total value of debt

Debt
43 Household Wealth and Debt in Poland
Having a housing loan is associated with certain social and economic characteristics and concentration
of this type of debt in certain groups of households is much higher than in the case of other forms of
debt. The bulk of housing loans were taken out by middle income households, whose reference per-
son is aged below 44 years or households with children - each of these groups accounts for approx. 60-
70% of all the indebted households and has approx. 60-80% of the total debt resulting from housing
loans (see Figure 3.4 right-hand panel). Low probability of having a housing loan is observed in the
group of smaller households or low-income households as well as elderly or less educated house-
holds.
The probability of having a housing loan and its average value, grow with higher income and educa-
tion level. Like in the case of total debt, the propensity to borrow and the debt amount are clearly less
correlated with net wealth (see Figure 3.5). The percentage of households having a housing loan is
markedly lower in the case of the least wealthy households, but remains relatively stable for the re-
maining 70-80% of the population. On the other hand, the correlation between net wealth and the
value of housing debt is non-monotonic. The average value of loan is the highest among the lowest
wealth households and stands at approx. PLN 160 thousand (see Table 3.1). These are mainly young
households whose reference person is maximum 34 years of age, with middle income level and sec-
ondary education (among other households with housing debt there are relatively more people with
higher income and higher education). The value of housing loan declines for other income groups
except for the wealthiest households where it grows again. This correlation between the mortgage
debt value and net assets was also observed in the euro area.
Figure 3.5. The percentage of the indebted households and the median of housing debt by net income
and net wealth
Source: BZGD, NBP.
Households in Poland take out mortgage loans about twice less frequently than households in the
euro area (23.1%) and repay more than twice lower capital for this type of borrowing which, according
to the median amount in Poland to EUR 25 thousand as compared to EUR 67.5 thousand in the euro
0
50
100
150
200
250
0
5
10
15
20
25
30
35
0-10% 10-20% 20-30% 30-40% 40-50% 50-60% 60-70% 70-80% 80-90% 90-100%
Conditio
nal m
edia
n (
PLN
thousand)
% o
f in
debte
d h
ousehold
s
Deciles
% of indebted households by net income % of indebted households by net wealth
Median by net income (right-hand scale) Median by net wealth (right-hand scale)

Debt
44 Household Wealth and Debt in Poland
area42. Poland belongs to the group of countries with relatively lowest percentage of indebted house-
holds and the lowest value of the debt, whose level is comparable only to Slovakia and Slovenia (tak-
ing into account both statistics).
Table 3.3. Household mortgage debt in Poland as compared to other euro area countries
PL BE DE GR ES FR IT CY LU MT NL AT PT SI SK FI EA
Percentage of the in-debted households (%)
12.1 30.5 21.5 17.5 32.5 24.4 10.8 44.8 38.8 15.6 44.7 18.4 26.7 14.1 9.6 N/D 23.1
Debt median value (EUR thousand )
25.0 69.3 80.0 41.0 60.0 55.9 60.0 86.6 127.3 35.0 131.0 37.5 48.8 6.6 25.0 N/D 67.5
Legend: PL - Poland, BE - Belgium, DE - Germany, GR - Greece, ES - Spain, FR - France, IT - Italy, CY - Cyprus LU - Luxemburg,
MT - Malta, NL - Netherlands, AT - Austria, PT - Portugal, SI - Slovenia, SK – Slovakia, FI - Finland, EA – euro area, N/D – no
data.
Source: BZGD, NBP; ECB (2013).
3.3. Non-housing credits and loans
Specific features of non-housing credit and loan, including, in general, its relatively low value and
short maturity, make it available to a wider group of households – approx. 29.4% of households claim
to have other than housing loan. The largest part of such loans are loans, which finance consumer
spending (car loans, educational loans, loans for living expenses, consumer loans). Loans for business
or professional activity (small business loans) and loans for other purposes (including the repayment
of other debts), held by 24.7% of households and accounting for more than 90% of the debt resulting
from non- housing credit and loans. Definitely fewer households incur credit card debt (5.3%) or cred-
it in the form of line of credit (open-end credit) (6.1%). The median value of non- housing credit and
loans is PLN 5 thousand, including for credit card debt - approx. PLN 1.4 thousand, for credit line
(open-end credit) or overdraft approx. PLN 2 thousand and for other forms of credit (including con-
sumer loans) - approx. PLN 5.0 thousand (see Table A13 of the Statistical Annex).
The frequency of taking out non- housing credit and loans is similar in most groups of households,
although these loans seem to be more common for households with secondary education and large
families (households with children and extended families). These groups represent more than 60% of
indebted households and of the total debt value in this type of loan. In contrast to housing loans, the
percentage of debtors does not change monotonically with rising income. The proportion of indebted
households increases along with income in the case of low-income households, to stabilize at approx.
40% in the case of above average income earners and declines for top earners (see Figure 3.6). This
trend may be observed in both credit cards debt and overdraft as well as other forms of loans or non-
housing credit and loans. The level of debt resulting from the latter loan category, however, is more
diverse in terms of income and more clearly correlated with it than in the case of credit cards debt and
overdraft.
42 Category housing loans is comparable to the category mortgage loans used in the ECB Report (ECB (2013a) as the overwhelming
majority (approx. 96%) of loans for housing purposes registered in the Household Wealth and Debt Survey (BZGD) are se-
cured with mortgage on property.

Debt
45 Household Wealth and Debt in Poland
Also in the case of non- housing credit and loans there is no clear correlation between propensity to
borrow and wealth. More affluent households have typically higher debt resulting from these loans
(see Figure 3.6). A distinctive group are households with housing loans who declare twice as often
(approx. 13% of them) to have credit cards debt and overdraft. Also the level of such debt in the range
of PLN 2.0-2.6 thousand is about 30-60% higher than in the other groups.
Figure 3.6. The proportion of indebted households and the median of debt resulting from non-
housing credit and loans by income and net wealth
Source: BZGD, NBP.
The percentage of households burdened with debt other than mortgage debt in Poland standing at the
level of 29.4% is comparable to the euro area level, while the median debt value stands at a much low-
er level of approx. EUR 1.2 thousand as compared to EUR 5 thousand in the euro area. Poland be-
longs to the group of countries with the lowest level of outstanding debt arising from non-mortgage
loans and again, in terms of both characteristics of the debt, is comparable to Slovakia (debt of EUR 1
thousand and approx. 20% of the indebted) (see Table 3.4).
Table 3.4. Household debt resulting from non-mortgage loans in Poland as compared to other euro
area countries
PL BE DE GR ES FR IT CY LU MT NL AT PT SI SK FI EA
Percentage of the indebt-ed households (%)
29.4 24.2 34.6 26.1 30.7 32.8 17.8 47.9 36.9 25.2 37.3 21.4 18.3 38.9 19.9 N/D 29.3
Debt median value (EUR thousand
1.2 5.2 3.2 4.3 7.2 5.2 5.7 10.1 10.0 4.0 13.7 3.0 3.3 3.1 1.0 N/D 5.0
Legend: PL - Poland, BE - Belgium, DE - Germany, GR - Greece, ES - Spain, FR - France, IT - Italy, CY - Cyprus LU - Luxemburg,
MT - Malta, NL - Netherlands, AT - Austria, PT - Portugal, SI - Slovenia, SK – Slovakia, FI - Finland, EA – euro area, N/D – no
data.
Source: BZGD, NBP; ECB (2013).
0
1
2
3
4
5
6
7
8
9
10
0
5
10
15
20
25
30
35
40
45
0-10% 10-20% 20-30% 30-40% 40-50% 50-60% 60-70% 70-80% 80-90% 90-100%
Conditio
nal m
edia
n (
PLN
thousand)
% o
f in
debte
d h
ousehold
s
Deciles
% of indebted households by net income % of indebted households by net wealth
Median by net income (right-hand scale) Median by net wealth (right-hand scale)

Debt
46 Household Wealth and Debt in Poland
3.4. Household debt burden
Household debt load is of fundamental importance not only for the indebted, but also for the rest of
population who as a result of this debt, in the case of massive loan repayment problems may be hit by
the financial crisis. At this point, we performed the analysis of basic indicators showing the scale of
this risk. The Household Wealth and Debt Survey allows, for the first time in Poland, to take into ac-
count not only the information about the scale of debt burden for the current income, but also about
households’ financial buffers that can be used to offset a temporary increase in debt servicing costs or
income decline. The available data also allow us to determine the size of the group of households in a
particularly difficult situation i.e. at the same time heavily burdened with debt and having small fi-
nancial buffers (low asset-to-debt ratio).
The starting point is to assess the scale of the debt burden for disposable income (Debt-Service-to-
Income, DSTI43), which is the measure used both by banks to assess client creditworthiness as well as
in micro - and macro-prudential policy. Complementary indicator is the total debt to disposable in-
come ratio (Debt-to-Income, DTI). While the DSTI measures the scale of the current debt service bur-
den (debt servicing costs are, among others, the function of the value of the debt, its maturity and the
interest rate level), the DTI allows you to assess the scale of potential growth of this burden. For ex-
ample, a high value loan granted for a long period of time amidst low interest rates may have an ac-
ceptable low DSTI, but should interest rates rise, the debt burden for the borrower may prove to be
excessive. The DTI limit would reduce this risk by limiting the amount of borrowing, regardless of the
interest rate level. The DTI, however, is insensitive to debt maturity and therefore does not inform
about the scale of the current debt load (loans of moderate values and very short maturities would
result in low DTI but high DSTI). There are no generally adopted standards as regard safe levels of the
DSTI and the DTI, but it is often recognized that we face financial tensions if debt servicing costs ex-
ceed 30% -40% of disposable income (see May and Tudela, 2005; Beer and Schurz, 2007) and the value
of that debt exceeds three-year income (see Banco de Espana, 2014)44.
The second class of indicators is based on the information on household assets. Firstly, households
may hold liquid financial assets (deposits, shares of companies listed on the stock market, bonds and
shares in investment funds), enabling them to smooth consumption in response to a sudden increase
in debt servicing costs or decline in income. Let’s analyse, for example, a household with a mortgage
loan worth twice the annual income, servicing costs at 30% of the monthly income and liquid asset
holdings equal to two months' income. The value of these assets is relatively low in relation to total
debt. However, they would allow for at least two months of debt servicing in the event of total loss of
income. Additionally, considering notice periods generally applicable in the labour market this gives
the household some time to improve its financial situation. First and foremost, liquid assets may facili-
tate the absorption of temporary debt service costs. Should, in the above cited example, the DSTI ab-
43 The DSTI ratio is defined as the ratio of the monthly loan instalment (under housing loan or non-housing credit and loans
(with the exception of credit card debt, credit line /overdraft) to the average net monthly income of a household. 44 In order to determine safe debt levels it is necessary to factor in a number of risk sources, including the risk of change in debt
servicing costs and debt level (including the eventuality of job loss). Simple indicator ignore these issues. Therefore, exceeding
the so-called safe levels does not necessarily have to mean excessive risk for the household. Similarly, meeting those levels
does not have to mean low risk level.
Debt
47 Household Wealth and Debt in Poland
ruptly increase by 20 pp (e.g. due to interest rate hikes, depreciation of the Polish zloty against the
loan currency or reduction in wages), which is a significant value, the household would have to spend
as much as 50% of its income on debt servicing. Instead of reducing other expenses it could finance
these additional costs using its liquid financial assets - in this example, liquid assets would be suffi-
cient for almost the entire year. The above example shows that even if the value of liquid assets in
relation to total debt is relatively low, these assets can be a very important buffer against sharp in-
creases in debt servicing costs.
Secondly, in the event of serious financial problems the indebted households may try to pay off the
debt with the proceeds from the sale of other assets, including real property. Households whose debt
exceeds the value of asset holdings (namely, if the Debt-to-Assets - DTA ratio exceeds 1, which means
that their net wealth is negative) do not have such a possibility. The LTV (Loan-to-Value) ratio45 is a
twin indicator for micro- and macro-prudential purposes, applying mainly to mortgage-burdened
households. As with the DSTI and the DTI limits, there are no clear standards as regards the reference
values of individual indicators, yet it is often assumed that the safe LTV level does not exceed 80%
(the most common limit in the regulations worldwide) and the DTA level does not exceed 75% (see
Banco de Espana, 2014).
45 The Loan-To-Value ratio (current LTV) is defined as the ratio of the value of outstanding loan to the current value of the real
estate property used as the loan collateral. The value of the property is the respondent’s estimate at the time of the survey.

Debt
48 Household Wealth and Debt in Poland
Table 3.5. Household debt burden indicators
Indebted households
Housing loans and credits
Non-housing credit and loans
DTI DTA
% DSTI
% GD with DSTI
exceed-ing 40%
% DSTI
% GD with DSTI
exceed-ing 40%
% DSTI
% GD with DSTI ex-
ceed-ing 40%
% Median
% GD with DTI exceed-
ing 300%
% Medi-
an
% GD with DTA
exceed-ing 75%
All households 33.4 14.2 3.4 12.1 21.0 2.0 24.6 12.7 2.4 37.0 21.6 3.7 37.0 6.5 3.4
Ownership status
Owner without housing loan
25.7 11.1 2.0 1.5 23.5 0.4 24.8 10.9 1.9 29.0 11.5 0.6 29.0 1.6 0.0
Owner with housing loan 100.0 20.3 16.0 100.0 20.3 16.0 25.6 27.9 7.6 100.0 185.4 29.8 100.0 26.7 10.5
Tenant or other 24.6 13.3 1.4 1.4 21.4 0.1 23.8 13.3 1.4 30.5 10.8 0.7 30.5 45.5 9.8
Household type
One-person household¹
20.3 16.1 3.1 4.9 26.9 1.3 16.4 13.8 2.2 23.3 20.6 1.8 23.3 6.2 3.0
Couple 33.9 16.2 3.3 12.8 20.2 2.0 23.6 14.6 2.2 36.2 28.7 5.1 36.2 5.9 3.3
Couple with children 45.1 14.8 4.0 22.4 19.1 3.0 29.6 13.2 2.7 49.5 34.3 6.0 49.5 10.2 4.9
Extended-family household 34.1 9.5 2.7 5.1 24.6 1.4 30.6 9.5 2.2 38.3 10.9 1.4 38.3 2.3 1.9
Age of the reference person
16-34
43.7 17.8 4.0 24.8 22.5 3.3 24.7 13.0 2.3 47.2 42.7 4.5 47.2 27.7 6.8
35-44 47.0 13.4 5.1 24.5 17.6 3.8 29.2 12.4 3.1 51.9 43.5 6.6 51.9 12.1 4.7
45-64 32.4 12.9 3.3 7.7 18.1 1.7 27.1 12.7 2.8 36.2 18.7 1.7 36.2 3.4 2.6
65+ 17.9 13.3 1.4 1.7 27.9 0.3 16.5 12.7 1.1 19.8 8.5 0.5 19.8 1.6 1.5
Labour force status of the refer-ence person
Employed
42.1 14.0 3.4 19.6 20.2 2.8 27.5 11.9 2.0 46.8 29.5 5.8 46.8 9.7 4.6
Self-employed 43.5 13.8 7.8 17.5 20.7 4.6 32.3 12.5 6.3 45.6 26.0 5.3 45.6 2.8 0.6
Retired and other not working 21.8 15.0 2.2 2.8 26.9 0.5 19.6 13.4 1.8 24.5 12.9 1.2 24.5 3.2 3.0
Education of the reference person
Primary or no education
21.2 13.0 3.0 2.0 31.8 0.9 19.7 12.8 2.6 22.4 11.1 1.0 22.4 4.5 2.7
Secondary education 34.2 13.2 3.5 9.5 21.0 1.9 27.3 12.2 2.6 37.9 17.7 2.9 37.9 4.5 3.8
Higher education 39.7 17.6 3.3 25.6 19.4 3.1 21.1 14.6 1.7 44.4 77.8 7.9 44.4 15.7 3.0
Class of geographical location
Urban areas
33.3 14.7 3.1 13.1 20.3 2.2 23.5 12.9 2.3 37.3 25.9 4.2 37.3 8.4 4.4
Rural areas 33.8 13.3 3.2 10.1 21.2 1.5 26.9 12.2 2.5 36.3 17.4 2.8 36.3 2.6 1.5
Net income (quantiles)
0-20%
17.2 19.2 4.6 2.0 58.1 1.4 15.2 17.1 3.2 20.1 17.1 1.6 20.1 4.0 3.4
20-40% 25.4 15.4 3.0 4.9 28.6 1.4 21.5 13.7 2.3 28.2 17.0 1.8 28.2 6.6 3.3
40-60% 36.1 15.8 3.2 11.6 24.0 2.3 27.3 14.0 2.1 40.4 19.7 4.0 40.4 5.7 5.4
60-80% 42.7 14.2 4.0 17.5 22.5 3.1 31.4 12.1 3.1 47.3 22.8 6.7 47.3 6.6 3.5
80-90% 45.4 10.9 2.4 19.2 17.1 2.4 32.5 8.3 1.3 48.6 17.4 2.7 48.6 3.5 1.6
90-100% 46.4 11.5 1.6 29.6 15.6 1.3 23.1 10.2 0.8 49.1 55.8 6.5 49.1 14.3 1.4
Net wealth (quantiles)
0-20%
28.8
14.7
2.5
4.5
23.8
0.7
25.5
14.1
2.2 34.3
13.2
2.9 34.3
69.7
14.8
20-40% 41.1
14.6
4.5
16.5
21.5
2.5
28.6
12.7
3.5 43.1
32.6
5.3 43.1
8.0
2.3
40-60% 32.1
12.8
1.6
12.0
18.3
1.3
22.8
11.2
0.8 35.9
21.7
3.6 35.9
4.1
0.3
60-80% 29.7
14.1
2.8
11.2
22.5
1.8
22.6
12.1
2.0 32.8
20.7
2.4 32.8
2.3
-
80-90% 37.0
14.9
3.6
15.8
22.4
2.8
25.9
12.0
2.0 39.8
22.2
3.6 39.8
1.8
-
90-100% 34.2
16.1
7.2
16.6
20.7
4.5
21.6
15.5
4.6 37.9
35.1
5.2 37.9
1.8
-
Note: When calculating the DSTI, we disregarded the costs of credit card debt, credit line and overdraft which, if
factored in, would distort the debt service costs for the majority of households. Consequently, the total number of
the indebted, presented in the table, exclusive of these categories, is 33.4%.
Source: BZGD, NBP.

Debt
49 Household Wealth and Debt in Poland
Borrowers spend on average approx. 14.2% of their monthly net income on debt servicing (calculated
using the median). There are large differences in the debt service burden between borrowers having a
mortgage and those burdened with other types of debt. The DSTI median for households burdened
with housing loan amounts to approx. 21.0%, while for the remaining indebted households it amounts
to approx. 12.7% (see Table 3.5). This is also reflected in the percentage of households who are the
most burdened with debt in each of these groups. Approx. 90% of all borrowers allocate up to 40% of
their monthly disposable income for debt service (see Figure 3.7 left-hand panel). 16.5% of households
with housing debt have the DSTI in excess of 40% as compared to just approx. 9.5% of households
burdened with other type of debt. Households repaying housing debt and debt resulting from non-
housing credit and loans46 are the most debt burdened group of borrowers accounting for approx. 10%
of the indebted population (and approx. 3.3% of all households). The DSTI median in this group is
approx. 27.9% which means that almost half of them spend almost 30% of their income on debt ser-
vice.
As a result, nearly 60% of all households with the DSTI exceeding 40% are households with housing
debt (see Figure 3.7 right-hand panel). Due to the generally considerable value of this debt, the proba-
bility of having a high DSTI in this group is by approx. 75% higher than across the remaining indebted
households. High probability of a significant debt burden concerns, to a similar extent, one-person
households and the self-employed. In these groups it is almost two times higher than among the total
indebted population. The highest probability of a high DSTI concerns two completely different groups
of households - those earning the lowest income and the wealthiest ones. In the latter group, it is how-
ever of a relatively less severe and much less risky due to a large surplus of assets over liabilities.
46 In the group of households repaying more than one loan, accounting for 4.5% of households, approx. 48% were repaying a
residential loan and a consumer loan for business activity or for another purpose only, 27% were repaying a housing loan and
another consumer credit or loan (credit card debt/ credit line/overdraft), and 25% were repaying a housing loan, a consumer
loan for business activity or for another purpose and another consumer credit or loan.

Debt
50 Household Wealth and Debt in Poland
Figure 3.7. DSTI ratio distribution in the population of indebted households in Poland (left-hand pan-
el) and the characteristics of households with DSTI> 40% (right-hand panel)
Note: The category Total debt DSTI does not take into account credit in the form of credit line, credit card debt or overdraft. The
DSTI has been calculated on the basis of net income.
The odds ratio – indicates as relatively high incidence of households with DSTI > 40% in a particular group of indebted house-
holds in relation to all the indebted; value 1 indicates the same frequency, value 2 two times higher frequency.
Source: BZGD, NBP.
The DTI is complementary to the DSTI indicator. For approx. 75% of the indebted, the debt does not
exceed the annual household income, and for almost 90% of them it does not exceed three times the
value of the annual income (see Figure 3.8). In the case of housing loans, the DTI ratio is clearly higher
– the overwhelming majority of households whose debt exceeds the annual income are households
with a housing debt and half of them have debt in excess of two times the value of their annual in-
come. The risk associated with fluctuations in the debt service costs is higher for mortgage-burdened
households for three reasons: (i) housing loans are clearly higher value loans, (ii) mortgage service
costs are sensitive to interest rate changes (practically, there are no housing loans with a fixed interest
rate, which is often the case in other types of debt), (iii) as a result of long maturities the sensitivity of
current debt servicing costs to interest rate changes is high. This translates into a higher percentage of
households heavily burdened with debt service costs in this group; on the other hand, these are high-
er-income households who are less at risk of losing their jobs because of better education; therefore
they are in a better position to assume such a risk.
0%
10%
20%
30%
40%
50%
60%
70%
80%
0-20% 20-30% 30-40% 40-50% 50%+
Total debt DSTI
Housing debt DSTI
Non-housing debt DSTI
0%
10%
20%
30%
40%
50%
60%
70%
0
0,5
1
1,5
2
2,5
3
The lowestincome quintile
The highest netwealth decile
Self-employed Owner withhousing loan
The odds ratio (left-hand scale)
Percentage of all the indebted (right-hand scale)

Debt
51 Household Wealth and Debt in Poland
Figure 3.8. DTI ratio distribution in the population of indebted households in Poland (left-hand panel)
and characteristics of households with DTI > 3 (right-hand panel)
Note: The category Total debt DTI takes into account all the declared types of debt, including credit in the form of credit line,
credit card debt and overdraft. The DTI has been calculated based on the net annual income.
The odds ratio – indicates a relatively high incidence of households with DTI> 3 in a particular group of the indebted households
in relation to all the indebted; value 1 indicates the same frequency, value 2 two times higher frequency
Source: BZGD, NBP.
The second group of indicators, indicating the scale of risk associated with debt, is based on the rela-
tion of the value of assets to the debt level. It also informs about the possibility of debt repayment with
the use of assets, as well as the capacity to absorb the increase in debt servicing costs.
The most convenient for this purpose are liquid financial assets that may be exchanged into cash rela-
tively quickly and whose sale, in contrast to the sale of a real estate or a car, generally does not affect
their current standard of living. The percentage of households holding liquid assets increases with the
level of income and is very similar among the indebted and non-indebted households (see Figure 3.9
left-hand panel). The exception is the lowest income group, where only approx. half of the indebted
claim to hold any liquid assets whereas among the non-indebted with similar income this percentage
is almost 70%. However, the value of liquid financial assets is significantly lower for the indebted in
almost all income groups. For non-indebted households the median value of liquid assets usually does
not exceed their two-month income, whereas among indebted households it is almost half lower and
corresponds to approx. one month's net income (see Figure 3.9 right-hand panel).
Despite lower value of liquid financial assets held by the indebted they constitute quite a significant
buffer. Firstly, approx. 40% of all indebted households have liquid assets enabling full repayment of
the debt. Among households burdened with a non-housing loan (including those that have a housing
and other type of loan) this percentage increases to nearly 60%. This partly protects them not only
against the risk of rising debt servicing costs, but also against the risk of a temporary decrease or loss
of income. Due to the significant value of housing debt only 13% of households burdened with such a
debt could pay off their entire debt by selling liquid financial assets. At the same time, approx. 11% of
indebted households claim not to have any liquid assets; as a result, any increase in debt servicing
0%
10%
20%
30%
40%
50%
60%
70%
0 - 0.25 0.25 - 0.5 0.5 - 1.0 1.0 - 3.0 3.0 - 5.0 5.0+
Total debt DTI
Housing debt DTI
Non-housing debt DTI
0%
10%
20%
30%
40%
50%
60%
70%
80%
90%
100%
0
0,5
1
1,5
2
2,5
3
3,5
Owner withhousing loan
Highereducation
Householdwithout children
The highestwealth decile
The odds ratio (left-hand scale)
Percentage of all the indebted (right-hand scale)

Debt
52 Household Wealth and Debt in Poland
costs is bound to take their toll on current consumption. Education is the main distinguishing feature
of indebted households in terms of holding liquid financial assets. The lack of any liquid financial
assets is reported by almost 30% of indebted households where the household reference person has a
primary education, and only among the 3% of households where the household head has a university
degree.
Figure 3.9. Liquid financial assets in relation to net annual income held by particular income groups
in the population of indebted and non-indebted households in Poland (left-hand panel) and liquid
assets values distribution by income in the group of indebted households (right-hand panel)
Source: BZGD, NBP.
Even if liquid assets do not allow households to fully repay their debt, they can absorb part of the
increase in debt servicing costs and moderate declines in revenues. Approximately 20-25% of indebted
households do not have any liquid assets or their liquid assets are so small that they would not allow
them to service even a slight increase in debt even for 1 month (see Figure 3.10). More than half of
households could, however, finance a 20 percentage point increase in the DSTI (e.g. from 30% to 50%)
for more than 3 months, and 30% of them even for over a year. Households with housing loans, main-
ly concerned about the risk of rising DSTI costs, have more liquid assets and are in a better situation.
Only 10-15% would not be able to absorb an increase in the DSTI even for one month, more than half
could do this for a period exceeding 6 months and 40% for over a year.
0%
20%
40%
60%
80%
100%
120%
0%
5%
10%
15%
20%
25%
30%
0-20
%
20-4
0%
40-6
0%
60-8
0%
80-9
0%
90-1
00%
Med
ian
of
the
rela
tio
n o
f li
qu
id a
sset
s to
net
ann
ual
in
com
e
Households by income groups
indebted households
non-indebted households
Indebted households holding liquid assets (right-hand scale)
Non-indebted households holding liquid assets (right-hand scale)
0%
10%
20%
30%
40%
50%
60%
lack ofliquidassets
up to 1mth
1-2 mths 2-3 mths 3-6 mths above 6mths
Total debt LATIm Housing debt LATIm
Non-housing debt LATIm

Debt
53 Household Wealth and Debt in Poland
Figure 3.10. The maximum period during which an indebted household could service
a 10 p.p. increase in DSTI with their liquid financial assets (left-hand panel) and the maximum period
during which indebted households could finance a 20 p.p. increase in the DSTI with liquid financial
assets (right-hand panel)
Source: BZGD, NBP.
Box 3.1. Analysis of households’ burden resulting from domestic and foreign currency loans
Table 3.6. Statistics on housing loans, divided into Polish zloty and foreign currency loans
Net DSTI Net DTI Liquid assets to annual
net income
Foreign currency
loans PLN loans
Foreign currency
loans PLN loans
Foreign currency
loans
PLN loans
Conditional median 19.3% 21.2% 1.8 1.8 31.5% 13.3%
Average 24.2% 28.1% 2.4 2.4 65.0% 30.3%
DSTI > 40% 21.1% 16.2% - - - -
DTI > 3 27.9% 28.6% - -
Liquid assets to annual net income < 10% - - - - 29.9% 51.5%
% of all households 2.2% 10.1% 2.2% 10.1% 2.0% 9.6%
Source: BZGD, NBP.
The number of households who claimed to be holding a foreign currency loan is relatively small,
both due to the percentage of those households in the population and the size of the sample. This
suggests that we should be extremely cautious in generalizing the results. Yet, due to the fact that
some features of households burdened with foreign currency loans identified in the Household
Wealth and Debt Survey are reflected in other data sources, information specific for BZGD, includ-
ing information on asset holdings, seems probable.
Among 12.1% of households indebted with housing loans, 10.1% claim to be holding a domestic
currency loan and 2.2% a foreign currency loan. This latter group of borrowers is not only exposed
0%
10%
20%
30%
40%
50%
60%
Lack ofliquidassets
up to 1mth
1-3 mths 3-6 mths 6-12mths
above 12mths
Total debt Housing debt Non-housing debt
0%
5%
10%
15%
20%
25%
30%
35%
40%
45%
Lack ofliquidassets
up to 1mth
1-3 mths 3-6 mths 6-12mths
above 12mths
Total debt Housing debt Non-housing debt

Debt
54 Household Wealth and Debt in Poland
to the risk of interest rate changes, but also to exchange rate fluctuations. The final risk is not a
simple sum of individual risk components, but depends on the correlation between changes in
interest rates abroad and the exchange rate of the zloty. Over the past few years, this correlation
has benefited borrowers – weaker exchange rate of the zloty was usually accompanied with inter-
est rate cuts abroad and vice versa – levelling off the amount of loan instalments. Interest rate cuts
for the major currencies in which mortgage loans were taken out (i.e. CHF and EUR) partially
reduced the scale of the burden of debt servicing costs due to the depreciation of the zloty ob-
served since mid-2008, but per saldo these costs have been increasing.
Foreign currency loans were usually granted in higher amounts, but they were taken by house-
holds earning much higher income - the median of the annual net income of a household bur-
dened with a foreign currency loan is PLN 33.5 thousand per person (as per equivalent income,
according to the OECD equivalence scale), and among households with a mortgage loan raised in
PLN is less than PLN 27 thousand per person. As a result, in terms of income, the average value of
loans taken out in foreign currencies is very similar to those raised in PLN (see the DTI indicator
in Table 3.6). Also, the percentage of households with high DTI was similar. Similarly, the average
value of the DSTI at the beginning of 2014 was similar. However, the percentage of households
spending over 40% of income on debt servicing was significantly higher among households with
mortgage loans taken out in foreign currency than among households with mortgage loans raised
in Polish zlotys (approx. 21% vs. 16%). This share is likely to have increased after the depreciation
of the Polish zloty against the Swiss franc as of the beginning of 2015.
In addition to higher income levels, the feature distinguishing households indebted with foreign
currency loans is a significantly higher value of their liquid financial assets holdings. The average
value of liquid financial assets held by households burdened with housing loans in Polish zloty
did not exceed their two-month income. In the case of households with foreign currency denomi-
nated loans these buffers are equivalent to almost 5-month income and for only less than 30% of
households they are below their monthly income.
The study suggests that in the group of households with foreign currency denominated loans
there are relatively more households heavily burdened with debt service costs, but, at the same
time, many of them have liquidity buffers in excess of liquidity buffers held by other households.
Liquid assets of households with foreign currency denominated loans allow long-term absorption
of even significant increases in the DSTI (absorption of a 20 p.p. increase in the DSTI for an aver-
age period of almost 2 years and absorption of a 30 p.p. increase in the DSTI for over a year).
A household may also try to pay off the debt with the proceeds from the sale of its assets, including
real estate property and vehicles and not just liquid assets alone. Over 90% of all indebted households
have wealth exceeding by more than 25% their debt level (see Figure 3.11, left-hand panel). This per-
centage is very similar both in the group of households with housing debt and those burdened with
another type of debt. The value of the debt exceeds the value of the whole household wealth more
often in the group of households with a loan other than housing loan (i.e. for nearly 7% of them as
compared to 1.2% of households with a housing loan).
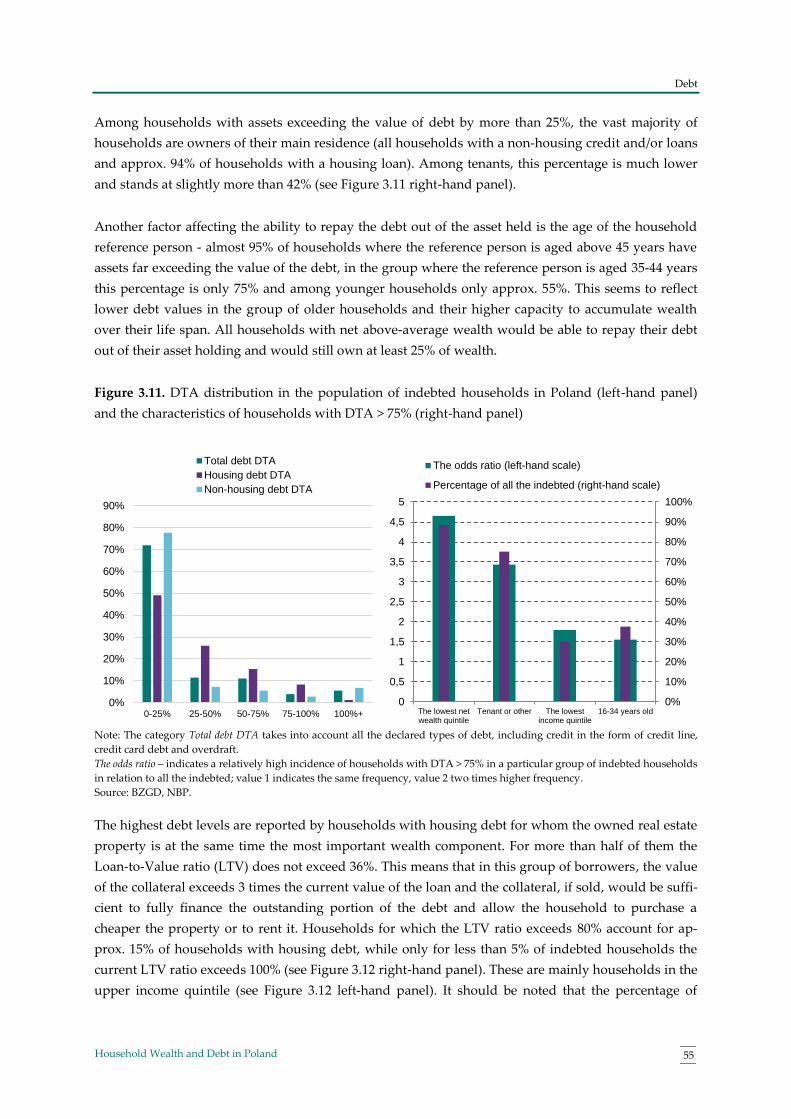
Debt
55 Household Wealth and Debt in Poland
Among households with assets exceeding the value of debt by more than 25%, the vast majority of
households are owners of their main residence (all households with a non-housing credit and/or loans
and approx. 94% of households with a housing loan). Among tenants, this percentage is much lower
and stands at slightly more than 42% (see Figure 3.11 right-hand panel).
Another factor affecting the ability to repay the debt out of the asset held is the age of the household
reference person - almost 95% of households where the reference person is aged above 45 years have
assets far exceeding the value of the debt, in the group where the reference person is aged 35-44 years
this percentage is only 75% and among younger households only approx. 55%. This seems to reflect
lower debt values in the group of older households and their higher capacity to accumulate wealth
over their life span. All households with net above-average wealth would be able to repay their debt
out of their asset holding and would still own at least 25% of wealth.
Figure 3.11. DTA distribution in the population of indebted households in Poland (left-hand panel)
and the characteristics of households with DTA > 75% (right-hand panel)
Note: The category Total debt DTA takes into account all the declared types of debt, including credit in the form of credit line,
credit card debt and overdraft.
The odds ratio – indicates a relatively high incidence of households with DTA > 75% in a particular group of indebted households
in relation to all the indebted; value 1 indicates the same frequency, value 2 two times higher frequency.
Source: BZGD, NBP.
The highest debt levels are reported by households with housing debt for whom the owned real estate
property is at the same time the most important wealth component. For more than half of them the
Loan-to-Value ratio (LTV) does not exceed 36%. This means that in this group of borrowers, the value
of the collateral exceeds 3 times the current value of the loan and the collateral, if sold, would be suffi-
cient to fully finance the outstanding portion of the debt and allow the household to purchase a
cheaper the property or to rent it. Households for which the LTV ratio exceeds 80% account for ap-
prox. 15% of households with housing debt, while only for less than 5% of indebted households the
current LTV ratio exceeds 100% (see Figure 3.12 right-hand panel). These are mainly households in the
upper income quintile (see Figure 3.12 left-hand panel). It should be noted that the percentage of
0%
10%
20%
30%
40%
50%
60%
70%
80%
90%
0-25% 25-50% 50-75% 75-100% 100%+
Total debt DTA
Housing debt DTA
Non-housing debt DTA
0%
10%
20%
30%
40%
50%
60%
70%
80%
90%
100%
0
0,5
1
1,5
2
2,5
3
3,5
4
4,5
5
The lowest netwealth quintile
Tenant or other The lowestincome quintile
16-34 years old
The odds ratio (left-hand scale)
Percentage of all the indebted (right-hand scale)

Debt
56 Household Wealth and Debt in Poland
households with the LTV ratio above 100% almost doubles (up to approx. 10% of households with
housing loan) if you refer the value of outstanding capital to the appraised value of the property at the
time of taking out a loan (Loan-to-Value at origination).
Figure 3.12. Current LTV by household income groups (left-hand panel) and distribution of LTV (% of
indebted households) (right-hand panel)
Source: BZGD, NBP.
The above analysis of the debt burden of households and the possibility of its repayment is focused on
individual indicators. From the point of view of financial stability, also the correlation between the
likelihood of being heavily indebted and the assets and liquidity buffers held by households is very
important. This is so because different risk is taken by a household whose DSTI exceeds 30% but who
holds liquid assets in excess of its few months’ income and other assets far exceeding the debt level,
and quite a different risk is faced by a household who, having the same DSTI, does not have any liq-
uid assets and all of its asset holdings would barely be sufficient for debt repayment.
The correlation between particular variables is presented with the use of empirical copula. Multidimen-
sional distribution (e.g. joint distribution of the DSTI and liquid asset, or DSTI and DTA) reflects both
the marginal distributions of individual variables and the relationship between the variables forming
it. The copula is a function describing the pure structure of relationships between variables, irrespec-
tive of the distribution of individual variables. It is obtained by normalizing the marginal distributions
(usually on a scale of 0:1, where values close to 0 indicate the lowest levels of the variable and values
close to 1, the highest). The correlations between selected variables are presented in Figure 3.13. If
variables were inversely correlated, the empirical copula distribution would concentrate around the
negatively sloping diagonal. If variables were positively correlated, the empirical copula distribution
would concentrate around the positively sloping diagonal. On the other hand, if the variables were
independent, the distribution would be uniform throughout the field.
0%
5%
10%
15%
20%
25%
30%
35%
40%
45%
0%
10%
20%
30%
40%
50%
60%
70%
80%
90%
100%
0-20% 20-40% 40-60% 60-80% 80-100%
% o
f h
ou
seh
old
s w
ith
res
iden
tial
deb
t
Households by income groups
>100%80-100%50-80%<=50%% of the indebted (right-hand scale)
0%
10%
20%
30%
40%
50%
60%
70%
Current LTV LTV at origination

Debt
57 Household Wealth and Debt in Poland
Figure 3.13. Empirical copula: DSTI vs. liquid financial assets to annual net income for total loans (left-
hand panel). DSTI vs. DTA (central panel) and DSTI vs. LTV (Current Loan-To-Value) for housing
loans (right-hand panel)
Note: The category Total debt does not include credit in the form of credit line, credit card debt or overdraft. Spearman rank
correlation coefficient in the left-hand figure is 0.01 (number of observations 1105), P(-0.05 < rho < 0.07) = 95% - statistically
insignificant correlation, in the central figure 0.44 (number of observations 1105), P(0.39< rho < 0.44) = 95%, and in the right-
hand figure 0.24 (number of observations = 356), P(0.14 < rho < 0.33) = 95%.
Source: BZGD, NBP.
Firstly, it is important how often households who are burdened with the current debt service do not
have sufficient liquidity buffers to absorb any temporary increases in the debt service costs. It turns
out that the value of the DSTI appears to be unrelated to the level of liquid assets, regardless of the
DSTI level (see Figure 3.13 left-hand panel). This means that the probability of having both high level
of DSTI and low level of liquid financial assets is relatively small, since it is the product of the proba-
bility of each of these events. 3.3% of indebted households with DSTI exceeding 40% and liquid assets
below the monthly income are in the most difficult situation (see Table 3.7). The percentage of house-
holds that could have a problem with the absorption of DSTI increases exceeding 30% of liquid asset
holdings is on the rise and amounts to nearly 7%. These are the lowest-income borrowers burdened
with a consumer loan - in this a group approx. 32% of households claim not to have any liquid assets.
Secondly, the point is how often an over-indebted household can decide to pay back its debt by selling
its assets. The extent of being burdened with the current debt service is positively correlated with the
value of the DTA ratio (see Figure 3.13, central panel). This means that households with a high DSTI
level are more likely than other to hold a low level of assets, insufficient to repay the debt effortlessly.
Thus, 0.6% of indebted households are in the most difficult situation, facing at the same time high debt
burden (DSTI> 40%) and being unable to repay the debt with the held assets (DTA> 1), whereas ap-
prox. 1.2 of indebted households would have difficulties with smooth repayment of such debt. Should
households find the threshold in excess of 30% DSTI unacceptable, 2.3% of the indebted would not be
able to easily repay the debt with the assets held. The positive correlation between the DSTI and the
DTA is observed primarily in the case of households with non-housing credit and loans. For house-
holds with housing debt, this correlation is clearly weaker, which is reflected in the absence of a strong
relationship between the current LTV and the DSTI (see Figure 3.13, right-hand panel), with a con-
cordance coefficient between these variables at the level of 0.24, and the confidence band P (0.136 <rho
<0.333) = 95%.
0
0,2
0,4
0,6
0,8
1
0 0,2 0,4 0,6 0,8 1
Liq
uid
asse
ts in
re
latio
n to
an
nu
al n
et
inco
me
Debt-Service-To-Income
0
0,2
0,4
0,6
0,8
1
0 0,2 0,4 0,6 0,8 1
Deb
t-T
o-A
sse
ts
Debt-Service-To-Income
0
0,2
0,4
0,6
0,8
1
0 0,2 0,4 0,6 0,8 1
Lo
an
-To
-Va
lue
Debt-Service-To-Income
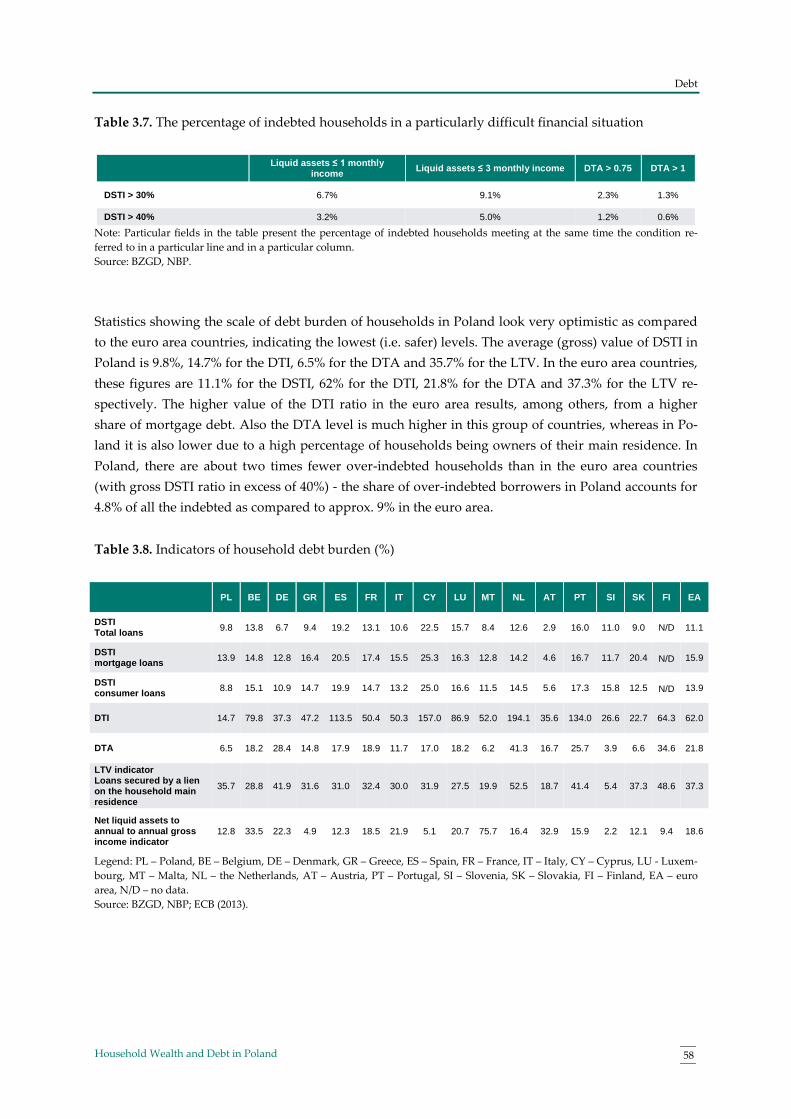
Debt
58 Household Wealth and Debt in Poland
Table 3.7. The percentage of indebted households in a particularly difficult financial situation
Liquid assets ≤ 1 monthly income
Liquid assets ≤ 3 monthly income DTA > 0.75 DTA > 1
DSTI > 30% 6.7% 9.1% 2.3% 1.3%
DSTI > 40% 3.2% 5.0% 1.2% 0.6%
Note: Particular fields in the table present the percentage of indebted households meeting at the same time the condition re-
ferred to in a particular line and in a particular column.
Source: BZGD, NBP.
Statistics showing the scale of debt burden of households in Poland look very optimistic as compared
to the euro area countries, indicating the lowest (i.e. safer) levels. The average (gross) value of DSTI in
Poland is 9.8%, 14.7% for the DTI, 6.5% for the DTA and 35.7% for the LTV. In the euro area countries,
these figures are 11.1% for the DSTI, 62% for the DTI, 21.8% for the DTA and 37.3% for the LTV re-
spectively. The higher value of the DTI ratio in the euro area results, among others, from a higher
share of mortgage debt. Also the DTA level is much higher in this group of countries, whereas in Po-
land it is also lower due to a high percentage of households being owners of their main residence. In
Poland, there are about two times fewer over-indebted households than in the euro area countries
(with gross DSTI ratio in excess of 40%) - the share of over-indebted borrowers in Poland accounts for
4.8% of all the indebted as compared to approx. 9% in the euro area.
Table 3.8. Indicators of household debt burden (%)
PL BE DE GR ES FR IT CY LU MT NL AT PT SI SK FI EA
DSTI Total loans
9.8 13.8 6.7 9.4 19.2 13.1 10.6 22.5 15.7 8.4 12.6 2.9 16.0 11.0 9.0 N/D 11.1
DSTI mortgage loans
13.9 14.8 12.8 16.4 20.5 17.4 15.5 25.3 16.3 12.8 14.2 4.6 16.7 11.7 20.4
N/D 15.9
DSTI consumer loans
8.8 15.1 10.9 14.7 19.9 14.7 13.2 25.0 16.6 11.5 14.5 5.6 17.3 15.8 12.5
N/D 13.9
DTI 14.7 79.8 37.3 47.2 113.5 50.4 50.3 157.0 86.9 52.0 194.1 35.6 134.0 26.6 22.7 64.3 62.0
DTA 6.5 18.2 28.4 14.8 17.9 18.9 11.7 17.0 18.2 6.2 41.3 16.7 25.7 3.9 6.6 34.6 21.8
LTV indicator Loans secured by a lien on the household main residence
35.7 28.8 41.9 31.6 31.0 32.4 30.0 31.9 27.5 19.9 52.5 18.7 41.4 5.4 37.3 48.6 37.3
Net liquid assets to annual to annual gross income indicator
12.8 33.5 22.3 4.9 12.3 18.5 21.9 5.1 20.7 75.7 16.4 32.9 15.9 2.2 12.1 9.4 18.6
Legend: PL – Poland, BE – Belgium, DE – Denmark, GR – Greece, ES – Spain, FR – France, IT – Italy, CY – Cyprus, LU - Luxem-
bourg, MT – Malta, NL – the Netherlands, AT – Austria, PT – Portugal, SI – Slovenia, SK – Slovakia, FI – Finland, EA – euro
area, N/D – no data.
Source: BZGD, NBP; ECB (2013).

References
59 Household Wealth and Debt in Poland
References
Allianz (2014). Global Wealth Report 2014, Public Policy & Economic Research, Allianz SE, Munich.
Arrondel, L., M. Roger and F. Savignac (2014). Wealth and income in the euro area: Heterogeneity in
households’ behaviours?, Working Paper 1709, European Central Bank.
Banco de Espana (2014). Survey of household finances (EFF) 2011. Methods, results and changes since
2008, Economic Bulletin, pp. 13-44.
Beer, C. and M. Schürz (2007). Characteristics of Household Debt in Austria. Does Household Debt
Pose a Threat to Financial Stability?, In: Monetary Policy & the Economy Q2/07. OeNB, pp. 58–79.
Bucks, Brian. K. and Karen M. Pence (2015). Wealth, Pensions, Debt and Savings: Considerations for a
Panel Survey, Finance and Economics Discussion Series 2015-019, Washington: Board of Gover-
nors of the Federal Reserve System.
Clauset, A., C. R. Shalizi, M. E. J. Newman (2009). Power-law distributions in empirical data, SIAM
Review 51(4). pp. 661-703.
Credit Suisse's (2014). Global Wealth Report 2014, Research Institute, Credit Suisse AG. Zurich.
Czapiński. J., T. Panek (ed.) (2014). Diagnoza Społeczna 2013. Warunki i jakość życia Polaków. Raport,
Warsaw.
Davies J. B., S. Sandstrom, A. F. Shorrocks, E. N. Wolff E. N. (2010). The level of distribution of
global household wealth, The Economic Journal 121, pp. 223-254.
Davies. J.B. and A.F. Shorrocks (2000). The distribution of wealth, in: A.B. Atkinson i F. Bourgui-
gnon (red.). Handbook of Income Distribution, Edition 1, Volume 1, Chapter 11, Elsevier , pp. 605-
675.
Deutsche Bundesbank (2013). Household wealth and finances in Germany: results of the Bundesbank
survey, Monthly Report June 23, p. 27.
ECB (2013a). The Eurosystem Household Finance and Consumption Survey: Results from the first wave,
Statistics Paper Series 2, Household Finance and Consumption Network, European Central Bank.
ECB (2013b). The Eurosystem Household Finance and Consumption Survey: Methodological Report for
the First Wave, Statistics Paper Series 2, Household Finance and Consumption Network, European
Central Bank.
ECB (2009). Survey Data on Household Finance and Consumption. Research Summary and Policy Use,
Occasional Paper Series No. 100, The Eurosystem Household Finance and Consumption Net-
work, European Central Bank.

References
60 Household Wealth and Debt in Poland
FED (2014). Changes in U.S. Family Finances from 2010 to 2013: Evidence from the Survey of Consumer
Finances, Federal Reserve Bulletin, Vol. 100, No 4, Washington: Board of Governors of the Federal
Reserve System.
Fessler. P. and M. Schürz (2013). Cross-Country Comparability of the Eurosystem Household Finance
and Consumption Survey, Monetary Policy and the Economy Q2/13, Oesterreichische National-
bank.
Fessler. P. and M. Schürz (2015). Private wealth across European countries: The role of income, inher-
itance and the welfare state, Working Paper, European Central Bank.
Forbes (2014). 100 najbogatszych Polaków. http://100najbogatszychpolakow.forbes.pl (The
Forbes’ list of 100 richest Poles).
GUS (2014). Dochody i warunki życia ludności Polski (Report from the EU-SILC Survey 2013), Warsaw.
Kennickell A. (2007). The Role of Over-sampling of the Wealthy in the Survey of Consumer Finances,
Federal Reserve Board, Survey of Consumer Finances Working Papers.
KNF (2013). Biuletyn Roczny. Rynek ubezpieczeń 2013. Statistical Report 02, The Office of the Polish
Financial Supervision Authority, Warsaw.
KNF (2015). Indywidualne konta emerytalne oraz indywidualne konta zabezpieczenia emerytalnego
w 2014 roku, The Office of the Polish Financial Supervision Authority, Warsaw.
May O. and Tudela M. (2005). When is mortgage indebtedness a financial burden to British households?
A dynamic probit approach, Bank of England working papers 277, Bank of England.
NBP (2014). Financial System in Poland 2013., Narodowy Bank Polski, Warsaw.
NBP (2015a). Financial Stability Report – July 2015, NBP, Warsaw.
NBP (2015b). Household Wealth and Debt in Poland – Methodological Annex to the Pilot Survey 2014,
NBP. Warsaw.
OECD (2013). Guidelines for micro statistics on household wealth, OECD Publishing, Paris.
OECD (2015). In It Together: Why Less Inequality Benefits All, OECD Publishing, Paris.
UNO (2013). Inequality Matters. Report of the World Social Situation 2013, Department of Economic
and Social Affairs, The United Nations, New York.
Vermeulen. P. (2014). How fat is the top tail of the wealth distribution?, Working Paper Series 1692,
Household Finance And Consumption Network, ECB.
Wolff E. N. (2006). Chapter 6: Changes in Household wealth in the 1980s and 1990s in the US, in: Wolff
E. N. ( Editor). International Perspectives on Household Wealth, Edgar Publishing Ltd.

References
61 Household Wealth and Debt in Poland
Wójcik-Żołądek. M. (2013). Nierówności społeczne w Polsce, Infos. No. 20(157), Biuro Analiz
Sejmowych Kancelarii Sejmu, Warsaw.
Ynesta. I. (2008). Households’ Wealth Composition Across OECD Countries and Financial Risks Borne
by Households, OECD, Paris.
Zachłod-Jelec. M. (2008). Koncepcja bogactwa gospodarstw domowych. Szacunki dla Polski,
Gospodarka Narodowa, No. 9.
Zachłod-Jelec. M. (2011). Związki dynamiczne między konsumpcją, dochodem i aktywami : wnioski dla
Polski, Bank i Kredyt, No. 6. pp. 49-84.
Zajączkowski. S. and D. Żochowski (2007). Obcia̜żenia gospodarstw domowych spłatami długu: roz-
kłady i stress testy: na podstawie badań budżetów gospodarstw domowych GUS, Materiały i Studia, Vo-
lume no. 221, NBP, Warsaw.

Statistical annex
62 Household Wealth and Debt in Poland
Statistical annex
Table A1. Percentage of households, conditional mean and conditional distribution of gross wealth (assets), net wealth, real
assets, financial assets, debt and the annual gross and net income.
Gross wealth
(Total as-sets)
Net wealth Debt Real assets Financial
assets
Gross income (annual)
Net income (annual)
Percentage of house-holds (%)
96.1 100.0 37.0 88.8 88.7 99.9 99.9
Conditional mean (PLN thousand)
449.8 411.1 57.3 465.2 21.9 70.5 48.1
Conditional distribution (PLN thousand)
5-percentile 2.5 0.0 0.6 6.6 0.3 13.6 10.3
10- percentile 10.1 2.4 1.0 50.0 1.0 19.2 13.9
20- percentile 97.4 49.2 2.0 130.0 2.2 27.5 19.7
30- percentile 161.6 130.0 3.5 180.0 3.9 36.5 25.8
40- percentile 218.5 187.8 6.0 240.0 6.0 46.2 32.4
50- percentile 294.1 256.8 10.0 302.1 8.6 56.9 39.6
60- percentile 380.0 345.2 17.0 400.8 12.7 68.7 47.7
70- percentile 492.4 456.5 39.6 498.0 20.0 83.3 56.7
80- percentile 641.3 602.3 90.0 643.0 30.6 102.2 69.0
90- percentile 930.0 879.0 191.1 940.0 47.4 134.6 90.0
95- percentile 1317.9 1263.8 280.0 1300.0 72.2 166.9 110.0

Statistical annex
63 Household Wealth and Debt in Poland
Table A2 Percentage of gross wealth (total assets), net wealth and debt of households broken down into particular groups
Structure
Gross wealth (total assets)
Net wealth Debt
% of house-holds
median (PLN thou-sand)
mean (PLN thou-sand)
median (PLN thou-sand)
mean (PLN thou-sand)
% of house-holds
median (PLN thou-sand)
mean (PLN thou-sand)
All households 100.0 294.1 449.8 256.8 411.1 37.0 10.0 57.3
Ownership status
Owner without housing credit 65.6 359.5 529.3 355.0 523.3 29.0 5.7 20.9
Owner with housing credit 10.8 438.5 628.4 275.6 477.7 100.0 111.0 150.7
Tenant or other 23.6 10.8 87.3 4.6 68.7 30.5 3.2 13.7
Household type
One-person household 24.0 181.3 263.5 150.0 230.6 20.5 3.6 29.1
Single-parent family with children 6.3 240.4 298.2 193.4 271.7 34.1 5.4 29.1
Couple 19.3 271.8 444.7 247.2 411.2 36.2 12.0 71.3
Couple with children 32.3 359.0 534.2 314.2 488.8 49.5 17.2 77.9
Extended-family household 18.1 413.7 580.1 403.5 559.9 38.3 6.5 24.5
Age of the reference person
16-24 1.6 16.4 207.3 9.5 183.2 16.5 2.8 7.2
25-34 14.1 248.0 340.9 158.5 282.2 50.6 38.0 91.7
35-44 18.4 343.5 527.1 286.0 470.8 51.9 25.0 87.5
45-54 20.0 359.0 558.1 334.1 525.7 40.5 8.0 39.9
55-64 23.3 303.0 476.0 294.3 451.0 32.5 6.0 28.2
65-74 13.0 257.0 357.5 242.1 339.7 25.2 3.0 13.5
75+ 9.7 219.4 334.7 186.5 297.2 12.5 3.6 37.6
Labour force status of the reference person
Employed 45.5 286.8 400.5 238.6 359.3 46.8 14.0 71.3
Self-employed 11.1 795.6 1 102.1 783.6 1 068.1 45.6 20.7 74.5
Retired 28.5 248.0 342.7 225.1 321.2 23.0 4.5 23.6
Other not working 14.9 195.0 287.7 157.4 251.0 27.3 3.6 16.4
Education of the reference person
Primary or no education 15.7 196.1 317.8 151.0 270.2 22.4 3.4 19.3
Secondary education 60.9 270.0 449.5 247.8 423.2 37.9 7.4 37.8
Tertiary education 23.4 409.3 526.7 343.6 473.1 44.4 52.0 113.6
Class of geographical location
Urban areas 67.1 242.3 374.0 207.2 335.3 37.3 11.3 63.1
Above 200 thousand inhabitants 25.3 315.7 453.5 258.3 396.4 37.4 15.0 95.1
Below 200 thousand inhabitants 41.8 212.5 326.3 184.7 298.2 37.3 10.0 43.7
Rural areas 32.9 399.2 603.6 366.1 565.5 36.3 7.0 45.0
Net income (quantiles)
0-20% 20.0 160.0 231.5 120.0 196.0 20.1 2.5 9.2
20-40% 19.9 189.2 293.4 178.6 280.2 28.2 4.4 19.4
40-60% 20.1 269.2 385.9 253.8 364.5 40.4 7.5 39.1
60-80% 19.9 390.0 587.2 357.5 552.5 47.3 14.4 67.7
80-90% 10.0 429.1 535.8 405.8 507.0 48.6 13.5 59.3
90-100% 10.0 627.6 896.8 539.0 817.2 49.1 78.8 147.9
Net wealth (quantiles)
0-20% 20.0 6.2 22.2 2.4 7.3 34.3 3.5 30.8
20-40% 20.1 143.1 149.8 129.9 125.2 43.1 12.0 56.9
40-60% 20.1 265.5 279.0 256.8 257.8 35.9 10.5 58.9
60-80% 19.9 466.2 477.8 455.4 458.8 32.8 10.0 58.0
80-90% 9.9 714.8 736.5 698.6 715.5 39.8 12.9 52.9
90-100% 10.0 1 296.8 1 732.9 1 263.8 1 692.7 37.9 26.9 106.2

Statistical annex
64 Household Wealth and Debt in Poland
Table A3. Gross wealth broken down into real assets and financial assets (percentage of households, share of gross wealth
(assets) by groups of households
Gross wealth (total assets)
Real assets Financial assets
% of households % of households
% of gross wealth
(assets) % of households
% of gross wealth
(assets)
All households 96.1 88.8 95.5 88.7 4.5
Ownership status
Owner without housing credit 100.0 100.0 95.9 91.0 4.1
Owner with housing credit 100.0 100.0 94.3 96.9 5.7
Tenant or other 83.5 52.3 85.1 78.3 14.9
Household type
One-person household 89.8 76.4 93.7 76.7 6.3
Single-parent family with children 94.4 81.1 95.0 84.4 5.0
Couple 98.3 94.0 94.2 92.2 5.8
Couple with children 98.7 93.7 97.1 93.9 2.9
Extended-family household 98.1 93.2 98.7 92.8 1.3
Age of the reference person
16-24 89.0 62.9 92.6 76.9 7.4
25-34 96.4 87.9 94.3 93.0 5.7
35-44 97.9 91.7 95.1 91.9 4.9
45-54 97.1 91.4 95.6 91.9 4.4
55-64 96.7 90.6 95.1 88.9 4.9
65-74 96.0 88.7 95.7 86.5 4.3
75+ 90.2 79.5 95.4 73.9 4.6
Labour force status of the reference person
Employed 98.0 91.0 93.7 93.7 6.3
Self-employed 100.0 99.8 97.0 94.8 3.0
Retired 95.3 88.2 95.3 85.1 4.7
Other not working 88.8 74.7 96.5 75.4 3.5
Education of the reference person
Primary or no education 86.4 73.1 97.6 69.3 2.4
Secondary education 97.3 89.8 96.4 90.3 3.6
Tertiary education 99.4 96.6 91.6 97.5 8.4
Class of geographical location
Urban areas 96.0 86.4 93.5 90.5 6.5
Above 200 thousand inhabitants 95.2 85.2 92.6 90.7 7.4
Below 200 thousand inhabitants 96.4 87.2 94.3 90.3 5.7
Rural areas 96.4 93.4 97.3 84.9 2.7
Net income (quantiles)
0-20% 85.5 69.2 71.6 67.8 28.4
20-40% 97.4 85.1 92.4 87.7 7.6
40-60% 98.6 93.7 93.4 92.4 6.6
60-80% 99.5 96.5 95.4 97.0 4.6
80-90% 100.0 99.4 96.7 98.4 3.3
90-100% 99.2 99.2 96.0 98.4 4.0
Net wealth (quantiles)
0-20% 80.5 44.3 97.3 74.7 2.7
20-40% 100.0 99.4 96.0 90.2 4.0
40-60% 100.0 100.0 96.0 90.0 4.0
60-80% 100.0 100.0 96.1 92.3 3.9
80-90% 100.0 100.0 94.9 95.1 5.1
90-100% 100.0 100.0 92.1 96.9 7.9

Statistical annex
65 Household Wealth and Debt in Poland
Table A4. Percentage of households holding real assets by types of assets and groups of householders (%)
Real assets
Household main residence
Other real estate prop-erty
Vehicles Valuables
Self-employment business wealth
All households 88.8 77.4 19.1 63.0 25.7 18.8
Ownership status
Owner without housing credit 100.0 100.0 20.9 67.3 27.8 22.5
Owner with housing credit 100.0 100.0 25.4 84.2 27.0 22.7
Tenant or other 52.3 4.3 11.2 41.6 19.4 6.6
Household type
One-person household 76.4 65.1 11.8 25.2 19.1 5.0
Single-parent family with children 81.1 71.6 13.8 43.8 21.0 11.6
Couple 94.0 79.5 23.2 70.0 27.3 14.7
Couple with children 93.7 81.0 24.7 82.7 27.9 25.7
Extended-family household 93.2 87.2 16.3 77.3 30.3 31.6
Age of the reference person
16-24 62.9 33.3 13.0 43.6 21.0 12.8
25-34 87.9 62.0 21.7 75.5 25.5 15.3
35-44 91.7 78.3 24.0 76.0 27.7 27.3
45-54 91.4 82.5 21.5 76.2 26.6 29.3
55-64 90.6 83.3 19.7 60.8 26.4 19.4
65-74 88.7 83.2 12.8 43.3 26.2 5.3
75+ 79.5 74.0 10.1 29.4 20.0 4.2
Labour force status of the reference person
Employed 91.0 75.6 22.3 75.4 27.8 11.9
Self-employed 99.8 92.1 28.9 84.3 32.2 94.8
Retired 88.2 80.8 13.9 45.2 24.8 5.5
Other not working 74.7 65.5 12.0 43.4 16.3 8.6
Education of the reference person
Primary or no education 73.1 65.8 6.1 32.8 15.3 12.0
Secondary education 89.8 78.5 17.8 65.8 26.0 20.7
Tertiary education 96.6 82.3 31.2 76.1 32.0 18.4
Class of geographical location
Urban areas 86.4 72.7 20.3 57.9 27.1 12.2
Above 200 thousand inhabitants 85.2 69.0 22.3 55.0 30.0 13.5
Below 200 thousand inhabitants 87.2 75.0 19.1 59.7 25.3 11.5
Rural areas 93.4 86.9 16.7 73.4 22.9 32.2
Net income (quantiles)
0-20% 69.2 60.5 7.1 21.4 14.4 4.8
20-40% 85.1 70.7 12.1 47.7 23.5 10.9
40-60% 93.7 80.2 18.2 71.2 27.2 18.6
60-80% 96.5 86.4 21.5 84.6 27.5 26.5
80-90% 99.4 87.6 31.0 89.9 31.0 26.8
90-100% 99.2 91.1 42.2 90.7 41.1 39.4
Net wealth (quantiles)
0-20% 44.3 6.9 2.5 33.6 15.9 1.1
20-40% 99.4 89.8 11.4 54.6 21.5 4.0
40-60% 100.0 96.1 18.6 63.5 25.0 8.8
60-80% 100.0 95.8 23.3 74.8 28.9 23.0
80-90% 100.0 97.6 33.1 88.1 36.3 42.6
90-100% 100.0 99.1 46.3 89.2 38.1 71.2

Statistical annex
66 Household Wealth and Debt in Poland
Table A5a. Conditional medians and means for real assets by types of assets and groups of households (PLN thousand)
Real assets
Household main resi-dence
Other real estate proper-ty
Vehicles Valuables Self-employment business
wealth
median mean median mean median mean median mean median mean median mean
All households 302.1 465.2 282.6 371.6 150.0 238.9 12.0 20.5 2.0 5.5 219.7 347.0
Ownership status
Owner without housing credit 343.5 508.8 270.0 363.8 144.2 248.2 12.0 20.8 2.0 5.9 201.5 343.2
Owner with housing credit 422.0 596.0 350.0 420.0 170.0 249.6 15.0 22.4 3.0 5.4 272.5 407.2
Tenant or other 13.0 119.2 328.0 358.8 137.5 179.3 9.0 17.2 1.5 4.0 276.9 288.7
Household type
One-person household 200.0 291.0 200.0 270.5 150.7 209.9 10.0 18.9 2.0 5.9 258.0 314.9
Single-parent family with children 266.7 330.4 250.0 304.0 122.5 144.5 8.0 21.3 1.5 7.8 100.0 167.9
Couple 270.0 439.1 260.0 347.9 137.5 254.0 10.0 17.3 2.7 7.4 271.6 428.9
Couple with children 362.0 538.5 320.0 421.0 165.9 237.0 14.0 22.6 2.0 4.1 220.0 332.9
Extended-family household 423.1 591.5 350.0 432.0 120.0 277.0 12.0 20.0 2.5 4.9 210.7 356.1
Age of the reference person
16-24 131.5 272.3 270.3 383.3 23.4 143.2 10.0 17.4 1.0 5.2 10.4 127.9
25-34 256.1 353.0 258.7 338.2 146.2 183.7 12.6 21.4 2.5 6.3 200.0 282.9
35-44 372.3 537.6 320.0 416.9 160.0 243.9 12.0 20.4 2.0 4.6 260.0 333.4
45-54 368.0 568.2 300.1 405.6 160.0 244.8 13.0 23.3 2.0 4.4 237.7 386.5
55-64 314.2 484.7 280.0 357.1 144.2 304.1 12.0 20.6 2.5 7.1 200.0 348.6
65-74 267.3 371.2 260.0 340.2 100.0 170.0 10.0 15.6 2.0 5.1 155.3 311.9
75+ 250.4 362.7 250.0 332.2 120.0 196.2 7.5 13.4 2.0 4.9 150.0 425.0
Labour force status of the reference person
Employed 297.0 406.2 284.7 354.9 156.0 230.1 13.0 20.2 2.0 5.9 200.0 279.3
Self-employed 789.4 1 073.5 446.0 579.1 270.0 427.3 20.0 31.0 3.0 6.0 250.0 407.5
Retired 258.3 353.5 250.0 331.1 100.0 147.5 10.0 16.4 2.0 5.2 155.3 273.0
Other not working 240.0 330.2 240.0 308.2 80.0 153.6 8.0 15.0 1.5 3.7 278.7 224.7

Statistical annex
67 Household Wealth and Debt in Poland
Table A5b. Conditional medians and means for real assets by types of assets and groups of households (PLN thousand)
Real assets
Household main resi-dence
Other real estate proper-ty
Vehicles Valuables Self-employment business
wealth
median mean median mean median mean median mean median mean median mean
Education of the reference person
Primary or no education 257.0 366.8 252.8 336.0 120.0 181.3 8.0 12.8 1.0 1.9 163.6 260.5
Secondary education 285.0 470.7 264.7 368.7 120.0 239.4 12.0 19.4 2.0 4.0 224.4 371.2
Tertiary education 393.6 500.8 330.0 397.6 180.0 245.6 17.0 25.2 3.9 9.7 260.0 312.1
Class of geographical location
Urban areas 265.1 390.0 250.0 337.5 150.0 225.2 12.0 20.0 2.5 6.2 200.0 266.1
Above 200 thousand inhabitants 340.0 473.0 320.0 404.6 200.0 291.9 15.0 22.9 2.8 8.5 258.7 320.6
Below 200 thousand inhabitants 222.0 340.8 200.0 300.1 130.0 178.1 10.0 18.4 2.0 4.6 147.3 227.1
Rural areas 405.5 606.9 350.0 429.7 146.2 273.0 12.0 21.2 2.0 3.7 250.0 409.6
Net income (quantiles)
0-20% 200.0 278.3 220.0 275.6 90.0 168.7 7.0 12.3 1.0 2.8 200.0 226.8
20-40% 200.0 322.8 200.0 299.1 100.0 179.7 7.0 12.0 1.8 3.5 228.7 322.4
40-60% 272.0 390.4 267.7 341.8 100.0 153.2 10.0 14.1 2.0 4.6 245.3 281.4
60-80% 392.7 583.4 340.0 435.5 160.0 301.7 14.0 23.0 2.5 6.3 215.2 379.2
80-90% 401.3 513.0 350.0 404.9 124.3 187.7 18.0 23.3 2.3 7.0 224.4 276.1
90-100% 587.0 832.9 444.1 510.6 228.2 344.4 25.0 35.8 5.0 8.5 202.1 456.6
Net wealth (quantiles)
0-20% 7.0 29.0 80.0 124.5 20.0 32.7 6.0 8.5 1.0 2.1 12.4 17.2
20-40% 132.0 139.2 130.0 135.5 50.0 71.7 10.0 12.5 1.5 2.9 15.0 26.4
40-60% 254.7 260.7 230.0 234.8 72.0 98.7 10.0 15.1 2.0 5.9 39.8 64.5
60-80% 448.8 457.2 400.0 380.9 150.0 158.9 15.0 24.6 3.0 7.1 120.0 150.7
80-90% 695.8 713.5 589.4 531.4 182.2 217.3 18.0 22.0 3.0 4.6 244.8 239.5
90-100% 1 245.3 1 672.4 781.6 922.4 400.0 550.8 25.0 38.4 3.0 9.0 400.0 653.1

Statistical annex
68 Household Wealth and Debt in Poland
Table A6. Share of particular real assets in the total value of real assets by groups of households (%)
Real
assets
Household main resi-
dence
Other real estate
property Vehicles Valuables
Self-employment business wealth
All households 100.0 69.7 11.1 3.1 0.3 15.8
Ownership status
Owner without housing credit 100.0 71.5 10.2 2.8 0.3 15.2
Owner with housing credit 100.0 70.5 10.6 3.2 0.2 15.5
Tenant or other 100.0 24.5 32.1 11.5 1.3 30.7
Household type
One-person household 100.0 79.2 11.1 2.1 0.5 7.1
Single-parent family with children 100.0 81.2 7.5 3.5 0.6 7.2
Couple 100.0 67.0 14.3 2.9 0.5 15.3
Couple with children 100.0 67.5 11.6 3.7 0.2 16.9
Extended-family household 100.0 68.3 8.2 2.8 0.3 20.4
Age of the reference person
16-24 100.0 74.6 10.8 4.4 0.6 9.5
25-34 100.0 67.5 12.9 5.2 0.5 13.9
35-44 100.0 66.2 11.9 3.1 0.3 18.5
45-54 100.0 64.4 10.1 3.4 0.2 21.8
55-64 100.0 67.7 13.6 2.9 0.4 15.4
65-74 100.0 86.0 6.6 2.1 0.4 5.0
75+ 100.0 85.2 6.9 1.4 0.3 6.2
Labour force status of the reference person
Employed 100.0 72.6 13.9 4.1 0.4 9.0
Self-employed 100.0 49.8 11.5 2.4 0.2 36.1
Retired 100.0 85.8 6.6 2.4 0.4 4.8
Other not working 100.0 81.8 7.5 2.6 0.2 7.8
Education of the reference person
Primary or no education 100.0 82.5 4.2 1.6 0.1 11.7
Secondary education 100.0 68.5 10.1 3.0 0.2 18.1
Tertiary education 100.0 67.7 15.9 4.0 0.6 11.9
Class of geographical location
Urban areas 100.0 72.8 13.6 3.4 0.5 9.6
Above 200 thousand inhabitants 100.0 69.3 16.2 3.1 0.6 10.7
Below 200 thousand inhabitants 100.0 75.7 11.5 3.7 0.4 8.7
Rural areas 100.0 65.8 8.0 2.8 0.1 23.2
Net income (quantiles)
0-20% 100.0 86.5 6.2 1.4 0.2 5.7
20-40% 100.0 76.9 7.9 2.1 0.3 12.8
40-60% 100.0 75.0 7.6 2.7 0.3 14.3
60-80% 100.0 66.8 11.5 3.5 0.3 17.9
80-90% 100.0 69.6 11.4 4.1 0.4 14.5
90-100% 100.0 56.3 17.6 3.9 0.4 21.8
Net wealth (quantiles)
0-20% 100.0 67.3 6.3 22.4 2.6 1.5
20-40% 100.0 87.9 5.9 4.9 0.5 0.8
40-60% 100.0 86.5 7.0 3.7 0.6 2.2
60-80% 100.0 79.8 8.1 4.0 0.4 7.6
80-90% 100.0 72.7 10.1 2.7 0.2 14.3
90-100% 100.0 54.7 15.3 2.0 0.2 27.8

Statistical annex
69 Household Wealth and Debt in Poland
Table A7. Share of groups of households holding real assets by types of assets (%)
Real assets
Household main resi-dence
Other real estate proper-ty
Vehicles Valuables
Self-employment business wealth
All households 100.0 100.0 100.0 100.0 100.0 100.0
Ownership status
Owner without housing credit 80.9 83.0 74.7 71.2 75.9 77.8
Owner with housing credit 15.5 15.7 14.9 15.7 11.1 15.2
Tenant or other 3.6 1.3 10.3 13.1 13.1 6.9
Household type
One-person household 12.9 14.7 13.0 8.8 19.3 5.8
Single-parent family with children 4.1 4.8 2.8 4.5 7.3 1.9
Couple 19.3 18.5 24.9 18.1 27.7 18.7
Couple with children 39.5 38.3 41.4 46.9 26.5 42.4
Extended-family household 24.2 23.7 17.9 21.7 19.2 31.2
Age of the reference person
16-24 0.7 0.7 0.6 0.9 1.2 0.4
25-34 10.6 10.3 12.3 17.6 15.9 9.3
35-44 21.9 20.8 23.4 21.9 16.6 25.6
45-54 25.1 23.2 22.9 27.4 16.5 34.6
55-64 24.8 24.1 30.4 22.5 31.0 24.1
65-74 10.3 12.7 6.1 6.8 12.1 3.3
75+ 6.7 8.2 4.2 2.9 6.6 2.6
Labour force status of the reference person
Employed 40.7 42.4 51.1 53.6 52.5 23.2
Self-employed 28.8 20.6 30.0 22.5 15.2 65.9
Retired 21.5 26.5 12.8 16.3 26.0 6.5
Other not working 8.9 10.4 6.0 7.5 6.4 4.4
Education of the reference person
Primary or no education 10.2 12.1 3.8 5.1 3.3 7.5
Secondary education 62.4 61.4 56.9 60.3 45.2 71.8
Tertiary education 27.4 26.6 39.3 34.6 51.5 20.6
Class of geographical location
Urban areas 54.8 57.3 67.2 60.2 80.3 33.5
Above 200 thousand inhabitants 24.7 24.6 36.1 24.7 45.9 16.8
Below 200 thousand inhabitants 30.1 32.7 31.1 35.5 34.4 16.7
Rural areas 45.2 42.7 32.8 39.8 19.7 66.5
Net income (quantiles)
0-20% 9.3 11.6 5.3 4.1 5.7 3.3
20-40% 13.3 14.6 9.5 8.8 11.8 10.7
40-60% 17.8 19.2 12.3 15.6 17.6 16.2
60-80% 27.2 26.1 28.3 30.0 24.6 30.8
80-90% 12.3 12.3 12.7 16.2 15.4 11.3
90-100% 20.1 16.2 31.9 25.3 24.9 27.7
Net wealth (quantiles)
0-20% 0.6 0.6 0.4 4.4 4.7 0.1
20-40% 6.7 8.5 3.6 10.6 8.9 0.3
40-60% 12.6 15.7 8.0 14.9 21.0 1.7
60-80% 22.2 25.4 16.3 28.5 29.1 10.7
80-90% 17.2 18.0 15.7 15.0 11.8 15.6
90-100% 40.7 31.9 56.1 26.6 24.5 71.6

Statistical annex
70 Household Wealth and Debt in Poland
Table A8. Percentage of households holding financial assets by types of assets and groups of households (%)
Financial
assets Deposits
Mutual funds
Bonds Shares
Voluntary pension scheme / Life insurance
policy
Other financial assets
Other receiva-
bles
All households 88.7 81.9 4.2 1.0 3.5 51.3 2.2 5.0
Ownership status
Owner without housing credit 91.0 84.2 4.0 1.1 3.4 53.0 2.2 4.1
Owner with housing credit 96.9 94.1 8.7 1.8 7.2 63.6 3.7 8.0
Tenant or other 78.3 69.6 2.6 0.4 2.2 41.0 1.7 6.2
Household type
One-person household 76.7 66.0 2.5 1.1 2.1 37.3 1.7 5.0
Single-parent family with children 84.4 74.0 3.8 1.2 1.2 41.7 1.3 4.1
Couple 92.2 85.4 5.1 2.0 5.8 58.0 2.1 5.1
Couple with children 93.9 90.0 5.6 0.5 4.4 57.8 3.0 6.1
Extended-family household 92.8 87.2 3.1 0.8 2.3 54.3 2.1 3.3
Age of the reference person
16-24 76.9 76.9 3.8 - 0.7 24.9 2.7 3.1
25-34 93.0 89.8 5.4 0.7 5.3 53.2 1.9 8.2
35-44 91.9 87.1 5.7 1.1 4.4 53.7 3.7 5.8
45-54 91.9 87.3 4.8 0.7 3.9 54.6 2.7 4.6
55-64 88.9 82.4 3.1 1.5 3.0 53.8 1.6 5.0
65-74 86.5 73.1 3.3 1.1 2.8 48.5 2.2 2.9
75+ 73.9 61.6 2.5 1.1 1.6 38.1 0.5 2.7
Labour force status of the refer-ence person
Employed 93.7 89.3 5.8 1.1 5.0 58.8 2.9 5.5
Self-employed 94.8 92.5 3.3 0.9 3.8 47.7 3.9 9.4
Retired 85.1 74.2 3.3 1.5 2.5 48.7 1.4 3.4
Other not working 75.4 65.7 1.6 - 0.9 35.9 0.6 3.5
Education of the reference person
Primary or no education 69.3 56.0 0.2 0.1 0.9 34.8 0.3 3.1
Secondary education 90.3 83.2 2.4 0.8 3.1 52.0 1.6 5.3
Tertiary education 97.5 95.7 11.6 2.4 6.5 60.3 5.0 5.5
Class of geographical location
Urban areas 90.5 83.9 5.0 1.2 4.2 54.2 2.4 5.7
Above 200 thousand inhabitants 90.7 85.4 7.2 1.7 4.8 45.5 2.8 6.6
Below 200 thousand inhabitants 90.3 82.9 3.7 0.9 3.8 59.4 2.2 5.1
Rural areas 84.9 77.7 2.5 0.8 2.2 45.4 1.8 3.7
Net income (quantiles)
0-20% 67.8 55.9 1.1 0.1 0.9 30.2 0.3 4.1
20-40% 87.7 77.9 1.4 1.0 1.3 45.0 1.2 4.6
40-60% 92.4 86.5 3.4 1.0 2.6 52.6 2.1 2.9
60-80% 97.0 92.0 5.5 0.7 5.4 60.2 2.8 6.0
80-90% 98.4 97.7 6.8 1.5 5.1 65.1 2.2 5.5
90-100% 98.4 96.5 12.2 3.3 9.8 71.3 7.3 9.6
Net wealth (quantiles)
0-20% 74.7 64.7 0.6 0.3 0.5 37.9 0.5 5.1
20-40% 90.2 82.1 3.4 0.2 2.4 57.1 0.9 4.4
40-60% 90.0 82.6 3.7 1.5 3.0 54.5 1.6 4.4
60-80% 92.3 86.6 6.5 1.1 6.3 52.2 3.4 3.7
80-90% 95.1 91.7 4.1 2.3 3.4 56.3 4.4 5.4
90-100% 96.9 94.9 9.2 1.8 7.5 52.9 5.3 9.4

Statistical annex
71 Household Wealth and Debt in Poland
Table A9a. Conditional medians and means for financial assets by types of assets and groups of households (PLN thousand)
Financial assets Deposits Mutual funds Bonds Shares
Voluntary pension scheme / Life
insurance policy
Other financial assets
Other receivables
median mean median mean median mean median mean median mean median mean median mean median mean
All households 8.6 21.9 5.0 16.2 11.9 33.4 6.1 28.8 8.0 16.5 4.3 5.7 9.0 23.7 3.0 9.4
Ownership status
Owner without housing credit
9.4 22.5 6.0 16.9 12.0 34.6 4.4 26.2 9.0 19.0 4.3 5.7 9.0 26.0 3.5 9.5
Owner with housing credit 13.4 33.5 6.6 22.0 12.3 39.1 45.0 51.0 10.0 16.3 5.4 7.1 20.0 26.6 3.0 9.8
Tenant or other 4.7 13.4 2.5 10.4 11.0 20.1 4.9 6.2 4.3 5.9 3.1 4.5 5.9 12.3 2.0 8.9
Household type
One-person household 4.0 18.5 3.0 15.9 11.8 36.4 6.1 21.7 10.0 12.2 2.4 3.1 6.4 37.0 3.7 10.7
Single-parent family with children
4.2 16.1 2.5 12.8 8.6 17.9 4.3 36.9 15.0 12.8 2.7 3.9 3.5 27.4 3.2 20.1
Couple 10.1 26.2 7.0 19.6 12.8 29.1 8.0 26.7 9.0 19.6 4.5 5.6 5.0 27.1 2.4 9.3
Couple with children 10.6 24.0 6.0 16.4 11.5 37.2 4.9 55.7 6.0 11.4 5.4 6.7 10.0 21.4 3.5 8.0
Extended-family household 9.1 19.3 5.9 13.7 15.0 32.4 4.2 14.6 10.5 32.1 5.4 6.8 6.9 10.9 2.0 6.7
Age of the reference person
16-24 3.4 16.9 2.0 11.9 6.3 18.6 - - 5.4 5.4 3.3 4.8 50.0 61.3 0.2 8.0
25-34 9.6 19.6 5.0 15.2 11.0 11.1 5.7 5.6 9.0 6.7 4.3 5.9 3.7 8.0 2.0 3.4
35-44 10.0 25.3 5.0 17.3 12.0 37.7 50.0 58.3 7.0 13.9 5.1 6.5 12.0 21.5 5.0 9.1
45-54 10.1 24.4 6.0 17.8 10.0 36.0 2.0 6.8 6.0 14.6 5.3 6.9 5.9 13.1 2.5 10.5
55-64 8.6 23.4 5.0 16.8 20.0 54.6 4.3 16.9 12.0 26.3 4.3 5.5 20.0 42.8 3.0 11.2
65-74 5.3 16.1 4.0 12.4 21.7 28.4 15.0 16.3 20.0 29.3 2.7 3.9 7.5 33.8 5.0 12.4
75+ 4.7 18.2 4.3 15.8 15.4 25.5 100.0 80.1 0.3 14.8 2.4 3.4 1.7 17.3 4.6 22.0
Labour force status of the reference person
Employed 9.9 24.5 5.0 17.0 11.0 34.9 6.1 31.9 8.0 16.5 4.9 6.0 10.0 26.2 2.4 6.7
Self-employed 18.0 32.7 12.0 23.6 30.0 61.9 10.0 16.1 10.0 15.2 6.4 9.4 13.0 16.4 3.7 13.9
Retired 6.2 17.4 4.1 14.1 11.8 22.3 5.8 28.2 5.2 17.9 3.0 4.2 6.0 26.7 4.0 10.7
Other not working 3.6 11.6 2.0 9.8 8.6 17.4 - - 3.8 13.8 3.0 4.2 6.0 8.4 3.5 10.7

Statistical annex
72 Household Wealth and Debt in Poland
Table A9b. Conditional medians and means for financial assets and groups of households (PLN thousand)
Financial assets Deposits Mutual funds Bonds Shares
Voluntary pension scheme / Life
insurance policy
Other financial assets
Other receivables
median mean median mean median mean median mean median mean median mean median mean median mean
Education of the refer-ence person
Primary or no education 3.7 9.2 2.3 8.2 60.0 60.0 50.0 50.0 4.7 9.9 2.6 3.4 50.0 41.2 1.5 7.0
Secondary education 8.0 16.6 4.0 12.4 12.0 26.3 4.2 12.0 7.5 16.2 4.3 5.3 6.4 10.8 3.0 8.6
Tertiary education 18.1 40.9 12.0 27.9 11.0 37.0 15.0 41.8 9.0 17.6 5.3 7.3 15.0 33.9 3.7 12.3
Class of geographical location
Urban areas 9.1 24.0 5.0 17.6 10.0 32.1 8.0 30.9 8.0 17.0 4.3 5.7 10.0 25.8 3.0 10.2
Above 200 thousand inhabitants
11.8 32.1 8.0 23.6 10.0 44.4 7.5 32.0 9.0 16.2 4.3 6.1 15.0 33.5 3.0 11.6
Below 200 thousand inhabitants
8.4 19.1 4.1 13.8 11.0 17.5 10.0 29.6 8.0 17.5 4.3 5.6 10.0 19.9 2.5 9.1
Rural areas 7.7 17.4 4.1 13.1 24.0 39.0 4.2 22.4 7.5 14.8 4.3 5.6 3.1 17.8 3.7 6.8
Net income (quantiles)
0-20% 2.4 7.7 1.2 7.3 10.0 16.8 4.2 4.2 3.8 4.8 2.3 2.6 1.4 2.6 2.0 3.9
20-40% 4.8 12.6 2.4 10.5 20.0 24.7 10.0 30.2 2.8 6.4 2.7 3.4 3.5 11.7 2.5 11.6
40-60% 7.6 15.8 4.0 12.2 7.8 17.5 4.3 23.2 10.0 15.1 3.8 4.7 5.9 6.9 4.0 8.1
60-80% 11.2 22.3 6.3 16.5 12.3 18.7 4.4 4.4 5.0 12.8 5.3 6.3 9.0 14.0 3.2 9.0
80-90% 18.8 26.2 11.9 18.3 8.0 25.3 40.0 30.3 5.4 10.3 6.0 7.2 6.9 15.0 3.0 4.4
90-100% 34.1 64.5 22.8 40.3 25.0 65.0 15.0 42.9 12.0 29.4 8.1 10.2 20.0 48.9 2.5 15.9
Net wealth (quantiles)
0-20% 3.4 6.8 1.3 5.1 4.3 4.7 8.0 6.7 3.4 2.8 3.0 3.8 5.0 4.1 2.0 4.8
20-40% 6.3 12.5 3.0 9.4 8.0 15.1 4.2 5.0 4.3 8.2 3.3 4.7 6.4 8.1 2.5 3.5
40-60% 10.0 20.3 6.0 15.8 10.0 16.8 5.7 16.1 9.0 12.7 4.3 5.6 10.0 18.7 5.0 14.2
60-80% 11.5 22.4 7.0 16.3 10.0 18.1 6.1 30.1 8.0 17.5 4.5 5.8 5.9 15.1 3.9 11.4
80-90% 12.3 24.2 8.8 18.0 20.0 18.8 2.3 8.5 11.3 25.6 5.3 6.7 9.0 13.2 2.5 6.6
90-100% 26.5 62.5 20.8 41.7 30.0 92.2 80.0 86.0 11.0 21.0 6.6 9.3 20.0 54.8 6.0 15.4

Statistical annex
73 Household Wealth and Debt in Poland
Table A10. Share of particular financial assets in the total value of financial assets by groups of households (%)
Financial
assets Deposits
Investment funds
Bonds Shares
Voluntary pension
scheme / Life insurance
policy
Other finan-cial
assets
Other receiv-ables
All households 100.0 68.2 7.2 1.5 3.0 15.0 2.7 2.4
Ownership status
Owner without housing credit 100.0 69.2 6.7 1.5 3.2 14.8 2.7 1.9
Owner with housing credit 100.0 63.8 10.4 2.8 3.6 13.8 3.1 2.4
Tenant or other 100.0 68.8 5.0 0.3 1.2 17.5 2.0 5.3
Household type
One-person household 100.0 73.9 6.3 1.7 1.8 8.2 4.4 3.8
Single-parent family with children 100.0 69.6 5.0 3.4 1.1 12.1 2.7 6.0
Couple 100.0 69.3 6.1 2.2 4.7 13.3 2.3 2.0
Couple with children 100.0 65.3 9.2 1.2 2.2 17.1 2.8 2.2
Extended-family household 100.0 66.6 5.6 0.7 4.0 20.6 1.3 1.2
Age of the reference person
16-24 100.0 70.2 5.5 - 0.3 9.3 12.9 1.9
25-34 100.0 74.8 3.3 0.2 2.0 17.3 0.8 1.5
35-44 100.0 64.8 9.2 2.8 2.6 15.0 3.4 2.3
45-54 100.0 69.1 7.6 0.2 2.5 16.7 1.6 2.2
55-64 100.0 66.6 8.0 1.3 3.8 14.3 3.3 2.7
65-74 100.0 64.8 6.8 1.3 5.9 13.5 5.2 2.6
75+ 100.0 72.3 4.7 6.6 1.8 9.5 0.7 4.4
Labour force status of the refer-ence person
Employed 100.0 65.9 8.8 1.6 3.6 15.4 3.3 1.6
Self-employed 100.0 70.3 6.6 0.5 1.9 14.4 2.1 4.2
Retired 100.0 70.5 5.0 2.8 3.0 13.8 2.5 2.4
Other not working 100.0 73.3 3.1 - 1.5 17.3 0.6 4.2
Education of the reference person
Primary or no education 100.0 71.8 1.5 1.1 1.4 18.5 2.2 3.4
Secondary education 100.0 69.1 4.1 0.6 3.3 18.6 1.2 3.0
Tertiary education 100.0 66.8 10.8 2.5 2.9 11.1 4.2 1.7
Class of geographical location
Urban areas 100.0 67.9 7.4 1.7 3.3 14.3 2.9 2.7
Above 200 thousand inhabitants 100.0 69.3 10.9 1.8 2.7 9.5 3.2 2.6
Below 200 thousand inhabit-ants
100.0 66.5 3.7 1.5 3.9 19.2 2.5 2.7
Rural areas 100.0 69.0 6.6 1.2 2.2 17.2 2.2 1.7
Net income (quantiles)
0-20% 100.0 77.6 3.4 0.1 0.8 14.9 0.2 3.0
20-40% 100.0 73.7 3.1 2.6 0.8 13.8 1.3 4.8
40-60% 100.0 72.1 4.1 1.6 2.7 16.9 1.0 1.6
60-80% 100.0 70.0 4.8 0.1 3.2 17.6 1.8 2.5
80-90% 100.0 69.1 6.7 1.8 2.0 18.2 1.3 0.9
90-100% 100.0 61.3 12.5 2.2 4.6 11.4 5.6 2.4
Net wealth (quantiles)
0-20% 100.0 65.3 0.6 0.4 0.3 28.2 0.4 4.9
20-40% 100.0 68.1 4.6 0.1 1.8 23.5 0.6 1.4
40-60% 100.0 71.4 3.4 1.3 2.1 16.8 1.6 3.4
60-80% 100.0 68.2 5.7 1.6 5.3 14.7 2.5 2.1
80-90% 100.0 71.5 3.4 0.8 3.8 16.5 2.5 1.5
90-100% 100.0 65.4 14.0 2.6 2.6 8.2 4.8 2.4

Statistical annex
74 Household Wealth and Debt in Poland
Table A11. Share of groups of households holding financial assets by types of assets (%)
Financial
assets Deposits
Mutual funds
Bonds Shares
Voluntary pension
scheme / Life insurance
policy
Other financial assets
Other receiv-ables
All households 100.0 100.0 100.0 100.0 100.0 100.0 100.0 100.0
Ownership status
Owner without housing credit 69.3 70.3 65.0 65.3 73.3 68.5 70.3 54.4
Owner with housing credit 18.0 16.8 26.1 32.6 21.6 16.6 20.4 18.0
Tenant or other 12.7 12.8 8.9 2.1 5.2 14.9 9.3 27.7
Household type
One-person household 17.5 19.0 15.4 19.3 10.7 9.5 28.4 27.2
Single-parent family with children 4.4 4.5 3.1 9.5 1.6 3.5 4.4 10.9
Couple 23.9 24.3 20.3 34.4 37.7 21.3 20.4 19.7
Couple with children 37.5 35.9 48.2 29.5 27.6 42.7 38.9 33.9
Extended-family household 16.7 16.3 13.0 7.3 22.5 23.0 8.0 8.4
Age of the reference person
16-24 1.1 1.1 0.8 - 0.1 0.7 5.0 0.8
25-34 13.2 14.5 6.0 1.8 8.5 15.3 4.1 8.3
35-44 22.0 20.9 28.0 39.1 19.0 22.0 27.6 20.4
45-54 23.0 23.3 24.4 3.2 19.2 25.7 13.3 20.6
55-64 24.9 24.4 27.8 20.1 31.0 23.8 30.4 27.8
65-74 9.3 8.8 8.7 7.5 18.2 8.3 17.8 10.0
75+ 6.7 7.1 4.3 28.3 4.0 4.2 1.7 12.1
Labour force status of the refer-ence person
Employed 53.8 52.0 65.9 55.1 63.9 55.2 64.8 35.5
Self-employed 17.7 18.3 16.2 5.6 11.0 17.1 13.7 30.9
Retired 21.7 22.5 15.0 39.3 21.8 20.0 20.1 21.9
Other not working 6.7 7.2 2.9 - 3.3 7.8 1.4 11.6
Education of the reference person
Primary or no education 5.2 5.4 1.1 3.7 2.4 6.4 4.3 7.2
Secondary education 46.9 47.5 27.0 18.4 51.9 58.1 20.7 58.8
Tertiary education 48.0 47.0 71.9 78.0 45.6 35.5 75.0 34.0
Class of geographical location
Urban areas 75.0 74.7 77.0 80.9 81.7 71.4 79.6 82.5
Above 200 thousand inhabitants 38.0 38.6 57.7 45.3 33.7 24.0 44.8 41.1
Below 200 thousand inhabit-ants
37.1 36.1 19.3 35.6 48.0 47.4 34.8 41.4
Rural areas 25.0 25.3 23.0 19.1 18.3 28.6 20.4 17.5
Net income (quantiles)
0-20% 5.4 6.1 2.6 0.3 1.4 5.4 0.3 6.8
20-40% 11.4 12.3 4.9 19.4 2.9 10.4 5.3 22.5
40-60% 15.1 15.9 8.6 15.3 13.5 17.0 5.5 10.1
60-80% 22.2 22.8 14.7 2.1 23.7 26.1 15.0 22.8
80-90% 13.3 13.4 12.3 15.5 9.0 16.1 6.2 5.2
90-100% 32.7 29.4 57.0 47.4 49.5 25.0 67.8 32.6
Net wealth (quantiles)
0-20% 5.2 5.0 0.4 1.3 0.4 9.8 0.8 10.5
20-40% 11.6 11.6 7.4 0.7 6.8 18.3 2.7 6.6
40-60% 18.8 19.7 8.8 16.4 13.1 21.1 11.0 26.4
60-80% 21.3 21.3 16.8 22.3 37.5 20.9 19.4 18.1
80-90% 11.8 12.4 5.5 6.4 15.0 13.0 10.9 7.5
90-100% 31.3 30.0 61.0 52.9 27.1 17.1 55.2 31.0

Statistical annex
75 Household Wealth and Debt in Poland
Table A12. Percentage of indebted households by type of debt and groups of households (%)
Total debt
Housing credits / loans Total of other forms of debt
In domes-tic curren-cy
In foreign curren-cy
Backed on the HMR
Other
Credit line/ overdraft
Credit card debt
Other credit and loans
All households 37.0 12.1 10.1 2.2 10.8 1.6 29.4 6.1 5.3 24.7
Ownership status
Owner without housing credit 29.0 1.5 1.1 0.4 - 1.5 28.0 4.8 4.1 24.8
Owner with housing credit 100.0 100.0 83.7 17.4 100.0 2.5 37.0 12.9 13.2 25.6
Tenant or other 30.5 1.4 1.4 - 0.1 1.4 29.8 6.7 5.2 24.0
Household type
One-person household 20.5 4.2 3.7 0.5 3.8 0.4 17.1 3.4 2.7 14.3
Single-parent family with children 34.1 7.6 6.4 1.2 6.5 1.1 30.8 6.9 5.5 25.8
Couple 36.2 12.8 10.1 2.7 10.8 2.2 27.2 5.7 4.1 23.7
Couple with children 49.5 22.4 18.6 4.0 20.1 2.9 36.3 8.4 7.0 29.6
Extended-family household 38.3 5.1 4.4 0.9 4.8 0.3 35.2 5.9 7.0 30.6
Age of the reference person
16-24 16.5 - - - - - 16.5 - 5.3 15.3
25-34 50.6 27.6 24.9 2.7 25.2 2.8 31.4 5.4 8.7 26.0
35-44 51.9 24.5 19.0 6.1 22.4 2.8 37.7 10.2 9.5 29.2
45-54 40.5 10.7 8.7 2.0 9.4 1.6 34.7 8.0 4.2 30.6
55-64 32.5 5.2 4.2 0.9 4.0 1.2 29.1 5.5 4.5 24.4
65-74 25.2 2.6 2.3 0.3 2.1 0.4 23.3 4.1 2.8 20.2
75+ 12.5 0.6 0.6 - 0.6 - 11.9 1.2 0.4 11.5
Labour force status of the refer-ence person
Employed 46.8 19.6 16.2 3.6 17.5 2.7 34.3 8.1 7.7 27.6
Self-employed 45.6 17.5 13.9 3.8 14.9 2.7 35.4 3.6 6.6 32.3
Retired 23.0 2.3 2.1 0.2 2.1 0.2 21.4 4.0 2.6 19.0
Other not working 27.3 3.9 3.6 0.3 3.9 - 25.0 6.2 2.4 21.3
Education of the reference person
Primary or no education 22.4 2.0 1.8 0.2 2.0 0.1 20.9 3.2 0.7 19.7
Secondary education 37.9 9.5 8.3 1.3 8.6 1.1 32.3 6.6 5.6 27.4
Tertiary education 44.4 25.6 20.3 5.8 22.4 3.9 27.5 7.0 7.6 21.2
Class of geographical location
Urban areas 37.3 13.1 10.5 2.7 11.4 2.0 29.0 7.1 6.0 23.7
Above 200 thousand inhabitants 37.4 14.9 11.2 4.0 12.9 2.5 27.5 6.7 6.9 21.8
Below 200 thousand inhabit-ants
37.3 11.9 10.1 1.9 10.5 1.7 29.8 7.4 5.5 24.8
Rural areas 36.3 10.1 9.2 1.1 9.5 0.8 30.3 4.2 3.9 26.9
Net income (quantiles)
0-20% 20.1 2.0 2.0 - 1.9 0.2 18.5 4.5 1.9 15.6
20-40% 28.2 4.9 4.4 0.5 4.7 0.3 24.6 5.0 3.3 21.5
40-60% 40.4 11.6 9.4 2.2 10.6 0.9 32.9 7.2 6.1 27.3
60-80% 47.3 17.5 15.8 1.9 16.3 1.7 37.9 8.1 8.3 31.4
80-90% 48.6 19.2 16.3 3.4 15.0 5.1 38.1 5.7 6.3 32.5
90-100% 49.1 29.6 20.9 9.0 25.8 4.6 28.0 6.3 7.9 23.2
Net wealth (quantiles)
0-20% 34.3 4.5 4.0 0.6 4.3 0.2 31.6 8.0 4.8 25.7
20-40% 43.1 16.5 14.8 1.7 15.1 1.7 32.8 7.3 5.1 27.4
40-60% 35.9 12.0 9.3 2.9 11.3 0.7 27.6 5.8 7.1 22.1
60-80% 32.8 11.2 9.9 1.4 9.9 1.5 26.3 4.5 3.6 21.4
80-90% 39.8 15.8 13.6 2.2 14.2 2.6 31.3 7.8 5.6 23.9
90-100% 37.9 16.6 11.1 6.1 12.6 4.8 25.9 2.6 6.4 17.8

Statistical annex
76 Household Wealth and Debt in Poland
Table A13a. Conditional medians and means for debt by type of debt and groups of households (PLN thousand)
Total debt
Housing credits / loans Total of other forms of debt
In domestic currency
In foreign currency
Backed on the HMR
Other
Credit line/ overdraft
Credit card debt
Other credit and loans
medi-
an mea
n medi-
an mea
n medi-
an mea
n medi-
an mea
n median mean
medi-an
mean
medi-an
mean
medi-an
mean
medi-an
mean
medi-an
mean
All households 10.0 57.3 104.0 142.7 100.0 130.0 114.5 194.7 103.0 142.8 101.8 117.8 5.0 13.4 2.0 3.5 1.4 2.7 5.0 14.4
Ownership status
Owner without housing credit 5.7 20.9 101.8 108.1 110.0 117.0 66.2 85.8 - - 101.8 108.1 5.0 15.8 2.0 4.0 1.2 2.3 5.1 16.6
Owner with housing credit 111.0 150.7 104.0 145.9 99.0 130.5 130.0 211.3 103.0 143.1 110.0 113.7 7.5 13.0 2.6 4.2 2.0 3.2 8.0 15.0
Tenant or other 3.2 13.7 158.0 143.0 158.0 143.0 - - 5.0 5.0 158.0 150.8 3.0 7.1 1.3 2.0 1.2 3.2 3.5 7.6
Household type
One-person household 3.6 29.1 50.0 105.1 50.0 97.7 156.0 163.2 50.0 106.3 54.2 92.0 2.4 9.4 1.0 2.6 0.8 4.3 2.5 9.8
Single-parent family with children 5.4 29.1 50.0 96.2 50.0 90.6 44.4 125.0 50.0 86.6 169.0 155.5 2.5 8.5 1.5 2.2 1.5 2.1 2.5 9.1
Couple 12.0 71.3 126.0 172.2 145.0 162.7 100.5 208.0 132.0 178.3 92.0 128.0 5.0 13.5 2.0 2.6 1.2 2.7 5.0 14.4
Couple with children 17.2 77.9 115.0 150.2 104.0 136.5 138.9 204.5 115.0 150.3 110.0 113.2 5.3 13.6 2.0 4.1 1.5 2.3 5.0 15.0
Extended-family household 6.5 24.5 43.6 69.2 34.6 55.5 90.0 126.6 43.6 66.8 150.0 109.6 6.0 16.7 3.0 4.3 1.4 2.8 6.0 17.7
Age of the reference person
16-24 2.8 7.2 - - - - - - - - - - 2.8 7.2 - - 0.7 1.1 4.1 7.4
25-34 38.0 91.7 137.0 157.0 144.6 152.8 75.0 195.2 137.0 159.6 92.0 114.7 6.0 9.9 2.0 4.5 1.7 2.7 6.2 10.1
35-44 25.0 87.5 115.0 164.4 110.0 143.4 118.7 212.6 118.7 164.7 110.0 117.6 5.4 13.9 2.0 3.0 1.3 2.3 6.0 16.1
45-54 8.0 39.9 60.0 117.1 54.8 101.3 100.5 185.3 59.0 118.2 80.0 87.5 5.0 10.7 2.0 4.7 1.5 2.6 5.0 10.5
55-64 6.0 28.2 50.0 79.3 43.6 65.5 138.9 142.5 43.6 63.7 120.0 123.6 4.4 17.4 1.2 2.7 1.2 3.6 5.0 19.5
65-74 3.0 13.5 38.0 86.1 38.0 89.5 90.0 60.8 18.1 49.2 150.0 268.5 2.2 5.2 1.5 2.5 2.0 3.6 2.4 5.0
75+ 3.6 37.6 26.8 17.1 26.8 17.1 - - 26.8 17.1 - - 3.6 38.6 5.0 4.3 0.9 1.0 3.6 39.5
Labour force status of the reference person
Employed 14.0 71.3 119.0 153.3 111.0 136.7 150.0 220.8 122.0 155.1 100.0 109.6 5.0 9.8 2.0 3.2 1.2 2.2 5.6 10.6
Self-employed 20.7 74.5 110.5 135.9 62.9 135.8 114.5 127.1 75.0 137.2 120.0 122.8 8.0 28.9 3.0 8.3 2.0 5.4 7.8 29.7
Retired 4.5 23.6 27.0 82.1 27.0 82.4 90.0 79.5 26.8 64.4 150.0 255.4 3.6 16.5 2.0 4.0 1.0 2.7 3.8 17.4
Other not working 3.6 16.4 56.3 71.5 56.3 72.7 90.0 58.3 56.3 71.5 - - 3.0 6.8 1.0 2.3 2.0 2.4 2.8 7.1

Statistical annex
77 Household Wealth and Debt in Poland
Table A13b. Conditional medians and means for debt by type of debt and groups of households (PLN thousand)
Total debt
Housing credits / loans Total of other forms of debt
In domestic currency
In foreign currency
Backed on the HMR
Other
Credit line/ overdraft
Credit card loans
Other loans
medi-
an mea
n medi-
an mea
n medi-
an mea
n medi-
an mea
n medi-
an mea
n medi-
an mea
n medi-
an mea
n medi-
an mea
n medi-
an mea
n medi-
an mea
n Education of the reference person
Primary or no education 3.4 19.3 38.0 61.4 38.0 61.5 90.0 60.8 38.0 58.9 120.0 120.0 3.0 14.7 1.0 1.9 0.7 1.4 3.0 15.2
Secondary education 7.4 37.8 70.0 108.1 59.0 100.9 100.5 154.6 60.0 104.7 110.0 118.0 5.0 12.5 2.0 3.7 1.2 2.1 5.0 13.5
Tertiary education 52.0 113.6 150.0 180.8 144.6 164.9 156.0 221.5 153.0 186.0 100.0 117.6 6.0 15.2 2.0 3.6 1.7 4.0 7.6 17.1
Class of geographical location
Urban areas 11.3 63.1 115.0 152.3 110.0 137.3 118.7 206.1 118.7 153.8 101.8 117.2 5.0 12.7 2.0 3.4 1.4 2.7 5.0 13.8
Above 200 thousand inhabit-ants
15.0 95.1 170.0 207.9 169.0 185.5 215.0 259.3 209.5 216.4 110.0 121.5 6.0 16.5 1.7 2.9 1.5 3.7 6.2 18.8
Below 200 thousand inhabit-ants
10.0 43.7 71.2 110.1 76.2 104.7 65.2 138.7 70.0 107.1 92.0 113.2 4.0 10.5 2.0 3.7 1.3 1.9 4.4 11.1
Rural areas 7.0 45.0 90.0 117.7 74.0 113.0 100.5 138.6 80.0 116.0 120.0 120.8 5.0 14.7 2.0 4.1 2.2 2.9 5.0 15.5
Net income (quantiles)
0-20% 2.5 9.2 50.0 54.5 50.0 54.5 - - 50.0 45.1 158.0 158.0 2.0 4.0 1.0 1.9 0.8 1.8 2.0 3.9
20-40% 4.4 19.4 60.0 71.7 60.0 69.7 60.0 89.9 60.0 71.3 3.0 60.1 3.3 7.9 1.2 2.1 1.5 3.2 3.3 8.0
40-60% 7.5 39.1 66.2 106.8 92.0 102.9 65.2 123.5 61.3 105.0 92.0 127.7 3.8 10.5 2.0 2.6 1.0 1.4 4.0 11.7
60-80% 14.4 67.7 105.6 138.2 121.9 139.4 100.5 117.5 114.5 138.7 64.4 97.7 6.0 20.5 2.0 4.3 1.8 2.6 6.2 22.9
80-90% 13.5 59.3 130.0 127.9 104.4 116.6 150.0 160.3 119.0 121.2 100.0 125.6 6.5 11.3 3.0 4.6 1.0 2.6 6.5 11.9
90-100% 78.8 147.9 182.0 221.6 153.0 190.9 271.3 286.2 209.5 232.3 110.0 123.7 9.5 25.5 3.0 7.4 1.7 5.2 9.5 27.0
Net wealth (quantiles)
0-20% 3.5 30.8 160.0 180.8 150.0 153.5 351.4 377.8 160.0 183.2 40.0 138.8 3.0 7.5 1.3 2.1 1.2 1.7 3.3 7.3
20-40% 12.0 56.9 101.2 128.7 122.0 137.2 50.0 56.6 99.0 125.1 169.0 143.2 4.3 9.9 2.0 2.9 0.7 1.5 4.3 7.3
40-60% 10.5 58.9 104.0 154.2 86.2 112.5 215.0 282.1 100.5 155.6 158.0 132.4 5.5 9.4 2.2 4.4 1.8 3.0 5.0 8.2
60-80% 10.0 58.0 98.0 137.6 80.0 137.3 101.8 126.0 98.0 139.8 101.8 104.3 5.8 13.8 2.0 2.7 2.4 3.0 5.8 10.1
80-90% 12.9 52.9 54.2 114.3 50.5 91.1 237.3 256.2 50.5 103.5 80.0 126.3 7.0 9.5 4.0 4.5 0.9 2.7 6.0 8.8
90-100% 26.9 106.2 130.0 166.8 120.0 157.5 130.0 168.1 132.4 183.9 100.0 97.4 8.0 48.2 15.0 12.2 1.5 5.2 6.0 15.0
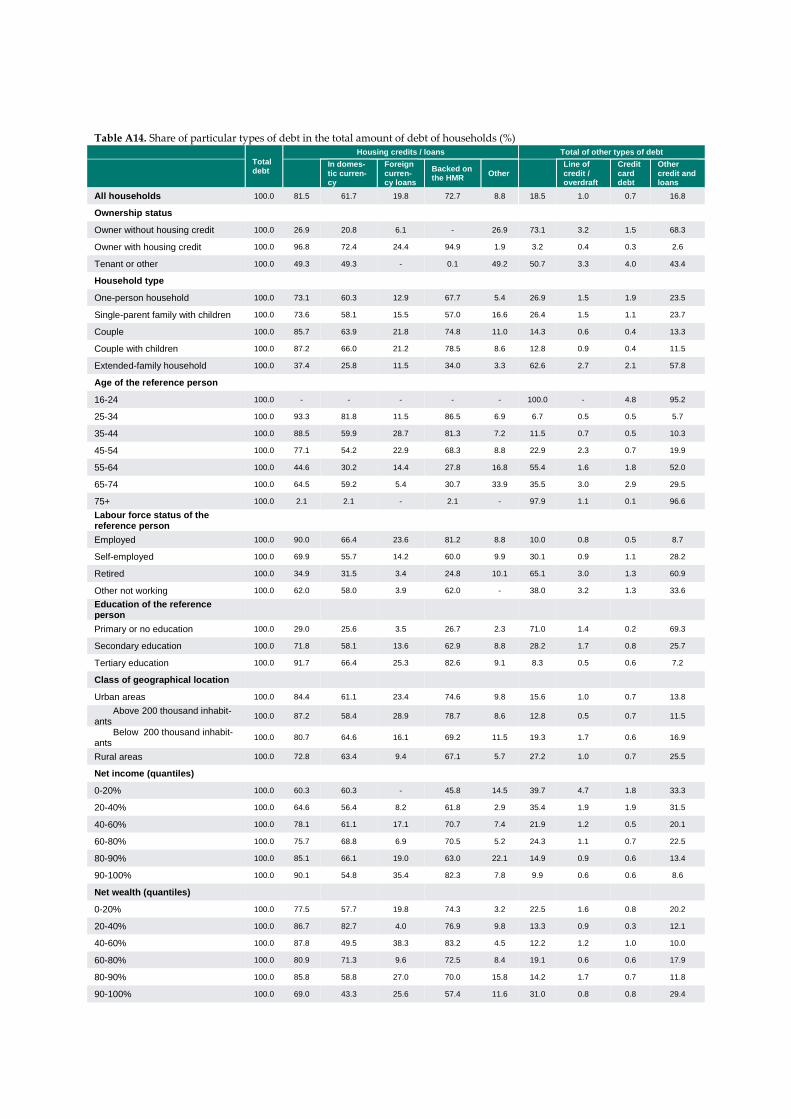
Table A14. Share of particular types of debt in the total amount of debt of households (%)
Total debt
Housing credits / loans Total of other types of debt
In domes-tic curren-cy
Foreign curren-cy loans
Backed on the HMR
Other
Line of credit / overdraft
Credit card debt
Other credit and loans
All households 100.0 81.5 61.7 19.8 72.7 8.8 18.5 1.0 0.7 16.8
Ownership status
Owner without housing credit 100.0 26.9 20.8 6.1 - 26.9 73.1 3.2 1.5 68.3
Owner with housing credit 100.0 96.8 72.4 24.4 94.9 1.9 3.2 0.4 0.3 2.6
Tenant or other 100.0 49.3 49.3 - 0.1 49.2 50.7 3.3 4.0 43.4
Household type
One-person household 100.0 73.1 60.3 12.9 67.7 5.4 26.9 1.5 1.9 23.5
Single-parent family with children 100.0 73.6 58.1 15.5 57.0 16.6 26.4 1.5 1.1 23.7
Couple 100.0 85.7 63.9 21.8 74.8 11.0 14.3 0.6 0.4 13.3
Couple with children 100.0 87.2 66.0 21.2 78.5 8.6 12.8 0.9 0.4 11.5
Extended-family household 100.0 37.4 25.8 11.5 34.0 3.3 62.6 2.7 2.1 57.8
Age of the reference person
16-24 100.0 - - - - - 100.0 - 4.8 95.2
25-34 100.0 93.3 81.8 11.5 86.5 6.9 6.7 0.5 0.5 5.7
35-44 100.0 88.5 59.9 28.7 81.3 7.2 11.5 0.7 0.5 10.3
45-54 100.0 77.1 54.2 22.9 68.3 8.8 22.9 2.3 0.7 19.9
55-64 100.0 44.6 30.2 14.4 27.8 16.8 55.4 1.6 1.8 52.0
65-74 100.0 64.5 59.2 5.4 30.7 33.9 35.5 3.0 2.9 29.5
75+ 100.0 2.1 2.1 - 2.1 - 97.9 1.1 0.1 96.6
Labour force status of the reference person
Employed 100.0 90.0 66.4 23.6 81.2 8.8 10.0 0.8 0.5 8.7
Self-employed 100.0 69.9 55.7 14.2 60.0 9.9 30.1 0.9 1.1 28.2
Retired 100.0 34.9 31.5 3.4 24.8 10.1 65.1 3.0 1.3 60.9
Other not working 100.0 62.0 58.0 3.9 62.0 - 38.0 3.2 1.3 33.6
Education of the reference person
Primary or no education 100.0 29.0 25.6 3.5 26.7 2.3 71.0 1.4 0.2 69.3
Secondary education 100.0 71.8 58.1 13.6 62.9 8.8 28.2 1.7 0.8 25.7
Tertiary education 100.0 91.7 66.4 25.3 82.6 9.1 8.3 0.5 0.6 7.2
Class of geographical location
Urban areas 100.0 84.4 61.1 23.4 74.6 9.8 15.6 1.0 0.7 13.8
Above 200 thousand inhabit-ants
100.0 87.2 58.4 28.9 78.7 8.6 12.8 0.5 0.7 11.5
Below 200 thousand inhabit-ants
100.0 80.7 64.6 16.1 69.2 11.5 19.3 1.7 0.6 16.9
Rural areas 100.0 72.8 63.4 9.4 67.1 5.7 27.2 1.0 0.7 25.5
Net income (quantiles)
0-20% 100.0 60.3 60.3 - 45.8 14.5 39.7 4.7 1.8 33.3
20-40% 100.0 64.6 56.4 8.2 61.8 2.9 35.4 1.9 1.9 31.5
40-60% 100.0 78.1 61.1 17.1 70.7 7.4 21.9 1.2 0.5 20.1
60-80% 100.0 75.7 68.8 6.9 70.5 5.2 24.3 1.1 0.7 22.5
80-90% 100.0 85.1 66.1 19.0 63.0 22.1 14.9 0.9 0.6 13.4
90-100% 100.0 90.1 54.8 35.4 82.3 7.8 9.9 0.6 0.6 8.6
Net wealth (quantiles)
0-20% 100.0 77.5 57.7 19.8 74.3 3.2 22.5 1.6 0.8 20.2
20-40% 100.0 86.7 82.7 4.0 76.9 9.8 13.3 0.9 0.3 12.1
40-60% 100.0 87.8 49.5 38.3 83.2 4.5 12.2 1.2 1.0 10.0
60-80% 100.0 80.9 71.3 9.6 72.5 8.4 19.1 0.6 0.6 17.9
80-90% 100.0 85.8 58.8 27.0 70.0 15.8 14.2 1.7 0.7 11.8
90-100% 100.0 69.0 43.3 25.6 57.4 11.6 31.0 0.8 0.8 29.4

Figure A15. Percentage of households burdened with particular types of debt (%)
Total debt
Housing credit / loans Total of other types of debt
In domestic currency
In foreign
currency
Backed on the HMR
Other
Line of credit /
overdraft
Credit card debt
Other credit and
loans
All households 100.0 100.0 100.0 100.0 100.0 100.0 100.0 100.0 100.0 100.0
Ownership status
Owner without housing credit 18.8 6.2 6.3 5.8 - 57.5 74.0 58.7 41.8 76.3
Owner with housing credit 76.6 91.0 90.0 94.2 100.0 16.3 13.2 26.5 31.0 11.6
Tenant or other 4.7 2.8 3.7 - 0.0 26.2 12.8 14.8 27.2 12.1
Household type
One-person household 6.8 6.1 6.6 4.4 6.3 4.2 9.8 9.6 19.1 9.5
Single-parent family with children 2.9 2.7 2.8 2.3 2.3 5.6 4.2 4.4 4.9 4.2
Couple 23.4 24.7 24.3 25.8 24.1 29.3 18.1 13.1 14.5 18.5
Couple with children 58.8 62.9 63.0 62.8 63.5 57.9 40.8 51.8 36.8 40.3
Extended-family household 8.0 3.7 3.4 4.7 3.8 3.1 27.1 21.1 24.7 27.6
Age of the reference person
16-24 0.1 - - - - - 0.5 - 0.6 0.5
25-34 30.9 35.5 41.1 17.9 36.8 24.4 11.1 15.5 22.5 10.4
35-44 39.4 42.8 38.4 56.7 44.1 32.5 24.4 25.8 27.2 24.2
45-54 15.3 14.5 13.5 17.6 14.3 15.4 18.8 34.4 14.8 18.0
55-64 10.1 5.5 5.0 7.3 3.9 19.5 30.0 15.9 25.7 31.1
65-74 2.1 1.7 2.0 0.6 0.9 8.1 4.0 6.0 8.9 3.7
75+ 2.1 0.1 0.1 - 0.1 - 11.3 2.3 0.3 12.3
Labour force status of the reference person
Employed 71.7 79.2 77.2 85.4 80.1 71.6 38.8 54.4 53.1 37.3
Self-employed 17.8 15.3 16.1 12.7 14.7 20.1 29.0 15.0 27.4 29.9
Retired 7.3 3.1 3.7 1.3 2.5 8.4 25.7 20.9 13.6 26.5
Other not working 3.2 2.4 3.0 0.6 2.7 - 6.5 9.7 5.9 6.3
Education of the reference person
Primary or no education 3.2 1.1 1.3 0.6 1.2 0.8 12.3 4.4 1.1 13.2
Secondary education 41.2 36.3 38.9 28.4 35.7 41.6 62.9 68.7 49.2 63.1
Tertiary education 55.6 62.6 59.8 71.1 63.1 57.6 24.8 26.9 49.8 23.7
Class of geographical location
Urban areas 74.6 77.3 73.9 88.0 76.5 83.5 62.7 74.5 74.5 61.5
Above 200 thousand inhabitants 42.5 45.5 40.2 61.9 46.0 41.4 29.3 22.3 44.5 29.1
Below 200 thousand inhabitants 32.1 31.8 33.7 26.1 30.6 42.1 33.4 52.2 30.0 32.4
Rural areas 25.4 22.7 26.1 12.0 23.5 16.5 37.3 25.5 25.5 38.5
Net income (quantiles)
0-20% 1.7 1.3 1.7 - 1.1 2.9 3.7 7.9 4.5 3.5
20-40% 5.2 4.1 4.7 2.1 4.4 1.7 9.8 9.6 14.4 9.7
40-60% 15.0 14.4 14.9 12.9 14.6 12.7 17.7 17.2 12.0 18.0
60-80% 30.1 28.0 33.6 10.5 29.2 18.0 39.5 31.8 29.2 40.3
80-90% 13.6 14.2 14.6 13.0 11.8 34.2 10.9 12.0 11.5 10.8
90-100% 34.4 38.1 30.6 61.4 39.0 30.6 18.3 21.4 28.4 17.7
Net wealth (quantiles)
0-20% 10.0 9.5 9.3 9.9 10.2 3.6 12.1 15.3 11.4 11.9
20-40% 23.2 24.7 31.1 4.7 24.5 25.9 16.6 19.4 10.7 16.7
40-60% 20.0 21.5 16.0 38.6 22.9 10.3 13.2 23.6 29.5 11.9
60-80% 18.0 17.8 20.8 8.7 17.9 17.2 18.6 11.0 14.9 19.2
80-90% 9.9 10.4 9.4 13.5 9.5 17.8 7.6 16.1 10.4 6.9
90-100% 19.1 16.1 13.4 24.7 15.1 25.2 31.9 14.6 23.1 33.4

Figure A16. Debt burden indicators by groups of households
DSTI DTI DTA
Medi-
an
% of households with DSTI in
excess of 40%
Me-dian
% of households with DTI in excess of Me-dian
% of households with DTA in
excess of 75% 300% 450%
All households 14.2 3.4 21.6 3.7 1.6 6.5 3.5
Ownership status
Owner without housing credit 11.1 2.0 11.5 0.6 0.2 1.6 0.0
Owner with housing credit 20.3 16.0 185.4 29.8 12.5 26.7 10.5
Tenant or other 13.3 1.4 10.8 0.7 0.6 45.5 9.9
Household type
One-person household 17.3 3.1 20.2 1.6 0.8 6.8 2.2
Single-parent family with children 11.0 3.1 21.3 2.8 1.9 6.0 6.6
Couple 16.2 3.3 28.7 5.1 2.4 5.9 3.3
Couple with children 14.8 4.0 34.3 6.0 2.4 10.2 4.9
Extended-family household 9.5 2.7 10.9 1.4 0.4 2.3 1.9
Age of the reference person
16-24 8.4 - 8.7 1.0 1.0 47.6 6.7
25-34 18.1 4.5 89.7 12.1 5.6 27.7 6.9
35-44 13.4 5.1 43.5 6.6 2.8 12.1 4.7
45-54 12.4 3.3 18.7 1.7 0.8 3.6 2.9
55-64 13.3 3.6 14.6 1.2 0.6 3.3 2.5
65-74 12.4 1.3 10.3 0.3 0.2 1.6 2.0
75+ 17.8 1.5 20.4 1.2 - 2.9 0.9
Labour force status of the reference person
Employed 14.0 3.4 29.5 5.8 2.8 9.7 4.6
Self-employed 13.8 7.8 26.0 5.3 1.9 2.8 0.6
Retired 15.5 2.1 14.2 1.0 0.2 2.6 2.3
Other not working 15.0 2.2 11.1 1.6 0.7 5.0 4.3
Education of the reference person
Primary or no education 13.0 3.0 11.1 1.0 0.5 4.5 2.7
Secondary education 13.2 3.5 17.7 2.9 1.4 4.5 3.8
Tertiary education 17.6 3.3 77.8 7.9 3.0 15.7 3.2
Class of geographical location
Urban areas 14.7 3.5 25.9 4.2 1.9 8.4 4.5
Above 200 thousand inhabitants 17.8 4.1 36.5 6.0 2.6 12.0 4.8
Below 200 thousand inhabitants 13.0 3.2 21.6 3.1 1.5 7.4 4.3
Rural areas 13.3 3.1 17.4 2.8 1.0 2.6 1.5
Net income (quantiles)
0-20% 19.2 4.6 17.1 1.6 1.5 4.0 3.4
20-40% 15.4 3.0 17.0 1.8 1.1 6.6 3.3
40-60% 15.8 3.2 19.7 4.0 1.9 5.7 5.4
60-80% 14.2 4.0 22.8 6.7 2.7 6.6 3.5
80-90% 10.9 2.4 17.4 2.7 1.0 3.5 2.0
90-100% 11.5 1.6 55.8 6.5 0.9 14.3 1.4
Net wealth (quantiles)
0-20% 14.7 2.5 13.2 2.9 1.4 69.7 14.8
20-40% 14.6 4.5 32.6 5.3 2.4 8.0 2.3
40-60% 12.8 1.6 21.7 3.6 1.0 4.1 0.3
60-80% 14.1 2.8 20.7 2.4 1.4 2.3 -
80-90% 14.9 3.6 22.2 3.6 2.1 1.8 -
90-100% 16.1 7.2 35.1 5.2 1.7 1.8 -

Figure A17. Net income and total expenditure and consumption expenditure by groups of households (PLN thousand)
Net income Total expenditure Consumption expenditure
median mean median mean median mean
All households 39.6 48.1 27.8 29.7 13.2 14.8
Ownership status
Owner without housing credit 41.1 48.9 29.8 30.4 13.4 15.3
Owner with housing credit 60.0 72.2 36.0 36.8 15.6 17.7
Tenant or other 26.4 35.1 22.8 24.4 10.3 11.8
Household type
One-person household 18.0 23.5 15.6 17.9 7.2 7.9
Single-parent family with children 28.1 40.4 24.0 24.9 11.4 12.3
Couple 40.2 47.8 30.0 30.4 13.2 14.3
Couple with children 51.6 59.9 36.0 35.3 17.4 18.2
Extended-family household 57.6 62.8 36.0 36.0 18.6 19.0
Age of the reference person
16-24 21.6 26.1 21.6 21.4 8.4 9.4
25-34 47.0 54.7 30.0 31.4 14.4 15.3
35-44 48.5 54.9 33.6 34.4 16.8 17.5
45-54 48.2 57.5 30.0 32.8 14.4 16.2
55-64 38.1 47.5 26.4 29.0 12.6 14.6
65-74 27.9 35.2 21.6 24.2 10.2 12.1
75+ 22.8 30.0 19.2 22.3 8.8 10.7
Labour force status of the reference person
Employed 50.6 57.9 30.0 33.3 14.9 16.5
Self-employed 53.9 67.5 36.0 36.2 16.8 18.0
Retired 28.8 35.6 22.8 25.2 10.8 12.5
Other not working 21.1 28.0 19.2 22.1 9.6 11.3
Education of the reference person
Primary or no education 21.7 29.3 18.0 21.5 8.4 11.1
Secondary education 38.0 45.6 27.6 29.0 13.2 14.7
Tertiary education 58.4 67.3 36.0 36.8 15.6 17.4
Class of geographical location
Urban areas 39.8 48.6 28.8 30.0 12.7 14.7
Above 200 thousand inhabitants 41.3 53.5 30.0 32.0 13.4 15.5
Below 200 thousand inhabitants 38.5 45.7 26.4 28.8 12.6 14.2
Rural areas 39.1 47.2 26.4 28.9 13.2 14.9
Net income (quantiles)
0-20% 13.9 12.9 14.4 15.2 6.6 7.7
20-40% 25.7 25.9 21.6 23.1 10.2 11.1
40-60% 39.6 39.7 30.0 29.3 13.6 14.5
60-80% 56.7 57.3 36.0 36.4 18.0 18.7
80-90% 78.3 78.3 36.0 40.2 19.2 20.0
90-100% 110.0 131.5 48.0 48.2 22.8 23.5
Net wealth (quantiles)
0-20% 24.5 28.5 19.2 22.0 9.6 10.8
20-40% 34.3 39.3 24.0 26.2 12.0 12.8
40-60% 40.0 47.2 27.9 29.3 13.2 14.7
60-80% 47.7 55.7 30.0 32.1 14.5 16.1
80-90% 55.7 64.4 36.0 35.8 18.0 18.6
90-100% 61.6 75.6 36.0 41.5 19.2 20.4

Glossary
Assets - resources accumulated by households, including real assets and financial assets.
Consumer loan - loan for financing current household’s needs and household appliances. This catego-
ry includes: loans for living expenses, loans to purchase a car or other motor vehicles and loans for
educational purposes.
Debt-to-Assets (DTA) - the ratio of the current value of the debt to the value of assets held by house-
holds. It indicates the ability to repay the debt with the assets held, including the ability to absorb
increasing debt servicing costs.
Debt-to-Income (DTI) - the ratio of the current value of the debt to the annual income of households
(net or gross values).
Debt-Service-to-Income (DSTI) - the ratio of the monthly credit instalment to the monthly household
income (net or gross values). It denotes how much income is spent every month on debt repayment.
This indicator takes into account household burden resulting from all types of debt, excluding credit
card debt, line of credit or overdraft.
Financial assets - assets accumulated by households in the form of saving deposits, insurance policies,
voluntary pension schemes (with the exclusion of occupational pension schemes), shares in mutual
funds, stocks and bonds and other financial assets and receivables resulting from loans granted to
private individuals.
Household receivables resulting from participation in public and occupational pension schemes are
not treated as financial assets of households.
Household income - is the sum of income from employment (paid employment, self-employment)
and other sources of income (retirement and disability benefits, gains and other income) earned by
members of the household aged 16 years and above. It is measured in net and gross values.
Specifically, household income consists of the following sources of income: paid employment, work
(including assistance at work), self-employment, public pension and pension under occupational pen-
sion schemes, unemployment benefit and allowances, public assistance (family allowances, housing
allowances, welfare allowances, scholarships), donations and alimony payments, income from real
estate rental, income from financial assets holdings (deposits, stocks, bonds), dividends, profits from
capital investment in business, other income (lottery prizes, compensation, end-of-employment pay-
ments, awards), receipt of financial support.

Housing loan – loan taken out in order to meet household’s housing needs. This category includes:
loans for the purchase of the household main residence, loans for the purchase of another property
(land, buildings) and loans for renovation and modernization of housing (apartment or house).
Liabilities - liabilities incurred by the household, including commitments resulting from housing
loans and other forms of debt (non-residential loans).
Liquid-Assets-to-Income (LATI) - the ratio of households’ liquid financial assets to household’s an-
nual income. The ratio denotes the level of accumulated household savings (highest liquidity assets)
that can be quickly converted into cash in order to absorb increases in debt servicing costs.
Liquid financial assets - financial assets accumulated by households, which can be quickly converted
into cash. These include: saving deposits, shares in mutual funds, stocks, bonds and other financial
assets, with the exception of the funds accumulated in voluntary pension schemes and life insurance
policies.
Loan-to-Value (LTV) - the ratio of the outstanding loan to the value of real estate being the loan col-
lateral. Current LTV is calculated based on the estimated value of the real estate indicated by the re-
spondent at the time of the survey. LTV at origination is calculated based on the original purchase price
of the real estate, indexed at the time of loan granting, as declared by the respondent.
Mortgage loan – housing (residential) loan secured by a mortgage on the property.
Net wealth - gross assets accumulated by the household less incurred liabilities.
Other forms of debt (also: loans other than residential loans) – credit or loan for non-housing purpos-
es. This category includes: consumer loans, other consumer loans, loans to finance business or profes-
sional activity, loans for other purposes (including loans for repayment of other debt) and loans from
private individuals or employers.
Other consumer loan – credit card debt, credit line or overdraft.
Real assets – real estate properties held by households (household main residence, other real estate
property), vehicles, valuables and self-employment business wealth.
The middle wealth household - a household in the group of 10% of the population of households
with an average net wealth around the median (between the 45th and 55th percentile of the distribution
of the household’s net asset value).

The poorest household – a household in the group of 10% of the population of households with the
lowest net asset value (i.e. in the first decile of the distribution of the net asset value in the household
population).
The reference person (also referred to as the household head) - the person best oriented in the house-
hold’s situation who was interviewed during the survey.
The richest household – a household in the group of 10% of the population of households with the
highest net asset value (in the tenth decile of the distribution of the net asset value in the household
population).

www.nbp.pl