Embed Size (px)
Citation preview

Occasional Papers
1 | 2008
HOUSEHOLD WEALTH IN PORTUGAL: REVISED SERIES1
Fátima CardosoLuísa FarinhaRita Lameira
September 2008
The analyses, opinions and findings of these papers represent the views of the
authors, they are not necessarily those of the Banco de Portugal or the
Eurosystem.
Please address correspondence to
Economics and Research Department
Banco de Portugal, Av. Almirante Reis no. 71, 1150-012 Lisboa, Portugal;
email: [email protected]
(1) See the Ap pen dix also in ex cel for mat on http://www.bportugal.pt/publish/OP/2008-1.xls

BANCO DE PORTUGAL
Eco nom ics and Re search De part ment
Av. Almirante Reis, 71-6th floor
1150-012 Lisboa
www.bportugal.pt
Printed and dis trib uted by
Ad min is tra tive Ser vices De part ment
Av. Almirante Reis, 71-2nd floor
1150-012 Lisboa
Num ber of cop ies printed
75 is sues
Le gal De posit no. 257971/07
ISSN 1646-7477
ISBN 978-989-8061-49-2

1
Household wealth in Portugal: revised series
Fátima Cardoso∗ Luísa Farinha∗ Rita Lameira∗∗
1. Introduction
Household wealth can play an important role in modelling households’
consumption/savings decisions. Permanent income and life-cycle theories of consumer,
for instance, predict a relationship between wealth and the life-time pattern of
consumption. The growing importance of shares in households’ portfolios and more
recently the large and continuous rise in house prices in many developed economies
justify the recent upsurge in estimating wealth effects on consumption. In Portugal,
until recently there was virtually no literature relating wealth and consumption, a fact
largely due to the lack of appropriate data. The paper by Cardoso and Cunha (2005)
contributed to fill this gap by providing aggregate homogeneous series on the main
components of household wealth covering a relatively long period. Using these data
Castro (2007) estimated the effects of financial and housing wealth on consumption in
Portugal. The recognition that progress in this field largely depends on data availability
is the main motivation for this paper, which presents an update and a revision of the
household wealth series first published in Cardoso and Cunha (2005). The components
of household wealth covered are financial (both assets and liabilities) and housing
wealth (which is presumed to be the main component of households’ non-financial
wealth). The concepts, scope and methodology of the series presented in this paper are,
in the essence, the same as before. However, in the “shares and other equity” and
“housing” components revisions were more substantial as they incorporate new sources
of information and some methodological changes. In particular, in the case of housing
wealth the availability of more recent results from the Portuguese household wealth
survey, which were used to obtain a benchmark for this component of wealth, justified
a change in the methodological procedure.
∗ Banco de Portugal, Economics and Research Department. ∗∗ Banco de Portugal, Statistics Department.

2
The paper is organised as follows. Section 2 presents some methodological notes that
explain the main revisions of the series. In section 3 the recent behaviour of Portuguese
household wealth is analysed on the basis of a set of indicators and compared with
other countries for which corresponding figures are available. Section 4 presents the
concluding remarks.
2. Methodological notes
The concepts, scope and methodology of the series presented in this paper are described
in Cardoso and Cunha (2005). As mentioned in that paper, the components of
households’ financial wealth in aggregate terms come directly from the National
Financial Accounts. They are therefore consistent with the European System of
National and Regional Accounts (ESA 95).
In the case of securities, original aggregate data are difficult to find and households’
holdings of these assets have to be estimated or imputed. These figures are, in
particular, highly dependent on the methodology used in the estimation of the market
value of unlisted shares and other equity. In the context of National Financial
Accounts, a new methodology for the estimation of these securities was adopted in
2005. This is based on own funds of unlisted companies taken from balance sheet data.
Additionally, in 2006, the availability of a more comprehensive data source on non-
financial companies implied another substantial revision in the value of equities held by
households.
In the case of holdings of real assets, original aggregate data are even more difficult to
obtain or simply do not exist. In this case, survey data can be very useful in estimating
aggregates. In particular, these data can be used to obtain a point estimate for a
specific year. In early 2008, with the release of the results of the latest wave of the
survey on households’ wealth (known as IPEF — Inquérito ao Património e
Endividamento das Famílias) it has become feasible to have a point estimate of
household wealth in housing for the most recent year1.
1 The IPEF was carried out by Statistics Portugal and Banco de Portugal in 1994, 2000 and 2006/07.
3
Financial wealth
The financial series presented in this paper are consistent with National Financial
Accounts published by Banco de Portugal2. For some categories of assets and liabilities,
namely deposits and loans, the information included in the Financial Accounts is
obtained from counterpart sectors, mainly the banks, and therefore the figures are quite
accurate and stable. As for households’ wealth in securities, the estimation process is
more complex and the figures are more subject to changes. The series of “shares and
other equity” issued by the corporate sector and “securities other than shares” were
recently revised, due to the adoption of different methodological procedures. These
revisions were reflected in households’ holdings of securities, which are estimated in a
residual way, that is as the difference between the total amount of securities issued and
the portfolios of the other institutional sectors for which holdings may be obtained
directly.
The revision in the value of “shares and other equity” issued by the corporate sector
resulted from a change in the methodology of estimation of this item in National
Financial Accounts, in line with international principles that recommend the use of
market values. This change is explained in full detail in Almeida et al. (2007).
Following this methodology, the market value of quoted shares was taken directly from
a security-by-security database run by Banco de Portugal (SIET — Sistema Integrado
de Estatísticas de Títulos). This includes quotations for all companies listed on the
Portuguese stock exchange. In the case of unquoted shares and other equity, in the
absence of market values, an estimate of companies’ own funds was used as a proxy.
This estimate was based on the ratios between own funds and statutory capital
observed in the sample of non-financial corporations available in the Central Balance
Sheet Office of Banco de Portugal (CB — Central de Balanços), and the ratios were
extrapolated to the entire population for a given reference year. The complete series
was estimated using data from CB for the companies answering the annual surveys.
For the other companies, the evolution of own funds was based on the figures
2 The National Financial Accounts published by Banco de Portugal include revised data since 1997. Therefore, the figures now disseminated for the years 1980 to 1996 were estimated using the change rate implicit in the series published in Cardoso and Cunha (2005). Note also that the residual items “Other accounts receivable/payable” included in both the assets and liabilities of Financial Accounts compiled by Banco de Portugal, with the exception of “Trade credits and advances received”, were not considered in this paper, in line with what was done in the previous paper.

4
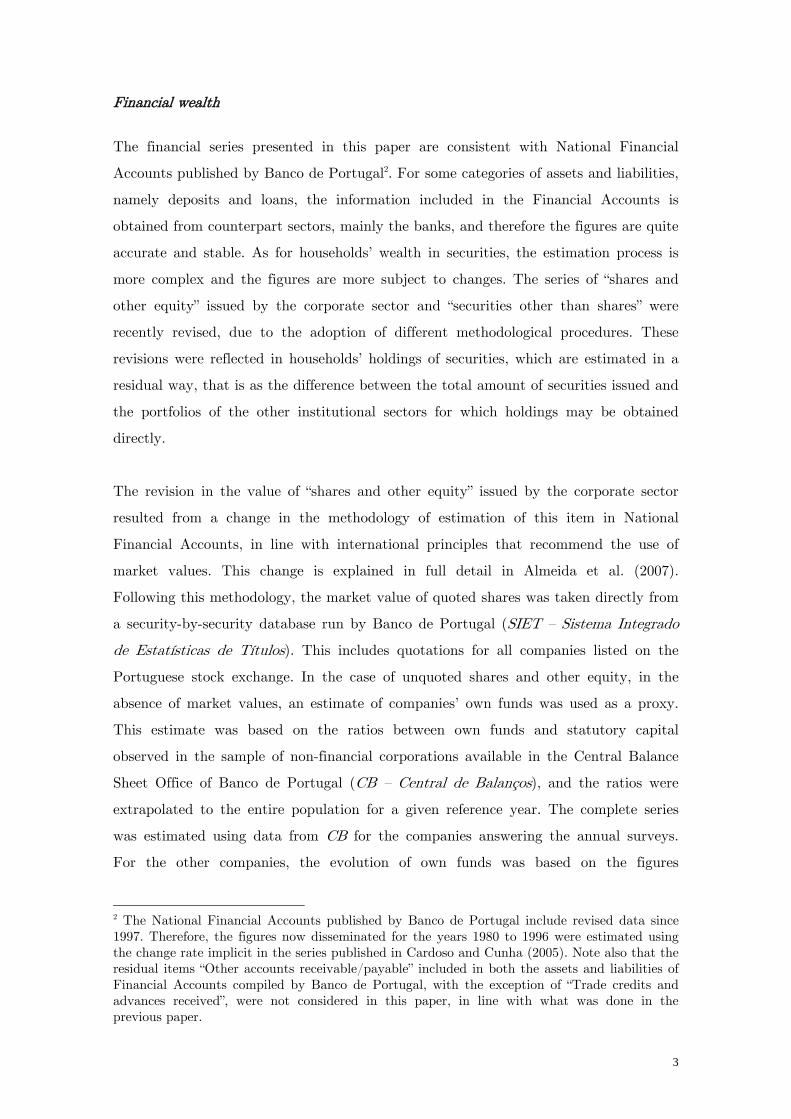
Chart 1 Household financial wealth
(as a percentage of disposable income)
Shares and other equity
0
20
40
60
80
100
120
140
160
180
1980 1982 1984 1986 1988 1990 1992 1994 1996 1998 2000 2002 2004 2006
New seriesOld series
Total f inancial assets
100120140160180200220240260280300320340
1980 1982 1984 1986 1988 1990 1992 1994 1996 1998 2000 2002 2004 2006
computed for the companies in the invariant sample of CB and taking into account
nominal GDP growth. Note that this database has recently benefited from the new
simplified reporting system for corporate information (IES — Informação Empresarial
Simplificada), which includes end of 2006 data for almost the entire population of
corporations. These adjustments implied an upward revision of more than 50 per cent
in the wealth of households in shares and other equity for 2004.
In the case of “securities other than shares”, there was a downward revision (of around
30 per cent for 2004) in households’ holdings of this type of instrument. This was a
consequence of an upward revision of the amount of Portuguese debt securities (mainly
issued by general government) estimated to be held by the non resident sector. Note
that the amount allocated to households is estimated as a residual.
These methodological revisions implied significant changes in the level of household
wealth measured as a percentage of disposable income, with an upward revision in the
series of shares and other equity and a decrease in their portfolio of securities other
than shares. As a consequence, there was a less pronounced upward revision in the
series of households’ financial assets (chart 1).
Non financial wealth (housing)
Households’ non-financial wealth is particularly difficult to estimate, given that source
data are much scarcer than in the case of the financial components. In Cardoso and

5
Cunha (2005) this difficulty was overcome using a relatively standard procedure — the
perpetual inventory method — which is, in general, used to obtain estimates of capital
stock. The idea behind the procedure is to take advantage of estimated flows of
investment in fixed capital, which are obtained with a higher frequency, and sum them
cumulatively by postulating reasonable hypotheses for the expected service life of the
assets and their respective depreciation rate. However, the results based on survey data
on households’ wealth which were presented in Coimbra et al. (2008) suggested that
the estimates of the housing stock of Portuguese households obtained with the
perpetual inventory method could significantly underestimate the market value of the
housing stock owned by households. This evidence suggested that survey data could be
very helpful for revising the estimates of housing wealth. In particular, it could be used
to obtain a point estimate for a specific year that would work as a benchmark. This
procedure has been followed in countries that collect data on household wealth through
direct surveys, such as Italy3. In the case of Portuguese households, with the release of
the data from the latest wave of the IPEF (the household wealth survey), the timing
was particularly appropriate to implement this method4. The individual data (at
household level) on the value of the main house and other residences were aggregated
in order to obtain a point estimate for the household wealth in housing of the entire
population in 20075. This estimate is given by the following expression:
*N
i ii
housing w∑
i.e., the weighted sum of the individual values reported by each household in the
sample, housingi, where the wi are the respective sample weights6. Starting from this
point estimate, the new series was retropolated on the basis of the rates of change
implicit in the former series (updated for the most recent years), derived from the series
in value and volume of gross fixed capital formation (GFCF) in housing7.
3 See D’Alessio and Faiella (2005) and Brandolini et al. (2004). 4 The field work was done between the last quarter of 2006 and the first quarter of 2007. 5 Households reporting ownership but presenting no value for the property have been excluded from the observations. When only the acquisition value of property was available, it was used as a proxy for its current value. 6 In a probability sample, each unit is associated with a weight that is equal to the inverse of the probability of that unit being selected to be part of the sample. In the IPEF, the initial weights, based on the sample design, were subsequently calibrated taking into account the structure of the population vis-à-vis the following variables: number of persons in the household, type of geographical agglomeration (rural or urban), age, gender, and level of education of the household members. 7 Note that for 2000 the figure obtained with this method is consistent with the point estimate obtained directly from extrapolation of the results of the IPEF 2000.

6
Chart 2 Household housing wealth
As a percentage of disposable income
160
180
200
220
240
260
280
300
320
340
360
1980 1982 1984 1986 1988 1990 1992 1994 1996 1998 2000 2002 2004 2006
New seriesOld series
Ratio to total liabilities
0
2
4
6
8
10
12
14
16
18
1980 1982 1984 1986 1988 1990 1992 1994 1996 1998 2000 2002 2004 2006
The figures obtained using this methodology represent an upward revision (of around
48 per cent in 2004) in the series of household wealth in housing. Thus, comparing the
relationship between non-financial wealth and household disposable income, on the
basis of the new and the old series, a level change is observed. Regarding the ratio of
household non-financial wealth to household debt, the new series suggests a globally
more favourable situation than the old series (chart 2). However, a trend decline in this
ratio can also be observed, albeit considerably less marked since 2000.
3. Portuguese household wealth: trends, recent developments
and international comparisons
Trends and recent developments
The relatively long series on the various components of households’ wealth that are
available (see tables 1 to 3 in the appendix) can be very helpful in identifying the main
trends throughout almost three decades. During this period the evolution of wealth was
very much in line with the major institutional changes that impacted the behaviour of
economic agents in Portugal8. Some of these changes date back to the mid-1980s.
8 See Ribeiro (2007).

7
Chart 3 Household wealth
(as a percentage of disposable income)
0
40
80
120
160
200
240
280
320
360
400
440
480
520
560
1980 1982 1984 1986 1988 1990 1992 1994 1996 1998 2000 2002 2004 2006
In p
erce
ntag
e
Net total wealth Net financial assets Housing Financial assets Total liabilities
Domestically, the 1980s were characterised by the reopening of the banking sector to
private initiative and by the gradual liberalisation of a highly regulated financial sector.
Until 1992, when capital movements became completely liberalised, both financial
assets and liabilities in percentage of disposable income evolved at a moderate pace.
This was slightly more rapid in the case of financial assets so the net financial position
of the sector increased gradually (chart 3).
After 1992, in the context of the convergence process leading to monetary union, both
indebtedness and financial assets in percentage of disposable income grew at a much
higher pace than before. In that period, the marked decline in nominal and real interest
rates was the main factor contributing to broader access to credit, taking in a much
wider range of households than in the previous decade9. In fact, there is evidence that
the significant increase in indebtedness witnessed in the second half of the 90s was
mainly due to an enlarged number of households with access to credit10. Financial
assets increased at a higher rate than liabilities until 1999 and consequently net
financial assets also kept growing. In this period, the weight of financial assets in
households’ total wealth also increased (chart 4).
9 Luz (1992) presents evidence that approximately 60 per cent of Portuguese households were subject to liquidity constraints, in the early 1990s. 10 See Farinha (2003, 2004).

8
Chart 5 Decomposition of changes in the stock of financial assets
-15000
-10000
-5000
0
5000
10000
15000
20000
25000
30000
35000
1998 1999 2000 2001 2002 2003 2004 2005 2006 2007
In m
illio
n eu
ro
Changes in stocksTransactionsOther changes in volume and prices
Chart 4 Composition of household wealth (as a percentage of total assets)
0%
10%
20%
30%
40%
50%
60%
70%
80%
90%
100%
1980 1982 1984 1986 1988 1990 1992 1994 1996 1998 2000 2002 2004 2006
H o u s in g Fin a n c ia l a s s e ts
The developments in the outstanding amounts of the wealth components, particularly
financial assets, reflect not only transactions but also changes in the value of assets
mainly due to price fluctuations. These changes in prices represented a significant part
of the total increase in the value of assets in 1998 and 1999. In contrast, between 2000
and 2002 price changes contributed negatively to the variation in stocks of financial
assets (chart 5).

9
After 1999, the increasing trend in the value of assets as a percentage of disposable
income was interrupted mainly due to the negative contribution of changes in the price
of financial assets and the deceleration in real estate prices. Additionally, indebtedness
continued to grow at rates well above those of disposable income, in such a way that
net total assets, as a percentage of disposable income, presented a decreasing path in
the period 1999-2007 (chart 3). The value of total household liabilities at the end of
2007 accounted for 143 per cent of disposable income, with this ratio standing at 99 per
cent in the case of housing loans11. Some factors on the credit supply side were also
crucial to the continued high growth rate of housing loans. Conditions of access to
credit have undergone some changes in recent years, for example by increasing loan
maturities. This aimed at reducing the impact of rising interest rates on current debt
service and sustaining demand for credit12.
It should be noted that the changes in households’ wealth both on the assets and the
liabilities sides were partly driven by the adjustment process of Portuguese economic
agents in response to several structural changes. First, the access to an enlarged market
contributed to a rise in the level of income which was perceived as being permanent.
Later, with financial and monetary integration, households reacted to the prevalence of
lower and less volatile interest rates. This suggests that current levels of households’
assets and debt holdings may have resulted from changes in their equilibrium levels.
Composition
The value of the housing stock as a percentage of the disposable income showed a slight
increase (albeit not continuous) along the period under review, more significant in the
second half of the 90s, reflecting mainly the considerable decrease in both nominal and
real interest rates.
However, a declining trend in housing wealth, as a percentage of total assets, was
observed from the beginning of the 80s to the end of the 90s (chart 4). Non-financial
wealth, which was dominant at the beginning of the period, stabilized after 2000 at
around 50 per cent of total assets. This evolution, especially from 1990 onwards,
11 Note that the ratio between total liabilities and disposable income (143 per cent in 2007) differs from the one usually mentioned in Banco de Portugal publications (129 per cent), which does not include trade credits. 12 See Farinha (2008).

10
Chart 6 Composition of portfolio
(as a percentage of total assets)
0%
10%
20%
30%
40%
50%
60%
70%
80%
90%
100%
1980 1982 1984 1986 1988 1990 1992 1994 1996 1998 2000 2002 2004 2006
Cu rren cy an d d ep o s its Secu rit ie s o th e r th an s h aresLo an s Sh are s an d o th er eq u it ies excl. mu tu a l fu n d sM u tu a l fu n d s s h are s In s u ran ce tech n ica l res e rv es
reflects both the growing access of households to non-bank financial products and the
relatively contained rise in house prices observed in the more recent years.
Financial wealth as a percentage of disposable income showed an upward trend during
the 1990s. As to its composition, the financial assets portfolio remained dominated by
deposits although it became more diversified (Chart 6). One of the contributions to this
diversification may well have been the liberalisation process started in the 1980s with
the opening of the banking system to private initiative, followed by the emergence of
new institutions and financial products, the liberalisation of interest rates, the abolition
of credit limits and the freeing up of cross-border capital flows at the end of 1992. The
privatization process initiated in 1989 contributed strongly to increasing the depth and
liquidity of the capital market, which allowed investors, in particular households, to
diversify their portfolios.
Investments in life insurance and pension funds have gained increasing importance
since the beginning of the 1990s as they have been gradually more perceived as a
necessary complement to public social security schemes. The evolution of life insurance
partially reflects the fact that this type of insurance is required by credit institutions
for house purchase loans.

11
Chart 8 Total financial assets
(as a percentage of disposable income)
0
100
200
300
400
500
600
700
TheNetherlands
Denmark Japan USA Belgium UnitedKingdom
Sweden Italy Germany France Spain Austria Finland
1995 2000 2006
Portugal
International comparisons
From 1995 to 2000, there was an overall increase in households’ wealth measured as a
percentage of disposable income, for both housing and financial wealth. This was true
for Portugal and for most of the other countries considered (see charts 7 and 8)13. This
evolution was more pronounced in the case of financial assets (except for the United
Kingdom), which implied a higher proportion of financial wealth in total assets.
From 2000 to 2006 the increase in housing wealth in Portugal in terms of disposable
income was moderate, in contrast with the other European countries considered and
the United States, where sharp rises in real estate prices were observed. Note that in
the USA and Japan the non-financial component of households’ wealth, as a percentage
of disposable income, is less significant than in Portugal and the other European
countries considered. In this period, the increase in financial wealth was more moderate
than in the case of housing for most countries (Italy and the United Kingdom even
showed decreases) and weaker than in the period 1995-2000.
Sources: Eurostat, national central banks, statistical offices and Banco de Portugal.
13 The comparisons here, as in Cardoso and Cunha (2005), are based on data from 1995 onwards, the period for which there are comparable figures for Financial Accounts, in the context of the regular reports to Eurostat. In the case of housing wealth, the data available covers the same period but only a narrower group of countries.
Chart 7 Housing wealth
(as a percentage of disposable income)
0
100
200
300
400
500
600
700
800
900
Spain France UnitedKingdom
Italy Finland USA Japan
1995 2000 2006
Portugal

12
Chart 8 Total financial assets
(as a percentage of disposable income)
0
100
200
300
400
500
600
700
TheNetherlands
Denmark Japan USA Belgium UnitedKingdom
Sweden Italy Germany France Spain Austria Finland
1995 2000 2006
Portugal
Sources: Eurostat, national central banks, statistical offices and Banco de Portugal.
Portugal showed the highest increase in the amount of liabilities as a percentage of
disposable income, with an evolution from 51.2 per cent in 1995 to 136.7 per cent in
2006. Additionally, Portugal recorded the most significant share of liabilities in total
assets in the group of the European countries for which housing estimates are available
(22 per cent compared with an average of 14 per cent). In Portugal the increase of this
share was stronger in the sub-period 1995-2000, when major structural changes
occurred in the context of the convergence process. Nevertheless, in Portugal the
indebtedness level in terms of disposable income is below the level observed in
Denmark, the Netherlands, the United Kingdom, Sweden and the United States and is
quite close to the level observed in Spain and Japan (chart 9).

13
Sources: Eurostat, national central banks, statistical offices and Banco de Portugal.
Comparing the composition of financial assets in 1995 and 2006 (chart 10), there was a
decrease in the share of households’ holdings of currency and deposits in most of the
European countries considered, whereas the proportion of mutual funds shares and
insurance technical reserves increased. The evolution over the last eleven years implied
that the structure of Portuguese households’ portfolio became closer to the average of
European countries and, in particular, euro area countries. In the case of the United
States and Japan, the changes in structure throughout this decade were less significant.
Considering the weight of each type of instrument in total financial assets at the end of
2006, Portugal is somewhat above the European average in the currency and deposits
component (with 36 percent compared with 31 per cent in the euro area). Japan and
Austria show the highest values and the United States and Sweden the lowest. In
Portugal, shares and other equity have a weight of 32 per cent in total financial wealth,
which is significantly above the European average (around 20 per cent) but lower than
in Finland and the United States14. The proportion of mutual funds shares in Portugal
stands close to the European average (approximately 10 per cent). In the segment of
life insurance and pension funds reserves, the weight in Portugal (17 per cent) is clearly
14 Note that, in Portugal, this item of Financial Accounts is largely dominated by unquoted shares and other equity.
Chart 9 Total liabilities
(as a percentage of disposable income)
0
50
100
150
200
250
300
Denmark TheNetherlands
UnitedKingdom
Sweden USA Spain Japan Germany Finland France Austria Belgium Italy
1995 2000 2006
Portugal

14
below the average for the other countries under review. Nonetheless, in this segment
there are significant differences between countries, with maximums in the Netherlands
and the United Kingdom and minimums in Spain and Finland. In the component of
securities other than shares, Portugal is also below the European average, with 5 per
cent of total assets invested in this type of assets compared with 9 per cent in the euro
area.
Chart 10 Composition of financial wealth (as a percentage of total assets)
1995
0%
10%
20%
30%
40%
50%
60%
70%
80%
90%
100%
2006
0%
10%
20%
30%
40%
50%
60%
70%
80%
90%
100%
Japa
n
Aus
tria
Spai
n
Portug
al
Ger
man
y
Fran
ce
Finl
and
Ital
y
Bel
gium
Uni
ted
Kin
gdom
The
Net
herlan
ds
Den
mar
k
Swed
en
USA
Eur
o ar
ea (9
)
Eur
opea
n U
nion
(12)
Currency and deposits Securities other than shares
Shares and other equities excl. mutual funds Mutual funds shares
Life insurance and pension funds reserves Other insurance technical reserves
Source: Eurostat national central banks, statistical offices and Banco de Portugal
15
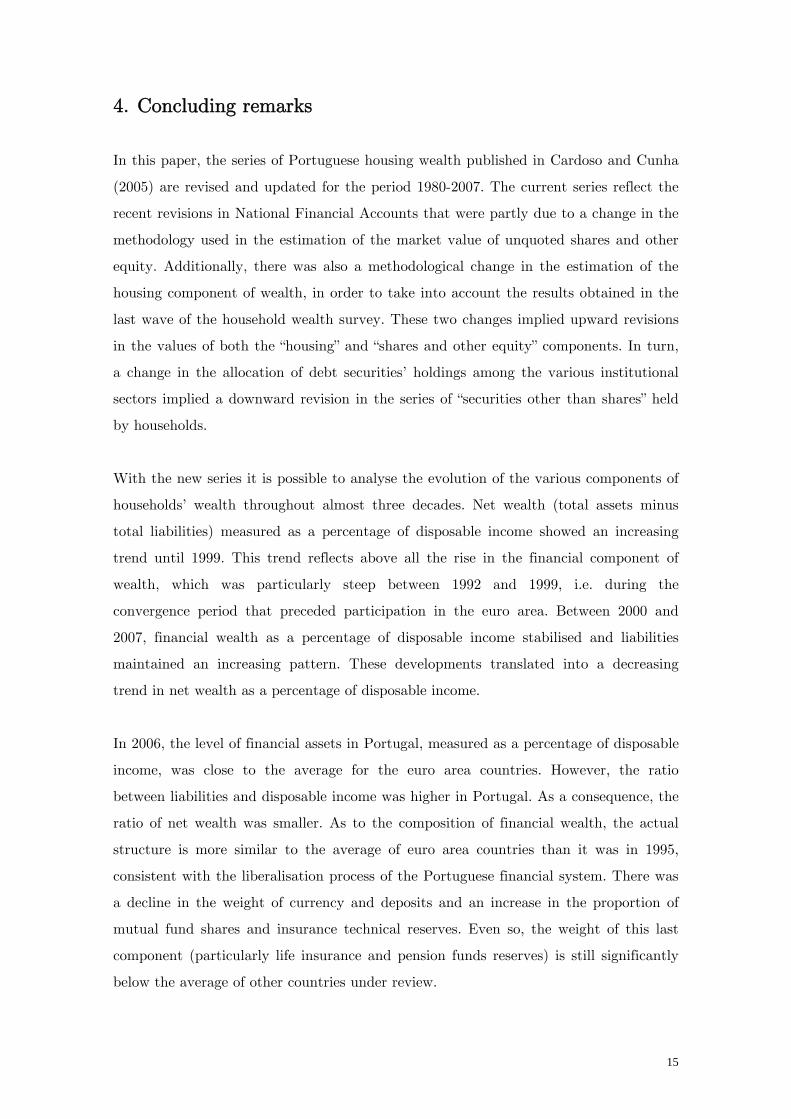
4. Concluding remarks
In this paper, the series of Portuguese housing wealth published in Cardoso and Cunha
(2005) are revised and updated for the period 1980-2007. The current series reflect the
recent revisions in National Financial Accounts that were partly due to a change in the
methodology used in the estimation of the market value of unquoted shares and other
equity. Additionally, there was also a methodological change in the estimation of the
housing component of wealth, in order to take into account the results obtained in the
last wave of the household wealth survey. These two changes implied upward revisions
in the values of both the “housing” and “shares and other equity” components. In turn,
a change in the allocation of debt securities’ holdings among the various institutional
sectors implied a downward revision in the series of “securities other than shares” held
by households.
With the new series it is possible to analyse the evolution of the various components of
households’ wealth throughout almost three decades. Net wealth (total assets minus
total liabilities) measured as a percentage of disposable income showed an increasing
trend until 1999. This trend reflects above all the rise in the financial component of
wealth, which was particularly steep between 1992 and 1999, i.e. during the
convergence period that preceded participation in the euro area. Between 2000 and
2007, financial wealth as a percentage of disposable income stabilised and liabilities
maintained an increasing pattern. These developments translated into a decreasing
trend in net wealth as a percentage of disposable income.
In 2006, the level of financial assets in Portugal, measured as a percentage of disposable
income, was close to the average for the euro area countries. However, the ratio
between liabilities and disposable income was higher in Portugal. As a consequence, the
ratio of net wealth was smaller. As to the composition of financial wealth, the actual
structure is more similar to the average of euro area countries than it was in 1995,
consistent with the liberalisation process of the Portuguese financial system. There was
a decline in the weight of currency and deposits and an increase in the proportion of
mutual fund shares and insurance technical reserves. Even so, the weight of this last
component (particularly life insurance and pension funds reserves) is still significantly
below the average of other countries under review.

16
References
Almeida, A., R. Biscaya and A. Cardoso (2008), “Measuring the market value of shares
and other equity in the Portuguese financial accounts”, IFC Bulletin 28, The IFC’s
Contribution to the 56th ISI Session, Lisbon, August 2007.
Brandolini, A., L. Cannari, G. D’Alessio and I. Faiella (2004), “Household wealth
distribution in Italy in the 1990’s”, Temmi di Discussione del Servizio Studi, nº 530,
Banca d’ Italia.
Cardoso, F. and V. Cunha (2005), “Household wealth in Portugal: 1980-2004”, Working
Paper no. 4, Banco de Portugal.
Castro, G. (2007), “The wealth effect on consumption in the Portuguese economy”,
Economic Bulletin, Winter, Banco de Portugal.
Coimbra, C., L. Farinha and R. Lameira (2008), “How to generate macro data using
survey micro data on household wealth?”, Bank for International Settlements, IFC
Bulletin 28, The IFC’s Contribution to the 56th ISI Session, Lisbon, August 2007.
D’ Alessio, G and I. Faiella (2005), “The use of sample data to improve the quality of
financial statistics”, Bank for International Settlements, IFC Bulletin 22, The IFC’s
Contribution to the 55th ISI Session, Sidney, April 2005.
Farinha, L. (2003), “The effect of demographic and socioeconomic factors on
households’ indebtedness”, Economic Bulletin, Banco de Portugal, June.
Farinha, L. (2004), “Households’ debt burden: an analysis based on microeconomic
data”, Economic Bulletin, Banco de Portugal, September.
Farinha, L. (2008), “Indebtedness of Portuguese households: recent evidence based on
the results of the household wealth survey”, Financial Stability Report 2007, Banco de
Portugal.

17
Luz, S. (1992), “The effects of liquidity constraints on consumption behaviour: the
Portuguese experience”, Working Paper no. 3, Banco de Portugal.
Ribeiro, N. (2007), “Debt growth: factors, institutional issues and implications — the
Portuguese case”, in Rapid credit growth in Central and Eastern Europe: endless boom
or early warning?, Charles Enoch and Inci Ötker-Robe eds., Palgrave MacMillan and
IMF, Basingstoke.

18

19
Appendix: Series

20

21

22

OCCASIONAL PAPERS
2007
1/07 FINANCIAL SECTOR ASSESSMENT PROGRAMME PORTUGAL:
BANKING SYSTEM STRESS-TESTING EXERCISE
— Economics and Research Department
2/07 MISS: UM MODELO PARA AVALIAÇÃO DA SUSTENTABILIDADE DA SEGURANÇA SOCIAL PÚBLICA
PORTUGUESA
— Maximiano Pinheiro, Vanda Geraldes da Cunha
MISS: A MODEL FOR ASSESSING THE SUSTAINABILITY OF PUBLIC SOCIAL SECURITY IN PORTUGAL
— Maximiano Pinheiro, Vanda Geraldes da Cunha
2008
1/08 HOUSEHOLD WEALTH IN PORTUGAL: REVISED SERIES
— Fátima Cardoso, Luísa Farinha, Rita Lameira
Banco de Portugal | Occasional Papers i